Embed Size (px)
Citation preview

Observatorio (OBS*) Journal, vol.8 – nº1 (2014), 171-188 1646-5954/ERC123483/2014 171
Copyright © 2014 (Muhammad Mursaleen, Mubashir Ijaz and Muhammad Kashif). Licensed under the Creative Commons
Attribution Non-commercial No Derivatives (by-nc-nd). Available at http://obs.obercom.pt.
Service Quality of News Channels: A Modified SERVQUAL Analysis
Muhammad Mursaleen*, Mubashir Ijaz**, Muhammad Kashif***
*GIFT University, Pakistan ** GIFT University, Pakistan *** GIFT University, Pakistan
Abstract
Current study investigates the service quality offered by Pakistani news channels through employing a
modified SERVQUAL scale. Further to this, the SERVQUAL and its applicability to measure the service
quality of news channels has been presented. A 29-item SERVQUAL based instrument was administered
to a sample of 318 randomly selected respondents. The descriptive analysis revealed a ‘gap analysis’
model to infer meaningful results. The results reveal several gaps between expected and perceived
service quality. In particular, ‘Responsiveness and Assurance’ dimensions had the highest gaps.
However, the SERVQUAL scale has been a good fit while measuring the service quality of news channels
in a developing country context. This research originally contributes to the existing service quality
literature as the SERVQUAL scale has never been used to measure service quality of TV channels. The
recommendations will be helpful in minimizing the service quality gaps and also can trigger channel
loyalty by offering services in accordance with the viewer expectations.
Keywords: Marketing, Service Quality, Media, News channels, Public, expectations, Perceptions,
Pakistan.
Introduction
The growth in service sector has been observed across the globe (Rashmi, 2005). This exponential growth
in the service sectors has made it difficult for firms to consistently create, share, and sustain memorable
customer service experiences (Oakton, 2011). Customers are becoming knowledgeable and selective in terms
of buying and consuming services (Juan et al., 2012). Today the service-oriented products are acknowledged
as ‘experiences’ where everyone in a service system has to create and share value for the customers (Vargo
and Lusch, 2004). This view recognizes the significant role of customer feedback in order to improve the
quality of services offered. The service providers must have a clear understanding of perceived as well as
expected quality of service offered so to create and deliver value for the customers (Nazimet al., 2011). The
customer satisfaction in service products is usually derived from a combination of technical quality as well as
functional quality. However, functional quality is considered important as most customers do not have
expertise to evaluate the technical quality (Nandan, and Geetika, 2010). When customers are satisfied with
the service quality, they tend to be loyal with the service organization (Siddiqi, 2011). Loyal customers
become the referents in order to attract more customers (Mersha et al., 2012). Hence, achievement of service
172 Muhammad Mursaleen, Mubashir Ijaz and Muhammad Kashif Observatorio (OBS*) Journal, (2014)
quality is regarded as a critical success factor for service organizations. Despite a handful of research to
unearth service quality, the quest for excellence in service delivery is continued and researchers recommend
further studies that highlight different cultural contexts (Frimpong and Wilson, 2013).
Watching the Television is a common phenomenon all across the globe. People living in Europe, on average,
spend 226 minutes watching the TV in a day, while in U.S it is 297 minutes per day (IP Germany, 2005). In
many other countries, people spend most of the time in watching television and it is also evident that in some
countries working time and TV watching time is spent equal (Christine and Bruno et al., 2010). Especially
after the introduction of cable TV operators, television viewership has been increased exponentially with
viewers having more choices and freedom to switch the channel more frequently (Christine et al., 2010). The
freedom of choice amongst the broadcasted TV channels and an increase in TV watching hours signals
viewers’ enjoyment with this activity. A large number of people in Pakistan watch TV daily, living in urban
and the rural areas. TV viewership has been increased significantly in Pakistan with 63 million viewers in the
year 2004 to 86 million in the year 2009 (Gallup, 2010). Eighty five private channels have been working in
Pakistan and continuous growth of subscribers is expected in coming years (PEMRA annual report 2010).
Pakistani children aged between 4-17 years, Men and Women aged 18 and above, have same television
watching habits (Gallup 2012). Due to socio-political unrest, most of the TV channels lie under the category
of ‘news channels’ where news related to current affairs are shared with general public. Interestingly, almost
95 percent of audience likes to watch news channels in Pakistan (Gallup, 2010).
Television viewing has multiple effects on individual consumers as well as on society. All the age groups
especially the children are highly influenced by watching TV, even in developing countries (Kashif et al.,
2012). TV viewing has been criticized over the years due to; creating unrealistic expectations about marriage
(Segrin and Nabi, 2002); affecting food disorders amongst children through advertising targeted at younger
children (McGinnis et al., 2006); and promotion of a ‘material culture’ where human values are almost ignored
(Burroughs et al., 2002). However, on the other side, TV viewership is encouraged due to its significant
advantage in De-marketing obesity amongst younger population (Wansink and Huckabee, 2005). Watching
a TV has also been beneficial in consumer education especially for children about various products and
services, ultimately making them more informed and knowledgeable consumers (Mehta et al., 2010). TV
viewing has been found to affect social perceptions, beliefs, and self-perceptions (Eisend and Moller, 2007).
It solely depends upon the quality of programs broadcasted in order to influence the general public.
Given this exponential growth in TV viewership, it’s significant impact on people from all walks of life, and
the need to broadcast the programs which promote individual and societal well-being by channel owners,
there is lack of evidence on the extent of service quality offered by TV channels. The studies pertaining to
service quality of TV channels in developed as well as developing world are absent. This is where current

Observatorio (OBS*) Journal, (2014) Muhammad Mursaleen, Mubashir Ijaz and Muhammad Kashif 173
study contributes significantly to the literature. It is true that service quality has some features which are
universal in nature (Sangeetha & Mahalingam, 2011) however, customer expectations and perceptions are
cultural phenomenon (Bick et al., 2010). Therefore, this article seeks to present service quality delivered by
media channels in Pakistan. The gaps model has been employed to measure the extent of service quality
(difference between expected and perceived quality) delivered by these channels. Pakistani media channels
have been under scrutiny by the media experts who criticize these channels of not reflecting a ‘family-
oriented’ culture (Tribune, 2012). The trend of obesity and overweight issues among Pakistani children has
also been attributed to TV viewing (Mushtaq et al., 2011). These issues necessitate a study which can help
news TV news channel owners and media managers to provide with current state of public satisfaction and
some useful marketing strategies to minimize the dangers to society. There are five perspectives to delineate
the quality of TV channels namely; producer view, manager view, curator view, regulator view, and consumer
view (Murroni and Irvine, 1997). However, to strengthen the methodology and achieving highly focused
results, the researchers only took into consideration the ‘consumer view’ to aim in answering the following
research questions;
RQ1: What are the expectations of TV viewers about TV channels?
RQ2: What is the extent to which public is satisfied with the service quality offered by various TV
channels?
This article has been presented through explaining the recent literature on service quality, mixed methods
employed to collect and analyze the data, findings from the study, and conclusion section where service
marketing theory with respect to TV channels has been discussed.
Literature review
Service quality
Service quality has been regarded as a key issue facing the service organizations since last 20 years (Ladhari,
2009). Service quality in services positively contributes in developing public trust on the service organization
(Cronin and Taylo, 1992). Customers are not passive today, rather more knowledgeable and empowered to
direct the service organizations (Donnelly et al., 1995). In order to measure the service quality, an
understanding of customer expectations is pivotal (Parasuraman et al., 2004). Based on certain expectancy
theories, expectations are defined as ‘partial beliefs about a product that serve as standards or reference
174 Muhammad Mursaleen, Mubashir Ijaz and Muhammad Kashif Observatorio (OBS*) Journal, (2014)
points against which a product is judged’ (Ziethaml and Berry, 1993). It can be stated that customer
expectations are the standards which must be met in order to ensure service quality. With these expectations
in mind, quality has been attributed as difference between expected quality and perceived quality
(Parasuraman et al., 1985). It is however pivotal to measure both; the expectations as well as perceptions
so that an analysis of service quality can be made (Parasuraman et al., 1985, Parasuraman et al., 1988). The
gaps between expectations (E) and perceptions (P) are measured which help researchers to reach at
meaningful conclusions about current state of service quality. It has been observed that service quality
researchers always come up with some gaps which are understandable because customers have higher
expectations (Friman and Fellesson, 2009).
There are several differences between goods and services which demand customized marketing approaches
to be employed for service firms. An understanding of these differences will enable the service marketers to
achieve success in the long-run. Services are intangible, where measuring the service quality is really a
challenging task. As a service provider, intangibility also complicates the process of inventory management
where no prior stock can be retained (Mersha et al., 2012). Customers and employees interact in various
service encounters where employees need to have “people management skills” (Chase, 1978). It is also
believed that the physical facilities of service provider must be clean and aesthetically appealing which can
influence the satisfaction levels of customers (Carlzon, 1987). Hence, customer satisfaction is more
challenging in services as compared with goods. On the other side, satisfying customers in service setting is
imperative and leads to customer loyalty (Siddiqi, 2011). In various service settings, customers have some
standards, also known as customer expectations which form the basis for evaluating the quality of any service.
The expectations may or may not meet the customer standards which can lead to several gaps in managing
services (Parasuraman et al., 1985).
The SERVQUAL scale
The initial model of SERVQUAL was presented as ‘Gaps Model’ by Parasuraman et al. (1985). Researchers
outlined the differences between customer expectations and perceptions. Higher gaps between expectations
and perceptions were regarded as low service quality and vice versa (Parasuraman et al., 1988). SERVQUAL
is a customer satisfaction tool which incorporates some pre-service customer expectations and compares
these with post-service performances to determine the extent of customer satisfaction (Parasuraman et al.,
1994). Customers are considered as ‘satisfied’ once their expectations are met. Over the years, SERVQUAL
instrument has been widely used as a measure to evaluate the customer satisfaction in services sector. The
SERVQUAL instrument has five dimensions; tangibles, reliability, responsiveness, assurance, and empathy

Observatorio (OBS*) Journal, (2014) Muhammad Mursaleen, Mubashir Ijaz and Muhammad Kashif 175
(Ham et al., 2003). The service expectations are the ‘must have’ criteria in order to satisfy customers where
a firm needs to minimize the following gaps (Riadh, 2009);
1. Customer Gap: The difference between customer expectations and management perception of
customers’ expectations.
2. Service Standard Gap: The difference between management perceptions of customer expectations
and translation of these expectations into service standards.
3. Service Performance Gap: The difference between actual service delivery by frontline in a high
contact service and the specifications perceived by management.
4. Service Delivery Gap: The difference between promises made through different marketing
communications and actual service delivery.
5. Service Quality Gap: The difference between customer expectations of service quality and customer
perceptions of service quality.
The SERVQUAL is a generic instrument which is used to measure service quality in different industries
including Healthcare, Banking, Fast food, Telecommunication, Retail chain, Information system, Library
services across the globe (Riadh, 2009).The identification of these gaps through SERVQUAL portrays the
actual performances of a firm and helps the managers to minimize the identified gaps through taking remedial
measures (Mohsin and Ernest, 2010). Despite its usefulness, the SERVQUAL has been criticized for its
operational and conceptual limitations which question the application of the scale across the globe (Jabnoun
and Khalifa, 2005; Landrum et al., 2007). Some others question its psychometric properties and hold the
opinion that all five dimensions of SERVQUAL are not generically applicable to all service contexts (Arasli et
al., 2005; Badri et al., 2005). The researchers recommend using SERVQUAL scale by grounding the five
dimensions of SERVQUAL in the context of investigation (Ladhari, 2008). These adaptations will help the
marketers to understand the cultural definitions of customer expectations, leading to formulation of highly
customized marketing strategies to improve the service performances (Barabino et al., 2012). These
researchers have successfully encountered the challenges of operationalizing SERVQUAL in different country
contexts to offer useful strategies in order to improve performance.
In order to increase the operational efficiency of a scale, its understanding is pivotal for marketers. The five
dimensions of SERVQUAL are described below:
- Tangibles: The extent of physical facilities, tools and equipment used such as signboards, furniture
etc.

176 Muhammad Mursaleen, Mubashir Ijaz and Muhammad Kashif Observatorio (OBS*) Journal, (2014)
- Reliability: The consistency of delivering error-free service, over a period of time.
- Responsiveness: The employees’ eagerness to deliver service such as their body language.
- Assurance: The extent of knowledge and courtesy employees possesses.
- Empathy: The skills to pay individualized attention to every customer.
Due to intangible nature of services, many researchers limit themselves to measure only the perceived quality
by discarding expected quality (Mohsin and Ernest, 2010). Although many tools are available to measure
service quality but the issue of ‘SERVQUAL’ as a tool to measure service quality has remained a critical
decision for researchers. Some believe that SERVPERF is a good choice when compared with SERVQUAL, in
terms of the scope (Francois and Fernando, 2007). Francois and Fernando (2007) conducted a meta- analytic
study based on 17 years of research published on the application and challenges of SERVQUAL. The results
of their study confirmed the application of both scales: SERVQUL and SERVPERF. However, it was also found
that due to better diagnostic nature of SERVQUAL scale (perceived and expected both qualities), it attracted
more scholastic interest than any other scale used so far to measure service quality.
Problem statement
Every organization seeks to gain a handful of profit which can be earned through offering different products
and services. TV networks gain profit by offering different type of programs however; the high cost of airtime
is real challenge to stay profitable (Chorianopoulos and Spinellis, 2005). Viewers like to watch the programs
of their choice and many a times are difficult to retain (Wilbur, 2008a). In order to attract viewers, channels
use several strategies which cause hypertension and other disease spread among viewers (Pardee et al.,
2007). The tactics used by several news channels induce the feeling of fear, anger and disgust among the
viewers (Newhagen, 1998). However, the channels are not to be criticized as their task is to present the
actual state of socio-political environment in a country (Aalberg et al. 2010). Whether the situation is good
or bad, the primary task of media channels is to communicate the message to public. However, to develop
public trust on the news, channels must be credible, liked by the viewers, representative of local culture, and
have a reputation of quality (Sunder et al., 1999). Juan et al. (2012) while investigating the program choice
found that ‘program variety’ on TV channels increase the satisfaction of viewers. Further to this, they found
that customer satisfaction depends upon different factors such as; creativity of programs, cast of models,
and visual appeal. High frequency of TV commercials has also resulted into an increasing trend to switch the
channels as many viewers avoid watching commercials (Elpers et al., 2003). The interest developed by
program is another significant dimension which signals high quality and results in public trust on TV channels

Observatorio (OBS*) Journal, (2014) Muhammad Mursaleen, Mubashir Ijaz and Muhammad Kashif 177
(Tse and Lee, 2001). Higher interest developed by TV channels signal ‘reliability’ of the service performed.
However, there are some personal, situational, and media-related variables identified which cause consumer
channels switching (Steve and Ian, 2010). Media studies investigating channels switching, building public
trust and overall quality of TV channels have so far explicated the advertising avoiding behavior as a remedial
measure (Elpers et al., 2003; Dix and Phau, 2010). No prior study investigates the service quality offered by
media channels which can help the authorities to understand public expectations and the quality delivered.
Current study is planned to fill this knowledge gap. The results will help media managers, especially in news
channels to customize the theme of ‘news’, broadcasted to communicate with general public.
Research objectives
- To understand the public expectations regarding TV news channels
- To demonstrate the differences between perceived and expected quality offered by TV news
channels
- To demonstrate the extent of SERVQUAL ‘model fitness’ measuring service quality of news channels
- To offer useful and practical marketing strategies in order to bridge the service quality gaps between
expectations and perceptions.
-
Methods & precincts
The SERVQUAL scale has been used as a culturally-sensitive scale by many service marketing researchers. It
is evident that SERVQUAL has been modified as per the context of investigation (Barabino et al., 2012;
Ramseook-Munhurrun et al., 2009). The initially developed scale by Parasuraman et al. (1991) was taken
into consideration for this study and was modified to fit-in with media service quality research settings. Every
item of the scale was re-worded to suit the service setting. For example, under the Reliability item: “The
employees deliver error-free services” was replaced by “Media is sharing truthful information”. This was done
under the guidance of several senior professors whom are well versed with the research techniques and
methods. The instrument consisted of two major parts; expectation (E) items and perceived (P) quality items.
Although a 7-point Likert scale has been used in SERVQUAL studies but most of the researchers have
extensively used a 5-item scale (Ramseook-Munhurrun et al., 2009). Hence, for this study, the scale ranged
from “1=strongly disagree” to “5=strongly Agree”. The use of a 5-point Likert scale has been advocated by
early researchers in the field of services marketing (Babakus and Mangold, 1992). An initial 29-item scale
was pilot tested with 10 respondents and the respondents’ ease and understanding with the scale was

178 Muhammad Mursaleen, Mubashir Ijaz and Muhammad Kashif Observatorio (OBS*) Journal, (2014)
observed. The pilot testing procedure and number of respondents to use for pilot study was guided and opted
from SERVQUAL studies (Ramseook-Munhurrun et al., 2009). After performing a ‘pilot test’, it was observed
that there is no need to reduce the number of items from the instrument which was finalized as a 29-item
scale.
The scale was administered by research team personally in the vicinity of Gujranwala city, located in the
province of Punjab, Pakistan. The data collection took one month from December, 2012 to January, 2013. A
total of 350 people were approached for the purpose of this study, to which questionnaire was personally
distributed. The sample size calculation has been guided through the recommendations made by Nunnally
and Bernstein (1994). These researchers suggest a sample size of 300> in order to attain some reliable
results and analysis in psychometric measurements. There were 29-items in the modified SERVQUAL scale
and with the proportion of 10:1, a sample size of 300 and above would have been appropriate. Amongst the
350 questionnaires distributed for the purpose of data collection, research team was able to collect back 318
responses which were considered valid for this study. Given the suggestions of researchers regarding sample
size, 318 is an acceptable number of respondents to ensure reliability of results. The data collected was
analyzed through SPSS 16.0 and various reliability tests and descriptive analysis were performed to unleash
the gaps which exist between expectations and perceptions of TV viewers.
Results
Technically, to assess the psychometric properties of modified SERVQUAL scale, the principle component
factor analysis with Varimax was used. It was decided that the items with an eigenvalues of above 1.0 and
the loadings equal to or greater than 0.50 will be retained (Hair et al., 1998). The variance explained for
expected and perceived service quality has been discussed through Table 1.
Table 1: Exploratory Factor Analysis
Expected Perceived
SERVQUAL
Dimensions KMO Bartlett's Sig.
Variance
Explained KMO Bartlett's Sig.
Variance
Explained
Reliability .681 66.6 .000 49.796 .565 314.444 .000 42.723
Responsiveness .611 86.2 .000 39.853 .850 1292.836 .000 55.499
Tangibility .500 26.07 .000 64.081 .500 13.716 .000 60.313
Assurance .611 92.45 .000 49.196 .730 791.041 .000 46.101
Empathy .726 88.26 .000 47.475 .725 397.351 .000 37.399
Observatorio (OBS*) Journal, (2014) Muhammad Mursaleen, Mubashir Ijaz and Muhammad Kashif 179
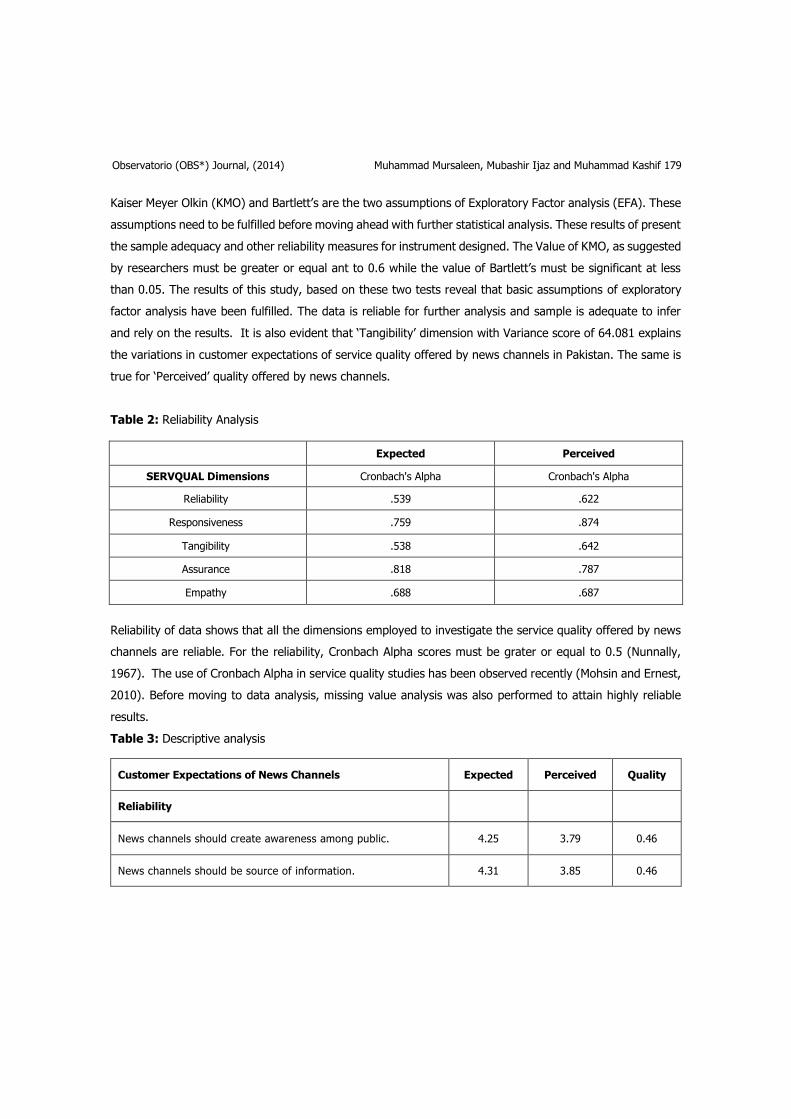
Kaiser Meyer Olkin (KMO) and Bartlett’s are the two assumptions of Exploratory Factor analysis (EFA). These
assumptions need to be fulfilled before moving ahead with further statistical analysis. These results of present
the sample adequacy and other reliability measures for instrument designed. The Value of KMO, as suggested
by researchers must be greater or equal ant to 0.6 while the value of Bartlett’s must be significant at less
than 0.05. The results of this study, based on these two tests reveal that basic assumptions of exploratory
factor analysis have been fulfilled. The data is reliable for further analysis and sample is adequate to infer
and rely on the results. It is also evident that ‘Tangibility’ dimension with Variance score of 64.081 explains
the variations in customer expectations of service quality offered by news channels in Pakistan. The same is
true for ‘Perceived’ quality offered by news channels.
Table 2: Reliability Analysis
Expected Perceived
SERVQUAL Dimensions Cronbach's Alpha Cronbach's Alpha
Reliability .539 .622
Responsiveness .759 .874
Tangibility .538 .642
Assurance .818 .787
Empathy .688 .687
Reliability of data shows that all the dimensions employed to investigate the service quality offered by news
channels are reliable. For the reliability, Cronbach Alpha scores must be grater or equal to 0.5 (Nunnally,
1967). The use of Cronbach Alpha in service quality studies has been observed recently (Mohsin and Ernest,
2010). Before moving to data analysis, missing value analysis was also performed to attain highly reliable
results.
Table 3: Descriptive analysis
Customer Expectations of News Channels Expected Perceived Quality
Reliability
News channels should create awareness among public. 4.25 3.79 0.46
News channels should be source of information. 4.31 3.85 0.46

180 Muhammad Mursaleen, Mubashir Ijaz and Muhammad Kashif Observatorio (OBS*) Journal, (2014)
News channels should provide truthful information. 4.25 2.72 1.53
News channels should depict a true picture of politics. 4.28 2.68 1.60
Telecasting the breaking news frequently by News Channels should not create anxiety.
4.00 3.67 0.33
Responsiveness
News channels should provide up to date information. 4.36 3.69 0.67
Talk shows broadcasted by news channels should mostly cover the Islamic topics.
4.17 2.83 1.34
News channels should be innovative in offering variety of programs
3.98 3.21 0.77
News channels should work to enhance viewer learning.. 4.42 3.08 1.34
News channels should guide the youth. 4.31 2.98 1.33
News channels should provide education to consumers 4.35 2.79 1.56
News channels should create social awareness. 4.24 3.45 0.79
News channels should provide education and useful information. 4.31 3.06 1.25
Assurance
News channels should convey the positive message. 3.92 2.82 1.10
News channels should free from corruption. 4.23 2.44 1.79
News channels should be working in line with the Islamic principles.
4.26 2.44 1.82
Anchors of News channels should behaving in a decent manner while discussing serious issues.
4.12 3.11 1.01
Programs offered by News channels should be interesting and entertaining.
4.41 3.57 0.84
News channels should depict a positive picture of Pakistani society. 4.36 2.98 1.38
News channels should righteously use the power of freedom 4.47 3.47 1.00

Observatorio (OBS*) Journal, (2014) Muhammad Mursaleen, Mubashir Ijaz and Muhammad Kashif 181
Tangibility
The detailed news and full footage of incidents broadcasted by News channels should not create anxiety
3.65 3.26 0.39
News channels should be representative of Pakistani culture. 4.30 2.79 1.51
Empathy
News channels should be entertaining 4.16 3.62 0.54
Commercials in news channels should be few. 4.10 2.71 1.39
News Channels should do not waste the time of audience on irrelevant information.
3.99 3.07 0.92
News channels should offer customized programs at different timings forpeople from generations.
4.32 3.20 1.12
There should be an element of ‘betterment for society’ in the talk Shows broadcasted by news channels.
4.34 3.36 0.98
News channels should share news and other information at customer convenience.
4.13 3.16 0.97
News channels should not disturb the safe home Environment
4.40 3.42 0.98
Table 3 presents the mean differences between expected and perceived quality offered by news channels in
Pakistan. Table 4 presents the mean scores for the five dimensions of SERVQUAL in terms of the difference
between expectations and perceptions. Means score of both expected and perceived service of channels were
compared to reach at a gap (E – P=Gap), as proposed by service marketing researchers (Mohsin and Ernest,
2010).
Table 4: Descriptive analysis Overall
Expected Perceived Gap
Reliability 4.22 3.34 0.88
Responsiveness 4.27 3.14 1.13
Tangibility 3.97 3.03 0.94
Assurance 4.25 2.97 1.28
Empathy 4.20 3.76 0.44

182 Muhammad Mursaleen, Mubashir Ijaz and Muhammad Kashif Observatorio (OBS*) Journal, (2014)
The results reveal that there are gaps in overall quality offered by news channels in Pakistan. Overall the
largest gap was found in the difference between expected and perceived quality in terms of ‘Assurance’
dimension (1.28). The ‘responsiveness’ has been evidenced as the second highest gap between expected
and perceived quality offered by news channels in Pakistan (1.13). It is interesting to note here that
‘Responsiveness’ has the highest expected value (4.27) which reflects the public reference while watching
news channels in Pakistan. Although the public is not satisfied with the overall quality of service offered
however; based on the mean results, public perceives news channels are ‘empathic’ up to a certain extent.
By explaining the five dimensions individually, it can be observed that gaps exist in all the 29 items. This also
means that the public is not satisfied with the quality of service offered by news channels in Pakistan.
Reliability had five dimensions with the highest gap observed in the item ‘News channels are depicting true
picture of politics’ (E-P=1.60). The ‘Responsiveness’ item ‘News channels are providing education and useful
information’ with a gap score of 1.56. There are gaps in ‘Assurance dimension as well with the largest gaps
found in items ‘News channels are free from corruption’ (1.79) and ‘News channels are working in line with
the Islamic principles’ (1.82). The largest gap under the ‘Tangibility’ dimension was found in the item ‘News
channels are representative of Pakistani culture’ (1.51). The largest gap was found in the ‘Empathy’
dimension in the item ‘Commercials in news channels are few’ (1.39).
Discussion There are numerous studies conducted to investigate the service quality of different sectors such as
healthcare, banking, and transport services (Mersha et al., 2012; Friman and Fellesson, 2009; Mohsin and
Ernest, 2010). However, the research pertaining to the service quality offered by news channels were
absolutely missing which formed the basis to conduct this study. Another motivation which fostered the
conduct of this study was the frustration of general public observed by the principal author with regards to
news media channels. Current study objectively identifies the public expectations from news channels. Based
on these expectations, a SERVQUAL approach has been employed to understand the state of service quality
offered by news channels in Pakistan. The study is an original and pioneer work in the field of service quality
where the context of Pakistani news channels.
Culture of Pakistan is different from western countries mainly in essence that Pakistanis are by large a
collectivist society (Hofstede, 2001). Several other differences are visible based on the Hofstede dimensions.
These differences make Pakistan an interesting country to investigate with regards to service quality of media
channels. Current study presented the gaps found between viewers’ expectations and their perceptions about
service quality offered by news channels. In Pakistan children aged (4-17), women aged 18 plus and men
aged 18 plus mostly have same television watching habits. Children spend more time as compare to men

Observatorio (OBS*) Journal, (2014) Muhammad Mursaleen, Mubashir Ijaz and Muhammad Kashif 183
and women for watching television in 4pm to 6pm slot (Gallup 2012). Additionally, the whole family is exposed
to various TV programs and there is no limit of time as per age of the viewers. Given these statistics, it is
alarming that an overall highest gaps is found in the ‘Responsiveness’ dimension. Due to having a collectivist
culture, the family members watch TV in groups. Considering the gaps found in all the dimensions, it can be
inferred that the channel loyalty and public trust cannot be attained unless the public is satisfied with the
segmentation and content of the news channels (Juan et al., 2012).
The socio-political unrest is observed in all parts of the world including the African, Asian, as well as European
countries. We acknowledge that the core task of media is to present the true picture of society in the local
socio-cultural contexts (Aalberg et al. 2010). Despite this acknowledgement, public do not perceive that news
channels are truthful. This is evident by the results of ‘Reliability’ and ‘Responsiveness’. Again referring back
to culture, TV watching in family gatherings is hilarious as public perceives that news channels repeatedly
share the breaking news in order to gain better ratings and become consumer choice. It will badly affect the
adolescents and children of all ages (Kashif et al., 2012).
Islam is a religion of peace and harmony for the masses. The public in Pakistan perceive that news channels
are not reflecting Islamic principles towards life and media freedom is not righteously exercised. These results
are in line with the studies conducted to explain the role of media in spreading ‘materialism’ among the
viewers (Burroughs et al., 2002). The largest gaps found under the ‘Assurance’ dimension are related to
public expectations that media must be ‘corruption free’ and must ‘follow the Islamic principles and tradition.
We acknowledge the strong competition amongst the news channels however the media managers must
take into consideration that frequency of communication and TV viewing can cause the feelings of anxiety,
fear, and frustration among viewers (Newhagen, 1998).
Individualized attention is another important concern among service marketing managers as paying
‘individual attention’ in services is considered important to succeed (Ladhari, 2009). The Pakistani public does
not perceive that news channels are customizing their offers in terms of time, variety of programs/talk shows,
and ultimately catering to the needs of individual segments with different psychographics. These expectations
are in lie with the results of recent studies conducted in the field of service marketing (Barabino et al., 2012).
One must also note that Pakistani score high on Power Distance Index (PDI) which translates them as
individuals who acknowledge and demand power (Hofstede, 2001). This power distance index can be linked
with the need to ‘receive individual attention’ among a group of people. Operationally, it seems difficult to
attain customer satisfaction based on individual attention to be provided by media channels. However, a
highly customized plan is possible with segmentation based on local culture, rituals, and adaptations. Further
to this, public expect that there must be minimum TVCs during the talk shows and other informatory

184 Muhammad Mursaleen, Mubashir Ijaz and Muhammad Kashif Observatorio (OBS*) Journal, (2014)
programs. Minimizing TV commercials during important programs help researchers to reduce channel
switching and channel loyalty (Dix and Phau, 2010).
Role of employees is considered pivotal for the success of service organizations (Nazimet, 2011). Pakistani
public expect that the news anchors must be ‘real’, and serious while presenting any news depicting crisis
situations. This can be linked with public perceptions of service quality based on individual experiences where
employees play the key role in building trust and credibility in the media industry (Sundar, 1999). Employees
can help service organizations to achieve the customer criteria of credibility and quality of news channels.
Conclusion The study made meaningful contribution to the existing body of knowledge. Firstly, a modified SERVQUAL
has been employed. Secondly, the Asian customers’ expectations from news channels have been explored
for the first time. Thirdly, the context of Pakistan is unique in the sense that no prior studies unearth the
service quality offered by news channels in Pakistan. The conduct of this study is very useful for media
marketing managers and owners of news channels as the customer expectations have been presented. These
managers and other decision makers can take into consideration the public expectations in order to devise
marketing strategies which will lead to customer satisfaction and loyalty. In particular, an emphasis should
be made on religious perspectives while communicating with the public. The results also reveal that public
does not trust much on the credibility and quality of news channels which is alarming sign in an era of high
competition. There are gaps found in all the dimensions of SERVQUAL but the largest gaps are observed
under responsiveness and assurance dimensions. The researchers are of the view that these two dimensions
must be specifically concentrated while devising marketing strategies. The researchers recommend several
strategic options for channel marketing managers and other decision makers. Firstly, news channels must
spread truthful and timely information to the people so that an element of trust can be established between
public and media channels. This can be achieved through strengthening the evidence and its validity before
a news or any information is broadcasted. In order to achieve credibility, the product mix must be stretched
horizontally or vertically through employing a welfare marketing approach. Welfare marketing strongly
stresses the need to identify the public benefit, and then devise a marketing strategy around their needs. In
case of media, we propose that media must recognize its role in consumer education where more and more
education-centered programs such as documentaries lectures of university staff etc. must be broadcasted.
Secondly, Talk shows telecasted on news channels must also focus on addressing the Islamic topics through
these shows. Media is acknowledged as a strongest ‘social institution’; playing a significant role in developing
self-reference criteria of the people. It is a big responsibility which must be achieved through emphasizing
culturally-specific and religious Islamic programs. It can be achieved through inviting religious scholars from

Observatorio (OBS*) Journal, (2014) Muhammad Mursaleen, Mubashir Ijaz and Muhammad Kashif 185
all sects to appear and share the Islamic thought and culture. It will benefit the whole family in culture such
as Pakistan where people watch TV in groups, in larger parts of Pakistan; rural market. Thirdly, the frequency
of breaking news must be minimized as it is a major cause of stress and anxiety amongst the viewers. Sharing
the similar news again and again loses its true importance and value as in the case of advertising. Hence,
the minimization of crisis news will help the media marketers in better able to position their channels as
brand, generating favorable loyalty. This can be achieved through employing a ‘market development’
strategy. There is no need to communicate ‘breaking news’ during the time when children are watching TV.
Hence, it is only possible when the time slots are identified so that the needs of various target groups are
well served. This can be achieved through conducting proper market research in Pakistan to identify the time
slots various consumers use to watch television. We propose a highly concentrated marketing strategy which
will help marketers to identify segments, and then offer highly customize programs according to the needs
of segments.
There are several strengths of the methodology opted for this study. Firstly, a context-specific SERVQUAL-
item scale has been used to understand the customer expectations of service quality. Secondly, the gaps
model has been used by explaining the difference between expected quality and the perceived quality.
Thirdly, a significantly large number of respondents have been selected as a sample for this study, based on
the recommendations by renowned statistics experts. Despite the significant contextual and methodological
contributions, there are several limitations. Firstly, the sample of respondents was selected from a university
in the province of Punjab for the purpose of convenience. However, there are many service quality studies
noted which consider students as sample respondents. This generally limits the generalizability of research
results. Future researchers are strongly recommended to incorporate a more representative sample of
respondents to better generalize the results. Secondly, the robust statistical techniques are not used to
analyze the data. Although the analysis through mean scores serves the purpose of study, still we recommend
future researchers to incorporate the ‘model fitness’ and application of various other measurement models
through structural equation modeling.
References
Aalberg, T., Van Aelst, P., & Curran, J. (2010). Media systems and the political information environment: A cross-national comparison. The International Journal of Press/Politics, 15(3), 255-271.
Afzal and Shehla, 2011, ‘Cultural diversity in Pakistan: national vs provincial.’ Mediterranean journal of social science vol. 2 pp. 331.
Agirreazaldegi, T. (2008). Audiovisual documentation in the preparation of news for television news programs. Aslib Proceedings, 60(1), 47 – 54.
Anderson, E. W. (1994). Cross-Category Variation in Customer Satisfaction and Retention: Marketing Letters, 5, 19-30.

186 Muhammad Mursaleen, Mubashir Ijaz and Muhammad Kashif Observatorio (OBS*) Journal, (2014)
Artero, J. P., Etayo, C., & Sánchez-Tabernero, A. (2012). Effect of advertising on perceived quality by TV viewers.
Babakus, E. & Mangold, W.G. (1992). Adapting the SERVQUAL scale to hospital services: an empirical investigation. Health Services Research , 26(6), 767-86.
Barabino, B., Deiana, E., & Tilocca, P. (2012). Measuring service quality in urban bus transport: a modified SERVQUAL approach. International Journal of Quality and Service Sciences, 4, 238 – 252.
Barabino, B., Deiana, E., &Tilocca, P. (2012). Measuring service quality in urban bus transport: a modified SERVQUAL approach. International Journal of Quality and Service Sciences, 4(3), 238-252.
Benesch, C., Frey, B. S. & Stutzer, A. (2010). TV Channels, Self-Control and Happiness. The B.E. Journal of Economic Analysis & Policy, 10(1), Article 86.
Bick, G. G., Abratt, R. R., & Möller, D. D. (2010). Customer Service Expectations in Retail Banking in Africa. South African Journal of Business Management, 41(2), 13-27.
Butt, M. M., & Run, E. C. (2010). Private healthcare quality: applying a SERVQUAL model. International Journal of Health Care Quality Assurance, 23(7), 658 – 673.
Carrillat, F. A., Jaramillo F., & Mulki, J. P. (2007). The validity of the SERVQUAL and SERVPERF scales: A meta-analytic view of 17 years of research across five continents. International Journal of Service Industry Management, 18(5), 472 – 490
Chase, R. B. (1978). Where does the customer fit in a service operation? Harvard Business Review, 566, 137–142.
Cronin Jr, J. J., & Taylor, S. A. (1992). Measuring service quality: a reexamination and extension.The journal of marketing, 56, 55-68.
Dix, S., & Phau, I. (2010). Measuring situational triggers of television channel switching. Marketing Intelligence & Planning, 28(2), 137-150.
Dix, S., & Phau, I. (2010). Measuring situational triggers of television channels switching. Marketing intelligence and planning, 285(2), 137-150.
Donnelly, M., Wisniewski, M., Dalrymple, J. F., & Curry, A. C. (1995). Measuring service quality in local government: the SERVQUAL approach.International Journal of Public Sector Management, 8(7), 15-20.
Eisend, M., & Möller, J. (2007). The Influence of TV Viewing on Consumers’ Body Images and Related Consumption Behavior, Marketing Letters, 18, 101-116.
Friman, M. and Fellesson, M. (2009). Service supply and customer satisfaction in public transportation: the quality paradox. Journal of Public Transportation, 12(4), 57-69.
Gallup Pakistan and Gilani research foundation. (2012). Media and television Audience measurement cyberletter.
Geetika, & Nandan, S. (2010). Determinants of customer satisfaction on service quality: a study of railway platform of India. Journal of public transportation, 12, 97-113.
Gunter, B. (2005). Trust in the news on television. Aslib Proceedings, 57(5), 384-397. Ham, C.L., Johnson, W., Weinstein, A., Plank, R. & Johnson, P.L. (2003). Gaining competitive advantages:
analyzing the gap between expectations and perceptions of service quality. International Journal of Value-Based Management, 16, 197-203.
http://galluppakistan.blogspot.com/2010/05/95-of-all-pakistani-tv-viewers-prefer.html Accessed March 2013. http://tribune.com.pk/story/418248/tv-channels-spreading-vulgarity-pemra-doing-nothing-chief-justice/ [Accessed
on 18 May, 2013]. http://www.gallup.com.pk/News/Media%20Cyberletter%20June%2009%20%282nd%20version%29.pdf Accessed
March 2013.
Hussain, N., Bhatti, W. A., & Jilani, A. (2011). An empirical analysis of after sales services and customer satisfaction. Management & marketing challenges for the knowledge society, 6(4), 561-572.
IP Germany 2005. Television (2005): International keyfacts. Cologne, Germany: IP Germany.
Observatorio (OBS*) Journal, (2014) Muhammad Mursaleen, Mubashir Ijaz and Muhammad Kashif 187
Koenig, H. G. (1990). Research on religion and mental health in later life: A review and commentary. Journal of Geriatric Psychiatry, 23, 23-53.
Ladhari, R. (2009). A review of twenty years of SERVQUAL research. International Journal of Quality and Service Sciences, 1(2), 172 – 198.
Ladhari, R. (2009). A review of twenty years of SERVQUAL research. International Journal ofQuality and Service Sciences, 1, 172-98.
McGinnis, J. M., Gootman, J. A., &Kraak, V. I. (2006). Food marketing to children and youth: threat or opportunity? Washington, DC: The National Academies Press.
Mehta, K., Coveney, J., Ward, P., Magarey, A., Spurrier, N., Udell, T. (2010). AustralianChildren’s Views about
Food Advertising on Television. Appetite, 55, 49-55. Mersha, T., Sriram, V., Yeshanew, H., &Gebre, Y. (2012). Perceived service quality in Ethiopian retail
banks.Thunderbird International Business Review, 544, 551-565. Mosahad, R., Ramayah, T., & Muhammad, O. (2010). Service quality, customer satisfaction and loyalty: A
test of mediation. International business research, 3(4), 72-80. Moschis, G., Ong F. S., Mathur, A., Yamashita, T., & Benmoyal-Bouzaglo, S. (2011) .Family and television
influences on materialism: a cross-cultural life-course approach. Journal of Asia Business Studies, 5(2), 124 – 144.
Murroni, C. and N. Irvine. (1997). The Best Television in the World’, in Quality in Broadcasting , C. Murroni et al. Institute for Public Policy Research, London.
Nakamoto Eds., Advances in consumer research. Valdosta, GA: Association for Consumer Research. Newhagen, J. E. (1998). TV news images that induce anger, fear, and disgust: Effects on approach‐avoidance
and memory. Journal of Broadcasting & Electronic Media, 42(2), 265-276. Nunnally, J. C., & Bernstein, I. H. (1994). Psychometric theory . New York: McGraw-Hill. Parasuraman, A., Berry, L.L. & Zeithaml, V.A. (1994). Reassessment of expectations as a comparison standard
in service quality measurement: Implications for future research. Journal of Marketing, January, 111-24.
Parasuraman, A., Berry, L.L., & Zeithaml, V.A. (1988). SERVQUAL: a multiple item scale for measuring customer perceptions of service quality. Journal of Retailing, Spring, 12-40.
Parasuraman, A., Zeithaml, V. A., & Berry, L. L. (2004). Refinement and reassessment of the SERVQUAL scale. Journal of retailing, 67(4), 114.
Parasuraman, A., Zeithaml, V. A., & Leonard L. (1985). A conceptual model on service quality and its implication for future research. Journa of marketing, 49, 41-50.
Pardee, P. E., Norman, G. J., Lustig, R. H., Preud’homme, D., &Schwimmer, J. B. (2007). Television viewing and hypertension in obese children. American journal of preventive medicine, 33(6), 439-443.
PEMRA annual report 2010. Ramseook-Munhurrun, P., Naidoo, P., Soolakshna D., & Bhiwajee L. (2009). Employee perceptions of service
quality in a call centre. Managing Service Quality, 19, 541 – 557. Sangeetha, J., & Mahalingam, S. (2011). Service quality models in banking: a review. International Journal
of Islamic and Middle Eastern Finance and Management, 4, 83 – 103. Segrin, C., & Nabi, R. L. (2002). Does television viewing cultivate unrealistic expectations about marriage?
Journal of Communication, 52, 247–263.
Shah, S. A. M., & Amjad, S. (2011). Cultural diversity in Pakistan: national vs provincial.’ Mediterranean journal of social science, 2, 331-344.
Siddiqi, K. O. (2011). March. Interrelations between service quality attributes, customer satisfaction and customer loyalty in the retail banking sector in Bangladesh. International Journal of Business and Management, 12–37.
Siddiqi, K. O. (2011, March). Interrelations between service quality attributes, customer satisfaction and customer loyalty in the retail banking sector in Bangladesh. International Journal of Business and Management, 12–37.

188 Muhammad Mursaleen, Mubashir Ijaz and Muhammad Kashif Observatorio (OBS*) Journal, (2014)
Sundar, S. S. (1999). Exploring receivers' criteria for perception of print and online news. Journalism & Mass Communication Quarterly, 76(2), 373-386.
Vargo, S. L., & Lusch, R. F. (2004). Evolving to a new dominant logic for marketing. Journal of marketing, 1-17.
Wansink, B., & Huckabee, M. (2005). De-marketing obesity. California Management Review, 47, 6–18. Zeithaml, V. A., & Berry, L. L. (1993). The nature and determinants of customer expectations of service.
Journal of the academy of Marketing Science, 21(1), 1-12.