Embed Size (px)
Citation preview

Service Quality and Customer Satisfaction in Selected Banks in Rwanda
A Thesis
Presented to the School of Postgraduate Studies and Research
Kampala International University
Kampala, Uganda
In Partial Fulfillment of the Requirements for the Degree Masters of
Business Administration in Banking and Finance
BY
RUBOGORA FELIX
MBA/10038/81/DF
September, 2011
ii
DECLARATION A
”This thesis is my original work and has not been presented for a Degree or any
other academic award in any University or Institutional of Learning”.
RUBOGORA FELIX
RESEARCHER
_______
Date: / /

iii
DECLARATION B
“I confirm that the work reported in the thesis is carried out by the candidate
under my supervision.”
DR. ANDEW MUSIIME
SUPERVISOR
Date: / /
iv
APPROVAL SHEET
This thesis entitled “Service Quality and Customer Satisfaction in
selected Banks Sector in Rwanda” prepared and submitted by Rubogora Felix, in
partial fulfillment of the requirements for the degree of Masters of Business
Administration in Banking and Finance has been examined and approved by the
panel on oral examination with a grade of PASSED.
Name and Sig. of Chairperson
Name and Sig of Supervisor Name and Sig. of Panelist
Name and Sig. of Panelist Name and Sig. of Panelist
Date of Comprehensive Examination: ____________________
Grade: ____________________
Name and Sig of Director, SPGSR
Name and Sig of DVC, SPGSR

v
DEDICATION
This Thesis is dedicated to the Almighty God who has given me life to go through my
studies. It is also dedicated to my lovely wife UWASE Claudine for the sacrifice, moral
and financial supports that she gave and prayers she made throughout the entire period
of my research and my 2 dearly loved daughters Colombe and Shammah who
sometimes stayed alone while I was away for studies. To my loved parents, brothers
and sisters, I also dedicate this research.

vi
ACKNOWLEDGEMENT
First and foremost, the researcher wishes to express his gratitude to the Almighty God
for having kept him safe during the research period, the whole of his life and
throughout his studies.
The researcher would like to acknowledge the varied assistance of the following
persons in the course of his research.
To the School of Post Graduate and Research, Kampala International University for
preparing him with the necessary skills and knowledge that has enabled him to do this
research.
To the Deputy Vice Chancellor of School of Post Graduate and Research, Kampala
International School Dr. Novembrieta R. Sumil and Viva Voce panel members who
greatly contributed in the understanding, questioning of hanging points and approval of
the research.
To his research supervisor DR ANDREW MUSIIME for giving him helpful advice and
comments while handling this work with more care and kindness.
To the management of Banque Populaire du Rwanda for having authorized him to
gather information related to his research conducted in its Kigali Town branches.
To all his colleagues and friends at Kampala International University from different
countries who allowed him to share some life experiences and especially those who
helped him share various capacities while carrying my research.
Lastly, to all individuals who contributed in one way or another toward the success of
this work.
“Thank you and God bless”
vii
TABLE OF CONTENTS
DECLARATION A ii DECLARATION B iii APPROVAL SHEET iv DEDICATION v ACKNOWLEDGEMENT vi TABLE OF CONTENTS vii LIST OF TABLES ix LIST OF FIGURES x LIST OF ACRONYMS xi ABSTRACT xii CHAPTER ONE 1 THE PROBLEM AND ITS SCOPE 1 Background of the Study 1 Statement of the Problem 2 Purpose of the Study 3 Research Objectives 3 Research Questions 3 Hypothesis of the study 4 Scope of the Study 4 Significance of the Study 4 Operational Definitions of Key Terms 5 CHAPTER TWO 7 REVIEW OF RELATED LITERATURE 7 Introduction Error! Bookmark not defined. Concepts, Opinions, Ideas from Authors/Experts 7 Theoretical review 7 Schema of work 9 Related studies 10 Service Quality 10 Service Quality Dimensions 12 Customer Satisfaction 14 Service Quality and Customer Satisfaction 16 CHAPTER THREE 17 RESEARCH METHODOLOGY 17 Research Design 17 Research Population 17 Sample Size 17 Sampling Procedure 18 Research Instrument 18
viii
Reliability and Validity of the Instrument 19 Data Gathering Procedures 19 Data analysis 20 Ethical Considerations 20 Limitations of the Study 21 CHAPTER FOUR 22 PRESENTATION, ANALYSIS AND INTERPRETATION OF DATA 22 Introduction Error! Bookmark not defined. Respondent’s profile 22 Level of service quality 23 Level of customer satisfaction 26 Relationship between service quality and customer satisfaction 28 CHAPTER FIVE 31 FINDINGS, CONCLUSIONS AND RECOMMENDATION 31 Introduction Error! Bookmark not defined. Findings 31 Conclusion 32 Recommendations 33 Areas for further research 33 REFERENCES 34 APPENDICES 37 APPENDIX A: TRANSMITTAL LETTER 37 APPENDIX B: APPROVAL LETTER FROM BPR 38 APPENDIX C: RESEARCH INSTRUMENT-QUESTIONNAIRE 39 APPENDIX D: RESEARCHER’S CURRICULUM VITAE 43
ix
LIST OF TABLES
Table 1: 22-Items Service Quality Scale 13 Table 2: Category of respondents 18 Table 3: Description of respondent’s profile 22 Table 4: Description of the level of service quality 23 Table 5: Description of the level of customer satisfaction 26 Table 6: Correlation results between service quality and customer satisfaction 28 Table 7: Regression analysis of customer satisfaction and service quality 29

x
LIST OF FIGURES
Figure 1: Service Quality Model 9 Figure 2: Schema of work 10
xi
LIST OF ACRONYMS
ATM: Automated Teller Machine
BPF: Banque Populaire pour les Femmes (Rwanda People’s Bank Women's Branch)
BPR: Banque Populaire du Rwanda (Rwanda People's Bank)
IPAR: Institute of Policy Analysis and Research
SPSS: Statistical Package for Social Scientists
PLCC: Peason’s Linear Correlation Coefficient
SAQ: Self Administered Questionnaire
xii
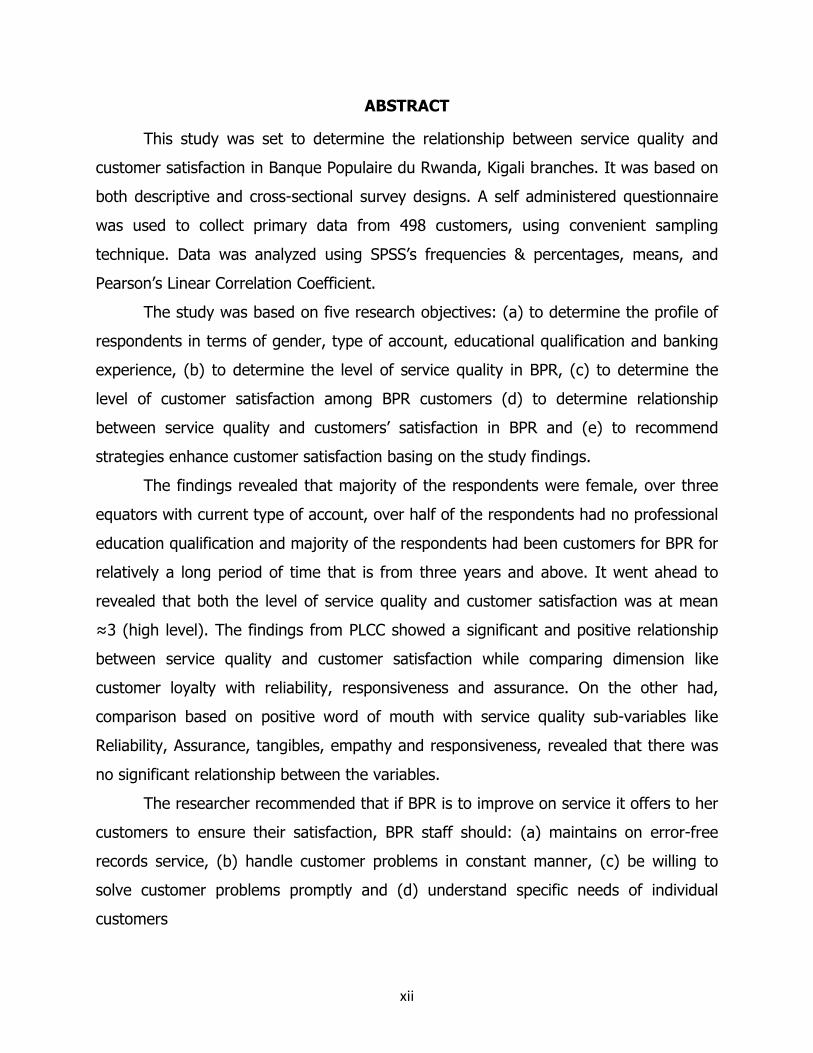
ABSTRACT
This study was set to determine the relationship between service quality and
customer satisfaction in Banque Populaire du Rwanda, Kigali branches. It was based on
both descriptive and cross-sectional survey designs. A self administered questionnaire
was used to collect primary data from 498 customers, using convenient sampling
technique. Data was analyzed using SPSS’s frequencies & percentages, means, and
Pearson’s Linear Correlation Coefficient.
The study was based on five research objectives: (a) to determine the profile of
respondents in terms of gender, type of account, educational qualification and banking
experience, (b) to determine the level of service quality in BPR, (c) to determine the
level of customer satisfaction among BPR customers (d) to determine relationship
between service quality and customers’ satisfaction in BPR and (e) to recommend
strategies enhance customer satisfaction basing on the study findings.
The findings revealed that majority of the respondents were female, over three
equators with current type of account, over half of the respondents had no professional
education qualification and majority of the respondents had been customers for BPR for
relatively a long period of time that is from three years and above. It went ahead to
revealed that both the level of service quality and customer satisfaction was at mean
≈3 (high level). The findings from PLCC showed a significant and positive relationship
between service quality and customer satisfaction while comparing dimension like
customer loyalty with reliability, responsiveness and assurance. On the other had,
comparison based on positive word of mouth with service quality sub-variables like
Reliability, Assurance, tangibles, empathy and responsiveness, revealed that there was
no significant relationship between the variables.
The researcher recommended that if BPR is to improve on service it offers to her
customers to ensure their satisfaction, BPR staff should: (a) maintains on error-free
records service, (b) handle customer problems in constant manner, (c) be willing to
solve customer problems promptly and (d) understand specific needs of individual
customers
1
CHAPTER ONE
THE PROBLEM AND ITS SCOPE
Background of the Study
Nowadays, the incredible growth of the globalization and especially liberalization
of banking services, are changing the way banks conduct business with customers who
are increasingly expecting higher quality of services, becoming time saver and wanting
more conveniences. However due to services intangibility, inseparability, heterogeneity
and perishability of production and consumption, service quality becomes hard to
evaluate. This is a critical area where private sector in particular, banks should focus on
and thus, catches up the level of customer satisfaction. In the survey report done 2009
by Institute of Policy Analysis and Research (IPAR) showing the level of customer care
in Rwanda, banking sector was ranked to 50% of the overall service perception
compared to customer expectations. The foremost findings were: first, customer service
seen was ranked as the worst in the region; secondly, there is relationship between
service quality; staff skills and lack of competition. These are areas where more
improvement is needed (IPAR, 2009). To take this issue seriously, the government
policy focused on by prioritizing it with particular importance. As said by the President
of the Republic in his speech starting the year 2009, “Customer service remains highly
problematic in private, public and civil society domains, something that is most certainly
going to preoccupy us in the coming days, months and years. We can no longer accept
a culture of mediocrity either from Rwandan business and government institutions that
give poor services, or Rwandan customers who quietly accept substandard ‘customer
care’, if I can call it that” (Ibidem).
For BPR organization under study, shifted in 2008 from a cooperative bank to be
a commercial bank. It has been using manual system with which customers were never
happy. However, even if it moved to computerized and networked system, still it has
faced a number of challenges due to experienced competitors in the industry that were
tapping at the door at that time. Among issues that are facing BPR, there are: (1) long
2
queuing lines ahead of BPR tellers; (2) it takes days to get transfers matured (e.g
salaries, etc from other banks) deposited on customers’ accounts, consequently many
customers’ complaints; (3) Some branches are still using bank books; means money
can only be withdrawn by the account owner, yet the practice of using cheques and
ATM is only for few branches.
On the other hand, more efforts have been put in place. Along with them we can
enumerate: (1) BPR system has been networked where identification of account’s
owner can be viewed by any branch staff that has the right. The result is that
customers can withdraw cash wherever there is BPR teller. (2) Adverts and awareness
mechanisms have been multiplied to disclose about new products and services
introduced including ATM service. (3) The convenience issue has been minimized by
increasing the number of outlets and sub-branches to facilitate customers to access
their bank without problem of long distance; and working hours to continue serving
customers within weekend and night hours.
BPR is now extended countrywide but five BPR branches are subjects in this
research. They are based in urban area Kigali town where competition is too tough. The
fear of competition is due to many factors among them includes the quality of its
service. So to focus our case study on five BPR branches in Kigali is not a random
choice without reasons on support.
Statement of the Problem
Despite the efforts provided by BPR to improve its service, there is still evidence
of challenges on quality of the service which leads to customer satisfaction once played
down by maintaining customers who are loyal to the bank and who can positively
recommend it to associates. Anderson, Fornell, & Lehmann (1994) stated that global
perceptions of service quality exert a strong influence on global perceptions of customer
satisfaction with the firm that finally is made by customer loyalty and positive word of
mouth communication. The matter has been evaluated particularly in terms of
commercial banking sector where competition has knocked at the door as mentioned

3
before. Based on the discussion above, the aim of this study is to examine how service
quality would impact so to improve the level of satisfaction of BPR customers.
Purpose of the Study
The purpose of this study was to determine the relationship between service
quality and customers satisfaction BPR.
Research Objectives
General objective
To determine the effectiveness of service quality on customer satisfaction in
Banque Populaire du Rwanda
Specific objectives
The study was guided by the following specific objectives:
1. To determine the respondent’s profile in terms of gender, type of account,
education background and banking experience
2. To determine the level of service quality in BPR
3. To determine the level of customer satisfaction in BPR.
4. To determine the relationship between service quality and customers’ satisfaction
in BPR;
5. To establish strategies to enhance customer satisfaction in BPR based on the
findings of the study.
Research Questions
The study was guided by the following research questions:
1. What are the respondent’s profile in terms of gender, type of account, education
background and banking experience?
2. What is the level of service quality in BPR?
3. What is the level of customer satisfaction in BPR
4. What is the relationship between service quality and customer satisfaction in
BPR?
4
5. What are strategies to put in place in order to enhance customer satisfaction in
BPR?
Hypothesis of the study
The study was guided by the following hypothesis “there is no significant
relationship between service quality and customer satisfaction in BPR”.
Scope of the Study
Geographically: The study was conducted in the five out of the eighteen
branches of BPR namely: Main branch, Muhima, Remera, Nyamirambo, and BPF (for
women) and it basically employed BPR customers.
Theoretical scope: The study was guided by the Service Quality model
developed by Christian Gronross in 1984, which looks at service quality being
determined by the differences between customers’ expectations of the service
provider’s performance and their evaluation of the services they received.
Time scope: The study on service quality and customer satisfaction was
conducted between January 2011 – September 2011 and it covered a historical period
that ranges from 2001 up to date.
Content scope: The study specifically looked at the respondents’ profile, the
level of service quality, the level of customer satisfaction, the relationship between
service quality and customer satisfaction, and recommended strategies to enhance
customer satisfaction in BPR.
Significance of the Study
The findings of the study are likely to assist service providers (commercial banks)
to identify service quality dimensions that most predict customers’ satisfaction, in order
to concentrate on them according to their degree of importance. Thus, the present
study helped bank managers to better understand how to hold loyal customers by
satisfying their overall needs with expectation that they will advocate for the bank, and
hold their trust upon the bank which results good profit, and enhances reputation as
well.
5
The findings from this study are likely also to be used as references for further
research work by anyone who might be interested in this area of study. The study are
likely to contribute academically towards future research by leveling the sensitivity of
different attributes of service quality on the customer satisfaction and providing
strategies to be put in place in order to meet customers’ needs in terms of satisfaction
The findings of this study are likely to assist policy makers in different Banks
including BPR its self, government and general public. They are likely to use it while
reviewing and Drafting policies that often act as guidelines on the approach that they
always consider to ensure customer satisfaction.
Finally the study is likely to help customers to express their feelings and
perceived position on the way banks are delivering services, with expectation to receive
improved service quality. The consideration that banks will give to findings from this
study is taken by customers as a potential upgrading of perceived service.
Operational Definitions of Key Terms
Service means a non-object that performances cannot be seen, felt, tasted, or
touched before an exchange agreement is concluded. The service performance is vary
and cannot be stored or reserved for the next use. Service cannot be separated from
provider; it needs the interaction directly between provider and consumer.
Service quality means a form of an attitude, related but not equivalent to
satisfaction that results from the comparison of expectation with performance. The
customers generally use certain criteria to evaluate service quality by examining
reliability, responsiveness, assurance, empathy and physical aspects.
Reliability means that the firm performs the service right the first time and the
firm honors its promise. This includes punctual service delivery and ability to keep to
agreements made with the customer. It concerns the ability to keep service promise
accurately and consistently. It includes correct service and accurate record and prompt
reply to customer.
Responsiveness refers to speed and timeliness of service delivery. It also
includes willingness and readiness of employees to provide service. It concerns ability to

6
provide appropriate information to customers when a problem occurs. It includes
prompt response, prompt services and quick problem solving.
Assurance is defined as knowledge and courtesy of employees and their ability
to convey trust and confidence. It’s a combination of the following: Competence
(having the requisite skills and knowledge); Courtesy (politeness, respect, consideration
and friendliness of contact staff); Credibility (trustworthiness, believability and honesty
of staff) and Security (freedom from danger, risk or doubt).
Empathy concerns with caring and individualized attention the firm provides its
customers. It’s a combination of the following: (1) Access (physical and social):
approachability and ease of contact. (2) Communication: keeping customers informed in
a language they understand and really listening to them. (3) Understanding the
customer: making the effort to get to know customers and their specific needs.
Tangibles are appearance of physical facilities, equipment, personnel, and
communication materials.
Positive Word of Mouth Communication means the informal conversation
between customers about service provided by a bank. Customers can gain a wealth of
information about a bank simply by communicating with a friend, family member, or
acquaintance. It also shows that you certainly feel pleased with the service at the point
you can advocate for it.

7
CHAPTER TWO
REVIEW OF RELATED LITERATURE
Concepts, Opinions, Ideas from Authors/Experts
Service quality is commonly noted as a critical prerequisite and determinant of
competitiveness for establishing and sustaining satisfying relationships with customers.
Previous studying suggests that service quality is an important indicator of customer
satisfaction. According to Chun and Zheng (2006), service quality is a form of an
attitude, related but not equivalent to satisfaction that results from the comparison of
expectation with performance. The customers generally use certain criteria to evaluate
service quality by examining reliability, responsiveness, assurance, empathy and
physical aspects
Customer Loyalty means the relationship between the relative attitude toward an
entity (service) and patronage behavior (Gefan, 2002). Loyalty involves a psychological
bond to the service provider and means you are at a certain high degree of customer
satisfaction and commitment.
According to Suda and Sarunya (2001) Customer satisfaction does not only
express a happy customer, but rather complex than that. It is actually a term most
widely used in the business and commerce industry. It is a business term explaining
about a measurement of the kind of products and services provided by a company to
meet its customer’s expectation.
Theoretical review
The study was guided by one of the most comprehensive Service Quality models
advanced by Christian Gronross in 1984. The model contends that service quality is
determined by the differences between customers’ expectations of the service
provider’s performance and their evaluation of the services they received.
Furthermore, Parasuraman et al. (1985) suggested the “Service Quality Model” in
order to serve as a framework for further research. Figure 2 schematically illustrated
this model. Five gaps are listed below:

8
Gap 1, customer expectation-management perception gap: Management may
have inaccurate perceptions of what consumers actually expect. It requires the
appropriate management processes, market analysis tools and attitude.
Gap 2, service quality specification gap: There may be an inability on the part of
the management to translate customer expectations into service quality specifications.
This gap relates to aspects of service design.
Gap 3, service delivery gap: Guidelines for service delivery do not guarantee
high-quality service delivery or performance. Reasons for this include lack of sufficient
support for the frontline staff, process problems, or frontline/contact staff performance
variability.
Gap 4, external communication gap: Consumer expectations are fashioned by
the external communications of an organization.
Gap 5, expected service-perceived service gap: Perceived quality of service
depends on the size and direction of Gap 5, which in turn depends on the nature of the
gaps associated with marketing, design and delivery of services. Service quality can also
be defined according to both the “what” and the “how” of a product or service
delivered.

9
Figure 1: Service Quality Model
Sources: Parasuraman et al., 1985,
Schema of work
The relationship between service quality variables and customer satisfaction
variables can be shown in the figure below. The five traditional service quality
dimensions have been developed by Parasuraman (1988) and adopted by many
researchers as appropriate model to measure the service quality. The measurement
was to analyze the gap between the expected and perceived service. In our case study,
the technique adopted is a bit different as it measured the correlation associated
between the perceived service quality elements and the level of satisfaction through its
behavioral variables (customer loyalty and word of mouth communication).

10
Figure 2: Schema of work
Source: Service Quality (Parasuraman, et al. 1988); Customer satisfaction (Reynolds
and Beatty, 1999 & Harrison-Walker, 2001).
Related studies
Service Quality
Various researches have developed alternative concepts for service quality, like
the European perspective (based primarily on Gronroos 1982; Lethinen, 1982) and the
American perspective (Parsuraman et al., 1985, 1988). The European perspective states
that service quality should include three dimensions, like technical quality, functional
quality and corporate image. The American perspective proposes that service quality
may be evaluated on the functional quality dimension, described by five components:
tangibles, reliability, responsibility, assurance, and empathy (Kang and James, 2004).
According to Parasuraman et al. (1985), service quality can be defined as the
difference between service expectation and service performance. They proposed service
quality to be a function of pre-purchase customer expectations, perceived process
quality, and perceived output quality. According to Woodside et al. (1989), service
Service quality Reliability
Responsiveness
Assurance
Empathy
Tangibles
Customer satisfaction
• Customer Loyalty • Word of Mouth
11
quality is represented by answers to such questions as: is the service delivered to
customer what they expected or different from what they expected? Was the service
they received approximately what they expected or better or worse than expected? A
majority studies have sought to find the criteria that contribute to evaluate service
quality in the traditional service environment (Grönroos, 1982, 1984; Lehtinen, U.&
Lehtinen, J.R.1982).
According to Asubonteng et al. (1996), service quality is the difference between
the customer expectations for service performance prior to the service encounter and
their perceptions of the service received. Gefan (2002) defined service quality as the
subjective comparison that customers make between the quality of the service that they
want to receive and what they actually get.
The definition of service quality is based on customer-led quality definition where
quality is defined as satisfying customer’s requirements, relying on the ability of the
organization to determine customers’ requirements and then meet these requirements.
Basically, service quality in banking can be viewed from two perspectives: customer
perspective & bank perspective
Service Characteristics
The characteristics of services are often described as four unique characters:
intangibility, inseparability, heterogeneity, and perishability, which make services
different from physical products and hard to evaluate (Parasuraman, 1985). Services
said to be intangible because they can be seen, tasted, felt, heard, or smelled before
they are purchased. They are performance rather than objects (Hoffman and Bateson,
2002). It means that services are more like a process than a thing, more a performance
than a physical object, and are experienced rather than consumed Inseparability of
services refers to that services are produced and consumed simultaneously. Unlike
services, physical products are first produced, then sold and then consumed.
Heterogeneity refers to the service performance are highly variable from one service
transaction to another and one time to another since services depend on who provide
them, when and where they are provided. Finally, perishability means service can’t be
stored or saved. It can be understood as services will not exist if they are not consumed
12
at their appointed time. It also reflects that service marketers have less control for
handling supply and demand fluctuations (ibid). With highly growth of new technology,
the increased use of Internet has big impact on these four services characteristics
(ibid).
Service Quality Dimensions
Numerous studies have sought to uncover the global attributes of services that
contribute most significantly to relevant quality assessments in the traditional service
environment (Parasuraman et al., 1985, 1988); Grönroos (1982) argue that service
quality should include three dimensions: (1) The technical quality of outcome: That is
to say, the actual outcome of the service encounter. The service outcome can often
measured by the consumer in an objective manner. (2) The functional quality of the
service encounter: This element of quality is concerned with the interaction between
the provider and recipient of a service and is often perceived in a subject manner. (3)
The corporate image: This is concerned with the customers’ perception of the service
organization. The image depends on: technical and functional quality; price; external
communications; physical location; appearance of the site and the competence and
behavior of service firms’ employees.
Similarly, Lehtinen, U.& Lehtinen, J.R. (1982) also state that service quality has
three dimensions, however the differences can be seen below: (1) Physical quality. This
includes items such as the condition of buildings and enabling equipment. (2) Corporate
quality. This refers to the organization’s image and profile. (3) Interactive quality. This
derives from the interaction between service organization’s personnel and customer as
well as the interaction between customers. In addition, they argue that in examining
the determinants of quality it is necessary to differentiate between the quality
associated with the process of service delivery and the quality associated with the
outcome of the service. Comparing the work between Grönroos (1982) and Lehtinen, U.
& Lehtinen, J.R (1982), Swartz and Brown (1989) drew some distinctions concerning
the dimensions of service quality. They sated that what the service delivers is evaluated
after performance. This dimension is called technical quality by Grönroos (1983),
13
physical quality by Lehtinen, U. & Lehtinen, J.R. (1982). They also stated that how the
service is delivered is evaluated during delivery. This dimension is called functional
quality by Grönroos (1983), interactive quality by Lehtinen, U. & Lehtinen, J.R. (1982).
According to Parasuraman et al. (1985), detailed dimensions of service quality through
focus group studies are listed as: reliability, responsiveness, competence, access,
courtesy, communication, credibility, security, competence, understanding the customer
and tangibles. Among these ten service quality determinants, reliability is identified as
the most important.
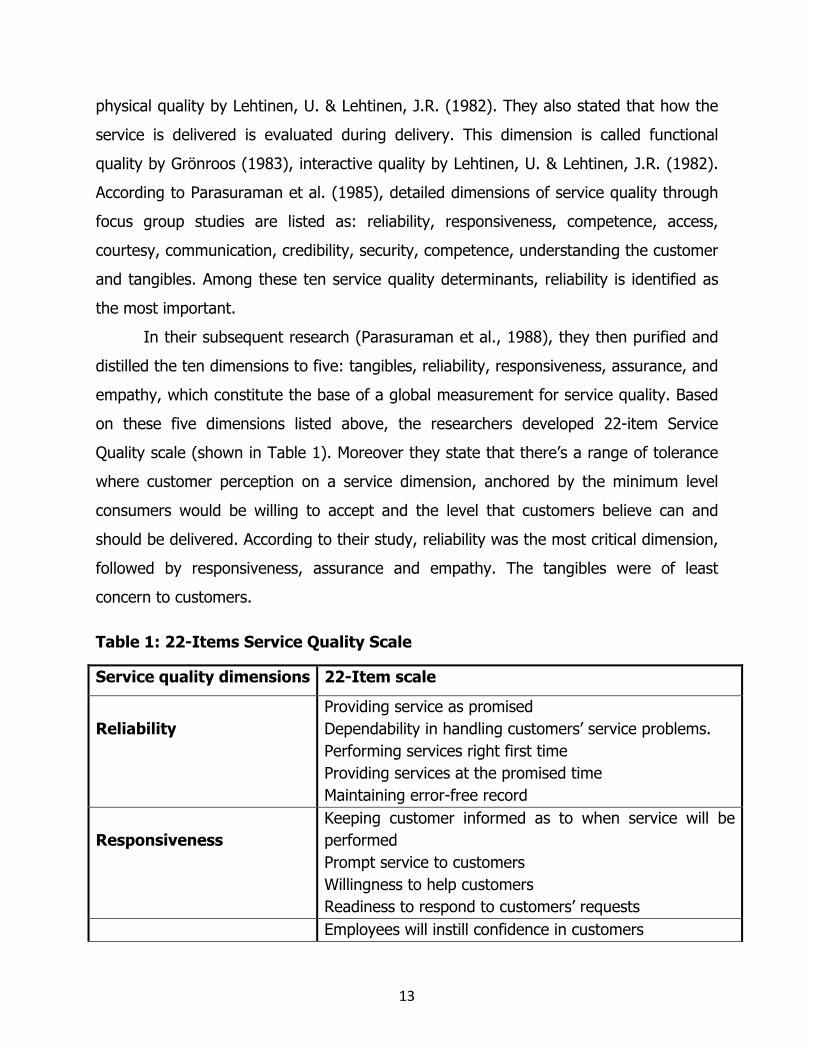
In their subsequent research (Parasuraman et al., 1988), they then purified and
distilled the ten dimensions to five: tangibles, reliability, responsiveness, assurance, and
empathy, which constitute the base of a global measurement for service quality. Based
on these five dimensions listed above, the researchers developed 22-item Service
Quality scale (shown in Table 1). Moreover they state that there’s a range of tolerance
where customer perception on a service dimension, anchored by the minimum level
consumers would be willing to accept and the level that customers believe can and
should be delivered. According to their study, reliability was the most critical dimension,
followed by responsiveness, assurance and empathy. The tangibles were of least
concern to customers.
Table 1: 22-Items Service Quality Scale
Service quality dimensions 22-Item scale
Reliability
Providing service as promised Dependability in handling customers’ service problems. Performing services right first time Providing services at the promised time Maintaining error-free record
Responsiveness
Keeping customer informed as to when service will be performed Prompt service to customers Willingness to help customers Readiness to respond to customers’ requests
Employees will instill confidence in customers
14
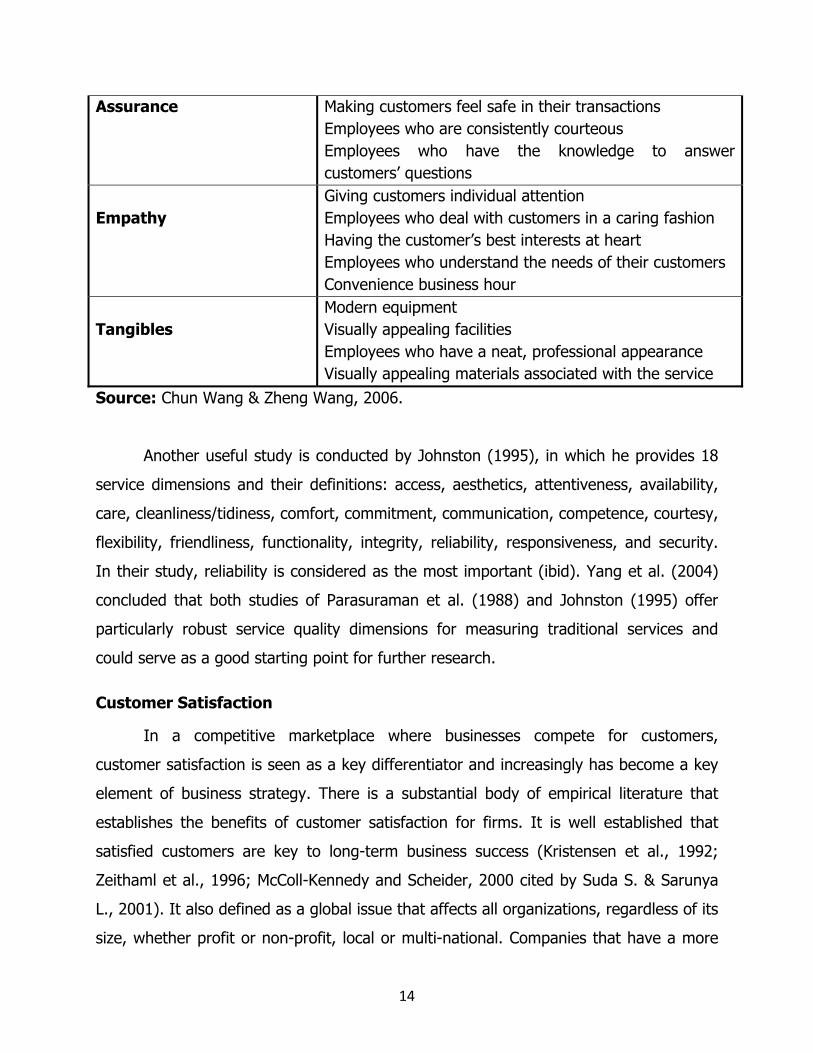
Assurance Making customers feel safe in their transactions Employees who are consistently courteous Employees who have the knowledge to answer customers’ questions
Empathy
Giving customers individual attention Employees who deal with customers in a caring fashion Having the customer’s best interests at heart Employees who understand the needs of their customers Convenience business hour
Tangibles
Modern equipment Visually appealing facilities Employees who have a neat, professional appearance Visually appealing materials associated with the service
Source: Chun Wang & Zheng Wang, 2006.
Another useful study is conducted by Johnston (1995), in which he provides 18
service dimensions and their definitions: access, aesthetics, attentiveness, availability,
care, cleanliness/tidiness, comfort, commitment, communication, competence, courtesy,
flexibility, friendliness, functionality, integrity, reliability, responsiveness, and security.
In their study, reliability is considered as the most important (ibid). Yang et al. (2004)
concluded that both studies of Parasuraman et al. (1988) and Johnston (1995) offer
particularly robust service quality dimensions for measuring traditional services and
could serve as a good starting point for further research.
Customer Satisfaction
In a competitive marketplace where businesses compete for customers,
customer satisfaction is seen as a key differentiator and increasingly has become a key
element of business strategy. There is a substantial body of empirical literature that
establishes the benefits of customer satisfaction for firms. It is well established that
satisfied customers are key to long-term business success (Kristensen et al., 1992;
Zeithaml et al., 1996; McColl-Kennedy and Scheider, 2000 cited by Suda S. & Sarunya
L., 2001). It also defined as a global issue that affects all organizations, regardless of its
size, whether profit or non-profit, local or multi-national. Companies that have a more

15
satisfied customer base also experience higher economic returns (aker and Jocobsson,
1994; Bolton, 1998; Yeung et al., 2002 cited by Suda S. & Sarunya L., 2001).
Consequently, higher customer satisfaction leads to greater customer loyalty (Yi,
1991; Anderson and Sulivan, 1993 & Boulding et al., 1993 cited by Suda S. & Sarunya
L., 2001) which in turn leads to higher future revenue (Fornell, 1992; Bolton, 1998 cited
by Suda S. & Sarunya L., 2001). For that matter, many market leaders are found to be
highly superior-customer-service orientated. They have been rewarded with high
revenue and customer retention as well.
For that matter, organizations in the same market sector are compelled to assess
the quality of the services that they provide in order to attract and retain their
customers. Apparently, many researchers conceptualize customer satisfaction as an
individual’s feeling of pleasure (or disappointment) resulting from comparing the
perceived performance or outcome in relation to the expectation (Oliver, 1981; Brandy
and Robertson, 2001; Lovelock, Patterson and Walker, 2001 cited by Suda S. & Sarunya
L., 2001). There are two general conceptualizations of satisfaction here, namely, the
transaction-specific satisfaction and the cumulative satisfaction (Boulding et al., 1993;
Jones and Suh, 2000 cited by Suda S. & Sarunya L., 2001). Transaction-specific
satisfaction is the customer’s very own valuation of his or her experience and reaction
towards a particular service encounter (Cronin and Taylor, 1992; Boshoff and Gray,
2004). This reaction is expressed by the customer who experiences a product or service
for the first time. Meanwhile, cumulative satisfaction refers to the customer’s overall
evaluation of the consumption experience to date (Johnson, Anderson and Fornell,
1995); an own accumulation of contacts with services provided them from day-to-day.
It is from this accumulation that customers establish a personal standard which is used
to gauge service quality. However, in general, it is agreed that customer satisfaction
measurement is a post-consumption assessment by the user, about the products or
services gained (Churchill and Surprenant, 1982; Yuksel and Rimmington, 1988 cited by
Suda S. & Sarunya L., 2001).

16
Service Quality and Customer Satisfaction
Customer satisfaction and service quality are inter-related. The higher the service
quality, the higher is the customer satisfaction. Many agree that in the banking sector,
there are no recognized standard scales to measure the perceived quality of a bank
service. Thus, competitive advantage through high quality service is an increasingly
important weapon to survive.
As a process in time, service quality takes place before, and leads to overall
customer satisfaction. Service quality has been found to be an important input to
customer satisfaction (Caruana & Malta 2002). Cronin and Taylor (1992) originally
hypothesized that satisfaction is an antecedent of service quality. They argued also that
service quality appears as the only one of the service factors contributing to customers’
satisfaction judgments.
Lasser et al (2000) cited by Suda S. & Sarunya L., (2001) examined the effects
of service quality on customer satisfaction in private banking sector by using two well-
known measures, the SERVQUAL and the technical/functional quality. They compared
and contrasted empirically SERVQUAL and technical/functional quality model. They tried
to compare the various dimensions of the two quality service models and their effects
on satisfaction. They mentioned that customer satisfaction is a multidimensional
construct, and that these dimensions will be differentially impacted by the various
components of service quality.
17
CHAPTER THREE
RESEARCH METHODOLOGY
Research Design
The research is descriptive and cross-sectional. The basic reason for carrying out
descriptive research is to identify the cause of something that is happening. It used
structured instrument and, specifically designed to measure the characteristics
described in the research questions using quantitative approach. Variables of interest in
a sample of subjects are examined once and the relationships between them are
determined. The quantitative analysis was used to determine the correlation between
independent and dependant variables.
Research Population
The study population was made up of customer of BPR Kigali branches who were
requesting or not requesting services at the time questionnaires were distributed. In
total they are 110,449 customers for the five branches, 59,642 are taken as
shareholders since BPR shifted from Cooperative bank to commercial bank (in January
2008). This means, 50, 807 customers are research population.
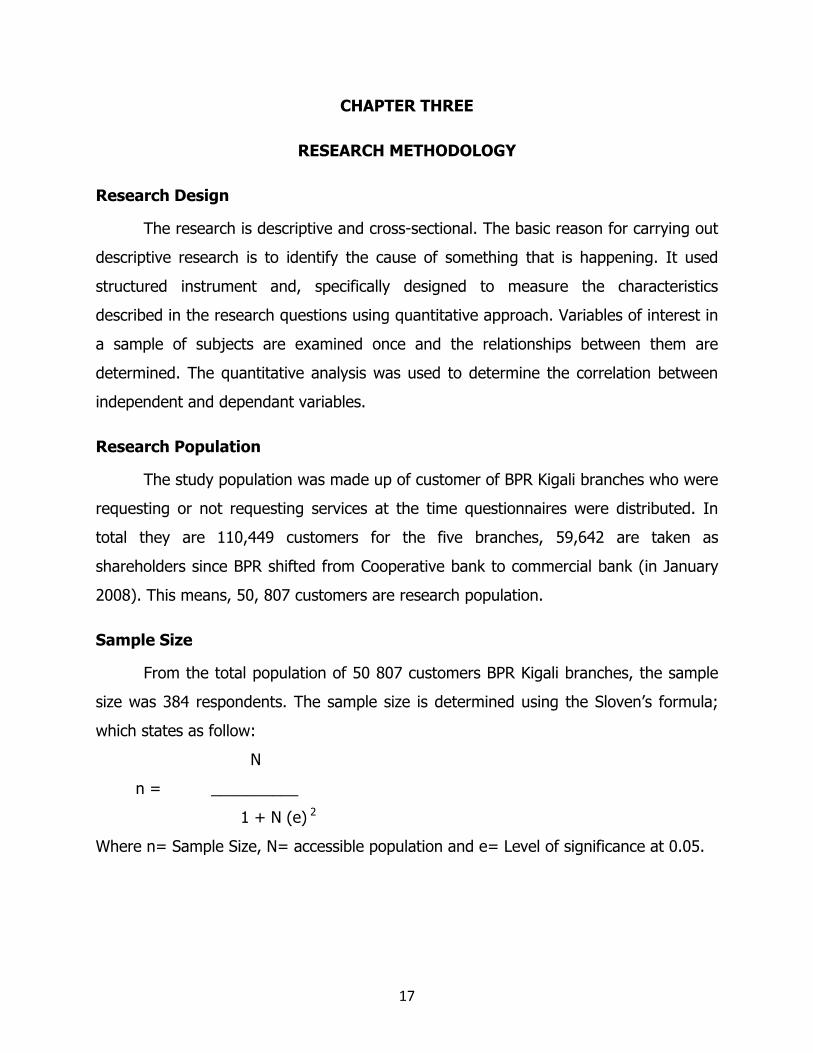
Sample Size
From the total population of 50 807 customers BPR Kigali branches, the sample
size was 384 respondents. The sample size is determined using the Sloven’s formula;
which states as follow:
N
n = __________
1 + N (e) 2
Where n= Sample Size, N= accessible population and e= Level of significance at 0.05.

18
The table below shows the population, sample size.
Table 2: Category of respondents
Branch name Population size Sample size
BPR Main Branch 8 406 61
BPR Muhima Branch 6 910 58
BPR Remera Branch 11 584 84
BPR Nyamirambo Branch 14 269 108
BPF Branch 9 638 73
Total 50,807 384
Source: BPR database, 2011
Sampling Procedure
The research used non-probability sampling technique, specifically convenience
sampling technique to collect data because it is fast, inexpensive, and easy and the
subjects are readily available. The sample of this research was made up of customers
who have been demanding service from BPR branches under study during the data
collection period. Researchers use convenience sampling not just because it is easy to
use, but because it also has other research advantages. Convenience sample is usually
used because it allows the researcher to obtain basic data and trends regarding his
study without the complications of using a randomized sample.
Research Instrument
Questionnaire technique was used for data collection of this study.
Questionnaires were distributed to respondents under the researcher supervision. All
respondents were given a questionnaire with explanation before filling in. In the
measurement of independent and dependant variables, Likert scales were used in order
to identify the respondents’ leveling on perceived banking service through statistical
techniques of correlations between dependant variable and independent variables. Total
19
number twenty –two questions on service quality and ten questions on customer
satisfaction were administered to the sample of the population on which the analysis
was based. Respondents were expected to tick the chosen appropriate answer, which
are corresponding to a given mark in likert scale starting by 1=strong disagree to
4=strong agree. There are several reasons behind the selection of this method. First, it
allows large amounts of information to be obtained at a relatively low cost. Second,
more accurate and precise responses are obtained because interviewer bias can be
avoided.
Reliability and Validity of the Instrument
In order to reduce the possibility of getting the wrong answer, attention was
paid on the reliability and validity of the questionnaire. Numbers of different steps were
taken to ensure the validity and reliability of the study: Data were collected from the
reliable sources. With meaning that respondent must be a customer of the bank under
research; questionnaire was made based on literature review to ensure the validity of
the result; questionnaire was pre-tested by experienced persons to ensure it measured
what it was supposed to; data were collected through a short period of time which is a
guarantee of no big change happened on the related topic; a pre-tested translated
questionnaire was available to make sure respondents who use local language are
involved without any problem and the whole research was carried out under supervision
of the researcher to avoid missing data.
Data Gathering Procedures
Before data gathering
Upon accomplishment of defending and acceptance of the research proposal, the
researcher obtained an introductory letter from the School of Postgraduate Studies and
Research and Evaluation of Kampala International University, seeking for permission
from the human resource management department of BPR to allow him to get access to
customers to participate in the study.

20
During data gathering
The researcher was available to give necessary explanation on some question
where need was. Then the researcher carried out a pilot study before the actual
research to check feasibility of the research instrument, in order to make necessary
improvement and adjustments in the study and to avoid wasting time. The researcher
also made use of secondary data by reviewing available relevant text books, journal
articles, periodicals, manuals dissertations, publications and visiting websites of the
concerned organization.
After data gathering
After two weeks, primary data was collected through questionnaires which
respondents returned back to the researcher which allowed the researcher to go a head
to analyze the data. Completed (SAQs) were coded, edited, categorized and entered
into a computer for the Statistical Package for Social Scientists (SPSS) for data
processing and analysis.
Data analysis
After data collection, the researcher analyzed statistically. Frequencies and
percentage distributions were used to analyze data on the respondent’s profile. Means
were used to analyze data on the level of service quality and level of customer
satisfaction. Pearson’s linear correlation coefficient was used to establish whether there
is any significant relationship between service quality and customer satisfaction in BPR.
The 0.05 level of significance was used to determine the strength of the relationship
between the independent and dependent variables.
Ethical Considerations
To ensure that ethics was practiced in this study as well as utmost confidentiality
for respondents and the data provided by them, the following was done: (i) coding of
all questionnaires; (ii) the respondent were requested to sign the informed consent; (iii)
authors mentioned in this study were acknowledged within the text; (iv) findings were
presented in a generalized manner.

21
Limitations of the Study
The anticipated threats to the validity in this study were as follows:
1. Intervening or confounding variables which were beyond the researcher’s control
such as honesty of respondents and the respondents and personal biases. To
minimize such conditions, the researcher requested respondents to be as honest
as possible and to be impartial/ unbiased when answering the questionnaires.
2. The research environments were classified as uncontrolled setting where
extraneous variables would influence on the data gathered such as comments
from other respondents, anxiety, stress, motivation on the part of the
respondents while on the process of answering the questionnaires. Although
these were beyond the researcher’s control, efforts were made to request the
respondents to be as objective as possible in answering the questionnaires.
3. Testing: It was feared that the use research assistants may render
inconsistencies such as differences in conditions and time when the data was
obtained from respondents. This was minimized by orienting and briefing the
researcher assistants on the data gathering procedures
4. Instrumentation: The research tool was non standardized hence validity and
reliability test was done to arrive at a reasonable data measuring tool.
5. Attrition: There was fear that representative sample could not be reached as
computed due to circumstances within the respondents and beyond the control
of the researcher. The researcher distributed questionnaires exceeding beyond
the minimum sample size to avoid this situation.

22
CHAPTER FOUR
PRESENTATION, ANALYSIS AND INTERPRETATION OF DATA
Respondent’s profile
In this study, the researcher described respondents profile in terms of gender,
type of account, and experience with the bank. Respondents were asked to state their
characteristics for purposes of classifying and comparing them thereafter. The study
employed a closed ended questionnaire to categorize respondent’s profiles and their
responses were analyzed using frequencies and percentage distributions as shown in
the following table.
Table 3: Description of respondent’s profile
Gender Frequency Percent
Male 171 44.6
Female 213 55.4
Total 384 100.0
Type of Account
Current 308 80.1
Saving 76 19.9
Total 384 100.0
Level of Education
A-level 96 25.1
Diploma 68 17.7
Undergraduate 45 11.8
Postgraduate 25 6.4
Others 150 39.0
Total 384 100.0
Experience with the Bank
Below 1year 80 20.7
1 - 2years 45 11.8
3 - 4years 136 35.3

23
5 - 6years 24 6.2
Over six years 99 25.9
Total 384 100.0 Source: Primary Data, 2011
The results in table 3 show that female were the majority respondents as
represented by 213(or 55.4%) and male were the minority 171(or 44.6%). The findings
revealed that there is big gender imbalance in the Bank.
In regard to type of accounts held, 308(or 80.1%) respondents had current
accounts where as only 76(or 19.9%) had saving accounts. The study therefore
indicates that majority of the Bank customers prefer current accounts.
Concerning the education qualification, over half of the respondents had no
professional qualification. This revealed by respondents with Diploma, Degree and
postgraduate qualifications being 68 (or 17.7%), 45 (or 11.8%) and 25 (or 6.4%)
customers respectively. Respondents in the category of others who included among
others customers with without any academic qualification and those with some
certificates of attendance dominated the study with 194 (or 39.0%), followed by
respondents with A-level qualification at 96 (or 25.1%). These results indicate that
majority of Bank customers are semi-illiterate.
Lastly in regard to experience with the Bank 136 (or 35.3%) respondents have
been customers for this bank for a period ranging between 3 – 4 years, 99 (or 25.9%)
respondents had Banked with BPR for a period of over 6years, 80 (or 20.74%)
respondents had banked for with BPR for less than a year, and 24 (or 6.2%) have been
customer for a period ranging between 5 – 6 years. This indicates that majority of the
respondents had Knowledge and experience about the bank since they had been BPR
customers for relatively long period of time that is 3years and above.
Level of service quality
The second objective was set to determine the level service quality in BPR
services. In this study, service quality was measured using 22 quantitative questions in
which respondents were required to indicate the extent to which they agree or disagree

24
with each statement by indicating the number that best describe their perceptions. All
the twenty two items on service quality were likert scaled using four points ranging
between 1= Strongly Disagree, 2= Disagree, 3= Agree and 4= Strongly Agree. Their
responses were analyzed and described using Means as summarized in table 3 below.
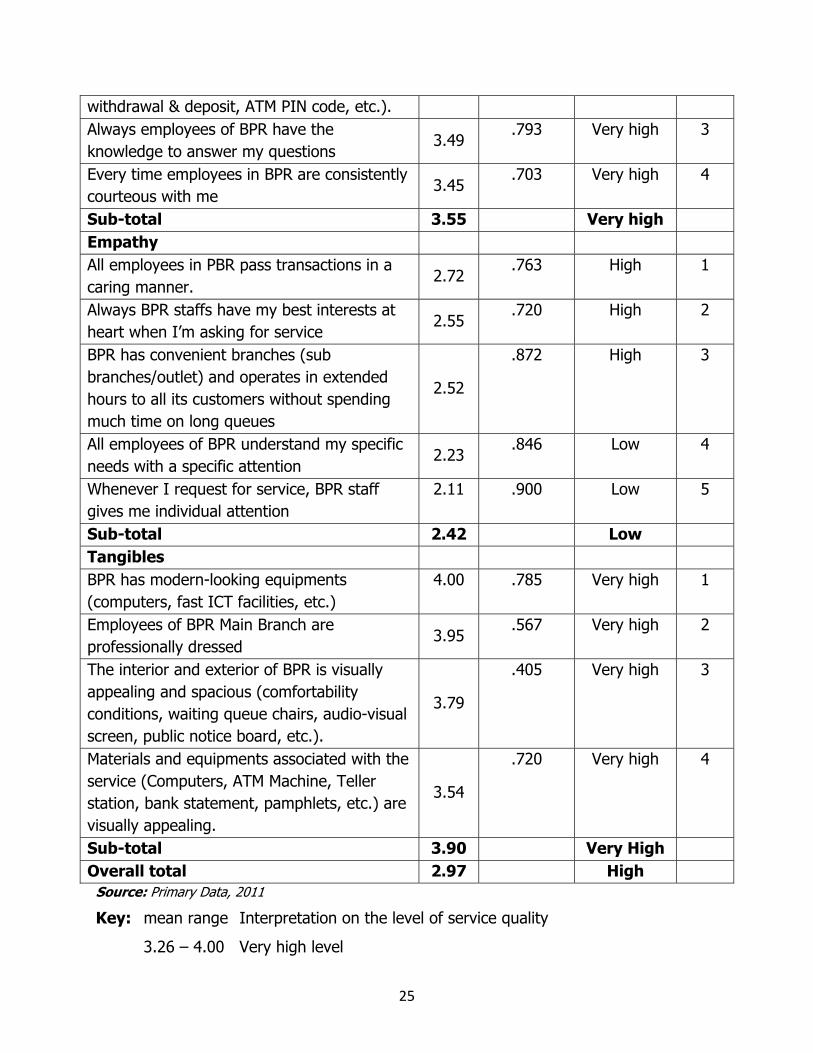
Table 4: Description of the level of service quality
Reliability Mean Std. Deviation
Interpretation
Rank
Whenever I request for banking service BPR Provides it at the promised time
2.80 .562 High 1
Whenever I request for banking service BPR Performs it right first time
2.78 .908 High 2
Whenever I request for service (cash deposit, cash withdrawal, bank statement, etc.), BPR staff provide it as promised
2.44 .613 Low 3
Always BPR maintains on error-free records service
2.42 .946 Low 4
Whenever I experience problem, BPR staffs handle it in constant manner
2.41 .877 Low 5
Sub-total 2.57 High Responsiveness Whenever I need service BPR staffs give me prompt service
2.65 .845 High 1
Whenever I ask for service BPR staffs serve me readily in a good manner.
2.50 .508 Low 2
Always BPR staffs are willing to solve customer problems
2.33 .771 Low 3
Always BPR Keeps me informed as to when service will be performed
2.19 .653 Low 4
Sub-total 2.42 Low Assurance The behavior of all employees in BPR instills confidence in me when handling their problems.
3.63 .484 Very high 1
I always feel safe in my transactions with BPR (account maintenance, cash transfer, cash
3.62 .485 Very high 2
25
withdrawal & deposit, ATM PIN code, etc.). Always employees of BPR have the knowledge to answer my questions
3.49 .793 Very high 3
Every time employees in BPR are consistently courteous with me
3.45 .703 Very high 4
Sub-total 3.55 Very high Empathy All employees in PBR pass transactions in a caring manner.
2.72 .763 High 1
Always BPR staffs have my best interests at heart when I’m asking for service
2.55 .720 High 2
BPR has convenient branches (sub branches/outlet) and operates in extended hours to all its customers without spending much time on long queues
2.52
.872 High 3
All employees of BPR understand my specific needs with a specific attention
2.23 .846 Low 4
Whenever I request for service, BPR staff gives me individual attention
2.11 .900 Low 5
Sub-total 2.42 Low Tangibles BPR has modern-looking equipments (computers, fast ICT facilities, etc.)
4.00 .785 Very high 1
Employees of BPR Main Branch are professionally dressed
3.95 .567 Very high 2
The interior and exterior of BPR is visually appealing and spacious (comfortability conditions, waiting queue chairs, audio-visual screen, public notice board, etc.).
3.79
.405 Very high 3
Materials and equipments associated with the service (Computers, ATM Machine, Teller station, bank statement, pamphlets, etc.) are visually appealing.
3.54
.720 Very high 4
Sub-total 3.90 Very High Overall total 2.97 High
Source: Primary Data, 2011
Key: mean range Interpretation on the level of service quality
3.26 – 4.00 Very high level
26
2.51 – 3.25 High level
1.76 – 2.50 Low level
1.00 – 1.75 Very low level
Table 4 reveals service quality in BPR exists at different levels. For instance the
findings portray two dimensions with the highest (very high) level of service quality;
tangibles and assurance at (mean=3.90 and 3.55 respectively); and all these are
equivalent to Strongly Agree on the likert scale. Secondly service quality which
corresponds with the agree item in the likert scale was reliability at (mean=2.57).
However, on the other hand, results show a low level of service quality coming from
empathy and responsiveness with means (means=2.423 and 2.419 respectively) which
are all equivalent to disagree on the likert scale.
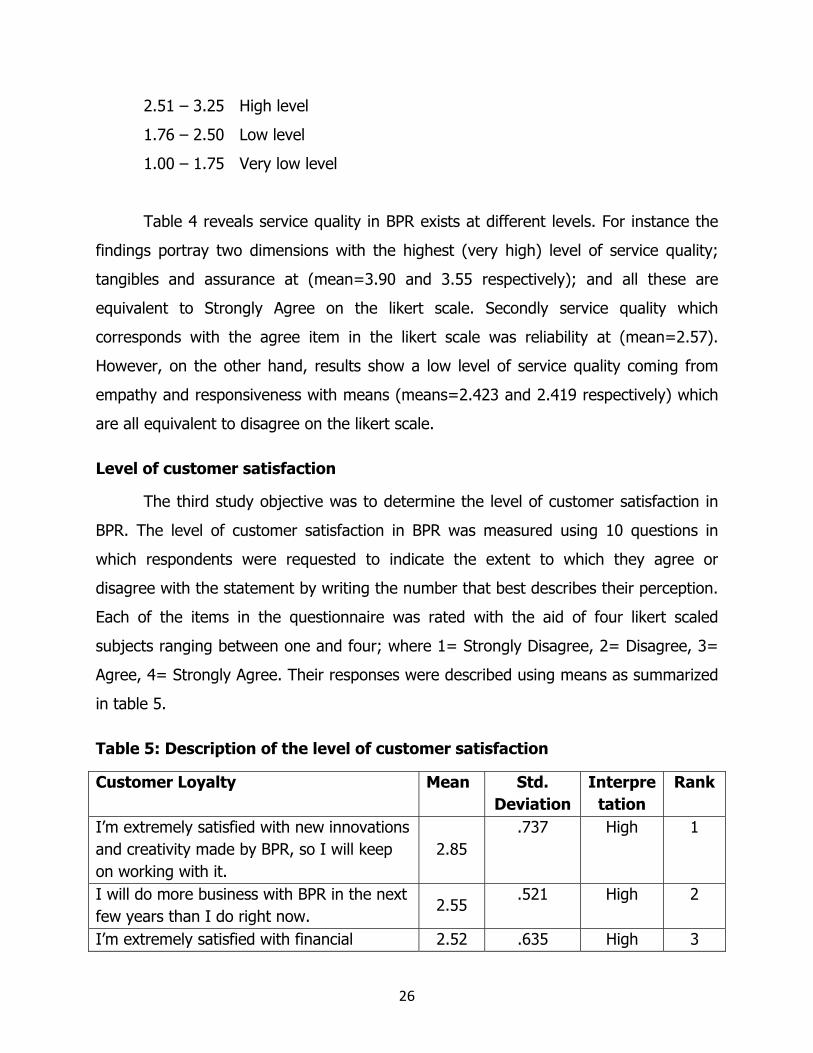
Level of customer satisfaction
The third study objective was to determine the level of customer satisfaction in
BPR. The level of customer satisfaction in BPR was measured using 10 questions in
which respondents were requested to indicate the extent to which they agree or
disagree with the statement by writing the number that best describes their perception.
Each of the items in the questionnaire was rated with the aid of four likert scaled
subjects ranging between one and four; where 1= Strongly Disagree, 2= Disagree, 3=
Agree, 4= Strongly Agree. Their responses were described using means as summarized
in table 5.
Table 5: Description of the level of customer satisfaction
Customer Loyalty Mean Std. Deviation
Interpretation
Rank
I’m extremely satisfied with new innovations and creativity made by BPR, so I will keep on working with it.
2.85 .737 High 1
I will do more business with BPR in the next few years than I do right now.
2.55 .521 High 2
I’m extremely satisfied with financial 2.52 .635 High 3
27
services rendered by BPR, therefore I will stick with. I consider myself to be loyal to BPR because it is usually a very satisfying experience.
2.42 .505 Low 4
BPR does good job of satisfying my needs and all things being equal, I really intend to continue using it in the future
2.41 .500 Low 5
Sub-total 2.55 High Positive Word of Mouth I say positive things about BPR to my friends, relatives, associates, etc.
2.92 .657 High 1
I encourage friends and colleagues to do business with BPR
2.74 .448 High 2
I always talk about good financial services offered BPR to others quite frequently
2.71 .652 High 3
I’m proud to say to others that I’m BPR’s customer
2.50 .500 Low 4
I will recommend my friends, relatives, associates, etc to open in an account and do business with BPR
2.36 .481 Low 5
Sub-total 2.65 High Overall total 2.58 High Source: Primary Data, 2011
Key: mean range Interpretation on the level of service quality
3.26 – 4.00 Very high level
2.51 – 3.25 High level
1.76 – 2.50 Low level
1.00 – 1.75 Very low levels
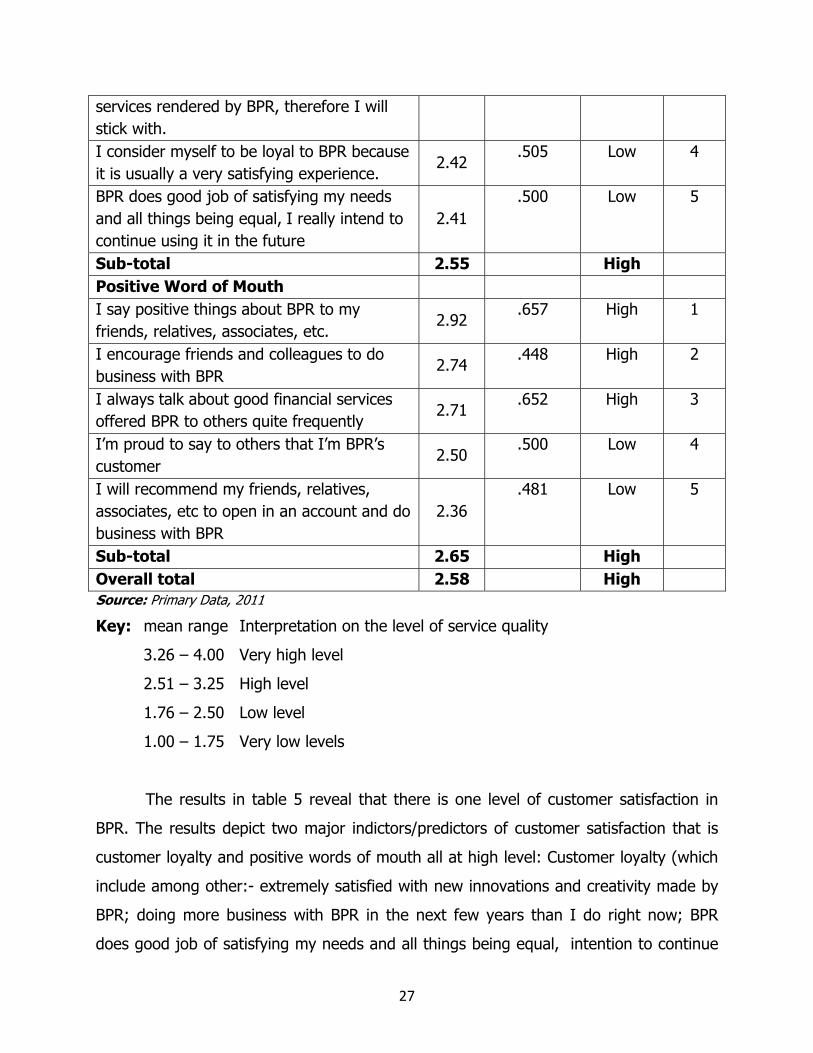
The results in table 5 reveal that there is one level of customer satisfaction in
BPR. The results depict two major indictors/predictors of customer satisfaction that is
customer loyalty and positive words of mouth all at high level: Customer loyalty (which
include among other:- extremely satisfied with new innovations and creativity made by
BPR; doing more business with BPR in the next few years than I do right now; BPR
does good job of satisfying my needs and all things being equal, intention to continue

28
the bank in future; considering myself to be loyal to BPR ; being satisfied with financial
services rendered by BPR) and positive word of mouth (including saying positive things
about BPR to my friends, relatives; encouraging friends and colleagues to do business
with BPR; talking about good financial services offered BPR to others quite frequently;
being proud to say to others that I’m BPR’s customer; recommending friends, relatives,
associates, etc to open accounts and do business with BPR) at (mean=2.55 and 2.65
respectively) which are all equivalent to agree on the likert scale.
Relationship between service quality and customer satisfaction
The fourth objective of this study was to determine if there is a significant
relationship between service quality and customer satisfaction in BPR, for which it was
hypothesized that “there is no significant relationship between service quality and
customer satisfaction in BPR” To test this null hypothesis, and to get an overall picture
of the relationship, the researcher combined all the mean perceptions computed in
table 3 and 4 above, and two mean indices were computed and generated (service
quality and customer satisfaction) after which the two indices were correlated using the
Pearson’s linear correlation coefficient(PLCC, or r). Results of this test are indicated in
table 6 below.
Table 6: Correlation results between service quality and customer
satisfaction
Variables correlated R-
value
Sig-value Interpretation Decision on Ho
Customer loyalty Vs
Reliability
.124 .006 Significant
relationship
Reject
Customer loyalty Vs
Responsiveness
.095 .033 Significant
relationship
Reject
Customer loyalty Vs
Assurance
.147 .001 Significant
relationship
Reject
29
Customer loyalty Vs
Empathy
-.014 .759 Negative and
insignificant
relationship
Accept
Customer loyalty Vs
Tangibles
-.018 .685 Negative and
insignificant
relationship
Accept
Positive word of mouth
Vs Reliability
.038 .396 No significant
relationship
Accept
Positive word of mouth
Vs Responsiveness
.082 .066 No significant
relationship
Accept
Positive word of mouth
Vs Tangibles
.044 .325 No significant
relationship
Accept
Positive word of mouth
Vs Empathy
.027 .549 No significant
relationship
Accept
Positive word of mouth
Vs Assurance
.015 .740 No significant
relationship
Accept
Source: Primary Data, 2011
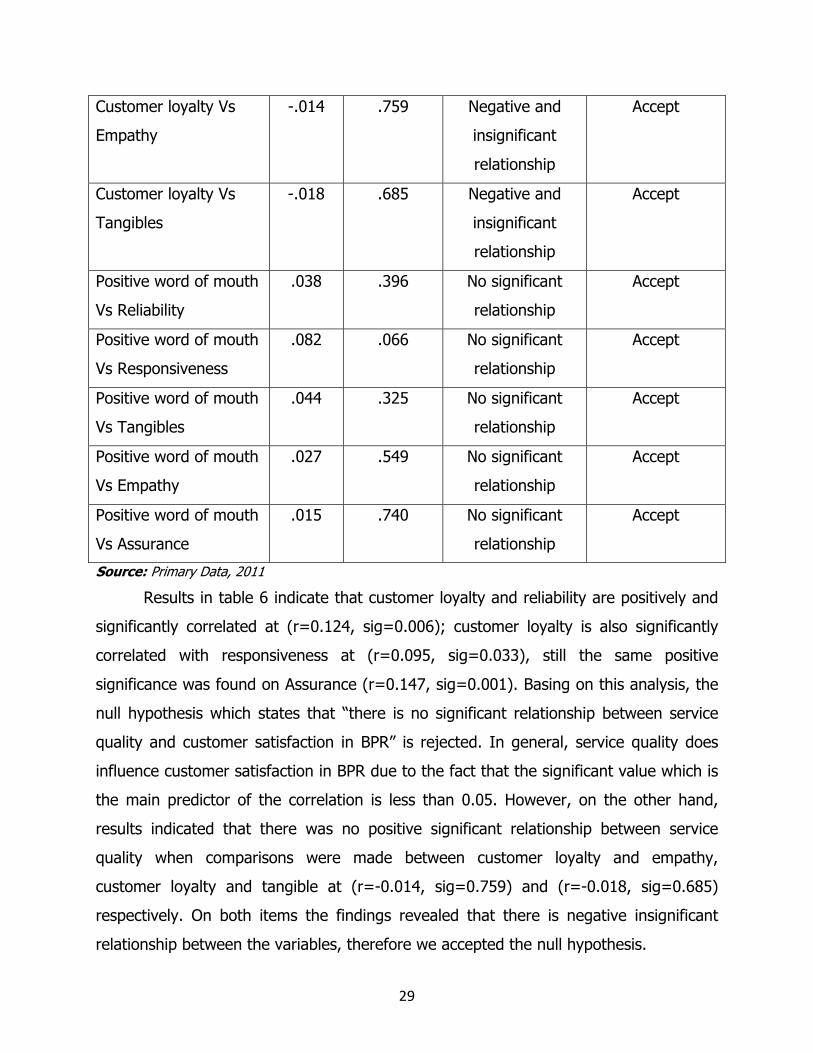
Results in table 6 indicate that customer loyalty and reliability are positively and
significantly correlated at (r=0.124, sig=0.006); customer loyalty is also significantly
correlated with responsiveness at (r=0.095, sig=0.033), still the same positive
significance was found on Assurance (r=0.147, sig=0.001). Basing on this analysis, the
null hypothesis which states that “there is no significant relationship between service
quality and customer satisfaction in BPR” is rejected. In general, service quality does
influence customer satisfaction in BPR due to the fact that the significant value which is
the main predictor of the correlation is less than 0.05. However, on the other hand,
results indicated that there was no positive significant relationship between service
quality when comparisons were made between customer loyalty and empathy,
customer loyalty and tangible at (r=-0.014, sig=0.759) and (r=-0.018, sig=0.685)
respectively. On both items the findings revealed that there is negative insignificant
relationship between the variables, therefore we accepted the null hypothesis.
30
On measuring the degree of significance between service quality and customer
satisfaction using reliability, responsiveness, assurance, empathy and tangibles under
service quality while using positive word of mouth on the side of customer satisfaction,
the study revealed the following results: positive words of mouth are not significantly
correlated to Reliability, Assurance, tangibles, empathy and responsiveness at (r=0.038,
sig=0.396 ), (r=0.082, sig=0.066), (r=0.044, sig=0.325), (r=0.027, sig=0.549) and
(r=0.740, sig=0.015) respectively. Therefore basing on the above analysis, the null
hypothesis that “there is no significant relationship between service quality and
customer satisfaction in BPR” is accepted. To sum it all, service quality does not
significantly correlate with customer satisfaction in BPR due to the fact that the
significant value which is the main predictor of the correlation is greater than 0.05
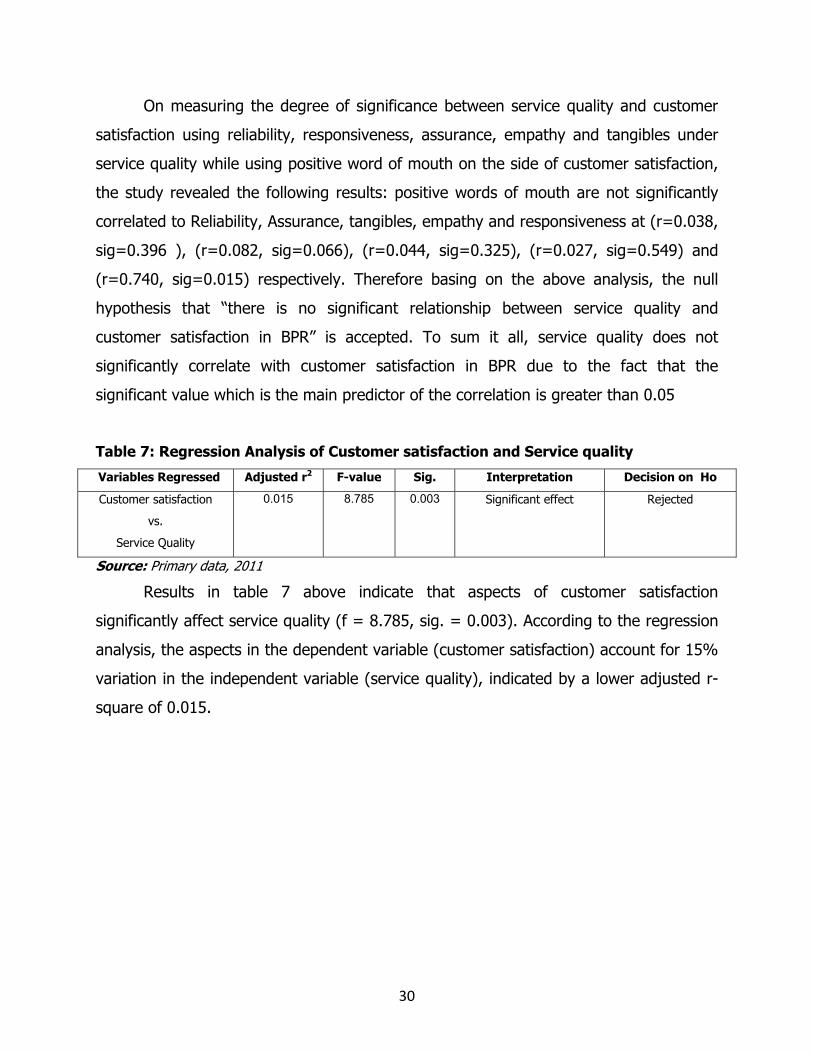
Table 7: Regression Analysis of Customer satisfaction and Service quality
Variables Regressed Adjusted r2 F-value Sig. Interpretation Decision on Ho
Customer satisfaction
vs.
Service Quality
0.015 8.785 0.003 Significant effect Rejected
Source: Primary data, 2011
Results in table 7 above indicate that aspects of customer satisfaction
significantly affect service quality (f = 8.785, sig. = 0.003). According to the regression
analysis, the aspects in the dependent variable (customer satisfaction) account for 15%
variation in the independent variable (service quality), indicated by a lower adjusted r-
square of 0.015.

31
CHAPTER FIVE
FINDINGS, CONCLUSIONS AND RECOMMENDATION
Findings
The study on service quality and customer satisfaction in BPR – Kigali branches
was guided by five study objectives that were: (a) to determine the respondents profile
in terms of gender, type of account, educational qualification, and customer’s banking
experience with BPR, (b) to determine the level of service quality in BPR, (c) to
determine the level of customer satisfaction among BPR customers, (d) to determine
the relationship between service quality and customer satisfaction in BPR and lastly (e)
to recommend strategies enhance customer satisfaction basing on the findings of the
study.
Data analysis using SPSS’s descriptive statistics showing means on respondents
profile, showed that majority of the respondents were female, over three equators with
current type of account, over half of the respondents had no professional and majority
of the respondents had been customers for BPR for relatively a long period of time that
is from three years and above.
Data analysis using SPSS’s descriptive statistics showing means revealed that the
level of service quality in BPR stands at mean ≈3 (high level). In general the level of
service quality range from moderate to high; similarly the study went ahead to reveal
through the mean that customer satisfaction was at ≈3 (high level).
Concerning the analysis of relationship between the study variable, findings from
the Pearson linear correlation coefficient show a significant and positive relationship
between service quality and customer satisfaction while comparing dimension like using
customer loyalty with reliability, responsiveness and assurance at (r=0.124, sig=0.006;
r=0.095, sig=0.033 and r=0.147, sig=0.001) respectively. Looking at the relationship
between service quality and customer satisfaction while comparing the positive word of
mouth with service quality sub-variables like Reliability, Assurance, tangibles, empathy
and responsiveness, the study findings revealed that there was no significant

32
relationship between the variables at (r=0.038, sig=0.396), (r=0.082, sig=0.066),
(r=0.044, sig=0.325), (r=0.027, sig=0.549) and (r=0.015, sig=0.740) respectively.
Conclusion
In this subsection, the researcher makes conclusion of the study findings in
relation to the study objectives set in chapter one.
Level of service quality in BPR
The first objective was to determine the level of service quality in BPR for which
it was hypothesized that service quality at BPR was low. Basing on the findings of the
study, the null hypothesis is rejected leading to a conclusion that service quality is high
in BPR.
Level of customer satisfaction among BPR customers
The second study objective was to determine the level of customer satisfaction
among BPR customers for it was hypothesized that the level of customer satisfaction
low. Basing on the study findings, the null hypothesis is rejected hence concluding that
customer satisfaction among BPR customers is high.
Relationship between service quality and customer satisfaction in BPR
The third study objective was to determine if there is a significant relationship
between service quality and customer satisfaction; and it was assumed that there is no
significant relationship between service quality and customer satisfaction in BPR. The
null hypothesis was accepted hence concluding that there is no significant relationship
between service quality and customer satisfaction in BPR.
Strategies to enhance customer satisfaction in BPR
The last study objective was to recommend strategies that will enhance
customer satisfaction basing on the findings of the study. Basing on the study findings,
if BPR to improve on service it offers to her customers to ensure their satisfaction, BPR
staff should: (a) maintains on error-free records service, (b) handle customer problems
in constant manner, (c) be willing to solve customer problems promptly and (d)
understand specific needs of individual customers.
33
Recommendations
This section tackles the recommendations obtained from the study findings and
conclusion. These recommendations are presented basing on the research objectives
and relevant hypotheses
According to the study findings, the researcher would recommend BPR to
improve the quality of its service in order to increase the level of customer satisfaction
by (1) increasing employees’ ability to handle customers’ complaint and customers’
problems in consistency manner; (3); BPR management should consistently be updated
where service has failed and look for a solution without delay, especially where more
staff are needed due to great number of customers to avoid long waiting lines.
Based on researcher personal observation, more trained staffs in charge of
handling customers’ problems are needed so that to solve problems of long waiting
lines. This is identifiable in most of branches in Kigali, especially at main branch, where
many customers’ complaints are addressed to one staff, and sometimes he or she may
be bored by much work and hence lower motivation to solve problems in good manner.
This will affect absolutely customers’ feeling by lowering their appreciation toward BPR
service quality and then bring them to dissatisfaction. Remember that it’s not always
easy to bring satisfaction where it has failed before as it’s a matter of feelings.
Areas for further research
Basing on the fact that this study was conducted or focused only on BPR Kigali
Branches, the same study should be replicated in other branches of the bank to test its
validity since Kigali branches are not even a half of the branches.
34
REFERENCES
Asubonteng, P., McCleary, K.J. and Swan, J.E. (1996). "SERVQUAL revisited: a critical
review of service quality", Journal of Services Marketing, Vol. 10, No. 6,
pp. 62-81.
Caruana & Malta (2002). Service loyalty-the effects of service quality and the mediating
role of customer satisfaction”, European Journal of Marketing, Vol.36,
No7/8, 2002, pp.811-828.
Chun Wang & Zheng Wang, (2006). Impact of internet on service quality in the banking
sector, Unpublished Master thesis, Lulea University,
Cronin J. J., Jr., & Taylor, S. A. (1992). Measuring service quality: A reexamination and
extension. Journal of Marketing, 56, 55-68.Teas, 1993).
Gefan, (2002). “Customer loyalty in e-commerce”, Journal of Information Systems,3,
27-51.
Gröroos, C. (1982). Strategic Management and Marketing in the Service Sector,
Marketing Science, Cambridge, MA.
Harrison-Walker, L. J. (2001). The measurement of word of mouth communicatioh and
an investigation of service quality and customer commitment as potential
antecedents, Journal of Service Research, 4(1), 60-75.
Hoffman, K. D. and Bateson, J.E.G. (2002). Essentials of Services Marketing: Concepts,
Strategies, and Cases, 2 nd Ed, Harcourt College Publishers.

35
(IPAR) Institute of Policy Analysis and Research – Rwanda, (July 2009). Poor customer
service and its impact on the Rwandan Economy.
Johnston, R. (1995). ‘The determinants of service quality: satisfiers and dissatisfiers’,
International Journal of Service Industry Management, Vol. 6, No. 5, pp.
53-71
Kang, G. and James, J. (2004). ‘Service quality dimensions: an examination of
Gronroos’s service quality model’, Managing Service Quality, Vol. 14, No.
4, pp. 266-277.
Lehtinen, U.& Lehtinen, J.R, (1982). Service quality – a study of dimension, unpublished
working paper, Service Management Institute, Helsinki, 439-60.
Morgan, R.M. and Hunt, S.D. (1995), “The commitment-trust theory of relationship
marketing”, Journal of Marketing, Vol. 58, July, pp. 20-38.
Parasuraman. A., Berry L. and Zeithmal V.,(1985). “A Conceptual Model of SQ and Its
Implications for Future Research”, Journal of Marketing. 49(3). pp. 41-50.
Parasuraman. A., Berry L. and Zeithmal V.,(1988), “SERVQUAL: A Multi-item Scale for
Measuring Consumer Perceptions of SQ”, Journal of Retailing, 64(2). pp.
12-40.
Reynold, E. K., & Beatty, E.S.(1999). Customer benefits and company consequences of
customer-salesperson relationships in retailing, Journal of Retailing, 75(1),
11-32.

36
Spreng and Machoy, (1996), An Empirical Examination of a Model of perceived service
quality and satisfaction, Journal of Retailing, Summer 96.Vol 72, Issue 2,
p. 201.
Suda S. & Sarunya L.(2001). An Investigation of the Relationship among Service
Quality, Customer Satisfaction, Customer Loyalty and Word of Mouth
Communication in a Retail Store, Graduate School of Commerce, Burapha
University.
Swartz and Brown (1989), consumer and provider expectations and experience in
evaluating professional service quality”, Journal of Health Care Marketing,
Vol.10, No.4.
Yang, M. Jun, and R.T. Peterson (2004), “Measuring customer perceived online service
quality: scale development and managerial implications”, International
Journal of Operations & Production Management, Vol. 24 No. 11, pp.
1149-1174.
Yi, Y. (1990). A critical review of consumer satisfaction. In V. Zeithaml (Ed.), Review of
marketing (pp. 68–123). Chicago: American Marketing Association.
Xu, Gang. “Estimating Sample Size for a Descriptive Study in Quantitative Research .”
Quirk’s Marketing Research Review, June 1999.
37
APPENDICES
APPENDIX A: TRANSMITTAL LETTER
38
APPENDIX B: APPROVAL LETTER FROM BPR
39
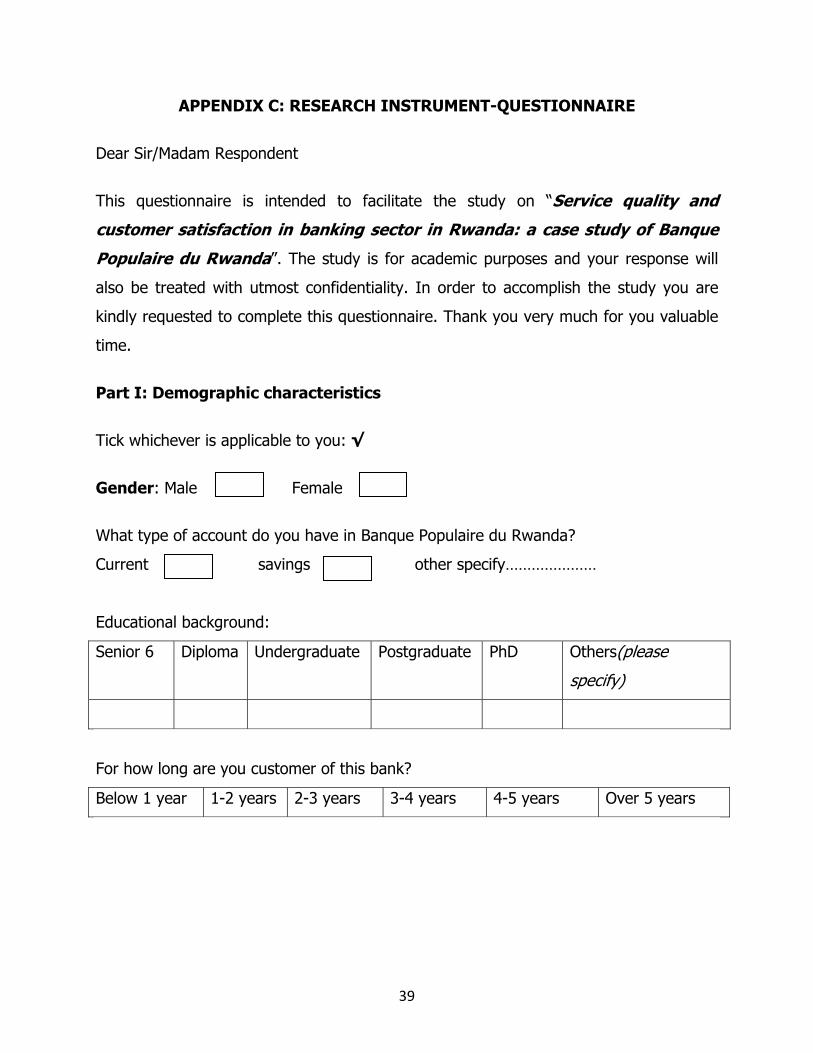
APPENDIX C: RESEARCH INSTRUMENT-QUESTIONNAIRE
Dear Sir/Madam Respondent
This questionnaire is intended to facilitate the study on “Service quality and
customer satisfaction in banking sector in Rwanda: a case study of Banque
Populaire du Rwanda”. The study is for academic purposes and your response will
also be treated with utmost confidentiality. In order to accomplish the study you are
kindly requested to complete this questionnaire. Thank you very much for you valuable
time.
Part I: Demographic characteristics
Tick whichever is applicable to you: √
Gender: Male Female
What type of account do you have in Banque Populaire du Rwanda?
Current savings other specify…………………
Educational background:
Senior 6 Diploma Undergraduate Postgraduate PhD Others(please
specify)
For how long are you customer of this bank?
Below 1 year 1-2 years 2-3 years 3-4 years 4-5 years Over 5 years

40
Part II: Service Quality
Please indicate the extent to which to agree or disagree by ticking on only one number
option for each of the items or statement on the table below:
Strongly disagree Disagree Agree Strongly agree
1 2 3 4
Please tick the most appropriate box: √
1 2 3 4 Independent Variables Reliability 1 Whenever I request for service (cash deposit, cash
withdrawal, bank statement, etc.), BPR staff provide it as promised.
2 Whenever I experience problem, BPR staffs handle it in constant manner.
3 Whenever I request for banking service BPR Performs it right first time
4 Whenever I request for banking service BPR Provides it at the promised time.
5 Always BPR maintains on error-free records service. Responsiveness 6 Always BPR Keeps me informed as to when service will be
performed.
7 Whenever I need service BPR staffs give me prompt service. 8 Always BPR staffs are willing to solve customer problems. 9 Whenever I ask for service BPR staffs serve me readily in a
good manner.
Assurance 10 The behavior of all employees in BPR instills confidence in
me when handling their problems.
11 I always feel safe in my transactions with BPR (account maintenance, cash transfer, cash withdrawal & deposit, ATM card PIN, etc.).
12 Every time employees in BPR are consistently courteous with me.

41
13 Always employees of BPR have the knowledge to answer my questions.
Empathy 14 Whenever I’m request for service, BPR staff gives me
individual attention.
15 All employees in PBR pass transactions in a caring manner. 16 Always BPR staffs have my best interests at heart when I’m
asking for service.
17 All employees of BPR understand my specific needs with a specific attention.
18 BPR has convenient branches (sub branches/outlet) and operates in extended hours to all its customers without spending much time on long queues.
Tangibles 19 BPR has modern-looking equipments (computers, fast ICT
facilities, etc.)
20 The interior and exterior of BPR is visually appealing and spacious (comfortability conditions, waiting queue chairs, audio-visual screen, public notice board, etc.).
21 Employees of BPR Main Branch are professionally dressed. 22 Materials and equipments associated with the service
(Computers, ATM Machine, Teller station, bank statement, pamphlets, etc.) are visually appealing.
42
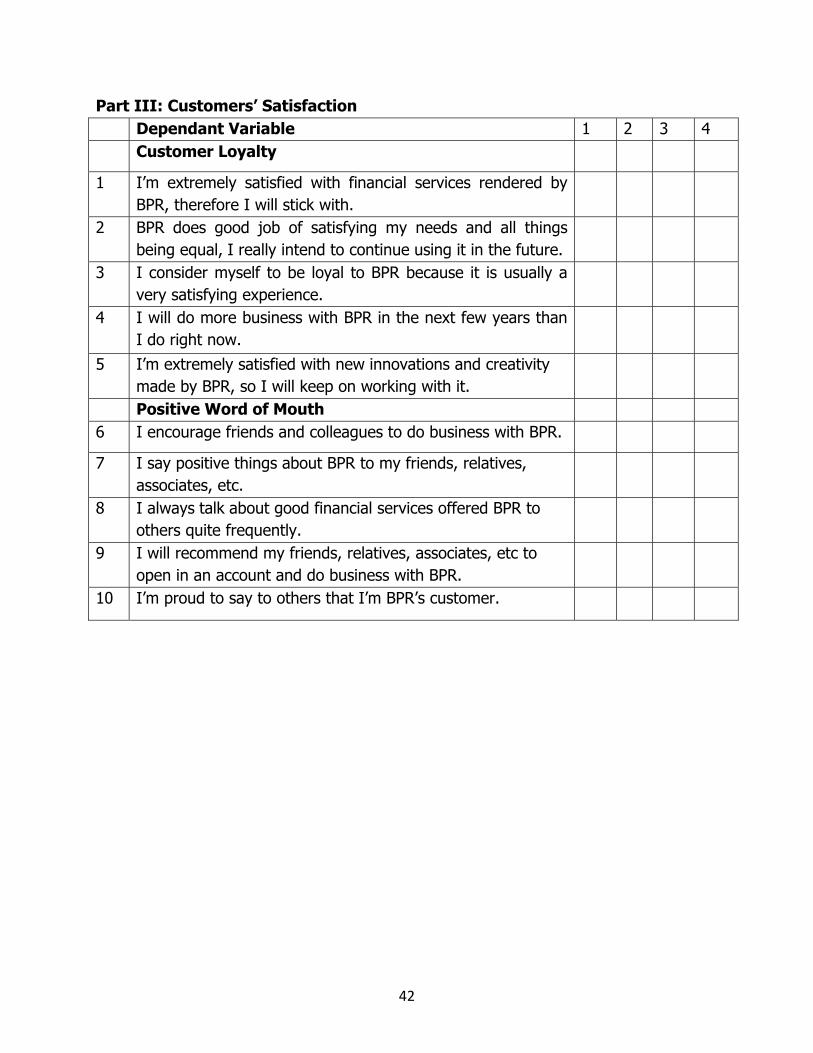
Part III: Customers’ Satisfaction Dependant Variable 1 2 3 4 Customer Loyalty
1 I’m extremely satisfied with financial services rendered by BPR, therefore I will stick with.
2 BPR does good job of satisfying my needs and all things being equal, I really intend to continue using it in the future.
3 I consider myself to be loyal to BPR because it is usually a very satisfying experience.
4 I will do more business with BPR in the next few years than I do right now.
5 I’m extremely satisfied with new innovations and creativity made by BPR, so I will keep on working with it.
Positive Word of Mouth 6 I encourage friends and colleagues to do business with BPR.
7 I say positive things about BPR to my friends, relatives, associates, etc.
8 I always talk about good financial services offered BPR to others quite frequently.
9 I will recommend my friends, relatives, associates, etc to open in an account and do business with BPR.
10 I’m proud to say to others that I’m BPR’s customer.
43
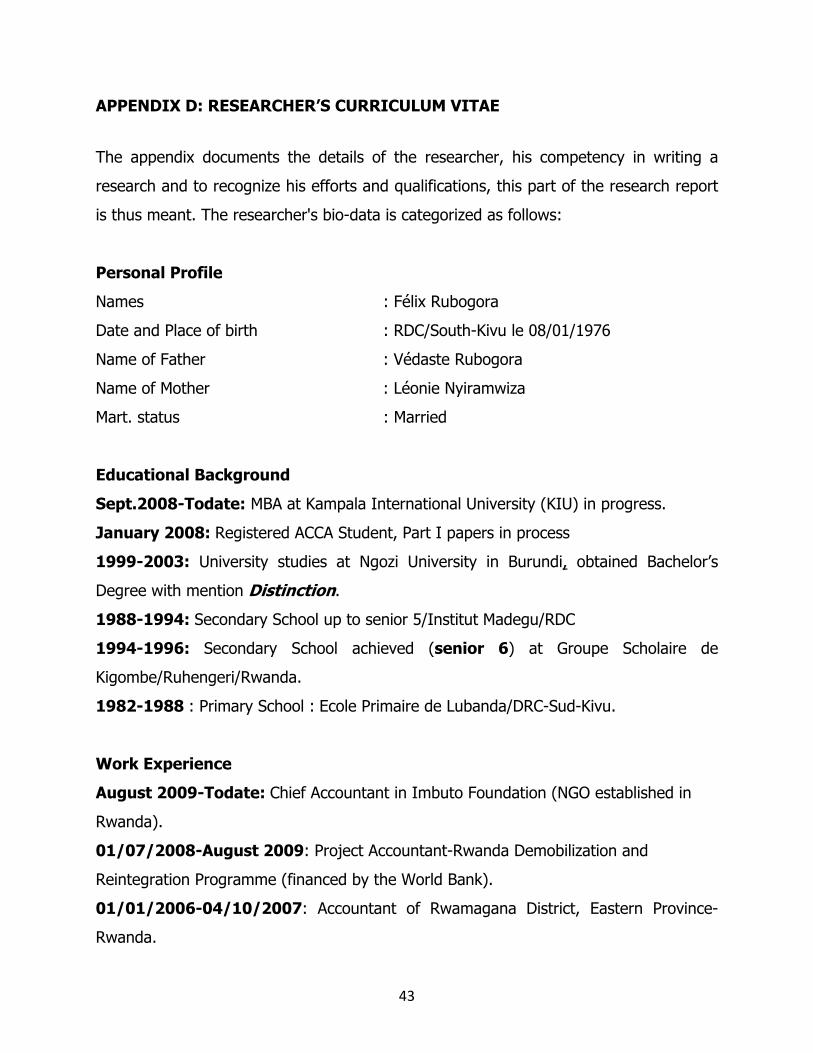
APPENDIX D: RESEARCHER’S CURRICULUM VITAE
The appendix documents the details of the researcher, his competency in writing a
research and to recognize his efforts and qualifications, this part of the research report
is thus meant. The researcher's bio-data is categorized as follows:
Personal Profile
Names : Félix Rubogora
Date and Place of birth : RDC/South-Kivu le 08/01/1976
Name of Father : Védaste Rubogora
Name of Mother : Léonie Nyiramwiza
Mart. status : Married
Educational Background
Sept.2008-Todate: MBA at Kampala International University (KIU) in progress.
January 2008: Registered ACCA Student, Part I papers in process
1999-2003: University studies at Ngozi University in Burundi, obtained Bachelor’s
Degree with mention Distinction.
1988-1994: Secondary School up to senior 5/Institut Madegu/RDC
1994-1996: Secondary School achieved (senior 6) at Groupe Scholaire de
Kigombe/Ruhengeri/Rwanda.
1982-1988 : Primary School : Ecole Primaire de Lubanda/DRC-Sud-Kivu.
Work Experience
August 2009-Todate: Chief Accountant in Imbuto Foundation (NGO established in
Rwanda).
01/07/2008-August 2009: Project Accountant-Rwanda Demobilization and
Reintegration Programme (financed by the World Bank).
01/01/2006-04/10/2007: Accountant of Rwamagana District, Eastern Province-
Rwanda.

44
10/Juin -31 Dec. 2005: Internal Auditor of Rwamagana Minicipality-Rwanda.
AVRIL 2005: Assistant Lecturer at UNATEK/Kibungo-Rwanda. Paper: Quantitative
Methods
Other Relevant Data
1. Computer skills
Microsoft Office package including Project
Sage Pastel (Accounting software)
TOMPRO (Accounting software)
SPSS Statistics Software
2. Language Skills
French: very Good
English: Very Good
Swahili: Good
3. Training acquired
Public procurement procedures and regulations by Rwanda National Tender Board.
Financial management, by WB Country office.
Financial Management of Global Fund Financing by Global Fund Office.
Financial Management of public funds by Ministry of Finances and PWC.
Human Rights Based Approach & Result Based Management (Planning, Implementation,
Monitoring and Evaluation) HRBA-RBM by UNICEF-Rwanda.
I certify that the information given above is sincerely true.