Embed Size (px)
Citation preview
i
SERVICE QUALITY AND CUSTOMER SATISFACTION IN
HOTELS IN NAIROBI, KENYA
CHARLES WATIKI
A RESEARCH PROJECT SUBMITTED IN PARTIAL FULFILLMENT OF THE
REQUIREMENTS OF MASTER OF BUSINESS ADMINISTRATION (MBA),
SCHOOL OF BUSINESS, UNIVERSITY OF NAIROBI
NOVEMBER, 2014

ii
DECLARATION
I declare that this research project is my original work and has never been submitted to
any other university for assessment or award of a degree.
Signature……………………………………………..Date……………………………….
Charles Watiki
D61/61461/2010
This project has been submitted with my authority as the university supervisor.
Signature…………………………………….Date……………………………
Michael. K. Chirchir
School of Business,University of Nairobi

iii
ACKNOWLEDGEMENTS
I feel indebted to the team of people who contributed towards successful completion of
this project. My sincere appreciation goes to my supervisor, Mr. Chirchir and my
moderator Mr. Mulwa for their support, counsel and guidance throughout the research
period. I am also grateful to my family members for their encouragement during the
study period.

iv
DEDICATION
This is dedicated to my dear family;my wife Esther and my daughter Quinter for being
patient with me during my absence. They provided me with moral support to complete
the project.

v
TABLE OF CONTENTS
DECLARATION.………………...……………………….………………………………ii
ACKNOWLEDGEMENTS ….…………...………….…………………………….……iii
DEDICATION…………………………………………….….……………….…………iv
LIST OF TABLES...........................................................................................................viii
LIST OF FIGURES............................................................................................................ix
ABSTRACT………...……………………………………..…………………...…………x
CHAPTER ONE: INTRODUCTION…………………..……........................................1
1.1 Background of the study…………………..………………………………..................1
1.1.1 Service Quality………………………………………………………………………2
1.1.2 Customer Satisfaction……………………….………………………………………4
1.1.3 Hotel industry in Kenya……………………………………………………………..5
1.2 Statement of the problem……………………………………………………………...6
1.3 Research objectives………………………...………………………………………….8
1.4 Value of the study……………………………………………………………………..8
CHAPTER TWO: LITERATURE REVIEW……………………..………………….10
2.1 Introduction………………………………………………………………………….10
2.2 Service Quality……………………………………………………………………….10
2.3 Determinants of Service Quality……………………………………………………..10
2.4 Measurements of Service Quality……………………………………………………14
2.4.1 Models for specific service settings………………………………………………..14
2.4.2 The SERVQUAL Model……………..……………………………………………15
2.4.3 Performance Only Model (SERVPERF)…………………….……... …………….16

vi
2.5 Empirical Studies on Service Quality………………………………………..………17
2.6 Customer Satisfaction………………………………………………………………..19
2.6.1 Factors affecting customer satisfaction……………………………………….……19
2.6.2 Empirical Studies on Customer Satisfaction……………………………………….20
2.7 Relationship between Service Quality and Customer Satisfaction……………..……21
2.8 Summary of Literature Review………………………………………………………22
2.9 Conceptual Framework……..……………….……………….………………………23
CHAPTER THREE: RESEARCH METHODOLOGY……………………………..25
3.1 Introduction………………………………………………………..…………………25
3.2 Research Design……………………………………...………………………………25
3.3 Target Population…………………………………………………………….………25
3.4 Sample Size……………………………………………………………………..……26
3.5 Data Collection…………………………………..……………………………….….26
3.6 Data Analysis…………………………………...……………………………………27
CHAPTER FOUR: DATA ANALYSIS, RESULTS AND DISCUSSION.………...28
4.1 Introduction…………………………………….………………………………….…28
4.2 Results…………………………………….………………………………………….28
4.2.1 Respondents general information………………………………………...………..28
4.2.2 Reliability of the results ………………………………………………...………….31
4.3 Perception of factors influencing customer satisfaction…………………………..…31
4.4 Service Quality and Customer Satisfaction……………………………...………….34
4.4.1 T Test for regression coefficients………….………………………………………34
4.4.2 Coefficient of determination, R2……………………………………………….….36

vii
4.4.3 F Test for the full model……………………………………………………….…..36
4.5 Discussion……………………………………………………………...…………….37
CHAPTER FIVE: SUMMARY, CONCLUSION AND
RECOMMENDATIONS……………………………………………………………….39
5.1 Introduction……….………………………………………………………………….39
5.2 Summary of Findings……………………………………………………..……...…..39
5.3 Conclusion………………………………………………………..………………….41
5.4 Recommendation……………………………………………………………….……41
5.5 Limitations of the study and suggestions for Further Research…………...……..…..42
REFERENCES………………………………………………….……………..……….43
APPENDICES…..…………………..…...……………………………………….....…..47
viii
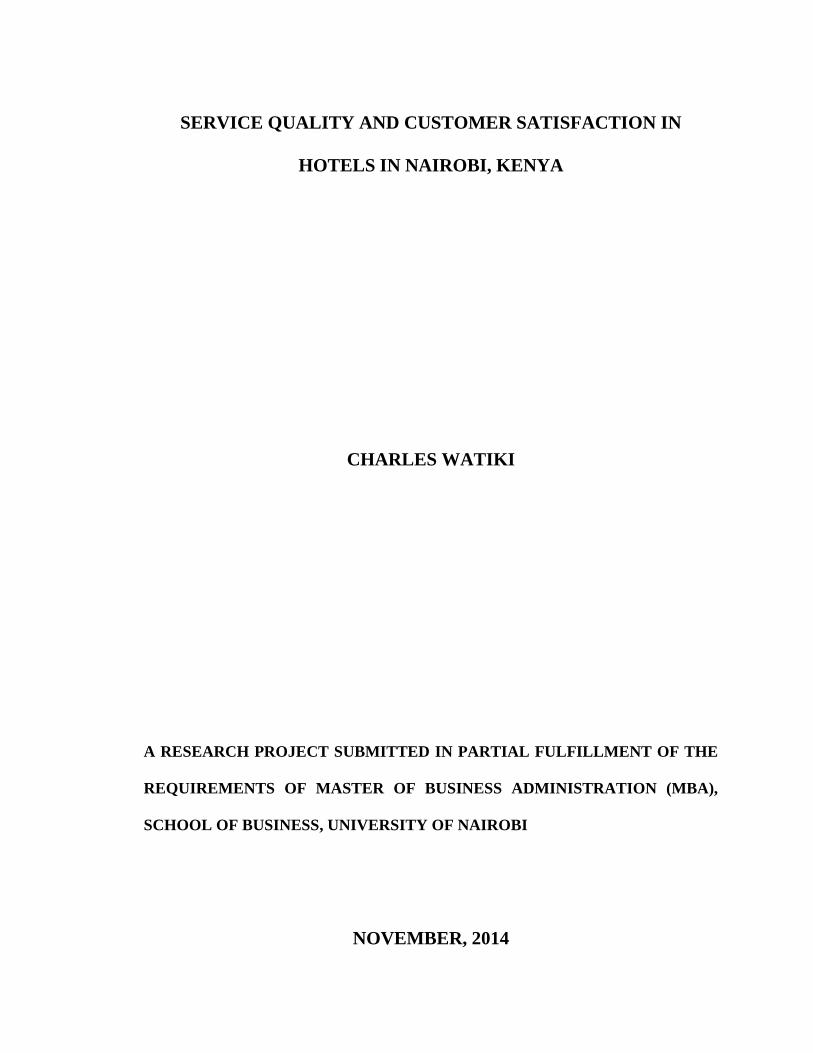
LIST OF TABLES
Table 2.1: Ten dimensions of service quality…………...……………………………….11
Table 2.2: Five dimensions of service quality……………...…………………...………12
Table 4.1: Respondents general information……………………………………………29
Table 4.2: Factors influencing customer satisfaction. …………………………….……32
Table 4.3: Regression coefficients of the five dimensions of service quality………..…44
Table 4.4: Regression statistics…………………………………………………..………36
Table 4.5: Test For significance………………………………………………………….37

ix
LIST OF FIGURES
Figure 2.1: Service quality and customer satisfaction relationship………………......….23

x
ABSTRACT
High level of competitiveness in the marketplace in which hospitality industries such as
hotels function has been one of the main reasons why service quality and customer
satisfaction have become of great importance. In the hotel industry, for example, satisfied
customers tend to return and make profit to the hotel. The hotel’s top management’s main
objective therefore, is on how to maximize customer satisfaction. This project had two
objectives: To determine factors influencing customer satisfaction and to examine the
relationship between service quality and customer satisfaction among hotels in Nairobi,
Kenya.
Performance Only Model (SERVPERF) which was developed by Cronin and Taylor
(1992) was used to develop a questionnaire which was later distributed to respondents
from across hotels in Nairobi. Descriptive statistics and Regression analysis were used to
establish the factors influencing customer satisfaction and bringing out the relationship
between service quality and customer satisfaction. All the five service quality variables
yielded positive relation with customer satisfaction. This means that service quality is
strongly linked with customer satisfaction and the higher the service quality, the higher
the customer satisfaction. The results further reveal that reliability dimension contributes
most towards customer satisfaction followed by Empathy, Tangibles and Responsiveness.
Assurance was seen to contribute the least. However all the dimensions were highly rated
and therefore the hotels cannot afford to ignore any of the variable.
From the analysis, it was also established that service quality has a statistically significant
effect on customer satisfaction with a coefficient of determination (R2) of 74.2%. This
implies that service quality contributes 74.2% of customer satisfaction while the other
factors contribute 25.8%. The researcher recommended that future studies could look into
the nature of these other factors that contribute 25.8% of customer satisfaction.
This study contributes to the existing studies examining service quality and customer
satisfaction in the hotel industries. The results from the study could be helpful to the
management of hotels in their policy formulation in the context of improving customer
satisfaction and service loyalty. The researcher recommended that since this study
focused only on hotels within Nairobi, future studies could look into more areas such as
Mombasa and Naivasha which are key tourist sites.

1
CHAPTER ONE: INTRODUCTION
1.1 Background of the Study
One of the most effective tools in hotel Industry success is service quality. Juran (1988)
defines quality as “fitness for use” while in Crosby (1979) quality is defined as
“conformance to requirements”. Mitra (2000) on the other hand views quality of a
product or service as “the fitness of that product or service for meeting or exceeding its
intended use as required by the customers”. Considering the hotel industry, bringing
about quality has complication that differs from when tangible product is involved.
Parasuraman et al., (1985) noted that it was inappropriate to use a product-based
definition of quality when studying the service sector. They therefore developed the
expression, “service quality”.
Service quality refers to the difference between customers' expectations of service and
their evaluation of the services they received (Parasuraman, Zeithaml, and Berry, 1985).
It is perceived as subjective since it relies on the judgement of the customer. However, it
is an important concept in influencing the extent and nature of customer satisfaction
experienced after service delivery. According toGronroos (1984); service quality is
dependent on two variables: expected service and perceived service. Expectations are
beliefs about the level of service that will be delivered by a service provider and they are
assumed to provide standards of reference against which the delivered service is
compared(Bitner et al,2003).If there is congruence between the performance and the
expectations, then a customer is said to be satisfied.

2
Various models have been proposed to measure service quality. Lehtinen and Lehtinen
(1982) proposed that service quality can be measured by its physical, corporate and
interactive quality whereas Le Blanc (1992) suggested a variety of factors such as
responsiveness, corporate image and accessibility as some of the factors used to evaluate
service quality.However, the most popular model for measuring service quality is the
SERVQUAL model developed by Parasuraman et al. (1985) and engenders five
determinants of service quality presented in order of importance, reliability,
responsiveness, assurance, empathy and tangibles.
This study focused on service quality and customer satisfaction: a case of hotel industry
in Kenya. The hotel industry is highly service oriented as through the experiences,
customers’ form opinions by comparing the service encounters against their expectations.
The hotel industry in Kenya is experiencing increasing competition with major
international hotel brands increasingly setting up operations in Kenya. This is set to
increase the competition in the hotel industry. To survive in this dynamic and highly
competitive business environment the hotel operators will be forced to critically
acknowledge the importance of service improvement in order to gain competitive
advantage.
1.1.1 Service Quality
Service quality is defined as customer’s perception of how well a service meets or
exceeds their expectations (Parasuraman, Berry and Zeithmal 1985). Service quality is
often judged by customers and not by the organization itself (Abbasi, Khalid, Azam and
Riaz, 2010).Martin (1999) suggested that a service is characterized by attributes such as
3
intangibility, heterogeneity, perishability and inseparability which delineate a service
from a good which further complicates the evaluation of the performance of a service.
This creates the need for an organization to develop new models or use already existing
models to measure the performance of the services and the perceptions that customers
have towards the company.
Parasuramanet al. (1985) mention that if customer’s expectations are superior to the
performance of the service, the service quality is deemed to be unsatisfactory which
results in dissonance on the part of the customer. The service will be considered excellent
if perceptions exceed expectations. Parasuraman, Berry and Zeithmal (1988) developed
an instrument, the SERVQUAL model, which was among the first models used to
measure service quality. The model is based on five factors reliability, responsiveness,
assurance, empathy and tangibles. The SERVQUAL model is built around the gap that
exists between the services offered vis-à-vis the expected service quality as perceived by
the customer.
Most writers agree that customers’ expectations are rarely concerned with a single aspect
of the service package but rather with many aspects (Berry et al., 1985). Service quality
dimensions are the characteristics which customers use to evaluate service quality. Proper
understanding of customers’ perceptions along these dimensions is essential for
hospitality organizations professionals to recognize the customer expectations. Aligning
the services to meet customer expectations would result in reduced gaps in perceptions of
service quality. Identification of the determinants of service quality should be a central
concern for service management. Once customers’ requirements are clearly identified and
4
understood, hotel operators are in a better position to anticipate and fulfill their
customers’ needs and wants (Juwaheer& Ross, 2003).
1.1.2 Customer Satisfaction
In close connection with service quality is customer satisfaction. Customer satisfaction is
defined as the consumer’s fulfillment response (Oliver, 1997). It is a judgment that a
product or service feature, or the product or service itself, provided (or is providing) a
pleasurable level of consumption-related fulfillment, including levels of under- or over-
fulfillment. According to Williams et al., (2003), customers are satisfied when their
judgment of the service they have received equals or exceed what they expected. If
performance matches, the customer is satisfied and, if it exceeds expectations, even
delighted (Kotler et al., 1996). If the performances fall short of expectations, the
customer is dissatisfied. Proper understanding of the factors that influence customer
satisfaction makes it easier for the service provider to design and deliver service offers
that correspond to customer demands(Gibson, 2005).
The term service quality and customer satisfaction have been conceptualized similarly in
the literature and therefore might be considered as one evaluative construct (Iacobucci et
al; 1995). According to parasuraman et al, (1988), service quality is a global judgment
relating to the superiority of the service, whereas satisfaction is related to a specific
transaction. He concluded that the two construct are related in that incidents of
satisfaction over time results in perception of service quality and therefore the two
constructs can be measured by the same attributes.
5
1.1.3 Hotel industry in Kenya
The hotels play a central role in the country’s tourism industry, yet the Coast lacks five-
star hotels. According to the Economic Survey (2012), the tourism earnings in Kenya
rose by 32.8% from 73.7 billion in 2010 to 97.9 billion in 2011. Out of these earnings,
the hotel industry’s establishments registered a net worth of over Ksh. 10 billion. The
Kenya hotel and restaurant regulations of 1988 established standards upon which
classification of hotels is based. Internationally, the classification of hotels and
restaurants creates uniformity in the industry providing common elements in every class
of hotel and restaurant that their clients should expect. The hotel business is regulated by
two Acts of parliament namely: Hotels and restaurants Act (Cap 494) and the tourist
Licensing Act (Cap 381). Vacation hotels, town hotels and lodges are classified into five
classes denoted by stars, five being the highest and one being the lowest. These star-
rated hotels enable both the domestic and international customers to understand the value
of the services they are paying for. The hotels that are 5-star rated are expected to offer
highest standards of facilities and services. According to the Kenya gazette, 13th
June,
2003, vol.cv-no.62, Nairobi has seven 5-star hotels, nine 3-star hotels, five 2-star hotels
and five 1-star hotels.
Kenya has the best developed hotel industries in Sub-Saharan Africa, offering an
average of 31,400 beds per night (Kenya economic survey 2013). As a result there has
been unprecedented entry of international Hotel brands in the Kenyan Hotel
industry. Kenya is set to host nine new international hotels which are planning to
put up 1437 hotel rooms to cater for growing demand for travel and accommodation in
the country by 2015 (Kenya economic survey 2013). These hotels include Marriot,
6
Accor, Radisson blu, Park inn, Lonrho, Rezidor (2 hotels) and Hilton (2 new hotels)
Hotel occupancy in Kenya is relatively stable throughout the year, other than December
due to Christmas and New Year celebrations in December and January which reduce
demand during those months. Although the reasons for the visit to the country vary, with
leisure being a significant driver, the market shows limited seasonality pattern. Nairobi’s
main source markets are the UK, the USA and Italy. Europe is the most important region
accounting for 47% of total international arrivals in Nairobi. Arrivals from Asian markets
are also becoming increasing important especially China and India. In 2011, for example,
arrivals from China and India grew by 31% and 24% respectively. This is partly due to
large construction projects being undertaken by Chinese companies.
1.2 Statement of the Problem
For the hotel industry to achieve its objective of delivering quality service for its
customers, it is imperative to study how the hotel can conceivably meet and even exceed
customers’ service delivery expectations (Doyle, 2000). Management of organizations
seeks to know the level at which the customers are satisfied with their services and the
kind of service quality levels their customers would like in order to offer the exactly what
would be taken positively. Parasuraman et al. (1988) provided a list of five determinants
of servicequality as a result of their focus group studies with service providers
andcustomers: Reliability, Responsiveness, Assurance, Empathy and Tangibles.
In a study to evaluate service quality dimensions that impact customer satisfaction, Harr
(2008) concluded that assurance, empathy and tangibles are the most important to
customers’ evaluation of service quality and thus, may have a positive influence on

7
customer satisfaction. Krishna et al., (2010) after studying service quality and its effect
on customer satisfaction in retailing in India concluded that customers have the highest
expectations on promptness of service, accuracy of transactions and security issues.
Manyi (2011) while studying the relationship between customer satisfaction and service
quality found out that all the five dimensions of service quality were significantly related
to customer satisfaction. The outcome of the study suggested that to satisfy
customers, organizations need to improve dimensions of service quality. These
results were consistent with the findings by Akoko (2012). The researcher, however,
pointed out that his research work targeted only a few service sectors due to time and
money constraint and therefore the study results could not be generalized to other
sectors such as the hotel industry.
Akoko (2012) studied service quality dimensions and customer satisfaction in Kenyan
telecommunications industry and established that all the five service quality dimensions
had positive impact on customer satisfaction. However, reliability dimension was
considered to be having the highest impact while tangibility was considered to have the
least impact. Similarly, the research work was limited to the telecommunication industry
and therefore the results could not be generalized to the hotel industry
In a study carried out by Musyoka (2013) to establish whether there exists any
relationship between service quality and library user satisfaction among universities
in Kenya, it was established that service quality accounts for 73.9% of user satisfaction.
He noted further that reliability dimension contributes most towards user satisfaction
while empathy dimension contributes the least. The research was limited to libraries

8
and therefore not all inclusive and the results could not be generalized to cover the hotel
industry.
The studies by Harr (2008), Krishna et al., (2010), Manyi (2011), Akoko (2012) and
Musyoka (2013) were carried out across different technological and social-cultural
contexts. The studies also gave conflicting results in regards to service quality
dimensions impacting most on customer satisfaction. All the studies however had a
consensus that there exists a relationship between service quality and customer
satisfaction. The purpose of this study is to enhance this understanding in the Kenyan
hotel industry by answering the question: What factors affect customer satisfaction?
1.3 Research Objectives
The research question is to be answered by achieving the following specific research
objectives.
i. To determine factors influencing customer satisfaction.
ii. To examine the relationship between service quality and customer satisfaction
among hotels in Nairobi, Kenya.
1.4 Value of the Study
The study aims to identify the relationship between service quality and customer
satisfaction a case study of hotels in Nairobi, Kenya. These findings will lead to a better
understanding of operations and quality dynamics involved in the hotel industry in Kenya
and ultimately lead to customer satisfaction. The findings made from the study are
significant as they will form basis for further research. Scholars and academicians will be

9
able to identify further areas for research on service quality in hotels in Kenya that will
enhance better service delivery and organizational performance. Academicians will also
make references and deductions from the findings and conclusions of the study since it
will provide additional information to the body of literature in the field of service quality
management.
The findings will also provide insights to the management of hotels in re-examining
their services strategy development particularly in the context of increasing
customer satisfaction and service loyalty. It will also provide an insight on the areas that
need improvement, restructuring or general overhaul of the strategies used in service
delivery and organizational performance.
The tourism industry in Kenya is currently facing slow progress and the hotels are losing
a lot of revenue due to cancelled bookings. This study is important to policy makers both
in the private and public sector of the industry since they stand to gain significant insights
from the findings of this study.The information at their disposal on service quality and
customer satisfaction will enable them formulate policies that relate to the hotel industry
in Kenya.

10
CHAPTER TWO: LITERATURE REVIEW
2.1 Introduction
This chapter discusses the theoretical framework and empirical studies related to service
quality and customer satisfaction. In particular, the study covers literature related to the
study as studied by other scholars. The literature is reviewed in two streams. First,
literature on service quality and its measurement is reviewed. Then, literature relating to
customer satisfaction is reviewed. Finally, literature relating to the relationship between
service quality and customer satisfaction is reviewed and a conceptual framework of the
study developed.
2.2 Service Quality
Researchers proposed different views on the definitions of service quality. Service quality
is defined as a comparative function between consumer expectations and actual
service performance (Parasuraman et al., 1985). On the other hand, Parasuraman et al.,
(1988) defined service quality as the ability of an organization to meet or exceed
customer expectations. According to Cronin & Taylor (1994), service quality is a form of
attitude representing a long-run overall evaluation of service. As observed by Chang,
Chen and Hsu (2002), the traditional notion of service quality by Parasuraman et al.,
(1985) is most commonly accepted.
2.3 Determinants of Service Quality
When purchasing goods, the customer employs many tangible aspects to judge quality;
style, hardness, color, label, feel and package. However, when purchasing services fewer

11
tangible aspects exist. In the absence of tangible evidence on which to evaluate quality,
customers must depend on other aspects. Service quality dimensions are the
aspects/characteristics which customers use to evaluate service quality.
A research by Parasuraman et al., (1985) identifies ten determinants that influence
customers’ perceptions of service quality as reliability, responsiveness, tangibility,
communication, credibility, security, competence, courtesy, understanding and access.
The description of the ten determinants of service quality is given in Table 2.1.
Table 2.1: Ten dimensions of service quality
Dimension Description
Tangibility Physical evidence of service (facilities, tools, equipments
Responsiveness Willingness or readiness to provide service, timeliness
Reliability Getting it right first time, honoring promises, dependability.
Communication Keeping customers informed in a language that they can understand
Credibility Honest, trustworthiness, having customer’s best interest at heart
Security Physical and financial; confidentiality
Competence Possession of the skills and knowledge required to perform the
service
Courtesy Politeness, respect, friendliness, clean and neat appearance.
Understanding Knowing the customer, his needs and requirements.
Access Ease of approach and contact
Source: Adapted from Parasuraman, Zeithml and Berry (1985)

12
In a follow-up study, Berry et al., (1988) found a high degree of correlation between, on
the one hand, communication, competence, courtesy, credibility and security, and, on the
other, between access and understanding; and so they created the two broad dimensions
of assurance and empathy, that is, five consolidated dimensions:-reliability,
responsiveness, tangibles, assurance and empathy (Parasuraman et al., 1988). These
dimensions were then used as a basis for the development of a service quality
measurement instrument; SERVQUAL model (Zeithamlet al., 1988). Table 2.2
demonstrates the five service dimensions customers care about.
Table 2.2: Five dimensions of service quality
Dimension Description
Tangibles Physical facilities, equipment and appearance of personnel.
Reliability Ability to perform the promised service dependably and accurately
Responsiveness Willingness to help customers and provide prompt service
Assurance Knowledge and courtesy of employees and their ability to inspire trust and
confidence
Empathy Caring, individualized attention the firm provides its customers.
Source: Adapted from Parasuraman, Zeithml and Berry (1988)
Johnston et al., (1990) tested the comprehensiveness of Parasuraman et al’s (1985)
service quality determinants using management perceptions of service and suggested a
refined list of 12 determinants of service quality as access, appearance/aesthetics,
availability, cleanliness/tidiness, comfort, communication, competence, courtesy,
friendliness, reliability, responsiveness and security. The limitation of their work lay in

13
the fact that the empirical investigation drew only on management perception of service
quality unlike Parasuraman et al., (1988) who used customer data in order to identify the
determinants of service quality.
Johnston and Silvestro (1990) included the customer’s perspective to the 12 service
quality dimensions and identified 5 additional dimension to create 17 dimensions
asaccess, appearance/aesthetics, availability, cleanliness/tidiness, comfort,
communication, competence, courtesy, friendliness, reliability, responsiveness,
securitycare, commitment, attentiveness/helpfulness, functionality and integrity (Johnston
et al.,1990). These dimensions are described in details in appendix 1.
Gronroos (1990) identified three dimensions of service quality as technical quality of the
service (“what” service is provided), which can be assessed by the customer like the
technical dimensions of a product, functional quality which represent how the service is
provided and the image of the service provider which moderates both technical and
functional quality to arrive at a perceived level of service. He argued that functional
quality is an important dimension of perceived service than technical quality because
service quality lies in improving the functional quality of a firm’s service process by
managing the staff-customer interaction and transactional relationships. He observed that
a favorable image is an asset for any firm because it has an impact on customer
perception of the operation of the firm.
These authors and many others who have postulated service quality dimensions appear to
have based their work on Parasuraman et al., (1985) and Parasuraman et al., (1988) well
publicized work. For the purpose of this study, therefore, the researcher adopted

14
Parasuraman et al’s (1988) dimensions of service quality i.e. Reliability, Responsiveness,
Access, Empathy and Tangibles. The five dimensions of service quality developed by
Parasuraman, Zeithmal and Berry (1988) are the most acknowledged and applied in
diversity of service industries (Nathan.D. and Saghier.N. (2013).
2.4 Measurement of Service Quality
Measuring service quality is an important aspect in the quality improvement process
because it provides feedback about the type of service provided and the extent to which it
meets customers’ needs (Mwangi et al., 2009). A number of scholars have carried out
several studies with an aim of developing models of measurement that would help service
organizations determine the extent to which their services are effective.
2.4.1 Models for specific service settings
Different researchers have developed alternative measures of service quality for specific
service settings. Knutson et al., (1991) developed LODGSERV model to measure service
quality in the lodging industry. The model is based on the five original SERVQUAL
dimensions and contains 26 items. Getty and Thompson (1994) on the other hand
developed LODGEQUAL model to measure service quality in the hotel industry. The
model identified three dimensions, namely tangibles, reliability and contact. DINESERV
model was developed by Stevens, Knutson and Patton (1995) to measure service quality
in restaurants. It contains 29 items and five SERVQUAL dimensions. Another model,
DIVEPERF, was developed by O’Neill et al., (2010) to assess perceptions of diving
services. The model consists of five SERVQUAL dimensions and 27 items. All of these

15
models represent modifications of the SERVQUAL instrument, aiming to improve its
original methodology.
2.4.2 The SERVQUAL Model
The model was developed by Parasuraman, Zeithaml and Berry (1988) as a tool of
identifying service quality shortfall. This model is based on the premise that customers
can evaluate a firm’s service quality by comparing their perception of its service with
their own expectations.
The model measures customer expectations and perceptions of service quality. The
quality gap (Q) is calculated by subtracting the expectation (E) from the perception (P)
value i.e. P-E=Q. Summation of all the Q values provide an overall quality rating which
is an indicator of relative importance of the service quality dimensions that influence
customers’ overall quality perceptions. SERVQUAL is a standardized instrument that has
been applied across a broad spectrum of service industries.
The SERVQUAL scale (Questionnaire) has two sections: one to measure customer
expectations in relation to a service segment and the other to measure perception
regarding the organization whose service is being assessed. SERVQUAL comprises a 22
items (Likert-type) with five dimensions of reliability, responsiveness, assurance,
empathy and tangibles. From the 5 dimensions, 22 statements are derived, each
measuring both the expectations and perceptions of customers towards the quality of
services of the organization being assessed. The customers are required to rate, on a 5-
point Likert scale, the degree to which they feel the service provider should deliver for an
excellent service. Another identical scale is provided adjacent to the first one in which the

16
respondents rate the actual quality of service delivered to them by an organization based
on their perceptions. For each statement, the difference between perception and
expectation is calculated; the averages of the obtained score being the SERVQUAL score
(Parasuraman et al., 1988).
2.4.3 Performance Only Model (SERVPERF)
SERVPERF was developed by Cronin and Taylor (1992) in their empirical work which
involved the modification of SERVQUAL with respect to conceptualization and
measurement of service quality. They developed a performance based measure of service
quality called “SERVPERF” illustrating that service quality is a form of consumer
attitude. SERVPERF measures service quality based solely on performance. Cronin and
Taylor (1992) argued that performance is the measure that best explains customers’
perceptions of service quality, so expectations should not be included in the service
quality measurement instrument. SERVPERF looks at the attributes of the 5 dimensions,
worded the same as SERVQUAL but does not repeat the set of statements as expectation
items. SERVPERFtherefore comprises a 22 items (Likert-type) with five dimensions of
reliability, responsiveness, assurance, empathy and tangibles. 22 statements are then
derived to measure the perceptions of customers towards the quality of services of the
organization being assessed.
This research adapted the SERVPERF tool to measure service quality among hotels in
Nairobi Kenya.

17
2.5 Empirical Studies on Service Quality
Different models have been advanced concerning service quality in the service
organizations with an aim of establishing the relationship between service quality and
customer satisfaction. From the earlier research work, Parasuraman et al., (1988), five
determinants of service quality were identified as reliability, responsiveness, assurance
empathy and tangibles. Ten studies carried out using the Servqual questionnaire revealed
that Reliability is the most critical dimension when measuring the relative importance of
the five dimensions followed by Responsiveness, Assurance, Empathy and finally
Tangibles (Parasuraman et al., 1991)
Stromgren(2007) studied the factors influencing service quality in the hotel industry in Peru
and established that the customers were more interested on the dimensions of reliability
exterior, tangibles and assurance. The best predictor of overall service quality was
identified as the dimension of reliability. The researcher however noted that a different
context would give different results. This is due to different social demographic variables
such as culture and religion which might impact on customer expectations. Harr (2008)
on the other handstudied service dimensions that leads to higher levels of customer
satisfaction in restaurants in Singapore and found out that assurance, empathy and tangibles
are the most important to customers’ evaluation of service quality, and thus, may have a
positive influence on customer satisfaction.
Musili (2009) studied the perceived quality of passenger services provided by the rift
valley railway consortium and found out that courtesy and friendliness of staff, security
and driving expertise are the most important dimensions to the customers. He further
18
noted that the general performance was poor with 37.5% of respondents registering
disappointment with the service.
A study by Krishna et al., (2010), established that customers have the highest
expectations on promptness of service, accuracy of transactions and security issues. The
researcher advised managers to prioritize on attention to details and promptness in
addressing customer complaints. The researcher noted that customers’ expectations and
perceptions are subjective and the findings can only be generalized to a pre-defined
market and economic scenarios.
Kiange (2011) investigated managers’ perception of customer expectations in hotel
industry in Kenya. The results showed that assurance, empathy and tangibles were
regarded as the most important factors affecting service quality. This research was
however limited to managers’ perception of customer expectations and failed to take into
account customer’s expectations. The result of the study therefore, does not represent the
voice of the customer. More study therefore needs to be carried out to establish whether
the manager’s perception of customer expectations matches customers’ expectations.
Kangogo et al., (2013) studied effect of customer satisfaction on performance of the hotel
industry in the western tourism circuit of Kenya. The customers reported to be satisfied
with reservation, reception, food quality and beverage quality. Costs, security and hotel
amenities on the other hand registered fair ratings while provision of personalized
services registered dissatisfaction. The researcher also noted that customer satisfaction
has positive impacts on market share, service quality, hotel image, sales turnover, and
that lack of customer satisfaction results in customer and employee turnover.

19
2.6 Customer Satisfaction
Tse&Wilton, (1988) defined customer satisfaction as “the consumer’sresponse to the
evaluation of the perceived discrepancy between prior expectations andthe actual
performance of the product or service as perceived after its consumption”. Woodruff and
Gardial, (1999)defined customer satisfaction as “the evaluative reaction to how particular
productperformed when compared to how he or she anticipated that it would perform”.
Kotler et al., (2002) on the other hand defined Customer satisfaction as the extent to
which a product’s perceived performance matches a buyer’s expectations. Failure to meet
theseexpectations leads to dissatisfaction. These definitions consider satisfaction as an
overall post-purchase evaluation by the customer.
2.6.1 Factors affecting Customer Satisfaction
According to Valerie, Zeithaml and Bitner (2005), customer satisfaction is influenced by
a host of issues such as product and service features, customer emotions, perception of
equity and fairness and other customers, family members, friends and co-workers.
According to Tulel et al, 2006, the customer service a brand offers and the fairness of the
price it charges determines the level of satisfaction among its customers than any other
measures. Parasuraman, Zeithml and Berry, 1988 identified 22 factors that influences
customer satisfaction as Physical facilities, Equipment, Appearance of hotel employees,
Communication materials, Timeliness of service, Problem solving interest, Efficient
service, Consistency of service, Accuracy of records, Problem resolution time, Prompt
attention to guest’s requests, Willingness to help, Flexibility of employees, Behavior of
employees, Safety and security, Courtesy of employees, Competence of employees,

20
Individualized attention, Convenient operating hours, Personal attention from employees,
Concern towards guest interest and Understanding guest specific needs.
2.6.2 Empirical Studies on Customer Satisfaction
Lawrence C. Voss (2006) studied customer satisfaction among four star hotels in
Spain,Germany and England. The results revealed that many customers were satisfied
with theability of staff to speak a foreign language, friendliness of staff, condition of
premise, room comfort and the ease of obtaining information. Areas of dissatisfaction
includedrespect shown by staff, ease of contacting a staff member, extra personal
attention,multilingual magazines, international newspaper and TV programs in own
language. Onoverall, customer satisfaction was high in all the hotels.
Mbungwana Christine Lungiswa (2009) conducted a customer satisfaction survey in
hotels in Cape Town. The research identified areas of satisfaction as, wellness/spa
experience, guest entertainment, maintenance of grounds and swimming pool experience.
Areas of dissatisfaction were identified as delivery of luggage, switch board and message
service, attention to special requests and dinner experience.
Kangogo et al., (2013) studied effect of customer satisfaction on performance of the hotel
industry in the western tourism circuit of Kenya. The customers reported to be satisfied
with reservation, reception, food quality and beverage quality. Costs, security and hotel
amenities on the other hand registered fair ratings while provision of personalized
services registered dissatisfaction. The researcher also noted that customer satisfaction
has positive impacts on market share, service quality, hotel image, sales turnover, and
that lack of customer satisfaction results in customer and employee turnover.

21
Similarly, Mburu et al., (2013) studied the determinants of customer satisfaction in the
Kenyan banking industry. The customers reported to be satisfied with the accuracy and
timeliness of bank statements and staff understanding of customer needs. Entertainment
& refreshment to customers, adequacy of bank’s networks and readiness of bank staff to
respond to customer requests registered elements of dissatisfaction. He further noted that
customer satisfaction can lead to higher rates of retention of the Kenyan bank customers.
2.7 Relationship between Service Quality and Customer Satisfaction
Some researchers argue that service quality is an antecedent of customer satisfaction
(Churchill and Suprenant, 1982) while others argues that satisfaction represents an
antecedent of service quality (Carman, 1990; Boltonand Drew, 1991). However, the
majority of recent publications believe that service quality is an antecedent to customer
satisfaction (Carrillat et al., 2007 &Zeithaml et al., 2008).
It is generally accepted that a positive relationship exists between service quality and
customer satisfaction (Bei and Chiao, 2001). Rowley (1998) argues that service quality
isan attitude related to, but not the same, as satisfaction. Parasuraman et al., (1985) in
theirstudy, proposed that when perceived service quality is high, then it will lead to
increase in customer satisfaction. Similar conclusion was reached by Bei and Chiao
(2006) and Brady et al., (2005).
After conducting a study to establish the relationship between customer satisfaction
andservice quality, Janet (2011) concluded that a significant relationship between the
twoexisted. All the dimensions of service quality were identified as the key factors in
influencing customer satisfaction. The outcome of the study suggested that to

22
improvecustomer satisfaction, organizations need to improve the dimensions of service
quality.
Akoko (2012) studied service quality dimensions and customer satisfaction in
Kenyantelecommunications industry and established that all the five service quality
dimensionshad positive impact on customer satisfaction. However, reliability dimension
was considered to be having the highest impact while tangibility was considered to have
the least impact. He suggested that all service quality dimensions should be improved and
allocated more resources since they positively affect customer satisfaction.
In a study carried out by Musyoka (2013) to establish whether there exists any
relationship between service quality and library user satisfaction among universities in
Kenya, it was established that service quality accounts for 73.9% of user satisfaction. He
noted further that reliability dimension contributes most towards user satisfaction while
empathy dimension contributes the least.
2.8 Summary of Literature Review
A review of literature on service quality indicates that the relative importance of the
dimensions of service quality is dependent on the industry in which service quality is
being measured. The review also highlights the need to examine the extent to which the
services provided meets customers’ needs. In the hotel industry, a review of the existing
literature has shown that customer satisfaction is highly depended on service quality
(Janet (2011), Harr (2008) & Krishna et al., (2010).

23
2.9 Conceptual Framework
Based on the literature reviewed, a theoretical framework for this study was developed
and is shown in Figure 2.1, the major objective of the study being to analyze the
relationship between service quality and customer satisfaction.
Figure 2.1: Service quality and customer satisfaction relationship framework.
Source: Adapted from Jalal (2012)
The dependent variable in this research is overall customer satisfaction while the
independent variable is service quality which measures the level of customer satisfaction.
The type of customer will act as a moderating variable in the conceptual framework. The
dimensions included in this variable are reliability, responsiveness, assurance, empathy
and tangibility.
Reliability
Independent variable Dependent variable
Reliability (X2)
Responsiveness
(X3)
Assurance (X4)
Empathy (X5)
Customer
satisfaction
Tangible (X1)
Independent variable> Dependent variable
β1
β2
β3
β4
β5
24
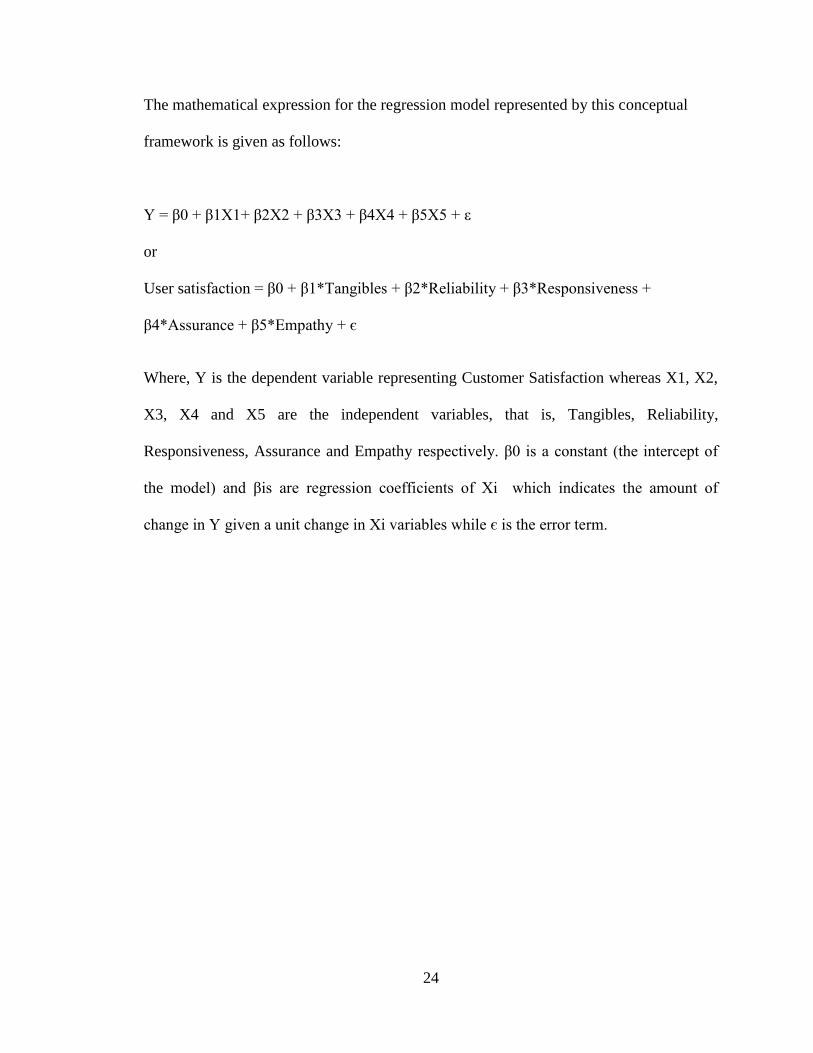
The mathematical expression for the regression model represented by this conceptual
framework is given as follows:
Y = β0 + β1X1+ β2X2 + β3X3 + β4X4 + β5X5 + ε
or
User satisfaction = β0 + β1*Tangibles + β2*Reliability + β3*Responsiveness +
β4*Assurance + β5*Empathy + є
Where, Y is the dependent variable representing Customer Satisfaction whereas X1, X2,
X3, X4 and X5 are the independent variables, that is, Tangibles, Reliability,
Responsiveness, Assurance and Empathy respectively. β0 is a constant (the intercept of
the model) and βis are regression coefficients of Xi which indicates the amount of
change in Y given a unit change in Xi variables while є is the error term.

25
CHAPTER THREE: RESEARCH METHODOLOGY
3.1 Introduction
This chapter sets out various stages that were followed in completing the study. These
stages are research design, target population, sampling design, data collection
instruments, data collection procedures and data analysis.
3.2 Research Design
The researcher applied a descriptive design to study service quality and customer
satisfaction from the customer’s perspective in star rated hotels within Nairobi. The
research design was chosen because the study was not confined to the collection and
description of the data, but sought to determine the existence of certain relationships
among the research variables. In this study, it was used to establish the relationship
between the determinants of service quality and customer satisfaction among star rated
hotels in Nairobi Kenya. The studies by Stromgren (2007), Krishna et al., (2010), Janet
(2011), Musyoka (2013), Mburu et al., 2013 adopted this research design and specific
research objectives were sufficiently achieved.
3.3 Target Population
In this study, the population that was targeted comprised the guests of star rated hotels in
Nairobi Kenya.According to the Kenya gazette, 13th
June, 2003, vol.cv-no.62, Nairobi
has seven 5-star hotels, nine 3-star hotels, five 2-star hotels and five 1-star hotels with a
total bed capacity of 6200 beds as indicated on See appendix 3. According to a research

26
carried out by Muna et al., (2013), Nairobi hotels are expected to have an average
occupancy rate of 55% in year 2014. See appendix: 3. In this regard the projected number
of guests per day is 3412 guests.
3.4 Sample size
This study adapted the formula developed by Glenn (2009) to determine the sample size.
Sample size, n = N/ (1+N(e)2)
Where e = Margin of error (0.05) and N is the population (3412)
Therefore;
Sample, n = N/ (1+N(e)2) = 3412/ (1+3412(0.05)
2) = 358 respondents
A minimum of 358 questionnaires were thereforedistributed proportionately among the
respondents from the star rated hotels in Nairobi as indicated in appendix 3.
3.5 Data Collection
Primary data was used for this study. The data was collected using a standardized
questionnaire comprising of 22 statements derived from the works of Cronin and Taylor
(1992) which involved the modification of SERVQUAL. The questionnaire was modified
to include a section that was used to measure factors influencing customer
satisfaction.The questionnaire comprised three parts. The first part required the
respondents to give their demographic information. The aim of this part was to provide
information on the type of the customer. The second part required them to rate the extent
to which they believed the indicated factors influences customer satisfaction. Part three of
the questionnaire required the respondents to rate their perception levels with the services

27
provided by the hotels. Likert type scale ranging from 1 to 5 was adapted. The researcher
administered a questionnaire to each member of the sample population using a drop and
pick later method.
3.6 Data Analysis
Prior to processing the responses, the completed questionnaires were edited for
completeness and consistency. Quantitative data collected was then analyzed and
interpreted in line with the study objectives through use of statistical package for social
sciences (SPSS).
The first research question was answered using the data collected from part II of the
questionnaire. The mean (weighted average) and standard deviation were used to analyze
the data from the responses received. Linear Regression model was used to realize the
second objective. The mathematical expression for the regression model is given as
follows:
Y = α + β1X1+ β2X2 + β3X3 + β4X4 + β5X5 + ε
Where, Y is the dependent variable representing Customer Satisfaction and X1, X2, X3,
X4 and X5 are the independent variables representing the 5 service quality dimensions,
that is, Tangibles, Reliability, Responsiveness, Assurance and Empathy respectively. α is
a constant (the intercept of the model) and βis are regression coefficients of Xis variables
while ε is the error term.

28
CHAPTER FOUR
DATA ANALYSIS, RESULTS AND DISCUSSION
4.1 Introduction
This chapter presents the results obtained from data analysis, interpretations and
discussion of findings. The study results are analyzed and interpreted in line with the
objectives which were to determine factors that influence customer satisfaction ant to
examine the relationship between service quality and customer satisfaction among hotels
in Nairobi, Kenya.
4.2 Results
The study targeted the guests of selected rated hotels in Nairobi County. The respondents
in the rated hotels were of different nationalities across the globe. Due to ample time and
accessibility of the hotels the survey yielded a 100% response rate in the research
process. The questionnaires were examined for errors and omissions then used for
analysis.
4.2.1 Respondents general information
The study sought to find out the distribution of respondents in five categories named;
gender, nationality, age, purpose of visit and the number of visits to the hotel. The results
are highlighted in Table 4.1.

29
Table 4.1: profile of respondents
Gender Percentage
Male 47%
Female 53%
Nationality Percentage
Kenya 28%
Rest of Africa 20%
Europe 15%
USA 11%
Middle East 8%
Asia 11%
Others 7%
Age Percentage
18 – 25 7%
26 – 35 22%
36 – 45 31%
46 – 55 34%
Over 55 years 6%
Purpose of the visit
Airline crew 14%
Leisure 27%
Business 25%
Meeting 17%
Others 17%
Number of visits to hotel
First Visit 14%
2 – 5 53%
6 – 10 23%
10> 10%
Source: Research data (2014)
30
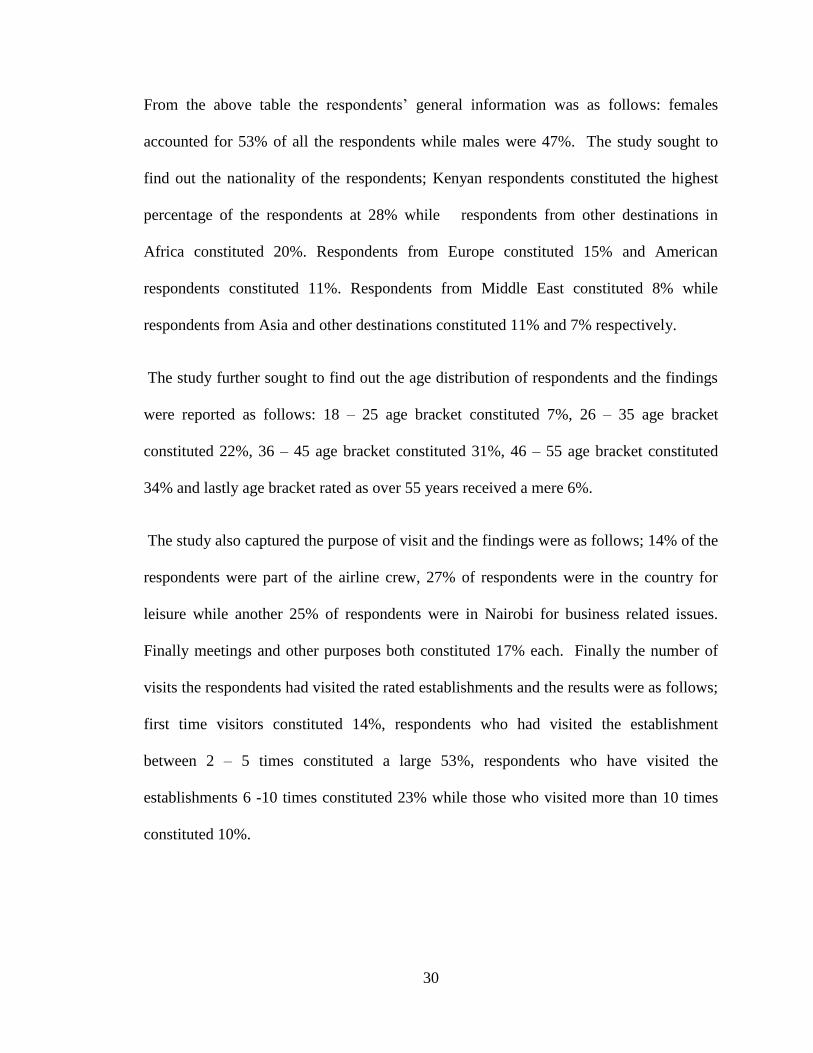
From the above table the respondents’ general information was as follows: females
accounted for 53% of all the respondents while males were 47%. The study sought to
find out the nationality of the respondents; Kenyan respondents constituted the highest
percentage of the respondents at 28% while respondents from other destinations in
Africa constituted 20%. Respondents from Europe constituted 15% and American
respondents constituted 11%. Respondents from Middle East constituted 8% while
respondents from Asia and other destinations constituted 11% and 7% respectively.
The study further sought to find out the age distribution of respondents and the findings
were reported as follows: 18 – 25 age bracket constituted 7%, 26 – 35 age bracket
constituted 22%, 36 – 45 age bracket constituted 31%, 46 – 55 age bracket constituted
34% and lastly age bracket rated as over 55 years received a mere 6%.
The study also captured the purpose of visit and the findings were as follows; 14% of the
respondents were part of the airline crew, 27% of respondents were in the country for
leisure while another 25% of respondents were in Nairobi for business related issues.
Finally meetings and other purposes both constituted 17% each. Finally the number of
visits the respondents had visited the rated establishments and the results were as follows;
first time visitors constituted 14%, respondents who had visited the establishment
between 2 – 5 times constituted a large 53%, respondents who have visited the
establishments 6 -10 times constituted 23% while those who visited more than 10 times
constituted 10%.

31
4.2.2 Reliability of the results
Mitchell (1996) outlines three common approaches to assessing reliability in addition to
comparing the data collected with other data from other sources. They are test re-test;
internal consistency and alternative form. In our study the method adopted was the test
re-tests method. the test re-test estimates of reliability were obtained by correlating data
collected with those from the same questionnaire collected under as near equivalent
conditions as possible. The questionnaire was pretested twice to respondents in the rated
hotels.
4.3 Perception of factors influencing customer satisfaction
The first objective sought to find out factors influencing customer satisfaction.
Respondents were asked to rate the factors on a scale of 1 to 5 ranging as 1 = strongly
disagree, 2 = disagree, 3= neutral, 4 = agree and 5= strongly agree. A five point likert
scale was used to interpret the respondent’s responses.
According to the scale those factors which were not considered at all were awarded 1
while those which were extremely influencing satisfaction were awarded 5 within the
continuum are 4 for fairly influencing satisfaction, 3 for neutral and 2 for somewhat
influencing satisfaction.
The mean (weighted average) and standard deviation were used to analyze the data from
the responses received as shown in Table 4.2.

32
Table 4.2 Factors influencing customer satisfaction.
No Factor N Mean Std deviation
1 communication materials 358 4.21 0.717
Fai
rly i
nfl
uen
cing s
atis
fact
ion
.
2 Timeliness 358 4.09 0.716
3 Willingness to help 358 4.02 0.812
4 Equipment 358 4.01 0.728
5 Understanding guest specific
needs
358 3.99 0.712
6 Physical facilities 358 3.98 0.721
7 Problem solving interest 358 3.98 0.871
8 Employee appearance 358 3.89 0.827
9 Accuracy of records 358 3. 82 0.672
10 Problem resolution time 358 3.78 0.712
11 Prompt attention to request 358 3.77 0.722
12 Flexibility of employees 358 3.77 0.672
13 Concern towards guests interests 358 3.77 0.672
14 Assurance ,safety and security 358 3.72 0.777
15 Individualized attention 358 3.72 0.621
16 Convenient operating hours 358 3.72 0.716
17 Personal attention from employees 358 3.62 0.711
18 courtesy of employees 358 3.61 0.726
19 Consistency of service 358 3.28 0.726
Neu
tral
20 Competence of employees 358 3.22 0.726
21 Efficient services 358 2.89 0.917
22 Behaviour of employees 358 2.87 0.716
Source: Research data (2014)
According to the researcher, those factors with a mean between 0.5 and 1.5 were not
influencing customer satisfaction, those factors with a mean greater than 1.6 but less than

33
2.5 were somewhat influencing customer satisfaction. From the respondents’ summary in
table 4.2 above, there was no score between 0.5 and 1.5 therefore all the factors
mentioned above influenced customer satisfaction fair extent. The factors with a mean
greater than 2.6 but less than 3.5 were neutral and they include, efficient services
(M=2.89),Consistency of service (M=3.28), Behavior of employees (M=2.87) and lastly
competence of employees (M=3.22).
The factors with a mean greater than 3.6 but less than 4.5 were fairly influencing
satisfaction. The factors that were found to be fairly satisfaction were,physical facilities
(M=3.98), equipment (M=4.01), employee appearance (M=3.89), communication
material(M=4.21), timeliness(M=4.09), Problem solving interest (M=3.98), Accuracy of
records (M=3.82), Problem resolution time (M=3.78), Prompt attention to request
(M=3.77), willingness to help (M=4.02), flexibility of employees (M=3.77) ,safety and
security (M=3.72), courtesy of employees (M=3.61), individualized attention (M=3.72),
convenient operating hours (M=3.72) ,personal attention from employees(M=3.62), and
lastly concern towards guests (M=3.77).
The factors with a mean greater than 4.6 would be termed as extremely influencing
customer satisfaction. There was no mean score greater than 4.6 hence it can be
extrapolated that none of the factors listed above were perceived to be extremely
influencing customer satisfaction.
The standard deviation was also used to analyze the responses. The higher the standard
deviation, the higher the level of dispersion among the respondents. The standard
deviation for all the factors listed was less than 1 meaning there was general consensus

34
by the respondents. A standard deviation of more than one would mean there was no
consensus among the respondents.
4.4 Relationship between Service Quality and Customer Satisfaction
The second objective of this study sought to examine the relationship between service
quality and customer satisfaction among hotels in Nairobi, Kenya. The following linear
regression model was adapted by the researcher to help determine the nature of the
relationship: y = 0 + 1XI + 2X2 + 3X3+ 4 X4 + 5X5 + : where y is the
dependent variable ( customer satisfaction), 0 is the constant (intercept), is are the
regression coefficients and x1,x2,x3,x4,x5 are tangibles, reliabilities, responsiveness,
assurance and empathy.
4.4.1 T Test for regression coefficients
Table 4.3: Regression coefficients of the five dimensions of service quality
Coefficients Std Error T-Stat P-value Lower 95 Upper 95
Intercept 6.3226 0.05 90.362 0.000 5.886 6.236
Tangibles x1 0.867 0.06 3.621 0.026 0.061 0.001
Reliability x2 0.916 0.05 2.601 0.362 0.521 0.026
Responsivenessx 3 0.865 0.08 4.261 0.891 0.143 0.013
Assurance x 4 0.813 0.04 4.193 0.026 0.261 0.124
Empathy x5 0.879 0.053 0.023 0.041 0.141 0.613
Source: Research data (2014)
From the research findings, the following values were obtained; 0 =6.322, 1=0.867,
2=0.916, 3=0.865, 4=0.813, 5=0.879.
The regression model can therefore be expressed as follows:
Y = 6.322 + 0.867XI + 0.916X2 + 0.865X3+ 0.813X4 + 0.879X5 +

35
Therefore:
Customer satisfaction = 6.322 + 0.867 Tangibles + 0.916 Reliability + 0.865
Responsiveness+ 0.813 Assurance + 0.879Empathy +
At 5% level of significance, three variables i.e. Tangibles, Assurance and Empathy were
statistically significance since their p-values were below the acceptable threshold of 0.05.
However, Reliability and Responsiveness were statistically insignificant since their p
values were above the acceptable threshold.
From the research findings, positive effect was found on all the dimensions of service
quality i.e. tangibles, reliability, responsiveness, assurance and empathy with regression
coefficients of 0.867, 0.916, 0.865, 0.813 and 0.879 respectively. These findings suggests
that a unit increase in tangible dimension, taking all the other variables constant at zero
would result to a 0.867 increase in customer satisfaction. Similarly, a unit increase in
reliability would result to a 0.916 increase in customer satisfaction. A unit increase in
responsiveness would result to a 0.865 increase in customer satisfaction.A unit increase
in assurance would result to a 0.813 increase in customer satisfaction. Finally, a unit
increase in Empathy would result to a 0.879 increase in customer satisfaction. These
findings also suggest that taking all variables constant at zero, the effect to customer
satisfaction would be 6.322.
These findings further indicate that reliability contributes most towards customer
satisfaction followed by Empathy, Tangibles and Responsiveness. Assurance was seen to
contribute the least. However, all the dimensions were highly rated by the respondents
and therefore the service industry cannot ignore any of the dimensions as they influence
customer satisfaction though at different levels.
36
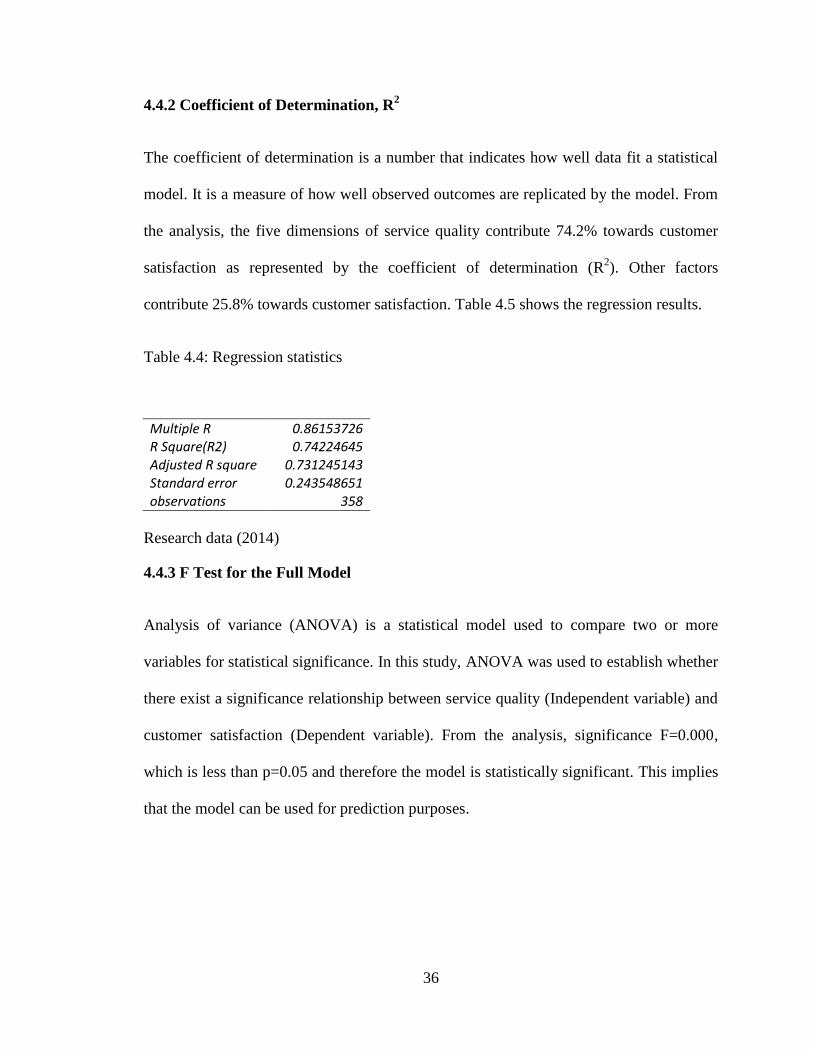
4.4.2 Coefficient of Determination, R2
The coefficient of determination is a number that indicates how well data fit a statistical
model. It is a measure of how well observed outcomes are replicated by the model. From
the analysis, the five dimensions of service quality contribute 74.2% towards customer
satisfaction as represented by the coefficient of determination (R2). Other factors
contribute 25.8% towards customer satisfaction. Table 4.5 shows the regression results.
Table 4.4: Regression statistics
Multiple R 0.86153726 R Square(R2) 0.74224645 Adjusted R square 0.731245143 Standard error 0.243548651 observations 358
Research data (2014)
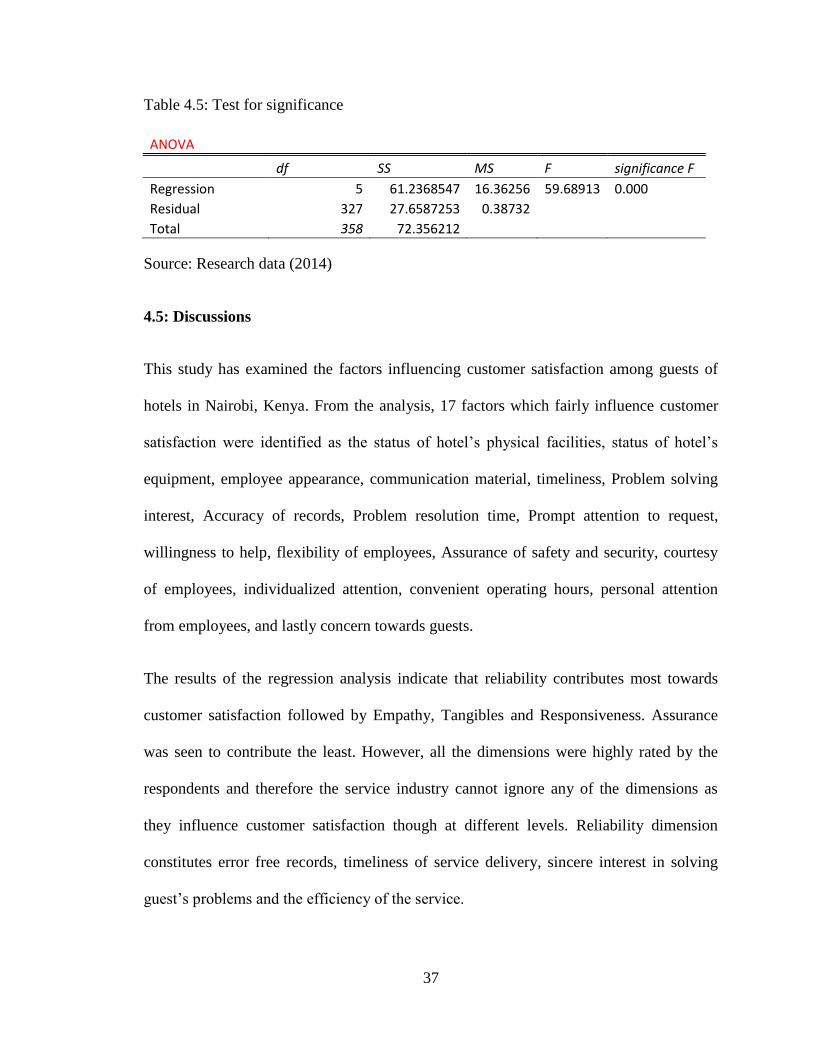
4.4.3 F Test for the Full Model
Analysis of variance (ANOVA) is a statistical model used to compare two or more
variables for statistical significance. In this study, ANOVA was used to establish whether
there exist a significance relationship between service quality (Independent variable) and
customer satisfaction (Dependent variable). From the analysis, significance F=0.000,
which is less than p=0.05 and therefore the model is statistically significant. This implies
that the model can be used for prediction purposes.
37
Table 4.5: Test for significance
ANOVA df SS MS F significance F
Regression 5 61.2368547 16.36256 59.68913 0.000 Residual 327 27.6587253 0.38732
Total 358 72.356212
Source: Research data (2014)
4.5: Discussions
This study has examined the factors influencing customer satisfaction among guests of
hotels in Nairobi, Kenya. From the analysis, 17 factors which fairly influence customer
satisfaction were identified as the status of hotel’s physical facilities, status of hotel’s
equipment, employee appearance, communication material, timeliness, Problem solving
interest, Accuracy of records, Problem resolution time, Prompt attention to request,
willingness to help, flexibility of employees, Assurance of safety and security, courtesy
of employees, individualized attention, convenient operating hours, personal attention
from employees, and lastly concern towards guests.
The results of the regression analysis indicate that reliability contributes most towards
customer satisfaction followed by Empathy, Tangibles and Responsiveness. Assurance
was seen to contribute the least. However, all the dimensions were highly rated by the
respondents and therefore the service industry cannot ignore any of the dimensions as
they influence customer satisfaction though at different levels. Reliability dimension
constitutes error free records, timeliness of service delivery, sincere interest in solving
guest’s problems and the efficiency of the service.

38
The results obtained were also statistically significant since the p-value for Tangibles,
Assurance and Empathy was <0.05. However, reliability and responsiveness registered a
p-value >0.05 and therefore were considered to be statistically insignificant. The results
of this study are consistent with the findings of Stromgren (2007), Musyoka (2013) and
Akoko (2012) who found out that reliability dimension has the highest impact on
customer satisfaction.

39
CHAPTER FIVE: SUMMARY, CONCLUSION AND
RECOMMENDATIONS
5.1 Introduction
This chapter is the synthesis of the entire study and presents a summary of findings,
conclusions drawn therefore and recommendations.
5.2 Summary of Findings
The study set out to examinefactors influencing customer satisfaction and the relationship
between service quality and customer satisfaction in rated hotels in Nairobi, Kenya.Data
was collected through a structured questionnaire which was issued to each respondent.
All the 358 questionnaires issued to the respondents were returned back resulting to a
100% response rate. From the analysis, the following findings were arrived at.
The results from the study show that there are 17 factors which fairly influence customer
satisfaction. These were the factors with a mean greater than 3.6 but less than 4.5 and
included,status of hotel’s physical facilities, status of hotel’s equipment, employee
appearance, communication material, timeliness, Problem solving interest, Accuracy of
records, Problem resolution time, Prompt attention to request, willingness to help,
flexibility of employees, Assurance of safety and security, courtesy of employees,
individualized attention, convenient operating hours, personal attention from employees,
and lastly concern towards guests.
The results further indicated that the status of communication materials, timeliness of
service, the willingness of the hotel employees to help guests, the status of hotel
40
equipment and understanding of guests specific needs were the top five factors in
influencing customer satisfaction. The factors with a mean greater than 4.6 would be
termed as extremely influencing customer satisfaction. However, there was no factor with
a mean greater than 4.6. Therefore, none of the factors listed above were perceived to be
extremely influencing customer satisfaction.These results therefore suggest that there
could be other factors that extremely influence customer satisfaction other than the 22
factors used in this study. Future studies should therefore explore the existence of these
factors.
Of the five dimensions of service quality used for the study, three were found to be
statistically significant with p-values of less than 0.05. These wereTangibles, Assurance
and Empathy. Reliability and Responsiveness were found to be statistically insignificant
since they had p-values greater than 0.05. The result of the regression analysis established
that all the five dimensions had a positive effect on customer satisfaction though at
varying degree. Reliability was found to have the greatest impact on customer
satisfaction followed by Empathy, Tangibles and Responsiveness. Assurance was seen to
contribute the least. All the five dimensions were highly rated by the respondents. This
means that service quality is strongly linked with customer satisfaction and the higher the
service quality, the higher the customer satisfaction. The results of this study are
consistent with the findings of Stromgren (2007), Musyoka (2013) and Akoko (2012)
who found out that reliability dimension has the highest impact on customer satisfaction.

41
5.3 Conclusion
This study set out to determine the factors influencing customer satisfaction and the
relationship between service quality and customer satisfaction. From the above findings,
17 factors fairly influencing customer satisfaction were identified. Of these factors, the
top five factors were identified as communication material, timeliness of service,
willingness to help, status of hotel equipment, Problem solving interest and status of
physical facilities. This implies that the hotels can improve the level of customer
satisfaction by committing more resources towards improving the factors with the highest
impact.
The results also show that the service quality dimensions have different impact in
influencing customer satisfaction. Reliability dimension was found to have the highest
impact followed by Empathy and Tangible. Responsiveness and Assurance were seen to
influence customer satisfaction the least. However, all the five dimensions were highly
rated and it was concluded that the rated Hotels offers high quality of services in all the
five major areas.
5.4. Recommendations
This study recommends that the 17 factors fairly influencing customer satisfaction should
be enhanced by all the hotels in Nairobi in order to increase guest’s satisfaction with their
services. The hotels should also enhance the five dimensions of service quality due to
their positive impact on customer satisfaction. When allocating resources, reliability
dimension should be given more allocation since it has the highest impact on customer
42
satisfaction. Similarly, the status of communication materials should also be emphasized
since it’s the main factor influencing customer satisfaction
5.5. Limitations of the study and suggestions for Further Research
The study had the following limitations. First, the study was conducted in Nairobi city
only hence its findings might not be generalized to all hotelsin Kenya. Thus future studies
should consider examining the same variables using morehotels that cuts across the
various major categorizations in terms of clients served, size and location. Second, the
study did not attempt to compare the views of the customers and those of employees in
terms of service quality. Thus future studies should try to check whether there is any gap
in ratings of customers and employees so that internal management can adjust their
strategies to remedy any gaps. Finally, the study did not find any factor extremely
influencing customer satisfaction. Thus future studies should try to check whether there
exist other factors which could extremely influence customer satisfaction.

43
REFERENCES
Akaka, K. (2012). Service quality dimensions and customer satisfaction in the Kenyan
telecommunications service industry: A case of Nokia Siemens Networks.
Atkinson, A. (1988). Answering the eternal question: What does the customer want? The
Cornell Hotel and Restaurant Administration Quarterly 29 (2).
Babakus, E. and Boller, G.W. (1992).An empirical assessment of the SERVQUAL scale.
Journal of business research, Vol. 26.
Bitner , M., Booms , B. H., & Mohr, L. A. (1994). Critical Service Encounters: The
Employee viewpoint.
Christine, M. (2009).Customer satisfaction in Hotels in Cape Town. Cape Peninsula
University of Technology.
Churchil, G.A. and Supernaut, J. (1982). An investigation into the determinants of
customer satisfaction, Journal of Marketing research.
C.N.KrishnaNaik, swapnaBhargovigantasala, Gantasala V. Prabhakar (2010). Service
quality (SERVQUAL) and its effects on customer satisfaction in retailing,
European journal of social sciences.Vol 16.
Cronin, J., & Taylor, S. A. (1994). SERVPERF versus SERVQUAL: reconciling
performance based and perceptions-minus-expectations measurement of service
quality. Journal of Marketing.
Crosby, P.B. (1979). Quality is free. New York: McGraw – Hill.
Glenn, D. (2009). Determining Sample Size.University of Florida.
44
Gronroos, C. (1990). Relationship approach to marketing in service contexts: The
marketing and organizational behavior interface, Journal of Business
Research, Vol. 20.
Johnston, R. and Silvestro, R., Fitzgerald, L. and Voss, C. (1990). Developing the
Determinants of Service Quality, in The Proceedings of the 1st International
ResearchSeminar in Service Management, La Londes les Maures.
Juran, J.M. (1988). Juran on planning for Quality. New York: Free press.
Juwaheer T.D., Ross, D.L. (2003). A study of hotel guest perceptions in Mauritius,
International Journal of Contemporary Hospitality Management, 15(2).
Ko King Lily Harr (2008). Service dimensions of service quality impacting customer
satisfaction of fine dining restaurants in Singapore. University of Nevada, Las
Vegas.
Kotler, P. & Armstrong, G. (1996).Principles of Marketing.Prentice. New Jersey.
Kotler& Keller, (2009). Framework for marketing management: 5th international
softcover edition.
Knutson, B. (1988). Frequent travellers: Making themhappy and bringing them back. The
Cornell Hotel and Restaurant Administration Quarterly 29 (1)
Knutson, B., P. Stevens, C. Wullaert, and M. Patton. (1991). LODGSERV: A service
quality index for the lodging industry. Hospitality Research Journal 14 (7).
Lawrence C. Voss (2006). The importance of customer satisfaction and cultural
influences in the European hospitality industry: A case study of a 4 star hotel

45
in Spain, Germany and England.
Lee, J. &Freick, L. (2000). The impact of switching costs on the customer satisfaction-
loyalty link: Mobile phone service in France. . Journal of Services Marketing, 35-48.
Magi, A., &Julander, C. (1996). Perceived service quality and customer satisfaction: An
empirical study of Swedish grocery. Journal of Retailing and consumer services, Vol.3
Manyi.J. (2011). The relationship between customer satisfaction and service quality: A
study of three service sectors in Umea.
Mburu, P. (2013). Determinants of Customer Satisfaction in the Kenyan Banking Industry.
European Journal of Business and Management.
Mitra, A. (2000). Fundamentals of Quality Control and Improvement (2nd Edition). India:
Prentice – Hall Private Ltd.
Musyoka, K. (2013). Service quality and library user satisfaction among universities in
Kenya.
Muna.S.,Lababedi. A. & Smith.T (2013). A time for Nairobi is a time for Africa.
OlleStromgren (2007). Analyzing service quality, a study among Peruvian resort hotels.
Lulea University of technology, Lima, Peru.
Otemba, A. (2012). Service Quality Dimensions And Customer Satisfaction In The Kenyan
Telecomunications Service Industry : A Case Of Nokia Siemens Networks.
Parasuraman, A., Zeithaml, V.A. & Berry L.L. (1985). A conceptual model of service
quality and its implications for further research, Journal of Marketing.
Vol.49

46
Parasuraman, A., Zeithaml, V.A., Berry, L.L. (1988). SERVQUAL: a multiple-item scale
for measuring consumer perceptions of service quality, Journal of Retailing.
Vol. 64
Parasuraman, A., Zeithaml, V.A. & Berry L.L. (1990). Delivering quality service –
balancing customer perceptions and expectations. New York: The Free Press.
Parasuraman, A., Berry L. L. and Zeithaml V. A. (1991), “Refinement and Reassessment of
the SERVQUAL Scale,” Journal of Retailing, Vol. 67, No. 4, 420-450
Parasuraman, A., Berry, L.L., and Zeithaml, V.A. (1994), “Reassessment of Expectations as
a Comparison of Standard in Measuring Service Quality: Implications for
Future Research”, Journal of Marketing, Vol.58, 111-124
Rowley, J. (1998). Quality measurement in the public sector: Some perspectives from the
service quality literature. Total Quality Measurement 9 (2/3).
Williams, C. et al (2003). Service quality in leisure and tourism.Buswell
Wallingford: CABI.
Zeithaml, V.A., and Bitner, M.J. (2003), “Service Marketing Integrating Customer Focus
across the Firm”, 3rd edition, United Kingdom, McGraw-Hill,

47
APPENDICES
Appendix 1: Definitions of the 18 determinants of service quality.
Determinant Description
Access The physical approachability of service location, including the ease of
finding one’s way around the service environment.
Aesthetics Extent to which the components of the service package are agreeable
or pleasing to the customer, including both the appearance and the
ambience of the service environment, the appearance and presentation
of service facilities, goods and staff.
Attentiveness/
helpfulness
The extent to which the service, particularly of contact staff, either
provides help to the customer or gives the impression of interest in the
customer and shows a willingness to serve.
Availability The availability of service facilities, staff and goods to the customer. I
Care The concern, consideration, sympathy and patience shown to the
customer.
Cleanliness/
tidiness
The cleanliness, neat and tidy appearance of the tangible components
of the service package, including the service environment, facilities,
goods and contact staff.
Comfort The physical comfort of the service environment and facilities
Commitment Staff’s apparent commitment to their work, including the pride and
satisfaction they apparently take in their job, their diligence and
thoroughness.
Communication The ability of the service providers to communicate with the customer
in a way he or she will understand.
Competence The skill, expertise and professionalism with which the service is
executed.
Courtesy The politeness, respect and propriety shown by the service, usually
contact staff, in dealing with the customer and his or her property.
Flexibility A willingness and ability on the part of the service worker to amend or

48
alter the nature of the service or product to meet the needs of the
customer.
Friendliness The warmth and personal approachability of the service providers,
particularly of contact staff, including cheerful attitude and the ability
to make the customer feel welcome.
Functionality The serviceability and fitness for purpose or “product quality” of
service facilities and goods.
Integrity The honesty, justice, fairness and trust with which customers are
treated by the service organization
Reliability The reliability and consistency of performance of service facilities,
goods and staff.
Responsiveness Speed and timeliness of service delivery.
Security Personal safety of the customer and his or her possessions while
participating in or benefiting from the service process.
Source: Johnston and Silvestro (1990)

49
Appendix 2: Projected occupancy rate for Nairobi Hotels from 2009 to 2018
Source: http://www.hvs.com

50
Appendix 3: Number of star rated hotels in Nairobi and respective bed capacity
Hotel Category Number
of Beds
Number of
Guests with
average
occupancy of
55%
Percentage
of the
sample
Number
of
samples
No Five Star Hotels
1 Hotel Intercontinental 770 424 12% 45
2 Laico Regency Hotel 388 213 6% 22
3 Hilton Hotel 353 194 6% 20
4 The Norfolk Hotel 334 184 5% 19
5 Nairobi Serena 283 156 5% 16
6 The Stanley 434 239 7% 25
7 Safari Park Hotel 285 157 5% 17
Three Star Hotels
1 The Bounty Hotel 100 55 2% 6
2 Fair View Hotel 163 90 3% 9
3 Marble Arch Hotel 77 42 1% 4
4 Landmark Hotel 242 133 4% 14
5 Holiday Inn 342 188 6% 20
6 Windsor Golf Country
club
260 143 4% 15
7 Nairobi Safari Club 282 155 5% 16
8 Utalii Hotel 105 58 2% 6
9 Ambassadeur Hotel 190 105 3% 11
Two Star Hotels
1 Panafric Hotel 46 25 1% 3
2 Silver Spring Hotel 188 103 3% 11
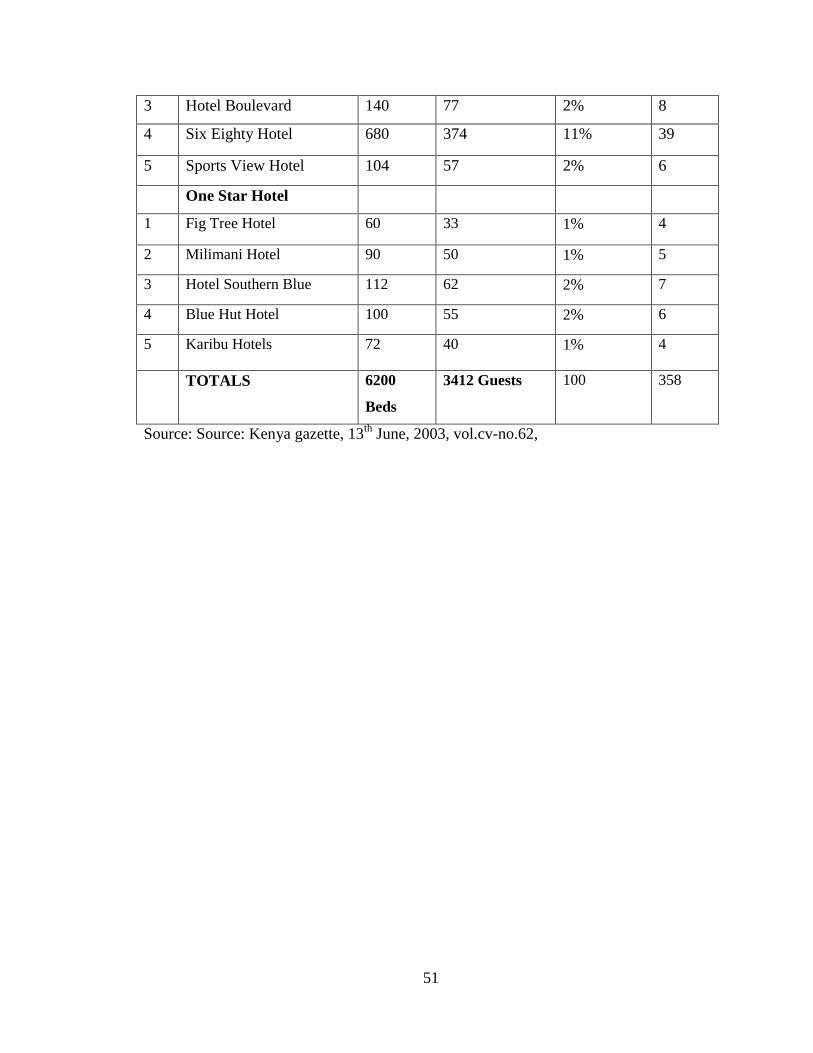
51
3 Hotel Boulevard 140 77 2% 8
4 Six Eighty Hotel 680 374 11% 39
5 Sports View Hotel 104 57 2% 6
One Star Hotel
1 Fig Tree Hotel 60 33 1% 4
2 Milimani Hotel 90 50 1% 5
3 Hotel Southern Blue 112 62 2% 7
4 Blue Hut Hotel 100 55 2% 6
5 Karibu Hotels 72 40 1% 4
TOTALS 6200
Beds
3412 Guests 100 358
Source: Source: Kenya gazette, 13th
June, 2003, vol.cv-no.62,
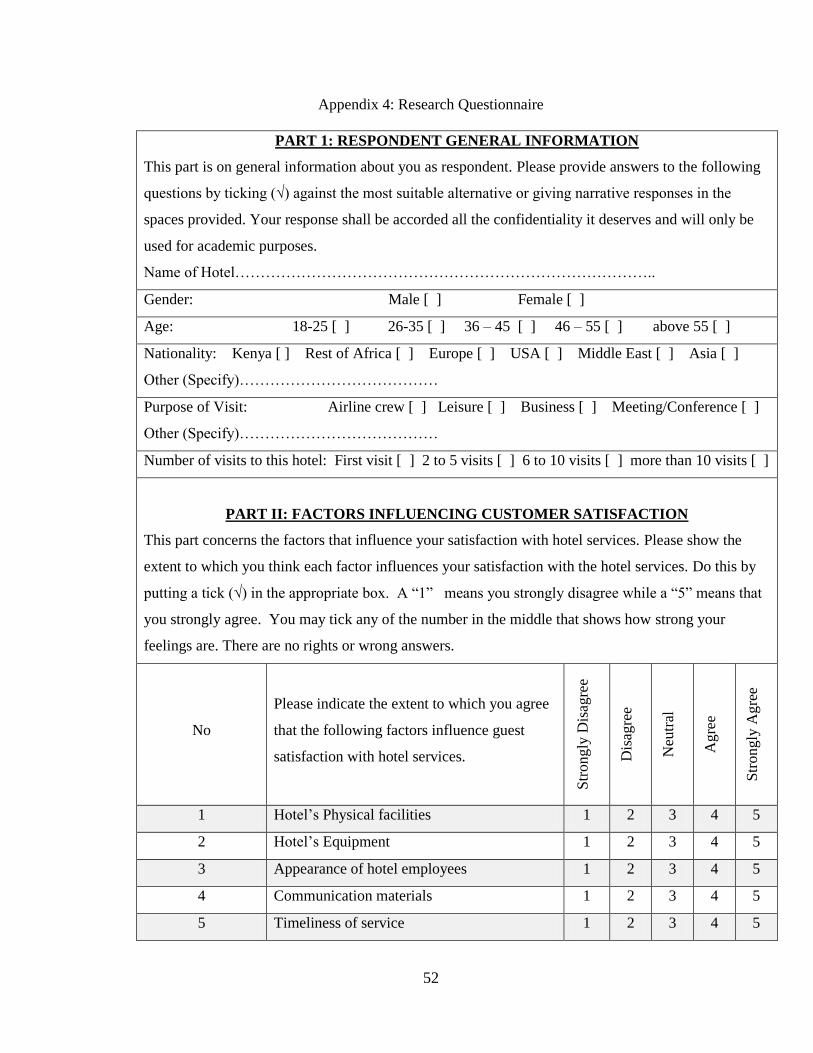
52
Appendix 4: Research Questionnaire
PART 1: RESPONDENT GENERAL INFORMATION
This part is on general information about you as respondent. Please provide answers to the following
questions by ticking (√) against the most suitable alternative or giving narrative responses in the
spaces provided. Your response shall be accorded all the confidentiality it deserves and will only be
used for academic purposes.
Name of Hotel………………………………………………………………………..
Gender: Male [ ] Female [ ]
Age: 18-25 [ ] 26-35 [ ] 36 – 45 [ ] 46 – 55 [ ] above 55 [ ]
Nationality: Kenya [ ] Rest of Africa [ ] Europe [ ] USA [ ] Middle East [ ] Asia [ ]
Other (Specify)…………………………………
Purpose of Visit: Airline crew [ ] Leisure [ ] Business [ ] Meeting/Conference [ ]
Other (Specify)…………………………………
Number of visits to this hotel: First visit [ ] 2 to 5 visits [ ] 6 to 10 visits [ ] more than 10 visits [ ]
PART II: FACTORS INFLUENCING CUSTOMER SATISFACTION
This part concerns the factors that influence your satisfaction with hotel services. Please show the
extent to which you think each factor influences your satisfaction with the hotel services. Do this by
putting a tick (√) in the appropriate box. A “1” means you strongly disagree while a “5” means that
you strongly agree. You may tick any of the number in the middle that shows how strong your
feelings are. There are no rights or wrong answers.
No
Please indicate the extent to which you agree
that the following factors influence guest
satisfaction with hotel services.
Str
ongly
Dis
agre
e
Dis
agre
e
Neu
tral
Agre
e
Str
ongly
Ag
ree
1 Hotel’s Physical facilities 1 2 3 4 5
2 Hotel’s Equipment 1 2 3 4 5
3 Appearance of hotel employees 1 2 3 4 5
4 Communication materials 1 2 3 4 5
5 Timeliness of service 1 2 3 4 5

53
6 Problem solving interest 1 2 3 4 5
7 Efficient service 1 2 3 4 5
8 Consistency of service 1 2 3 4 5
9 Accuracy of records 1 2 3 4 5
10 Problem resolution time 1 2 3 4 5
11 Prompt attention to guest’s requests 1 2 3 4 5
12 Willingness to help 1 2 3 4 5
13 Flexibility of employees 1 2 3 4 5
14 Behavior of employees 1 2 3 4 5
15 Safety and security 1 2 3 4 5
16 Courtesy of employees 1 2 3 4 5
17 Competence of employees 1 2 3 4 5
18 Individualized attention 1 2 3 4 5
19 Convenient operating hours
1 2 3 4 5
20 Personal attention from employees
1 2 3 4 5
21 Concern towards guest interest 1 2 3 4 5
22 Understanding guest specific needs
1 2 3 4 5
PART III: PERCEPTION ON THE QUALITY OF SERVICE
This part concerns how you feel about aspects of service quality levels at the hotel. Please tick (√) in
the appropriate box to show the extent to which you believe the hotel has features described by the
statement. A “1” means you strongly disagree while a “5” means that you strongly agree. You may
tick any of the number in the middle that shows how strong your feelings are.
Dimension of
service quality
Please indicate the extent to which you
agree with the following statements
Str
on
gly
Dis
agre
e
Dis
agre
e
Neu
tral
Agre
e
Str
on
gly
Agre
e
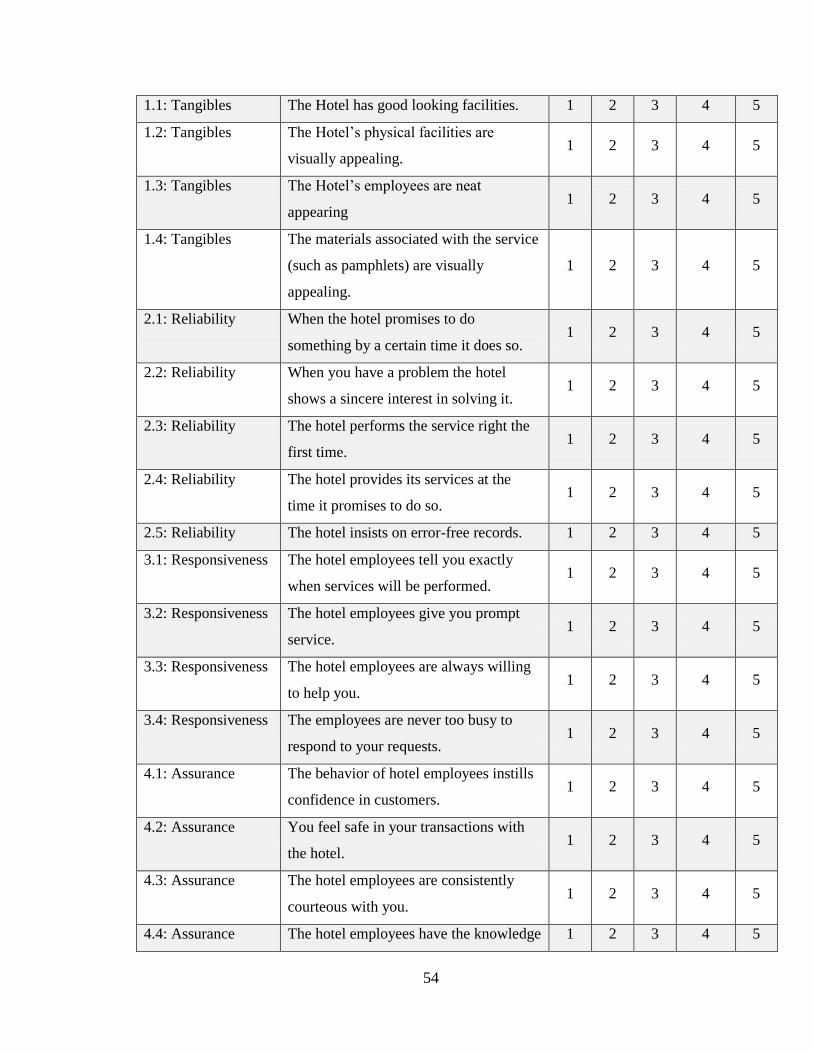
54
1.1: Tangibles The Hotel has good looking facilities. 1 2 3 4 5
1.2: Tangibles The Hotel’s physical facilities are
visually appealing. 1 2 3 4 5
1.3: Tangibles The Hotel’s employees are neat
appearing 1 2 3 4 5
1.4: Tangibles The materials associated with the service
(such as pamphlets) are visually
appealing.
1 2 3 4 5
2.1: Reliability When the hotel promises to do
something by a certain time it does so. 1 2 3 4 5
2.2: Reliability When you have a problem the hotel
shows a sincere interest in solving it. 1 2 3 4 5
2.3: Reliability The hotel performs the service right the
first time. 1 2 3 4 5
2.4: Reliability The hotel provides its services at the
time it promises to do so. 1 2 3 4 5
2.5: Reliability The hotel insists on error-free records. 1 2 3 4 5
3.1: Responsiveness The hotel employees tell you exactly
when services will be performed. 1 2 3 4 5
3.2: Responsiveness The hotel employees give you prompt
service. 1 2 3 4 5
3.3: Responsiveness The hotel employees are always willing
to help you. 1 2 3 4 5
3.4: Responsiveness The employees are never too busy to
respond to your requests. 1 2 3 4 5
4.1: Assurance The behavior of hotel employees instills
confidence in customers. 1 2 3 4 5
4.2: Assurance You feel safe in your transactions with
the hotel. 1 2 3 4 5
4.3: Assurance The hotel employees are consistently
courteous with you. 1 2 3 4 5
4.4: Assurance The hotel employees have the knowledge 1 2 3 4 5

55
to answer your questions.
5.1: Empathy The hotel gives you individual attention. 1 2 3 4 5
5.2: Empathy The hotel’s operating hours are
convenient to its customers. 1 2 3 4 5
5.3: Empathy The hotel has employees who give you
personal attention. 1 2 3 4 5
5.4: Empathy The hotel has your best interest at heart. 1 2 3 4 5
5.5: Empathy The hotel employees understand your
specific needs. 1 2 3 4 5
Source: Cronin and Taylor (1992)