Embed Size (px)
Citation preview
Michael zur Muehlen, Danny T. HoCenter of Excellence in Business Process Innovation
Howe School of Technology ManagementStevens Institute of Technology
Castle Point on HudsonHoboken, NJ 07030, USA
{mzurmuehlen|tho2}@stevens.edu
CEBPITechnical Report 2007-07
Center of Excellence in Business Process Innovation
Stevens Institute of Technology, Hoboken, Nj
http://howe.stevens.edu/bpm
Service Process Innovation: BPMN
in Practice
Service Process Innovation: A Case Study of BPMN in Practice
Michael zur Muehlen and Danny T. HoStevens Institute of Technology
Hoboken, NJ, USA{mzurmuehlen | tho2}@stevens.edu
AbstractWe describe the application of the Business Process
Modeling Notation to the redesign of a service management process in a truck dealership in the N.E. US. After the deployment of a new service management system did not lead to the expected efficiency gains the authors were asked to analyze the as-is service process, make suggestions for improvement, and simulate the financial impact of the proposed changes. The as-is and to-be process were documented in BPMN, and a BPMN-based simulation tool was used to quantify the effects of process improvement.
As an outcome of this project we developed an initial subset of BPMN constructs that were a useful starting point for modeling in a process-unaware domain with members of the surveyed organization. We found that the deliberate modification of BPMN constructs allows for the highlighting of common process weaknesses, and we show how an analytical process model changes when it is modified to serve as a simulation models.
1. Motivation
The continual effort of organizations to improve operational efficiency and effectiveness has been well documented in the literature [10]. The analysis and improvement of business process is a core part of these improvement activities, since it allows companies to identify unnecessary work steps, refine task responsibilities, clarify the alignment of supporting technology with organizational processes, and develop a roadmap for improvement [5, 9, 20].
Radical reengineering projects in the mid-1990s had a high failure rate, and have since been succeeded by more participatory, incremental improvement initiatives. While early BPR projects focused on the potential efficiency gains of information technology (organization follows technology), the project we report on in this paper was focused on organizational process improvement, and changes in information technology were considered after the overall process structure was accepted by the affected staff members (technology follows organization).
A multitude of graphical notations for the diagrammatic description of processes exist (for a survey
see for example [13]). While some notations have been developed by standardization groups or open consortia (such as IDEF, UML Activity Diagrams, Petri-Nets, Merise, or ISO 87), many business process notations are closely tied to the software tools used to create process diagrams (e.g. ARIS for EPC [19] or FlowCharts for ABC FlowCharter). This leads to a lack of model comparability across organizations and industries, as many BPM improvement projects rely on the notation recommended by consultants or tool vendors. In February 2006 the Object Management Group ratified the initial specification of the Business Process Management Notation (BPMN) [15], a proposed standard for the graphical representation of business process models. BPMN was derived from UML Activity Diagrams and extends the semantics of Activity Diagrams with capabilities to represent different types of events, exceptions, and transactions, among others. Since the publication of the initial BPMN specification it has found widespread adoption in industry (the BPMN.org site lists 43 available implementations of the standard). In this paper we report on a case study where BPMN was applied to the redesign of a service process in the automotive industry in North America. We found that a small subset of the overall BPMN constructs is sufficient to create a first model for discussions with clients, that the deliberate modification of BPMN constructs can help visualize process weaknesses, and illustrate the process that lead us from developing an as-is, a to-be, and a simulation model.
Our research approach follows the tradition of action research [4] in that the authors of this study were simultaneously actors in the redesign project they report on. We documented our progress in the project through written notes, voice recordings, and design artifacts. The resulting rich dataset allows us to point out qualitative findings of the case study, as proposed by Eisenhardt [6].
The remainder of this paper is structured as follows: In section two we introduce the organization where the case study took place and give some background on the case study. In section three we describe the information gathering and as-is modeling phase. In section four we describe the identification of process improvements and the development of the to-be model. In the following section we discuss the development of a simulation model that was used to quantify the effects of improvement. We
conclude this paper with a summary of our findings and an outlook on the future of the project.
2. Case Background
2.1. The Case Study Company
The case study company (denoted as SCF) has served as a franchisee for Freightliner, the largest truck manufacturer in the United States, since 1963. It serves the northeast United States from a high-traffic location along an Interstate. In 2006 the family-run business was acquired by a group of investors and a substantial business improvement program was put into place. One reason for the acquisition was a generational transition in ownership; the other was a necessary change from the traditional family operated to a more professional management structure and corporate approaches in marketing, sales, and finance.
Since the organization had been run as a family business for more than 40 years many work practices had been ingrained in the organizational culture, which put a focus on local efficiencies, but led to a lack of a coordinating view of the enterprise.
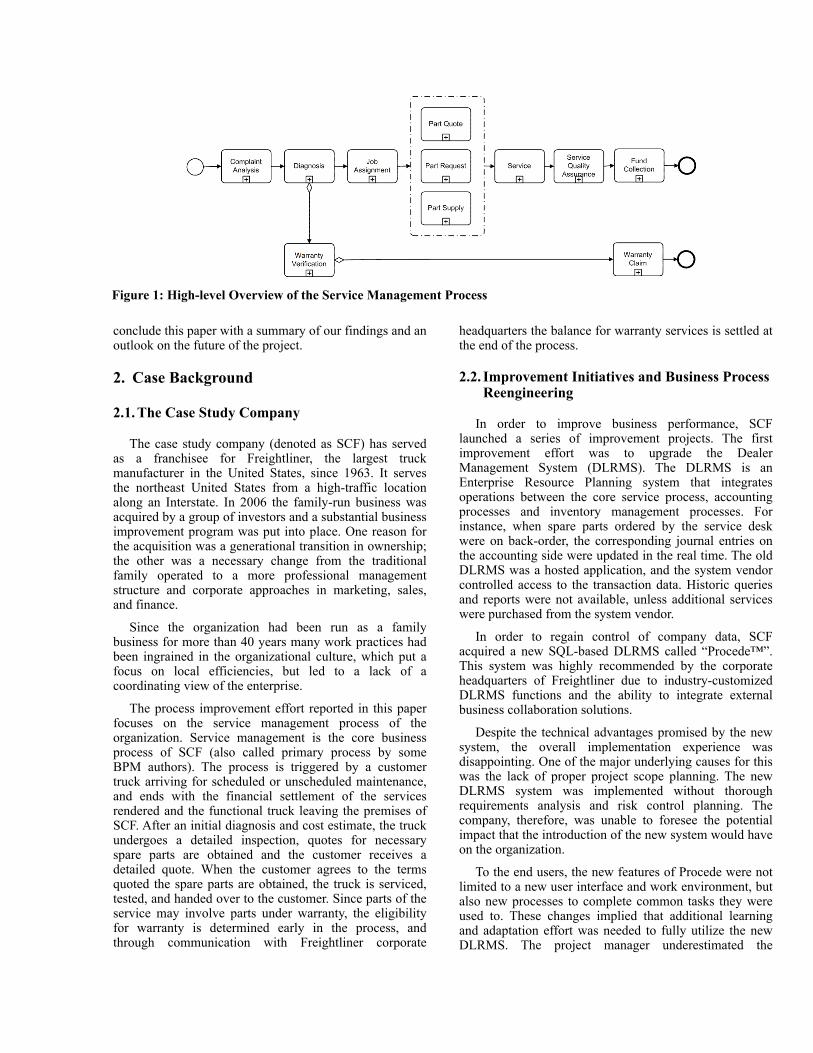
The process improvement effort reported in this paper focuses on the service management process of the organization. Service management is the core business process of SCF (also called primary process by some BPM authors). The process is triggered by a customer truck arriving for scheduled or unscheduled maintenance, and ends with the financial settlement of the services rendered and the functional truck leaving the premises of SCF. After an initial diagnosis and cost estimate, the truck undergoes a detailed inspection, quotes for necessary spare parts are obtained and the customer receives a detailed quote. When the customer agrees to the terms quoted the spare parts are obtained, the truck is serviced, tested, and handed over to the customer. Since parts of the service may involve parts under warranty, the eligibility for warranty is determined early in the process, and through communication with Freightliner corporate
headquarters the balance for warranty services is settled at the end of the process.
2.2. Improvement Initiatives and Business Process Reengineering
In order to improve business performance, SCF launched a series of improvement projects. The first improvement effort was to upgrade the Dealer Management System (DLRMS). The DLRMS is an Enterprise Resource Planning system that integrates operations between the core service process, accounting processes and inventory management processes. For instance, when spare parts ordered by the service desk were on back-order, the corresponding journal entries on the accounting side were updated in the real time. The old DLRMS was a hosted application, and the system vendor controlled access to the transaction data. Historic queries and reports were not available, unless additional services were purchased from the system vendor.
In order to regain control of company data, SCF acquired a new SQL-based DLRMS called “Procede™”. This system was highly recommended by the corporate headquarters of Freightliner due to industry-customized DLRMS functions and the ability to integrate external business collaboration solutions.
Despite the technical advantages promised by the new system, the overall implementation experience was disappointing. One of the major underlying causes for this was the lack of proper project scope planning. The new DLRMS system was implemented without thorough requirements analysis and risk control planning. The company, therefore, was unable to foresee the potential impact that the introduction of the new system would have on the organization.
To the end users, the new features of Procede were not limited to a new user interface and work environment, but also new processes to complete common tasks they were used to. These changes implied that additional learning and adaptation effort was needed to fully utilize the new DLRMS. The project manager underestimated the
Figure 1: High-level Overview of the Service Management Process
importance of the learning and adaptation process significantly. This became evident when the 10-week training program offered by system vendor was reduced to 4 weeks. The compressed program did not allow the employees to develop the required skill sets before the system went live. The absence of basic system navigation and data entry skills severely lowered the productivity of the departments working with the DLRMS in the first couple of months after the implementation.
In addition to replacing the old DLRMS, SCF also sought to implement best practice procedures in dealership operations from the Freightliner headquarters. Consequently, a Freightliner after market team was hired to provide consultancy services that are available exclusively to Freightliner franchisees. Key Performance Indicators (KPIs) were evaluated and compared to the industrial average of similar truck dealerships. As a result of the KPI evaluation, the after market team prepared a report with suggestions as to which improvement objectives SCF should focus on. However, the suggestions merely specified for SCF what needed to improve, but they did not provide guidance on how these improvement objectives could be attained.
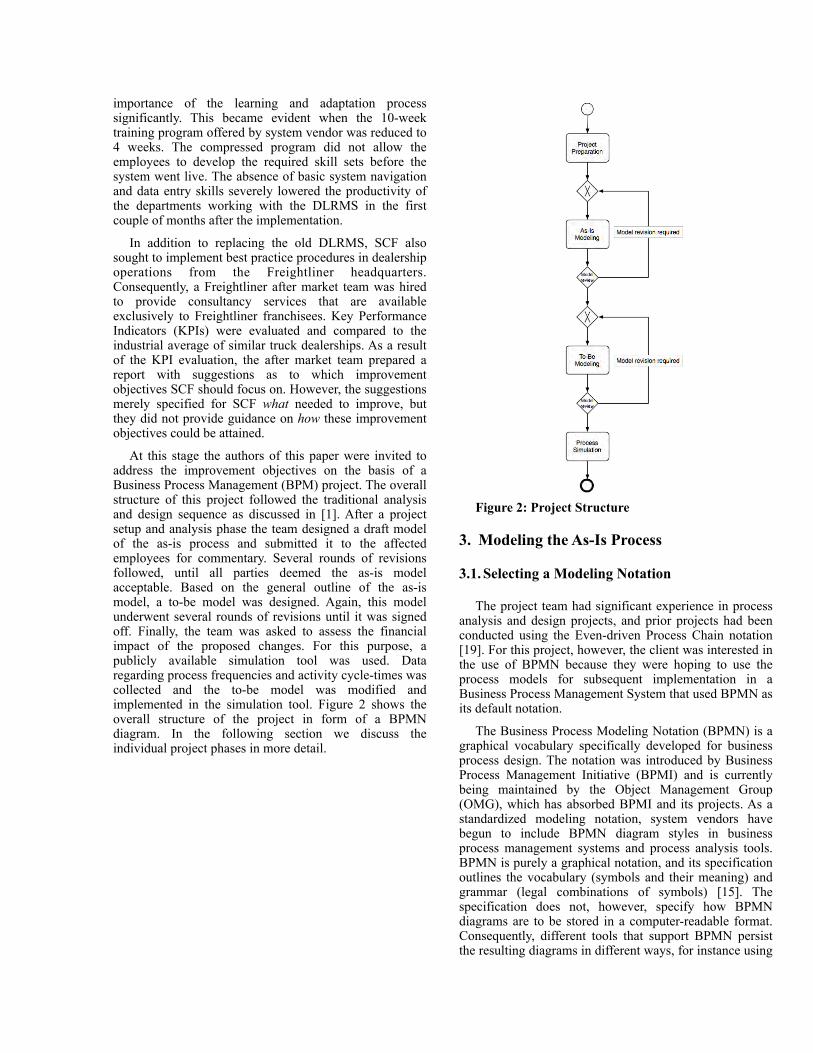
At this stage the authors of this paper were invited to address the improvement objectives on the basis of a Business Process Management (BPM) project. The overall structure of this project followed the traditional analysis and design sequence as discussed in [1]. After a project setup and analysis phase the team designed a draft model of the as-is process and submitted it to the affected employees for commentary. Several rounds of revisions followed, until all parties deemed the as-is model acceptable. Based on the general outline of the as-is model, a to-be model was designed. Again, this model underwent several rounds of revisions until it was signed off. Finally, the team was asked to assess the financial impact of the proposed changes. For this purpose, a publicly available simulation tool was used. Data regarding process frequencies and activity cycle-times was collected and the to-be model was modified and implemented in the simulation tool. Figure 2 shows the overall structure of the project in form of a BPMN diagram. In the following section we discuss the individual project phases in more detail.
Figure 2: Project Structure
3. Modeling the As-Is Process
3.1. Selecting a Modeling Notation
The project team had significant experience in process analysis and design projects, and prior projects had been conducted using the Even-driven Process Chain notation [19]. For this project, however, the client was interested in the use of BPMN because they were hoping to use the process models for subsequent implementation in a Business Process Management System that used BPMN as its default notation.
The Business Process Modeling Notation (BPMN) is a graphical vocabulary specifically developed for business process design. The notation was introduced by Business Process Management Initiative (BPMI) and is currently being maintained by the Object Management Group (OMG), which has absorbed BPMI and its projects. As a standardized modeling notation, system vendors have begun to include BPMN diagram styles in business process management systems and process analysis tools. BPMN is purely a graphical notation, and its specification outlines the vocabulary (symbols and their meaning) and grammar (legal combinations of symbols) [15]. The specification does not, however, specify how BPMN diagrams are to be stored in a computer-readable format. Consequently, different tools that support BPMN persist the resulting diagrams in different ways, for instance using
the XML Process Definition Language (XPDL). More recently, the Object Management Group has ratified a Business Process Definition Metamodel that will allow for BPMN models to be rendered in the XML Model Interchange (XMI) format defined by the Object Management Group. In our particular case we chose to model the BPMN diagrams in Microsoft Visio, using an open-source BPMN template. Due to the limited number of modelers and processes to be modeled a repository-based tool was deemed as not cost-effective.
While a number of competing storage formats exist, the choice of BPMN as a modeling language had several advantages. The increasing support for BPMN diagram styles in process modeling tools will ultimately lead to the more widespread availability of industry reference models in BPMN. Since inter-organizational collaboration depends on a common understanding of the business context by all parties involved, the choice of a standard notation is likely to help partnerships along the supply chain as the models become the best communication tool for business collaboration. From the design point of view, using a standardized language facilitates the understanding of models by information providers, modelers, and model users. Consequently, it facilitates the consolidation of cross-enterprise processes. Since tool vendors increasingly support BPMN, adopters have more options to select the most suitable process management tool for their project.
Besides the practical implications of BPMN, the expressiveness of the language had to meet the requirements of the proposed project. The expressive power of modeling languages can be evaluated using an ontological approach as proposed in [8]. The expressiveness of BPMN was examined and verified by Recker et al. [17]. Since BPMN provides a rich set of symbols, it can represent many real-world constructs intuitively, and its design guidelines facilitate the learning of process design and improve the communication quality between the consultants and the process participants.
The selection of the modeling language is but one step in the preparation of a process modeling project, and in previous work we have found that the modeling language is not the most critical aspect of a process modeling project [16]. Independent of the notation chosen, certain design guidelines had to be put in place to ensure that the resulting models were consistent and comparable. We followed the Guidelines of Modeling in the setup of the project, naming conventions for activities, and placement of symbols on the modeling canvas [2].
3.2. Collecting Information
The process analysis project at SCF was the first of its kind, i.e. there had been no prior attempt to document or manage the service process performance. Since no documentation existed, the as-is process model had to be designed from scratch. As the quality of models depends on the quality of underlying input data, a number of
interviews with key stakeholders were conducted to identify the major activities of the service management process. The key stakeholders were involved in the operation of the service management process. Except for a number of individuals at the executive level, at least two performers for each particular business role were interviewed to ensure the validity of individual answers and to ensure quality. The interviews were conducted in a semi-structured fashion using a set of seed questions. Examples for these questions were:‣ What is your role in the company?
‣ What do you do in your daily work?
‣ How frequently do you perform these tasks?
‣ Who do you have to contact in the work?
‣ How much do you know about the service management process?
‣ What do you like or dislike about your current work environment?
The interviews were recorded in either text documents or using voice tapes. Voice recording was used carefully with the permissions of the interviewees. Eventually, all interview documents were transcribed in text format.
3.3. Refining the Process
The authors started to sketch out the process map as soon as the interview documents became available. Over a period of six weeks, the as-is process was refined in a total of twelve iterations. During these iterations the process was refined in a top-down fashion. Starting from a sparsely populated diagram with collapsed subprocess symbols for each major activity, the overall structure of the process was identified. Following this, each of the major activities was refined and worked out in detail. One of the major challenges in this phase was the identification of the actual process flow in situations where the corporate policies were vague. In several situations individual interviewees reported a different process structure, because they performed the same process differently.
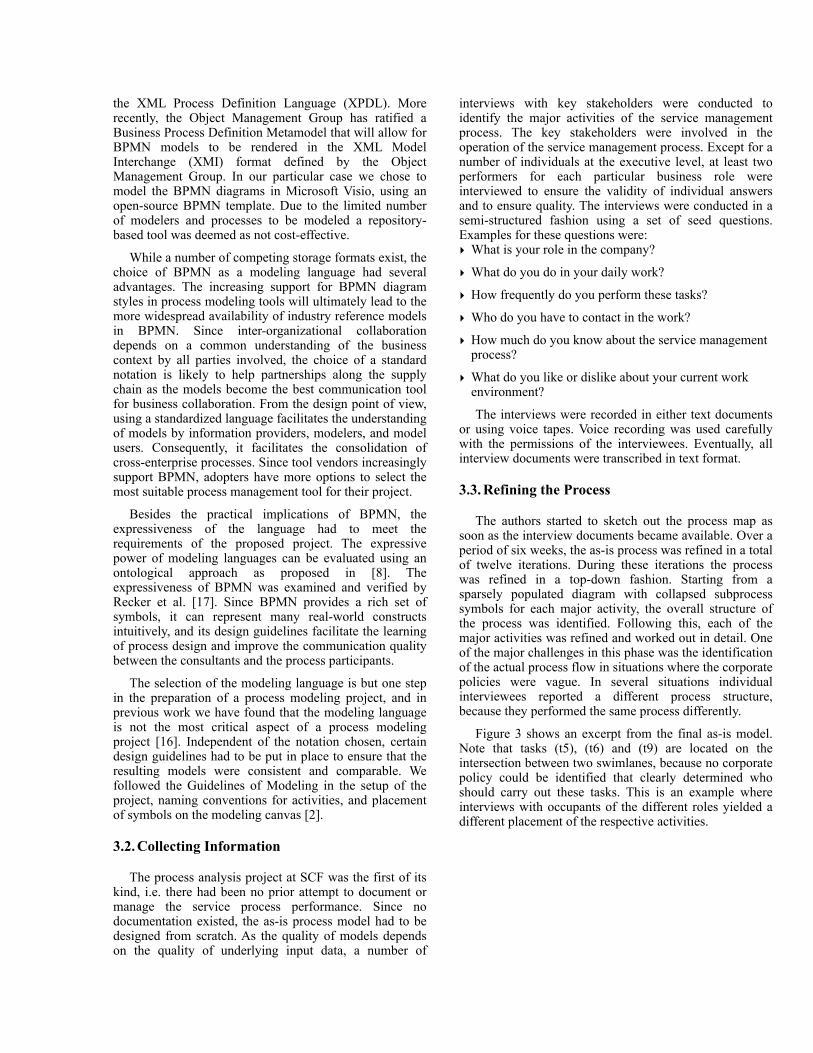
Figure 3 shows an excerpt from the final as-is model. Note that tasks (t5), (t6) and (t9) are located on the intersection between two swimlanes, because no corporate policy could be identified that clearly determined who should carry out these tasks. This is an example where interviews with occupants of the different roles yielded a different placement of the respective activities.
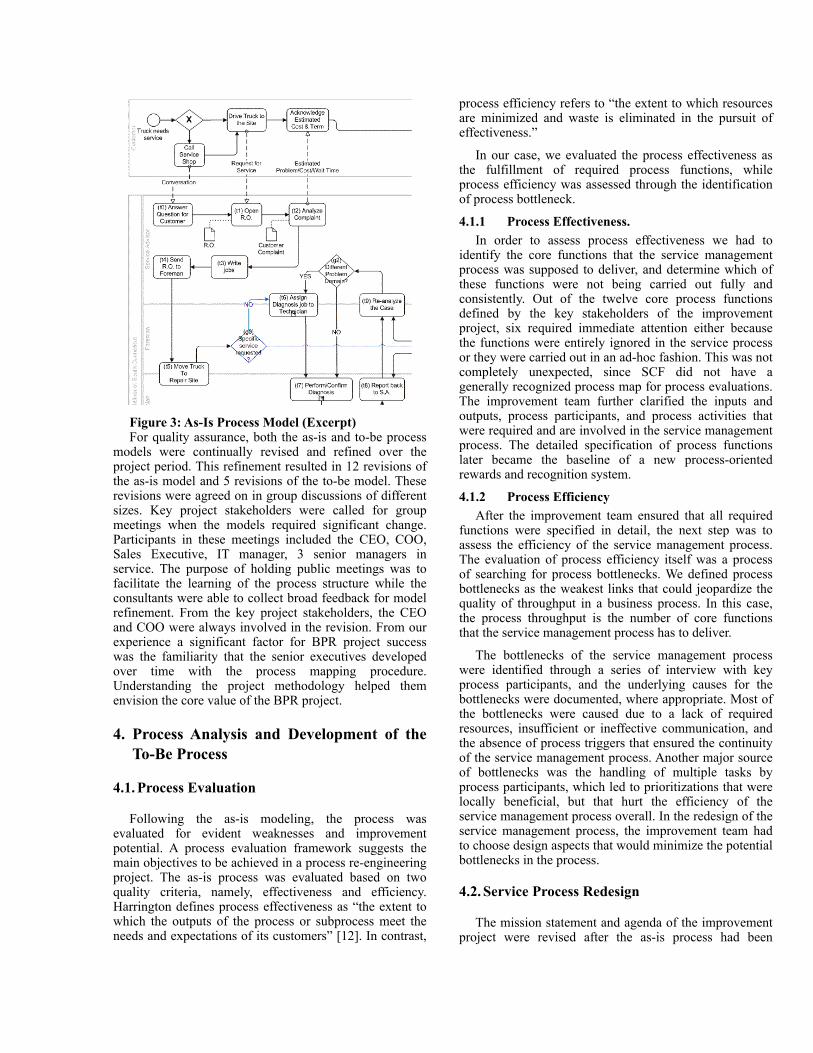
Figure 3: As-Is Process Model (Excerpt)For quality assurance, both the as-is and to-be process
models were continually revised and refined over the project period. This refinement resulted in 12 revisions of the as-is model and 5 revisions of the to-be model. These revisions were agreed on in group discussions of different sizes. Key project stakeholders were called for group meetings when the models required significant change. Participants in these meetings included the CEO, COO, Sales Executive, IT manager, 3 senior managers in service. The purpose of holding public meetings was to facilitate the learning of the process structure while the consultants were able to collect broad feedback for model refinement. From the key project stakeholders, the CEO and COO were always involved in the revision. From our experience a significant factor for BPR project success was the familiarity that the senior executives developed over time with the process mapping procedure. Understanding the project methodology helped them envision the core value of the BPR project.
4. Process Analysis and Development of the To-Be Process
4.1. Process Evaluation
Following the as-is modeling, the process was evaluated for evident weaknesses and improvement potential. A process evaluation framework suggests the main objectives to be achieved in a process re-engineering project. The as-is process was evaluated based on two quality criteria, namely, effectiveness and efficiency. Harrington defines process effectiveness as “the extent to which the outputs of the process or subprocess meet the needs and expectations of its customers” [12]. In contrast,
process efficiency refers to “the extent to which resources are minimized and waste is eliminated in the pursuit of effectiveness.”
In our case, we evaluated the process effectiveness as the fulfillment of required process functions, while process efficiency was assessed through the identification of process bottleneck.
4.1.1 Process Effectiveness. In order to assess process effectiveness we had to
identify the core functions that the service management process was supposed to deliver, and determine which of these functions were not being carried out fully and consistently. Out of the twelve core process functions defined by the key stakeholders of the improvement project, six required immediate attention either because the functions were entirely ignored in the service process or they were carried out in an ad-hoc fashion. This was not completely unexpected, since SCF did not have a generally recognized process map for process evaluations. The improvement team further clarified the inputs and outputs, process participants, and process activities that were required and are involved in the service management process. The detailed specification of process functions later became the baseline of a new process-oriented rewards and recognition system.
4.1.2 Process Efficiency After the improvement team ensured that all required
functions were specified in detail, the next step was to assess the efficiency of the service management process. The evaluation of process efficiency itself was a process of searching for process bottlenecks. We defined process bottlenecks as the weakest links that could jeopardize the quality of throughput in a business process. In this case, the process throughput is the number of core functions that the service management process has to deliver.
The bottlenecks of the service management process were identified through a series of interview with key process participants, and the underlying causes for the bottlenecks were documented, where appropriate. Most of the bottlenecks were caused due to a lack of required resources, insufficient or ineffective communication, and the absence of process triggers that ensured the continuity of the service management process. Another major source of bottlenecks was the handling of multiple tasks by process participants, which led to prioritizations that were locally beneficial, but that hurt the efficiency of the service management process overall. In the redesign of the service management process, the improvement team had to choose design aspects that would minimize the potential bottlenecks in the process.
4.2. Service Process Redesign
The mission statement and agenda of the improvement project were revised after the as-is process had been
evaluated. Although SCF had come to an agreement on what needed to be improved, there was still uncertainty as to how these changes would be realized.
A number of procedures for the redesign of business processes have been proposed in the literature. Hammer and Champy recommended 17 general principles for process reengineering in their BPR book [11]. Although these principles were thought provoking, they were not specified in much detail, much less empirically validated. Subsequently, a number of researchers proposed transformation methods for BPR projects, e.g. [3]. To extend these efforts, Reijers et al. consolidated 28 best practices of business process design based on literature reviews and lessons learned from consulting projects [14, 18]. These best practices were packaged in reusable patterns and assigned to different application levels of process design (compare table 1).
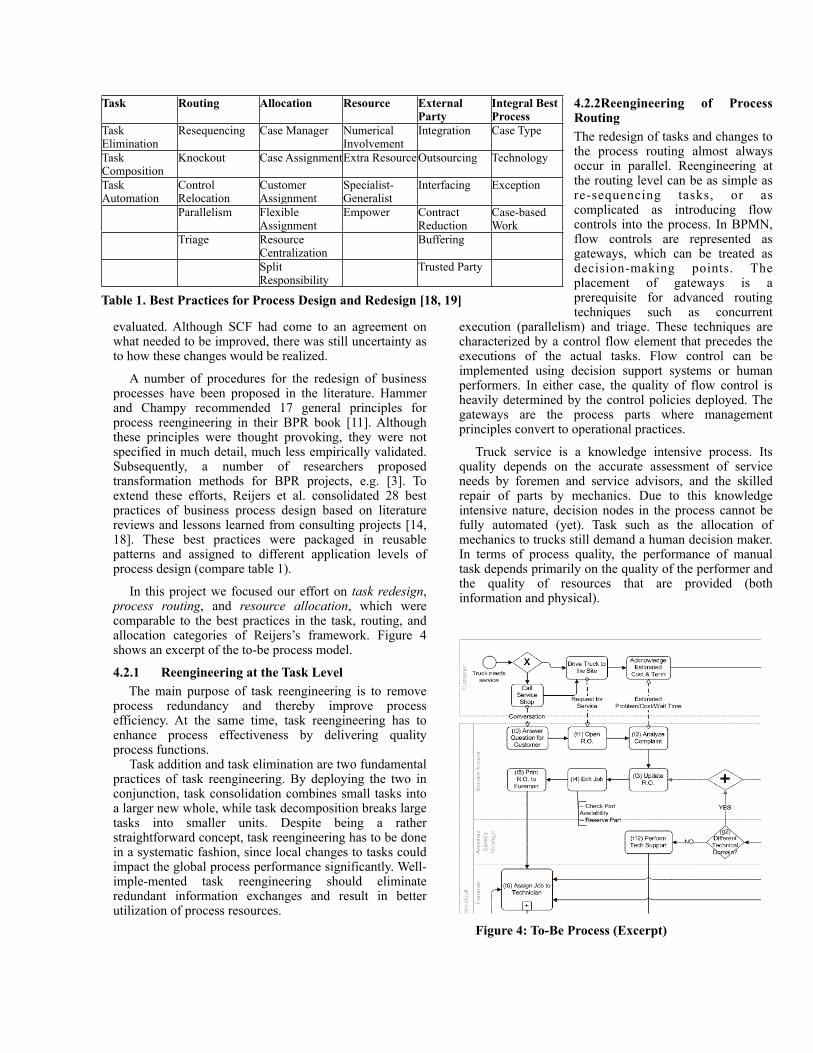
In this project we focused our effort on task redesign, process routing, and resource allocation, which were comparable to the best practices in the task, routing, and allocation categories of Reijers’s framework. Figure 4 shows an excerpt of the to-be process model.
4.2.1 Reengineering at the Task Level The main purpose of task reengineering is to remove
process redundancy and thereby improve process efficiency. At the same time, task reengineering has to enhance process effectiveness by delivering quality process functions.
Task addition and task elimination are two fundamental practices of task reengineering. By deploying the two in conjunction, task consolidation combines small tasks into a larger new whole, while task decomposition breaks large tasks into smaller units. Despite being a rather straightforward concept, task reengineering has to be done in a systematic fashion, since local changes to tasks could impact the global process performance significantly. Well-imple-mented task reengineering should eliminate redundant information exchanges and result in better utilization of process resources.
4.2.2Reengineering of Process Routing The redesign of tasks and changes to the process routing almost always occur in parallel. Reengineering at the routing level can be as simple as re-sequencing tasks, or as complicated as introducing flow controls into the process. In BPMN, flow controls are represented as gateways, which can be treated as decision-making points. The placement of gateways is a prerequisite for advanced routing techniques such as concurrent
execution (parallelism) and triage. These techniques are characterized by a control flow element that precedes the executions of the actual tasks. Flow control can be implemented using decision support systems or human performers. In either case, the quality of flow control is heavily determined by the control policies deployed. The gateways are the process parts where management principles convert to operational practices.
Truck service is a knowledge intensive process. Its quality depends on the accurate assessment of service needs by foremen and service advisors, and the skilled repair of parts by mechanics. Due to this knowledge intensive nature, decision nodes in the process cannot be fully automated (yet). Task such as the allocation of mechanics to trucks still demand a human decision maker. In terms of process quality, the performance of manual task depends primarily on the quality of the performer and the quality of resources that are provided (both information and physical).
Figure 4: To-Be Process (Excerpt)
Task Routing Allocation Resource External Party
Integral Best Process
Task Elimination
Resequencing Case Manager Numerical Involvement
Integration Case Type
Task Composition
Knockout Case AssignmentExtra ResourceOutsourcing Technology
Task Automation
Control Relocation
Customer Assignment
Specialist-Generalist
Interfacing Exception
Parallelism Flexible Assignment
Empower Contract Reduction
Case-based Work
Triage Resource Centralization
Buffering
Split Responsibility
Trusted Party
Table 1. Best Practices for Process Design and Redesign [18, 19]
4.2.3 Reengineering of Task Allocation In the service management process, resource allocation
is one of the tasks that is manually performed by a foreman. The foreman, who is comparable to a case manager in Reijers’ framework, is responsible for assigning service tasks to technicians according to the required skill set, the availability of resources, and other considerations that have to be taken into account to carry out the designated services. In order to simplify the task of resource allocation, the concept of complete kit was used in the redesign of the service process [7].
The complete kit method suggests that service tasks should not be assigned to technicians unless all required resources are available. The new resource scheduling system will be able to verify the availability of resource in real time and send reminders to the foreman once a required resource becomes available. As a result, the foreman no longer has to check for the availability of parts or technicians that are required for a particular service case. The main decision left to the foreman is to identify the best candidate to perform the tasks. This improvement strategy implies that, although resource allocation in the service management process cannot be fully automated, information systems are critical enablers to facilitate efficient decision-making.
4.2.4 Exception handling and Risk Management Designing a process under the aspects of exceptional
handling and risk management are not explicitly addressed in Reijers’ collection of redesign best practice. Nevertheless, risk minimization was a desired property of the new process and had to be taken into account. One of the major risks in the service management process affects the continuity of process execution. The as-is service management process could stop at any point during the execution, in particular when required spare parts were back-ordered. The as-is service process had no alert mechanism that would remind the foreman of the arrival of back-ordered parts. This, consequently, delayed the reassignment of tasks currently on hold. In order to avoid these potential breaks, the to-be process introduced a variety of process triggers. These triggers were represented as immediate events in BPMN. A process instance will be triggered or re-initiated when certain predefined conditions were met.
4.3. Changes at the Organization and Job Level
4.3.1 Role and Responsibility ChangesIn correspondence to the redesign of the service
management process, most of the roles and the associated responsibilities assigned to service management process participants were modified to various degrees. In BPMN, the redesign of roles and responsibilities was visualized by the relocation of activities. New swimlanes were added in the process map when new roles were created as the result of the new process design. Changes made to the lanes
often implied the restructuring required at the organization level.
4.3.2 Culture and Organizational LearningSimilar to other enterprise-wide improvement effort,
the success of business process projects has a lot to do with the adoption of new processes at the operational level. The improvement team has to be aware of resistance that is likely to occur when the implementation of change is not well planned. Despite the cumulative nature of the proposed process changes, the implementation of these changes had to occur in an incremental fashion.
In this project we dealt with a group of people who had been working in a rather static work environment as the nature of the trucking industry had not changed a lot in the past couple of decades. Any force that attempted to change the status quo was viewed as a threat against personal interests of the process participants. In addition, employees, including those who held management positions in SCF, had limited knowledge of business process reengineering and the benefits it might bring about. A communication tool was needed to introduce and explain the concept of process reengineering, the structure of the existing and the proposed service management process, and the stakeholders involved in the process.
4.4. Acceptance of BPMN Diagrams
We found that the process participants began reading BPMN-based process maps with relative ease. Participants liked the clear illustration of roles, duties, and their interactions through the composition of lanes, activities, and arrows. The easy adoption was a surprise to the team, as both the as-is and the to-be map contain more than 30 tasks that are performed by 6 different roles, i.e. the process maps have a significant complexity.
Through the process map, the employees learned how the proposed changes to their roles would impact the overall process throughput. The participants volunteered valuable feedback, rather than waiting for the modelers to seek their opinion. This, in return, improved the feasibility of implementation. As the result of learning to read BPMN diagrams, SCF employees not only discovered the value behind the reengineering project, but also mentioned the need to document other processes from time to time, indicating a reasonable comfort level with the notation.
5. Quantifying the Impact: Simulation
5.1. Converting the Consulting Model to a Simulation Model
The primary function of the as-is and to-be process maps in the improvement project was to facilitate the communication between key stakeholders. For this very purpose, the layout of the process was designed as simple
as possible to minimize the technical impact of the modeling tools used. Technical details associated with the resulting process maps were provided in well-structured text format. Technical reports were produced and updated whenever a major modification of the process design took place. In addition to the 12 revisions of the as-is process map and the 5 revisions of the to-be process map, there were a total of 4 technical reports for the as-is process and 2 issues for the to-be process.
Having understood the process weaknesses and the improvement potential, the authors were requested to illustrate the potential financial impact of the new process design using a simulation approach. For this purpose, the existing process maps needed to be extended to meet the information requirements of a simulation model. Both the as-is and the to-be maps were refined from the consulting version to a simulation version by including more graphical details.
Some details of the simulation model were determined by the availability of process execution data and the validity of this data. In addition, some aspects of the consulting models had to be changed rather than refined. In the consulting version of process maps, some BPMN notation elements were intentionally misused to increase the readability of the model. However, a BPMN-based simulation tool did not recognize these “errors” unless they were remedied through additional modeling elements. It is worth to note here that the simulation process maps had to meet a BPMN dialect specific to the chosen simulation tool rather than be compliant with the official BPMN specification.
5.2. Data Collection
The data required for the simulation run was collected from two different sources. The majority of data was retrieved from the Procede database. Even though Procede did not provide native functions to export data, we were able to retrieve transactions directly from the underlying SQL database. In addition to the number of service transactions completed, each service task was time-stamped whenever it met pre-defined checkpoints. These time stamps were essential to measure fundamental process performance indicators such as cycle time, lead time, wait time, etc. However, the data provided by Procede was not sufficient to describe the entire service management process, as the reference process built into Procede differed significantly from the as-is process model.
To complete the data collection, paper-based time cards were printed and distributed with each new service task. Since the as-is process was purely sequential, the timestamps on the time cards allowed us to trace the service tasks performed in individual process instances. To facilitate data collection, the time cards were attached to printed documents (such as repair orders) and service advisors and technicians were asked to record the time
when they received and sent the respective document. This additional effort was approved by the CEO and successfully implemented for a 30-day period. This manual data was used to fill in the blanks that could not be explained using the data obtained from Procede.
5.3. Process Simulation
The data collection yielded 207 service repair orders in January 2007 and the 105 time sheets distributed from mid-January to mid-February in 2007. A number of these items were deemed invalid due to the unfamiliarity of the operators with Procede and unintentional errors in operation. After eliminating invalid entries the team ended up with 154 valid repair orders and 66 valid time sheet entries that were applicable to the simulation.
Where data could not be obtained through Procede or manual collections had to be made, assumptions had to be made for the simulation. These assumptions were not made at random but rather obtained through consensus with the key process stakeholders.
The simulation was able to show significant differences in cycle time between the two scenarios. Since the time saved in the to-be process design implied additional process capacity, the economic return from the implementation of the to-be process would mainly lie in the potential increase in profitability due to extra capacity.
In particular, the simulation showed that the reassignment of tasks, improved notification during handovers and the streamlining of the parts order process could reduce the average wait time per process instance from 8.3 hours to 0.4 hours. By applying a simple times-savings-times-salary model we determined that the potential cost savings were in the order of $100k per month.
6. Lesson Learned
In order to make BPMN the universal language in communicating process designs company-wide, the author had to make sure that the company employees, at least the key stakeholders of the improvement project, were comfortable reading process maps in BPMN. Two BPMN workshops were held to introduce the constructs of BPMN and the basic of process modeling. The teaching and learning of BPMN was a whole new experience for both the authors and the employees. The author identified some “lessons learned” that might interest the BPMN researchers in particular.
6.1. Limited Usage of Constructs
In terms of the usage of BPMN constructs, there were two interest parties involved in the project. The authors, as consultants and process modelers, were the ones who had to manipulate BPMN constructs and come up with process
models that complied with the BPMN specification. The employees of the firm, as the readers of process models, do not need to know how to model processes with BPMN. Instead, they were interested in understanding the essence of a BPMN process map without taking in too much information. Therefore, the presentation of process model had to be both precise and concise.
For that very purpose, the authors used a limited set of BPMN constructs. Most of these elements overlapped with the BPMN core element set [15]. This selection was in accordance with our experience from teaching BPMN at the graduate level. Despite the introduction of the entire set of BPMN constructs, the audience tends to remember the basic constructs and disregarded the constructs that had richer meaning. To facilitate communication and mutual understanding, we decided to limit process designs to the constructs that the business users were more comfortable with.
The core element set of BPMN was sufficient to describe the entire service process for the purpose of consulting. “Sufficient” refers to the capability of a limited BPMN model to reflect “business problems”. In order to leverage process models as communication tools, the authors had to identify a level of abstraction at which the business users could recognize the business problems contained in the process models. Process models that were either over-simplified or over-complicated in their structure were likely to lose this capability.
6.2. Modification of Constructs
In order to illustrate certain shortcomings of the as-is and the to-be process, some BPMN constructs were deliberately modified in the as-is process maps. This “misuse” was deliberate to enhance the expressive power of the resulting process maps.
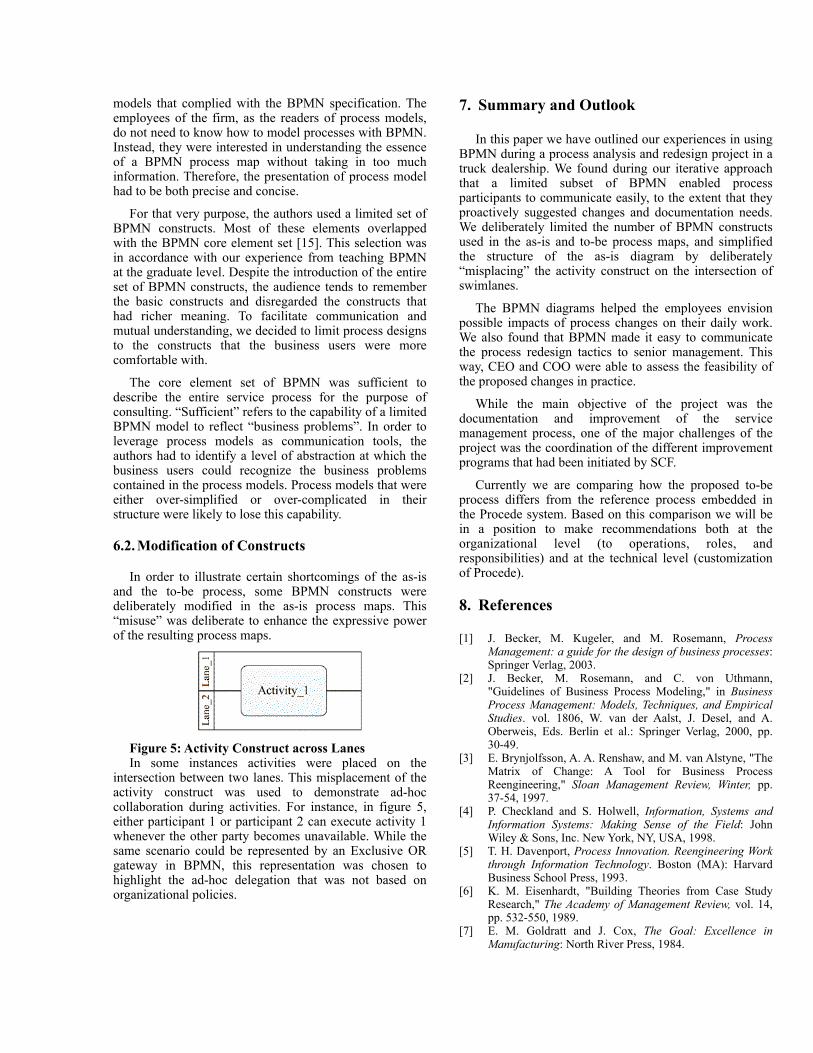
Figure 5: Activity Construct across LanesIn some instances activities were placed on the
intersection between two lanes. This misplacement of the activity construct was used to demonstrate ad-hoc collaboration during activities. For instance, in figure 5, either participant 1 or participant 2 can execute activity 1 whenever the other party becomes unavailable. While the same scenario could be represented by an Exclusive OR gateway in BPMN, this representation was chosen to highlight the ad-hoc delegation that was not based on organizational policies.
7. Summary and Outlook
In this paper we have outlined our experiences in using BPMN during a process analysis and redesign project in a truck dealership. We found during our iterative approach that a limited subset of BPMN enabled process participants to communicate easily, to the extent that they proactively suggested changes and documentation needs. We deliberately limited the number of BPMN constructs used in the as-is and to-be process maps, and simplified the structure of the as-is diagram by deliberately “misplacing” the activity construct on the intersection of swimlanes.
The BPMN diagrams helped the employees envision possible impacts of process changes on their daily work. We also found that BPMN made it easy to communicate the process redesign tactics to senior management. This way, CEO and COO were able to assess the feasibility of the proposed changes in practice.
While the main objective of the project was the documentation and improvement of the service management process, one of the major challenges of the project was the coordination of the different improvement programs that had been initiated by SCF.
Currently we are comparing how the proposed to-be process differs from the reference process embedded in the Procede system. Based on this comparison we will be in a position to make recommendations both at the organizational level (to operations, roles, and responsibilities) and at the technical level (customization of Procede).
8. References
[1] J. Becker, M. Kugeler, and M. Rosemann, Process Management: a guide for the design of business processes: Springer Verlag, 2003.
[2] J. Becker, M. Rosemann, and C. von Uthmann, "Guidelines of Business Process Modeling," in Business Process Management: Models, Techniques, and Empirical Studies. vol. 1806, W. van der Aalst, J. Desel, and A. Oberweis, Eds. Berlin et al.: Springer Verlag, 2000, pp. 30-49.
[3] E. Brynjolfsson, A. A. Renshaw, and M. van Alstyne, "The Matrix of Change: A Tool for Business Process Reengineering," Sloan Management Review, Winter, pp. 37-54, 1997.
[4] P. Checkland and S. Holwell, Information, Systems and Information Systems: Making Sense of the Field: John Wiley & Sons, Inc. New York, NY, USA, 1998.
[5] T. H. Davenport, Process Innovation. Reengineering Work through Information Technology. Boston (MA): Harvard Business School Press, 1993.
[6] K. M. Eisenhardt, "Building Theories from Case Study Research," The Academy of Management Review, vol. 14, pp. 532-550, 1989.
[7] E. M. Goldratt and J. Cox, The Goal: Excellence in Manufacturing: North River Press, 1984.
[8] P. Green and M. Rosemann, "Integrated Process Modeling: An Ontological Evaluation," Information Systems, vol. 25, pp. 73-87, 2000.
[9] V. Grover, S. R. Jeong, W. J. Kettinger, and J. T. C. Teng, "The implementation of business process reengineering," Journal of Management Information Systems, vol. 12, pp. 109-144, 1995.
[10] M. Hammer, "The Superefficient Company," Harvard Business Review, vol. 79, pp. 82-91, 2001.
[11] M. Hammer and J. Champy, Reengineering the corporation: Harper Business, 1993.
[12] H. J. Harrington and P. American Society for Quality Control Quality, Business process improvement: the breakthrough strategy for total quality, productivity, and competitiveness: McGraw-Hill, 1991.
[13] A. Knutilla, C. Schlenoff, S. Ray, S. T. Ployak, A. Tate, S. C. Cheah, and R. C. Anderson, "Process Specification Language: An Analysis of Existing Representations," National Institute of Standards and Technology (NIST), Gaithersburg (MD), NISTIT 6160 1998.
[14] S. L. Mansar and H. A. Reijers, "Best practices in business process redesign: validation of a redesign framework," Computers in Industry, vol. 56, pp. 457-471, 2005.
[15] Object Management Group, "Business Process Modeling Notation (BPMN) Specification," Object Management Group, Needham, MA, Standard Specification dtc/06-02-01, February 6th, 2006 2006.
[16] C. Raduescu, H.-M. Tan, M. Jayaganesh, W. Bandara, M. zur Muehlen, and S. Lippe, "A Framework of Issues in Large Process Modeling Projects," in Proceedings of the 14th European Conference on Information Systems (ECIS 2006), Göteborg, Sweden, 2006.
[17] J. Recker, M. Indulska, M. Rosemann, and P. Green, "Do Process Modelling Techniques Get Better? A Comparative Ontological Analysis of BPMN," 16th Australasian Conference on Information Systems. Australasian Chapter of the Association for Information Systems, Sydney, Australia, 2005.
[18] H. A. Reijers and S. L. Mansar, "Best practices in business process redesign: an overview and qualitative evaluation of successful redesign heuristics," Omega, vol. 33, p. 283, 2005.
[19] A.-W. Scheer, Business process change management : ARIS in practice. Berlin ; New York: Springer, 2003.
[20] J. Y. L. Thong, C.-S. Yap, and K.-L. Seah, "Business Process Reengineering in the Public Sector: The Case of the Housing Development Board in Singapore," Journal of Management Information Systems, vol. 17, 2000.