Embed Size (px)
Citation preview
SERVICE GAPS & OPPORTUNITIES ORGCODE CONSULTING, INC. 1
Service Gaps & Opportunities in Ending Homelessness
Pima County, AZ
Prepared by OrgCode Consulting, Inc.
SERVICE GAPS & OPPORTUNITIES ORGCODE CONSULTING, INC. 2
Introduction The Tucson Pima Collaboration to end Homelessness (TPCH,) as the Continuum of Care (CoC) for Pima County requested that OrgCode Consulting, Inc. conduct analysis and prepare a report on the population of persons experiencing homelessness in the County relative to:
1. The services offered in the continuum and where gaps may exist relative to the population;
2. The financial resources and prioritization of those resources;
3. The housing demands to best meet the needs of the population.
The intent of this report is to prepare the community for action using data and to communicate the findings of the analysis in plain language.
SERVICE GAPS & OPPORTUNITIES ORGCODE CONSULTING, INC. 3
Summary of Key Findings The report makes the following conclusions:
Service and Housing Status
Based on existing data, homelessness as it exists across the CoC is an entirely solvable issue if resources are used appropriately.
There is an apparent disconnect between the enhancement of resources for
population groups like veterans without commensurate reduction in overall homelessness for the group.
There is a higher proportion of single persons with higher acuity (the presence of
complex issues), as per the VI-SPDAT, than what is customarily seen in similarly-sized communitiesi; however, there remains enough resources to adequately to address these needs, and underused resources that are specifically catered to this population. Case in point, the most recent inventory of empty beds shows more than 150 empty spaces in Permanent Supportive Housing, as well as more than 150 empty spaces in Rapid ReHousingii.
Despite qualitative input to the contraryiii, there is absolutely no need to expand
emergency shelter capacity. While there may be a need to improve shelter program access and closely examine rules within shelters, the actual number of beds is more than sufficient.
For the past six years, transitional housing has been under-utilized. This trend is
compelling in that the community has considerably more transitional housing than it needs, and the conversion of transitional housing to other forms of support are long over-due.
SERVICE GAPS & OPPORTUNITIES ORGCODE CONSULTING, INC. 4
Service and Housing Investment
A sense of urgency needs to be created to better leverage existing resources and services.
It would appear necessary, from the review of data and qualitative interviews, to enhance training and professional development across the areas of progressive engagement, street outreach, housing first philosophy, and to increase the number of unsheltered persons and persons with higher acuity to access and maintain housing.
There is a mismatch between service demand and investment. While more than
85% of all single people surveyed through the VI-SPDAT would benefit from Permanent Supportive Housing or Rapid ReHousing (n=1,051), investment with HUD dollars in these interventions represents only 56% of allocation. This is a great disparity.
SERVICE GAPS & OPPORTUNITIES ORGCODE CONSULTING, INC. 5
Housing Demandiv Current housing stock includes: - 1,101 beds of PSH. - 458 beds of Rapid Re-Housing.
In order to just maintain the status quo:
997 beds of PSH will be required over the next 10 years with 471 required in
the first 5 years;
1,279 beds of Rapid ReHousing will be required over the next 10 years with 711 required in the first 5 years.
To end homelessness in Pima County:
1,812 beds of PSH will be required over the next 10 years with 1,011
required in the first 5 years;
2,325 beds of Rapid ReHousing will be required over the next 10 years with 1,400 required in the first 5 years.
SERVICE GAPS & OPPORTUNITIES ORGCODE CONSULTING, INC. 6
Housing Market Conditions and Availability 2008 statistics show approximately 400,000 households in Pima County including 215,625 in Tucson, 1,895 in South Tucson, 40,575 in other incorporated areas, and 98,500 in unincorporated areas. There are 37,500 affordable housing units countywide, with need for affordable housing far outweighing the existing supply, like in many parts of the country.
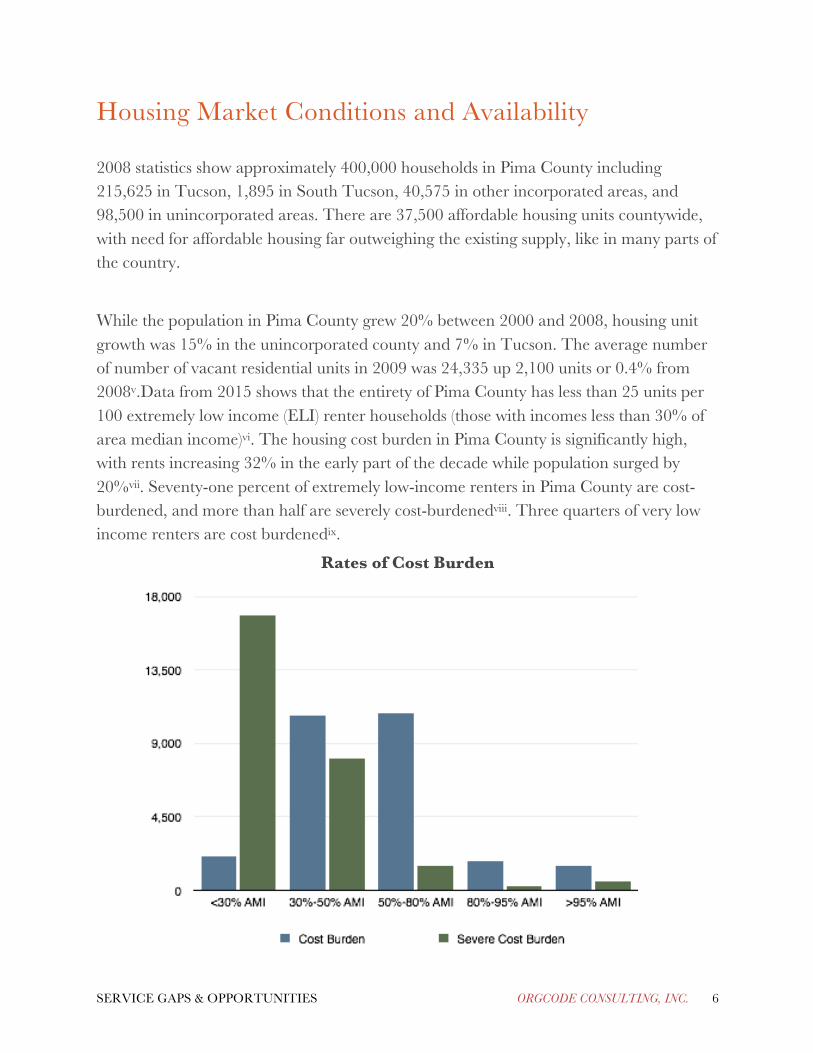
While the population in Pima County grew 20% between 2000 and 2008, housing unit growth was 15% in the unincorporated county and 7% in Tucson. The average number of number of vacant residential units in 2009 was 24,335 up 2,100 units or 0.4% from 2008v.Data from 2015 shows that the entirety of Pima County has less than 25 units per 100 extremely low income (ELI) renter households (those with incomes less than 30% of area median income)vi. The housing cost burden in Pima County is significantly high, with rents increasing 32% in the early part of the decade while population surged by 20%vii. Seventy-one percent of extremely low-income renters in Pima County are cost-burdened, and more than half are severely cost-burdenedviii. Three quarters of very low income renters are cost burdenedix.
Rates of Cost Burden
SERVICE GAPS & OPPORTUNITIES ORGCODE CONSULTING, INC. 7
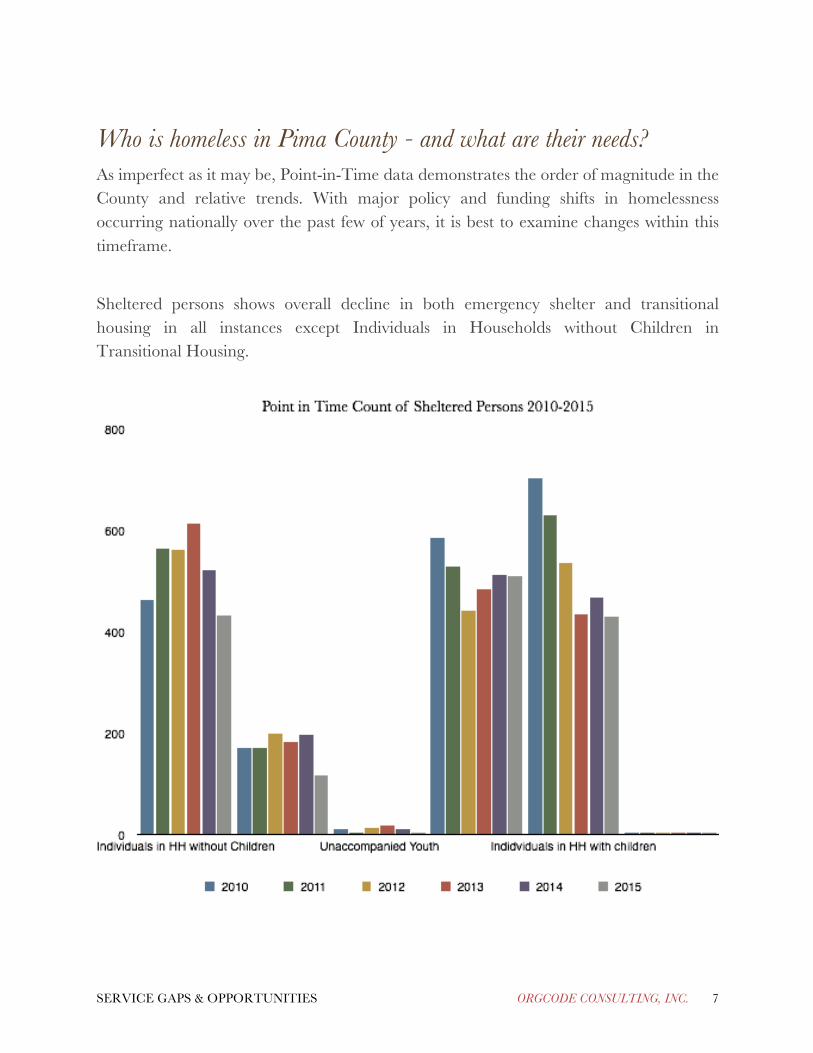
Who is homeless in Pima County - and what are their needs? As imperfect as it may be, Point-in-Time data demonstrates the order of magnitude in the County and relative trends. With major policy and funding shifts in homelessness occurring nationally over the past few of years, it is best to examine changes within this timeframe.
Sheltered persons shows overall decline in both emergency shelter and transitional housing in all instances except Individuals in Households without Children in Transitional Housing.

SERVICE GAPS & OPPORTUNITIES ORGCODE CONSULTING, INC. 8
Data on unsheltered persons demonstrates dramatic reductions in homelessness for individuals in households without children, as well as reductions in unaccompanied youth. There is no discernible pattern of why there are mild fluctuations in unsheltered families.
SERVICE GAPS & OPPORTUNITIES ORGCODE CONSULTING, INC. 9
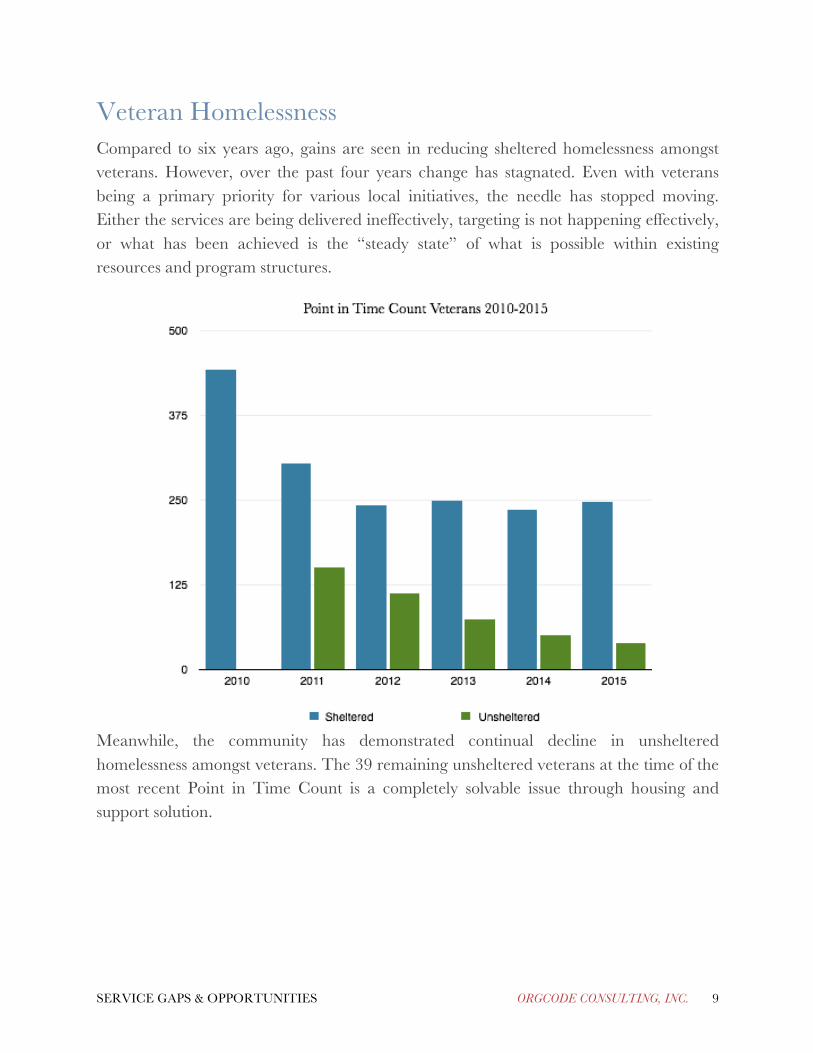
Veteran Homelessness Compared to six years ago, gains are seen in reducing sheltered homelessness amongst veterans. However, over the past four years change has stagnated. Even with veterans being a primary priority for various local initiatives, the needle has stopped moving. Either the services are being delivered ineffectively, targeting is not happening effectively, or what has been achieved is the “steady state” of what is possible within existing resources and program structures.
Meanwhile, the community has demonstrated continual decline in unsheltered homelessness amongst veterans. The 39 remaining unsheltered veterans at the time of the most recent Point in Time Count is a completely solvable issue through housing and support solution.

SERVICE GAPS & OPPORTUNITIES ORGCODE CONSULTING, INC. 10
Chronic Homelessness Is the community targeting its resources effectively in its approaches to reducing homelessness?
Datax suggests there has been an inadequate job in addressing chronic homelessness. There were 242 unsheltered chronically homeless persons in 2015, which is up from the sub-200 levels experienced in three of the previous four years. Defying explanation, while chronic homelessness is up compared to the most recent years, those persons that are unsheltered and living with substance use or mental health issues have gone down. This leads one to believe that many of these persons must be living with compromised physical health in addition to having longer bouts of homelessness due to the fact that an individual or one person in a family must have a disability to be determined chronically homeless. With substance use and mental illness decreasing per the data, the logical conclusion is an increased number of persons with physical disabilities.
Amongst the sheltered population, while chronic homelessness is slightly down over the most recent years and there appears to be a trend in that regard, presence of issues like mental illness and chronic substance abuse defy a predictable change pattern.
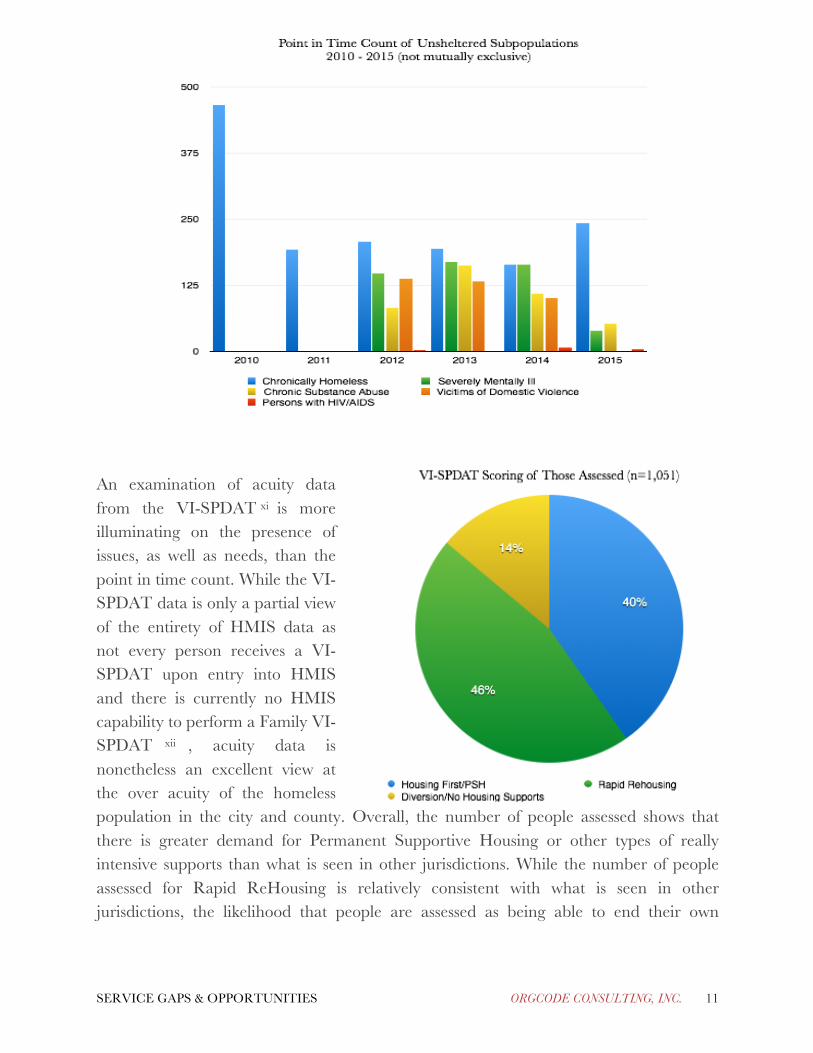
SERVICE GAPS & OPPORTUNITIES ORGCODE CONSULTING, INC. 11
An examination of acuity data from the VI-SPDAT xi is more illuminating on the presence of issues, as well as needs, than the point in time count. While the VI-SPDAT data is only a partial view of the entirety of HMIS data as not every person receives a VI-SPDAT upon entry into HMIS and there is currently no HMIS capability to perform a Family VI-SPDAT xii , acuity data is nonetheless an excellent view at the over acuity of the homeless population in the city and county. Overall, the number of people assessed shows that there is greater demand for Permanent Supportive Housing or other types of really intensive supports than what is seen in other jurisdictions. While the number of people assessed for Rapid ReHousing is relatively consistent with what is seen in other jurisdictions, the likelihood that people are assessed as being able to end their own
SERVICE GAPS & OPPORTUNITIES ORGCODE CONSULTING, INC. 12
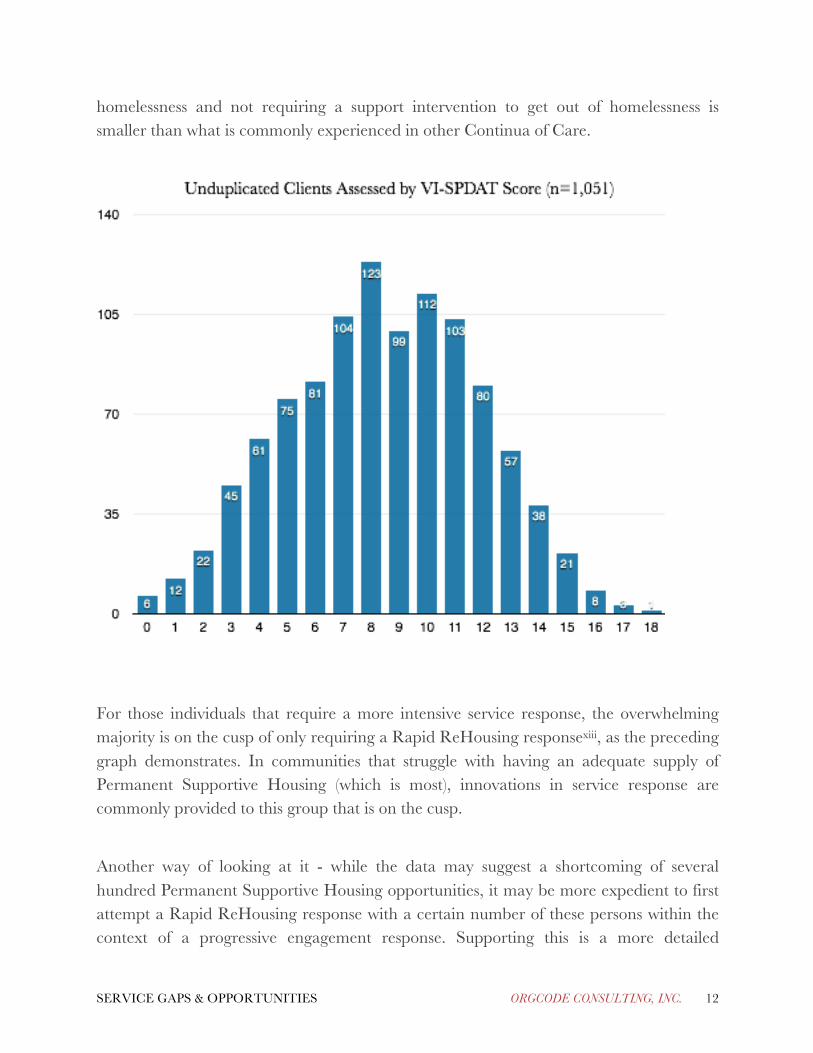
homelessness and not requiring a support intervention to get out of homelessness is smaller than what is commonly experienced in other Continua of Care.
For those individuals that require a more intensive service response, the overwhelming majority is on the cusp of only requiring a Rapid ReHousing responsexiii, as the preceding graph demonstrates. In communities that struggle with having an adequate supply of Permanent Supportive Housing (which is most), innovations in service response are commonly provided to this group that is on the cusp.
Another way of looking at it - while the data may suggest a shortcoming of several hundred Permanent Supportive Housing opportunities, it may be more expedient to first attempt a Rapid ReHousing response with a certain number of these persons within the context of a progressive engagement response. Supporting this is a more detailed
SERVICE GAPS & OPPORTUNITIES ORGCODE CONSULTING, INC. 13
investigation of VI-SPDAT results, which suggests that while there are a fair number of emergency room visits (the most dominant emergency service response from the VI-SPDAT), most of these are not by ambulance and most do not result in hospitalization.
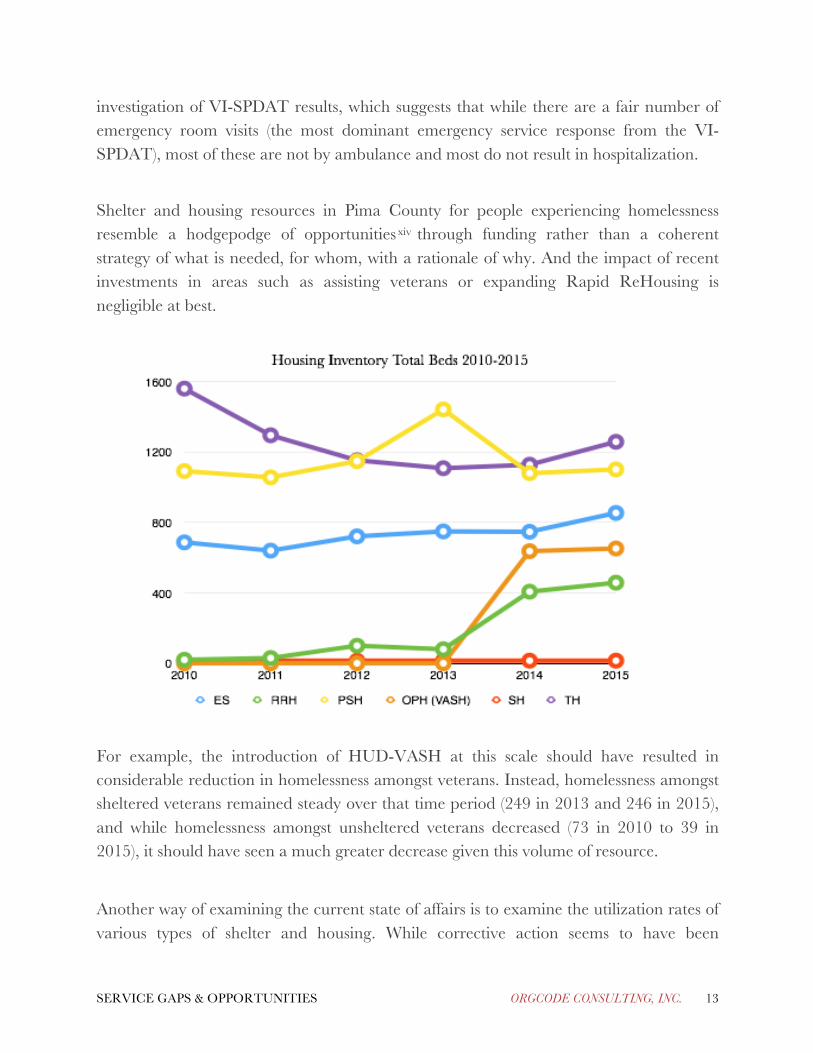
Shelter and housing resources in Pima County for people experiencing homelessness resemble a hodgepodge of opportunitiesxiv through funding rather than a coherent strategy of what is needed, for whom, with a rationale of why. And the impact of recent investments in areas such as assisting veterans or expanding Rapid ReHousing is negligible at best.
For example, the introduction of HUD-VASH at this scale should have resulted in considerable reduction in homelessness amongst veterans. Instead, homelessness amongst sheltered veterans remained steady over that time period (249 in 2013 and 246 in 2015), and while homelessness amongst unsheltered veterans decreased (73 in 2010 to 39 in 2015), it should have seen a much greater decrease given this volume of resource.
Another way of examining the current state of affairs is to examine the utilization rates of various types of shelter and housing. While corrective action seems to have been
SERVICE GAPS & OPPORTUNITIES ORGCODE CONSULTING, INC. 14
employed in Emergency Shelter over the past few years to keep that service at sub-100% utilizationxv (with the nightly utilization dropping from 96% in 2014 to 63% in 2015), all other resources have been under-utilized over the past two years. Rapid Rehousing nightly utilization was 77% in 2014 and 64% in 2015; Permanent Supportive Housing nightly utilization was 97% in 2014 and 85% in 2015; HUD-VASH nightly utilization was 84% in 2014 and 77% in 2015; and Transitional Housing was 87% in 2014 and 75% in 2015. Only the Safe Haven has remained fully utilized with a six year average nightly utilization of 98%.
Qualitative interviews conducted for this report mentioned the need for more shelter on several instances. Analysis does not warrant this. While some existing shelter space may need to be re-profiled for specific population groups (for example, medically frail persons, safe space for women, safe space for people that identify as gay, lesbian, bisexual, transgendered, transsexual, two-spirited, queer, inter-sexed), shelter capacity overall is more than sufficient to actually accommodate all unsheltered persons overall. In other words, there is more than enough shelter space, but it may be used incorrectly.
Furthermore, there is zero credence to expanding shelter capacity when various housing solutions are also currently under-utilized. As demonstrated by the following graphic, the number of empty beds in Emergency Shelter, Permanent Supportive Housing, Rapid ReHousing, and Transitional Housing is exceptional.

SERVICE GAPS & OPPORTUNITIES ORGCODE CONSULTING, INC. 15
SERVICE GAPS & OPPORTUNITIES ORGCODE CONSULTING, INC. 16
Could it be that existing program spaces are so restrictive in their rules that leveraging access to the space is difficult for persons with higher acuity or specific subpopulations? Yes. But issues with program use (and restrictions for entry into specific programs) is remarkably different from issues of capacity. The community needs to better understand if it is sheltering the right people in the right facilities with the right rulesxvi. The community does not need to expand bricks and mortar for shelters.

SERVICE GAPS & OPPORTUNITIES ORGCODE CONSULTING, INC. 17
Funding Are we doing the best we can with the money we have? The HUD funded landscape for programs in the Continuum of Care looks as follows:
One of the most glaring figures from the previous section of the report is the chronic trend of under-utilizing transitional housing. Year after year there has been almost 150 beds of transitional housing not used, and in some years - including the most recent one - considerably more than thatxvii. It does not take much to wonder how freeing up the resources used to fund those 150 units could be used to expand other program offerings. Across the nation, many communities are realizing the potential of doing this, and better meeting the needs of those in their community with the deepest needsxviii. Pima County should be no different. With 10 transitional housing projects funded in the community, serious consideration must be given to getting to at least half as many projects while increasing Rapid ReHousing and Permanent Supportive Housing opportunities. Funding wise, it would be prudent to invest at least $1 million from Transitional Housing into Permanent Supportive Housing, and upwards of $750,000 from Transitional Housing into Rapid ReHousing.
SERVICE GAPS & OPPORTUNITIES ORGCODE CONSULTING, INC. 18
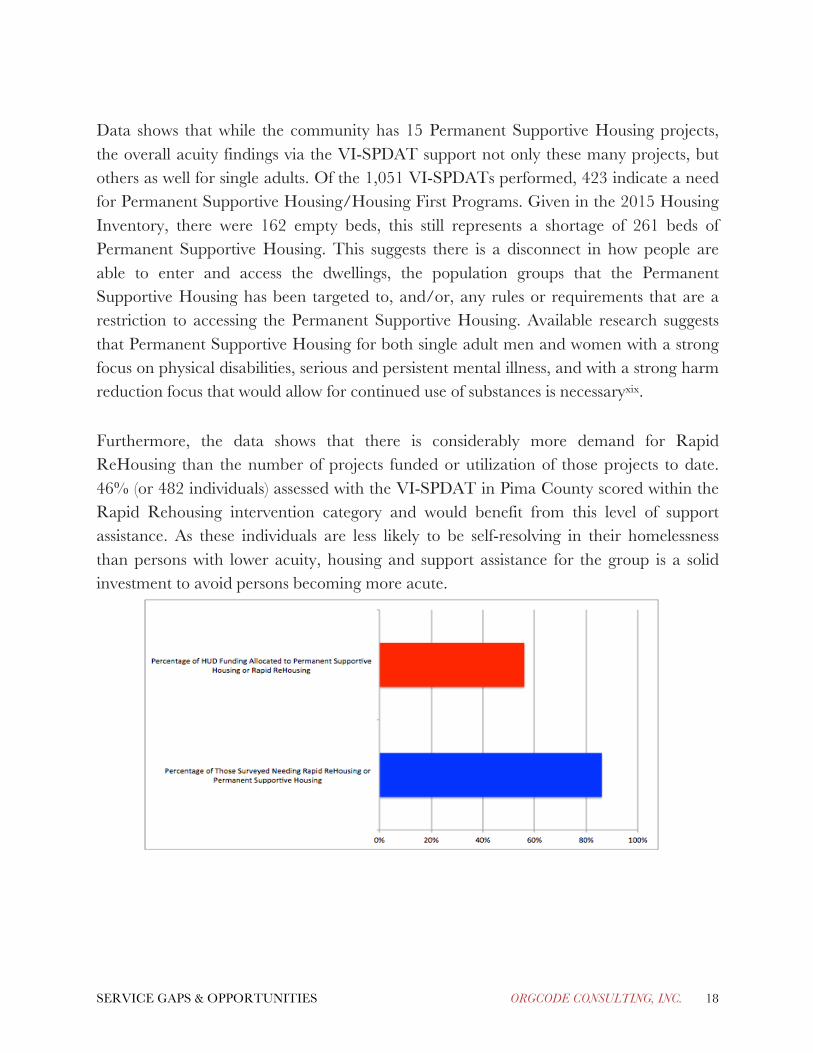
Data shows that while the community has 15 Permanent Supportive Housing projects, the overall acuity findings via the VI-SPDAT support not only these many projects, but others as well for single adults. Of the 1,051 VI-SPDATs performed, 423 indicate a need for Permanent Supportive Housing/Housing First Programs. Given in the 2015 Housing Inventory, there were 162 empty beds, this still represents a shortage of 261 beds of Permanent Supportive Housing. This suggests there is a disconnect in how people are able to enter and access the dwellings, the population groups that the Permanent Supportive Housing has been targeted to, and/or, any rules or requirements that are a restriction to accessing the Permanent Supportive Housing. Available research suggests that Permanent Supportive Housing for both single adult men and women with a strong focus on physical disabilities, serious and persistent mental illness, and with a strong harm reduction focus that would allow for continued use of substances is necessaryxix. Furthermore, the data shows that there is considerably more demand for Rapid ReHousing than the number of projects funded or utilization of those projects to date. 46% (or 482 individuals) assessed with the VI-SPDAT in Pima County scored within the Rapid Rehousing intervention category and would benefit from this level of support assistance. As these individuals are less likely to be self-resolving in their homelessness than persons with lower acuity, housing and support assistance for the group is a solid investment to avoid persons becoming more acute.
SERVICE GAPS & OPPORTUNITIES ORGCODE CONSULTING, INC. 19
Continuing this analysis further, across the board, it is clear that funding is not matched well to acuity. 86% of all people assessed to date through the VI-SPDAT need either Permanent Supportive Housing or Rapid ReHousing in order to be successful in housing. However, combined Permanent Supportive Housing and Rapid ReHousing only constitute 56% of all allocation. Even if one were to suggest that veterans should only be funded through Veteran Affairs resources, there is still an inconsistency between where the demand exists within the County and where investment is being made. Data regarding the specific service needs of families relative to acuity was not available for this study as the community does not currently use the Family VI-SPDAT. As such, commentary on utilization patterns and precise recommendations on investment in support and housing options are compromised. That said, if the experience of other service providers within the State (Maricopa County) and places of comparable geography (Salt Lake County, Palm Beach County) are any indication, less than 10% of families will require Permanent Supportive Housing, and over 50% of families will benefit from Rapid ReHousing. As such, ensuring sufficient Rapid ReHousing resources by reallocating some investment from transitional housing and putting it into Rapid ReHousing seems prudent.

SERVICE GAPS & OPPORTUNITIES ORGCODE CONSULTING, INC. 20
Housing What housing do we need to end homelessness in Pima County? Using all available existing data and the OrgCode model for predicting housing needxx, we are able to indicate the following housing needs over the next 10 years, as outlined in the table below:
10 Year Projections of Housing Needs, by Type of Housing1
Additional PSH Units Necessary
Over 10 Year Period
Additional Rapid
ReHousing Over 10 Year
Period
Additional Section 8 or Other Rent Geared to
Income Housing
Over 10 Year Period
ADDITIONAL TOTAL
HOUSING OVER 10
YEAR PERIOD
Shelter Beds Required Per
Year
Maintaining the Status Quo
997 1279 860 3136 701
Marginal Improvement
1196 1535 1032 3763 512
Resolving Homelessness
1812 2325 1564 5701 380
This is based upon an understanding of current inventory, trends in homelessness, understanding of the current rental and employment market, and a broad range of other economic and social conditions. However, while this is a 10 year projection, the model only works as indicated if certain matters are addressed within the first 3-5 years - otherwise the projections across the board increase.
1 Regarding shelter beds, the model appreciates that there will always be a need for shelter beds as not all housing destabilization can be prevented. Use of beds, however, should be short term and infrequent.
SERVICE GAPS & OPPORTUNITIES ORGCODE CONSULTING, INC. 21
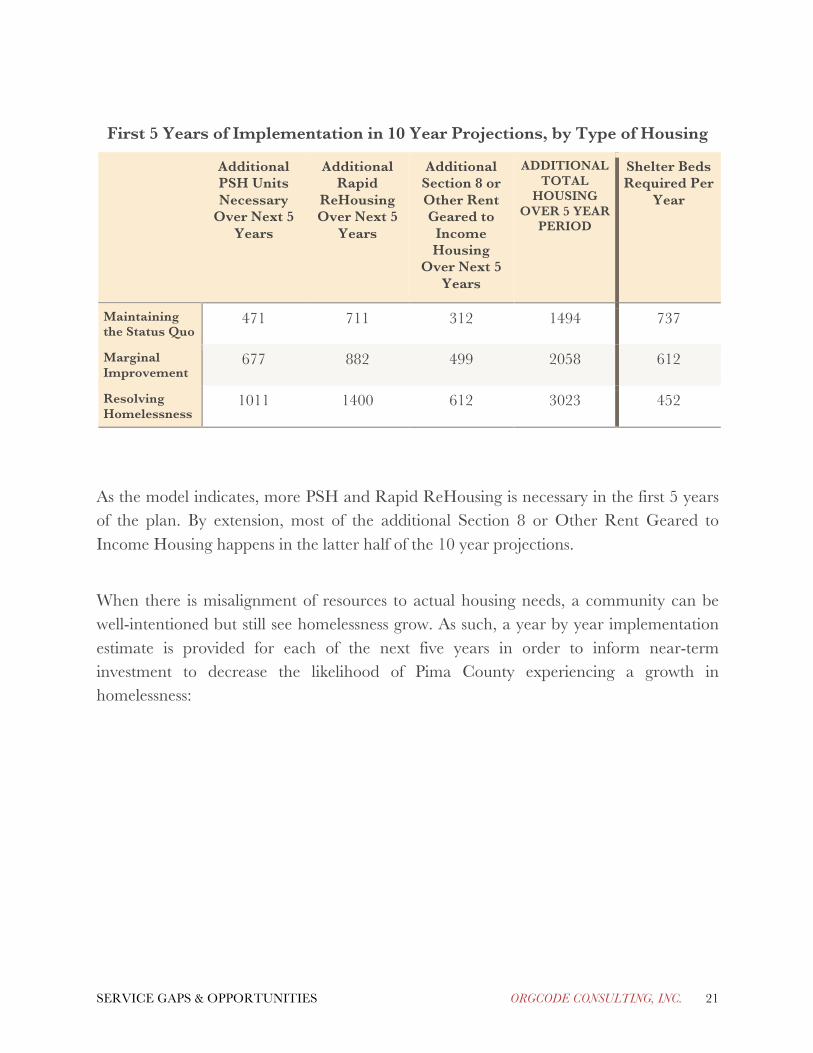
First 5 Years of Implementation in 10 Year Projections, by Type of Housing
Additional PSH Units Necessary
Over Next 5 Years
Additional Rapid
ReHousing Over Next 5
Years
Additional Section 8 or Other Rent Geared to
Income Housing
Over Next 5 Years
ADDITIONAL TOTAL
HOUSING OVER 5 YEAR
PERIOD
Shelter Beds Required Per
Year
Maintaining the Status Quo
471 711 312 1494 737
Marginal Improvement
677 882 499 2058 612
Resolving Homelessness
1011 1400 612 3023 452
As the model indicates, more PSH and Rapid ReHousing is necessary in the first 5 years of the plan. By extension, most of the additional Section 8 or Other Rent Geared to Income Housing happens in the latter half of the 10 year projections.
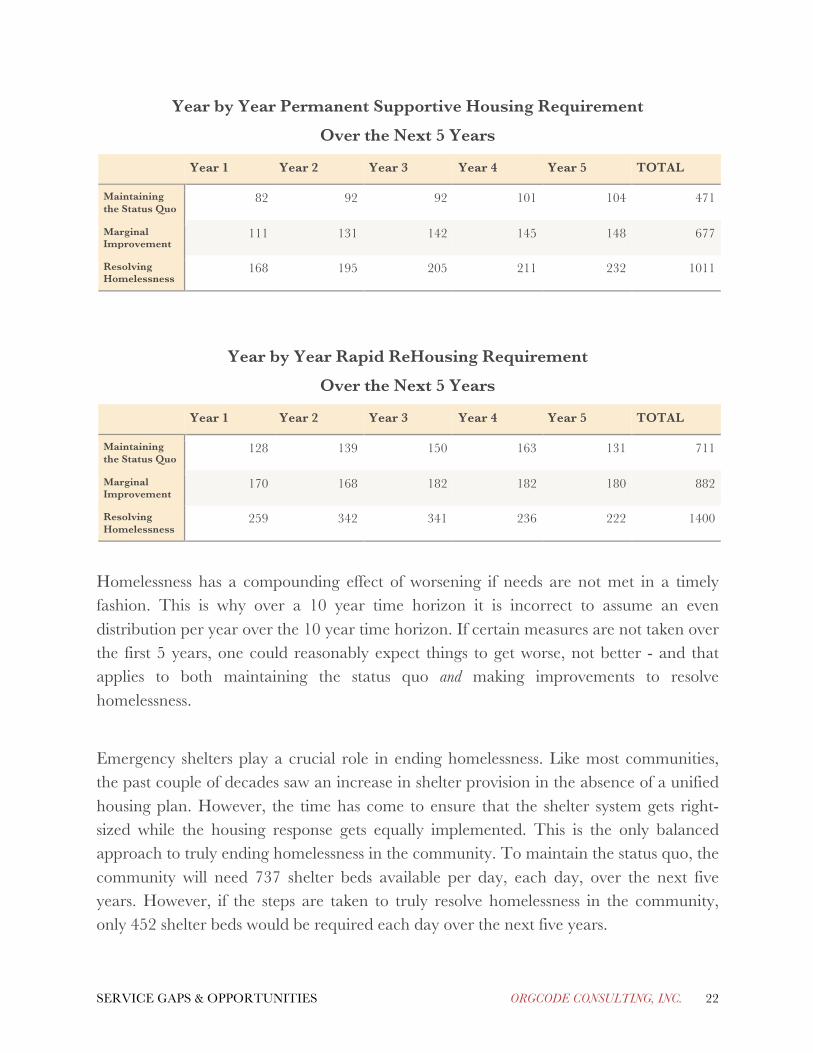
When there is misalignment of resources to actual housing needs, a community can be well-intentioned but still see homelessness grow. As such, a year by year implementation estimate is provided for each of the next five years in order to inform near-term investment to decrease the likelihood of Pima County experiencing a growth in homelessness:
SERVICE GAPS & OPPORTUNITIES ORGCODE CONSULTING, INC. 22
Year by Year Permanent Supportive Housing Requirement
Over the Next 5 Years
Year 1 Year 2 Year 3 Year 4 Year 5 TOTAL
Maintaining the Status Quo
82 92 92 101 104 471
Marginal Improvement
111 131 142 145 148 677
Resolving Homelessness
168 195 205 211 232 1011
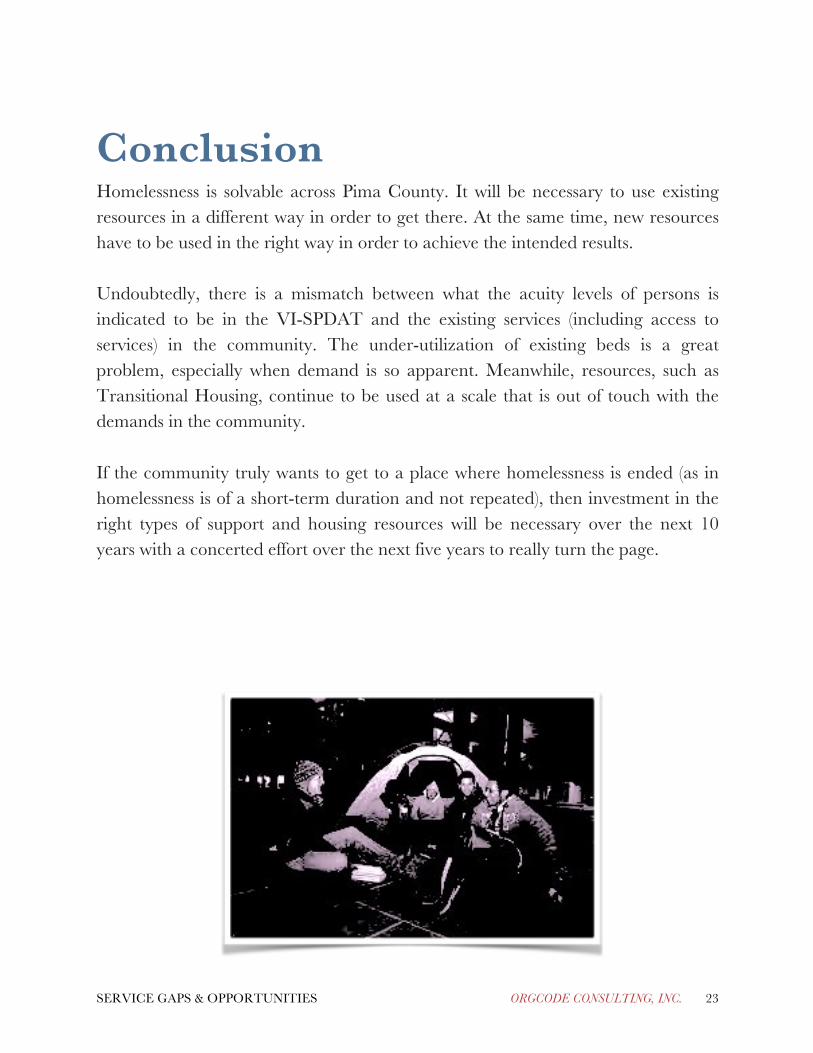
Year by Year Rapid ReHousing Requirement
Over the Next 5 Years
Year 1 Year 2 Year 3 Year 4 Year 5 TOTAL
Maintaining the Status Quo
128 139 150 163 131 711
Marginal Improvement
170 168 182 182 180 882
Resolving Homelessness
259 342 341 236 222 1400
Homelessness has a compounding effect of worsening if needs are not met in a timely fashion. This is why over a 10 year time horizon it is incorrect to assume an even distribution per year over the 10 year time horizon. If certain measures are not taken over the first 5 years, one could reasonably expect things to get worse, not better - and that applies to both maintaining the status quo and making improvements to resolve homelessness.
Emergency shelters play a crucial role in ending homelessness. Like most communities, the past couple of decades saw an increase in shelter provision in the absence of a unified housing plan. However, the time has come to ensure that the shelter system gets right-sized while the housing response gets equally implemented. This is the only balanced approach to truly ending homelessness in the community. To maintain the status quo, the community will need 737 shelter beds available per day, each day, over the next five years. However, if the steps are taken to truly resolve homelessness in the community, only 452 shelter beds would be required each day over the next five years.
SERVICE GAPS & OPPORTUNITIES ORGCODE CONSULTING, INC. 23
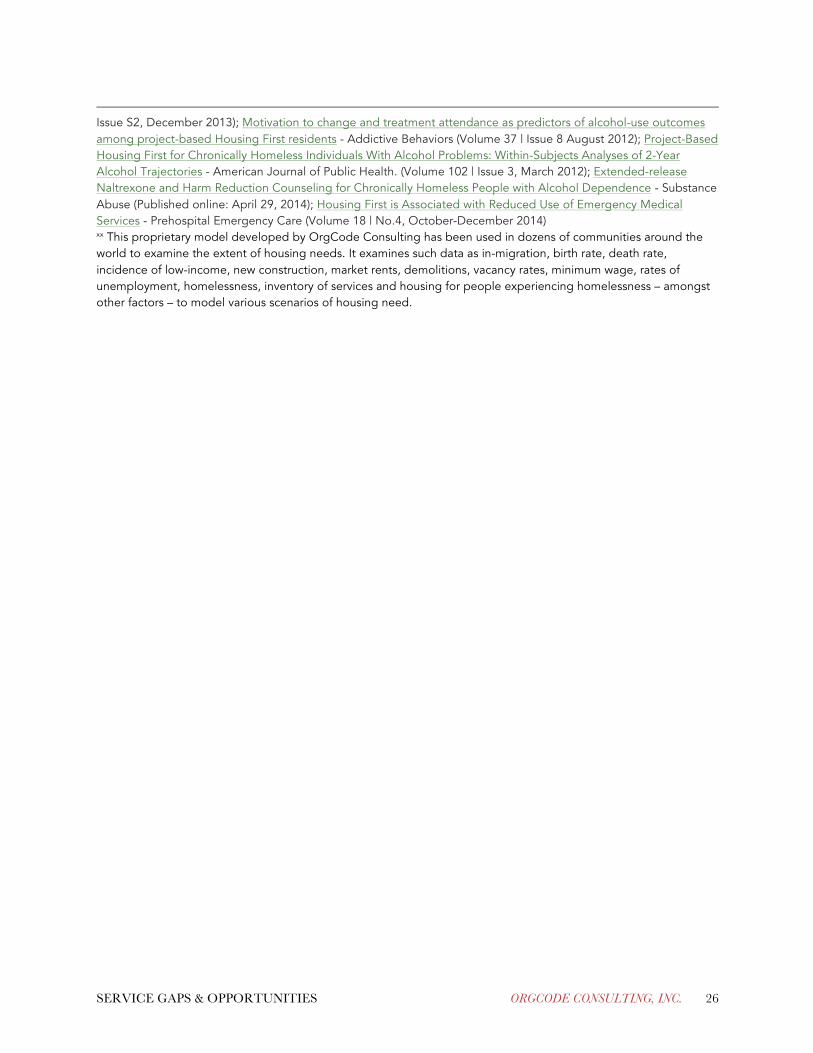
Conclusion Homelessness is solvable across Pima County. It will be necessary to use existing resources in a different way in order to get there. At the same time, new resources have to be used in the right way in order to achieve the intended results. Undoubtedly, there is a mismatch between what the acuity levels of persons is indicated to be in the VI-SPDAT and the existing services (including access to services) in the community. The under-utilization of existing beds is a great problem, especially when demand is so apparent. Meanwhile, resources, such as Transitional Housing, continue to be used at a scale that is out of touch with the demands in the community. If the community truly wants to get to a place where homelessness is ended (as in homelessness is of a short-term duration and not repeated), then investment in the right types of support and housing resources will be necessary over the next 10 years with a concerted effort over the next five years to really turn the page.

SERVICE GAPS & OPPORTUNITIES ORGCODE CONSULTING, INC. 24
This report was prepared by Iain De Jong of OrgCode Consulting, Inc. with further analysis conducted
by Zach Brown and Amanda Sisson.
Errors and omissions are those of the authors.

SERVICE GAPS & OPPORTUNITIES ORGCODE CONSULTING, INC. 25
Endnotes i This is based upon a cursory examination of available VI-SPDAT from Salt Lake County, Utah; St. Louis County, Missouri; and Palm Beach County, Florida. ii Based upon Utilization Rate data from 2010-2015 provided by the County. iii Six qualitative interviews were conducted with various service providers in Pima County, as well as HMIS staff, in July 2015. As part of the semi-structured interview process, each participant in the process was asked about the unmet needs of people experiencing homelessness. More shelter was the most common response from these interviews. iv Demand analysis was completed using bed inventory data provided by the County that was inputted along with other housing market data collected by OrgCode Consulting, to run various models of demand. v Kuehl, Martina. (2010). City of Tucson and Pima County 5-Year HUD Consolidated Plan, July 1, 2010-June 30,
2014. vi The 2015 Arizona State Housing Profile. (2015). National Low Income Housing Coalition.
http://nlihc.org/sites/default/files/2015-SHP-AZ.pdf. vii ibid viii ibid ix ibid x The primary source of this data comes from the Point in Time Count. As such, this data may be interpreted as an under representation of the extent of the issue, as Point in Time Count data is generally accepted as the minimum number of persons experiencing homelessness on any given night. xi The VI-SPDAT (Vulnerability Index-Service Prioritization Decision Assistance Tool) is a self-reported triage tool of primary issues related to homelessness to help guide and navigate each person towards the most appropriate support and housing intervention. xii As the Family VI-SPDAT was not yet programmed into ServicePoint, the community has not collected acuity information about families experiencing homelessness. Throughout the United States, most families that are assessed would benefit most from Rapid ReHousing as a starting point. Less than 10% of families in places like Maricopa County or District of Columbia require Permanent Supportive Housing. There are also many families that are truly having a housing emergency and will not remain in the homeless service delivery system very long before progressing to independent housing – and achieve this without ongoing subsidy or considerable support from homeless service providers. xiii The threshold at which PSH is considered as a first attempt over RRH is 10 in VI-SPDAT Version 1. Because of the absence of the preferred amount of PSH in communities, many consider RRH as a viable option to try with those that score 10, 11 and even 12. xiv It is not uncommon for CoCs to have expanded housing options in this way. Over the past couple decades, HUD has had various funding priorities, for example, with different types of services and built forms being preferred. If one were to examine this trend nationally, one would see, for example, considerably more PSH in the northeast, with a lot more transitional housing in the southern and western parts of the country. xv An alternate examination may lead one to conclude that the utilization rates went down because of access issues to shelter whereby restrictive rules and barring practices make shelter access very difficult and therefore decrease utilization. One would expect an uptick in unsheltered homelessness at a comparable rate if this were true. That has not happened. xvi Whether or not any of the existing shelter providers have the interest or capacity to make adjustments to their current shelter operations was beyond the scope of this study. xvii Approximately 300 units of transitional housing were underutilized. xviii Stellar examples of this type of change from transitional housing to different types of housing can be seen in Fresno, CA; Providence, RI; and Montgomery County, PA. xix See, for example, evaluations of the DESC 1811 Eastlake Housing Retention in Single-Site Housing First for Chronically Homeless Individuals with Severe Alcohol Problems - American Journal of Public Health (Volume 103 |
SERVICE GAPS & OPPORTUNITIES ORGCODE CONSULTING, INC. 26
Issue S2, December 2013); Motivation to change and treatment attendance as predictors of alcohol-use outcomes among project-based Housing First residents - Addictive Behaviors (Volume 37 | Issue 8 August 2012); Project-Based Housing First for Chronically Homeless Individuals With Alcohol Problems: Within-Subjects Analyses of 2-Year Alcohol Trajectories - American Journal of Public Health. (Volume 102 | Issue 3, March 2012); Extended-release Naltrexone and Harm Reduction Counseling for Chronically Homeless People with Alcohol Dependence - Substance Abuse (Published online: April 29, 2014); Housing First is Associated with Reduced Use of Emergency Medical Services - Prehospital Emergency Care (Volume 18 | No.4, October-December 2014) xx This proprietary model developed by OrgCode Consulting has been used in dozens of communities around the world to examine the extent of housing needs. It examines such data as in-migration, birth rate, death rate, incidence of low-income, new construction, market rents, demolitions, vacancy rates, minimum wage, rates of unemployment, homelessness, inventory of services and housing for people experiencing homelessness – amongst other factors – to model various scenarios of housing need.


![Hospice Through a ‘[insert community]’ Lens: Brief Basics, Gaps, and Opportunities Barry K. Baines, MD](https://img.pdfslide.us/doc/110x75/56649e845503460f94b85309/hospice-through-a-insert-community-lens-brief-basics-gaps-and-opportunities.jpg)