Embed Size (px)
Citation preview
Department of Infrastructure, Local Government and Planning
Service Delivery Statements
Queensland Budget 2016-17

2016-17 Queensland Budget Papers1. Budget Speech
2. Budget Strategy and Outlook
3. Capital Statement
4. Budget Measures
5. Service Delivery Statements
Appropriation Bills
Budget Highlights
The Budget Papers are available online at
www.budget.qld.gov.au
© Crown copyright All rights reservedQueensland Government 2016
Excerpts from this publication may be reproduced, with appropriate acknowledgement, as permitted under the Copyright Act.
Service Delivery Statements
ISSN 1445-4890 (Print)ISSN 1445-4904 (Online)

Department of Infrastructure, Local Government and
Planning
Summary of portfolio
Page Department of Infrastructure, Local Government and Planning
3 Department of Infrastructure, Local Government and Planning - controlled
Department of Infrastructure, Local Government and Planning - administered
33 Building Queensland
34 Queensland Reconstruction Authority
42 South Bank Corporation
48 Trade and Investment Queensland
60 Economic Development Queensland
Portfolio overview
Ministerial and portfolio responsibilities
The table below represents the agencies and services that are the responsibility of the Deputy Premier, Minister for Infrastructure, Local Government and Planning and Minister for Trade and Investment, and the Assistant Minister for Local Government.
Deputy Premier, Minister for Infrastructure, Local Government
and Planning and Minister for Trade and Investment
The Honourable Jackie Trad MP
Assistant Minister for Local Government
The Honourable Jennifer Howard MP
Department of Infrastructure, Local Government and Planning
Director-General: Frankie Carroll
Service area 1: Local Government
Service area 2: Funding Programs and Community Initiatives
Service area 3: Infrastructure Policy and Planning
Service area 4: Better Planning for Queensland
The Deputy Premier, Minister for Infrastructure, Local Government and Planning and Minister for Trade and Investment is also responsible for:
Building Queensland
Chief Executive Officer: David Quinn
Objective: To provide the Queensland Government with independent, expert advice on major infrastructure by working with departments, government owned corporations and statutory authorities to guide better infrastructure decision making.
2016-17 Queensland State Budget – Service Delivery StatementsDepartment of Infrastructure, Local Government and Planning
1

Queensland Reconstruction Authority
Acting Chief Executive Officer: Brendan Moon
Objective: To increase the disaster resilience of Queensland communities and demonstrate accountability in the use of natural disaster funding by coordinating the rapid restoration of communities following natural disasters.
South Bank Corporation
Chief Executive Officer: Jeffrey Weigh
Objective: To manage and facilitate varied and innovative use of land and other property within the Corporation area for a diverse range of commercial and non-commercial activities and events.
Trade and Investment Queensland
Interim Chief Executive Officer: Jack Noye
Objective: Trade and Investment Queensland delivers services to develop sustainable export markets, improve export capabilities for Queensland exporters and promote investment opportunities in Queensland to international investors.
Economic Development Queensland
General Manager: Greg Chemello
Objective: To drive business and economic growth in Queensland.
Additional information about these agencies can be sourced from:
www.dilgp.qld.gov.au
http://buildingqueensland.qld.gov.au/
www.qldreconstruction.org.au
www.southbankcorporation.com.au
www.tiq.qld.gov.au
www.dilgp.qld.gov.au/local-government/about-us/economic-development-queensland.html
2016-17 Queensland State Budget – Service Delivery StatementsDepartment of Infrastructure, Local Government and Planning
2

Departmental overview
The Department of Infrastructure, Local Government and Planning within Queensland is well placed to support and promote the transition of the economy from the resources boom to one focused on a modern service-based economy with diverse industries, sustainable and sound planning and development and opportunities for long-term job creation. The department's priorities are directed towards the liveability, sustainability and prosperity of communities across the State, driving social cohesion and protecting our unique natural environment.
With a vision for building great cities, towns and communities in Queensland with great places to live, work and play, the department delivers integrated and future-shaping advice and solutions through leading expertise and quality partnerships.
The department contributes to the Government's objectives for the community by driving initiatives that promote job creation within a diverse and vibrant economy, endorsing safe and environmentally aware development, delivering quality advice and services, working collaboratively with the local government sector and by promoting caring and connected communities.
The department's strategic objectives are:
increased economic, social and environmental benefits for Queenslanders a growing and prosperous South East Queensland greater liveability and connectedness in coastal communities resilient, strong and sustainable rural and remote communities to maintain a high performing, innovative, diverse and engaged workforce.
In 2016-17 the department's key priorities are to:
coordinate and monitor delivery of the $2 billion State Infrastructure Fund, established to support the implementationof the State Infrastructure Plan and focusing on infrastructure projects that enhance productivity and support jobs
embed the Infrastructure Portfolio Office functions across government to monitor the implementation of theState Infrastructure Plan
drive the State’s infrastructure delivery program, ensuring whole-of-government integration with infrastructureplanning and delivery
drive the transition to the new planning system, including cultural change, in collaboration with local governments complete the integrated review of the State Planning Policy, the State Development Assessment Provisions and the
Planning Regulation to ensure these instruments are working effectively in the lead up to the commencement of theState Planning Act 2016
deliver the Ageing in Place pilot project in regional Queensland to assist people as they enter their senior years byproviding suitable housing options to enable them to stay in their towns, close to friends and family
further develop Queensland’s largest waterfront urban renewal project at Northshore Hamilton, including $50 millionof public infrastructure works for major road upgrades, wharf demolition and new river-walks
release and administer the 2016-17 Local Government Grants and Subsidies Program and targeted fundingprograms to support Indigenous councils
build resilience to natural disasters through the RACQ Get Ready Queensland program build the capacity and capability of local governments through the 2016-17 Local Government Capacity Building
Program undertake a review of the councillor conduct complaints process.
In recognising the State's geographical and social diversity and in pursuing and supporting growth in emerging industries and new markets, the department will take a multi-dimensional approach by designing targeted strategies and programs that take into account the diverse macro-economic drivers that operate in the second largest state in the Commonwealth.
In 2016-17 the department will create policies and drive initiatives, based on an understanding of the varied challenges and possibilities in the south-east of the State, along the vast coastline and in remote and rural areas, to facilitate expansion and investment and to reinvigorate prospects for sustainable growth and economic prosperity across Queensland.
2016-17 Queensland State Budget – Service Delivery StatementsDepartment of Infrastructure, Local Government and Planning
3

Service performance
Performance statement
Local Government
Service area objective
To provide a legislative and regulatory framework for local governments to enhance their capability and decision making processes.
Service area description
The service area undertakes the:
review and maintenance of the Queensland local government regulatory framework and provision of strategic policycoordination for local government related matters across Queensland Government portfolios. It delivers governanceand statutory services related to portfolio legislation including the provision of legal advice and policy developmentand coordination
Local Government Capacity Building Program - a calendar of workshops, information sessions, targeted training andthe development and publication of capacity building tools and resources. The annual program varies according tothe demands of the four year local government election cycle with the year preceding the election and the year of theelection having more face to face training activities and workshops.
Services
Governance and statutory services Local government capacity building
2016-17 service area highlights
The 2016-17 Local Government Capacity Building Program will include:
financial reporting training for local government finance professionals sponsorship of up to 60 local government employees to undertake the Local Government Association of
Queensland's Diploma of Local Government Administration partnering with Queensland Treasury Corporation to undertake business reviews and provide specialised advisory
services for small rural, remote and Indigenous local governments delivery of a program of governance training, including councillors' roles, responsibilities and obligations, dealing with
councillors' interests, ethics and accountability and meeting procedures partnering with the Local Government Association of Queensland to deliver training on fraud management.
Review of the Councillor Conduct Complaints Process:
A review of the provisions dealing with complaints about the conduct of councillors in the Local Government Act 2009
and the City of Brisbane Act 2010 will be undertaken in 2016-17. The purpose of the review is to ensure a fair,transparent and accountable system is in place to effectively manage complaints about councillor conduct.
The review will examine the statutory provisions relating to complaints, to assess the effectiveness of the currentlegislative and policy framework and make recommendations about policy, legislative and operational changesrequired to improve the system of councillor conduct complaints.
The review will be overseen by a three-person panel chaired by the former Integrity Commissioner, Dr DavidSolomon, and representatives of the Local Government Association of Queensland and the Local GovernmentManagers Australia Queensland Inc.
2016-17 Queensland State Budget – Service Delivery StatementsDepartment of Infrastructure, Local Government and Planning
4

Department of Infrastructure, Local
Government and Planning Notes
2015-16
Target/Est.
2015-16
Est. Actual
2016-17
Target/Est.
Service area: Local Government1
Service: Governance and statutory
services
Service standards
Effectiveness measures
Level of satisfaction of local governments (Mayors and CEOs) that the regulatory framework gives them the authority and capacity to manage their interests, to be financially sustainable and accountable 2, 3, 5 85% .. 85%
Level of satisfaction of local governments (Mayors and CEOs) with the timeliness, effectiveness and consistency of advice and services provided by the department 2, 4, 5 85% .. 85%
Efficiency measure
Average cost of administering and managing the councillor conduct complaints process per local government 2, 6 $12,000 $12,000 $12,600
Service: Local government capacity
building
Service standards
Effectiveness measure
Extent to which participants believe that capacity building programs and initiatives increase their understanding of local government roles and responsibilities 7, 8, 9 75% 92% 75%
Efficiency measure
Cost of capacity building per local government 7, 10, 11 $13,800 $19,000 $17,750
Notes: 1. This is a new service area for the 2016-17 Service Delivery Statement (SDS). It combines the previous service areas of Local Government
capacity building and Governance and statutory services.
2. This service standard was reported in the 2015-16 SDS service area of Governance and Statutory Services.3. Mayors and CEOs are asked to comment on the overall effectiveness of the regulatory framework in enabling them to perform their
fundamental roles.4. The components of timeliness, effectiveness and consistency together measure local governments’ overall satisfaction with departmental
advice and services.5. The annual survey of Mayors and Council Chief Executive Officers, usually undertaken in March, did not occur in the 2015-16 financial
year due to the timing of the 2016 Queensland local government quadrennial elections. In future, the annual survey will be undertaken inthe second half of the calendar year.
6. The councillor conduct complaint management administration process includes costs associated with the Remuneration and DisciplineTribunal and the Regional Conduct Review Panels averaged across 76 local governments within the statutory requirements of the processover time. Brisbane City Council is excluded as it has a separate councillor conduct complaint management process.
7. This service standard was reported in the 2015-16 SDS service area of Capacity Building.
2016-17 Queensland State Budget – Service Delivery StatementsDepartment of Infrastructure, Local Government and Planning
5
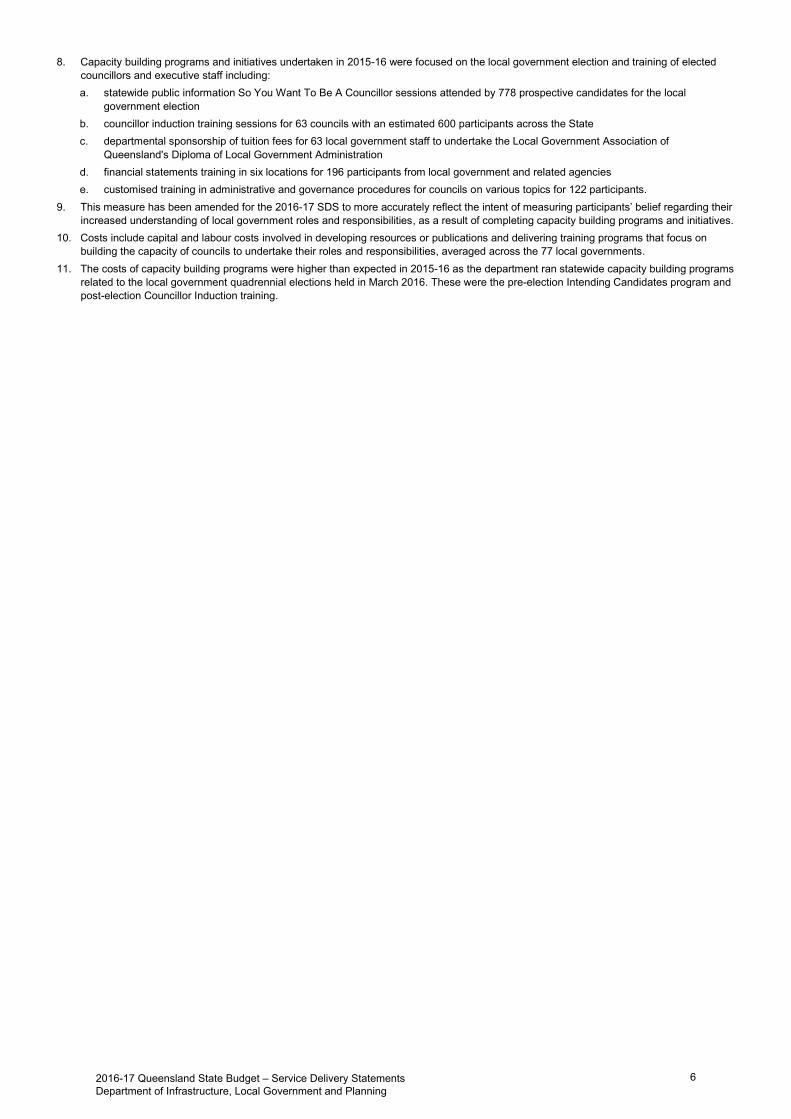
8. Capacity building programs and initiatives undertaken in 2015-16 were focused on the local government election and training of electedcouncillors and executive staff including:a. statewide public information So You Want To Be A Councillor sessions attended by 778 prospective candidates for the local
government electionb. councillor induction training sessions for 63 councils with an estimated 600 participants across the Statec. departmental sponsorship of tuition fees for 63 local government staff to undertake the Local Government Association of
Queensland's Diploma of Local Government Administrationd. financial statements training in six locations for 196 participants from local government and related agenciese. customised training in administrative and governance procedures for councils on various topics for 122 participants.
9. This measure has been amended for the 2016-17 SDS to more accurately reflect the intent of measuring participants’ belief regarding theirincreased understanding of local government roles and responsibilities, as a result of completing capacity building programs and initiatives.
10. Costs include capital and labour costs involved in developing resources or publications and delivering training programs that focus onbuilding the capacity of councils to undertake their roles and responsibilities, averaged across the 77 local governments.
11. The costs of capacity building programs were higher than expected in 2015-16 as the department ran statewide capacity building programsrelated to the local government quadrennial elections held in March 2016. These were the pre-election Intending Candidates program andpost-election Councillor Induction training.
2016-17 Queensland State Budget – Service Delivery StatementsDepartment of Infrastructure, Local Government and Planning
6

Funding Programs and Community Initiatives
Service area objective
The objective of the service area is to:
administer the department’s local government and community funding programs to maximise program objectives, inaccordance with budget forecasts and within agreed timeframes
build community preparedness and resilience for natural disasters and emergency events.
Service area description
This service area undertakes the assessment and evaluation of submissions for funding and administers the funding and grants for local government projects and community activities. Funding is delivered under the Local Government Grants and Subsidies Program, grants to Indigenous Councils and community based grants. The funding provided enables councils to deliver and maintain resilient community infrastructure and essential services.
The service area promotes natural disaster awareness and preparedness through initiatives such as the RACQ Get Ready Queensland program and supports other community initiatives.
Services
Delivery of local government and community funding programs Natural disaster preparedness and resilience
2016-17 service area highlights
Release of funding programs to support Indigenous councils. Water and Wastewater Capacity Building program phase 2. Implementation of a 10 year action plan for Bundaberg Flood Protection Scoping Study. Release of the 2016-17 Local Government Grants and Subsidies Program. RACQ Get Ready Queensland week in October 2016. Get Ready Queensland Resilient Australia Awards 2016.
Department of Infrastructure, Local
Government and Planning Notes
2015-16
Target/Est.
2015-16
Est. Actual
2016-17
Target/Est.
Service area: Funding Programs and
Community Initiatives1
Service: Delivery of local government
and community funding programs
Service standards
Effectiveness measure
Percentage of funded projects administered according to agreed timeframes and budget allocation 2, 3 90% 100% 90%
Efficiency measure
Administration costs as a percentage of all funding distributed 2, 4 0.75% <0.65% <0.65%
Service: Natural disaster
preparedness and resilience
2016-17 Queensland State Budget – Service Delivery StatementsDepartment of Infrastructure, Local Government and Planning
7

Department of Infrastructure, Local
Government and Planning Notes
2015-16
Target/Est.
2015-16
Est. Actual
2016-17
Target/Est.
Service standards
Effectiveness measure
Level of community resilience as measured by the Queensland Resilience Index 5 New measure New measure 5%
Efficiency measure
Cost per Queenslander of the department’s Get Ready Queensland Community Resilience program initiatives 6, 7 <$0.75 <$0.60 <$0.60
Notes: 1. This is a new service area for the 2016-17 Service Delivery Statement (SDS). It combines the previous service areas of Local Government
and Community Funding and Community Recovery and Resilience. 2. This service standard was reported in the 2015-16 SDS service area of Local Government and Community Funding.3. Funded projects include those approved under the Local government grants and subsidies program, the Community Resilience Fund and
the Natural Disaster Resilience Program.
4. Administration costs are total labour costs as a percentage of the total value of local government grants and subsidy funding distributed.5. This is a new service standard for the 2016-17 SDS. The Queensland Resilience Index (QRI) has been designed to measure changes in
the level of resilience shown by Queenslanders over time. The QRI uses a random representative sample of 800 Queenslanders withapproximately 50% drawn from the south-east corner and 50% from other regions in line with population distribution. The resilience indexwas benchmarked at 100 in 2013-14 and results of 104 were recorded in 2015-16. The target is to increase the level of resilience by 5%year on year.
6. This service standard was reported in the 2015-16 SDS service area of Community Recovery and Resilience.
7. The total cost of the department’s role in preparing and implementing the Get Ready Queensland Community Resilience programinitiatives, expressed as a cost to each Queenslander.
2016-17 Queensland State Budget – Service Delivery StatementsDepartment of Infrastructure, Local Government and Planning
8

Infrastructure Policy and Planning
Service area objective
To deliver quality infrastructure policy, planning and prioritisation in Queensland.
Service area description
This service area leads the Queensland Government’s efforts in developing and coordinating policy, planning and prioritisation of infrastructure activities. This includes the coordination of infrastructure policy, contributing to national infrastructure agendas and whole of state infrastructure planning. The service area is responsible for delivering an Infrastructure Program coordination function across government. It delivers reform initiatives that will improve the way infrastructure planning is coordinated, and strengthen integration with regional land-use and economic planning. The service area is responsible for ensuring infrastructure is prioritised on the basis that it provides a clear economic or service delivery benefit and will deliver the best possible value for money to Queenslanders on infrastructure investment.
A range of infrastructure policy, planning and coordination activities are undertaken by the service area including:
providing strategic policy, coordination, planning and prioritisation of infrastructure activities monitoring and updating the State Infrastructure Plan delivering a range of implementation initiatives outlined in the State Infrastructure Plan administering funding programs under the State Infrastructure Fund driving infrastructure innovation and best-practice across government and program coordination including value
sharing policy providing a cross-government perspective to infrastructure coordinating the state’s input and advice on infrastructure-related issues to the Australian Government implementing the Strategic Asset Management Plan Framework.
2016-17 service area highlights
Monitor and report on the delivery of the $180 million Significant Regional Infrastructure Projects Program, which willfund significant infrastructure projects in key regional centres that respond to a community need or provide increasedeconomic opportunities.
Develop proposals that were identified through community consultation on the State Infrastructure Plan from a$20 million fund allocated for Maturing the Infrastructure Pipeline Program.
Embed the Infrastructure Portfolio Office functions across government to monitor the implementation of the StateInfrastructure Plan, and drive infrastructure innovation and best-practice across the Queensland Government.
Provide support and advice to the Infrastructure Cabinet Committee to drive and oversee the State’s infrastructuredelivery program, ensuring whole-of-government integration of infrastructure planning and delivery.
Develop and implement a value capture/sharing policy and alternative funding models that leverage investmentsmore effectively.
Partner with other levels of government to investigate city deals for Queensland's city regions to drive the sustainablegrowth of our cities.
Deliver reform initiatives that target strengthened governance, organisational capability and integration, and ongoingindustry and community engagement around infrastructure planning and delivery to improve the way infrastructureplanning is coordinated across the Queensland Government.
Coordinate and monitor delivery of the $2 billion State Infrastructure Fund, established to support the implementationof the State Infrastructure Plan and focusing on infrastructure projects that enhance productivity and support jobs.
2016-17 Queensland State Budget – Service Delivery StatementsDepartment of Infrastructure, Local Government and Planning
9
Department of Infrastructure, Local
Government and Planning Notes
2015-16
Target/Est.
2015-16
Est. Actual
2016-17
Target/Est.
Service Area: Infrastructure Policy
and Planning1
Service standards
Effectiveness measure
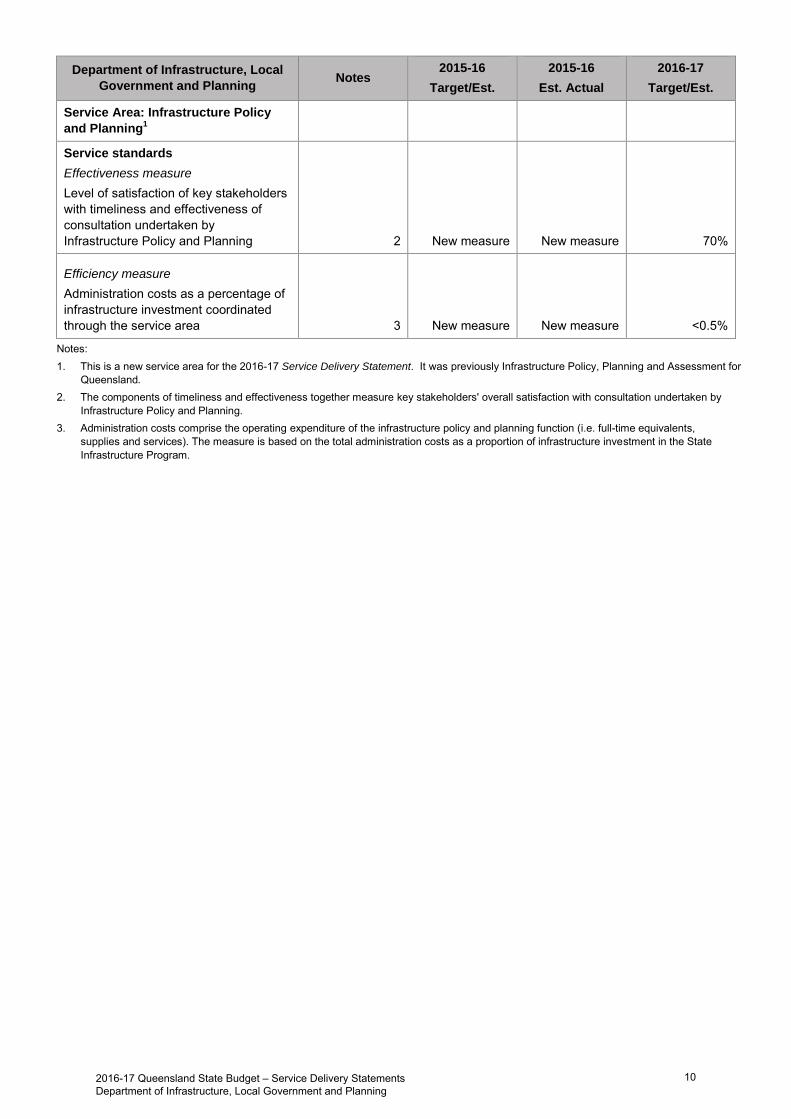
Level of satisfaction of key stakeholders with timeliness and effectiveness of consultation undertaken by Infrastructure Policy and Planning 2 New measure New measure 70%
Efficiency measure
Administration costs as a percentage of infrastructure investment coordinated through the service area 3 New measure New measure <0.5%
Notes: 1. This is a new service area for the 2016-17 Service Delivery Statement. It was previously Infrastructure Policy, Planning and Assessment for
Queensland.
2. The components of timeliness and effectiveness together measure key stakeholders' overall satisfaction with consultation undertaken byInfrastructure Policy and Planning.
3. Administration costs comprise the operating expenditure of the infrastructure policy and planning function (i.e. full-time equivalents,supplies and services). The measure is based on the total administration costs as a proportion of infrastructure investment in the State Infrastructure Program.
2016-17 Queensland State Budget – Service Delivery StatementsDepartment of Infrastructure, Local Government and Planning
10

Better Planning for Queensland
Service area objective
Deliver a streamlined planning framework that supports investment, jobs and community participation.
Service area description
The service area administers the Sustainable Planning Act 2009, and on commencement, the Planning Act 2016, and:
works with key stakeholders to provide a streamlined and simplified legislative framework and overarching policy forthe land use planning and development assessment system in Queensland
partners with regional stakeholders to prepare – and then lead delivery of – plans for regions, precincts and releaseareas that maximise the opportunities presented by each area and that both influence and respond to the StateInfrastructure Plan
delivers practical, effective and regionally-focused land use planning and development assessment services incollaboration with applicants, councils and agencies that attract investment and deliver balanced developmentoutcomes.
2016-17 service area highlights
Drive successful transition to the new planning system, including cultural change, in collaboration with localgovernments.
Complete the integrated review of the State Planning Policy, the State Development Assessment Provisions and thePlanning Regulation to ensure these instruments are working effectively in the lead up to the commencement of thePlanning Act 2016.
Produce a draft South East Queensland Regional Plan. Introduce a statewide development assessment framework to facilitate investment in wind farms to contribute to the
Government’s renewable energy objectives. Enhance effectiveness and service levels of, and cross-agency support for, the integrated state assessment system.
Department of Infrastructure, Local
Government and Planning Notes
2015-16
Target/Est.
2015-16
Est. Actual
2016-17
Target/Est.
Service area: Better Planning
for Queensland1
Service standards
Effectiveness measure
Percentage of State Assessment and Referral Agency responses issued within agreed timeframes and budget allocation. 2 New measure New measure 80%
Efficiency measure
Median number of days taken to assess and issue State Assessment and Referral Agency: assessment manager decisions concurrency agency responses New measure New measure
17 days 20 days
Notes: 1. Due to the current legislative review process of the Queensland planning system, the department will trial new measures of effectiveness
and efficiency relating to the implementation of the new planning legislation and supporting instruments. These measures will be reported in the 2017-18 Service Delivery Statement.
2. Responses include assessment manager decisions and concurrency agency responses.
2016-17 Queensland State Budget – Service Delivery StatementsDepartment of Infrastructure, Local Government and Planning
11

Discontinued measures
Performance measures included in the 2015-16 Service Delivery Statements that have been discontinued or replaced are reported in the following table with estimated actual results.
Department of Infrastructure, Local
Government and Planning Notes
2015-16
Target/Est.
2015-16
Est. Actual
2016-17
Target/Est.
Service area: Better Planning for
Queensland
Percentage of total decisions or referral responses where the state is the Assessment Manager or Concurrence Agency are appealed 1 <2% <1%
Discontinued measure
Percentage of total referral responses or decision notices issued that do not require an additional information request 1 70% 87%
Discontinued measure
Note: 1. This measure has been discontinued and replaced with more exhaustive measures to appropriately reflect the service area.
2016-17 Queensland State Budget – Service Delivery StatementsDepartment of Infrastructure, Local Government and Planning
12

Administered items
Administered activities are those undertaken by departments on behalf of the Government.
The Department of Infrastructure, Local Government and Planning administers funds for other State agencies including Building Queensland, the Queensland Reconstruction Authority, and Trade and Investment Queensland.
In addition, the department administers Commonwealth funds on behalf of the State which include:
Australian Government Financial Assistance Grants - Under the Local Government (Financial Assistance) Act 1995
the Australian Government provides grant funding to support Queensland councils in delivering services to theircommunities. In 2015-16, $225.4 million was made available to local governments as untied funding.
Australian Government National Insurance Affordability Initiative – Ipswich and Roma – the Australian Government is contributing $17 million to build the Roma flood levee and to upgrade flood defences in Ipswich.
Further, the department administers funds paid to Brisbane City Council for the maintenance and management of the inner Brisbane City South Bank and Roma Street parklands. In 2015-16, a total of $23.3 million was paid for operational works and $4.1 million for capital works funding for both parklands.
Financial statements and variance explanations in relation to administered items appear in the departmental financial statements.
2016-17 Queensland State Budget – Service Delivery StatementsDepartment of Infrastructure, Local Government and Planning
13

Departmental budget summary
The table below shows the total resources available in 2016-17 from all sources and summarises how resources will be applied by service area and by controlled and administered classifications.
Department of Infrastructure, Local
Government and Planning
2015-16
Adj. Budget
$’000
2015-16
Est. Actual
$’000
2016-17
Budget
$’000
CONTROLLED
Income
Appropriation revenue1
Deferred from previous year/s 83,487 65,423 101,314
Balance of service appropriation 213,187 140,781 238,716
Other revenue 4,740 5,027 4,348
Total income 301,414 211,231 344,378
Expenses
Local Government 13,192 12,191 12,935
Funding Programs and Community Initiatives 233,264 161,316 253,470
Infrastructure Policy and Planning 5,407 6,508 27,052
Better Planning for Queensland 60,324 37,715 57,615
Total expenses 312,187 217,730 351,072
Operating surplus/deficit (10,773) (6,499) (6,694)
Net assets 79,817 87,788 97,976
ADMINISTERED
Revenue
Commonwealth revenue 462,480 237,401 450,094
Appropriation revenue 1,157,877 521,779 877,379
Other administered revenue 10,695 10,695 11,563
Total revenue 1,631,052 769,875 1,339,036
Expenses
Transfers to government 461,195 236,116 461,657
Administered expenses 1,169,857 533,759 877,379
Total expenses 1,631,052 769,875 1,339,036
Net assets 93 98 98
Note: 1. Appropriation revenue includes State and Commonwealth funding.
2016-17 Queensland State Budget – Service Delivery StatementsDepartment of Infrastructure, Local Government and Planning
14

Service area sources of revenue1
Sources of revenue
2016-17 Budget
Department of Infrastructure, Local
Government and Planning
Total cost
$’000
State
contribution
$’000
User
charges
and fees
$’000
C’wealth
revenue
$’000
Other
revenue
$’000
Local Government 12,935 12,474 461 .. ..
Funding Programs and Community Initiatives 253,470 236,719 20 9,292 745
Infrastructure Policy and Planning 27,052 27,030 22
Better Planning for Queensland 57,615 54,515 3,025 .. 75
Total 351,072 330,738 3,528 9,292 820
Note: 1. Explanations of variances are provided in the financial statements.
2016-17 Queensland State Budget – Service Delivery StatementsDepartment of Infrastructure, Local Government and Planning
15

Budget measures summary
This table shows a summary of budget measures relating to the department since the 2015-16 State Budget. Further details are contained in Budget Paper 4.
Department of Infrastructure, Local
Government and Planning
2015-16
$’000
2016-17
$’000
2017-18
$’000
2018-19
$’000
2019-20
$’000
Revenue measures
Administered .. .. .. .. ..
Departmental .. .. .. .. ..
Expense measures
Administered .. 4,854 5,133 5,266 6,809
Departmental1 1,610 44,351 25,744 13,572 13,139
Capital measures
Administered .. .. .. .. ..
Departmental .. 9,000 5,000 .. ..
Note: 1. Figures reconcile with Budget Paper 4, including the whole-of-government expense measures ‘Brisbane CBD government office agency
rental impacts’ and ‘Reprioritisation allocations’. These figures do not include Budget Paper 4 measures for the Significant Regional Infrastructure Projects Program and the State Infrastructure Fund, for which funding is held centrally.
2016-17 Queensland State Budget – Service Delivery StatementsDepartment of Infrastructure, Local Government and Planning
16

Departmental capital program
The department's capital program primarily relates to capital works undertaken for Indigenous local councils. Historically the majority of this work has taken place under the Indigenous State Infrastructure Program (ISIP); however this $63 million program is expected to end in 2016-17 with forecast expenditure of $4 million to complete remaining projects including projects in Wujal Wujal, and Palm Island. The goal of ISIP is to improve environmental health conditions for people living in major communities in Indigenous council areas by providing safe and secure drinking water, safe sewerage systems, safe solid waste disposal arrangements, reductions in vector environments (such as mosquitoes) and dust reduction through sealed roads.
In 2016-17 two new capital works projects are to commence, one to replace waste water infrastructure at Cherbourg at a cost of $15 million over two years ($10 million in 2016-17 and $5 million in 2017-18), and the other to replace/improve water infrastructure at Palm Island as part of the Palm Island Water Shortage project at a cost of $2.5 million.
The balance of the department's capital budget relates to works undertaken to complete the Development Assessment System (MyDAS). MyDAS is an online system introduced in 2013 that enables: online lodgement of development applications, tracking through the Integrated Development Assessment System process, integration with the development assessment mapping system, and electronic payment of fees.
Capital budget
Department of Infrastructure, Local
Government and Planning Notes
2015-16
Adj. Budget
$’000
2015-16
Est. Actual
$’000
2016-17
Budget
$’000
Capital purchases1
Total land, buildings and infrastructure .. .. ..
Total plant and equipment 7,192 3,120 16,598
Total other capital .. 2,543 1,859
Total capital purchases 7,192 5,663 18,457
Note: 1. For more detail on the agency’s capital acquisitions please refer to Budget Paper 3.
2016-17 Queensland State Budget – Service Delivery StatementsDepartment of Infrastructure, Local Government and Planning
17

Staffing1
Department of Infrastructure, Local
Government and Planning Notes
2015-16
Adj. Budget
2015-16
Est. Actual
2016-17
Budget
Local Government 76 78 79
Funding Programs and Community Initiatives 53 48 48
Infrastructure Policy and Planning 2 19 28 53
Better Planning for Queensland 230 235 227
TOTAL 3 378 389 407
Notes: 1. Full-time equivalents (FTEs) as at 30 June.2. The increase in the 2016-17 Budget reflects the establishment of an Infrastructure Portfolio Office to coordinate and integrate State
Government infrastructure, land-use and economic planning.3. The 2015-16 Adjusted Budget has been reduced from 412 FTEs to 378 FTEs to reflect the transfer of 30 FTEs on creation of the Building
Queensland statutory body (3 December 2015), the transfer of six FTEs responsible for administering the Natural Disaster Relief RecoveryArrangements to the Queensland Reconstruction Authority (1 January 2016) and the transfer-in of two FTEs from the Department ofHousing and Public Works for the Office of the Queensland Government Architect (8 December 2015).
2016-17 Queensland State Budget – Service Delivery StatementsDepartment of Infrastructure, Local Government and Planning
18

Chart: Total departmental expenses across the Forward Estimates period
Departmental balance sheet
The department's major assets are in property, plant and equipment ($57 million) and intangibles ($7.4 million). Property, plant and equipment is expected to decrease over the forward estimates period as construction of infrastructure assets are completed and transferred to Indigenous local councils.
Budgeted financial statements
Analysis of budgeted financial statements
An analysis of the department's financial position, as reflected in the department's financial statements, is provided below.
Departmental income statement
Total expenses are estimated to be $351.1 million in 2016-17, an increase of $133.3 million from the 2015-16 financial year. The increase is mainly due to increased expenditure for the Local Government Grants and Subsidies Program; the Community Resilience Fund; the Gold Coast 2018 Commonwealth Games Athletes Village; the Yeppoon and Rockhampton Revitalisation Projects; the Planning Reform Program; the fast tracking of the early stages of infrastructure projects, and the coordination and integration of infrastructure planning and delivery.
The forecast deficit for the department in 2016-17 is $6.7 million. This is primarily due to the transfer of infrastructure assets to Indigenous local councils for nil consideration under the Indigenous State Infrastructure Program.
The decrease in total departmental expenses after 2016-17 is a result of the completion of the Community Resilience Fund, the Yeppoon and Rockhampton Revitalisation Projects, and the Royalties for the Regions Program.
0
50,000
100,000
150,000
200,000
250,000
300,000
350,000
400,000
2015‐16 2016‐17 2017‐18 2018‐19 2019‐20
$'000
Financial year
Total expenses
Total expenses
2016-17 Queensland State Budget – Service Delivery StatementsDepartment of Infrastructure, Local Government and Planning
19

Controlled income statement
Department of Infrastructure, Local Government and Planning
Notes
2015-16Adjusted
Budget$'000
2015-16 Est. Act.
$'000
2016-17 Budget
$'000
INCOME
Appropriation revenue 1,5,9 296,674 206,204 340,030
Taxes .. .. ..
User charges and fees 3,453 3,567 3,378
Royalties and land rents .. .. ..
Grants and other contributions 833 994 558
Interest 454 466 412
Other revenue .. .. ..
Gains on sale/revaluation of assets .. .. ..
Total income 301,414 211,231 344,378
EXPENSES
Employee expenses 2,6,10 42,700 41,474 45,766
Supplies and services 3,7,11 48,379 26,791 67,014
Grants and subsidies 4,8,12 220,365 148,722 237,549
Depreciation and amortisation 472 472 472
Finance/borrowing costs .. .. ..
Other expenses 271 271 271
Losses on sale/revaluation of assets .. .. ..
Total expenses 312,187 217,730 351,072
OPERATING SURPLUS/(DEFICIT) (10,773) (6,499) (6,694)
2016-17 Queensland State Budget – Service Delivery StatementsDepartment of Infrastructure, Local Government and Planning
20

Controlled balance sheet
Department of Infrastructure, Local Government and Planning
Notes 2015-16 Budget
$'000
2015-16 Est. Act.
$'000
2016-17 Budget
$'000
CURRENT ASSETS
Cash assets 13,19 25,340 22,257 22,167
Receivables 14,20 4,707 2,751 2,751
Other financial assets .. .. ..
Inventories .. .. ..
Other 16 .. ..
Non-financial assets held for sale .. .. ..
Total current assets 30,063 25,008 24,918
NON-CURRENT ASSETS
Receivables 25,358 25,358 24,667
Other financial assets .. .. ..
Property, plant and equipment 15,21,25 43,909 47,621 57,050
Intangibles 16,22,26 1,686 5,907 7,447
Other .. .. ..
Total non-current assets 70,953 78,886 89,164
TOTAL ASSETS 101,016 103,894 114,082
CURRENT LIABILITIES
Payables 17,23 19,389 14,474 14,474
Accrued employee benefits 1,810 1,620 1,620
Interest bearing liabilities and derivatives .. .. ..
Provisions .. .. ..
Other .. .. ..
Total current liabilities 21,199 16,094 16,094
NON-CURRENT LIABILITIES
Payables .. 12 12
Accrued employee benefits .. .. ..
Interest bearing liabilities and derivatives .. .. ..
Provisions .. .. ..
Other .. .. ..
Total non-current liabilities .. 12 12
TOTAL LIABILITIES 21,199 16,106 16,106
NET ASSETS/(LIABILITIES) 79,817 87,788 97,976
EQUITY
TOTAL EQUITY 18,24,27 79,817 87,788 97,976
2016-17 Queensland State Budget – Service Delivery StatementsDepartment of Infrastructure, Local Government and Planning
21

Controlled cash flow statement
Department of Infrastructure, Local Government and Planning
Notes 2015-16 Budget*
$'000
2015-16 Est. Act.
$'000
2016-17 Budget
$'000
CASH FLOWS FROM OPERATING ACTIVITIES
Inflows:
Appropriation receipts 28,35,42 296,674 193,050 340,030
User charges and fees 3,453 3,567 3,378
Royalties and land rent receipts .. .. ..
Grants and other contributions 833 994 558
Interest received .. 12 ..
Taxes .. .. ..
Other .. .. ..
Outflows:
Employee costs 29,36,43 (42,700) (41,474) (45,766)
Supplies and services 30,37,44 (48,379) (25,977) (67,014)
Grants and subsidies 31,38,45 (212,633) (145,709) (230,533)
Borrowing costs .. .. ..
Other (271) (1,085) (271)
Net cash provided by or used in operating activities (3,023) (16,622) 382
CASH FLOWS FROM INVESTING ACTIVITIES
Inflows:
Sales of non-financial assets .. .. ..
Investments redeemed .. .. ..
Loans and advances redeemed 1,103 1,103 1,103
Outflows:
Payments for non-financial assets 32,39,46 (7,284) (5,755) (18,457)
Payments for investments .. .. ..
Loans and advances made .. .. ..
Net cash provided by or used in investing activities (6,181) (4,652) (17,354)
CASH FLOWS FROM FINANCING ACTIVITIES
Inflows:
Borrowings .. .. ..
Equity injections 33,40,47 38,023 15,487 80,487
Outflows:
Borrowing redemptions .. .. ..
Finance lease payments .. .. ..
Equity withdrawals 34,41,48 (32,406) (23,461) (63,605)
Net cash provided by or used in financing activities 5,617 (7,974) 16,882
Net increase/(decrease) in cash held (3,587) (29,248) (90)
Cash at the beginning of financial year 28,927 51,505 22,257
Cash transfers from restructure .. .. ..
Cash at the end of financial year 25,340 22,257 22,167
*Technical adjustments have been made in this statement to reallocate amounts between categories and facilitate consistency acrossagencies.
2016-17 Queensland State Budget – Service Delivery StatementsDepartment of Infrastructure, Local Government and Planning
22

Administered income statement
Department of Infrastructure, Local Government and Planning
Notes
2015-16Adjusted
Budget$'000
2015-16 Est. Act.
$'000
2016-17 Budget
$'000
INCOME
Appropriation revenue 49,53,56 1,157,877 521,779 877,379
Taxes .. .. ..
User charges and fees 444 444 444
Royalties and land rents .. .. ..
Grants and other contributions 50,54,57 462,480 237,401 450,094
Interest .. .. ..
Other revenue 10,251 10,251 11,119
Gains on sale/revaluation of assets .. .. ..
Total income 1,631,052 769,875 1,339,036
EXPENSES
Employee expenses .. .. ..
Supplies and services .. .. ..
Grants and subsidies 51,55,58 1,169,857 533,759 877,379
Depreciation and amortisation .. .. ..
Finance/borrowing costs .. .. ..
Other expenses .. .. ..
Losses on sale/revaluation of assets .. .. ..
Transfers of Administered Revenue to Government 52,59 461,195 236,116 461,657
Total expenses 1,631,052 769,875 1,339,036
OPERATING SURPLUS/(DEFICIT) .. .. ..
2016-17 Queensland State Budget – Service Delivery StatementsDepartment of Infrastructure, Local Government and Planning
23

Administered balance sheet
Department of Infrastructure, Local Government and Planning
Notes 2015-16 Budget
$'000
2015-16 Est. Act.
$'000
2016-17 Budget
$'000
CURRENT ASSETS
Cash assets 105 15 15
Receivables 6 .. ..
Other financial assets .. .. ..
Inventories .. .. ..
Other .. .. ..
Non-financial assets held for sale .. .. ..
Total current assets 111 15 15
NON-CURRENT ASSETS
Receivables .. .. ..
Other financial assets .. .. ..
Property, plant and equipment 93 98 98
Intangibles .. .. ..
Other .. .. ..
Total non-current assets 93 98 98
TOTAL ASSETS 204 113 113
CURRENT LIABILITIES
Payables 111 15 15
Transfers to Government payable .. .. ..
Accrued employee benefits .. .. ..
Interest bearing liabilities and derivatives .. .. ..
Provisions .. .. ..
Other .. .. ..
Total current liabilities 111 15 15
NON-CURRENT LIABILITIES
Payables .. .. ..
Accrued employee benefits .. .. ..
Interest bearing liabilities and derivatives .. .. ..
Provisions .. .. ..
Other .. .. ..
Total non-current liabilities .. .. ..
TOTAL LIABILITIES 111 15 15
NET ASSETS/(LIABILITIES) 93 98 98
EQUITY
TOTAL EQUITY 93 98 98
2016-17 Queensland State Budget – Service Delivery StatementsDepartment of Infrastructure, Local Government and Planning
24

Administered cash flow statement
Department of Infrastructure, Local Government and Planning
Notes 2015-16 Budget*
$'000
2015-16 Est. Act.
$'000
2016-17 Budget
$'000
CASH FLOWS FROM OPERATING ACTIVITIES
Inflows:
Appropriation receipts 60,63,66 1,157,877 746,592 877,379
User charges and fees 444 532 444
Royalties and land rent receipts .. .. ..
Grants and other contributions 61,64,67 462,480 237,401 450,094
Interest received .. .. ..
Taxes .. .. ..
Other 10,251 10,251 11,119
Outflows:
Employee costs .. .. ..
Supplies and services .. .. ..
Grants and subsidies 62,65,68 (1,169,857) (758,996) (877,379)
Borrowing costs .. .. ..
Other .. .. ..
Transfers to Government (461,195) (461,353) (461,657)
Net cash provided by or used in operating activities .. (225,573) ..
CASH FLOWS FROM INVESTING ACTIVITIES
Inflows:
Sales of non-financial assets .. .. ..
Investments redeemed .. .. ..
Loans and advances redeemed .. .. ..
Outflows:
Payments for non-financial assets .. .. ..
Payments for investments .. .. ..
Loans and advances made .. .. ..
Net cash provided by or used in investing activities .. .. ..
CASH FLOWS FROM FINANCING ACTIVITIES
Inflows:
Borrowings .. .. ..
Equity injections .. .. ..
Outflows:
Borrowing redemptions .. .. ..
Finance lease payments .. .. ..
Equity withdrawals .. .. ..
Net cash provided by or used in financing activities .. .. ..
Net increase/(decrease) in cash held .. (225,573) ..
Cash at the beginning of financial year 105 225,588 15
Cash transfers from restructure .. .. ..
Cash at the end of financial year 105 15 15
*Technical adjustments have been made in this statement to reallocate amounts between categories and facilitate consistency acrossagencies.
2016-17 Queensland State Budget – Service Delivery StatementsDepartment of Infrastructure, Local Government and Planning
25

Income statementMajor variations between 2015-16 Adjusted Budget and 2015-16 Estimated Actual include:
1. The decrease is primarily due to re-profiling the timing of funding for the Community Resilience Fund, theRoyalties for the Regions Program, the Local Government Grants and Subsidies Program and the PlanningReform Program.
2. The decrease is primarily due to re-profiling the timing of expenditure for the Planning Reform Program due totiming changes on commencement of the Planning Act 2016.
3. The decrease is primarily due to re-profiling the timing of expenditure for the Planning Reform Program due totiming changes on commencement of the Planning Act 2016.
4. The decrease is primarily due to re-profiling the timing of expenditure for the Community Resilience Fund, theRoyalties for the Regions Program and the Local Government Grants and Subsidies Program.
Major variations between 2015-16 Adjusted Budget and 2016-17 Budget include:
5. The increase is primarily due to additional funding for the Yeppoon and Rockhampton Revitalisation Projects; theGold Coast 2018 Commonwealth Games (GC2018) Athletes Village; the Local Government Grants andSubsidies Program; the fast tracking of the early stages of infrastructure projects, and the coordination andintegration of infrastructure planning and delivery. This is partially offset by transition of funding for the Royaltiesfor the Regions Program (replaced by the Building Our Regions program in the Department of StateDevelopment), and completion of the Torres Strait Major Infrastructure Program (Stage 5) in 2015-16.
6. The increase is primarily due to establishing an Infrastructure Portfolio Office to coordinate and integrate StateGovernment infrastructure, land-use and economic planning.
7. The increase is principally due to additional expenditure to fast track the early stages of infrastructure projects; tocoordinate and integrate infrastructure planning and delivery; and to undertake the Palm Island Water ShortageProject.
8. The increase is primarily due to additional expenditure for the Yeppoon and Rockhampton Revitalisation Projects,and the GC2018 Athletes Village. This is partially offset by transition of expenditure for the Royalties for theRegions Program and the completion of the Torres Strait Major Infrastructure Program (Stage 5) in 2015-16.
Major variations between 2015-16 Estimated Actual and the 2016-17 Budget include:
9. The increase is primarily due to additional funding for the Local Government Grants and Subsidies Program; theCommunity Resilience Fund; the GC2018 Athletes Village; the Yeppoon and Rockhampton RevitalisationProjects; the Planning Reform Program; the fast tracking of the early stages of infrastructure projects, and thecoordination and integration of infrastructure planning and delivery. This is partially offset by the completion of theTorres Strait Major Infrastructure Program (Stage 5) in 2015-16.
10. The increase is primarily due to establishing an Infrastructure Portfolio Office to coordinate and integrate StateGovernment infrastructure, land-use and economic planning.
11. The increase is principally due to increased expenditure to fast track the early stages of infrastructure projects; tocoordinate and integrate infrastructure planning and delivery; to complete the Palm Island Water Shortage Projectand to support the Planning Reform Program due to timing changes on commencement of the Planning Act 2016.
12. The increase is primarily due to additional expenditure for the Local Government Grants and Subsidies Program;the Community Resilience Fund; the GC2018 Athletes Village and the Yeppoon and Rockhampton RevitalisationProjects. This is partially offset by the completion of the Torres Strait Major Infrastructure Program (Stage 5) in2015-16.
Balance sheetMajor variations between 2015-16 Budget and 2015-16 Estimated Actual include:
13. The decrease is primarily due to a reduction in funds held at year end as a result of reduced grant commitments.
14. The decrease principally relates to a reduction in invoices owing at year end.
15. The increase is primarily due to a change in value of water infrastructure assets held in the Northern PeninsulaArea.
Explanation of variances in the financial statements
2016-17 Queensland State Budget – Service Delivery StatementsDepartment of Infrastructure, Local Government and Planning
26

17. The decrease is primarily due to a reduction in accounts payable at year end.
18. The increase is principally due to a reduction in infrastructure assets transferred to Indigenous local councils atnil value and an increase in the asset revaluation reserve in respect of water infrastructure assets held in theNorthern Peninsula Area.
Major variations between 2015-16 Budget and 2016-17 Budget include:
19. The decrease is primarily due to a reduction in funds held at year end as a result of reduced grant commitments.
20. The decrease principally relates to a reduction in invoices owing at year end.
21. The increase principally relates to new funding for Cherbourg Wastewater Infrastructure.
22. The increase principally relates to expenditure on MyDAS.
23. The decrease is primarily due to a reduction in accounts payable at year end.
24. The increase principally relates to new funding for Cherbourg Wastewater Infrastructure, Palm Island WaterInfrastructure and an increase in the asset revaluation reserve in respect of water infrastructure assets held in theNorthern Peninsula Area.
Major variations between 2015-16 Estimated Actual and the 2016-17 Budget include:
25. The increase principally relates to new funding for Cherbourg Wastewater Infrastructure.
26. The increase principally relates to expenditure on MyDAS.
27. The increase principally relates to funding for Cherbourg Wastewater Infrastructure; Palm Island Water andWastewater Infrastructure; and MyDAS. This is partially offset by the forecast deficit for 2016-17.
Cash flow statementMajor variations between 2015-16 Budget* and 2015-16 Estimated Actual include:
28. The decrease is primarily due to re-profiling the timing of funding for the Community Resilience Fund, theRoyalties for the Regions Program, the Local Government Grants and Subsidies Program and the PlanningReform Program.
29. The decrease is primarily due to re-profiling the timing of expenditure for the Planning Reform Program due totiming changes on commencement of the Planning Act 2016.
30. The decrease is primarily due to re-profiling the timing of expenditure for the Planning Reform Program due totiming changes on commencement of the Planning Act 2016.
31. The decrease is primarily due to re-profiling the timing of expenditure for the Community Resilience Fund, theRoyalties for the Regions Program and the Local Government Grants and Subsidies Program.
32. The decrease principally relates to the construction of infrastructure assets on behalf of Indigenous localcouncils.
33. The decrease principally relates to the deferral of contributions for the GC2018 Athletes Village and theProgram Development Co-Investment Program.
34. The decrease principally relates to the deferral of contributions for the Program Development Co-investmentProgram.
Major variations between 2015-16 Budget* and 2016-17 Budget include:
35. The increase is primarily due to additional funding for the Yeppoon and Rockhampton Revitalisation Projects; theGC2018 Athletes Village; the Local Government Grants and Subsidies Program; the fast tracking of the earlystages of infrastructure projects, and the coordination and integration of infrastructure planning and delivery. Thisis partially offset by decreased funding for the Royalties for the Regions Program, and the completion of theTorres Strait Major Infrastructure Program (Stage 5) in 2015-16.
36. The increase is primarily due to establishing an Infrastructure Portfolio Office to coordinate and integrate StateGovernment infrastructure, land-use and economic planning.
37. The increase is principally due to additional expenditure to fast track the early stages of infrastructure projects; tocoordinate and integrate infrastructure planning and delivery; and to undertake the Palm Island Water ShortageProject.
16. The increase principally relates to expenditure on the Development Assessment System (MyDAS).
2016-17 Queensland State Budget – Service Delivery StatementsDepartment of Infrastructure, Local Government and Planning
27
38. The increase is due to additional expenditure for the Yeppoon and Rockhampton Revitalisation Projects, theCommonwealth Games Athletes Village. This is partially offset by decreased expenditure for the Royalties for theRegions Program and the completion of the Torres Strait Major Infrastructure Program (Stage 5) in 2015-16.
39. The increase principally relates to the construction of infrastructure assets on behalf of Indigenous local councils.
40. The increase principally relates to contributions received for the GC2018 Athletes Village and the ProgramDevelopment Co-Investment Program and for construction of infrastructure assets on behalf of Indigenous localcouncils.
41. The increase principally relates to increased contributions for the GC2018 Athletes Village and the ProgramDevelopment Co-Investment Program.
Major variations between 2015-16 Estimated Actual and the 2016-17 Budget include:
42. The increase is primarily due to additional funding for the Local Government Grants and Subsidies Program; theCommunity Resilience Fund; the GC2018 Athletes Village; the Yeppoon and Rockhampton RevitalisationProjects; the Planning Reform Program; the fast tracking of the early stages of infrastructure projects, and thecoordination and integration of infrastructure planning and delivery. This is partially offset by the completion of theTorres Strait Major Infrastructure Program (Stage 5) in 2015-16.
43. The increase is primarily due to establishing an Infrastructure Portfolio Office to coordinate and integrate StateGovernment infrastructure, land-use and economic planning.
44. The increase is principally due to increased expenditure to fast track the early stages of infrastructure projects; tocoordinate and integrate infrastructure planning and delivery; to complete the Palm Island Water Shortage Projectand to support the Planning Reform Program due to timing changes on commencement of the Planning Act 2016.
45. The increase is primarily due to additional expenditure for the Local Government Grants and Subsidies Program;the Community Resilience Fund; the GC2018 Athletes Village and the Yeppoon and Rockhampton RevitalisationProjects. This is partially offset by the completion of the Torres Strait Major Infrastructure Program (Stage 5) in2015-16.
46. The increase principally relates to the construction of infrastructure assets on behalf of Indigenous local councils.
47. The increase principally relates to contributions received for the GC2018 Athletes Village, the ProgramDevelopment Co-Investment Program and for construction of infrastructure assets on behalf of IndigenousLocal Councils.
48. The increase principally relates to increased contributions for the GC2018 Athletes Village and the ProgramDevelopment Co-Investment Program.
Administered income statementMajor variations between 2015-16 Adjusted Budget and 2015-16 Estimated Actual include:
49. The decrease is primarily due to a reduction of funds required by the Queensland Reconstruction Authority (QRA)as a result of utilisation of funding received in advance in prior financial years and by the advance payment for theFinancial Assistance Grants (FAG) in June 2015 that apples to 2015-16.
50. The decrease is primarily due to the advance payment in June 2015 for FAG that applies to 2015-16.
51. The decrease is primarily due to a reduction of funds required by the QRA as a result of utilisation of fundingreceived in advance in prior financial years and the advance payment for FAG to local governments that applies to2015-16.
52. The decrease is primarily due to the advance payment in June 2015 for FAG to local governments that applies to2015-16.
Major variations between 2015-16 Adjusted Budget and 2016-17 Budget include:
53. The decrease is primarily due to a reduction in funding required by the QRA as a result of declining NaturalDisaster Relief and Recovery Arrangements (NDRRA) project claims.
54. The decrease is primarily due to decreased funding for the Australian Government National Insurance AffordabilityInitiative (NIAI).
55. The decrease is primarily due to a reduction in funding required by the QRA as a result of declining NDRRAproject claims and decreased funding for NIAI.
2016-17 Queensland State Budget – Service Delivery StatementsDepartment of Infrastructure, Local Government and Planning
28

Major variations between 2015-16 Estimated Actual and the 2016-17 Budget include:
56. The increase is primarily due to advance funding for FAG in June 2015 that applies to 2015-16 and funding toQRA for NDRRA project claims.
57. The increase is primarily due to the advance payment in June 2015 for FAG that applies to 2015-16.
58. The increase is primarily due to increased funding for FAG and also an increase in funding required by the QRAdue to the utilisation of all funds received in advance during 2015-16. It does not correlate to increased NDRRAproject expenditure by the QRA in 2016-17.
59. The increase is primarily due to the advance payment in June 2015 for FAG to local governments that applies to2015-16.
Administered cash flow statementMajor variations between 2015-16 Budget* and 2015-16 Estimated Actual include:
60. The decrease is primarily due to a reduction of funds required by the QRA as a result of utilisation of fundingreceived in advance in prior financial years.
61. The decrease is primarily due to the advance payment in June 2015 for FAG that applies to 2015-16.
62. The decrease is due to a reduction of funds required by the QRA as a result of utilisation of funding received inadvance in prior financial years.
Major variations between 2015-16 Budget* and 2016-17 Budget include:
63. The decrease is primarily due to a reduction in funding required by the QRA as a result of decliningNDRRA project claims.
64. The decrease is primarily due to reduced funding for NIAI.
65. The decrease is due to a reduction in funding required by the QRA as a result of declining NDRRA project claimsand decreased funding for NIAI.
Major variations between 2015-16 Estimated Actual and the 2016-17 Budget include:
66. The increase is primarily due to the reduction of funds required by the QRA in 2015-16 as a result of utilisation offunding received in advance in prior financial years.
67. The increase is primarily due to the advance payment in June 2015 for FAG that applies to 2015-16.
68. The increase is primarily due to the reduction of funds required by the QRA in 2015-16 as a result of utilisation offunding received in advance in prior financial years.
2016-17 Queensland State Budget – Service Delivery StatementsDepartment of Infrastructure, Local Government and Planning
29

Reporting Entity Financial Statements
Reporting Entity comprises:
• Department of Infrastructure, Local Government and Planning (excluding Administered);
• Economic Development Queensland.
Reporting entity income statement
Department of Infrastructure, Local Government and Planning
Notes
2015-16Adjusted
Budget$'000
2015-16 Est. Act.
$'000
2016-17 Budget
$'000
INCOME
Appropriation revenue 296,674 206,204 340,030
Taxes .. .. ..
User charges and fees 134,880 124,966 97,201
Royalties and land rents .. .. ..
Grants and other contributions 15,833 2,594 1,958
Interest 4,833 8,073 5,399
Other revenue 17 .. 5
Gains on sale/revaluation of assets .. .. ..
Total income 452,237 341,837 444,593
EXPENSES
Employee expenses 57,811 55,132 61,087
Supplies and services 168,640 127,880 175,742
Grants and subsidies 202,253 132,165 201,970
Depreciation and amortisation 504 486 477
Finance/borrowing costs 3,969 2,639 2,169
Other expenses 16,384 10,840 8,946
Losses on sale/revaluation of assets .. 18,030 ..
Total expenses 449,561 347,172 450,391
Income tax expense/revenue 4,035 (3,553) 269
OPERATING SURPLUS/(DEFICIT) (1,359) (1,782) (6,067)
Explanations of variances for each entity are included in the individual budget financial statements located in this Service Delivery Statement.
2016-17 Queensland State Budget – Service Delivery StatementsDepartment of Infrastructure, Local Government and Planning
30

Reporting entity balance sheet
Department of Infrastructure, Local Government and Planning
Notes 2015-16 Budget
$'000
2015-16 Est. Act.
$'000
2016-17 Budget
$'000
CURRENT ASSETS
Cash assets 139,206 194,755 116,949
Receivables 16,890 24,232 24,606
Other financial assets .. .. ..
Inventories 409,939 307,869 337,667
Other 1,222 111 111
Non-financial assets held for sale .. .. ..
Total current assets 567,257 526,967 479,333
NON-CURRENT ASSETS
Receivables 52,090 20,891 114,018
Other financial assets .. .. ..
Property, plant and equipment 437,579 525,989 564,053
Deferred tax assets 8,217 2,466 2,466
Intangibles 1,686 5,907 7,447
Other .. .. ..
Total non-current assets 499,572 555,253 687,984
TOTAL ASSETS 1,066,829 1,082,220 1,167,317
CURRENT LIABILITIES
Payables 53,162 29,573 31,314
Current tax liabilities 4,035 (1,553) 269
Accrued employee benefits 1,810 1,620 1,620
Interest bearing liabilities and derivatives 21,136 21,426 61,860
Provisions .. 1,514 1,890
Other 17,895 14,463 14,463
Total current liabilities 98,038 67,043 111,416
NON-CURRENT LIABILITIES
Payables .. 12 12
Deferred tax liabilities 76,753 102,036 102,036
Accrued employee benefits .. .. ..
Interest bearing liabilities and derivatives 60,388 15,635 16,523
Provisions .. .. ..
Other .. .. ..
Total non-current liabilities 137,141 117,683 118,571
TOTAL LIABILITIES 235,179 184,726 229,987
NET ASSETS/(LIABILITIES) 831,650 897,494 937,330
EQUITY
TOTAL EQUITY 831,650 897,494 937,330
2016-17 Queensland State Budget – Service Delivery StatementsDepartment of Infrastructure, Local Government and Planning
31

Reporting entity cash flow statement
Department of Infrastructure, Local Government and Planning
Notes 2015-16 Budget*
$'000
2015-16 Est. Act.
$'000
2016-17 Budget
$'000
CASH FLOWS FROM OPERATING ACTIVITIES
Inflows:
Appropriation receipts 296,674 193,050 340,030
User charges and fees 135,019 134,328 96,827
Royalties and land rent receipts .. .. ..
Grants and other contributions 15,833 2,594 1,958
Interest received 4,379 7,700 4,987
Taxes .. .. ..
Other 17 782 5
Outflows:
Employee costs (57,811) (55,261) (61,087)
Supplies and services (188,613) (126,971) (203,423)
Grants and subsidies (194,521) (129,152) (194,954)
Borrowing costs (3,969) (2,639) (2,169)
Taxation equivalents paid (15,472) (21,650) (1,177)
Other (14,699) 3,254 (6,216)
Net cash provided by or used in operating activities (23,163) 6,035 (25,219)
CASH FLOWS FROM INVESTING ACTIVITIES
Inflows:
Sales of non-financial assets 1,540 5,992 8,202
Investments redeemed .. .. ..
Loans and advances redeemed 1,103 3,182 1,853
Outflows:
Payments for non-financial assets (32,987) (25,888) (55,299)
Payments for investments .. .. ..
Loans and advances made (27,756) (3,436) (94,568)
Net cash provided by or used in investing activities (58,100) (20,150) (139,812)
CASH FLOWS FROM FINANCING ACTIVITIES
Inflows:
Borrowings 49,117 34,053 61,927
Equity injections 38,023 15,487 80,487
Outflows:
Borrowing redemptions (28,059) (44,007) (20,605)
Finance lease payments .. .. ..
Equity withdrawals (21,365) (21,365) (34,584)
Dividends paid .. .. ..
Net cash provided by or used in financing activities 37,716 (15,832) 87,225
Net increase/(decrease) in cash held (43,547) (29,947) (77,806)
Cash at the beginning of financial year 182,753 224,702 194,755
Cash transfers from restructure .. .. ..
Cash at the end of financial year 139,206 194,755 116,949
*Technical adjustments have been made in this statement to reallocate amounts between categories and facilitate consistency acrossagencies.
2016-17 Queensland State Budget – Service Delivery StatementsDepartment of Infrastructure, Local Government and Planning
32

Statutory bodies
Building Queensland
Building Queensland (BQ) was established under the Building Queensland Act 2015 (the Act) on the 3 December 2015. BQ’s role is to provide independent, objective and transparent advice to the Queensland Government to enable better infrastructure decisions.
BQ works closely with all Queensland Government departments, government-owned corporations and statutory authorities and bodies, providing them with strategic advice and assisting with early stage development of projects.
One of the key functions of BQ is to develop rigorous business cases for projects. Using transparent and disciplined frameworks, including cost benefit analysis, and expert advice, BQ assists with business cases on projects where potential government investment is between $50 million and $100 million and leads the preparation of business cases where investment exceeds $100 million. BQ also leads the procurement or delivery of projects if directed to do so.
BQ also recommends infrastructure projects that should be prioritised to meet the State’s needs, through a pipeline of priority projects. This pipeline, based on rigorous analysis and assessment of projects, will contribute to future state infrastructure plans.
BQ is committed to sharing expertise to ensure infrastructure decision-making is based on transparent analysis. BQ's work, including project and cost benefit analysis summaries, will be regularly published online.
BQ's commitment to demonstrating transparency includes:
extensive disclosure obligations that are built into the Act, including requirements to publish project summaries, costbenefit analysis summaries, an infrastructure pipeline document and any ministerial directions received. BQ mustprovide a summary report and an updated priority pipeline document to the responsible Minister every six months,and publish it 28 days thereafter
providing the annual budget to the responsible Minister in March of each year for the next financial year for approval.BQ's budget is also subject to scrutiny through the annual Parliamentary Estimates process
tabling its audited annual report in Parliament within three months of the end of the financial year project costs for the development of business cases are passed back to the respective line agencies, which authorise
and regularly report on these costs providing monthly updates to its Board on operational matters, including budget and expenses publishing its frameworks, for Business Cases, Cost Benefit Analysis, Social Impact and a summary of the
Prioritisation Guide, to the BQ website and updating them regularly.
Budget
Building Queensland 2015-16 Adj.
Budget $'000
2015-16 Est.
Act. $'000
2016-17
Budget $'000
Total expenses 8,073 7,152 8,055
Capital .. 18 17
Staffing1
Building Queensland
2015-16 Adj.
Budget
2015-16
Est. Act.
2016-17
Budget
30 29 30
Note: 1. Full-time equivalents (FTEs) as at 30 June.
Building Queensland
2016-17 Queensland State Budget – Service Delivery StatementsDepartment of Infrastructure, Local Government and Planning
33

Queensland Reconstruction Authority
Overview
The QRA manages and coordinates the state’s restoration of communities and reconstruction of essential public infrastructure in disaster-affected communities. The QRA's role focuses on working with local and state government agencies to deliver value for money and accountable expenditure and acquittal of public reconstruction funds under Natural Disaster Relief and Recovery Arrangements (NDRRA).
QRA's vision is to build a more disaster-resilient Queensland. The QRA’s objectives are to:
deliver value for money and ensure accountable expenditure of disaster recovery funds, providing integrity andaccountability
coordinate and support the rapid recovery of disaster-impacted Queensland communities, creating jobs and adiverse economy, and building safe, caring and connected communities
build the capacity and capability of local governments and state agencies to recover sooner following natural disasterevents, supporting the delivery of quality frontline services
contribute to the Queensland Government’s response to national natural disaster funding reforms, helping to createjobs and a diverse economy
drive a collaborative approach to the development of evidence-based policy across all levels of government, whichcontributes to a more resilient Queensland.
In 2015-16:
following an independent review into the operations of QRA, the Government has implemented some of the 14recommendations arising and is in the process of implementing others including preserving the QRA’s flexibility andscalability and its future roles, such as coordinating and supporting mitigation, recovery and resilience activitiesacross government
QRA closed out and acquitted a $1.6 billion claim to the Commonwealth under the NDRRA in March 2016, involvingmore than 800 submissions from nearly 80 local governments and state agencies. On acceptance from theCommonwealth, the approved claim will return more than $1.1 billion to Queensland and finalise the significantprogram of works triggered by the devastating summer disaster events of 2010-11, other disasters in 2012 andTropical Cyclone Oswald and other events of 2013
QRA monitored the delivery of 2014 and 2015 disaster event reconstruction works, as well as provided activesupport for local governments activated for NDRRA in 2016.
Service summary
Key priorities for 2016-17 include:
ensuring the ongoing delivery of Queensland’s NDRRA reconstruction works arising from the 2015 and 2016 events,including the 2015 $20 million Betterment Fund, allocated to local government authorities for assistance followingTropical Cyclone Marcia, to build infrastructure back to a more disaster-resilient standard
managing close-out, acquittal and Commonwealth reimbursement processes related to Queensland’s naturaldisaster events for the relevant financial year/s
strengthening our statewide regional liaison officer network as the key contacts for local governments andreconstruction delivery agents in affected regions across Queensland
contributing to the Queensland Government's response to national natural disaster funding reforms following therelease of the Productivity Commission report into natural disaster funding, which recommended substantial changesto the way NDRRA funding is distributed and managed. QRA will work with the Commonwealth to minimise theimpact of any changes on Queensland communities
The Queensland Reconstruction Authority (QRA) was established under the Queensland Reconstruction Authority Act 2011 following the unprecedented natural disasters, which impacted Queensland over the summer months of 2010-11. In 2015-16, a legislative amendment has made the QRA a permanent part of the Queensland Government.
2016-17 Queensland State Budget – Service Delivery StatementsDepartment of Infrastructure, Local Government and Planning
34

refreshing the Queensland Disaster Resilience Strategy and lead a whole-of-government approach to disasterrecovery, resilience and mitigation policy
leading ongoing development of Queensland’s flood risk management policy and work with local governments toimplement recommendations of the Queensland Floods Commission of Inquiry and the 2015 Flood Warning GaugeNetwork Review.
Service performance
Performance statement
Administration of Natural Disaster Relief and Recovery Arrangements Funding
Service area objective
To demonstrate accountability in the use of natural disaster funding by coordinating the rapid restoration of communities following natural disasters.
Service area description
With responsibility for the administration of NDRRA funding, the QRA:
actively manages and resources statewide NDRRA reconstruction works, including works relating to Queensland’snatural disaster events of 2014, 2015 and 2016, and publicly reports on their progress
manages the close-out and acquittal of NDRRA expenditure to obtain an unqualified audit opinion from theQueensland Audit Office in relation to claims for Australian Government reimbursement of eligible NDRRAexpenditure.
In relation to future natural disaster events, the service area will assist with disaster recovery operations and support local governments and state agencies in their recovery processes, and capture critical damage impact data that informs funding requirements and strengthens disaster risk mapping and monitoring.
Queensland Reconstruction Authority Notes 2015-16
Target/Est.
2015-16
Est. Actual
2016-17
Target/Est.
Service area: Administration of Natural
Disaster Relief and Recovery Arrangements
Funding
Service standards
Effectiveness measures
Percentage of NDRRA reconstruction works completed within timeframes required by the Commonwealth Government within budget 1 100% 100% 100%
Prepare and submit NDRRA claims for the relevant financial year supported by unqualified independent audit opinion in order to maximise reimbursement for the Queensland Government 2 March 2016 March 2016 March 2017
Efficiency measure
Immediate disaster recovery operating costs per dollar of new disaster event damage 3 0.25% 0.10% 0.25%
Notes: 1. Deadlines for completion of works eligible for reimbursement under NDRRA are set by the Australian Government.2. An unqualified audit opinion is required in order for works to be eligible for reimbursement from the Australian Government.
3. This aims to measure the efficiency of resource allocation in immediate disaster response and recovery operations. Maintaining or reducingthis measure will indicate efficient resource allocation.
2016-17 Queensland State Budget – Service Delivery StatementsDepartment of Infrastructure, Local Government and Planning
35

Staffing1
Queensland Reconstruction Authority Notes 2015-16
Adj. Budget
2015-16
Est. Actual
2016-17
Budget
Administration of Natural Disaster Relief and Recovery Arrangements funding 2 104 94 104
Notes:
1. Full-time equivalents (FTEs) as at 30 June.
2. The 2015-16 Adjusted Budget reflects the addition of six FTE positions responsible for administering the Natural Disaster Relief andRecovery Arrangements transferred from the Department of Infrastructure, Local Government and Planning to the QRA on1 January 2016.
2016-17 Queensland State Budget – Service Delivery StatementsDepartment of Infrastructure, Local Government and Planning
36

Income statement
Queensland Reconstruction Authority Notes 2015-16 Budget
$'000
2015-16 Est. Act.
$'000
2016-17 Budget
$'000
INCOME
Taxes .. .. ..
User charges and fees .. .. ..
Grants and other contributions 1,4,7 644,426 232,224 356,054
Interest .. .. ..
Other revenue .. .. ..
Gains on sale/revaluation of assets .. .. ..
Total income 644,426 232,224 356,054
EXPENSES
Employee expenses 2,5,8 12,597 9,700 13,553
Supplies and services 16,523 16,408 16,921
Grants and subsidies 3,6,9 614,426 513,724 324,699
Depreciation and amortisation .. .. ..
Finance/borrowing costs .. .. ..
Other expenses 880 392 881
Losses on sale/revaluation of assets .. .. ..
Total expenses 644,426 540,224 356,054
OPERATING SURPLUS/(DEFICIT) .. (308,000) ..
2016-17 Queensland State Budget – Service Delivery StatementsDepartment of Infrastructure, Local Government and Planning
37

Balance sheet
Queensland Reconstruction Authority Notes 2015-16 Budget
$'000
2015-16 Est. Act.
$'000
2016-17 Budget
$'000
CURRENT ASSETS
Cash assets 10,15 169,766 18,550 18,550
Receivables 11,16 12,627 1,694 1,694
Other financial assets .. .. ..
Inventories .. .. ..
Other .. 5 5
Non-financial assets held for sale .. .. ..
Total current assets 182,393 20,249 20,249
NON-CURRENT ASSETS
Receivables .. .. ..
Other financial assets .. .. ..
Property, plant and equipment .. .. ..
Intangibles .. .. ..
Other .. .. ..
Total non-current assets .. .. ..
TOTAL ASSETS 182,393 20,249 20,249
CURRENT LIABILITIES
Payables 12,17 2,400 2,718 2,718
Accrued employee benefits 13,18 1,064 .. ..
Interest bearing liabilities and derivatives .. .. ..
Provisions .. .. ..
Other .. 24 24
Total current liabilities 3,464 2,742 2,742
NON-CURRENT LIABILITIES
Payables .. .. ..
Accrued employee benefits .. .. ..
Interest bearing liabilities and derivatives .. .. ..
Provisions .. .. ..
Other .. .. ..
Total non-current liabilities .. .. ..
TOTAL LIABILITIES 3,464 2,742 2,742
NET ASSETS/(LIABILITIES) 178,929 17,507 17,507
EQUITY
TOTAL EQUITY 14,19,20 178,929 17,507 17,507
2016-17 Queensland State Budget – Service Delivery StatementsDepartment of Infrastructure, Local Government and Planning
38
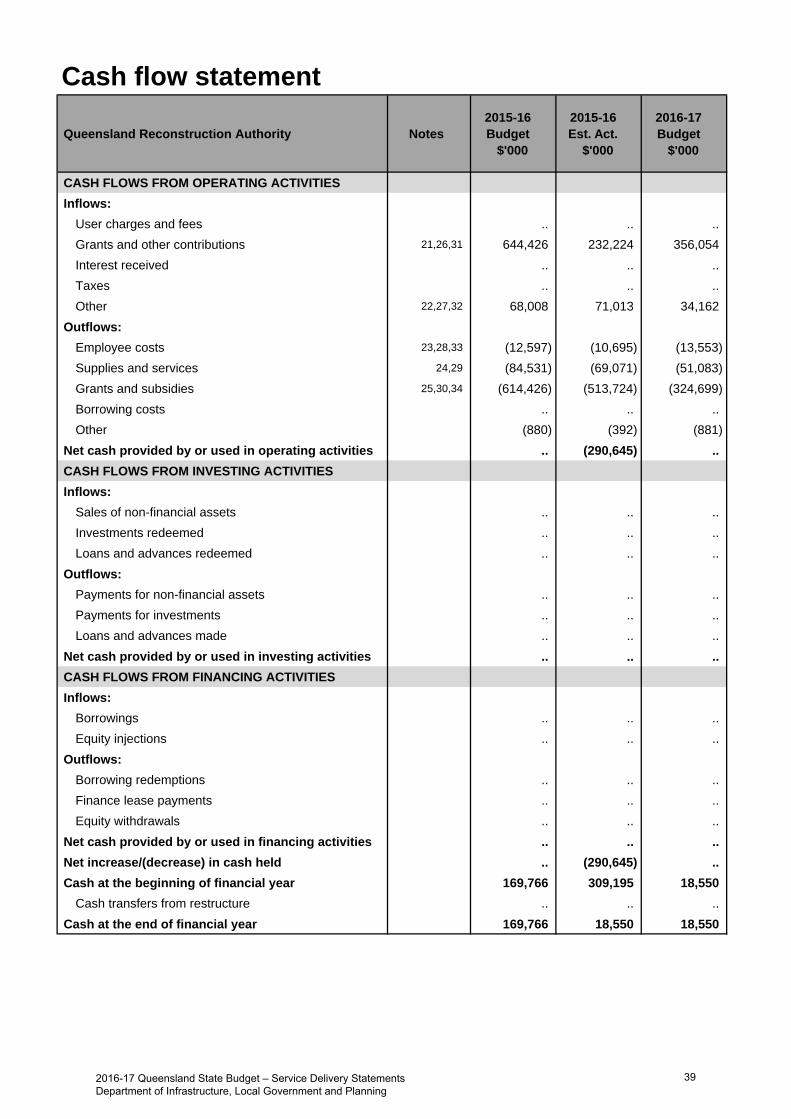
Cash flow statement
Queensland Reconstruction Authority Notes 2015-16 Budget
$'000
2015-16 Est. Act.
$'000
2016-17 Budget
$'000
CASH FLOWS FROM OPERATING ACTIVITIES
Inflows:
User charges and fees .. .. ..
Grants and other contributions 21,26,31 644,426 232,224 356,054
Interest received .. .. ..
Taxes .. .. ..
Other 22,27,32 68,008 71,013 34,162
Outflows:
Employee costs 23,28,33 (12,597) (10,695) (13,553)
Supplies and services 24,29 (84,531) (69,071) (51,083)
Grants and subsidies 25,30,34 (614,426) (513,724) (324,699)
Borrowing costs .. .. ..
Other (880) (392) (881)
Net cash provided by or used in operating activities .. (290,645) ..
CASH FLOWS FROM INVESTING ACTIVITIES
Inflows:
Sales of non-financial assets .. .. ..
Investments redeemed .. .. ..
Loans and advances redeemed .. .. ..
Outflows:
Payments for non-financial assets .. .. ..
Payments for investments .. .. ..
Loans and advances made .. .. ..
Net cash provided by or used in investing activities .. .. ..
CASH FLOWS FROM FINANCING ACTIVITIES
Inflows:
Borrowings .. .. ..
Equity injections .. .. ..
Outflows:
Borrowing redemptions .. .. ..
Finance lease payments .. .. ..
Equity withdrawals .. .. ..
Net cash provided by or used in financing activities .. .. ..
Net increase/(decrease) in cash held .. (290,645) ..
Cash at the beginning of financial year 169,766 309,195 18,550
Cash transfers from restructure .. .. ..
Cash at the end of financial year 169,766 18,550 18,550
2016-17 Queensland State Budget – Service Delivery StatementsDepartment of Infrastructure, Local Government and Planning
39

Income statementMajor variations between 2015-16 Budget and 2015-16 Estimated Actual include:
1. Grants and other contributions income 2015-16 Estimated Actual is below 2015-16 Budget due to the utilisation of funding received in advance (cash held by Queensland Reconstruction Authority) in prior financial years to fund expenditure in 2015-16 resulting in an operating deficit for 2015-16.
2. Employee expenses 2015-16 Estimated Actual is below 2015-16 Budget due to less staff required than wasoriginally budgeted.
3. Grants and subsidies expenses 2015-16 Estimated Actual is below 2015-16 Budget due to a reduction in thefinal cost of eligible reconstruction works claimed and completed by State Departments and Agencies (SDAs)and Local Government Authorities (LGAs).
Major variations between 2015-16 Budget and 2016-17 Budget include:
4. Grants and other contributions income 2016-17 Budget is below 2015-16 Budget due to a reduction in fundingrequired to reimburse agencies for completed National Disaster Relief and Recovery Arrangements (NDRRA)works (see note 6).
5. Employee expenses 2016-17 Budget is greater than 2015-16 Budget due to an increase in salary costs and the transfer of six full time equivalent positions from the Department of Infrastructure, Local Government and Planning.
6. Grants and subsidies expenses 2016-17 Budget is below 2015-16 Budget due to reduced NDRRA works by SDAsand LGAs as part of the forecast NDRRA program.
Major variations between 2015-16 Estimated Actual and the 2016-17 Budget include:
7. Grants and other contributions income 2016-17 Budget is greater than 2015-16 Estimated Actual due to theutilisation of funding received in advance (cash held by QRA) in prior financial years to fund expenditure in2015-16. Funding in 2016-17 will be required to match expenditure.
8. Employee expenses 2016-17 Budget is greater than 2015-16 Esimated Actual due to vacant positions in 2015-16expected to be filled in 2016-17.
9. Grants and subsidies expenses 2016-17 Budget is below 2015-16 Estimated Actual due to reduced NDRRAworks by SDAs and LGAs as part of the forecast NDRRA program.
Balance sheetMajor variations between 2015-16 Budget and 2015-16 Estimated Actual include:
10. Cash assets 2015-16 Estimated Actual is below 2015-16 Budget due to the utilisation in 2015-16 ofadvance funding not spent in prior years.
11. Receivables 2015-16 Estimated Actual is below 2015-16 Budget due to a forecast reduction in goods andservices tax (GST) receivable at the end of the financial year.
12. Payables 2015-16 Estimated Actual is greater than 2015-16 Budget due to forecast employee benefits payableto the whole-of-government central scheme at the end of the financial year.
13. The accrued employee benefits balance originally budgeted at 30 June 2016 (2015-16) has been transfered to thecentral whole-of-government central scheme during 2015-16 and the 2015-16 Estimated Actual is nil.
14. Accumulated surplus 2015-16 Estimated Actual is below 2015-16 Budget due to the utilisation in 2015-16 ofadvance funding not spent in prior years.
Major variations between 2015-16 Budget and 2016-17 Budget include:
15. Cash assets 2016-17 Budget is below 2015-16 Budget due to the utilisation in 2015-16 of advance funding notspent in prior years.
16. Receivables 2016-17 Budget is below 2015-16 Budget due to a forecast reduction in GST receivable at the end ofthe 2016-17 financial year.
17. Payables 2016-17 Budget is greater than 2015-16 Budget due to forecast employee benefits payable to theQueensland Central Scheme at the end of the 2016-17 financial year.
Explanation of variances in the financial statements
2016-17 Queensland State Budget – Service Delivery StatementsDepartment of Infrastructure, Local Government and Planning
40

18. The accrued employee benefits balance originally budgeted at 30 June 2016 (2015-16) has been transfered to thewhole-of-government central scheme during 2015-16 and the 2016-17 Budget is nil.
19. Accumulated surplus 2016-17 Budget is below 2015-16 Budget due to the utilisation in 2015-16 of advancefunding not spent in prior years.
Major variations between 2015-16 Estimated Actual and the 2016-17 Budget include:
20. There are no variations forecast between the 2015-16 Estimated Actual and the 2016-17 Budget.
Cash flow statementMajor variations between 2015-16 Budget and 2015-16 Estimated Actual include:
21. Grants and other contributions inflows 2015-16 Estimated Actual is below 2015-16 Budget due to the utilisation offunding received in advance (cash held by QRA) in prior financial years to fund expenditure in 2015-16 resulting ina net decrease in cash held in 2015-16.
22. Other inflows 2015-16 Estimated Actual is greater than 2015-16 Budget due to the timing of GST receipts fromthe Australian Taxation Office in prior years.
23. Employee costs outflows 2015-16 Estimated Actual is below 2015-16 Budget due to less staff required thanwas originally budgeted.
24. Supplies and services outflows 2015-16 Estimated Actual is below 2015-16 Budget predominately due toa reduction in the payment of GST on Grants and subsidies during 2015-16.
25. Grants and subsidies outflows 2015-16 Estimated Actual is below 2015-16 budget due to a reduction in the finalcost of eligible reconstruction works claimed and completed by SDAs and LGAs.
Major variations between 2015-16 Budget and 2016-17 Budget include:
26. Grants and other contributions inflows 2016-17 Budget is below 2015-16 Budget due to a reduction in fundingrequired to reimburse agencies for completed NDRRA works.
27. Other inflows 2016-17 Budget is below 2015-16 Budget due to forecast reduced overall GST outflows on Grantsand subsidies during 2016-17.
28. Employee costs outflows 2016-17 Budget is greater than 2015-16 budget due to an increase in salary costs andthe transfer of six full-time equivalent positions from the Department of Infrastructure, Local Government andPlanning.
29. Supplies and services 2016-17 Budget is below 2015-16 Budget due to forecast reduced overall GST outflows onGrants and subsidies during 2016-17.
30. Grants and subsidies outflows 2016-17 Budget is below 2015-16 Budget due to reduced NDRRA works by SDAsand LGAs as part of the forecast NDRRA program.
Major variations between 2015-16 Estimated Actual and the 2016-17 Budget include:
31. Grants and other contributions inflows 2016-17 Budget is greater than 2015-16 Estimated Actual due to theutilisation of funding received in advance (cash held by QRA) in prior financial years to fund expenditure in2015-2016. Funding in 2016-17 will be required to match expenditure.
32. Other inflows 2016-17 Budget is below 2015-16 Estimated Actual due to forecast reduced overall GSToutflows on Grants and subsidies during 2016-17.
33. Employee costs outflows 2016-17 Budget is greater than 2015-16 Estimated Actual due to vacant positions in2015-16 expected to be filled in 2016-17.
34. Grants and subsidies outflows 2016-17 Budget is below 2015-16 Estimated Actual due to reduced NDRRAworks by SDAs and LGAs as part of the forecast NDRRA program.
2016-17 Queensland State Budget – Service Delivery StatementsDepartment of Infrastructure, Local Government and Planning
41

South Bank Corporation
Overview
The objectives of the South Bank Corporation (the Corporation), as outlined in the South Bank Corporation Act 1989, are to:
promote, facilitate, carry out and control the development, disposal and management of land and other propertywithin the Corporation area
achieve an appropriate balance between the Corporation’s commercial and non-commercial functions ensure the Corporation area complements, rather than duplicates, other public use sites in the inner-city Brisbane
area provide for a diverse range of recreational, cultural and educational pursuits for local, regional and international
visitors accommodate public events and entertainment that benefit the general community achieve excellence and innovation in the management of open space and park areas.
The Corporation's responsibilities include ownership and management of:
the Brisbane Convention and Exhibition Centre the Parklands car park retail and short term commercial leasing and retail marketing road and footpath ownership and management statutory planning for the Corporation area and planning assessment for the Southpoint development.
Key factors impacting the Corporation include:
in 2012 the Corporation was directed to refrain from capital expenditure and to exercise financial prudence to ensurethat any cash reserves were able to be applied to its long term debt obligations. These debt obligations have sincebeen fully repaid
on 1 July 2013 the Corporation’s management responsibilities for the South Bank Parklands transferred to theBrisbane City Council. In addition, the Corporation’s planning assessment powers, excluding the Southpointdevelopment, were transferred to the Brisbane City Council from 1 February 2013
from 1 March 2016 a new Board was appointed by the Government to bring a fresh approach to the precinct and itsfuture development and management.
Service summary
New initiatives for 2016-17 include:
completion by the Anthony John Group of Stage B of the Southpoint development in the Corporation area, being acommercial tower and retail precinct on Grey Street South Bank, which includes the restoration and refurbishment ofthe heritage listed Collins Place
increasing the profile and involvement of retailers across the precinct securing a retail tenant for the heritage listed Allgas Building in the centre of the South Bank Parklands continuing to manage and enhance, with Brisbane City Council, the distinct elements of the precinct that make South
Bank Brisbane’s favourite place to live, work and play reviewing the role and powers of the Corporation and identifying future opportunities for the management of land and
other property within the Corporation area.
2016-17 Queensland State Budget – Service Delivery StatementsDepartment of Infrastructure, Local Government and Planning
42

Staffing1
South Bank Corporation Notes 2015-16
Budget
2015-16
Est. Actual
2016-17
Budget
South Bank Corporation 2 24 24 25
Notes: 1. Full-time equivalents (FTEs) as at 30 June.2. The increase in staffing in 2016-17 is for planning and project management of capital works.
2016-17 Queensland State Budget – Service Delivery StatementsDepartment of Infrastructure, Local Government and Planning
43

Income statement
South Bank Corporation Notes 2015-16 Budget
$'000
2015-16 Est. Act.
$'000
2016-17 Budget
$'000
INCOME
Taxes .. .. ..
User charges and fees 1,4,6 82,071 80,548 91,871
Grants and other contributions .. .. ..
Interest 550 690 650
Other revenue .. .. ..
Gains on sale/revaluation of assets 7 5,000 4,738 2,340
Total income 87,621 85,976 94,861
EXPENSES
Employee expenses 2,8 2,815 2,626 2,955
Supplies and services 3,5,9 61,338 57,696 64,065
Grants and subsidies .. .. ..
Depreciation and amortisation 25,000 23,000 23,000
Finance/borrowing costs .. .. ..
Other expenses 7,156 7,276 7,633
Losses on sale/revaluation of assets .. .. ..
Total expenses 96,309 90,598 97,653
OPERATING SURPLUS/(DEFICIT) (8,688) (4,622) (2,792)
2016-17 Queensland State Budget – Service Delivery StatementsDepartment of Infrastructure, Local Government and Planning
44

Balance sheet
South Bank Corporation Notes 2015-16 Budget
$'000
2015-16 Est. Act.
$'000
2016-17 Budget
$'000
CURRENT ASSETS
Cash assets 35,145 38,623 33,691
Receivables 1,834 1,569 1,569
Other financial assets .. .. ..
Inventories 313 338 338
Other 10,14,18 430 5,314 1,264
Non-financial assets held for sale .. .. ..
Total current assets 37,722 45,844 36,862
NON-CURRENT ASSETS
Receivables .. .. ..
Other financial assets .. .. ..
Property, plant and equipment 698,361 717,039 722,857
Intangibles .. .. ..
Other 11,15 6,167 2,654 3,076
Total non-current assets 704,528 719,693 725,933
TOTAL ASSETS 742,250 765,537 762,795
CURRENT LIABILITIES
Payables 9,452 8,234 8,234
Accrued employee benefits .. 423 423
Interest bearing liabilities and derivatives .. .. ..
Provisions 239 .. ..
Other 12,16,19 29,335 16,259 6,309
Total current liabilities 39,026 24,916 14,966
NON-CURRENT LIABILITIES
Payables 645 764 764
Accrued employee benefits .. 131 131
Interest bearing liabilities and derivatives .. .. ..
Provisions 89 .. ..
Other 13,17 .. 10,423 10,423
Total non-current liabilities 734 11,318 11,318
TOTAL LIABILITIES 39,760 36,234 26,284
NET ASSETS/(LIABILITIES) 702,490 729,303 736,511
EQUITY
TOTAL EQUITY 702,490 729,303 736,511
2016-17 Queensland State Budget – Service Delivery StatementsDepartment of Infrastructure, Local Government and Planning
45

Cash flow statement
South Bank Corporation Notes 2015-16 Budget
$'000
2015-16 Est. Act.
$'000
2016-17 Budget
$'000
CASH FLOWS FROM OPERATING ACTIVITIES
Inflows:
User charges and fees 21,22 92,496 91,393 85,921
Grants and other contributions .. .. ..
Interest received 550 690 650
Taxes .. .. ..
Other 4,000 4,000 4,000
Outflows:
Employee costs (2,815) (2,626) (2,955)
Supplies and services (65,338) (62,488) (64,437)
Grants and subsidies .. .. ..
Borrowing costs .. .. ..
Other (11,156) (11,276) (11,633)
Net cash provided by or used in operating activities 17,737 19,693 11,546
CASH FLOWS FROM INVESTING ACTIVITIES
Inflows:
Sales of non-financial assets .. .. ..
Investments redeemed .. .. ..
Loans and advances redeemed .. .. ..
Outflows:
Payments for non-financial assets 20 (14,773) (8,757) (16,478)
Payments for investments .. .. ..
Loans and advances made .. .. ..
Net cash provided by or used in investing activities (14,773) (8,757) (16,478)
CASH FLOWS FROM FINANCING ACTIVITIES
Inflows:
Borrowings .. .. ..
Equity injections .. .. ..
Outflows:
Borrowing redemptions .. .. ..
Finance lease payments .. .. ..
Equity withdrawals .. .. ..
Net cash provided by or used in financing activities .. .. ..
Net increase/(decrease) in cash held 2,964 10,936 (4,932)
Cash at the beginning of financial year 32,181 27,687 38,623
Cash transfers from restructure .. .. ..
Cash at the end of financial year 35,145 38,623 33,691
2016-17 Queensland State Budget – Service Delivery StatementsDepartment of Infrastructure, Local Government and Planning
46

Income statementMajor variations between 2015-16 Budget and 2015-16 Estimated Actual include:
1. The decrease is due to lower turnover by the Brisbane Convention and Exhibition Centre.
2. The decrease is due to the reduced need for project staff as a result of reduced capital works.
3. The decrease is due to lower turnover by the Brisbane Convention and Exhibition Centre.
Major variations between 2015-16 Budget and 2016-17 Budget include:
4. The increase is due to the sale of development land in the 2016-17 year.
5. The increase is due to the cost of a development land sale in the 2016-17 year.
Major variations between 2015-16 Estimated Actual and the 2016-17 Budget include:
6. The increase is mainly due to the sale of development land in the 2016-17 year.
7. The reduction is due to anticipated maturing of the asset following strong growth and investment in prior years.
8. The increase is due to provision in the 2016-17 Budget for project staff with increased capital works.
9. The increase is mainly due to the cost of a development land sale in the 2016-17 year.
Balance sheetMajor variations between 2015-16 Budget and 2015-16 Estimated Actual include:
10. The increase is due to the transfer of development land from non-current assets to current assets.
11. The decrease is due to the transfer of development land from non-current assets to current assets.
12. The decrease is due to the transfer of an unearned income liability from current to non-current liabilities.
13. The increase is due to the transfer of an unearned income liability from current to non-current liabilities.
Major variations between 2015-16 Budget and 2016-17 Budget include:
14. The increase is due to annual insurance fees expected to be recognised as a prepayment asset.
15. The decrease is due to the transfer of development land from non-current assets to current assets.
16. The decrease is due to the recognition of unearned income as revenue in the 2016-17 year on sale ofdevelopment land, plus the transfer of some unearned income from current to non-current liabilities.
17. The decrease is due to the transfer of some unearned income from current to non-current liabilities.
Major variations between 2015-16 Estimated Actual and the 2016-17 Budget include:
18. The decrease follows the sale of development land.
19. The decrease is due to the transfer of some unearned income from current to non-current liabilities.
Cash flow statementMajor variations between 2015-16 Budget and 2015-16 Estimated Actual include:
20. The decrease is due to the deferral of planned capital works.
Major variations between 2015-16 Budget and 2016-17 Budget include:
21. The decrease is due to the receipt in the 2015-16 Budget year of land sales premiums.
Major variations between 2015-16 Estimated Actual and the 2016-17 Budget include:
22. The decrease is due to the receipt in the 2015-16 year of land sales premiums.
Explanation of variances in the financial statements
2016-17 Queensland State Budget – Service Delivery StatementsDepartment of Infrastructure, Local Government and Planning
47
Trade and Investment Queensland
Overview
Trade and Investment Queensland (TIQ) is the Queensland Government's dedicated agency for business trade and investment.
TIQ utilises its global and regional networks to identify international export opportunities, promote Queensland exporters to potential customers, identify international investors for foreign direct investment and endorse Queensland as an ideal destination offering diverse sectoral and investment solutions.
TIQ's vision is to be the best trade and investment organisation in Australasia by taking Queensland business to the world and bringing the world to Queensland. TIQ contributes to the Queensland Government's objective for the community of creating jobs and a diverse economy by:
identifying, promoting and facilitating high quality trade and investment opportunities for Queensland business bydeveloping global connections, and promoting investment opportunities to international investors
highlighting Queensland’s strengths overseas and positioning the state as an attractive investment destination, a hubfor innovation and a hotspot for leading international companies in the Asia Pacific region.
TIQ's activities align with Queensland Government policies where there is a significant role for international trade and investment including Advance Queensland and the development of Northern Queensland.
The Queensland economy is expected to have one of the highest rates of economic growth of any Australian state in 2016-17 driven by a surge in liquefied natural gas exports and the recently concluded free trade agreements with key North Asia trade and investment partners.
Service summary
In 2015-16, TIQ coordinated nine Ministerial-led missions and two Governor's visits, managed over 130 inbound delegations of overseas buyers to meet Queensland exporters and organised over 60 site visits for potential investors.
TIQ also had a key role in the Asia Pacific Cities Summit in July, the North Queensland Economic Summit held in November 2015 and the 2015 Queensland International Business Series in October, (including the 2015 Premier of Queensland’s Export Awards and the Queensland Trade and Investment Luncheon), as well as supporting the Advance Queensland Innovation and Investment Summit held in April 2016.
In 2015-16, TIQ also implemented its new customer relationship management system, to ensure clients are dealt with efficiently and to streamline business functions, from export facilitation to event planning.
During 2016-17, TIQ's key priorities and initiatives are to:
develop and implement key Queensland Government strategies for trade and investment and international education implement the forward plan for ministerial trade missions collaborate with other state government agencies in attracting foreign investment in Queensland encourage Queensland businesses to link with emerging global opportunities by working closely with key trading
partners, (particularly in Asia); utilise trade agreements or partner agreements; and capitalise on Queensland'ssupply chain connectivity and superior track-record in doing business
work with other government agencies to position Queensland globally as a leader in a number of industries, with aparticular focus on international education, biofuels, agriculture, mining technology, energy and resources, lifesciences, medical technology and creative industries
promote Queensland as a preferred destination in Australia for business and skilled migrants deliver the annual Premier of Queensland’s Export Awards.
2016-17 Queensland State Budget – Service Delivery StatementsDepartment of Infrastructure, Local Government and Planning
48
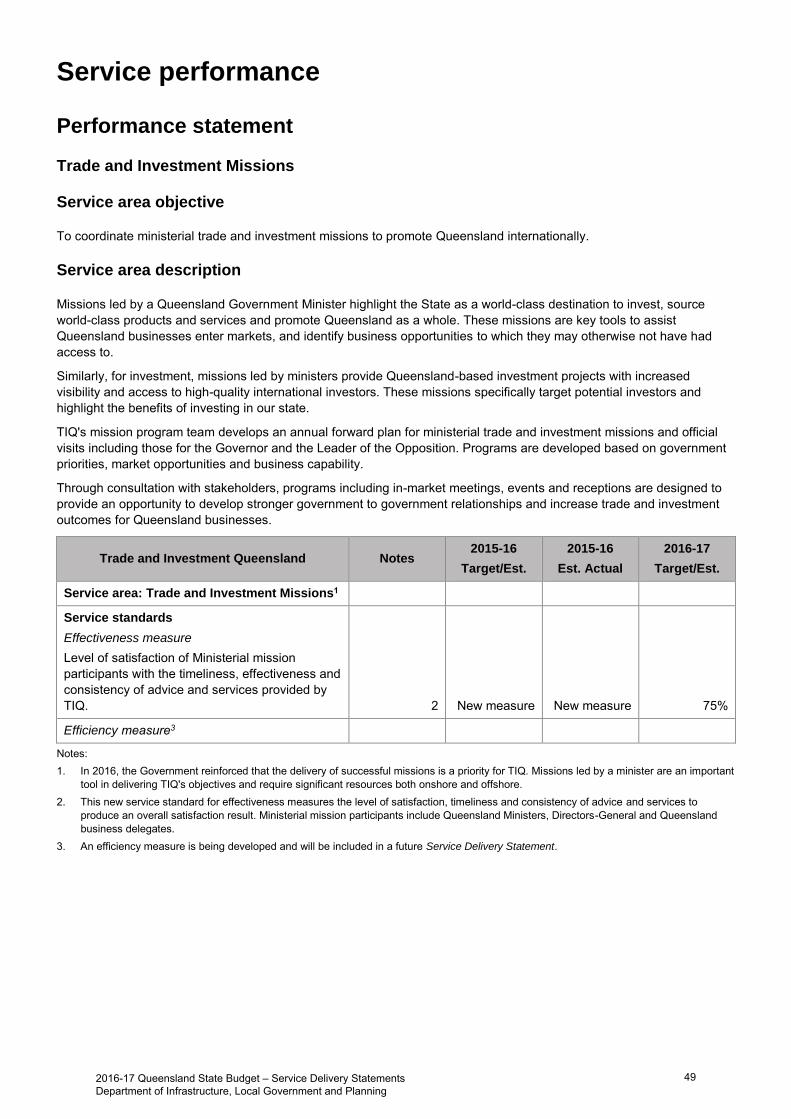
Service performance
Performance statement
Trade and Investment Missions
Service area objective
To coordinate ministerial trade and investment missions to promote Queensland internationally.
Service area description
Missions led by a Queensland Government Minister highlight the State as a world-class destination to invest, source world-class products and services and promote Queensland as a whole. These missions are key tools to assist Queensland businesses enter markets, and identify business opportunities to which they may otherwise not have had access to.
Similarly, for investment, missions led by ministers provide Queensland-based investment projects with increased visibility and access to high-quality international investors. These missions specifically target potential investors and highlight the benefits of investing in our state.
TIQ's mission program team develops an annual forward plan for ministerial trade and investment missions and official visits including those for the Governor and the Leader of the Opposition. Programs are developed based on government priorities, market opportunities and business capability.
Through consultation with stakeholders, programs including in-market meetings, events and receptions are designed to provide an opportunity to develop stronger government to government relationships and increase trade and investment outcomes for Queensland businesses.
Trade and Investment Queensland Notes 2015-16
Target/Est.
2015-16
Est. Actual
2016-17
Target/Est.
Service area: Trade and Investment Missions1
Service standards
Effectiveness measure
Level of satisfaction of Ministerial mission participants with the timeliness, effectiveness and consistency of advice and services provided by TIQ. 2 New measure New measure 75%
Efficiency measure3
Notes: 1. In 2016, the Government reinforced that the delivery of successful missions is a priority for TIQ. Missions led by a minister are an important
tool in delivering TIQ's objectives and require significant resources both onshore and offshore. 2. This new service standard for effectiveness measures the level of satisfaction, timeliness and consistency of advice and services to
produce an overall satisfaction result. Ministerial mission participants include Queensland Ministers, Directors-General and Queensland business delegates.
3. An efficiency measure is being developed and will be included in a future Service Delivery Statement.
2016-17 Queensland State Budget – Service Delivery StatementsDepartment of Infrastructure, Local Government and Planning
49

Policy Advice and Coordination
Service area objective
To support the development and coordination of trade and investment policy advice for the Deputy Premier and Minister for Trade and Investment and the Government.
Service area description
This service area promotes Queensland through supporting the appropriate development and coordination of policy advice for the Government. The service area provides:
detailed briefings to the Deputy Premier and Minister for Infrastructure, Local Government and Planning and Minister for Trade and Investment on policy, from development through to coordination and implementation
policy and operational advice and support to the Deputy Premier in relation to trade and investment matters.
In 2016 TIQ will lead the development of the whole-of-government Trade and Investment Strategy. This Strategy will provide a framework for the delivery, coordination and measurement of government initiatives designed to promote trade and investment for Queensland.
Trade and Investment Queensland Notes 2015-16
Target/Est.
2015-16
Est. Actual
2016-17
Target/Est.
Service area: Policy Advice and Coordination1
Service standards
Effectiveness measure
Customer satisfaction with advice and support to intergovernmental issues on trade and investment promotion. 2 New measure New measure 75%
Efficiency measure3
Notes: 1. In 2016, the Government, through the TIQ Board, communicated that providing timely and accurate policy advice on trade and investment
matters will be a key ongoing function of TIQ. 2. This service standard informs on overall satisfaction levels with the quality, timeliness and support provided by TIQ and is derived from an
annual client survey. Clients are Queensland Ministers, Directors-General and their agencies and other senior officers. 3. An efficiency measure is being developed and will be included in a future Service Delivery Statement.
2016-17 Queensland State Budget – Service Delivery StatementsDepartment of Infrastructure, Local Government and Planning
50

Trade
Service area objective
To facilitate Queensland companies to win export business.
Service area description
To achieve its objective, the Trade service area:
creates awareness within the Queensland business community of export opportunities identifies Queensland companies with an internationally competitive export offering promotes Queensland exporters to potential customers through TIQ’s global network identifies international export opportunities through TIQ’s global network works with Australian branches of multinationals to nominate existing Queensland-based suppliers for projects
offshore.
Services
Export leads Export deals
Trade and Investment Queensland Notes 2015-16
Target/Est.
2015-16
Est. Actual
2016-17
Target/Est.
Service area: Trade
Service: Export leads
Service standards
Effectiveness measure
Client satisfaction with advice and/or support provided to a Queensland organisation seeking to export a good or service. 1 New measure New measure 75%
Efficiency measure
Cost per export lead 2 $5,500 $4,700 $5,500
Service: Export deals
Service standards
Effectiveness measures
Client satisfaction with advice and support which led to the successful export of a Queensland good or service 1 New measure New measure 75%
Efficiency measures
Cost per export deal 3 $42,000 $37,800 $42,000
Notes: 1. This service standard informs on overall satisfaction levels with the quality, timeliness and support provided by TIQ and is derived from an
annual client survey. Clients are Queensland exporters and international buyers involved in the export/purchase of Queensland goods andservices.
2. Cost of an export lead includes the full-time equivalent (FTE) costs of Queensland and internationally-based FTE staff involved in servicingbusiness clients plus their discretionary budgets divided by the number of leads.
3. Cost of an export deal includes the FTE costs of Queensland and internationally-based FTE staff involved in servicing business clients plustheir discretionary budgets divided by the number of deals.
2016-17 Queensland State Budget – Service Delivery StatementsDepartment of Infrastructure, Local Government and Planning
51

Investment
Service area objective
To facilitate investment in a Queensland company or project.
Service area description
To achieve its objective the Investment service area:
develops value propositions for investment at a state and sector level works with local governments, economic development agencies and private sector service providers to identify
Queensland investment ready projects for promotion internationally pursues opportunities for reinvestment from current international investors in Queensland promotes Queensland investment propositions identifies international investors through TIQ’s global network.
Services
Investment leads Investment deals
Trade and Investment Queensland Notes 2015-16
Target/Est.
2015-16
Est. Actual
2016-17
Target/Est.
Service area: Investment
Service: Investment leads
Service standards
Effectiveness measure
Client satisfaction with advice and/or support provided to a Queensland organisation seeking investment in to a Queensland investment opportunity. 1 New measure New measure 75%
Efficiency measure
Cost per investment lead 2 $19,000 $17,600 $19,000
Service: Investment deals
Service standards
Effectiveness measures
Client satisfaction with advice and/or support which led to a successful investment in Queensland. 1 New measure New measure 75%
Efficiency measures Cost per investment deal 3 $150,000 $141,000 $150,000
Notes: 1. This service standard informs on overall satisfaction levels with the quality, timeliness and support provided by TIQ and is derived from an
annual client survey. Clients are owners of Queensland investment ready projects and international investors involved in a Queenslandcompany or project.
2. Cost of an investment lead includes the full-time equivalent (FTE) costs of Queensland and internationally-based FTE staff involved inservicing business clients plus their discretionary budgets divided by the number of leads.
3. Cost of an investment deal includes the FTE costs of Queensland and internationally-based FTE staff involved in servicing business clientsplus their discretionary budgets divided by the number of deals.
2016-17 Queensland State Budget – Service Delivery StatementsDepartment of Infrastructure, Local Government and Planning
52
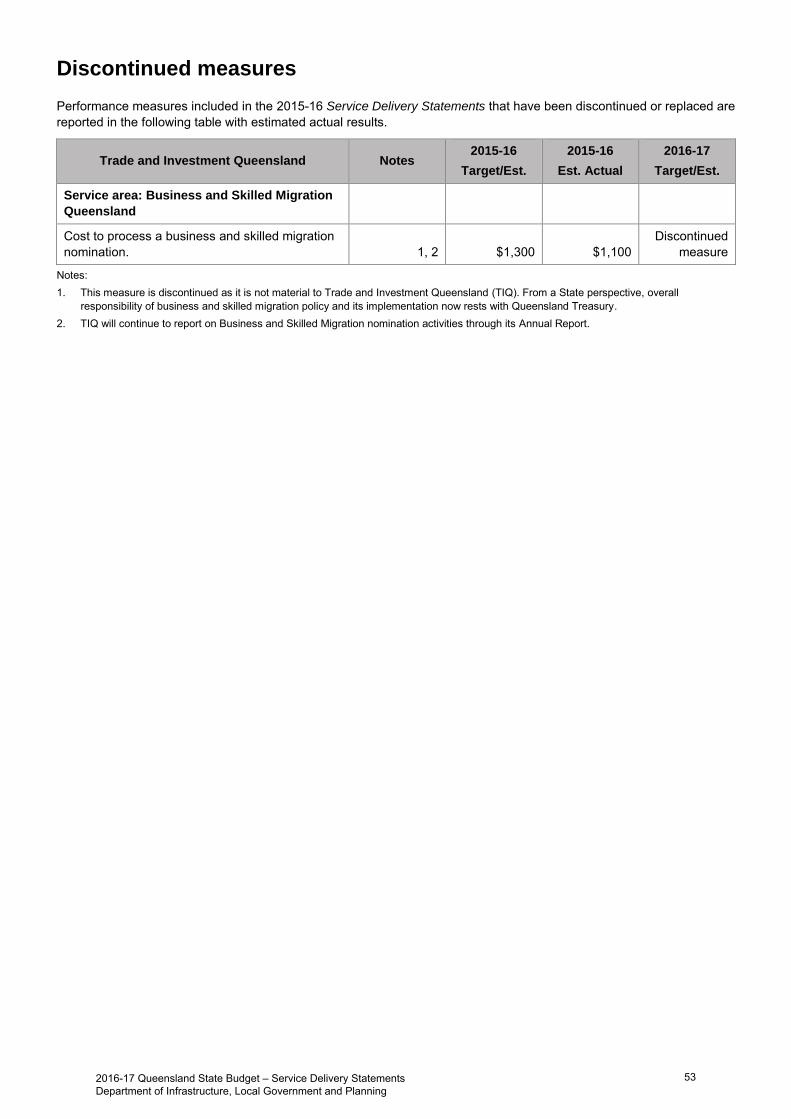
Discontinued measures
Performance measures included in the 2015-16 Service Delivery Statements that have been discontinued or replaced are reported in the following table with estimated actual results.
Trade and Investment Queensland Notes 2015-16
Target/Est.
2015-16
Est. Actual
2016-17
Target/Est.
Service area: Business and Skilled Migration
Queensland
Cost to process a business and skilled migration nomination. 1, 2 $1,300 $1,100
Discontinued measure
Notes: 1. This measure is discontinued as it is not material to Trade and Investment Queensland (TIQ). From a State perspective, overall
responsibility of business and skilled migration policy and its implementation now rests with Queensland Treasury.2. TIQ will continue to report on Business and Skilled Migration nomination activities through its Annual Report.
2016-17 Queensland State Budget – Service Delivery StatementsDepartment of Infrastructure, Local Government and Planning
53

Staffing1
Trade and Investment Queensland Notes 2015-16
Budget
2015-16
Est. Actual
2016-17
Budget
Trade and Investment Queensland 125 115 128
Note: 1. Trade and Investment Queensland (TIQ) employs 125 full-time equivalents (FTEs) in Queensland as at 30 June and in accordance with
the Queensland Government reporting on whole-of-government workforce data known as Minimum Obligatory Human ResourceInformation (MOHRI). TIQ also employs a further 65 FTEs across its international network in 13 offices across 11 countries under LocallyEngaged Staff (LES) conditions. These LES are not accounted for in the MOHRI data reported by government.
2016-17 Queensland State Budget – Service Delivery StatementsDepartment of Infrastructure, Local Government and Planning
54

Income statement
Trade and Investment Queensland Notes 2015-16 Budget
$'000
2015-16 Est. Act.
$'000
2016-17 Budget
$'000
INCOME
Taxes .. .. ..
User charges and fees 648 480 674
Grants and other contributions 1,2,5 29,871 31,236 34,039
Interest 75 100 75
Other revenue 300 760 371
Gains on sale/revaluation of assets .. .. ..
Total income 30,894 32,576 35,159
EXPENSES
Employee expenses 3,6 20,245 20,773 21,863
Supplies and services 4,7 10,306 10,449 13,847
Grants and subsidies .. .. ..
Depreciation and amortisation 196 196 200
Finance/borrowing costs .. .. ..
Other expenses 147 142 139
Losses on sale/revaluation of assets .. .. ..
Total expenses 30,894 31,560 36,049
OPERATING SURPLUS/(DEFICIT) .. 1,016 (890)
2016-17 Queensland State Budget – Service Delivery StatementsDepartment of Infrastructure, Local Government and Planning
55

Balance sheet
Trade and Investment Queensland Notes 2015-16 Budget
$'000
2015-16 Est. Act.
$'000
2016-17 Budget
$'000
CURRENT ASSETS
Cash assets 8,9 2,161 2,848 2,158
Receivables 1,055 1,043 1,043
Other financial assets .. .. ..
Inventories .. .. ..
Other 554 775 775
Non-financial assets held for sale .. .. ..
Total current assets 3,770 4,666 3,976
NON-CURRENT ASSETS
Receivables 313 456 456
Other financial assets .. .. ..
Property, plant and equipment 352 332 212
Intangibles 241 374 294
Other .. .. ..
Total non-current assets 906 1,162 962
TOTAL ASSETS 4,676 5,828 4,938
CURRENT LIABILITIES
Payables 828 1,094 1,094
Accrued employee benefits 657 754 754
Interest bearing liabilities and derivatives .. .. ..
Provisions .. .. ..
Other 541 352 352
Total current liabilities 2,026 2,200 2,200
NON-CURRENT LIABILITIES
Payables .. .. ..
Accrued employee benefits 464 549 549
Interest bearing liabilities and derivatives .. .. ..
Provisions .. .. ..
Other .. .. ..
Total non-current liabilities 464 549 549
TOTAL LIABILITIES 2,490 2,749 2,749
NET ASSETS/(LIABILITIES) 2,186 3,079 2,189
EQUITY
TOTAL EQUITY 2,186 3,079 2,189
2016-17 Queensland State Budget – Service Delivery StatementsDepartment of Infrastructure, Local Government and Planning
56

Cash flow statement
Trade and Investment Queensland Notes 2015-16 Budget
$'000
2015-16 Est. Act.
$'000
2016-17 Budget
$'000
CASH FLOWS FROM OPERATING ACTIVITIES
Inflows:
User charges and fees 648 480 674
Grants and other contributions 10,11,14 29,871 31,236 34,039
Interest received 75 100 75
Taxes .. .. ..
Other 300 760 371
Outflows:
Employee costs 12,15 (20,245) (20,773) (21,863)
Supplies and services 13,16 (10,306) (10,449) (13,847)
Grants and subsidies .. .. ..
Borrowing costs .. .. ..
Other (147) (142) (139)
Net cash provided by or used in operating activities 196 1,212 (690)
CASH FLOWS FROM INVESTING ACTIVITIES
Inflows:
Sales of non-financial assets .. .. ..
Investments redeemed .. .. ..
Loans and advances redeemed .. .. ..
Outflows:
Payments for non-financial assets .. .. ..
Payments for investments .. .. ..
Loans and advances made .. .. ..
Net cash provided by or used in investing activities .. .. ..
CASH FLOWS FROM FINANCING ACTIVITIES
Inflows:
Borrowings .. .. ..
Equity injections .. .. ..
Outflows:
Borrowing redemptions .. .. ..
Finance lease payments .. .. ..
Equity withdrawals .. .. ..
Net cash provided by or used in financing activities .. .. ..
Net increase/(decrease) in cash held 196 1,212 (690)
Cash at the beginning of financial year 1,965 1,636 2,848
Cash transfers from restructure .. .. ..
Cash at the end of financial year 2,161 2,848 2,158
2016-17 Queensland State Budget – Service Delivery StatementsDepartment of Infrastructure, Local Government and Planning
57

Income statementMajor variations between 2015-16 Budget and 2015-16 Estimated Actual include:
1. The increase in 2015-16 relates to additional funding received to cover foreign exchange movements oninternational office expenditure and the new enterprise bargaining (EB) arrangements.
Major variations between 2015-16 Budget and 2016-17 Budget include:
2. The increase in 2016-17 is due to extension of International Education and Training initiatives, adjustments for
3. The increase in 2015-16 is due to an increase as a result of new EB arrangements and the impact offluctuations of the foreign exchange rates on international salaries.
4. The increase relates to the impact of the extension with the International Education and Training Initiatives andcost increases due to the foreign exchange rate movements compared with assumptions used for the BudgetProcess in 2015-16.
Major variations between 2015-16 Estimated Actual and the 2016-17 Budget include:
5. The increase in 2016-17 is due to extension of International Education and Training Initiatives, the new EBarrangements and offset by deferred funding in 2015-16.
6. The increase in 2016-17 is due to the extension of the International Education and Training Initiatives and the newEB arrangements.
7. The increase in 2016-17 is due to the continuation and extension of International Education and TrainingInitiatives, the foreign exchange movements and offset by deferred funding from 2014-15 to 2015-16.
Balance sheetMajor variations between 2015-16 Budget and 2015-16 Estimated Actual include:
8. The increase relates to cash from grant contributions received in 2015-16 that are committed for the 2016-17financial year for finalisation of the whole-of-government Trade and Investment Strategy.
Major variations between 2015-16 Estimated Actual and the 2016-17 Budget include:
9. The decrease relates to cash from grant contributions received in 2015-16 that will be incurred in 2016-17 forfinalisation of the whole-of-government Trade and Investment Strategy.
Cash flow statementMajor variations between 2015-16 Budget and 2015-16 Estimated Actual include:
10. The increase in 2015-16 relates to additional funding received to cover foreign exchange movements oninternational offices expenditure and the new EB arrangements.
Major variations between 2015-16 Budget and 2016-17 Budget include:
11. The increase in 2016-17 is due to the extension of International Education and Training initiatives, adjustments forforeign exchange rate movements and the relocation to 1 William Street.
12. The increase in 2015-16 is due to increase in employee expenses as per the new EB arrangements and theimpact of fluctuations of the foreign exchange rates on international salaries.
13. The increase relates to the impact of the extension of International Education and Training Initiatives and costincreases due to the foreign exchange rate movements compared with assumptions used for the Budget processin 2015-16.
Major variations between 2015-16 Estimated Actual and the 2016-17 Budget include:
14. The increase in the 2016-17 is due to extension of International Education and Training Initiatives, the newEB arrangements and the deferred funding received in 2015-16.
Explanation of variances in the financial statements
foreign exchange movements, the relocation to 1 William Street and new EB arrangements.
2016-17 Queensland State Budget – Service Delivery StatementsDepartment of Infrastructure, Local Government and Planning
58

15. The increase in 2016-17 is due to the extension of International Education and Training Initiatives and the newEB arrangements.
16. The increase in 2016-17 is due to the extension of International Education and Training Initiatives, the foreignexchange movements and offset by deferred funding from 2014-15 to 2015-16.
2016-17 Queensland State Budget – Service Delivery StatementsDepartment of Infrastructure, Local Government and Planning
59

Commercialised business unit
Economic Development Queensland
Overview
Economic Development Queensland (EDQ) supports the department’s vision to drive the creation of cities, towns and communities in Queensland that are great places to live, work and play. EDQ works collaboratively with state and local governments, industry and the public to identify, plan, facilitate and deliver property development and infrastructure projects across Queensland to create prosperous, liveable and connected communities.
EDQ is a specialist land use planning and property development unit which facilitates economic development and development for community purposes by:
unlocking for development key government sites and under-utilised urban land with fragmented ownership enabling or undertaking land development activities and infrastructure provision demonstrating innovation in planning, building and infrastructure projects improving housing choice, diversity and delivering quality urban design identifying retail, commercial and industrial opportunities across the State with a particular focus on regional areas
including joint venture projects with local governments.
EDQ continues to support jobs growth and investment through the Accelerated Works Program and the Catalyst Infrastructure Program despite the softening of the residential and industrial markets across Queensland.
Service summary
In 2016-17 EDQ will deliver or facilitate delivery of a range of urban renewal, industrial and residential projects across Queensland. EDQ will achieve this by:
undertaking a major review of a number of development schemes within existing Priority Development Areas (PDAs),starting with the Bowen Hills and Northshore Hamilton PDAs
delivering and measuring the performance of the Ageing in Place pilot project in four regional Queensland towns toassist people as they enter their senior years by providing suitable housing options to enable people to stay in theircommunities, close to friends and family
leading the delivery of superior economic and community outcomes through a portfolio of Economic and CommunityDevelopment zones
in conjunction with local government, further investigating potential new PDAs throughout Queensland progressing development in EDQ’s eight current residential projects including settling up to 150 lots earning up to
$28 million in revenue completing construction and releasing the 10-lot final stage of the Crestmead Industrial Estate to help generate
investment and support jobs in the Crestmead, Browns Plains and Marsden areas further developing Queensland’s largest waterfront urban renewal project at Northshore Hamilton, including the
opening of a new public park and commencement of over $50 million of public infrastructure works including majorroad upgrades, wharf demolition and new river-walks
commencing over $30 million of public infrastructure works at Yeerongpilly Green in Brisbane, including major roadupgrades and new public parks
following the release of the master plan for the Gold Coast Health and Knowledge Precinct, commencing marketingof nine hectares of developable land within the 200 hectare site to facilitate the creation of a world-renowned,knowledge-based and mixed use community
executing the Infrastructure Agreement with Unity Water to further enable development within the Caloundra SouthPDA and resolving infrastructure funding options for the Yarrabilba and Greater Flagstone PDAs.
2016-17 Queensland State Budget – Service Delivery StatementsDepartment of Infrastructure, Local Government and Planning
60

Performance statement
Business and Economic Growth
Service area objective
To drive business and economic growth in Queensland.
Service area description
This service area delivers policies and programs that drive business and economic growth consistent with the Government’s economic development agenda. This service area will drive the expansion of Queensland’s economic growth as benchmarked against the global economy and comparable jurisdictions by:
driving economic, business and community growth through innovative property and infrastructure partnerships toincrease the resilience and sustainability of Queensland communities
supporting and enabling new growth in Queensland communities through fast tracking opportunities for urban,residential, industrial and community development across Queensland
facilitating the provision of priority development infrastructure that will unlock development opportunities andeconomic growth for local governments, key industry sectors, the community and the State.
Services
Priority development planning and catalyst infrastructure delivery Regional, urban and industrial development and investment
Economic Development Queensland Notes 2015-16
Target/Est.
2015-16
Est. Actual
2016-17
Target/Est.
Service area: Business and
Economic Growth1
Service: Priority development
planning and catalyst infrastructure
delivery
Service standards
Effectiveness measure
Value of investment enabled through the Priority Development Infrastructure co-investment and Catalyst Infrastructure programs 2 New measure New measure $61.2 million
Efficiency measure
Value of investment enabled per dollar invested in the management of the Priority Development Infrastructure co-investment and Catalyst Infrastructure programs 2 New measure New measure $1.60
Service: Regional, urban and
industrial development and
investment
Service standards
Effectiveness measures
Value of private sector investment generated through land sales 3 $622 million $472.6 million $582.7 million
2016-17 Queensland State Budget – Service Delivery StatementsDepartment of Infrastructure, Local Government and Planning
61

Economic Development Queensland Notes 2015-16
Target/Est.
2015-16
Est. Actual
2016-17
Target/Est.
Percentage of development projects managed, facilitated or delivered within committed timeframes and approved budget 4 92% 92% 92%
Efficiency measure
Value of private sector investment generated through land sales per dollar spent on sales management 3 $9.85 $6.53 $6.99
Notes: 1. This service area was previously called Driving Business and Economic Growth, and has been renamed for the 2016-17 Service Delivery
Statement.2. This measure combines reporting on projects being delivered under the discontinued Priority Development Infrastructure co-investment
program and projects being delivered through the Catalyst Infrastructure Program which began in September 2015.3. Private sector investment has fallen across the industrial and residential sectors due to softening market conditions which has impacted on
the value of private sector investment generated. This decrease has also impacted on the value of private sector investment per dollarspent on land sales management.
4. This service standard has been amended for the 2016-17 Service Delivery Statement by adding the word 'development' to clarify what isreferred to as a project. The methodology for calculating the measure has not changed.
2016-17 Queensland State Budget – Service Delivery StatementsDepartment of Infrastructure, Local Government and Planning
62
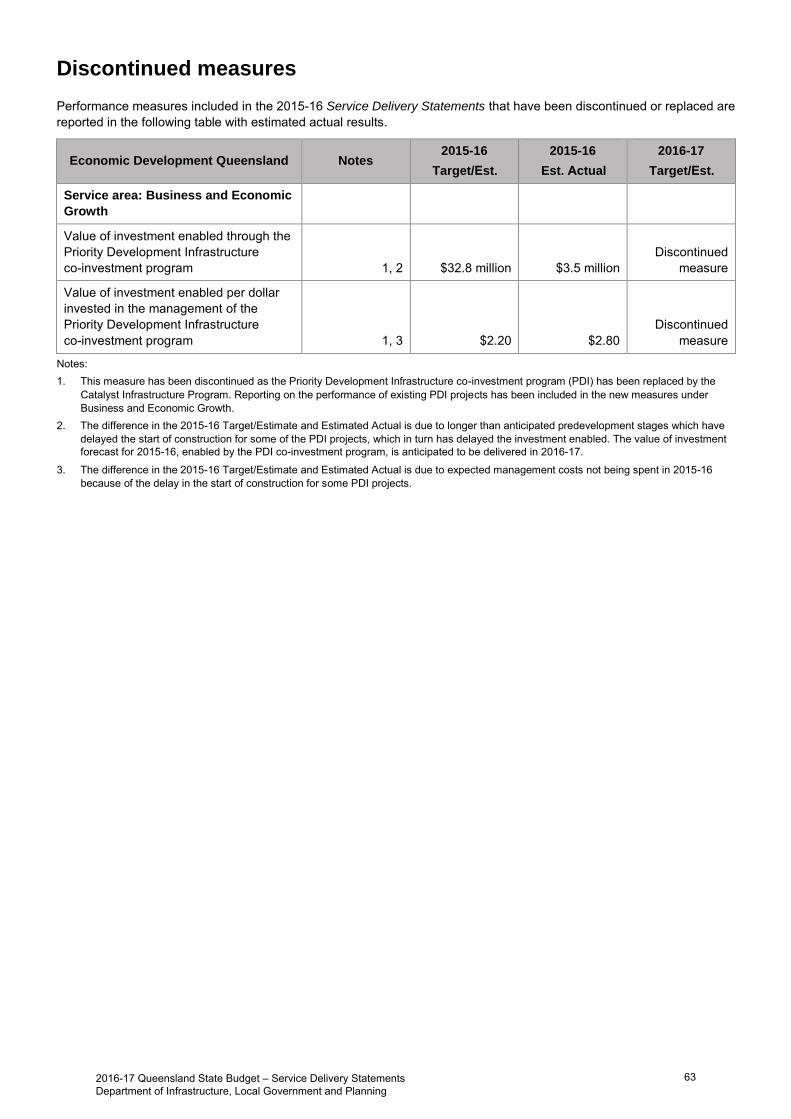
Discontinued measures
Performance measures included in the 2015-16 Service Delivery Statements that have been discontinued or replaced are reported in the following table with estimated actual results.
Economic Development Queensland Notes 2015-16
Target/Est.
2015-16
Est. Actual
2016-17
Target/Est.
Service area: Business and Economic
Growth
Value of investment enabled through the Priority Development Infrastructure co-investment program 1, 2 $32.8 million $3.5 million
Discontinued measure
Value of investment enabled per dollar invested in the management of the Priority Development Infrastructure co-investment program 1, 3 $2.20 $2.80
Discontinued measure
Notes: 1. This measure has been discontinued as the Priority Development Infrastructure co-investment program (PDI) has been replaced by the
Catalyst Infrastructure Program. Reporting on the performance of existing PDI projects has been included in the new measures underBusiness and Economic Growth.
2. The difference in the 2015-16 Target/Estimate and Estimated Actual is due to longer than anticipated predevelopment stages which havedelayed the start of construction for some of the PDI projects, which in turn has delayed the investment enabled. The value of investment forecast for 2015-16, enabled by the PDI co-investment program, is anticipated to be delivered in 2016-17.
3. The difference in the 2015-16 Target/Estimate and Estimated Actual is due to expected management costs not being spent in 2015-16because of the delay in the start of construction for some PDI projects.
2016-17 Queensland State Budget – Service Delivery StatementsDepartment of Infrastructure, Local Government and Planning
63

Staffing1
Economic Development Queensland Notes 2015-16
Budget
2015-16
Est. Actual
2016-17
Budget
Economic Development Queensland 109 109 109
Note: 1. Full-time equivalents (FTEs) as at 30 June.
2016-17 Queensland State Budget – Service Delivery StatementsDepartment of Infrastructure, Local Government and Planning
64

Income statement
Economic Development Queensland Notes 2015-16 Budget
$'000
2015-16 Est. Act.
$'000
2016-17 Budget
$'000
INCOME
User charges and fees 1,8,12 131,427 121,513 93,990
Grants and other contributions 2,9,13 33,112 18,476 36,979
Interest 3,14 4,379 7,607 4,987
Other revenue 17 .. 5
Gains on sale/revaluation of assets .. .. ..
Total income 168,935 147,596 135,961
EXPENSES
Employee expenses 4,15 15,111 13,658 15,321
Supplies and services 5,10,16 120,261 101,203 108,895
Grants and subsidies .. 319 ..
Depreciation and amortisation 32 14 5
Finance/borrowing costs 3,969 2,639 2,169
Other expenses 6,11,17 16,113 10,569 8,675
Losses on sale/revaluation of assets 7,18 .. 18,030 ..
Total expenses 155,486 146,432 135,065
Income tax expense/revenue 4,035 (3,553) 269
OPERATING SURPLUS/(DEFICIT) 9,414 4,717 627
2016-17 Queensland State Budget – Service Delivery StatementsDepartment of Infrastructure, Local Government and Planning
65
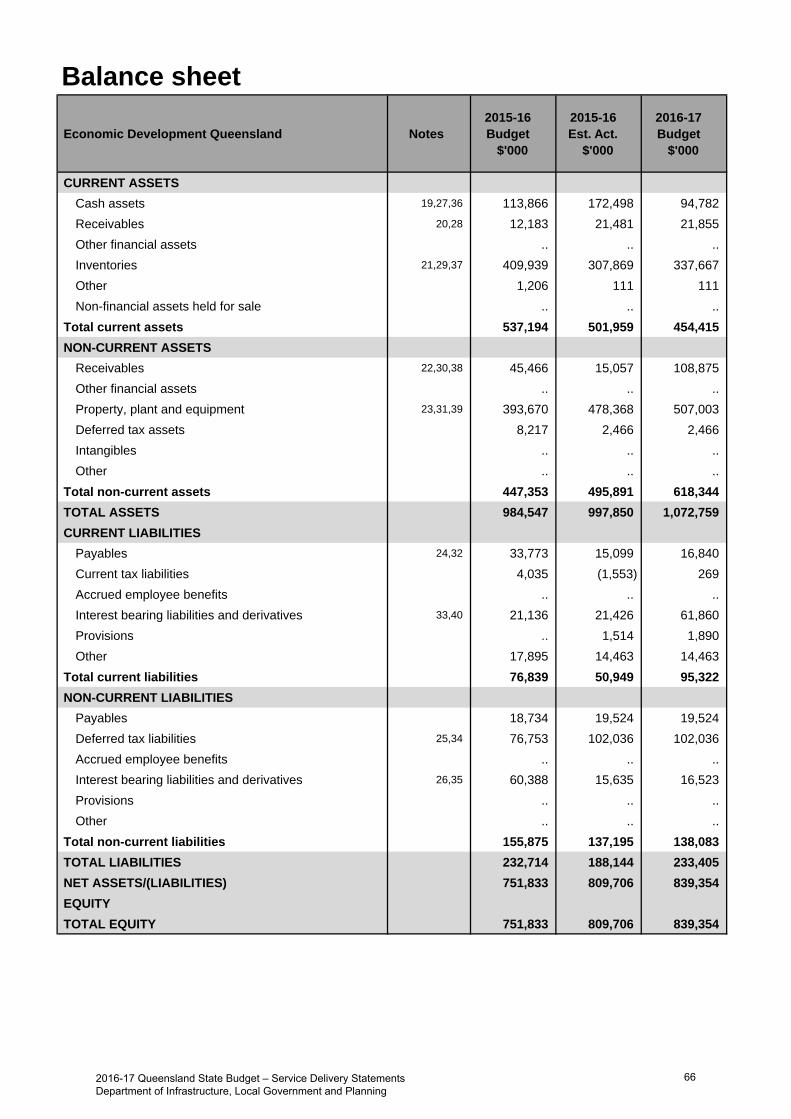
Balance sheet
Economic Development Queensland Notes 2015-16 Budget
$'000
2015-16 Est. Act.
$'000
2016-17 Budget
$'000
CURRENT ASSETS
Cash assets 19,27,36 113,866 172,498 94,782
Receivables 20,28 12,183 21,481 21,855
Other financial assets .. .. ..
Inventories 21,29,37 409,939 307,869 337,667
Other 1,206 111 111
Non-financial assets held for sale .. .. ..
Total current assets 537,194 501,959 454,415
NON-CURRENT ASSETS
Receivables 22,30,38 45,466 15,057 108,875
Other financial assets .. .. ..
Property, plant and equipment 23,31,39 393,670 478,368 507,003
Deferred tax assets 8,217 2,466 2,466
Intangibles .. .. ..
Other .. .. ..
Total non-current assets 447,353 495,891 618,344
TOTAL ASSETS 984,547 997,850 1,072,759
CURRENT LIABILITIES
Payables 24,32 33,773 15,099 16,840
Current tax liabilities 4,035 (1,553) 269
Accrued employee benefits .. .. ..
Interest bearing liabilities and derivatives 33,40 21,136 21,426 61,860
Provisions .. 1,514 1,890
Other 17,895 14,463 14,463
Total current liabilities 76,839 50,949 95,322
NON-CURRENT LIABILITIES
Payables 18,734 19,524 19,524
Deferred tax liabilities 25,34 76,753 102,036 102,036
Accrued employee benefits .. .. ..
Interest bearing liabilities and derivatives 26,35 60,388 15,635 16,523
Provisions .. .. ..
Other .. .. ..
Total non-current liabilities 155,875 137,195 138,083
TOTAL LIABILITIES 232,714 188,144 233,405
NET ASSETS/(LIABILITIES) 751,833 809,706 839,354
EQUITY
TOTAL EQUITY 751,833 809,706 839,354
2016-17 Queensland State Budget – Service Delivery StatementsDepartment of Infrastructure, Local Government and Planning
66

Cash flow statement
Economic Development Queensland Notes 2015-16 Budget
$'000
2015-16 Est. Act.
$'000
2016-17 Budget
$'000
CASH FLOWS FROM OPERATING ACTIVITIES
Inflows:
User charges and fees 41,52,63 131,566 111,351 93,616
Grants and other contributions 42,64 33,112 18,476 36,979
Interest received 4,379 7,688 4,987
Other 17 782 5
Outflows:
Employee costs (15,111) (13,787) (15,321)
Supplies and services 43,53,65 (140,234) (81,584) (136,576)
Grants and subsidies .. (319) ..
Borrowing costs (3,969) (2,639) (2,169)
Taxation equivalents paid 44,54,66 (15,472) (21,650) (1,177)
Other 45,55,67 (14,428) 4,339 (5,945)
Net cash provided by or used in operating activities (20,140) 22,657 (25,601)
CASH FLOWS FROM INVESTING ACTIVITIES
Inflows:
Sales of non-financial assets 46,56,68 1,540 5,992 8,202
Investments redeemed .. .. ..
Loans and advances redeemed .. 2,079 750
Outflows:
Payments for non-financial assets 47,57,69 (25,703) (20,133) (36,842)
Payments for investments .. .. ..
Loans and advances made 48,58,70 (27,756) (3,436) (94,568)
Net cash provided by or used in investing activities (51,919) (15,498) (122,458)
CASH FLOWS FROM FINANCING ACTIVITIES
Inflows:
Borrowings 49,59,71 49,117 34,053 61,927
Equity injections 50,60,72 30,933 21,988 62,132
Outflows:
Borrowing redemptions 51,61,73 (28,059) (44,007) (20,605)
Finance lease payments .. .. ..
Equity withdrawals 62,74 (19,892) (19,892) (33,111)
Dividends paid .. .. ..
Net cash provided by or used in financing activities 32,099 (7,858) 70,343
Net increase/(decrease) in cash held (39,960) (699) (77,716)
Cash at the beginning of financial year 153,826 173,197 172,498
Cash transfers from restructure .. .. ..
Cash at the end of financial year 113,866 172,498 94,782
2016-17 Queensland State Budget – Service Delivery StatementsDepartment of Infrastructure, Local Government and Planning
67

Income statementMajor variations between 2015-16 Budget and 2015-16 Estimated Actual include:
1. The decrease is mainly due to lower than budgeted land sales as a result of changing market conditions.
2. The decrease is due to the Department of State Development (DSD) retaining the funding for construction of theBundaberg Gas Pipeline.
3. The increase is due to interest earned on higher than budgeted cash balances.
4. The decrease is due to delays in filling vacant positions.
5. The decrease is due to the transfer of Bundaberg Gas Pipeline construction from Economic DevelopmentQueensland (EDQ) to DSD and lower than budgeted cost of sales due to lower sales.
6. The decrease is due to a reduction in the forecast tax equivalents.
7. The increase is due to a write down in land inventory as a result of changing market conditions.
Major variations between 2015-16 Budget and 2016-17 Budget include:
8. The decrease is mainly due to lower than budgeted land sales as a result of changing market conditions.
9. The increase is due to a higher forecast spend on the Gold Coast 2018 Commonwealth Games (GC2018)Village, in accordance with the construction program.
10. The decrease is due to lower cost of sales as a result of reduced land sales forecast.
11. The decrease is due to a reduction in forecast tax equivalents.
Major variations between 2015-16 Estimated Actual and the 2016-17 Budget include:
12. The decrease is mainly due to lower land sales forecast as a result of changing market conditions.
13. The increase is due to a higher forecast spend on the GC2018 Village, in accordance with the constructionprogram.
14. The decrease is due to lower cash balances forecast at 30 June 2017.
15. The increase is due to enterprise bargaining agreement increases and full year impact of staff changes.
16. The increase is due to higher forecast spend on the GC2018 Village in accordance with the constructionprogram.
17. The decrease is due to a reduction in forecast tax equivalents.
18. The decrease is due to a reduction in the value of forecast land inventory write downs.
Balance sheetMajor variations between 2015-16 Budget and 2015-16 Estimated Actual include:
19. The increase reflects a delay in development activity due to revised scheduling of costs and the funding for theCatalyst Infrastructure Program to 2016-17.
20. The increase is due to funding for catalyst infrastructure loans being recorded as a current receivable andbudgeted as a non-current receivable.
21. The decrease is due to a devaluation of land inventory due to current market conditions and decreaseddevelopment activity.
22. The decrease is due to catalyst infrastructure loan funding being budgeted as a non-current receivable andactuals recorded as a current receivable.
23. The increase is due to revaluation increments for investment property at 30 June 2015.
24. The decrease reflects timing and amount of operating payments.
25. The increase is due to land revaluations at 30 June 2015.
26. The decrease is due to catalyst infrastructure loan funding being treated as current liability.
Explanation of variances in the financial statements
2016-17 Queensland State Budget – Service Delivery StatementsDepartment of Infrastructure, Local Government and Planning
68

Major variations between 2015-16 Budget and 2016-17 Budget include:
27. The decrease reflects the commencement of funding for the Catalyst Infrastructure Program in 2016-17.
28. The increase is due to funding for catalyst infrastructure loans being recorded as a current receivable andbudgeted as non-current.
29. The decrease is due to a devaluation of land inventory due to current market conditions and decreaseddevelopment activity.
30. The increase is due to catalyst infrastructure loan funding in accordance with the construction program.
31. The increase is due to revaluation increments for investment property at 30 June 2015 and forecast spend on the GC2018 Village.
32. The decrease reflects timing and amount of operating payments.
33. The increase is due to funding catalyst infrastructure.
34. The increase is due to land revaluations at 30 June 2015.
35. The decrease is due to catalyst infrastructure loan funding being treated as current liability.
Major variations between 2015-16 Estimated Actual and the 2016-17 Budget include:
36. The decrease reflects the commencement of funding for the Catalyst Infrastructure Program and revised scheduleof development activity.
37. The increase is due to additional construction in accordance with the expected schedule of developmentprograms.
38. The increase is due to catalyst loan funding in accordance with the construction program.
39. The increase is due to forecast spend on the GC2018 Village.
40. The increase is due to funding catalyst infrastructure.
Cash flow statementMajor variations between 2015-16 Budget and 2015-16 Estimated Actual include:
41. The decrease is due to lower than budgeted land sales as a result of changing market conditions.
42. The decrease is due to the transfer of funding for Bundaberg Gas Pipeline from EDQ to DSD.
43. The decrease is due to the transfer of the Bundaberg Gas Pipeline construction from EDQ to DSD and lower thanbudgeted development costs.
44. The increase is due to the timing of the payment of tax equivalents.
45. The decrease is due to the receipt of security deposits.
46. The increase is due to land leases being paid out earlier than budgeted.
47. The decrease is due to delayed spend on industrial development projects.
48. The decrease is due to delayed catalyst infrastructure loan funding.
49. The decrease is due to delayed construction spending in accordance with the expected schedule of developmentprograms.
50. The decrease is due to delayed Priority Development Infrastructure (PDI) expenditure.
51. The increase is due to a partial repayment made as part of an overall debt reduction strategy.
Major variations between 2015-16 Budget and 2016-17 Budget include:
52. The decrease is due to lower than budgeted land sales as a result of changing market conditions.
53. The decrease is due to lower development costs as a result of reduced land sales.
54. The decrease is due to the timing of the payment of tax equivalents.
55. The decrease is due to the receipt of security deposits.
56. The increase is due to timing of expected conversion to freehold leases.
57. The increase is due to higher forecast spend on the GC2018 Village in accordance with the constructionprogram.
2016-17 Queensland State Budget – Service Delivery StatementsDepartment of Infrastructure, Local Government and Planning
69
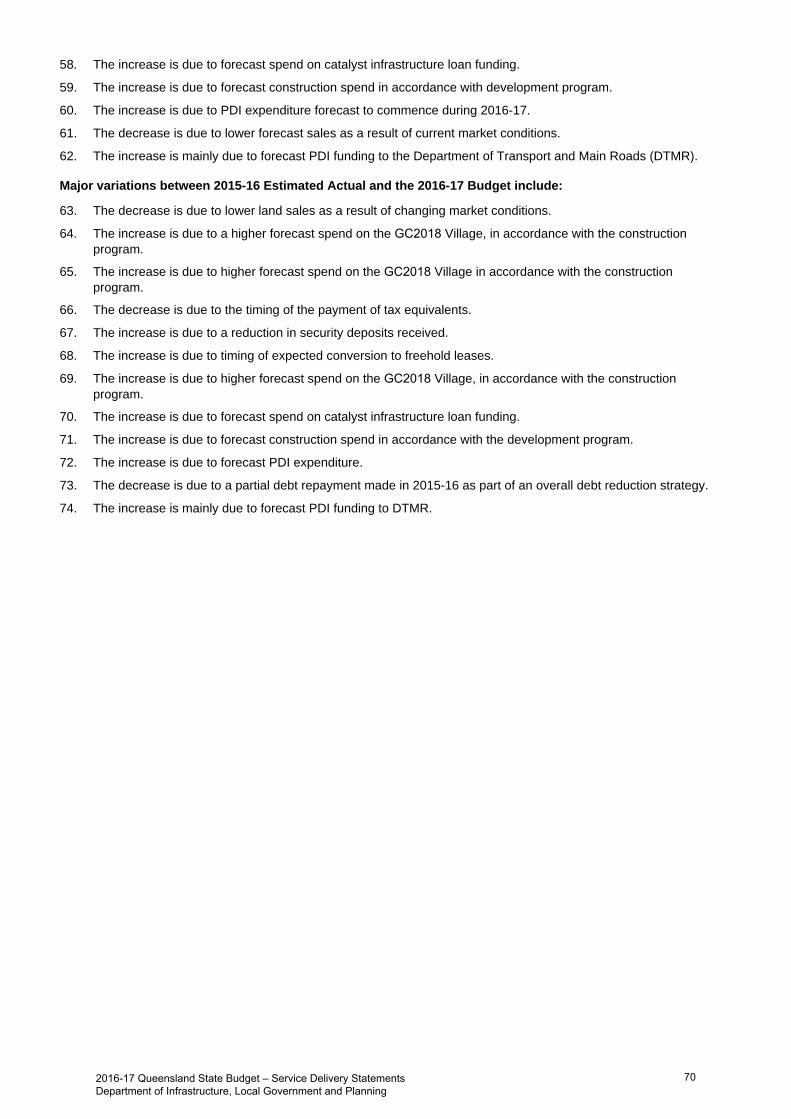
58. The increase is due to forecast spend on catalyst infrastructure loan funding.
59. The increase is due to forecast construction spend in accordance with development program.
60. The increase is due to PDI expenditure forecast to commence during 2016-17.
61. The decrease is due to lower forecast sales as a result of current market conditions.
62. The increase is mainly due to forecast PDI funding to the Department of Transport and Main Roads (DTMR).
Major variations between 2015-16 Estimated Actual and the 2016-17 Budget include:
63. The decrease is due to lower land sales as a result of changing market conditions.
64. The increase is due to a higher forecast spend on the GC2018 Village, in accordance with the constructionprogram.
65. The increase is due to higher forecast spend on the GC2018 Village in accordance with the constructionprogram.
66. The decrease is due to the timing of the payment of tax equivalents.
67. The increase is due to a reduction in security deposits received.
68. The increase is due to timing of expected conversion to freehold leases.
69. The increase is due to higher forecast spend on the GC2018 Village, in accordance with the constructionprogram.
70. The increase is due to forecast spend on catalyst infrastructure loan funding.
71. The increase is due to forecast construction spend in accordance with the development program.
72. The increase is due to forecast PDI expenditure.
73. The decrease is due to a partial debt repayment made in 2015-16 as part of an overall debt reduction strategy.
74. The increase is mainly due to forecast PDI funding to DTMR.
2016-17 Queensland State Budget – Service Delivery StatementsDepartment of Infrastructure, Local Government and Planning
70

Glossary of terms
Accrual accounting Recognition of economic events and other financial transactions involving revenue, expenses, assets, liabilities and equity as they occur and reporting in financial statements in the period to which they relate, rather than when a flow of cash occurs.
Administered items Assets, liabilities, revenues and expenses an entity administers, without discretion, on behalf of the Government.
Agency/entity Used generically to refer to the various organisational units within Government that deliver services or otherwise service Government objectives. The term can include departments, commercialised business units, statutory bodies or other organisations established by Executive decision.
Appropriation Funds issued by the Treasurer, under Parliamentary authority, to agencies during a financial year for: delivery of agreed services administered items adjustment of the Government’s equity in agencies, including acquiring of
capital.
Balance sheet A financial statement that reports the assets, liabilities and equity of an entity as at a particular date.
Capital A term used to refer to an entity’s stock of assets and the capital grants it makes to other agencies. Assets include property, plant and equipment, intangible items and inventories that an entity owns/controls and uses in the delivery of services.
Cash Flow Statement A financial statement reporting the cash inflows and outflows for an entity’s operating, investing and financing activities in a particular period.
Controlled Items Assets, liabilities, revenues and expenses that are controlled by departments. These relate directly to the departmental operational objectives and arise at the discretion and direction of that department.
Depreciation The periodic allocation of the cost of physical assets, representing the amount of the asset consumed during a specified time.
Equity Equity is the residual interest in the assets of the entity after deduction of its liabilities. It usually comprises the entity’s accumulated surpluses/losses, capital injections and any reserves.
Equity injection An increase in the investment of the Government in a public sector agency.
Financial statements Collective description of the Income Statement, the Balance Sheet and the Cash Flow Statement for an entity’s controlled and administered activities.
2016-17 Queensland State Budget – Service Delivery StatementsDepartment of Infrastructure, Local Government and Planning
71

Income statement A financial statement highlighting the accounting surplus or deficit of an entity. It provides an indication of whether the entity has sufficient revenue to meet expenses in the current year, including non-cash costs such as depreciation.
Outcomes Whole-of-government outcomes are intended to cover all dimensions of community wellbeing. They express the current needs and future aspirations of communities, within a social, economic and environment context.
Own-source revenue Revenue that is generated by an agency, generally through the sale of goods and services, but it may also include some Commonwealth funding.
Priorities Key policy areas that will be the focus of Government activity.
Services The actions or activities (including policy development) of an agency which contribute to the achievement of the agency’s objectives.
Service area Related services grouped into a high level service area for communicating the broad types of services delivered by an agency.
Service standard Define a level of performance that is expected to be achieved appropriate for the service area or service. Service standards are measures of efficiency or effectiveness.
For a more detailed Glossary of Terms, please refer to the Reader’s Guide available on the Budget website at www.budget.qld.gov.au
2016-17 Queensland State Budget – Service Delivery StatementsDepartment of Infrastructure, Local Government and Planning
72


Queensland Budget 2016-17 Service Delivery Statements www.budget.qld.gov.au

Queensland Budget 2016-17 Service Delivery Statements www.budget.qld.gov.au