Embed Size (px)
Citation preview
Telecommun Syst (2012) 50:31–45DOI 10.1007/s11235-010-9383-2
Service characterization for cost/benefit optimizationof enhanced UMTS
Fernando J. Velez · Orlando Cabral · Francisco Merca ·Vasos Vassiliou
Published online: 3 August 2010© Springer Science+Business Media, LLC 2010
Abstract In this paper an all-IP Enhanced-Universal Mo-bile Telecommunications System (E-UMTS) is considered,where enhancements include link level behavior, high-speeddownlink packet access (HSDPA) channel, resource man-agement, Diffserv architecture, and Radio Resource Man-agement schemes. An overview of E-UMTS deploymentscenarios and service needs is presented based on the viewsof relevant players. Deployment and mobility scenarios areconsidered, including expected population density and us-age of service mix for three environments, namely offices,urban/vehicular, and business city center. In addition, basedon population and service penetration values, E-UMTS traf-fic generation and activity models are described and charac-terized. Based on these scenarios and characterizations, sys-tem level simulations are carried out and the enhanced ser-vice quality performance is demonstrated, including block-ing probability, handover failure probability and end-to-end
F.J. Velez (�) · O. Cabral · F. MercaInstituto de Telecomunicações, Departamento de EngenhariaElectromecânica, Faculdade de Engenharia, Universidade daBeira Interior, Calçada Fonte do Lameiro, 6201-001 Covilhã,Portugale-mail: [email protected]
O. Cabrale-mail: [email protected]
F. Mercae-mail: [email protected]
F.J. VelezCentre for Telecommunications Research, King’s College LondonStrand, London WC2R 2LS, UK
V. VassiliouDepartment of Computer Science, University of Cyprus,75 Kallipoleos Street, P.O. Box 20537, 1678 Nicosia, Cypruse-mail: [email protected]
delay in each deployment scenario. By using system levelsimulations, services and environmental conditions can bemapped into deployment strategies (and supported systemcapacity) whose evaluation is essential prior to field trialsand real implementation. On the one hand, costs depend onthe prices of the spectrum, equipment, operation and main-tenance, as well as on the number of cells which, in turn,depends on the cell radius. On the other, revenues dependon the price per MB and on the supported throughput. Asthe goal of operators and service providers is to maximizethe profit, the profit in percentage was obtained for the threeconsidered scenarios. Its optimum values are found for cellradii around 31, 257, and 310 m for offices, vehicular andbusiness city center scenarios, respectively.
Keywords Enhanced UMTS · Service characterization ·Deployment scenarios · Performance evaluation · Costbenefit analysis · Economic impact
1 Introduction
Enhanced-Universal Mobile Telecommunications SystemUMTS (E-UMTS) is a UMTS evolution step which providesbit rates higher than 2 Mbps in the uplink and downlink di-rections, over a 5 MHz frequency carrier. It enables the pro-vision of new wideband services and a significant reductionof the price per bit, running over flexible Quality of Ser-vice (QoS) enabled IP based access and core networks, andmaking possible an effective end-to-end packet based trans-mission. European projects, (e.g. IST-SEACORN,1 IST-
1http://www.it.pt/project_detail_p.asp?ID=239.
32 F.J. Velez et al.
BBONE,2 IST-CMOBILE,3 IST-UNITE4) have proposeda set of enhancements to UMTS, which include, amongothers, advanced modulation and radio transmission tech-niques, improved strategies for IP routing, and QoS assur-ance.
E-UMTS allows for expansion both in the downlinkand uplink directions. High Speed Downlink Packet Access(HSDPA) for instance, a major part of the E-UMTS con-cept, mostly extends UMTS maximum achieved data ratesfor the downlink direction. Hence, E-UMTS supports wide-band real-time/time-based mobile ubiquitous and seamlessapplications [1], scaling system capacity for mass-marketservices.
While in the Wireless LAN (WLAN) domain high ca-pacity is possible with the different versions of IEEE 802.11(54 Mbps with a/g standard, and 108 Mbps with the n stan-dard), in the mobile communications domain the data-ratesare not so high and E-UMTS is an important step to achievethis goal. Furthermore, with the use of a wider range of de-vices with various radio interfaces, E-UMTS is a 3.5G sys-tem able to support values of capacity comparable to theones needed for broadband mobile applications, and willallow for the introduction of the Always Best Connected(ABC) concept [2]. In this context, instead of being a com-peting technology, E-UMTS is complementary to the vari-ous types of WLANs (and other radio and access technolo-gies).
When a hardware demonstrator is not available and sincethe E-UMTS enhancements proposed in http://www.it.pt/project_detail_p.asp?ID=239, http://b-bone.ptinovacao.pt/,http://c-mobile.ptinovacao.pt/, http://www.ist-unite.org/have not yet been totally implemented, the only practicalway to evaluate the effect of the proposed enhancements ina multi-service context is by means of simulation. For thatpurpose a set of services needs to be considered in order tocreate a complete and realistic simulation framework, im-pacting directly on traffic generation models. These servicesare assessed from a variety of operation environments, eachwith its distinctive set of service preferences, usage patterns,and associated mobility profiles. Therefore, as an answer tothese services and environmental conditions, a matching setof deployment strategies need to be studied, adapted andsimulated.
The usage of each application, i.e., the percentage of anapplication’s connections relative to the total number of ac-tive applications, is one of the most important aspects to bedetermined. This data is essential for multi-service trafficanalysis and engineering purposes, as well as for simula-tions. The computation of the system capacity is, therefore,
2http://b-bone.ptinovacao.pt/.3http://c-mobile.ptinovacao.pt/.4http://www.ist-unite.org/.
one of the main motivations for the realization of this study.At the same time, a further step is taken in traffic modellingby introducing long range dependence models [3], betteradapted to wireless IP communications. These are basedon recent research that uses field data and has concludedthat traditional traffic models produce too optimistic resultswhen used to model some types of data traffic. This may re-sult in networks that are under dimensioned and thereforeunder-performing with respect to theoretical expectations.
A range of twenty-eight applications and eight deploy-ment environments was first considered in [4] for completedeployment scenarios. In this work, a subset of five servicesand three operation environments are selected to meet thetechnical demands of the simulation tools. Without this sum-marization effort the framework proposed would be very dif-ficult to evaluate due to the amount of computing resourcesit would require.
The system level simulations performed in this workconsider the identification of E-UMTS new services, newwireless techniques for capacity increase, as well as QoSsupport. Each simulation environment incorporates the sug-gested traffic mix and the link layer enhancements. Fromthese simulations, results can be extracted that focus onthe assessment of QoS support in E-UMTS. The sys-tem level simulator was developed building on the pub-licly available simulation framework Network Simulator—version 2 (ns-2). New modules or additions to existingmodules were developed to support the simulation of 3 G(and beyond) UMTS and Enhanced UMTS networks. Rep-resentative performance evaluation results are presentedto demonstrate how the system level simulator can beused for system capacity determination and network plan-ning.
The paper is organized as follows. Section 2 first presentsa set of simulation scenarios derived for E-UMTS deploy-ment environments. The environments include informationon the expected population density and the expected us-age of service mix. The set of applications cover voice,interactive data (e.g., Instant Messaging for Multimedia)and streaming-based services (Video-telephony, HD Video-telephony). Section 3 describes session and activity parame-ters. A choice of source traffic models to be used in E-UMTSsimulations is also presented. Section 4 addresses details onthe organization and development of the simulations and themain characterization parameters of the scenarios, includingmobility aspects, while Sect. 5 presents the simulation re-sults for each environment, including blocking probability,handover failure probability and end-to-end delay. In Sect. 6,a cost/revenue model is proposed and its usefulness for theoptimization of the planning is shown for each of the sce-narios. Finally, conclusions are drawn in Sect. 7.
Service characterization for cost/benefit optimization of enhanced UMTS 33
2 Deployment scenarios and traffic behavior
2.1 Application mix
Although tens of applications can be considered in the E-UMTS deployment scenarios [4, 5], a reduced set of rep-resentative services and environments is required in or-der to meet the technical demands of the simulation tools.Without this summarization effort the framework proposedwould pose considerable difficulties to implement, due tothe amount of computing resources it would require fromsimulators.
Three deployment scenarios are considered with a mix-ture of four or five services each, depending on the envi-ronment: (i) offices, OFF (buildings); (ii) urban/vehicular,URB/VEH; and (iii) business city center, BCC. Proposedapplications and their relative usage for each environmentare shown in Table 1. This table is adapted from previouswork [4] by assuming, as a simplification, that the most sig-nificant application in a service group accounts for all thetraffic usage in that group.
The envisaged approximated data rates are introduced forall applications in accordance with the service class associ-ated with the application. The population density factors foreach of the scenarios are also the ones from [4, 5]. Data ratesare aligned as far as possible to existing standard values inUMTS and HSDPA.
2.2 Application traffic
At the application level, the amount of generated calls/sessions is dependent on the number of potential users andthe session arrival rate per user that characterizes each ser-vice and environment. Together with call/session durationand activity pattern, they determine the traffic behavior atup- and downlink. It is a worth noting that the term call usu-ally refers to conversational services while session refers todata connections.
2.3 Busy hour call attempt
Busy hour call attempts represent in our work the total num-ber of call attempts by all users considered in one simula-tion. They correspond to the call attempts per unit time forthe users covered by a radio cell or part of a cell [4]
BHCAj = Usagej
τj
· MT · ρ (1)
where MT is the number of users in the cell, τj is the averagecall/session duration, and ρ is the average traffic per user(which depends on the fraction of active users f , which canvary from 0 to 1 [6]). From the values for the usage fromTable 1 and for given application’s average duration, takinga given user population (e.g., MT = 100) into account, itis straightforward to obtain results for BHCA as a functionof ρ, as it has a linear dependence [4].
2.4 Quality and grade of service
Quality of service parameters include upper limits for la-tency (end-to-end delay), bit error rate (BER), and frame er-ror rate (FER). In terms of grade of service, the maximum al-lowed latency varies between 150 and 200 ms for voice andvideo-telephony applications (or even up to 500 ms for assis-tance in travel), and 2–10 s for Instant Messaging for Mul-timedia or Multimedia Web Browsing [5]. While the maxi-mum allowed BER is 10−4 for voice and video-telephonyapplications it decreases down to 10−6 for the remainingones. Regarding FER, a limit of 1–3% was defined for VOI,VTE and HDT.5
Values for the grade of service were identified for theblocking, handover failure and call/session dropping prob-
5The acronyms VOI, VTE, MWB, IMM, ATR, and HDT refer to theapplications considered in our scenarios, and are defined in Table 1.
Table 1 Proposal for E-UMTSapplications usage in each of theSEACORN simulation scenarios
Applications usage Data rate[kbps]
Usage [%]
OFF URB BCC
Sound
Voice (VOI) 12.2 58.0 82.5 27.0
High Interactive Multimedia
Video-telephony (VTE) 128 22.3 11.0 16.0
Narrowband
Multimedia Web Browsing (MWB) 384 8.0 2.0 26.0
Wideband
Instant Messaging for Multimedia (IMM) 1024 11.7 – –
Assistance in Travel (ATR) 1660 – 4.5 –
HD Video telephony (HDT) 2048 – – 31.0
Density Factor (users/m2) 0.150 0.012 0.031
34 F.J. Velez et al.
abilities. The handover failure probability is the probabil-ity of a user not succeeding in transferring its connectionfrom a cell to another. By call/session dropping probabilitywe refer to the probability of forced connection termination.Thus, in our approach, call dropping is caused by handoverfailure during the whole connection, and can then be relatedwith the handover failure probability. According to [7], thethreshold for handover failure probability can be related tothe maximum connection dropping probability by
(Phf )max = μ
η· (Pd)max (2)
where μ is the service rate, meaning that the average du-ration is given by τ = 1/μ, η is the cross-over rate, andγ = η/μ is the handover rate. Hence,
(Phf )max = 1
γ· (Pd)max, (3)
and γ = ητ . Recommendation E.771 [8] proposes a limitof 1% blocking probability for future mobile systems, in-cluding the radio channel blocking probability. Concerninghandover failure, a fixed value, independent of the cell size,can only be defined for the call dropping probability, Pd ,which can nevertheless be easily related with handover fail-ure probability. Half of the limit of blocking probability isproposed for Pd , i.e., 0.5% (in order to provide ongoing callswith a higher degree of service quality). Some more toler-ant figures concerning maximum blocking probability wereused in 3G preliminary estimations [9], where an upper limitof 2% is used for the call blocking probability.
The maximum setup delay varies between 15–20 s forVoice, Video-telephony and Multimedia Web Browsing, and60 s for the remaining applications. It corresponds to theworst-case of an international call setup. Local calls requirea setup delay under 10 s [8].
Concerning services like Instant Messaging for Multi-media (IMM), Assistance in Travel (AIT), and HD VideoTelephony (HDVT) an important issue is the definition of ablocked call since these ones can be non-time-based services
and can therefore tolerate a longer delay, instead of block-ing (whenever resources are unavailable); hence, a longermaximum setup delay was defined for these services. A callattempt is considered blocked whenever its maximum setupdelay values is exceeded.
3 Session and activity characteristics
3.1 Call generation and traffic parameters
Call generation and traffic parameters describe service be-havior in terms of traffic generation. They include the aver-age data-rate, session arrival rate per user during the busyhour, average call duration, burstiness and symmetry fac-tor [5]. Because model parameters for each type of con-nection may be different it is useful to have different des-ignations. Nevertheless, in E-UMTS the concept is basi-cally the same, since both entities are similarly supportedon packet data protocol context establishment. Since uplinkand downlink data-rates are not necessarily the same it mustbe referred that in simulations, the data-rate parameter valuerefers to the highest value between the two links, which isthe downlink in all exemplified cases.
The set of traffic parameters is defined in Table 2. Twolevels of behavior may be distinguished: call/session repre-senting traffic generation process, and activity models thatdescribe how a session behaves in terms of idle and activeperiods.
Call and session related parameters are used to model thebirth and death of calls and sessions. Session arrival raterepresents the average number of calls generated per ser-vice subscriber during the busy hour. The Poisson processis used to model session arrivals. Values for call/session ar-rival rate are derived from service penetration [5], Pj , andsession average duration values, τj , for application j con-sidering ρ = 0.03 Erl. These parameters are tightly associ-ated for each application, and deployment scenario, as for-mulated below. Usage, Uj , is expressed as a ratio betweenthe traffic for service j , (derived from session arrival rate,
Table 2 Call generation and traffic parameters
Applications Data rate[kbps]
Session arrival rate [min−1] τj
[min]Burstiness Symmetry
UL/DLOFF BCC URB
Voice 12 0.50 0.54 0.84 3 1 1
Video-telephony 128 0.45 0.48 0.48 3 1–5 1
Multimedia web browsing 384 0.16 0.21 0.19 15 1–20 0.25
Instant Messaging for MM 1024 0.15 – – 15 1–50 0.05
Assistance in Travel 1536 – – 0.11 20 1–5 0.07
HD Video-telephony 2048 – 0.09 – 30 1–5 1
WLAN Interconnection 12,780 0.03 – – 60 1–20 0.25
Service characterization for cost/benefit optimization of enhanced UMTS 35
Table 3 Application activity parameters
Applications Active state (ON) Inactive state (OFF)
Average [s] File size [kB] Distribution Average [s] Distribution
Voice 1,4 2.14 Exponential 1.7 Exponential
Video-telephony τ – – 0 –
Multimedia web browsing 5 240 Pareto 13 Pareto
Instant Messaging for MM 5 640 Weibull 90 Pareto
Assistance in Travel 60 11,520 Weibull 14 Pareto
HD Video-telephony τ – – 0 –
WLAN Interconnection 5 7988 Weibull 1 Pareto
duration and number of subscribers), and the total producedtraffic, during the busy hour, by all services. The conversionto BHCA can be done by using (4).
Uj = SessArrRatej · Pj · τj∑
i SessArrRatei · Pi · τi
(4)
3.2 Application activity parameters
Session activity parameters describe the detailed aspects oftraffic within a call. This is accomplished by means of an al-ternating active/inactive state model, i.e., on/off states. Theactivity within a call can be modelled by defining an aver-age duration for each on and off periods, together with anadequate statistical distribution. Video telephony is alwaysactive in both directions. Hence, it does not present a burstybehavior.
The basic model for data application normally uses a websession as a paradigm, although the model may be used forall types of data. A session is composed by of a set of activeperiods made of packet sequences (packet calls) separatedby inactivity periods. A packet call is a sequence or burstsof packets, corresponding, e.g., to a web page or other dataitem. Inactivity periods between packet call arrivals are of-ten called reading time (or inactivity time). This model isdescribed in [10].
Table 3 presents the average active versus inactive dura-tions, the corresponding file sizes of activity packet sessionperiods and the statistical distributions of the active and in-active durations as well.
Further details on traffic source models and their para-meters are given in [5]. Regarding streaming services, amodel for streaming video is also outlined in [11], basedon MPEG-4 trace statistics. Multicast and broadcast trafficin an Enhanced-UMTS environment is studied in [11].
4 Simulation topologies and mobility
Each simulation scenario is defined by a variety of parame-ters, including traffic, propagation and mobility models, as
well as topologies and user population. Furthermore, eachscenario corresponds to a specific operating environment.The three simulated environments are the Office (OFF) en-vironment, the Urban/Vehicular (URB/VEH) environment,and the Business City Centre (BCC) one. For the URB andOFF scenarios, a threshold for the maximum handover fail-ure probability was defined. For the BCC scenario, in turn, acombined threshold was used that simultaneously accountsfor the influence of blocked and dropped calls/sessions.
4.1 Office
In an office environment users are stationary most of thetime. When they move they have a specific destination,which is randomly chosen. The source and destination po-sitions are either in an office room or a corridor. Therefore,the chosen path is either along the x or the y axis. To char-acterize this environment, several parameters may be spec-ified such as the ratio of room-situated mobile terminals tothe corridor-situated mobile terminals at any time, the av-erage time in an office room (and the corresponding aver-age time in the corridor), the mobile speed, and the aver-age distance between source and destination. The consid-ered mobility model is the Random-Waypoint one [5, 12].The model defines a pattern of movements for each user in-dividually. In this pattern, each mobile node is assigned apause time. Every node waits for the time specified as thepause time. Then it chooses a random location on the mapand heads toward that location with a fixed speed of 3 km/h(0.83 m/s), a typical pedestrian speed.
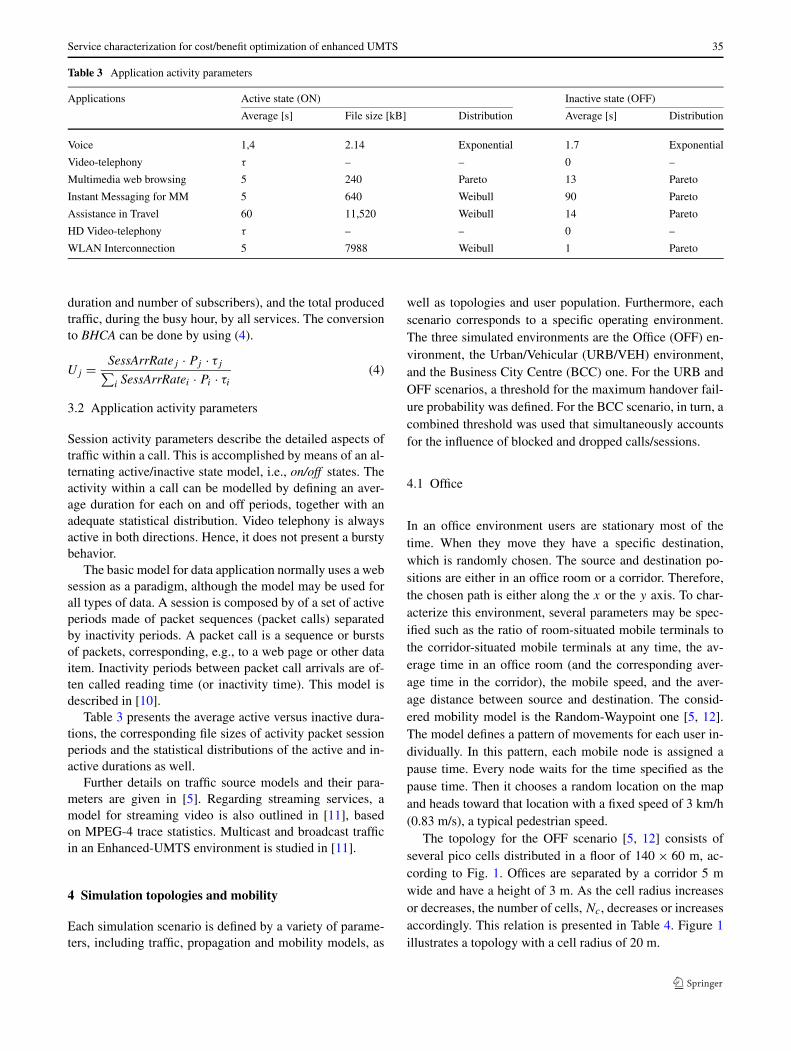
The topology for the OFF scenario [5, 12] consists ofseveral pico cells distributed in a floor of 140 × 60 m, ac-cording to Fig. 1. Offices are separated by a corridor 5 mwide and have a height of 3 m. As the cell radius increasesor decreases, the number of cells, Nc, decreases or increasesaccordingly. This relation is presented in Table 4. Figure 1illustrates a topology with a cell radius of 20 m.
36 F.J. Velez et al.
Fig. 1 Offices topology(triangles represent basestations)
Table 4 Cell radius R versusnumber of cells, Nc
R [m] 35.0 20.0 15.6 12.7 10.8 9.3 8.3 7.4 6.7 6.1 5.6
Nc 3 6 8 10 12 14 16 18 20 22 24
4.2 Urban
In an urban environment the high speed mobile terminalsmove according to a pseudorandom mobility model. Posi-tion updates are often due to the high speeds. As an exam-ple, the positions may be updated every twenty meters. Pa-rameters that could be specified are the following: averagespeed, probability to change direction at a position updateand maximum angle for this change of direction.
The mobility model used for the urban environment is theGauss-Markov one [5, 12]. The pattern is confined withinthe predefined grid area. The Gauss-Markov model is de-fined to be between the random walk (slow mobiles) andthe fluid flow (very high speed mobiles) models, which arelabeled as extremes. Most of the nodes move somewherein-between those speeds. Parameters for the Gauss-Markovmodel include the mobile speed at 50 km/h (13.89 m/s), anda seed, a random number that is fed into a random numbergenerator, as this model aims to assign pseudorandom pathsto the mobile users.
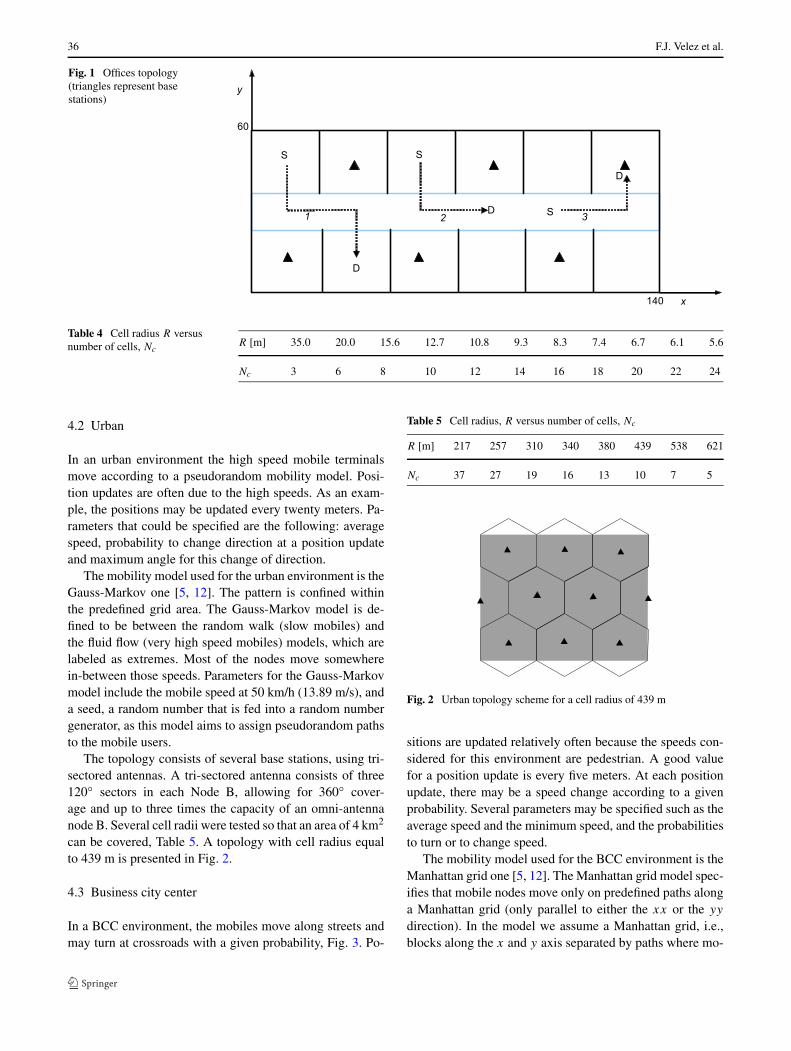
The topology consists of several base stations, using tri-sectored antennas. A tri-sectored antenna consists of three120◦ sectors in each Node B, allowing for 360◦ cover-age and up to three times the capacity of an omni-antennanode B. Several cell radii were tested so that an area of 4 km2
can be covered, Table 5. A topology with cell radius equalto 439 m is presented in Fig. 2.
4.3 Business city center
In a BCC environment, the mobiles move along streets andmay turn at crossroads with a given probability, Fig. 3. Po-
Table 5 Cell radius, R versus number of cells, Nc
R [m] 217 257 310 340 380 439 538 621
Nc 37 27 19 16 13 10 7 5
Fig. 2 Urban topology scheme for a cell radius of 439 m
sitions are updated relatively often because the speeds con-sidered for this environment are pedestrian. A good valuefor a position update is every five meters. At each positionupdate, there may be a speed change according to a givenprobability. Several parameters may be specified such as theaverage speed and the minimum speed, and the probabilitiesto turn or to change speed.
The mobility model used for the BCC environment is theManhattan grid one [5, 12]. The Manhattan grid model spec-ifies that mobile nodes move only on predefined paths alonga Manhattan grid (only parallel to either the xx or the yy
direction). In the model we assume a Manhattan grid, i.e.,blocks along the x and y axis separated by paths where mo-
Service characterization for cost/benefit optimization of enhanced UMTS 37
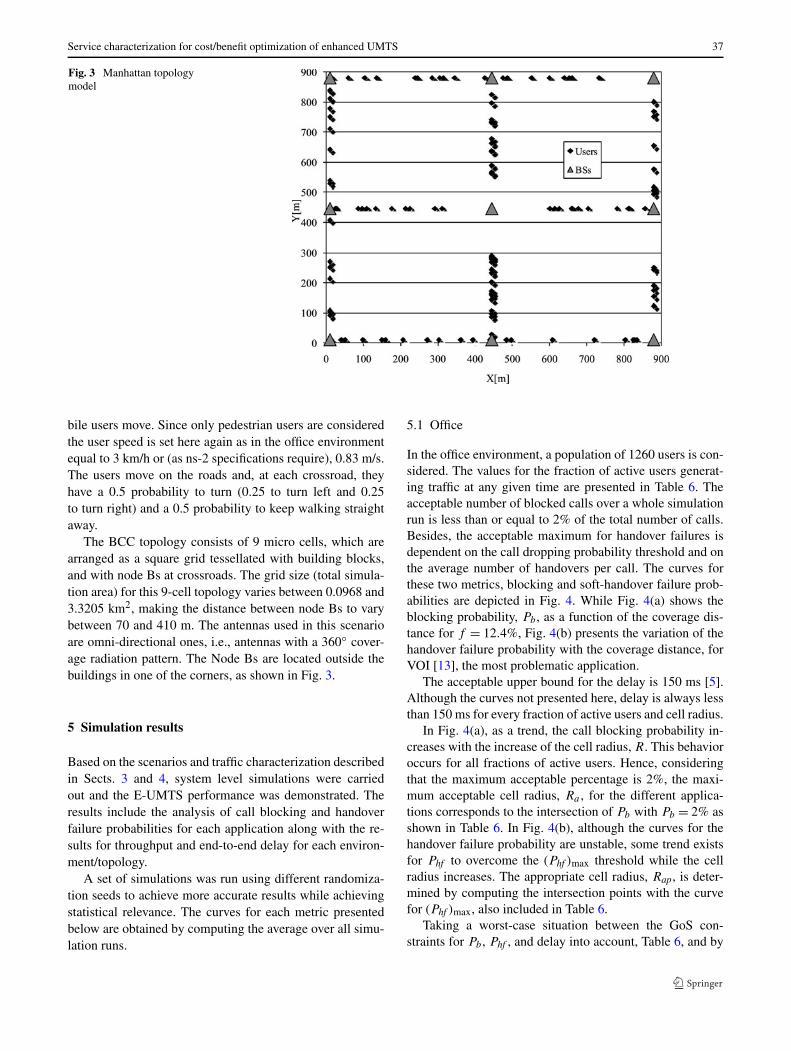
Fig. 3 Manhattan topologymodel
bile users move. Since only pedestrian users are consideredthe user speed is set here again as in the office environmentequal to 3 km/h or (as ns-2 specifications require), 0.83 m/s.The users move on the roads and, at each crossroad, theyhave a 0.5 probability to turn (0.25 to turn left and 0.25to turn right) and a 0.5 probability to keep walking straightaway.
The BCC topology consists of 9 micro cells, which arearranged as a square grid tessellated with building blocks,and with node Bs at crossroads. The grid size (total simula-tion area) for this 9-cell topology varies between 0.0968 and3.3205 km2, making the distance between node Bs to varybetween 70 and 410 m. The antennas used in this scenarioare omni-directional ones, i.e., antennas with a 360◦ cover-age radiation pattern. The Node Bs are located outside thebuildings in one of the corners, as shown in Fig. 3.
5 Simulation results
Based on the scenarios and traffic characterization describedin Sects. 3 and 4, system level simulations were carriedout and the E-UMTS performance was demonstrated. Theresults include the analysis of call blocking and handoverfailure probabilities for each application along with the re-sults for throughput and end-to-end delay for each environ-ment/topology.
A set of simulations was run using different randomiza-tion seeds to achieve more accurate results while achievingstatistical relevance. The curves for each metric presentedbelow are obtained by computing the average over all simu-lation runs.
5.1 Office
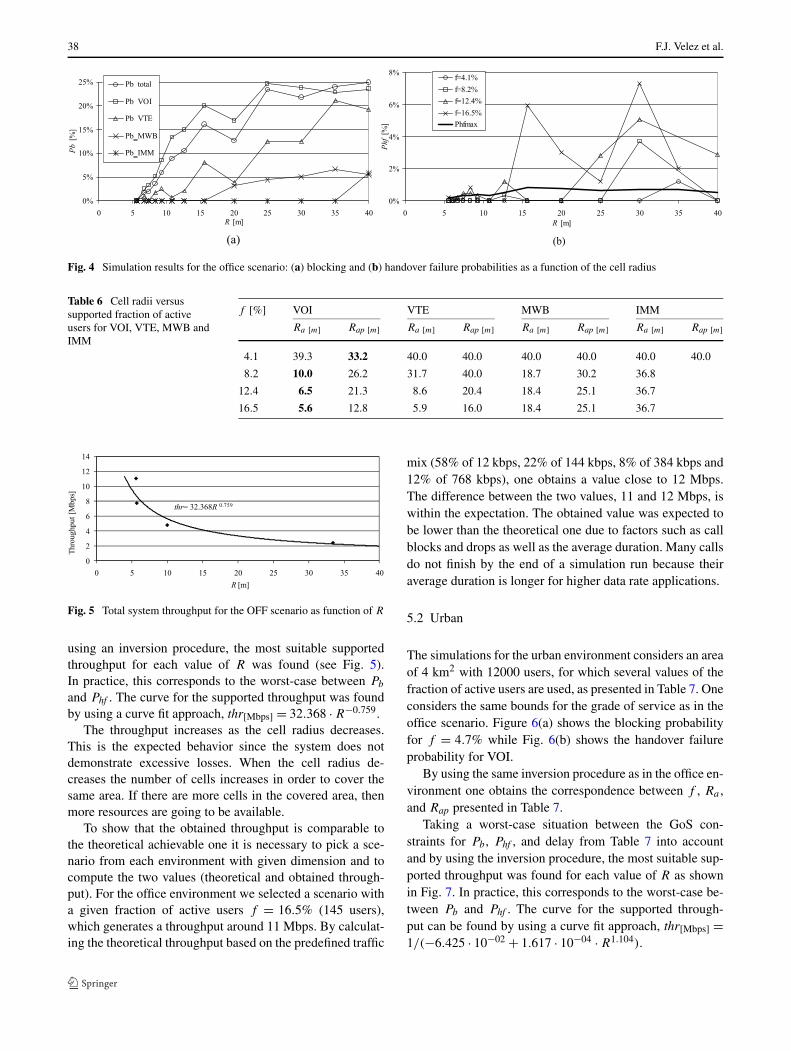
In the office environment, a population of 1260 users is con-sidered. The values for the fraction of active users generat-ing traffic at any given time are presented in Table 6. Theacceptable number of blocked calls over a whole simulationrun is less than or equal to 2% of the total number of calls.Besides, the acceptable maximum for handover failures isdependent on the call dropping probability threshold and onthe average number of handovers per call. The curves forthese two metrics, blocking and soft-handover failure prob-abilities are depicted in Fig. 4. While Fig. 4(a) shows theblocking probability, Pb , as a function of the coverage dis-tance for f = 12.4%, Fig. 4(b) presents the variation of thehandover failure probability with the coverage distance, forVOI [13], the most problematic application.
The acceptable upper bound for the delay is 150 ms [5].Although the curves not presented here, delay is always lessthan 150 ms for every fraction of active users and cell radius.
In Fig. 4(a), as a trend, the call blocking probability in-creases with the increase of the cell radius, R. This behavioroccurs for all fractions of active users. Hence, consideringthat the maximum acceptable percentage is 2%, the maxi-mum acceptable cell radius, Ra , for the different applica-tions corresponds to the intersection of Pb with Pb = 2% asshown in Table 6. In Fig. 4(b), although the curves for thehandover failure probability are unstable, some trend existsfor Phf to overcome the (Phf )max threshold while the cellradius increases. The appropriate cell radius, Rap, is deter-mined by computing the intersection points with the curvefor (Phf )max, also included in Table 6.
Taking a worst-case situation between the GoS con-straints for Pb , Phf , and delay into account, Table 6, and by
38 F.J. Velez et al.
Fig. 4 Simulation results for the office scenario: (a) blocking and (b) handover failure probabilities as a function of the cell radius
Table 6 Cell radii versussupported fraction of activeusers for VOI, VTE, MWB andIMM
f [%] VOI VTE MWB IMM
Ra [m] Rap [m] Ra [m] Rap [m] Ra [m] Rap [m] Ra [m] Rap [m]
4.1 39.3 33.2 40.0 40.0 40.0 40.0 40.0 40.0
8.2 10.0 26.2 31.7 40.0 18.7 30.2 36.8
12.4 6.5 21.3 8.6 20.4 18.4 25.1 36.7
16.5 5.6 12.8 5.9 16.0 18.4 25.1 36.7
Fig. 5 Total system throughput for the OFF scenario as function of R
using an inversion procedure, the most suitable supportedthroughput for each value of R was found (see Fig. 5).In practice, this corresponds to the worst-case between Pb
and Phf . The curve for the supported throughput was foundby using a curve fit approach, thr[Mbps] = 32.368 · R−0.759.
The throughput increases as the cell radius decreases.This is the expected behavior since the system does notdemonstrate excessive losses. When the cell radius de-creases the number of cells increases in order to cover thesame area. If there are more cells in the covered area, thenmore resources are going to be available.
To show that the obtained throughput is comparable tothe theoretical achievable one it is necessary to pick a sce-nario from each environment with given dimension and tocompute the two values (theoretical and obtained through-put). For the office environment we selected a scenario witha given fraction of active users f = 16.5% (145 users),which generates a throughput around 11 Mbps. By calculat-ing the theoretical throughput based on the predefined traffic
mix (58% of 12 kbps, 22% of 144 kbps, 8% of 384 kbps and12% of 768 kbps), one obtains a value close to 12 Mbps.The difference between the two values, 11 and 12 Mbps, iswithin the expectation. The obtained value was expected tobe lower than the theoretical one due to factors such as callblocks and drops as well as the average duration. Many callsdo not finish by the end of a simulation run because theiraverage duration is longer for higher data rate applications.
5.2 Urban
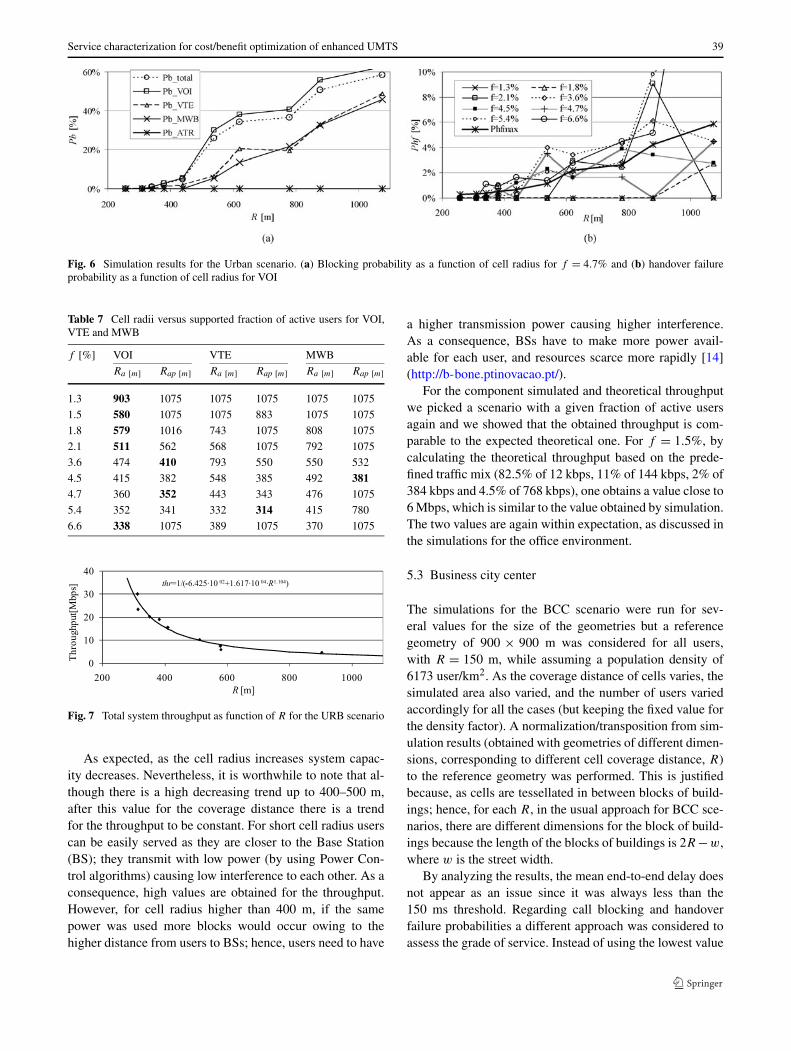
The simulations for the urban environment considers an areaof 4 km2 with 12000 users, for which several values of thefraction of active users are used, as presented in Table 7. Oneconsiders the same bounds for the grade of service as in theoffice scenario. Figure 6(a) shows the blocking probabilityfor f = 4.7% while Fig. 6(b) shows the handover failureprobability for VOI.
By using the same inversion procedure as in the office en-vironment one obtains the correspondence between f , Ra ,and Rap presented in Table 7.
Taking a worst-case situation between the GoS con-straints for Pb , Phf , and delay from Table 7 into accountand by using the inversion procedure, the most suitable sup-ported throughput was found for each value of R as shownin Fig. 7. In practice, this corresponds to the worst-case be-tween Pb and Phf . The curve for the supported through-put can be found by using a curve fit approach, thr[Mbps] =1/(−6.425 · 10−02 + 1.617 · 10−04 · R1.104).
Service characterization for cost/benefit optimization of enhanced UMTS 39
Fig. 6 Simulation results for the Urban scenario. (a) Blocking probability as a function of cell radius for f = 4.7% and (b) handover failureprobability as a function of cell radius for VOI
Table 7 Cell radii versus supported fraction of active users for VOI,VTE and MWB
f [%] VOI VTE MWB
Ra [m] Rap [m] Ra [m] Rap [m] Ra [m] Rap [m]
1.3 903 1075 1075 1075 1075 1075
1.5 580 1075 1075 883 1075 1075
1.8 579 1016 743 1075 808 1075
2.1 511 562 568 1075 792 1075
3.6 474 410 793 550 550 532
4.5 415 382 548 385 492 3814.7 360 352 443 343 476 1075
5.4 352 341 332 314 415 780
6.6 338 1075 389 1075 370 1075
Fig. 7 Total system throughput as function of R for the URB scenario
As expected, as the cell radius increases system capac-ity decreases. Nevertheless, it is worthwhile to note that al-though there is a high decreasing trend up to 400–500 m,after this value for the coverage distance there is a trendfor the throughput to be constant. For short cell radius userscan be easily served as they are closer to the Base Station(BS); they transmit with low power (by using Power Con-trol algorithms) causing low interference to each other. As aconsequence, high values are obtained for the throughput.However, for cell radius higher than 400 m, if the samepower was used more blocks would occur owing to thehigher distance from users to BSs; hence, users need to have
a higher transmission power causing higher interference.As a consequence, BSs have to make more power avail-able for each user, and resources scarce more rapidly [14](http://b-bone.ptinovacao.pt/).
For the component simulated and theoretical throughputwe picked a scenario with a given fraction of active usersagain and we showed that the obtained throughput is com-parable to the expected theoretical one. For f = 1.5%, bycalculating the theoretical throughput based on the prede-fined traffic mix (82.5% of 12 kbps, 11% of 144 kbps, 2% of384 kbps and 4.5% of 768 kbps), one obtains a value close to6 Mbps, which is similar to the value obtained by simulation.The two values are again within expectation, as discussed inthe simulations for the office environment.
5.3 Business city center
The simulations for the BCC scenario were run for sev-eral values for the size of the geometries but a referencegeometry of 900 × 900 m was considered for all users,with R = 150 m, while assuming a population density of6173 user/km2. As the coverage distance of cells varies, thesimulated area also varied, and the number of users variedaccordingly for all the cases (but keeping the fixed value forthe density factor). A normalization/transposition from sim-ulation results (obtained with geometries of different dimen-sions, corresponding to different cell coverage distance, R)to the reference geometry was performed. This is justifiedbecause, as cells are tessellated in between blocks of build-ings; hence, for each R, in the usual approach for BCC sce-narios, there are different dimensions for the block of build-ings because the length of the blocks of buildings is 2R −w,where w is the street width.
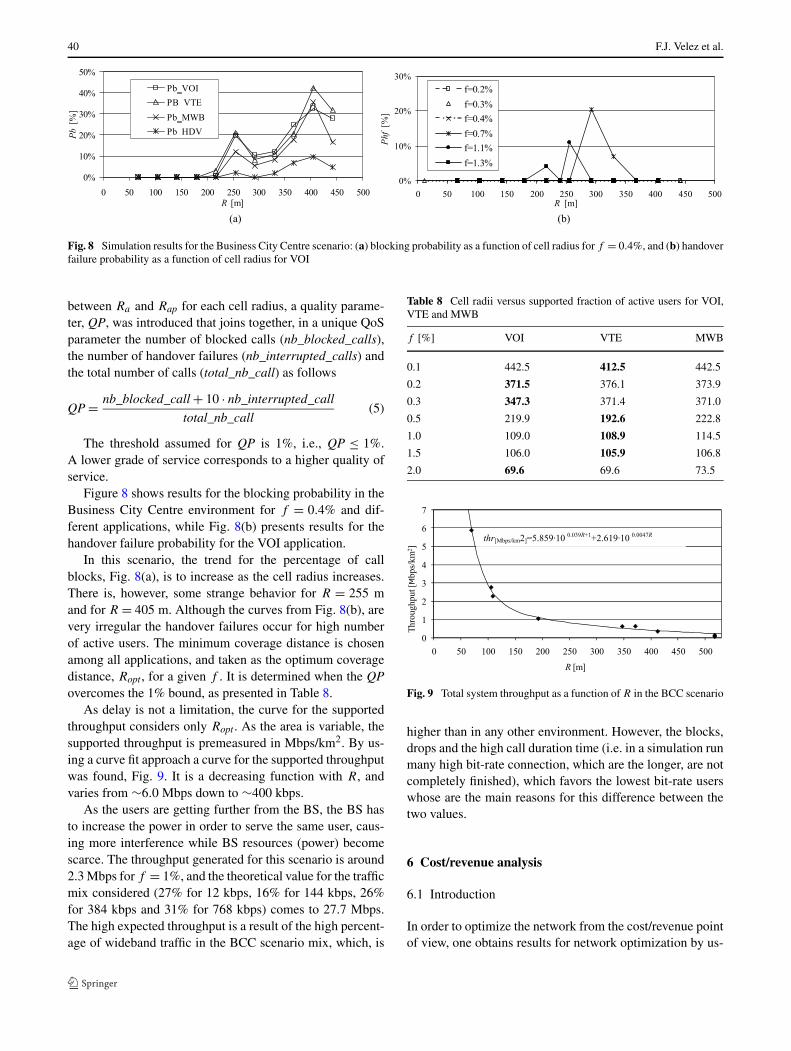
By analyzing the results, the mean end-to-end delay doesnot appear as an issue since it was always less than the150 ms threshold. Regarding call blocking and handoverfailure probabilities a different approach was considered toassess the grade of service. Instead of using the lowest value
40 F.J. Velez et al.
Fig. 8 Simulation results for the Business City Centre scenario: (a) blocking probability as a function of cell radius for f = 0.4%, and (b) handoverfailure probability as a function of cell radius for VOI
between Ra and Rap for each cell radius, a quality parame-ter, QP, was introduced that joins together, in a unique QoSparameter the number of blocked calls (nb_blocked_calls),the number of handover failures (nb_interrupted_calls) andthe total number of calls (total_nb_call) as follows
QP = nb_blocked_call + 10 · nb_interrupted_call
total_nb_call(5)
The threshold assumed for QP is 1%, i.e., QP ≤ 1%.A lower grade of service corresponds to a higher quality ofservice.
Figure 8 shows results for the blocking probability in theBusiness City Centre environment for f = 0.4% and dif-ferent applications, while Fig. 8(b) presents results for thehandover failure probability for the VOI application.
In this scenario, the trend for the percentage of callblocks, Fig. 8(a), is to increase as the cell radius increases.There is, however, some strange behavior for R = 255 mand for R = 405 m. Although the curves from Fig. 8(b), arevery irregular the handover failures occur for high numberof active users. The minimum coverage distance is chosenamong all applications, and taken as the optimum coveragedistance, Ropt, for a given f . It is determined when the QPovercomes the 1% bound, as presented in Table 8.
As delay is not a limitation, the curve for the supportedthroughput considers only Ropt. As the area is variable, thesupported throughput is premeasured in Mbps/km2. By us-ing a curve fit approach a curve for the supported throughputwas found, Fig. 9. It is a decreasing function with R, andvaries from ∼6.0 Mbps down to ∼400 kbps.
As the users are getting further from the BS, the BS hasto increase the power in order to serve the same user, caus-ing more interference while BS resources (power) becomescarce. The throughput generated for this scenario is around2.3 Mbps for f = 1%, and the theoretical value for the trafficmix considered (27% for 12 kbps, 16% for 144 kbps, 26%for 384 kbps and 31% for 768 kbps) comes to 27.7 Mbps.The high expected throughput is a result of the high percent-age of wideband traffic in the BCC scenario mix, which, is
Table 8 Cell radii versus supported fraction of active users for VOI,VTE and MWB
f [%] VOI VTE MWB
0.1 442.5 412.5 442.5
0.2 371.5 376.1 373.9
0.3 347.3 371.4 371.0
0.5 219.9 192.6 222.8
1.0 109.0 108.9 114.5
1.5 106.0 105.9 106.8
2.0 69.6 69.6 73.5
Fig. 9 Total system throughput as a function of R in the BCC scenario
higher than in any other environment. However, the blocks,drops and the high call duration time (i.e. in a simulation runmany high bit-rate connection, which are the longer, are notcompletely finished), which favors the lowest bit-rate userswhose are the main reasons for this difference between thetwo values.
6 Cost/revenue analysis
6.1 Introduction
In order to optimize the network from the cost/revenue pointof view, one obtains results for network optimization by us-
Service characterization for cost/benefit optimization of enhanced UMTS 41
ing the model described in [15] of which is made a briefintroduction. The system cost contains a fixed term, Cfi, thatrepresents licensing and spectrum auction fees, and a termproportional to the number of BSs, Cfb [€] · Nc/ula. Hence,the overall cost of the network per unit length or area, ula,per year is,
C0[€/ula] = Cfi [€/ula] + Cfb [€] · Nc/ula, (6)
where Cfb includes the installation costs of the BSs includ-ing the cost of obtaining cell sites, the normal backhaul,and the cost of hardware and core equipment common to all(see (10)); and Nc/ula is the number of cells per unit length orarea. C0 and Cfi are also given per ula. The estimation of thevariation of system capacity, obtained for a given grade ofservice, is an input for the revenues. The revenue per cell peryear, (Rv)cell can be obtained as a function of the throughputper BS, thrBS[kbps], and the revenue of a channel with a datarate Rb [kbps], RRb [€/min], by
(Rv)cell [€] = thrBS [kbps] · Tbh · RRb [€/min]Rb [kbps]
, (7)
where Tbh is the equivalent duration of busy hours per day,as defined in [15, 16].
The revenue per unit length or area per year, Rv [€/ula], isobtained by multiplying the revenue per cell by the numberof cells per unit length or area
Rv [€/ula] = Nc/ula · (Rv)cell [€]. (8)
6.2 Hypothesis
It is now important to present the main parameters that serveas an input to the model. The project duration is of 5 years,and we assumed a null discount rate. Costs and revenues aretaken on an annual basis. It were considered six busy hoursper day, 240 busy days per year,6 and the revenue/price of a144 kbps “channel” per minute (corresponding to the priceof one MB, approximately), R144 [€/min]. The revenue percell can be obtained as
(Rv)cell [€] = thrBS [kbps] · 60 · 6 · 240 · R144 [€/min]144[kbps]
. (9)
In the future, with equipment normalization and massproduction, the equipment prices will get lower, and thechannel prices will also get lower, making this kind of com-munication system more accessible. Table 9 considers sev-eral hypothesis for the price of the 144 kbps channel for thedifferent scenarios.
Two hypotheses were made for costs (A [17] and B), Ta-ble 10. Costs are different for several scenarios, since the of-fice scenario uses pico-cells, the urban one uses macro-cells
6http://b-bone.ptinovacao.pt/.
Table 9 Hypothesis for R144 [€/min] for offices, urban and BCC sce-nario
OFF URB BCC
R144 [€/min] 0.02 0.01 0.10
0.005 0.05 0.05
– 0.10 0.025
and the BCC one uses micro-cells. Cfb [€] can be determinedby
Cfb [€] = CBS + CInst
Nyear+ CM&O. (10)
The profit, Pft, an important result to optimize the net-work, is given by the difference between the revenues andthe costs, in €/ula, while the profit in percentage is givenby the net revenue normalized by the cost, i.e.,
Pft [%] = Rv [€/km] − C0 [€/km]C0 [€/km]
· 100[%]. (11)
We consider the profit in percentage instead of the ab-solute profit because this is a more relevant metric for oper-ators and service providers.
6.3 Optimization and profit
6.3.1 Offices
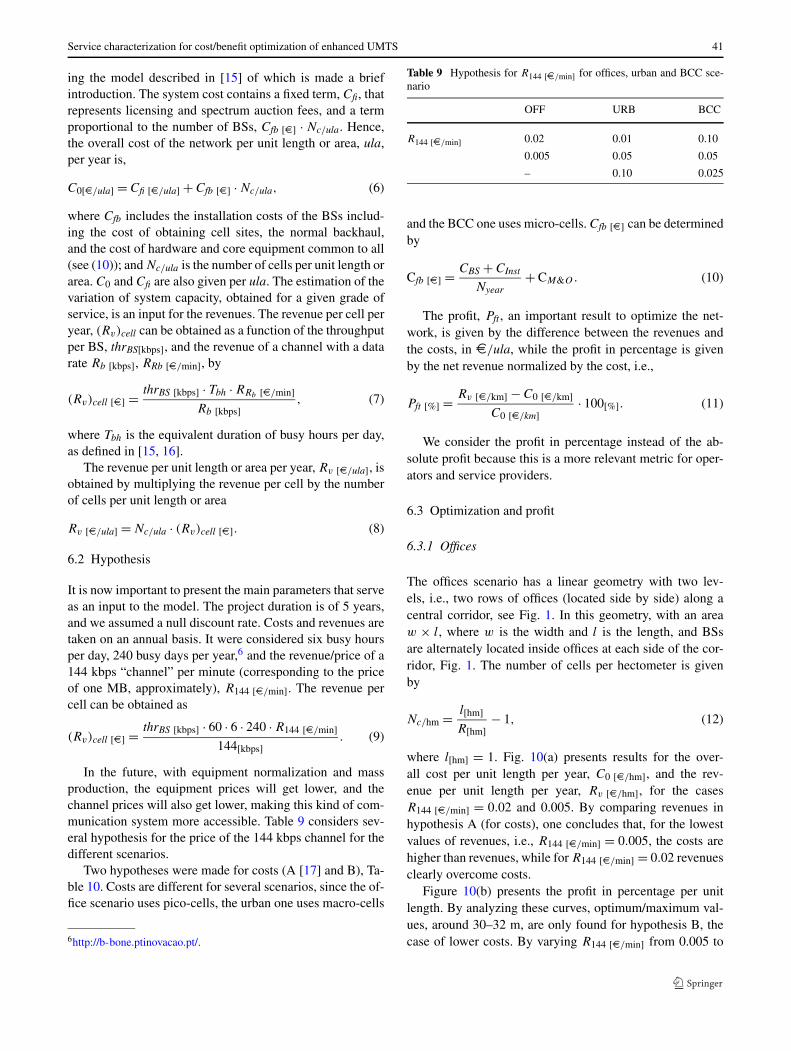
The offices scenario has a linear geometry with two lev-els, i.e., two rows of offices (located side by side) along acentral corridor, see Fig. 1. In this geometry, with an areaw × l, where w is the width and l is the length, and BSsare alternately located inside offices at each side of the cor-ridor, Fig. 1. The number of cells per hectometer is givenby
Nc/hm = l[hm]R[hm]
− 1, (12)
where l[hm] = 1. Fig. 10(a) presents results for the over-all cost per unit length per year, C0 [€/hm], and the rev-enue per unit length per year, Rv [€/hm], for the casesR144 [€/min] = 0.02 and 0.005. By comparing revenues inhypothesis A (for costs), one concludes that, for the lowestvalues of revenues, i.e., R144 [€/min] = 0.005, the costs arehigher than revenues, while for R144 [€/min] = 0.02 revenuesclearly overcome costs.
Figure 10(b) presents the profit in percentage per unitlength. By analyzing these curves, optimum/maximum val-ues, around 30–32 m, are only found for hypothesis B, thecase of lower costs. By varying R144 [€/min] from 0.005 to
42 F.J. Velez et al.
Table 10 Hypothesis for costs
Parameters Pico-cell Macro-cell Micro-cell
A B A B A B
Initial Costs:
BS price, CBS [€] 5000 2500 50,000 25,000 8000 3200
Installation, CInst [€] 3000 250 30,000 2500 2490 208
License fees, Cfi [€/ula] 1000 1000 1590 1590 1590 1590
Annual Cost:
Operation and maintenance, CM&O [€] 1000 250 3000 750 750 188
Fig. 10 Office scenario: (a) costs and revenues per unit length as a function of R, and (b) profit per unit length as a function of R
Fig. 11 Urban scenario: (a) costs and revenues per km2 as a function of R, and (b) profit per km2 as a function of R
0.02 there is no significant variation on the optimum cov-erage distance but the profit increases about eight times,from 63% to 552%. If hypothesis A is considered, i.e.,higher costs, no optimum coverage distance was found inthe range of the simulations. Furthermore, profit is negativewhen R144 [€/min] = 0.005.
Although in hypothesis A the reduction of cells size is notprofitable (even if there is a need to support a given systemcapacity), results from case B shows that a higher numberof pico-cell can be installed in the future, when costs of de-ploying and maintaining the network will decrease, enablingthe support of higher system capacity.
6.3.2 Urban
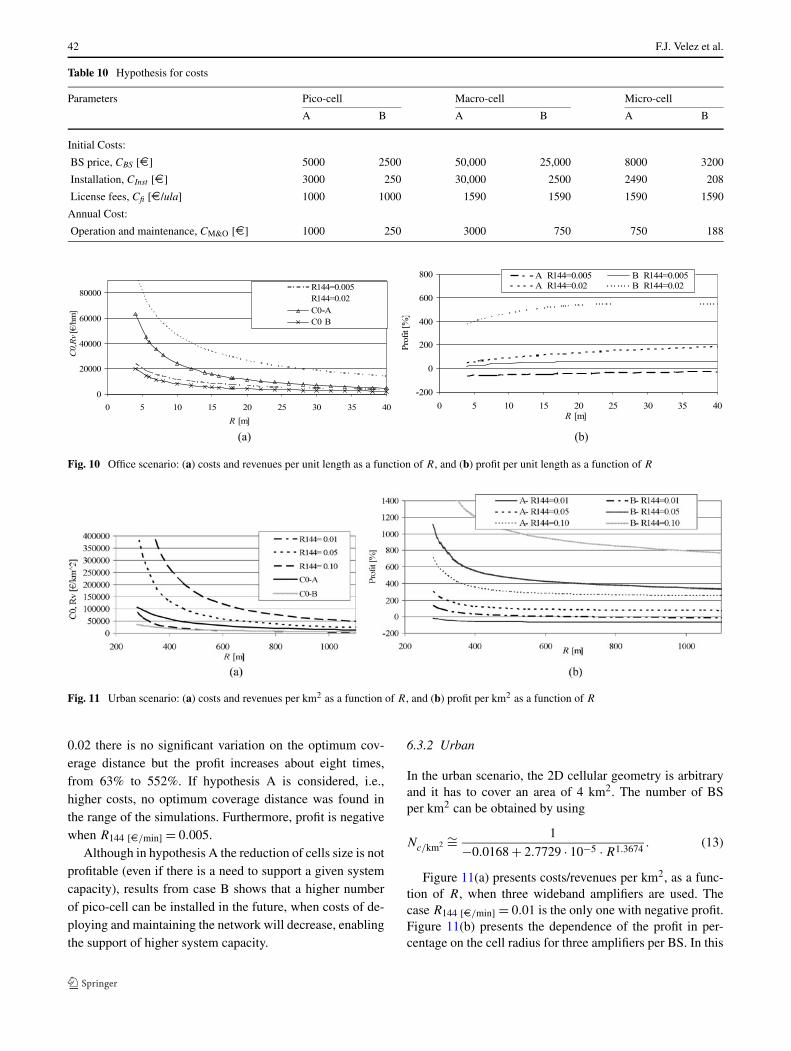
In the urban scenario, the 2D cellular geometry is arbitraryand it has to cover an area of 4 km2. The number of BSper km2 can be obtained by using
Nc/km2 ∼= 1
−0.0168 + 2.7729 · 10−5 · R1.3674. (13)
Figure 11(a) presents costs/revenues per km2, as a func-tion of R, when three wideband amplifiers are used. Thecase R144 [€/min] = 0.01 is the only one with negative profit.Figure 11(b) presents the dependence of the profit in per-centage on the cell radius for three amplifiers per BS. In this
Service characterization for cost/benefit optimization of enhanced UMTS 43
case, it can be observed that the curves have a decreasingbehavior. The most profitable cell radius is 257 m (the low-est simulated one). By varying the price from R144 [€/min] =0.01 to R144 [€/min] = 0.05 and to R144 [€/min] = 0.10,a variation in the profit from −18% up to 308% and to 716%is obtained, respectively (in hypothesis A).
6.3.3 BCC
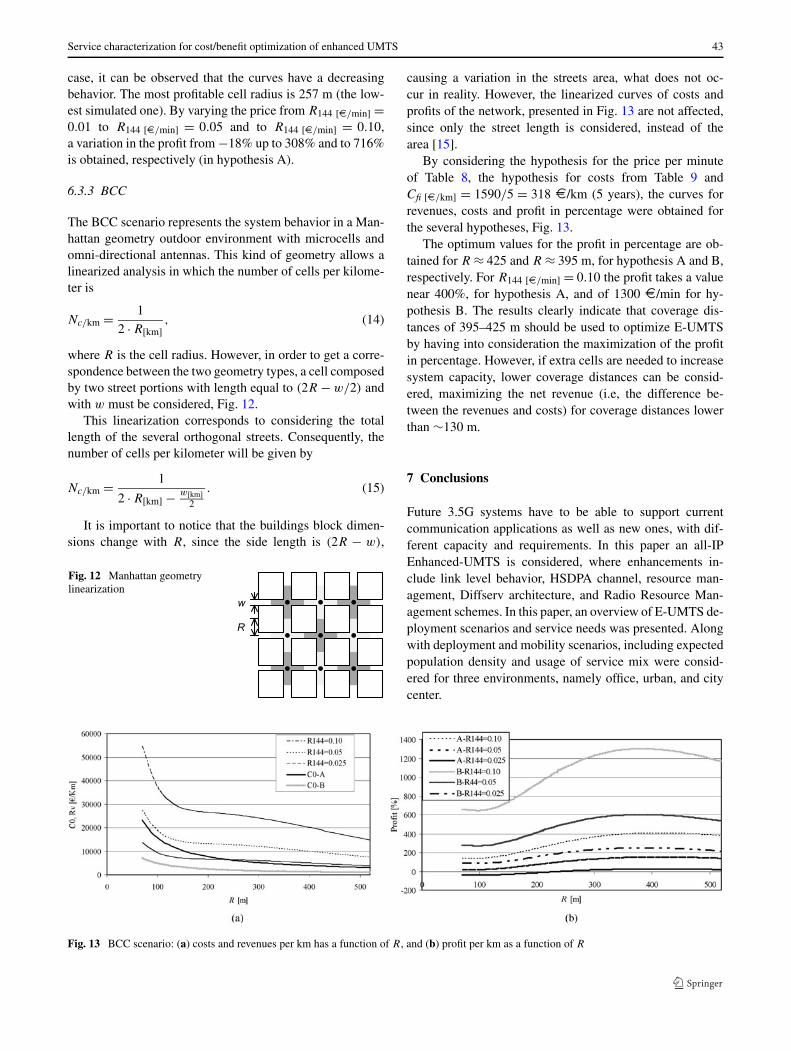
The BCC scenario represents the system behavior in a Man-hattan geometry outdoor environment with microcells andomni-directional antennas. This kind of geometry allows alinearized analysis in which the number of cells per kilome-ter is
Nc/km = 1
2 · R[km], (14)
where R is the cell radius. However, in order to get a corre-spondence between the two geometry types, a cell composedby two street portions with length equal to (2R − w/2) andwith w must be considered, Fig. 12.
This linearization corresponds to considering the totallength of the several orthogonal streets. Consequently, thenumber of cells per kilometer will be given by
Nc/km = 1
2 · R[km] − w[km]2
. (15)
It is important to notice that the buildings block dimen-sions change with R, since the side length is (2R − w),
Fig. 12 Manhattan geometrylinearization
causing a variation in the streets area, what does not oc-cur in reality. However, the linearized curves of costs andprofits of the network, presented in Fig. 13 are not affected,since only the street length is considered, instead of thearea [15].
By considering the hypothesis for the price per minuteof Table 8, the hypothesis for costs from Table 9 andCfi [€/km] = 1590/5 = 318 €/km (5 years), the curves forrevenues, costs and profit in percentage were obtained forthe several hypotheses, Fig. 13.
The optimum values for the profit in percentage are ob-tained for R ≈ 425 and R ≈ 395 m, for hypothesis A and B,respectively. For R144 [€/min] = 0.10 the profit takes a valuenear 400%, for hypothesis A, and of 1300 €/min for hy-pothesis B. The results clearly indicate that coverage dis-tances of 395–425 m should be used to optimize E-UMTSby having into consideration the maximization of the profitin percentage. However, if extra cells are needed to increasesystem capacity, lower coverage distances can be consid-ered, maximizing the net revenue (i.e, the difference be-tween the revenues and costs) for coverage distances lowerthan ∼130 m.
7 Conclusions
Future 3.5G systems have to be able to support currentcommunication applications as well as new ones, with dif-ferent capacity and requirements. In this paper an all-IPEnhanced-UMTS is considered, where enhancements in-clude link level behavior, HSDPA channel, resource man-agement, Diffserv architecture, and Radio Resource Man-agement schemes. In this paper, an overview of E-UMTS de-ployment scenarios and service needs was presented. Alongwith deployment and mobility scenarios, including expectedpopulation density and usage of service mix were consid-ered for three environments, namely office, urban, and citycenter.
Fig. 13 BCC scenario: (a) costs and revenues per km has a function of R, and (b) profit per km as a function of R
44 F.J. Velez et al.
E-UMTS traffic generation and activity models were de-scribed and characterized, based on population and servicepenetration values. By considering these scenarios and char-acterizations, system level simulations were carried out andthe enhanced performance, including call blocks, handoverfailures, end-to-end delays, and throughputs is demonstratedin several deployment scenarios. The results have shown thatthe proposed models are quality-efficient as the block andfailure percentages as well as the delay measurements arewithin acceptable limits for the given simulation scenarios(although some handover failure limitations occur in the of-fice scenario because of the small cell size). Furthermore,the obtained throughput for each scenario is within expecta-tion when compared to the theoretical ideal values. There-fore, by using system level simulation, identified servicesand environmental conditions can be mapped into deploy-ment strategies and evaluated prior to field trials and realimplementation.
In the offices scenario, the profit (in percentage) was ob-tained, and the optimum (most profitable) cell radius wasfound. We observe that the profit is highly dependent oncosts. Although the reduction of cells size is not profitablein the case of high costs (even if there is a need of ex-tra system capacity), numerical results for low values ofthe costs show that a higher number of pico cells (with asmaller radius, around 30–32 m) can be installed in the fu-ture when costs of deploying and maintaining the networkdecreases, enabling higher system capacity while reducingprices.
In the urban/vehicular scenario the profit is generally adecreasing function with R. As a consequence the mostprofitable cell radius is the lowest simulated one, i.e., 257 m.
In the BCC scenario a quality parameter was introducedthat simultaneously accounts for blocking and handover fail-ure probabilities. Different hypothesis for costs and priceswere considered, and an optimum coverage distance is ob-tained around 410–440 m. Although this range of cell ra-dius maximizes the supported throughput per BS. In BCCE-UMTS, the results for the profit in percentage indicatesthat coverage distances in the range 395–425 m should beused.
Acknowledgement This work was partially funded by MULTI-PLAN and CROSSNET (Portuguese Foundation for Science andTechnology projects with FEDER funding), IST-SEACORN, Fun-dação Calouste Gulbenkian, FCT Ph.D. grant SFRH/BD/28517/2006,COST290—Wi-QoST Traffic and QoS Management in Wireless Mul-timedia Networks, and COST2100—Pervasive Mobile & AmbientWireless Communications. Fernando J. Velez would like to acknowl-edge the wise words form Dr. Kostas Papanikolaou, the project officerfrom SEACORN, who made him believe that the dream to publish highquality scientific work must always be pursued. The authors acknowl-edge the fruitful contributions from all the IST-SEACORN partners.
References
1. Raychaudhuri, D. (2003). Topics in 4G wireless networks: ad-hocnets, adaptive services & QoS. In Proc. of wireless, mobile and al-ways best connected. 1st International ANWIRE Workshop, Glas-gow, UK, Apr.
2. Gustafson, E., & Jonsson, A. (2003). Always best connected.IEEE Wireless Communications, 10(1), 49–55.
3. Sowden, B. C., & Sowerby, K. W. (2001). The impact of long-range dependent traffic in a CDMA system supporting real-timeservices. In Proc. of GLOBECOM’ 2001 (Vol. 6, pp. 3509–3513).Global telecommunications conference, San Antonio, CA, USA.
4. Ferreira, J., Gomes, A., & Velez, F. J. (2003). Enhanced UMTSdeployment and mobility scenarios. In Proc. of 12th IST mobile &wireless communications summit, Aveiro, Portugal, June 2003.
5. Ferreira, J., & Velez, F. J. (2005). Enhanced UMTS services andapplications characterisation. Telektronikk, 101(1), 113–131.
6. Juárez, J. M., Paulo, R. R., & Velez, F. J. (2010). Modelling andsimulation of B3G multi-service traffic in the presence of mobility.Wireless Networks, 16(3), 659–669.
7. Jabbari, B. (1996). Teletraffic aspects of evolving and next-generation wireless communication networks. IEEE PersonalCommunications Magazine, 3(6), 4–9.
8. ITU-T Recommendation, E.771 (1996). Network grade of serviceparameters and target values for circuit-switched public land mo-bile services.
9. Study into Spectrum Requirements for UMTS Services (1998). Fi-nal Report, Quotient Communications Ltd., Ovum Ltd., February1998.
10. ETSI (1998). Technical report universal mobile telecommunica-tions system (UMTS); selection procedures for the choice of ra-dio transmission technologies of the UMTS (UMTS 30.03 version3.2.0). ETSI TR 101 112 V3.2.0, Sophie Antipolis, France, Apr.1998.
11. Ferreira, J., & Velez, F. J. (2004). Deployment scenarios and appli-cations characterisation for enhanced UMTS simulation. In Proc.of 3G 2004. 5th IEE international conference on 3G mobile com-munication technologies, London, UK, Oct. 2004.
12. Antoniou, J. et al. (2004). Designing a system level simulatorfor E-UMTS. In Proc. of IST-SEACORN project workshop, Cam-bridge, UK, Mar. 2004.
13. Anastácio, N., Merca, F., Cabral, O., & Velez, F. J. (2006). QoSmetrics for cross-layer design and network planning for B3G sys-tems. In Proc. of 3rd international symposium on wireless commu-nication systems, Valencia, Spain, Sep. 2006.
14. Holma, H., & Toskala, A. (2004). WCDMA for UMTS. Chichester:Wiley.
15. Velez, F. J., & Correia, L. M. (2003). Optimisation of mobilebroadband multi-service systems based in economic aspects. Wire-less Networks, 9(5), 525–533.
16. Velez, F. J., & Correia, L. M. (2002). Cost/revenue optimizationin multiservice mobile broadband systems. In Proc. of PIMRC’2002. 13th IEEE international symposium on personal, indoor andmobile radio communications, Lisbon, Portugal, Sep. 2002.
17. Johansson, K., Furuskär, A., Karlsson, P., & Zander, J. (2004).Relation between cost structure and base station characteristics incellular systems. In Proc. of PIMRC’ 2004. 15th IEEE interna-tional symposium on personal, indoor and mobile radio commu-nications, Barcelona, Spain, Sep. 2004.
Service characterization for cost/benefit optimization of enhanced UMTS 45
Fernando J. Velez received the Li-cenciado, M.Sc. and Ph.D. degreesin Electrical and Computer Engi-neering from Instituto Superior Téc-nico, Technical University of Lis-bon in 1993, 1996 and 2001, re-spectively. Since 1995 he has beenwith the Department of Electro-mechanical Engineering of Univer-sity of Beira Interior, Covilhaã, Por-tugal, where he is Assistant Profes-sor. He is also researcher at Insti-tuto de Telecomunicações, Lisbon.He made or makes part of the teamsof RACE/MBS, ACTS/SAMBA,
COST 259, COST 273, COST 290, ISTSEACORN, IST-UNITE,PLANOPTI, COST 2100, COST IC0902 and COST IC 0905 Euro-pean projects, he participated in SEMENTE, SMART-CLOTHINGand UBIQUIMESH Portuguese projects, and he was the coordina-tor of four Portuguese projects: SAMURAI, MULTIPLAN, CROSS-NET, and MobileMAN. Prof. Velez has authored five book chapters,around 80 papers and communications in international journals andconferences, plus 25 in national conferences, and is a senior mem-ber of IEEE and Ordem dos Engenheiros (EUREL), and a member ofIET and IAENG. His main research areas are cellular planning tools,traffic from mobility, simulation of wireless networks, cross-layer de-sign, inter-working, spectrum sharing/aggregation, multi-service traf-fic and cost/revenue performance of advanced mobile communicationsystems.
Orlando Cabral was born in Viseu,Portugal, on September 1978. Hereceived the Licenciado degree inMathematics from University ofTrás os Montes e Alto Douro, VilaReal, Portugal. he finished is M.Sc.in 2006 in Informatic Engineeringat University of Beira Interior, Cov-ilhã, Portugal, where he is assistantresearcher in Institute for Telecom-munications. He is pursuing the re-search towards his Ph.D. in Electri-cal Engineering. He made or makespart of the teams of the MULTI-PLAN, IST-UNITE, COST 290,
COST2100, CROSSNET and UBIQUIMESH projects. His main re-
search areas are network capacity and coverage planning, multi-servicetraffic and heterogeneous networks.
Francisco Merca concluded his Li-cenciado degree in Electrical Engi-neering, Computer Systems branch,at University of Beira Interior in2006. His final year project wasabout Cost/Revenue Optimizationof Multi-service Cellular Planningfor Business City Centre EnhancedUMTS. Since 2007 he has beenworking for the Portuguese Navyin Sonar Systems and his main re-search interest is in UnderwaterAcoustic Sensor Networks.
Vasos Vassiliou is a Lecturer atthe Computer Science Departmentof the University of Cyprus since2005. He is also the Associate Di-rector of the Networks ResearchLaboratory (NetRL) at UCY. Heheld positions as a Visiting Lec-turer at the same department (2004–2005) and as an Assistant Profes-sor at the Computer Science Depart-ment of the University of Nicosia(2002–2004). He has published sev-eral articles in international Confer-ences and Journals and participatesactively in COST actions, local, and
European Projects. His research interests include Network Architec-tures (IPv6, MPLS), Mobile Networks (Mobile IP, Mobile MPLS, AdHoc and Sensor Networks), Wireless Communications (Protocol en-hancements for 3G/4G cellular wireless networks) and Quality of Ser-vice (QoS) and Traffic Engineering for computer and telecommunica-tion networks. Dr. Vassiliou holds an M.Sc. (1999) and a Ph.D. (2002)from the Georgia Institute of Technology both in Electrical and Com-puter Engineering. He is a member of IEEE, ACM, and IET (formerIEE) and participates in the Technical Program Committees of severalinternational conferences, such as Globecom, VTC, PIMRC, WNET,EW. He is also an Associate Editor of the Journal of Telecommunica-tion Systems.