Embed Size (px)
Citation preview
0
Ministry of Public Health & Population
Service Availability and Health Facilities Functionality in
16 Governorates
Final report
Using HeRAMS
(Health Services and Resources Availability Mapping System)
October 2016
1
Table of contents 1
Acronyms and Acknowledgements 2
Introduction and Methodology 3
Process and timeline 4
Snapshot of HeRAMS main results 5
Health facilities functionality
1 Overview on health facilities and staff 6 2 Functionality of health facilities 7 3 Damages to health facilities 8 4 Human resources availability 9 5 Availability of midwives and doctors 10 6 Population coverage by health units 11 7 Population coverage by health centers 12 8 Population coverage by hospitals 13 9 HF utilities and functions; beds 14 10 HF utilities and functions; BeMOC, ambulances 15
Services availability
1 Overall service availability 16 2 Availability of services in governorates 17 – 19 3 Availability of services in provision level 20 4 Specific services availability 21 – 24
Governorate summaries
1 Abyan 25 9 Hajjah 33 2 Aden 26 10 Ibb 34 3 Al Baydha 27 11 Lahaj 35 4 Al Dhalae 28 12 Marib 36 5 Al Hodeida 29 13 Sada’a 37 6 Al Jawf 30 14 Sana’a 38 7 Amant Al Asama 31 15 Shabwa 39 8 Amran 32 16 Taiz 40
Annex 41
Table of
contents
2
Abbreviations
BeMOC Basic Emergency Obstetric Care
DHIS District Health Information System
DHS Demographic and Health Survey
Dist District
Doc Doctors
Gen Prac. General Practitioner
HC Health Centre
HeRAMS Health Resource Availability Mapping System
HF Health Facility
HMIS Health Management Information System
HNO Health Needs Overview
Hosp Hospital
HU Health Unit
IDP Internally Displaced Person
MoPHP Ministry of Public Health and Population
NCD Non-communicable diseases
OCHA United Nation's Office for the Coordination of Humanitarian Affairs
PHC Primary health care
Pop Population
Spec Specialist
TB Tuberculosis
WHO World Health Organization
YHRP Yemen Humanitarian Response Plan
Acknowledgement
The Ministry of Public Health & Population (MoPHP) and WHO country office – Yemen would like to express
their gratitude to all those whom contributed to the collection of data, data entry, its analysis and synthesis of
information towards the production of this report. Appreciation is due to staff of the MoPHP and WHO whom
organized the functions and workshops and provided logistical support which has resulted in the successful
accomplishment of the assessment. A word of gratitude is due to all district health officers and governorate
health offices whom have participated in the workshops and interviews, without their cooperation the whole
process could not have been possible.
Disclaimer
Neither the MoPHP nor the WHO are responsible for the validity and reliability of the information included in
this report. The information is based on data that has been deliberately revealed through interviews with
national health authority officials at different levels to the best of their knowledge and evidence they possess.
In some cases the information has been integrated or validated with phone interviews with health staff and
field visits to selected health facilities.
For further information or electronic copies of this report or separate governorate reports; kindly
send your request to the WHO country office – on the following email: [email protected]
Abbreviations &
Acknowledgments
3
Introduction
HeRAMS (Health Resources and Services Availability Mapping System) is an approach that aims at collection and
analysis of information on the availability of health services and functionality of health facilities in humanitarian
emergencies. The tool has was developed in 2008 and has since been used in several emergency contexts; Sudan
(2008), Haiti (2009), Pakistan (2010) and Central African Republic (2014). Information revealed has been used
extensively by the national health authorities, health cluster members and relevant coordination mechanisms.
Planning for HeRAMS in Yemen began in the second half of 2015, which was agreed upon by the health cluster in
October 2015, as a unified tool for gathering information. By January of 2016, the generic HeRAMS tool was adapted
to the local context after extensive discussions with relevant health sector stakeholders. In February, the tool was
piloted in Amant Asama (capital Sana’a) with a plan of action to further conduct the assessment in 16 priority
governorates during quarter one, two and three of the current year.
The undertaking of HeRAMS in the emergency context of Yemen aims at a rapid revelation of key information on the
availability of health services and functionality of those providing facilities at all levels of provision. The generated
information will greatly support the decision making bodies and health cluster members in planning, monitoring,
measuring gaps, coordination of inputs, as well as responding to urgent needs of the health sector. The overall aim is
to maximize the use of resources towards the provision of relevant, equitable and efficient health services.
This report “Service availability and health facility functionality based on HeRAMS (16 governorates) – Final report”
presents the findings of the 16 governorate assessments under the following headings: 1) Introduction, 2) Health
facilities functionality, 3) Service Availability, and finally 4) Governorate summaries.
Each of the surveyed governorates has a separate detailed report which examines functionality and service
availability on all levels of provision in relation to its districts.
Methodology & Process
After the piloting of the assessment tool in February 2016 in Amant Al Asama (the capital Sana’a), HeRAMS has been
conducted in fifteen additional governorates (Feb – Jul 2016); Ibb, Sada’a, Amran, Aden, Hodeida, Taiz, Sana’a,
Abyan, Al Dhalae and Hajjah governorates during March and April of 2016. The MoPHP jointly with the WHO have
covered further the governorates; Lahaj, Marib, Al Jawf, Al Baydha, and Shabwa during May and June of 2016 to
reach to a total of 16 governorates prioritized in the humanitarian emergency response framework. Before the end
of the current year 2016, HeRAMS will cover the remaining 6 governorates; Thamar, Hadaramout, Raima, Al Mahra,
Mahweit, Socotra and a similar final report will be available for all the governorates.
The assessment tool has two components; a) Information Sheet as well as b) the Services checklist. The information
sheet includes basic information on the health facility status including functionality, damages, available utilities and
human resources. This is intended to build upon and to update the national HMIS ‘Health Analyzer - 2008’. The
Services Checklist – includes information on services availability based on the list of services provided at all level of
service provision. Tools are completed through interviews with the district health officer’s in the governorates with
the assistance of trained surveyors. Validation of information has been through on-site visits to randomly selected
health facilities. Data entry was carried out by the MoPHP and WHO (two stages) and analyzed using EpiInfo.
Geolocation of new health facilities is planned and ongoing to enable their plotting on maps despite the security
challenges in some governorates.
.
Introduction &
Methodology
4
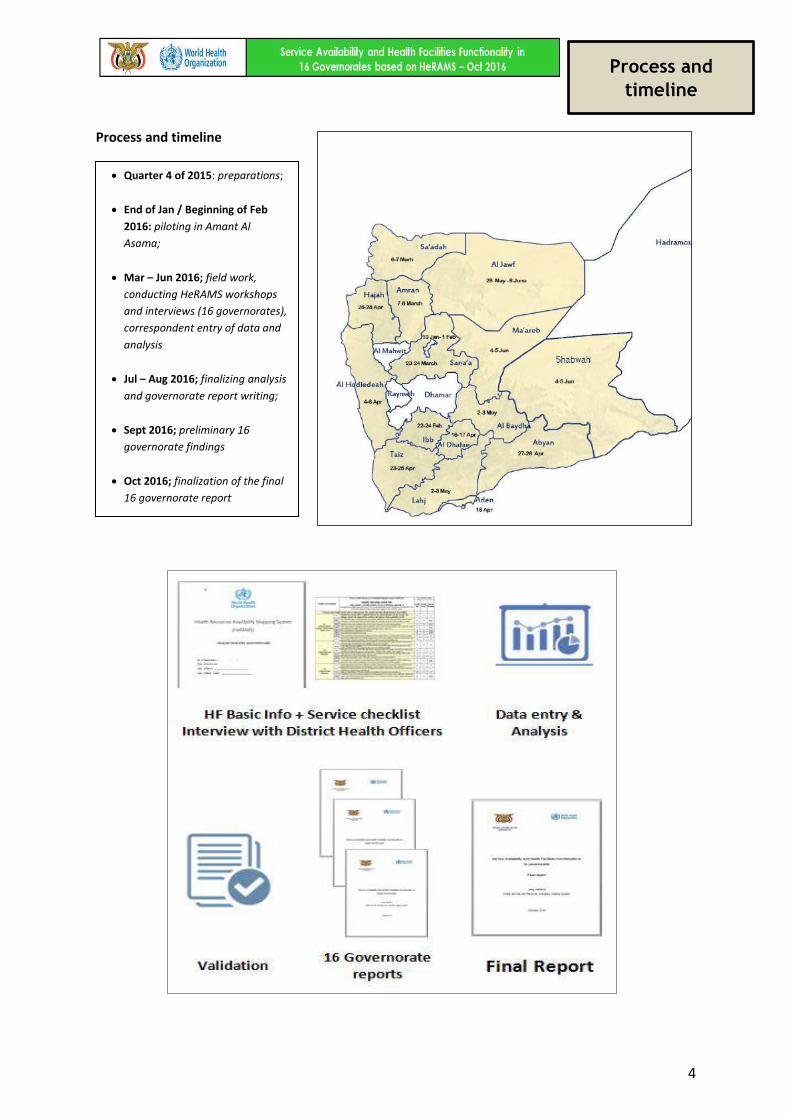
Process and timeline
Process and
timeline
Quarter 4 of 2015: preparations;
End of Jan / Beginning of Feb
2016: piloting in Amant Al
Asama;
Mar – Jun 2016; field work,
conducting HeRAMS workshops
and interviews (16 governorates),
correspondent entry of data and
analysis
Jul – Aug 2016; finalizing analysis
and governorate report writing;
Sept 2016; preliminary 16
governorate findings
Oct 2016; finalization of the final
16 governorate report
5
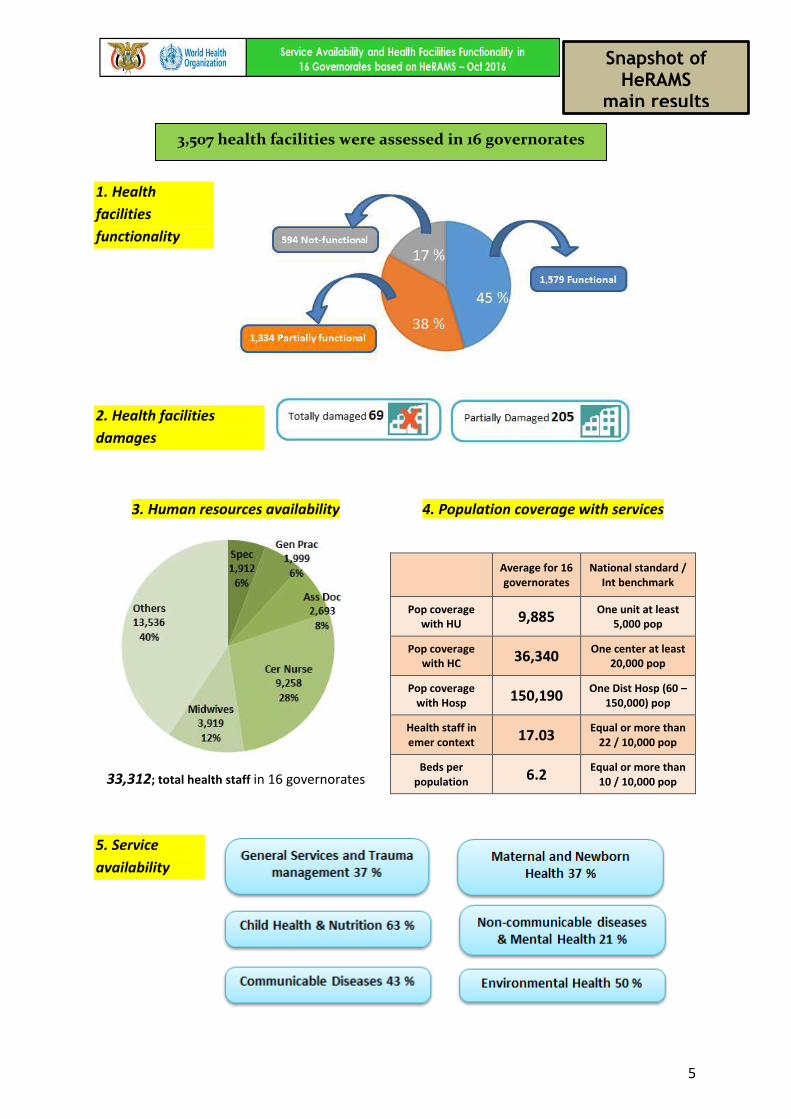
1. Health
facilities
functionality
2. Health facilities
damages
3. Human resources availability
4. Population coverage with services
33,312; total health staff in 16 governorates
Average for 16 governorates
National standard / Int benchmark
Pop coverage with HU 9,885
One unit at least 5,000 pop
Pop coverage with HC 36,340
One center at least 20,000 pop
Pop coverage with Hosp 150,190
One Dist Hosp (60 – 150,000) pop
Health staff in emer context 17.03
Equal or more than 22 / 10,000 pop
Beds per population 6.2
Equal or more than 10 / 10,000 pop
5. Service
availability
Snapshot of HeRAMS
main results
3,507 health facilities were assessed in 16 governorates
6
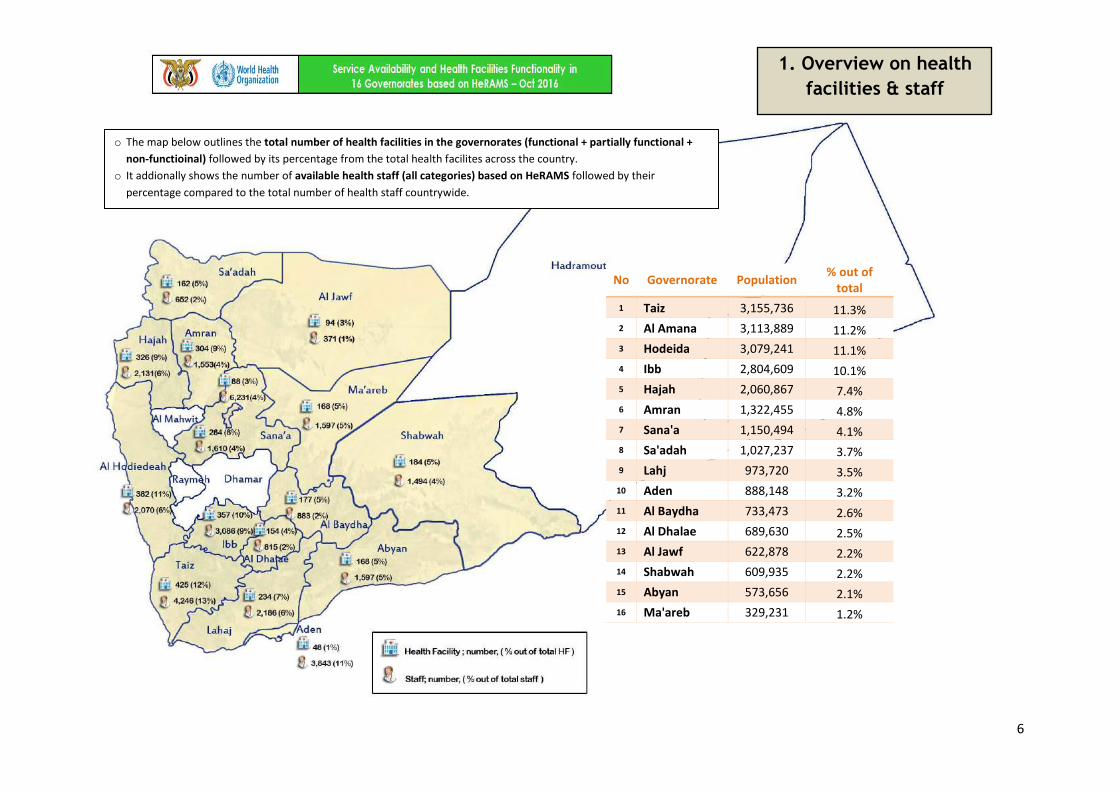
No Governorate Population % out of
total
1 Taiz 3,155,736 11.3%
2 Al Amana 3,113,889 11.2%
3 Hodeida 3,079,241 11.1%
4 Ibb 2,804,609 10.1%
5 Hajah 2,060,867 7.4%
6 Amran 1,322,455 4.8%
7 Sana'a 1,150,494 4.1%
8 Sa'adah 1,027,237 3.7%
9 Lahj 973,720 3.5%
10 Aden 888,148 3.2%
11 Al Baydha 733,473 2.6%
12 Al Dhalae 689,630 2.5%
13 Al Jawf 622,878 2.2%
14 Shabwah 609,935 2.2%
15 Abyan 573,656 2.1%
16 Ma'areb 329,231 1.2%
o The map below outlines the total number of health facilities in the governorates (functional + partially functional +
non-functioinal) followed by its percentage from the total health facilites across the country.
o It addionally shows the number of available health staff (all categories) based on HeRAMS followed by their
percentage compared to the total number of health staff countrywide.
1. Overview on health
facilities & staff
7
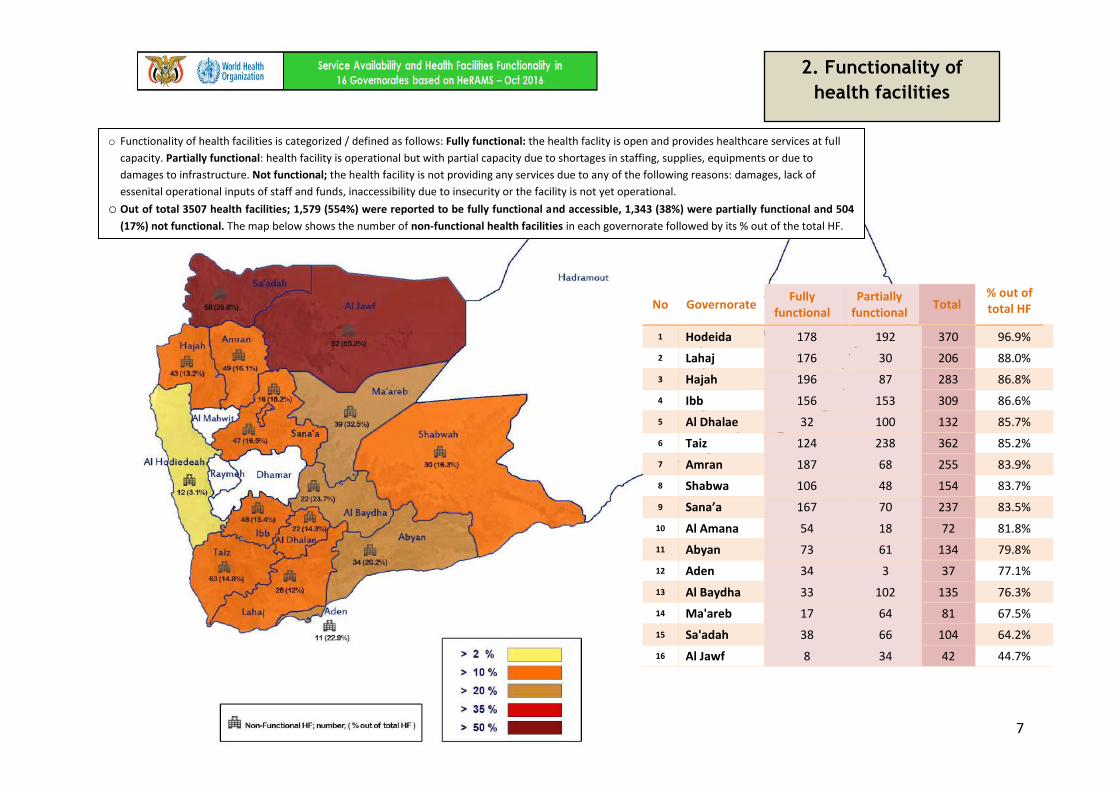
No Governorate Fully
functional Partially
functional Total
% out of total HF
1 Hodeida 178 192 370 96.9%
2 Lahaj 176 30 206 88.0%
3 Hajah 196 87 283 86.8%
4 Ibb 156 153 309 86.6%
5 Al Dhalae 32 100 132 85.7%
6 Taiz 124 238 362 85.2%
7 Amran 187 68 255 83.9%
8 Shabwa 106 48 154 83.7%
9 Sana’a 167 70 237 83.5%
10 Al Amana 54 18 72 81.8%
11 Abyan 73 61 134 79.8%
12 Aden 34 3 37 77.1%
13 Al Baydha 33 102 135 76.3%
14 Ma'areb 17 64 81 67.5%
15 Sa'adah 38 66 104 64.2%
16 Al Jawf 8 34 42 44.7%
2. Functionality of
health facilities
o Functionality of health facilities is categorized / defined as follows: Fully functional: the health faclity is open and provides healthcare services at full
capacity. Partially functional: health facility is operational but with partial capacity due to shortages in staffing, supplies, equipments or due to
damages to infrastructure. Not functional; the health facility is not providing any services due to any of the following reasons: damages, lack of
essenital operational inputs of staff and funds, inaccessibility due to insecurity or the facility is not yet operational.
o Out of total 3507 health facilities; 1,579 (554%) were reported to be fully functional and accessible, 1,343 (38%) were partially functional and 504
(17%) not functional. The map below shows the number of non-functional health facilities in each governorate followed by its % out of the total HF.
8
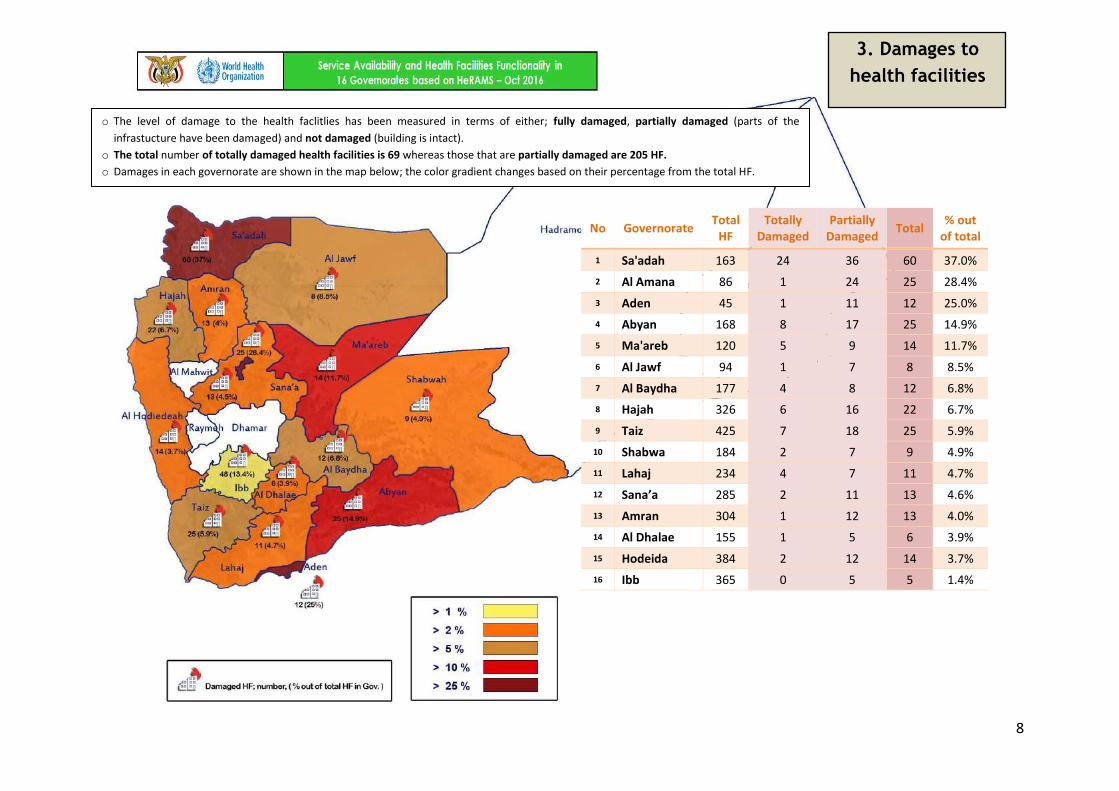
No Governorate Total
HF Totally
Damaged Partially
Damaged Total
% out of total
1 Sa'adah 163 24 36 60 37.0%
2 Al Amana 86 1 24 25 28.4%
3 Aden 45 1 11 12 25.0%
4 Abyan 168 8 17 25 14.9%
5 Ma'areb 120 5 9 14 11.7%
6 Al Jawf 94 1 7 8 8.5%
7 Al Baydha 177 4 8 12 6.8%
8 Hajah 326 6 16 22 6.7%
9 Taiz 425 7 18 25 5.9%
10 Shabwa 184 2 7 9 4.9%
11 Lahaj 234 4 7 11 4.7%
12 Sana’a 285 2 11 13 4.6%
13 Amran 304 1 12 13 4.0%
14 Al Dhalae 155 1 5 6 3.9%
15 Hodeida 384 2 12 14 3.7%
16 Ibb 365 0 5 5 1.4%
o The level of damage to the health faclitlies has been measured in terms of either; fully damaged, partially damaged (parts of the
infrastucture have been damaged) and not damaged (building is intact).
o The total number of totally damaged health facilities is 69 whereas those that are partially damaged are 205 HF.
o Damages in each governorate are shown in the map below; the color gradient changes based on their percentage from the total HF.
o
3. Damages to
health facilities
9
4. Availability of
human resources
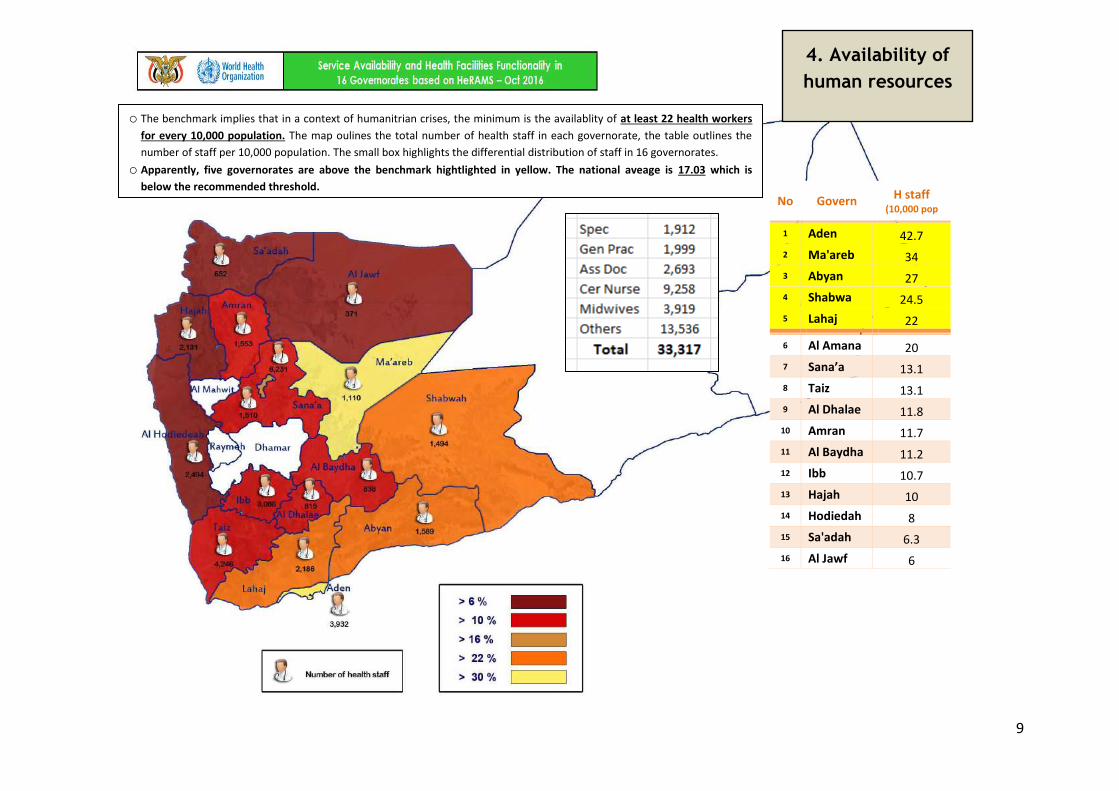
No Govern H staff (10,000 pop
1 Aden 42.7
2 Ma'areb 34
3 Abyan 27
4 Shabwa 24.5
5 Lahaj 22
6 Al Amana 20
7 Sana’a 13.1
8 Taiz 13.1
9 Al Dhalae 11.8
10 Amran 11.7
11 Al Baydha 11.2
12 Ibb 10.7
13 Hajah 10
14 Hodiedah 8
15 Sa'adah 6.3
16 Al Jawf 6
o The benchmark implies that in a context of humanitrian crises, the minimum is the availablity of at least 22 health workers
for every 10,000 population. The map oulines the total number of health staff in each governorate, the table outlines the
number of staff per 10,000 population. The small box highlights the differential distribution of staff in 16 governorates. o Apparently, five governorates are above the benchmark hightlighted in yellow. The national aveage is 17.03 which is
below the recommended threshold.
10
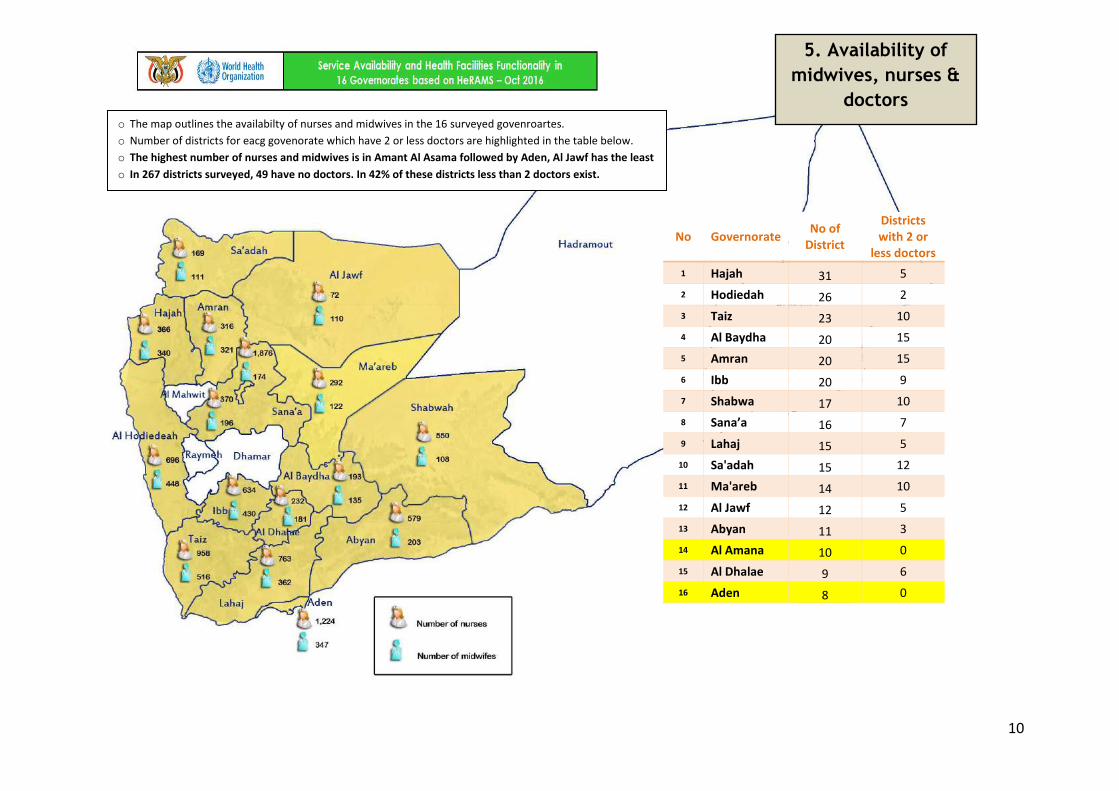
No Governorate No of
District
Districts with 2 or
less doctors
1 Hajah 31 5
2 Hodiedah 26 2
3 Taiz 23 10
4 Al Baydha 20 15
5 Amran 20 15
6 Ibb 20 9
7 Shabwa 17 10
8 Sana’a 16 7
9 Lahaj 15 5
10 Sa'adah 15 12
11 Ma'areb 14 10
12 Al Jawf 12 5
13 Abyan 11 3
14 Al Amana 10 0
15 Al Dhalae 9 6
16 Aden 8 0
5. Availability of
midwives, nurses &
doctors o The map outlines the availabilty of nurses and midwives in the 16 surveyed govenroartes.
o Number of districts for eacg govenorate which have 2 or less doctors are highlighted in the table below.
o The highest number of nurses and midwives is in Amant Al Asama followed by Aden, Al Jawf has the least
o In 267 districts surveyed, 49 have no doctors. In 42% of these districts less than 2 doctors exist.
11
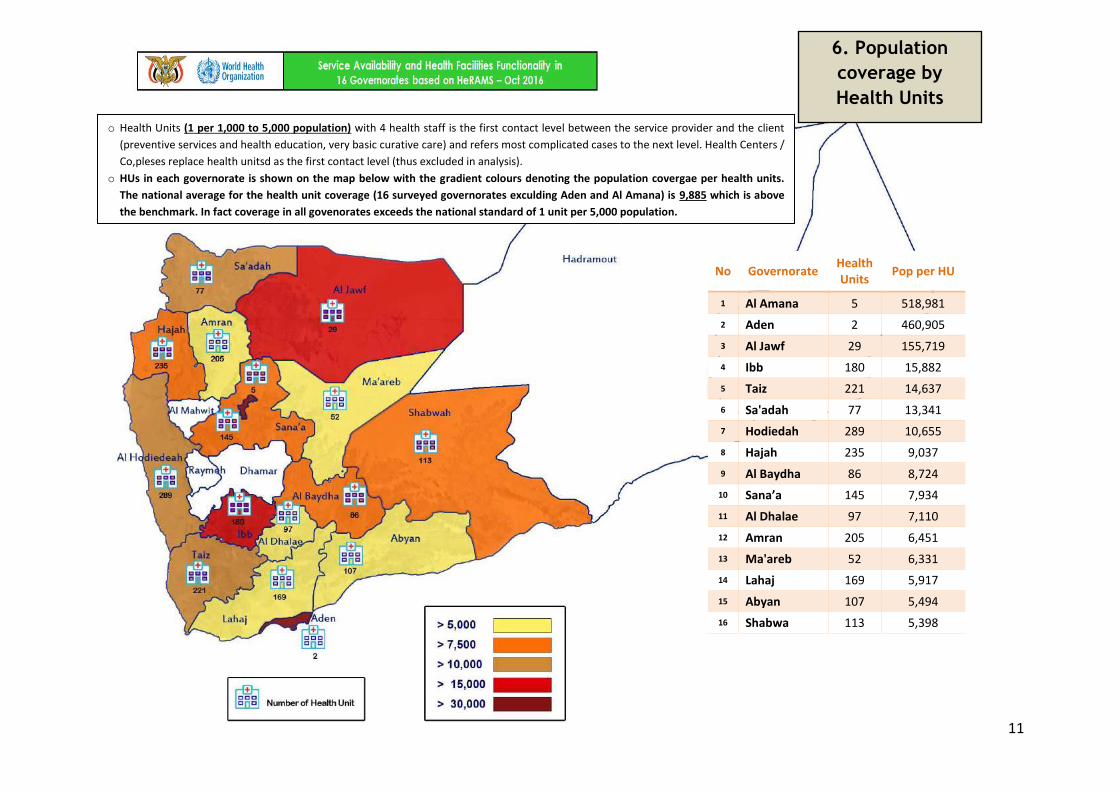
No Governorate Health Units
Pop per HU
1 Al Amana 5 518,981
2 Aden 2 460,905
3 Al Jawf 29 155,719
4 Ibb 180 15,882
5 Taiz 221 14,637
6 Sa'adah 77 13,341
7 Hodiedah 289 10,655
8 Hajah 235 9,037
9 Al Baydha 86 8,724
10 Sana’a 145 7,934
11 Al Dhalae 97 7,110
12 Amran 205 6,451
13 Ma'areb 52 6,331
14 Lahaj 169 5,917
15 Abyan 107 5,494
16 Shabwa 113 5,398
o Health Units (1 per 1,000 to 5,000 population) with 4 health staff is the first contact level between the service provider and the client
(preventive services and health education, very basic curative care) and refers most complicated cases to the next level. Health Centers /
Co,pleses replace health unitsd as the first contact level (thus excluded in analysis).
o HUs in each governorate is shown on the map below with the gradient colours denoting the population covergae per health units.
The national average for the health unit coverage (16 surveyed governorates exculding Aden and Al Amana) is 9,885 which is above
the benchmark. In fact coverage in all govenorates exceeds the national standard of 1 unit per 5,000 population.
6. Population
coverage by
Health Units
12
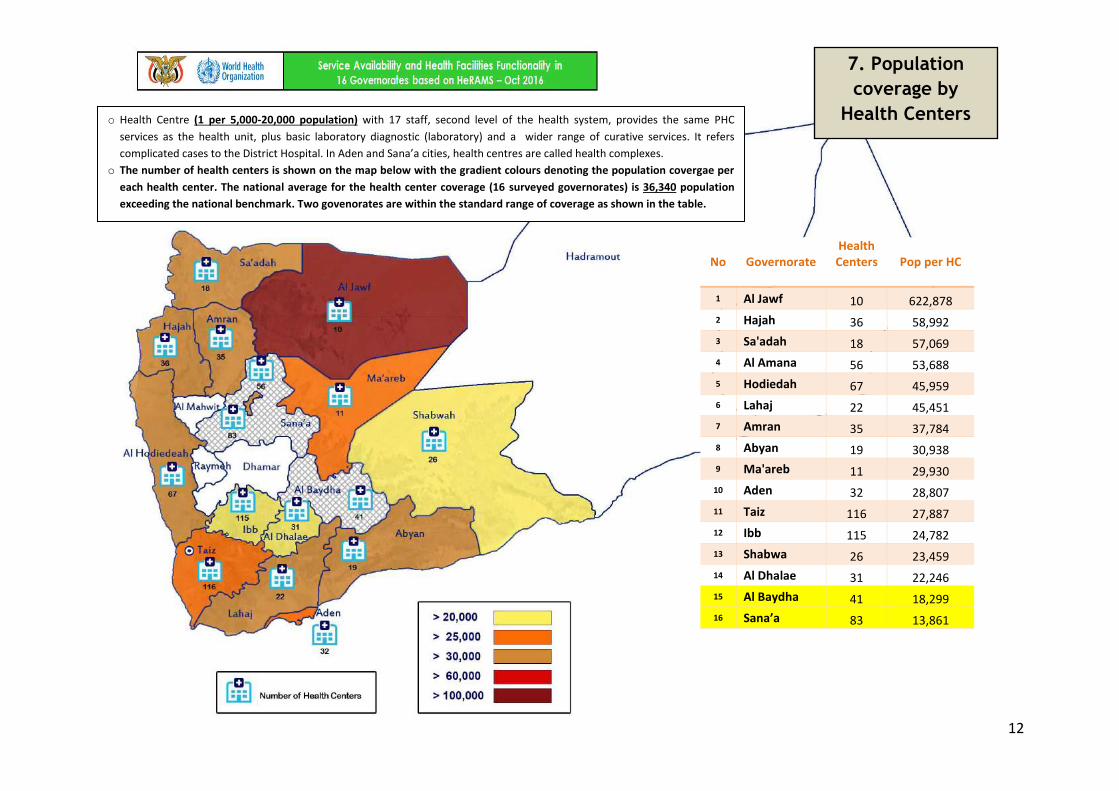
No Governorate Health Centers
Pop per HC
1 Al Jawf 10 622,878
2 Hajah 36 58,992
3 Sa'adah 18 57,069
4 Al Amana 56 53,688
5 Hodiedah 67 45,959
6 Lahaj 22 45,451
7 Amran 35 37,784
8 Abyan 19 30,938
9 Ma'areb 11 29,930
10 Aden 32 28,807
11 Taiz 116 27,887
12 Ibb 115 24,782
13 Shabwa 26 23,459
14 Al Dhalae 31 22,246
15 Al Baydha 41 18,299
16 Sana’a 83 13,861
o Health Centre (1 per 5,000-20,000 population) with 17 staff, second level of the health system, provides the same PHC
services as the health unit, plus basic laboratory diagnostic (laboratory) and a wider range of curative services. It refers
complicated cases to the District Hospital. In Aden and Sana’a cities, health centres are called health complexes.
o The number of health centers is shown on the map below with the gradient colours denoting the population covergae per
each health center. The national average for the health center coverage (16 surveyed governorates) is 36,340 population
exceeding the national benchmark. Two govenorates are within the standard range of coverage as shown in the table.
7. Population
coverage by
Health Centers
13
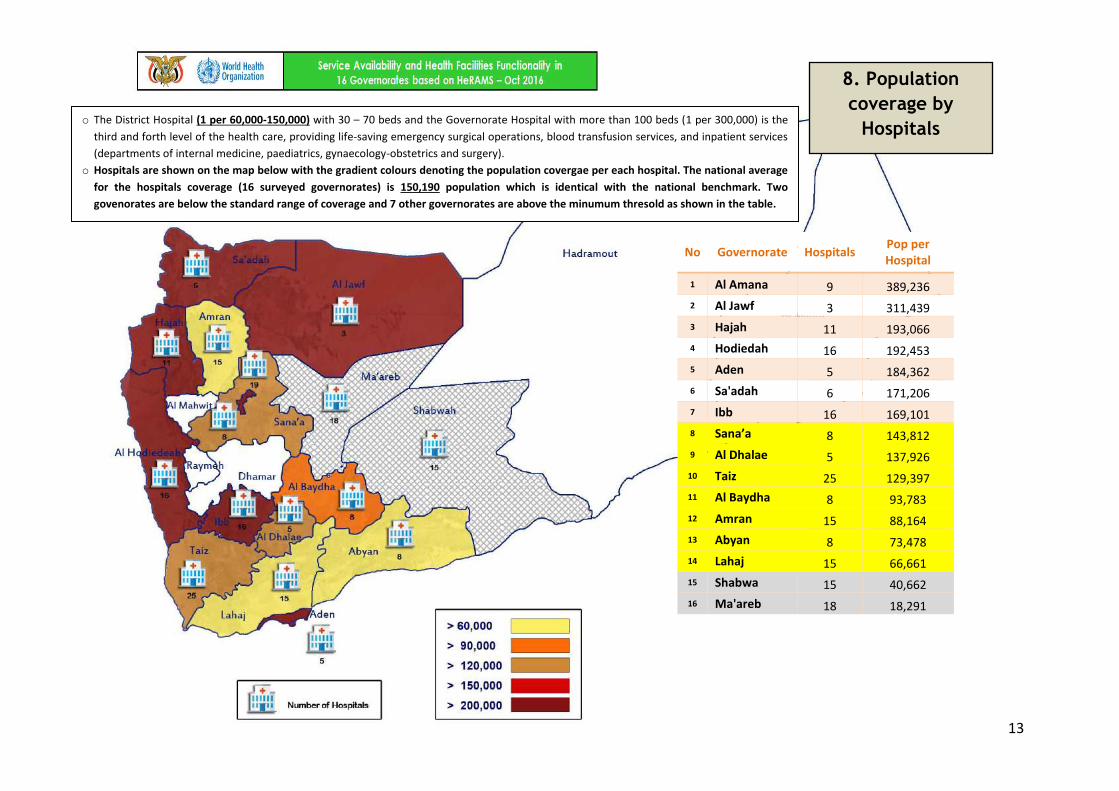
No Governorate Hospitals Pop per Hospital
1 Al Amana 9 389,236
2 Al Jawf 3 311,439
3 Hajah 11 193,066
4 Hodiedah 16 192,453
5 Aden 5 184,362
6 Sa'adah 6 171,206
7 Ibb 16 169,101
8 Sana’a 8 143,812
9 Al Dhalae 5 137,926
10 Taiz 25 129,397
11 Al Baydha 8 93,783
12 Amran 15 88,164
13 Abyan 8 73,478
14 Lahaj 15 66,661
15 Shabwa 15 40,662
16 Ma'areb 18 18,291
o The District Hospital (1 per 60,000-150,000) with 30 – 70 beds and the Governorate Hospital with more than 100 beds (1 per 300,000) is the
third and forth level of the health care, providing life-saving emergency surgical operations, blood transfusion services, and inpatient services
(departments of internal medicine, paediatrics, gynaecology-obstetrics and surgery).
o Hospitals are shown on the map below with the gradient colours denoting the population covergae per each hospital. The national average
for the hospitals coverage (16 surveyed governorates) is 150,190 population which is identical with the national benchmark. Two
govenorates are below the standard range of coverage and 7 other governorates are above the minumum thresold as shown in the table.
8. Population
coverage by
Hospitals
14
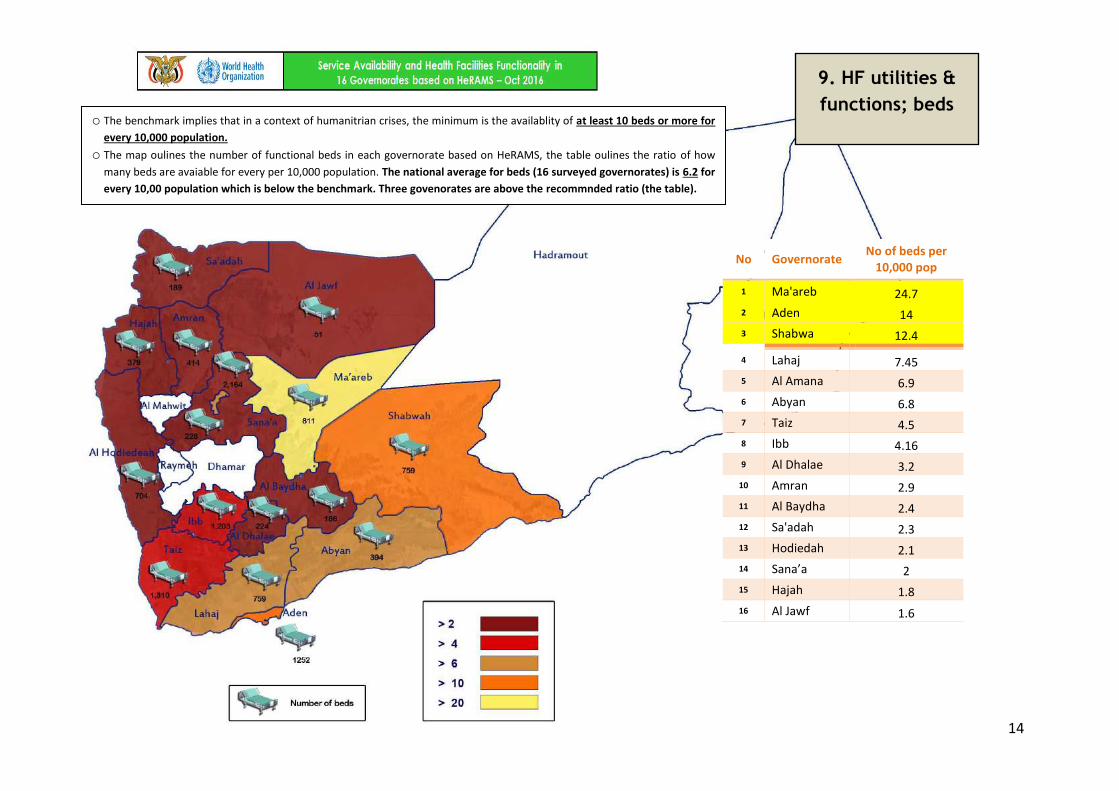
No Governorate No of beds per
10,000 pop
1 Ma'areb 24.7
2 Aden 14
3 Shabwa 12.4
4 Lahaj 7.45
5 Al Amana 6.9
6 Abyan 6.8
7 Taiz 4.5
8 Ibb 4.16
9 Al Dhalae 3.2
10 Amran 2.9
11 Al Baydha 2.4
12 Sa'adah 2.3
13 Hodiedah 2.1
14 Sana’a 2
15 Hajah 1.8
16 Al Jawf 1.6
o The benchmark implies that in a context of humanitrian crises, the minimum is the availablity of at least 10 beds or more for
every 10,000 population. o The map oulines the number of functional beds in each governorate based on HeRAMS, the table oulines the ratio of how
many beds are avaiable for every per 10,000 population. The national average for beds (16 surveyed governorates) is 6.2 for
every 10,00 population which is below the benchmark. Three govenorates are above the recommnded ratio (the table).
9. HF utilities &
functions; beds
15
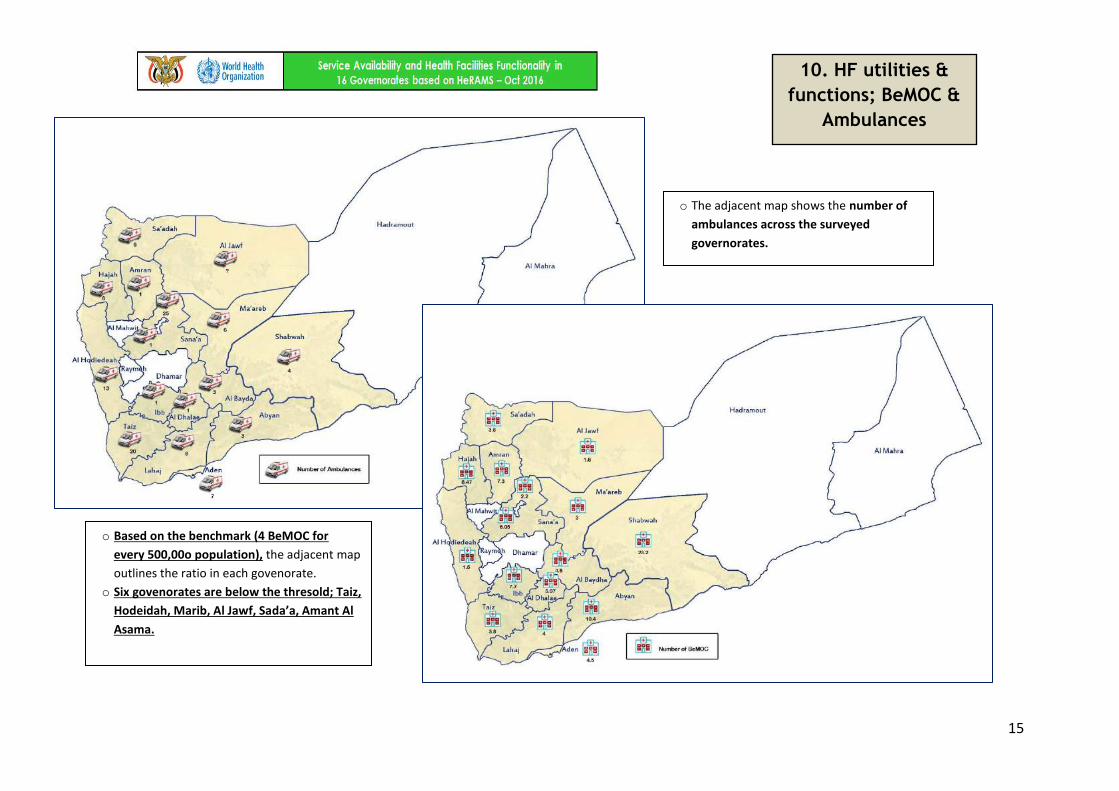
o Based on the benchmark (4 BeMOC for
every 500,00o population), the adjacent map
outlines the ratio in each govenorate.
o Six govenorates are below the thresold; Taiz,
Hodeidah, Marib, Al Jawf, Sada’a, Amant Al
Asama.
o The adjacent map shows the number of
ambulances across the surveyed
governorates.
10. HF utilities &
functions; BeMOC &
Ambulances
16
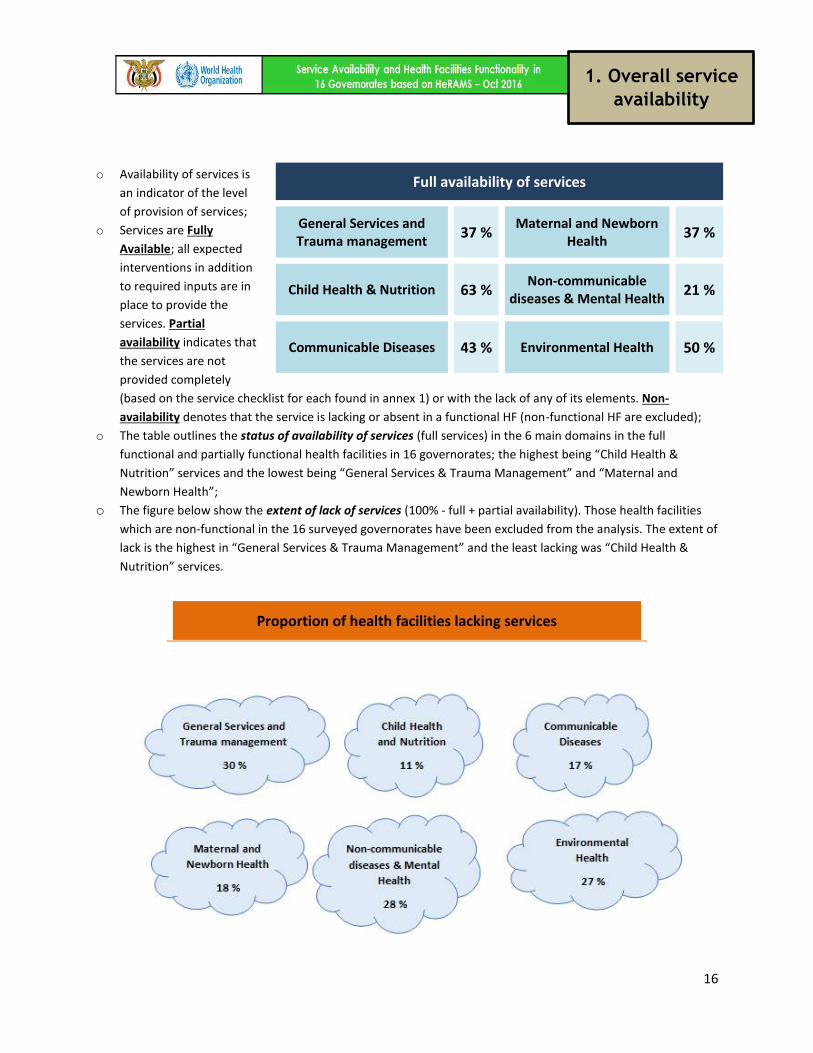
o Availability of services is
an indicator of the level
of provision of services;
o Services are Fully
Available; all expected
interventions in addition
to required inputs are in
place to provide the
services. Partial
availability indicates that
the services are not
provided completely
(based on the service checklist for each found in annex 1) or with the lack of any of its elements. Non-
availability denotes that the service is lacking or absent in a functional HF (non-functional HF are excluded);
o The table outlines the status of availability of services (full services) in the 6 main domains in the full
functional and partially functional health facilities in 16 governorates; the highest being “Child Health &
Nutrition” services and the lowest being “General Services & Trauma Management” and “Maternal and
Newborn Health”;
o The figure below show the extent of lack of services (100% - full + partial availability). Those health facilities
which are non-functional in the 16 surveyed governorates have been excluded from the analysis. The extent of
lack is the highest in “General Services & Trauma Management” and the least lacking was “Child Health &
Nutrition” services.
Full availability of services
General Services and Trauma management
37 % Maternal and Newborn
Health 37 %
Child Health & Nutrition 63 % Non-communicable
diseases & Mental Health 21 %
Communicable Diseases 43 % Environmental Health 50 %
Proportion of health facilities lacking services
1. Overall service
availability
17
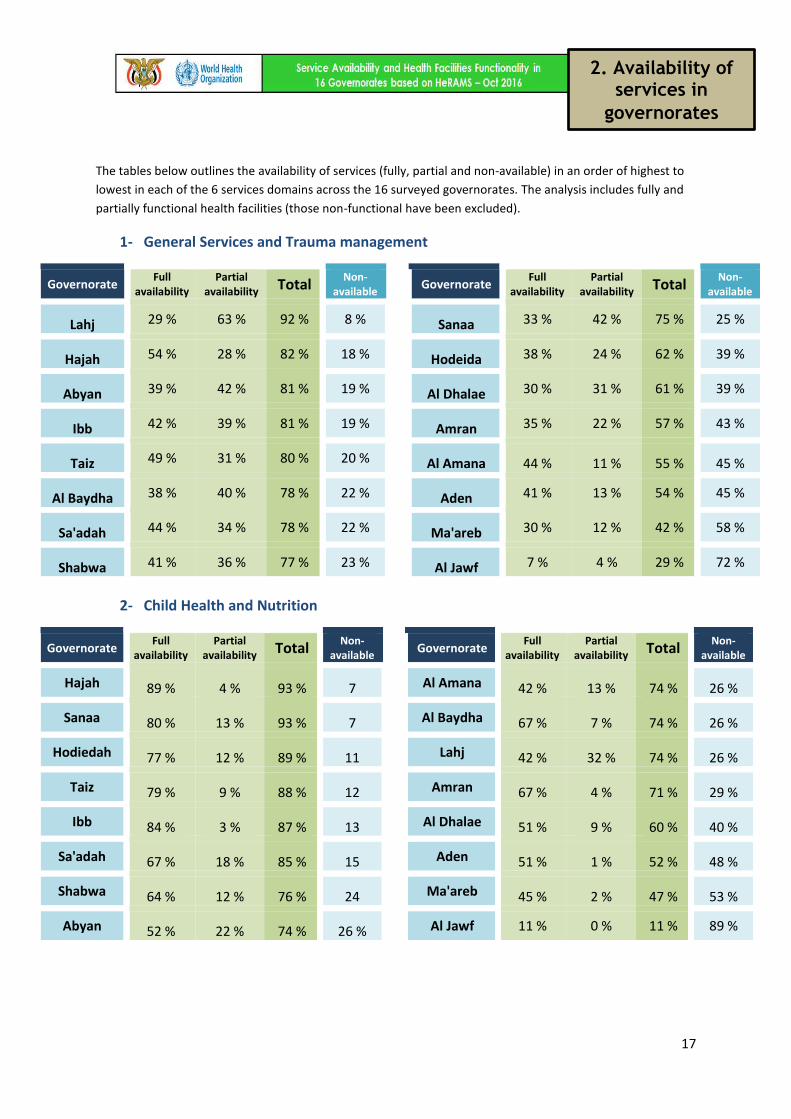
The tables below outlines the availability of services (fully, partial and non-available) in an order of highest to
lowest in each of the 6 services domains across the 16 surveyed governorates. The analysis includes fully and
partially functional health facilities (those non-functional have been excluded).
1- General Services and Trauma management
Governorate Full
availability Partial
availability Total Non-
available Governorate
Full availability
Partial availability Total
Non- available
Lahj 29 % 63 % 92 % 8 % Sanaa 33 % 42 % 75 % 25 %
Hajah 54 % 28 % 82 % 18 % Hodeida 38 % 24 % 62 % 39 %
Abyan 39 % 42 % 81 % 19 % Al Dhalae 30 % 31 % 61 % 39 %
Ibb 42 % 39 % 81 % 19 % Amran 35 % 22 % 57 % 43 %
Taiz 49 % 31 % 80 % 20 % Al Amana 44 % 11 % 55 % 45 %
Al Baydha 38 % 40 % 78 % 22 % Aden 41 % 13 % 54 % 45 %
Sa'adah 44 % 34 % 78 % 22 % Ma'areb 30 % 12 % 42 % 58 %
Shabwa 41 % 36 % 77 % 23 % Al Jawf 7 % 4 % 29 % 72 %
2- Child Health and Nutrition
Governorate Full
availability Partial
availability Total Non-
available Governorate
Full availability
Partial availability Total
Non- available
Hajah 89 % 4 % 93 % 7 Al Amana 42 % 13 % 74 % 26 %
Sanaa 80 % 13 % 93 % 7 Al Baydha 67 % 7 % 74 % 26 %
Hodiedah 77 % 12 % 89 % 11 Lahj 42 % 32 % 74 % 26 %
Taiz 79 % 9 % 88 % 12 Amran 67 % 4 % 71 % 29 %
Ibb 84 % 3 % 87 % 13 Al Dhalae 51 % 9 % 60 % 40 %
Sa'adah 67 % 18 % 85 % 15 Aden 51 % 1 % 52 % 48 %
Shabwa 64 % 12 % 76 % 24 Ma'areb 45 % 2 % 47 % 53 %
Abyan 52 % 22 % 74 % 26 % Al Jawf 11 % 0 % 11 % 89 %
2. Availability of services in
governorates
18
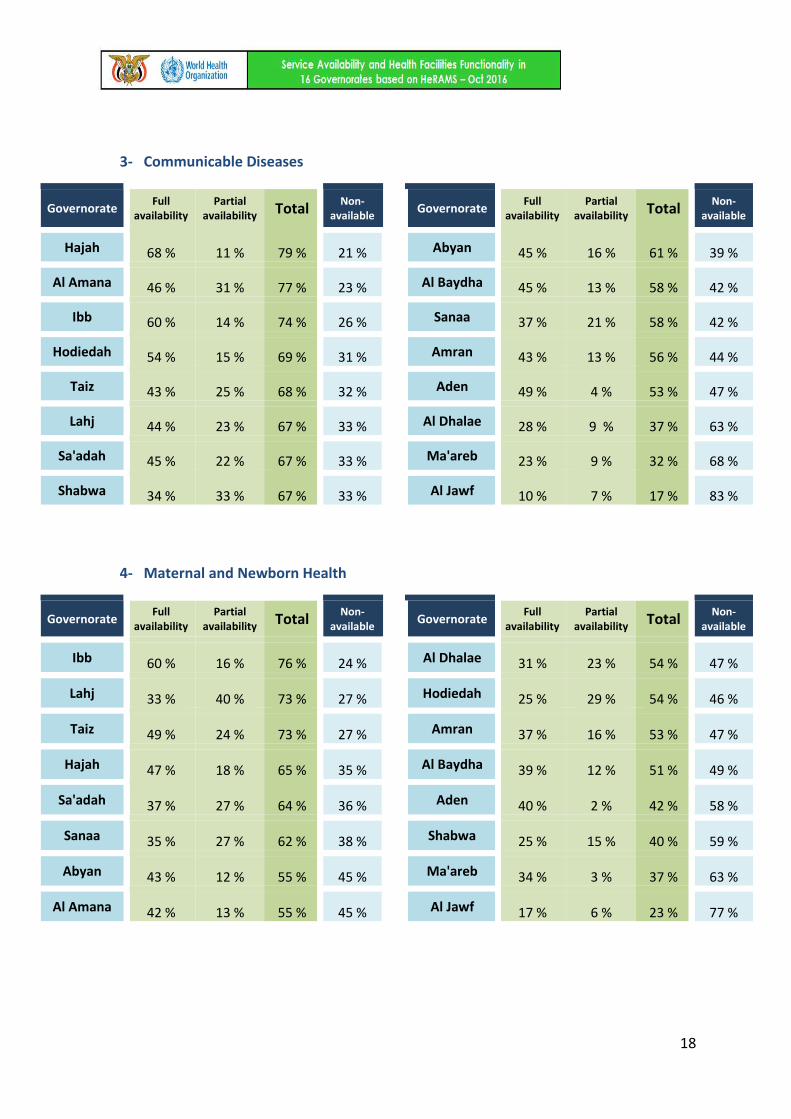
3- Communicable Diseases
Governorate Full
availability Partial
availability Total Non-
available
Governorate
Full availability
Partial availability Total
Non- available
Hajah 68 % 11 % 79 % 21 % Abyan 45 % 16 % 61 % 39 %
Al Amana 46 % 31 % 77 % 23 % Al Baydha 45 % 13 % 58 % 42 %
Ibb 60 % 14 % 74 % 26 % Sanaa 37 % 21 % 58 % 42 %
Hodiedah 54 % 15 % 69 % 31 % Amran 43 % 13 % 56 % 44 %
Taiz 43 % 25 % 68 % 32 % Aden 49 % 4 % 53 % 47 %
Lahj 44 % 23 % 67 % 33 % Al Dhalae 28 % 9 % 37 % 63 %
Sa'adah 45 % 22 % 67 % 33 % Ma'areb 23 % 9 % 32 % 68 %
Shabwa 34 % 33 % 67 % 33 % Al Jawf 10 % 7 % 17 % 83 %
4- Maternal and Newborn Health
Governorate Full
availability Partial
availability Total Non-
available
Governorate
Full availability
Partial availability Total
Non- available
Ibb 60 % 16 % 76 % 24 % Al Dhalae 31 % 23 % 54 % 47 %
Lahj 33 % 40 % 73 % 27 % Hodiedah 25 % 29 % 54 % 46 %
Taiz 49 % 24 % 73 % 27 % Amran 37 % 16 % 53 % 47 %
Hajah 47 % 18 % 65 % 35 % Al Baydha 39 % 12 % 51 % 49 %
Sa'adah 37 % 27 % 64 % 36 % Aden 40 % 2 % 42 % 58 %
Sanaa 35 % 27 % 62 % 38 % Shabwa 25 % 15 % 40 % 59 %
Abyan 43 % 12 % 55 % 45 % Ma'areb 34 % 3 % 37 % 63 %
Al Amana 42 % 13 % 55 % 45 % Al Jawf 17 % 6 % 23 % 77 %
19
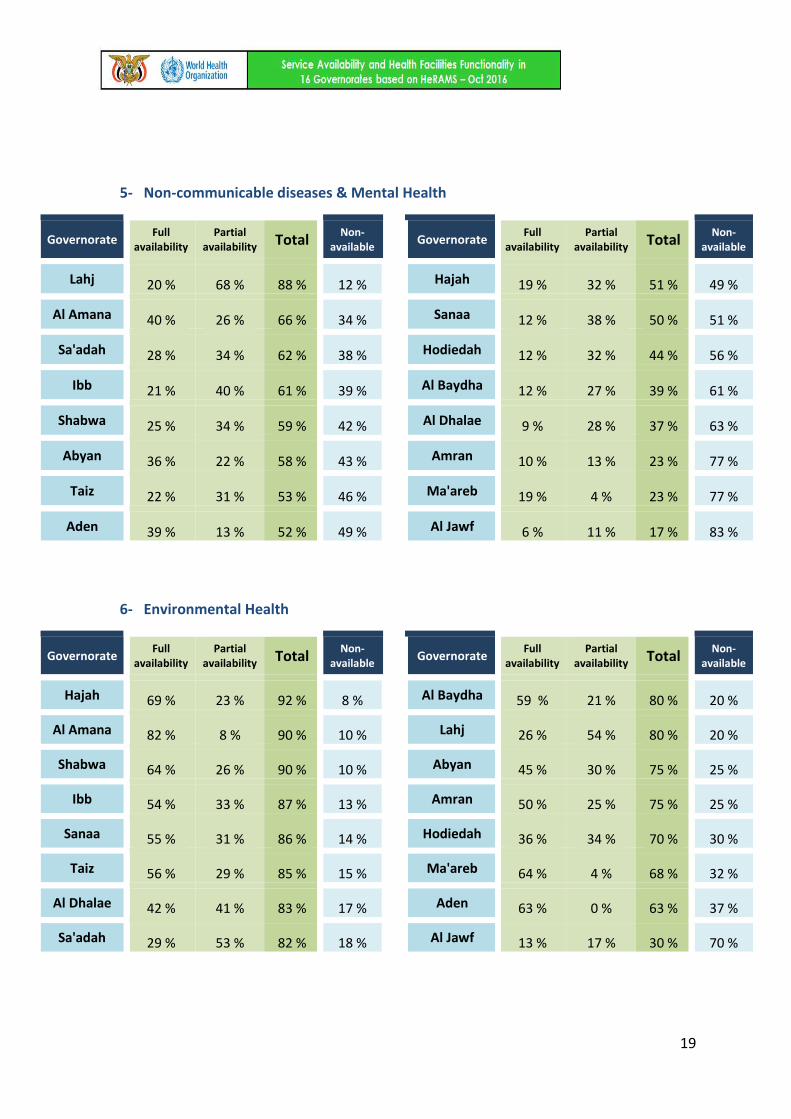
5- Non-communicable diseases & Mental Health
Governorate Full
availability Partial
availability Total Non-
available
Governorate
Full availability
Partial availability Total
Non- available
Lahj 20 % 68 % 88 % 12 % Hajah 19 % 32 % 51 % 49 %
Al Amana 40 % 26 % 66 % 34 % Sanaa 12 % 38 % 50 % 51 %
Sa'adah 28 % 34 % 62 % 38 % Hodiedah 12 % 32 % 44 % 56 %
Ibb 21 % 40 % 61 % 39 % Al Baydha 12 % 27 % 39 % 61 %
Shabwa 25 % 34 % 59 % 42 % Al Dhalae 9 % 28 % 37 % 63 %
Abyan 36 % 22 % 58 % 43 % Amran 10 % 13 % 23 % 77 %
Taiz 22 % 31 % 53 % 46 % Ma'areb 19 % 4 % 23 % 77 %
Aden 39 % 13 % 52 % 49 % Al Jawf 6 % 11 % 17 % 83 %
6- Environmental Health
Governorate Full
availability Partial
availability Total Non-
available
Governorate
Full availability
Partial availability Total
Non- available
Hajah 69 % 23 % 92 % 8 % Al Baydha 59 % 21 % 80 % 20 %
Al Amana 82 % 8 % 90 % 10 % Lahj 26 % 54 % 80 % 20 %
Shabwa 64 % 26 % 90 % 10 % Abyan 45 % 30 % 75 % 25 %
Ibb 54 % 33 % 87 % 13 % Amran 50 % 25 % 75 % 25 %
Sanaa 55 % 31 % 86 % 14 % Hodiedah 36 % 34 % 70 % 30 %
Taiz 56 % 29 % 85 % 15 % Ma'areb 64 % 4 % 68 % 32 %
Al Dhalae 42 % 41 % 83 % 17 % Aden 63 % 0 % 63 % 37 %
Sa'adah 29 % 53 % 82 % 18 % Al Jawf 13 % 17 % 30 % 70 %
20
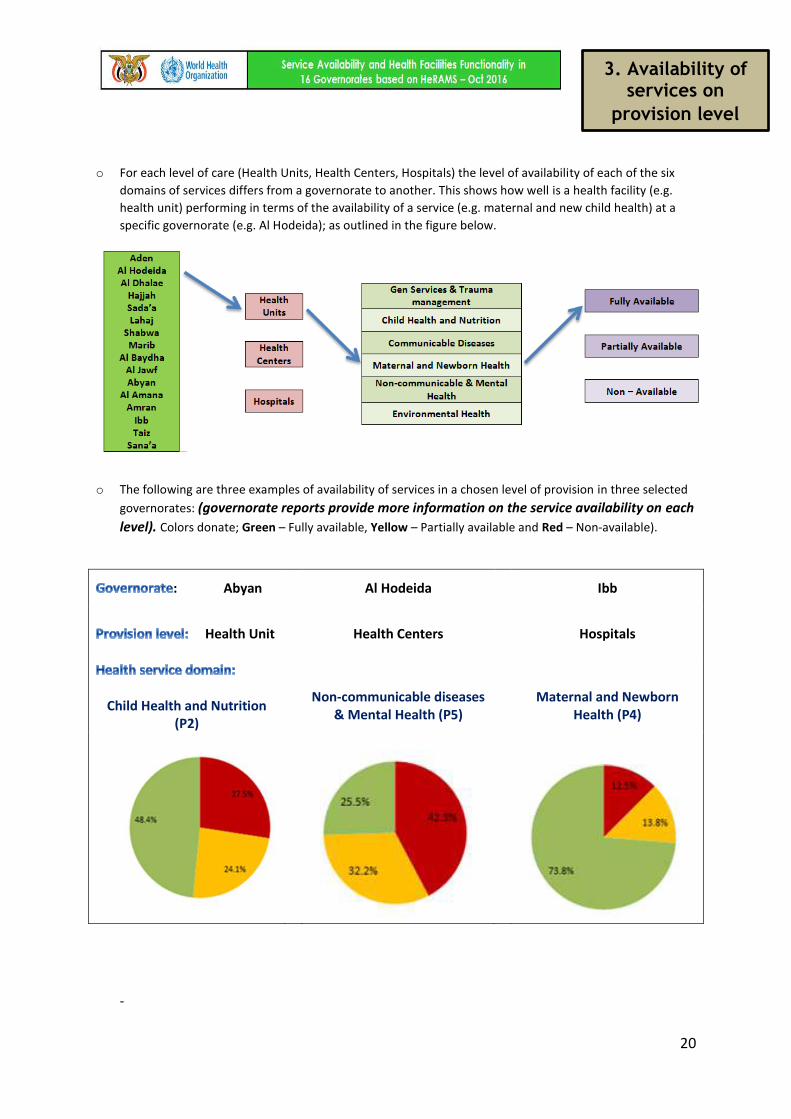
o For each level of care (Health Units, Health Centers, Hospitals) the level of availability of each of the six
domains of services differs from a governorate to another. This shows how well is a health facility (e.g.
health unit) performing in terms of the availability of a service (e.g. maternal and new child health) at a
specific governorate (e.g. Al Hodeida); as outlined in the figure below.
o The following are three examples of availability of services in a chosen level of provision in three selected
governorates: (governorate reports provide more information on the service availability on each
level). Colors donate; Green – Fully available, Yellow – Partially available and Red – Non-available).
: Abyan Al Hodeida Ibb
Health Unit Health Centers Hospitals
Child Health and Nutrition (P2)
Non-communicable diseases
& Mental Health (P5)
Maternal and Newborn
Health (P4)
-
3. Availability of services on
provision level
21
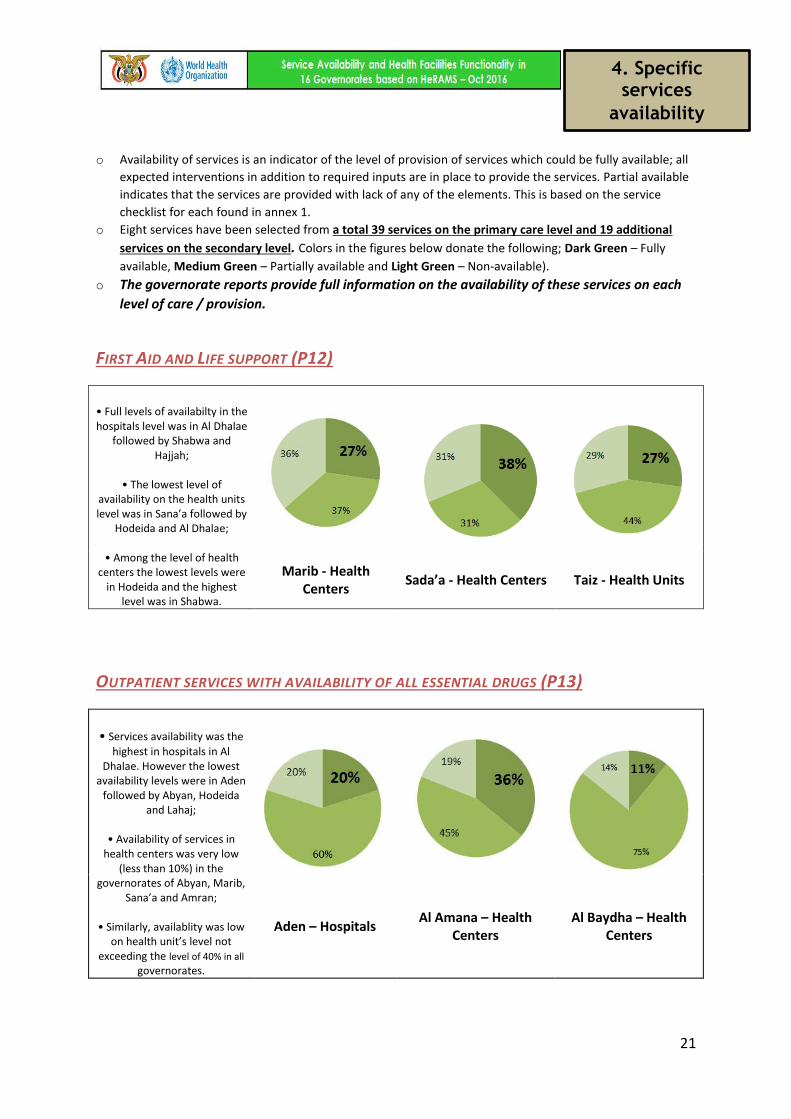
o Availability of services is an indicator of the level of provision of services which could be fully available; all
expected interventions in addition to required inputs are in place to provide the services. Partial available
indicates that the services are provided with lack of any of the elements. This is based on the service
checklist for each found in annex 1.
o Eight services have been selected from a total 39 services on the primary care level and 19 additional
services on the secondary level. Colors in the figures below donate the following; Dark Green – Fully
available, Medium Green – Partially available and Light Green – Non-available).
o The governorate reports provide full information on the availability of these services on each
level of care / provision.
FIRST AID AND LIFE SUPPORT (P12)
• Full levels of availabilty in the hospitals level was in Al Dhalae
followed by Shabwa and Hajjah;
• The lowest level of
availability on the health units level was in Sana’a followed by
Hodeida and Al Dhalae;
• Among the level of health centers the lowest levels were
in Hodeida and the highest level was in Shabwa.
Marib - Health Centers
Sada’a - Health Centers Taiz - Health Units
OUTPATIENT SERVICES WITH AVAILABILITY OF ALL ESSENTIAL DRUGS (P13)
• Services availability was the
highest in hospitals in Al Dhalae. However the lowest
availability levels were in Aden followed by Abyan, Hodeida
and Lahaj;
• Availability of services in health centers was very low
(less than 10%) in the governorates of Abyan, Marib,
Sana’a and Amran;
• Similarly, availablity was low on health unit’s level not
exceeding the level of 40% in all
governorates.
Aden – Hospitals Al Amana – Health
Centers Al Baydha – Health
Centers
4. Specific services
availability
22
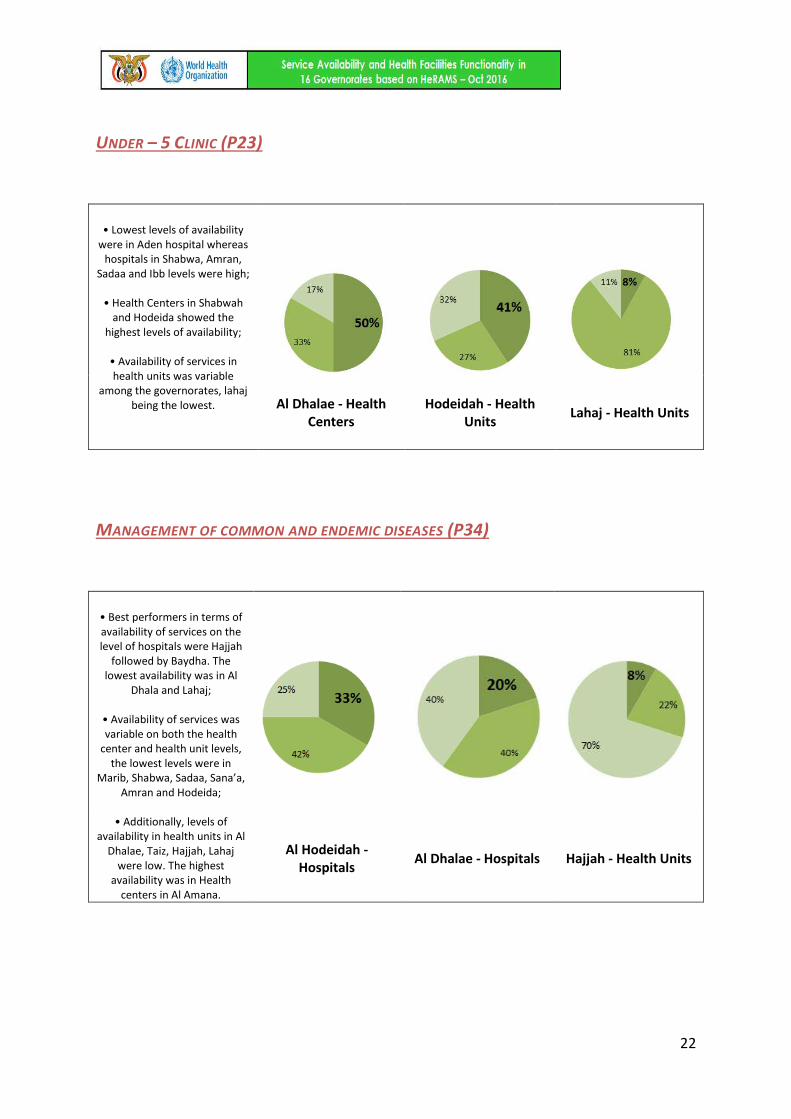
UNDER – 5 CLINIC (P23)
• Lowest levels of availability
were in Aden hospital whereas hospitals in Shabwa, Amran,
Sadaa and Ibb levels were high;
• Health Centers in Shabwah and Hodeida showed the
highest levels of availability;
• Availability of services in health units was variable
among the governorates, lahaj being the lowest.
Al Dhalae - Health Centers
Hodeidah - Health Units
Lahaj - Health Units
MANAGEMENT OF COMMON AND ENDEMIC DISEASES (P34)
• Best performers in terms of availability of services on the level of hospitals were Hajjah
followed by Baydha. The lowest availability was in Al
Dhala and Lahaj;
• Availability of services was variable on both the health
center and health unit levels, the lowest levels were in
Marib, Shabwa, Sadaa, Sana’a, Amran and Hodeida;
• Additionally, levels of
availability in health units in Al Dhalae, Taiz, Hajjah, Lahaj
were low. The highest availability was in Health
centers in Al Amana.
Al Hodeidah - Hospitals
Al Dhalae - Hospitals Hajjah - Health Units
23
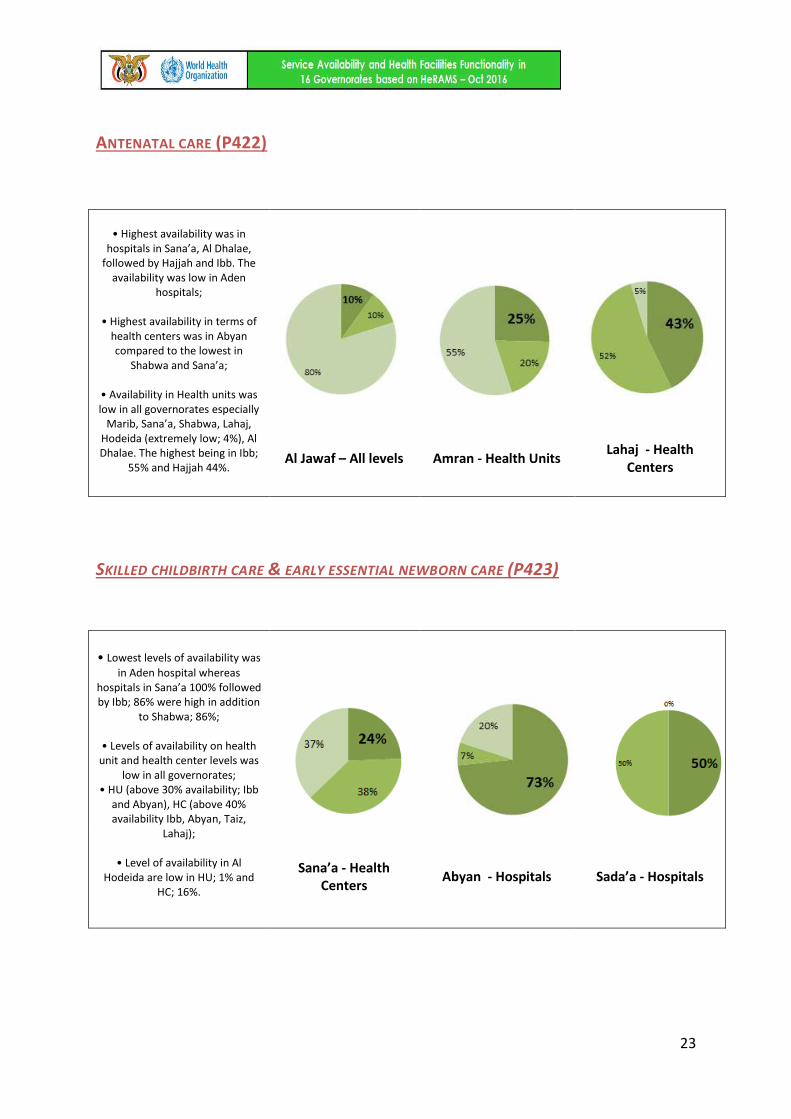
ANTENATAL CARE (P422)
• Highest availability was in
hospitals in Sana’a, Al Dhalae, followed by Hajjah and Ibb. The
availability was low in Aden hospitals;
• Highest availability in terms of
health centers was in Abyan compared to the lowest in
Shabwa and Sana’a;
• Availability in Health units was low in all governorates especially
Marib, Sana’a, Shabwa, Lahaj, Hodeida (extremely low; 4%), Al Dhalae. The highest being in Ibb;
55% and Hajjah 44%.
Al Jawaf – All levels Amran - Health Units Lahaj - Health
Centers
SKILLED CHILDBIRTH CARE & EARLY ESSENTIAL NEWBORN CARE (P423)
• Lowest levels of availability was
in Aden hospital whereas hospitals in Sana’a 100% followed by Ibb; 86% were high in addition
to Shabwa; 86%;
• Levels of availability on health unit and health center levels was
low in all governorates; • HU (above 30% availability; Ibb
and Abyan), HC (above 40% availability Ibb, Abyan, Taiz,
Lahaj);
• Level of availability in Al Hodeida are low in HU; 1% and
HC; 16%.
Sana’a - Health Centers
Abyan - Hospitals Sada’a - Hospitals
24
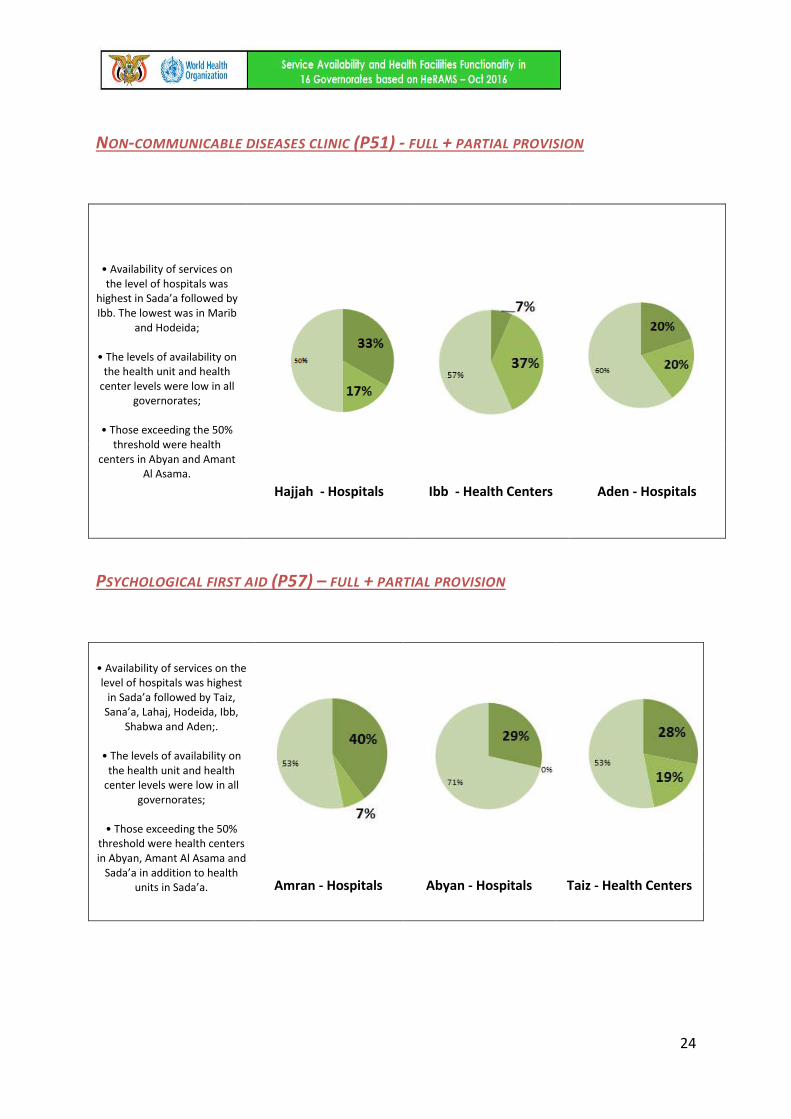
NON-COMMUNICABLE DISEASES CLINIC (P51) - FULL + PARTIAL PROVISION
• Availability of services on the level of hospitals was
highest in Sada’a followed by Ibb. The lowest was in Marib
and Hodeida;
• The levels of availability on the health unit and health
center levels were low in all governorates;
• Those exceeding the 50%
threshold were health centers in Abyan and Amant
Al Asama.
Hajjah - Hospitals Ibb - Health Centers Aden - Hospitals
PSYCHOLOGICAL FIRST AID (P57) – FULL + PARTIAL PROVISION
• Availability of services on the level of hospitals was highest
in Sada’a followed by Taiz, Sana’a, Lahaj, Hodeida, Ibb,
Shabwa and Aden;.
• The levels of availability on the health unit and health
center levels were low in all governorates;
• Those exceeding the 50%
threshold were health centers in Abyan, Amant Al Asama and
Sada’a in addition to health units in Sada’a.
Amran - Hospitals Abyan - Hospitals Taiz - Health Centers
25
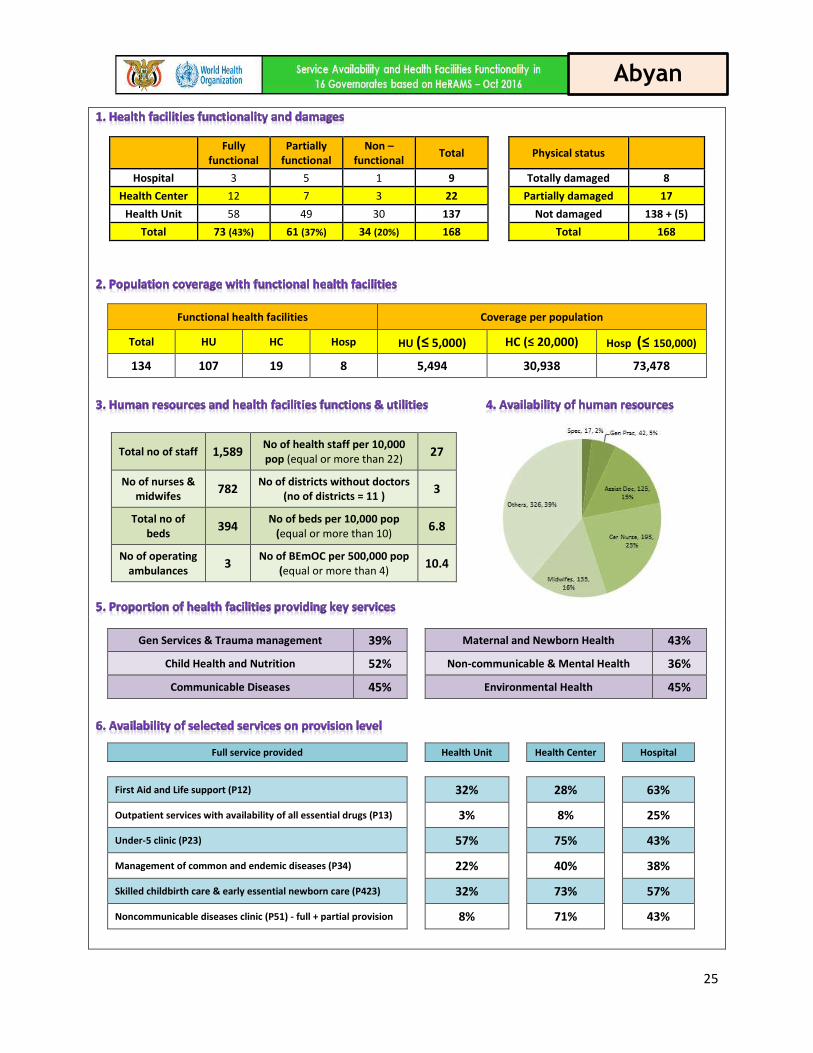
Fully
functional Partially
functional Non –
functional Total
Physical status
Hospital 3 5 1 9 Totally damaged 8
Health Center 12 7 3 22 Partially damaged 17
Health Unit 58 49 30 137 Not damaged 138 + (5)
Total 73 (43%) 61 (37%) 34 (20%) 168 Total 168
Functional health facilities Coverage per population
Total HU HC Hosp HU (≤ 5,000) HC (≤ 20,000) Hosp (≤ 150,000)
134 107 19 8 5,494 30,938 73,478
Total no of staff 1,589 No of health staff per 10,000 pop (equal or more than 22)
27
No of nurses & midwifes
782 No of districts without doctors
(no of districts = 11 ) 3
Total no of beds
394 No of beds per 10,000 pop
(equal or more than 10) 6.8
No of operating ambulances
3 No of BEmOC per 500,000 pop
(equal or more than 4) 10.4
Gen Services & Trauma management 39% Maternal and Newborn Health 43%
Child Health and Nutrition 52% Non-communicable & Mental Health 36%
Communicable Diseases 45% Environmental Health 45%
Full service provided Health Unit Health Center Hospital
First Aid and Life support (P12) 32% 28% 63%
Outpatient services with availability of all essential drugs (P13) 3% 8% 25%
Under-5 clinic (P23) 57% 75% 43%
Management of common and endemic diseases (P34) 22% 40% 38%
Skilled childbirth care & early essential newborn care (P423) 32% 73% 57%
Noncommunicable diseases clinic (P51) - full + partial provision 8% 71% 43%
Abyan
26
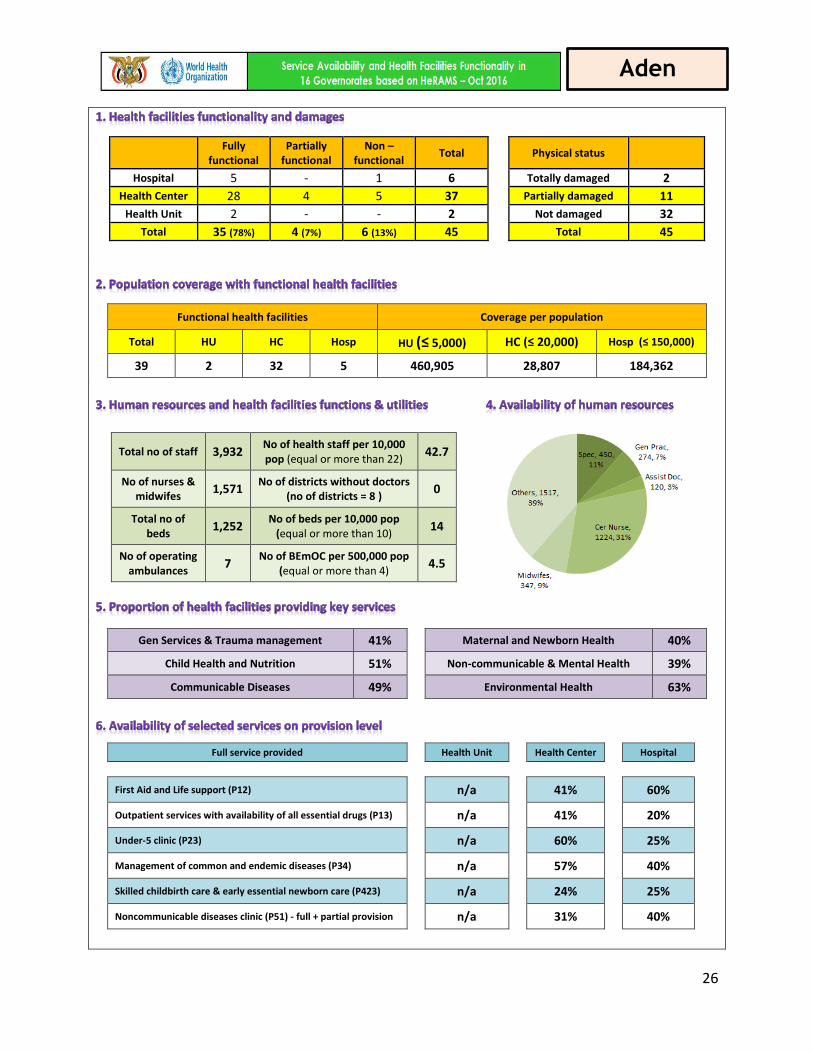
Fully
functional Partially
functional Non –
functional Total
Physical status
Hospital 5 - 1 6 Totally damaged 2
Health Center 28 4 5 37 Partially damaged 11
Health Unit 2 - - 2 Not damaged 32
Total 35 (78%) 4 (7%) 6 (13%) 45 Total 45
Functional health facilities Coverage per population
Total HU HC Hosp HU (≤ 5,000) HC (≤ 20,000) Hosp (≤ 150,000)
39 2 32 5 460,905 28,807 184,362
Total no of staff 3,932 No of health staff per 10,000 pop (equal or more than 22)
42.7
No of nurses & midwifes
1,571 No of districts without doctors
(no of districts = 8 ) 0
Total no of beds
1,252 No of beds per 10,000 pop
(equal or more than 10) 14
No of operating ambulances
7 No of BEmOC per 500,000 pop
(equal or more than 4) 4.5
Gen Services & Trauma management 41% Maternal and Newborn Health 40%
Child Health and Nutrition 51% Non-communicable & Mental Health 39%
Communicable Diseases 49% Environmental Health 63%
Full service provided Health Unit Health Center Hospital
First Aid and Life support (P12) n/a 41% 60%
Outpatient services with availability of all essential drugs (P13) n/a 41% 20%
Under-5 clinic (P23) n/a 60% 25%
Management of common and endemic diseases (P34) n/a 57% 40%
Skilled childbirth care & early essential newborn care (P423) n/a 24% 25%
Noncommunicable diseases clinic (P51) - full + partial provision n/a 31% 40%
Aden

27
Fully
functional Partially
functional Non –
functional Total
Physical status
Hospital 2 6 4 12 Totally damaged 4
Health Center 10 31 9 50 Partially damaged 8
Health Unit 21 65 29 115 Not damaged 165
Total 33 (19%) 102 (58%) 42 (23%) 177 Total 177
Functional health facilities Coverage per population
Total HU HC Hosp HU (≤ 5,000) HC (≤ 20,000) Hosp (≤ 150,000)
135 86 41 8 8,724 18,299 93,783
Total no of staff 838 No of health staff per 10,000 pop (equal or more than 22)
11.2
No of nurses & midwifes
328 No of districts without doctors
(no of districts = 20 ) 15
Total no of beds
186 No of beds per 10,000 pop
(equal or more than 10) 2.4
No of operating ambulances
3 No of BEmOC per 500,000 pop
(equal or more than 4) 4.6
Gen Services & Trauma management 38% Maternal and Newborn Health 39%
Child Health and Nutrition 67% Non-communicable & Mental Health 12%
Communicable Diseases 45% Environmental Health 59%
Full service provided Health Unit Health Center Hospital
First Aid and Life support (P12) 25% 37% 57%
Outpatient services with availability of all essential drugs (P13) 2% 11% 67%
Under-5 clinic (P23) 53% 76% 86%
Management of common and endemic diseases (P34) 0% 8% 67%
Skilled childbirth care & early essential newborn care (P423) 18% 25% 100%
Noncommunicable diseases clinic (P51) - full + partial provision 4% 37% 60%
Al Baydha
28
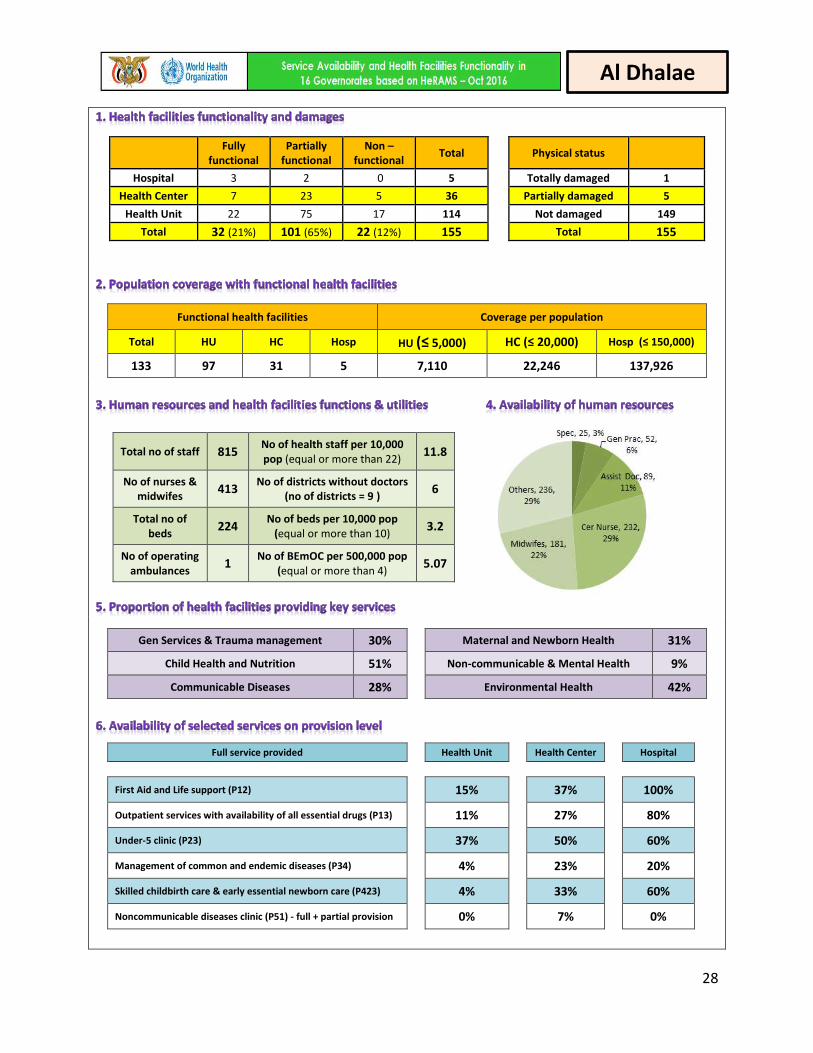
Fully
functional Partially
functional Non –
functional Total
Physical status
Hospital 3 2 0 5 Totally damaged 1
Health Center 7 23 5 36 Partially damaged 5
Health Unit 22 75 17 114 Not damaged 149
Total 32 (21%) 101 (65%) 22 (12%) 155 Total 155
Functional health facilities Coverage per population
Total HU HC Hosp HU (≤ 5,000) HC (≤ 20,000) Hosp (≤ 150,000)
133 97 31 5 7,110 22,246 137,926
Total no of staff 815 No of health staff per 10,000 pop (equal or more than 22)
11.8
No of nurses & midwifes
413 No of districts without doctors
(no of districts = 9 ) 6
Total no of beds
224 No of beds per 10,000 pop
(equal or more than 10) 3.2
No of operating ambulances
1 No of BEmOC per 500,000 pop
(equal or more than 4) 5.07
Gen Services & Trauma management 30% Maternal and Newborn Health 31%
Child Health and Nutrition 51% Non-communicable & Mental Health 9%
Communicable Diseases 28% Environmental Health 42%
Full service provided Health Unit Health Center Hospital
First Aid and Life support (P12) 15% 37% 100%
Outpatient services with availability of all essential drugs (P13) 11% 27% 80%
Under-5 clinic (P23) 37% 50% 60%
Management of common and endemic diseases (P34) 4% 23% 20%
Skilled childbirth care & early essential newborn care (P423) 4% 33% 60%
Noncommunicable diseases clinic (P51) - full + partial provision 0% 7% 0%
Al Dhalae
29
Fully
functional Partially
functional Non –
functional Total
Physical status
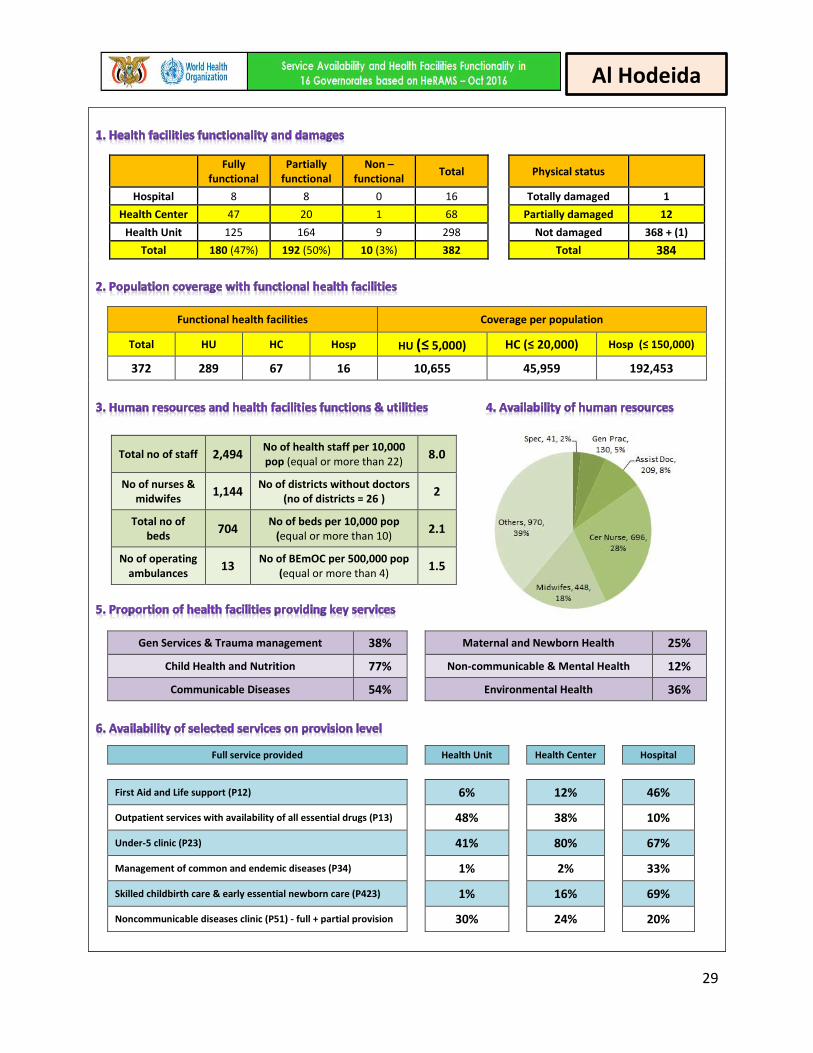
Hospital 8 8 0 16 Totally damaged 1
Health Center 47 20 1 68 Partially damaged 12
Health Unit 125 164 9 298 Not damaged 368 + (1)
Total 180 (47%) 192 (50%) 10 (3%) 382 Total 384
Functional health facilities Coverage per population
Total HU HC Hosp HU (≤ 5,000) HC (≤ 20,000) Hosp (≤ 150,000)
372 289 67 16 10,655 45,959 192,453
Total no of staff 2,494 No of health staff per 10,000 pop (equal or more than 22)
8.0
No of nurses & midwifes
1,144 No of districts without doctors
(no of districts = 26 ) 2
Total no of beds
704 No of beds per 10,000 pop
(equal or more than 10) 2.1
No of operating ambulances
13 No of BEmOC per 500,000 pop
(equal or more than 4) 1.5
Gen Services & Trauma management 38% Maternal and Newborn Health 25%
Child Health and Nutrition 77% Non-communicable & Mental Health 12%
Communicable Diseases 54% Environmental Health 36%
Full service provided Health Unit Health Center Hospital
First Aid and Life support (P12) 6% 12% 46%
Outpatient services with availability of all essential drugs (P13) 48% 38% 10%
Under-5 clinic (P23) 41% 80% 67%
Management of common and endemic diseases (P34) 1% 2% 33%
Skilled childbirth care & early essential newborn care (P423) 1% 16% 69%
Noncommunicable diseases clinic (P51) - full + partial provision 30% 24% 20%
Al Hodeida
30
Fully
functional Partially
functional Non –
functional Total
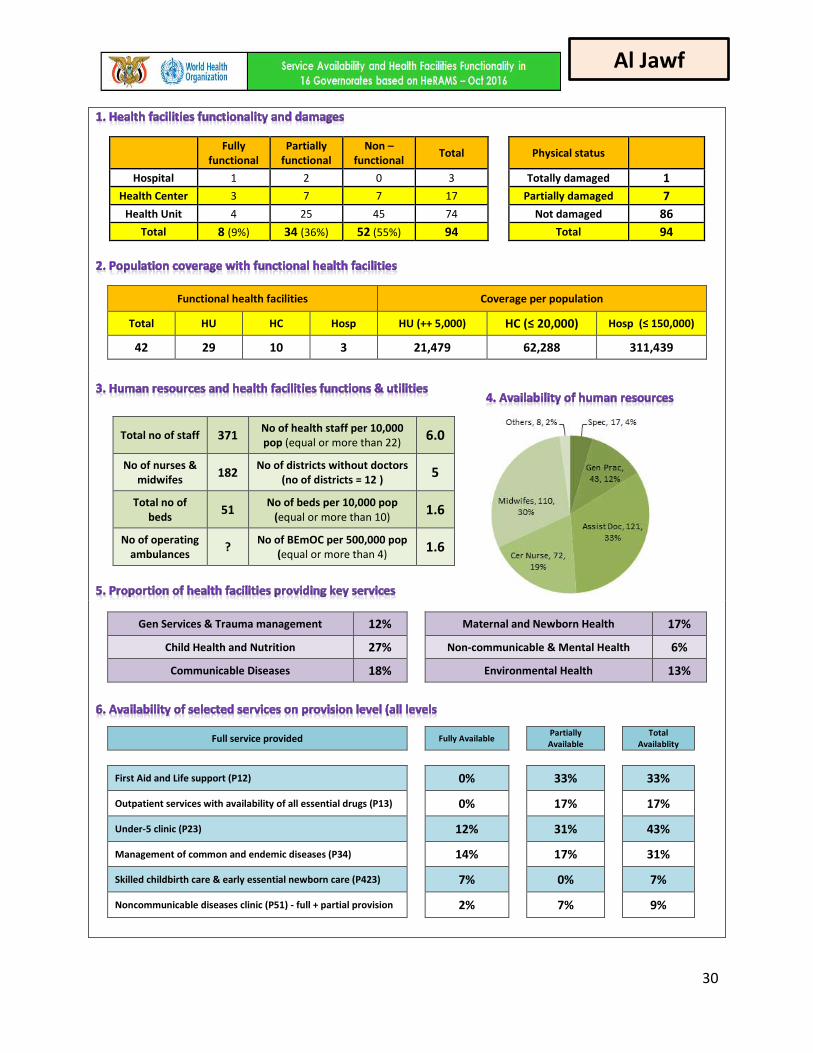
Physical status
Hospital 1 2 0 3 Totally damaged 1
Health Center 3 7 7 17 Partially damaged 7
Health Unit 4 25 45 74 Not damaged 86
Total 8 (9%) 34 (36%) 52 (55%) 94 Total 94
Functional health facilities Coverage per population
Total HU HC Hosp HU (++ 5,000) HC (≤ 20,000) Hosp (≤ 150,000)
42 29 10 3 21,479 62,288 311,439
Total no of staff 371 No of health staff per 10,000 pop (equal or more than 22)
6.0
No of nurses & midwifes
182 No of districts without doctors
(no of districts = 12 ) 5
Total no of beds
51 No of beds per 10,000 pop
(equal or more than 10) 1.6
No of operating ambulances
? No of BEmOC per 500,000 pop
(equal or more than 4) 1.6
Gen Services & Trauma management 12% Maternal and Newborn Health 17%
Child Health and Nutrition 27% Non-communicable & Mental Health 6%
Communicable Diseases 18% Environmental Health 13%
Full service provided Fully Available Partially Available
Total
Availablity
First Aid and Life support (P12) 0% 33% 33%
Outpatient services with availability of all essential drugs (P13) 0% 17% 17%
Under-5 clinic (P23) 12% 31% 43%
Management of common and endemic diseases (P34) 14% 17% 31%
Skilled childbirth care & early essential newborn care (P423) 7% 0% 7%
Noncommunicable diseases clinic (P51) - full + partial provision 2% 7% 9%
Al Jawf
31
Fully
functional Partially
functional Non –
functional Total
Physical status
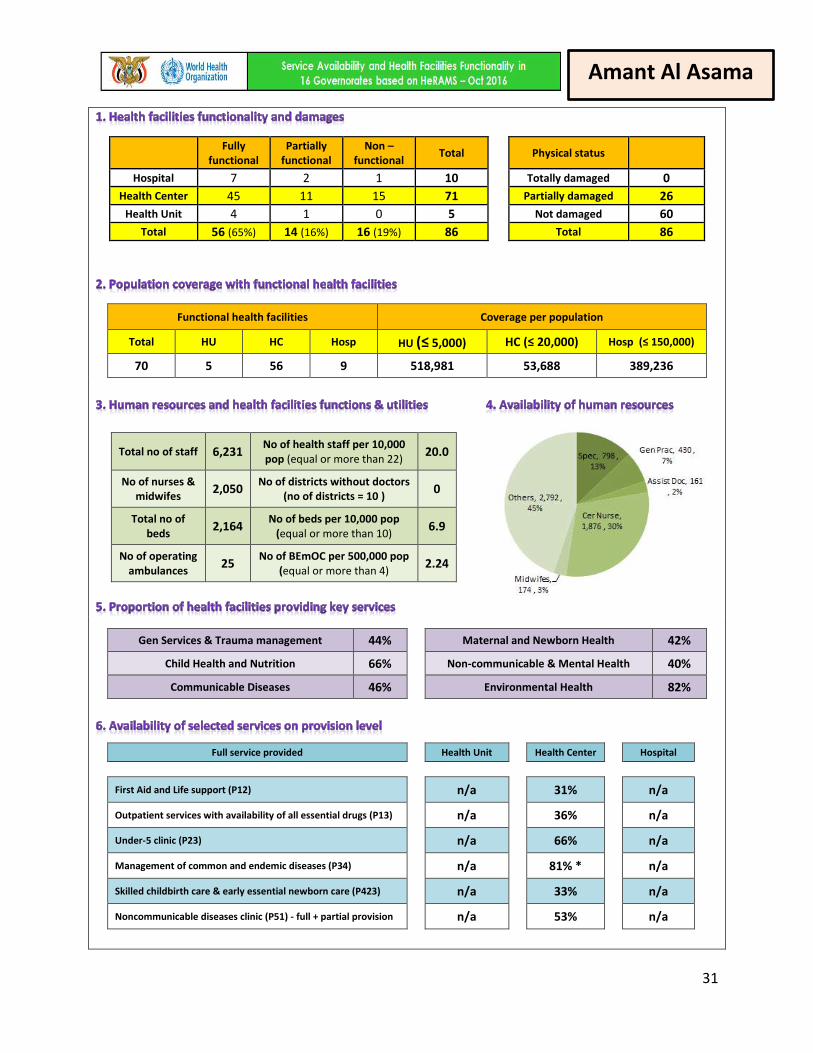
Hospital 7 2 1 10 Totally damaged 0
Health Center 45 11 15 71 Partially damaged 26
Health Unit 4 1 0 5 Not damaged 60
Total 56 (65%) 14 (16%) 16 (19%) 86 Total 86
Functional health facilities Coverage per population
Total HU HC Hosp HU (≤ 5,000) HC (≤ 20,000) Hosp (≤ 150,000)
70 5 56 9 518,981 53,688 389,236
Total no of staff 6,231 No of health staff per 10,000 pop (equal or more than 22)
20.0
No of nurses & midwifes
2,050 No of districts without doctors
(no of districts = 10 ) 0
Total no of beds
2,164 No of beds per 10,000 pop
(equal or more than 10) 6.9
No of operating ambulances
25 No of BEmOC per 500,000 pop
(equal or more than 4) 2.24
Gen Services & Trauma management 44% Maternal and Newborn Health 42%
Child Health and Nutrition 66% Non-communicable & Mental Health 40%
Communicable Diseases 46% Environmental Health 82%
Full service provided Health Unit Health Center Hospital
First Aid and Life support (P12) n/a 31% n/a
Outpatient services with availability of all essential drugs (P13) n/a 36% n/a
Under-5 clinic (P23) n/a 66% n/a
Management of common and endemic diseases (P34) n/a 81% * n/a
Skilled childbirth care & early essential newborn care (P423) n/a 33% n/a
Noncommunicable diseases clinic (P51) - full + partial provision n/a 53% n/a
Amant Al Asama

32
Fully
functional Partially
functional Non –
functional Total
Physical status
Hospital 9 6 4 19 Totally damaged 1
Health Center 21 14 2 37 Partially damaged 12
Health Unit 156 49 43 248 Not damaged 288 + (1)
Total 186 (61%) 69 (23%) 49 (16%) 304 Total 304
Functional health facilities Coverage per population
Total HU HC Hosp HU (≤ 5,000) HC (≤ 20,000) Hosp (≤ 150,000)
255 205 35 15 6,451 37,784 88,164
Total no of staff 1,553 No of health staff per 10,000 pop (equal or more than 22)
11.7
No of nurses & midwifes
637 No of districts without doctors
(no of districts = 20 ) 15
Total no of beds
414 No of beds per 10,000 pop
(equal or more than 10) 2.9
No of operating ambulances
1 No of BEmOC per 500,000 pop
(equal or more than 4) 7.3
Gen Services & Trauma management 35% Maternal and Newborn Health 37%
Child Health and Nutrition 67% Non-communicable & Mental Health 10%
Communicable Diseases 43% Environmental Health 50%
Full service provided Health Unit Health Center Hospital
First Aid and Life support (P12) 29% 42% 60%
Outpatient services with availability of all essential drugs (P13) 1% 6% 33%
Under-5 clinic (P23) 54% 56% 80%
Management of common and endemic diseases (P34) 3% 11% 47%
Skilled childbirth care & early essential newborn care (P423) 22% 36% 73%
Noncommunicable diseases clinic (P51) - full + partial provision 13% 17% 33%
Amran
33
Fully
functional Partially
functional Non –
functional Total
Physical status
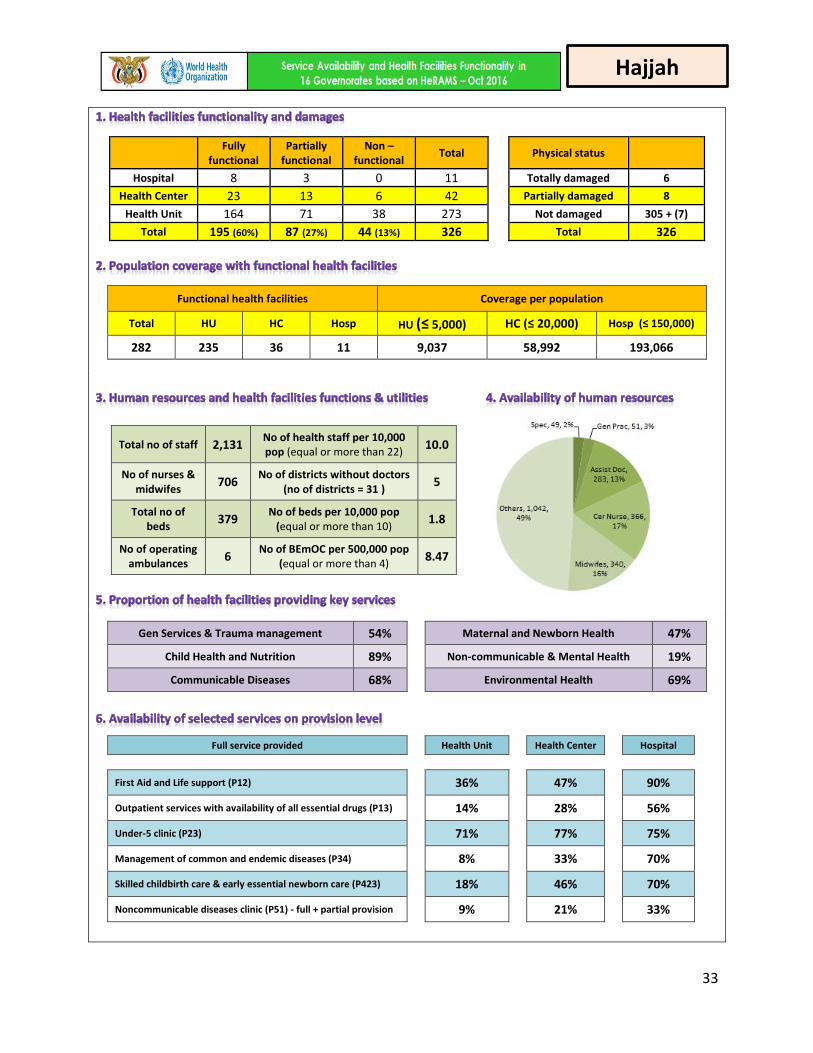
Hospital 8 3 0 11 Totally damaged 6
Health Center 23 13 6 42 Partially damaged 8
Health Unit 164 71 38 273 Not damaged 305 + (7)
Total 195 (60%) 87 (27%) 44 (13%) 326 Total 326
Functional health facilities Coverage per population
Total HU HC Hosp HU (≤ 5,000) HC (≤ 20,000) Hosp (≤ 150,000)
282 235 36 11 9,037 58,992 193,066
Total no of staff 2,131 No of health staff per 10,000 pop (equal or more than 22)
10.0
No of nurses & midwifes
706 No of districts without doctors
(no of districts = 31 ) 5
Total no of beds
379 No of beds per 10,000 pop
(equal or more than 10) 1.8
No of operating ambulances
6 No of BEmOC per 500,000 pop
(equal or more than 4) 8.47
Gen Services & Trauma management 54% Maternal and Newborn Health 47%
Child Health and Nutrition 89% Non-communicable & Mental Health 19%
Communicable Diseases 68% Environmental Health 69%
Full service provided Health Unit Health Center Hospital
First Aid and Life support (P12) 36% 47% 90%
Outpatient services with availability of all essential drugs (P13) 14% 28% 56%
Under-5 clinic (P23) 71% 77% 75%
Management of common and endemic diseases (P34) 8% 33% 70%
Skilled childbirth care & early essential newborn care (P423) 18% 46% 70%
Noncommunicable diseases clinic (P51) - full + partial provision 9% 21% 33%
Hajjah
34
Fully
functional Partially
functional Non –
functional Total
Physical status
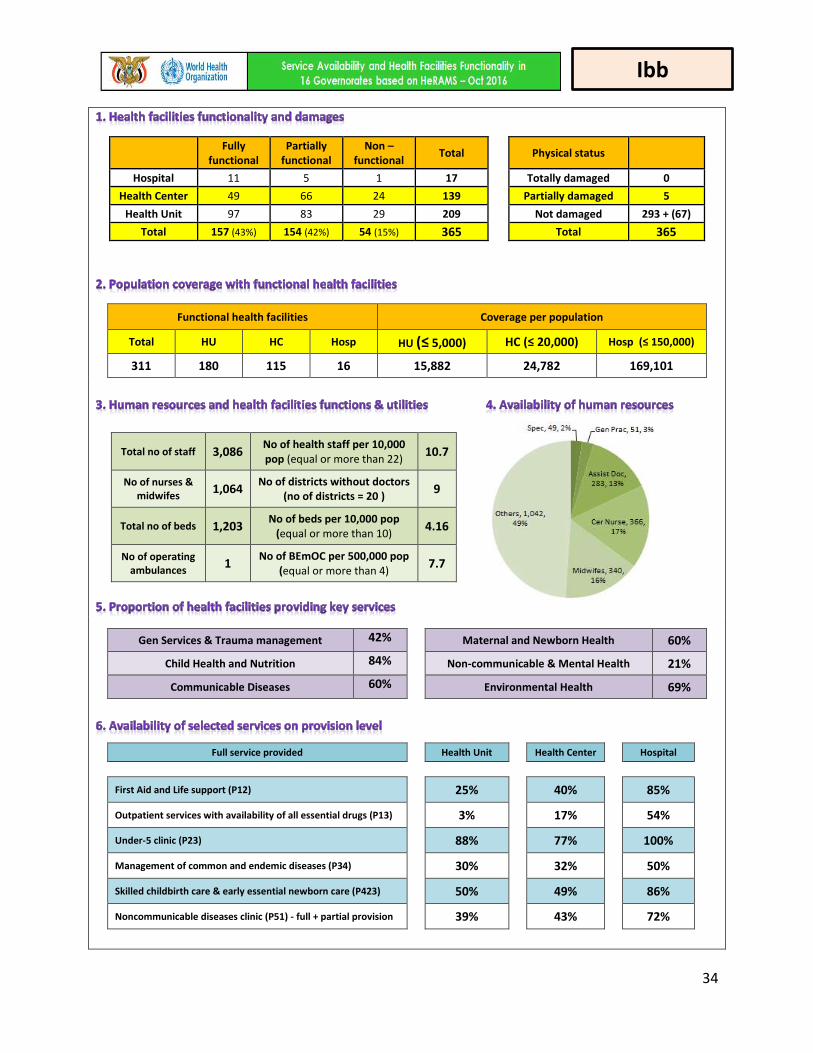
Hospital 11 5 1 17 Totally damaged 0
Health Center 49 66 24 139 Partially damaged 5
Health Unit 97 83 29 209 Not damaged 293 + (67)
Total 157 (43%) 154 (42%) 54 (15%) 365 Total 365
Functional health facilities Coverage per population
Total HU HC Hosp HU (≤ 5,000) HC (≤ 20,000) Hosp (≤ 150,000)
311 180 115 16 15,882 24,782 169,101
Total no of staff 3,086 No of health staff per 10,000 pop (equal or more than 22)
10.7
No of nurses & midwifes
1,064 No of districts without doctors
(no of districts = 20 ) 9
Total no of beds 1,203 No of beds per 10,000 pop
(equal or more than 10) 4.16
No of operating ambulances
1 No of BEmOC per 500,000 pop
(equal or more than 4) 7.7
Gen Services & Trauma management 42% Maternal and Newborn Health 60%
Child Health and Nutrition 84% Non-communicable & Mental Health 21%
Communicable Diseases 60% Environmental Health 69%
Full service provided Health Unit Health Center Hospital
First Aid and Life support (P12) 25% 40% 85%
Outpatient services with availability of all essential drugs (P13) 3% 17% 54%
Under-5 clinic (P23) 88% 77% 100%
Management of common and endemic diseases (P34) 30% 32% 50%
Skilled childbirth care & early essential newborn care (P423) 50% 49% 86%
Noncommunicable diseases clinic (P51) - full + partial provision 39% 43% 72%
Ibb
35
Fully
functional Partially
functional Non –
functional Total
Physical status
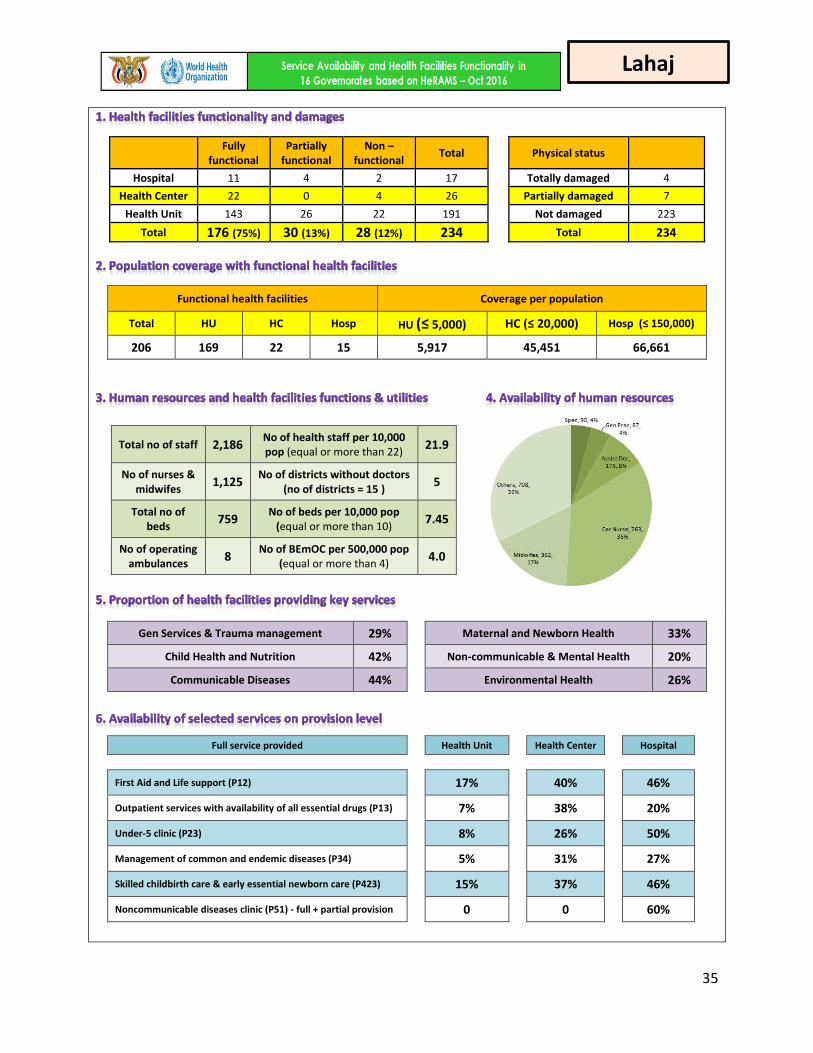
Hospital 11 4 2 17 Totally damaged 4
Health Center 22 0 4 26 Partially damaged 7
Health Unit 143 26 22 191 Not damaged 223
Total 176 (75%) 30 (13%) 28 (12%) 234 Total 234
Functional health facilities Coverage per population
Total HU HC Hosp HU (≤ 5,000) HC (≤ 20,000) Hosp (≤ 150,000)
206 169 22 15 5,917 45,451 66,661
Total no of staff 2,186 No of health staff per 10,000 pop (equal or more than 22)
21.9
No of nurses & midwifes
1,125 No of districts without doctors
(no of districts = 15 ) 5
Total no of beds
759 No of beds per 10,000 pop
(equal or more than 10) 7.45
No of operating ambulances
8 No of BEmOC per 500,000 pop
(equal or more than 4) 4.0
Gen Services & Trauma management 29% Maternal and Newborn Health 33%
Child Health and Nutrition 42% Non-communicable & Mental Health 20%
Communicable Diseases 44% Environmental Health 26%
Full service provided Health Unit Health Center Hospital
First Aid and Life support (P12) 17% 40% 46%
Outpatient services with availability of all essential drugs (P13) 7% 38% 20%
Under-5 clinic (P23) 8% 26% 50%
Management of common and endemic diseases (P34) 5% 31% 27%
Skilled childbirth care & early essential newborn care (P423) 15% 37% 46%
Noncommunicable diseases clinic (P51) - full + partial provision 0 0 60%
Lahaj
36
Fully
functional Partially
functional Non –
functional Total
Physical status
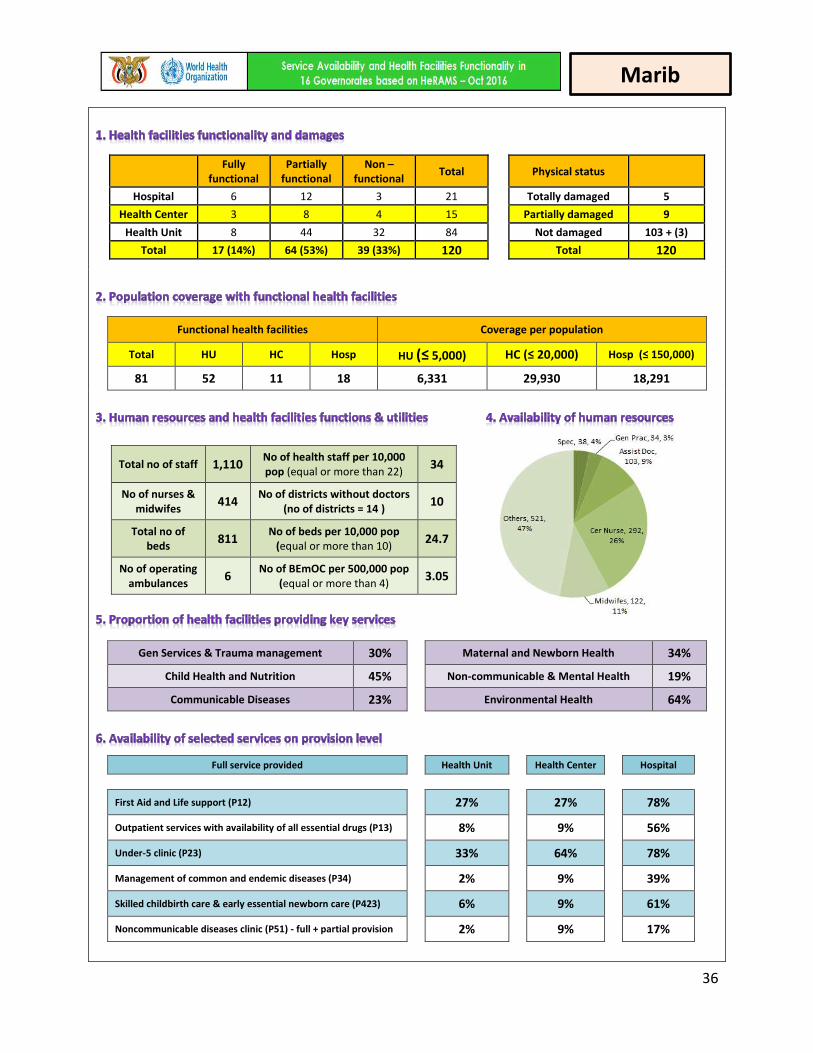
Hospital 6 12 3 21 Totally damaged 5
Health Center 3 8 4 15 Partially damaged 9
Health Unit 8 44 32 84 Not damaged 103 + (3)
Total 17 (14%) 64 (53%) 39 (33%) 120 Total 120
Functional health facilities Coverage per population
Total HU HC Hosp HU (≤ 5,000) HC (≤ 20,000) Hosp (≤ 150,000)
81 52 11 18 6,331 29,930 18,291
Total no of staff 1,110 No of health staff per 10,000 pop (equal or more than 22)
34
No of nurses & midwifes
414 No of districts without doctors
(no of districts = 14 ) 10
Total no of beds
811 No of beds per 10,000 pop
(equal or more than 10) 24.7
No of operating ambulances
6 No of BEmOC per 500,000 pop
(equal or more than 4) 3.05
Gen Services & Trauma management 30% Maternal and Newborn Health 34%
Child Health and Nutrition 45% Non-communicable & Mental Health 19%
Communicable Diseases 23% Environmental Health 64%
Full service provided Health Unit Health Center Hospital
First Aid and Life support (P12) 27% 27% 78%
Outpatient services with availability of all essential drugs (P13) 8% 9% 56%
Under-5 clinic (P23) 33% 64% 78%
Management of common and endemic diseases (P34) 2% 9% 39%
Skilled childbirth care & early essential newborn care (P423) 6% 9% 61%
Noncommunicable diseases clinic (P51) - full + partial provision 2% 9% 17%
Marib

37
Fully
functional Partially
functional Non –
functional Total
Physical status
Hospital 1 5 3 9 Totally damaged 25
Health Center 3 15 10 28 Partially damaged 38
Health Unit 31 46 49 126 Not damaged 100
Total 35 (21%) 66 (41%) 62 (38%) 163 Total 163
Functional health facilities Coverage per population
Total HU HC Hosp HU (≤ 5,000) HC (≤ 20,000) Hosp (≤ 150,000)
101 77 18 6 13,341 57,069 171,206
Total no of staff 652 No of health staff per 10,000 pop (equal or more than 22)
6.3
No of nurses & midwifes
280 No of districts without doctors
(no of districts = 15 ) 12
Total no of beds
189 No of beds per 10,000 pop
(equal or more than 10) 2.3
No of operating ambulances
6 No of BEmOC per 500,000 pop
(equal or more than 4) 3.8
Gen Services & Trauma management 44% Maternal and Newborn Health 37%
Child Health and Nutrition 67% Non-communicable & Mental Health 28%
Communicable Diseases 45% Environmental Health 29%
Full service provided Health Unit Health Center Hospital
First Aid and Life support (P12) 28% 38% 67%
Outpatient services with availability of all essential drugs (P13) 11% 33% 67%
Under-5 clinic (P23) 49% 63% 80%
Management of common and endemic diseases (P34) 5% 14% 50%
Skilled childbirth care & early essential newborn care (P423) 19% 25% 50%
Noncommunicable diseases clinic (P51) - full + partial provision 13% 25% 100%
Sada’a
38
Fully
functional Partially
functional Non –
functional Total
Physical status
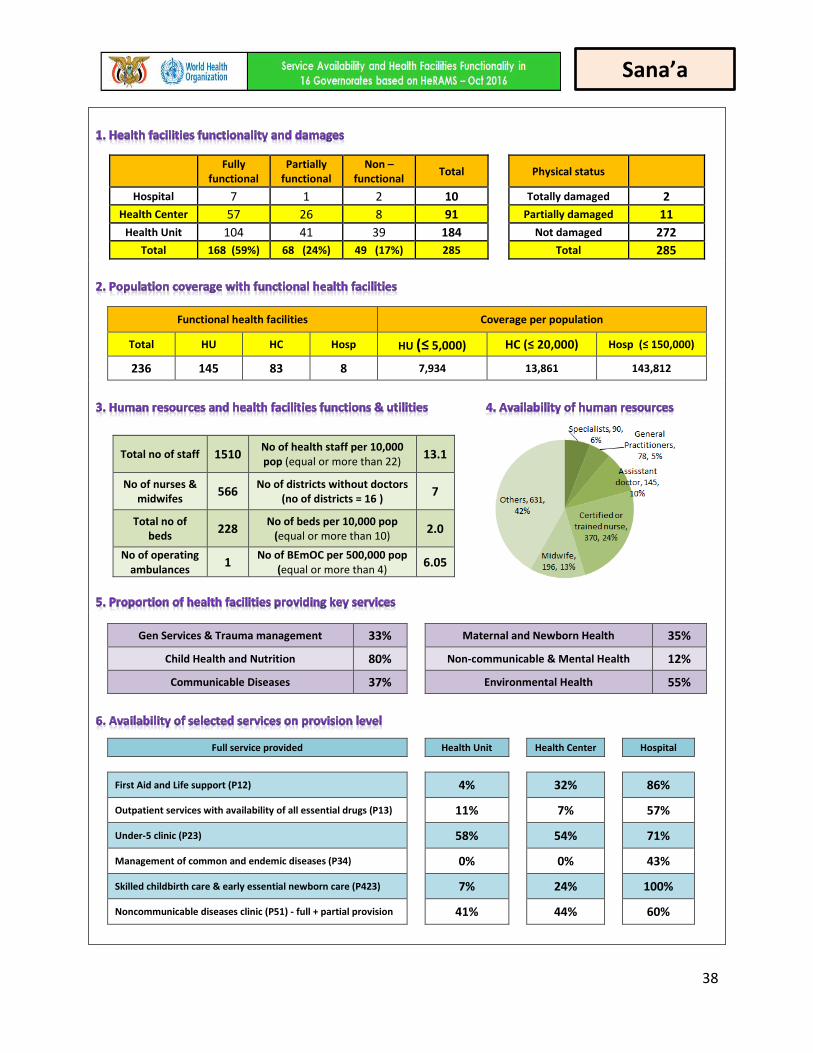
Hospital 7 1 2 10 Totally damaged 2
Health Center 57 26 8 91 Partially damaged 11
Health Unit 104 41 39 184 Not damaged 272
Total 168 (59%) 68 (24%) 49 (17%) 285 Total 285
Functional health facilities Coverage per population
Total HU HC Hosp HU (≤ 5,000) HC (≤ 20,000) Hosp (≤ 150,000)
236 145 83 8 7,934 13,861 143,812
Total no of staff 1510 No of health staff per 10,000 pop (equal or more than 22)
13.1
No of nurses & midwifes
566 No of districts without doctors
(no of districts = 16 ) 7
Total no of beds
228 No of beds per 10,000 pop
(equal or more than 10) 2.0
No of operating ambulances
1 No of BEmOC per 500,000 pop
(equal or more than 4) 6.05
Gen Services & Trauma management 33% Maternal and Newborn Health 35%
Child Health and Nutrition 80% Non-communicable & Mental Health 12%
Communicable Diseases 37% Environmental Health 55%
Full service provided Health Unit Health Center Hospital
First Aid and Life support (P12) 4% 32% 86%
Outpatient services with availability of all essential drugs (P13) 11% 7% 57%
Under-5 clinic (P23) 58% 54% 71%
Management of common and endemic diseases (P34) 0% 0% 43%
Skilled childbirth care & early essential newborn care (P423) 7% 24% 100%
Noncommunicable diseases clinic (P51) - full + partial provision 41% 44% 60%
Sana’a
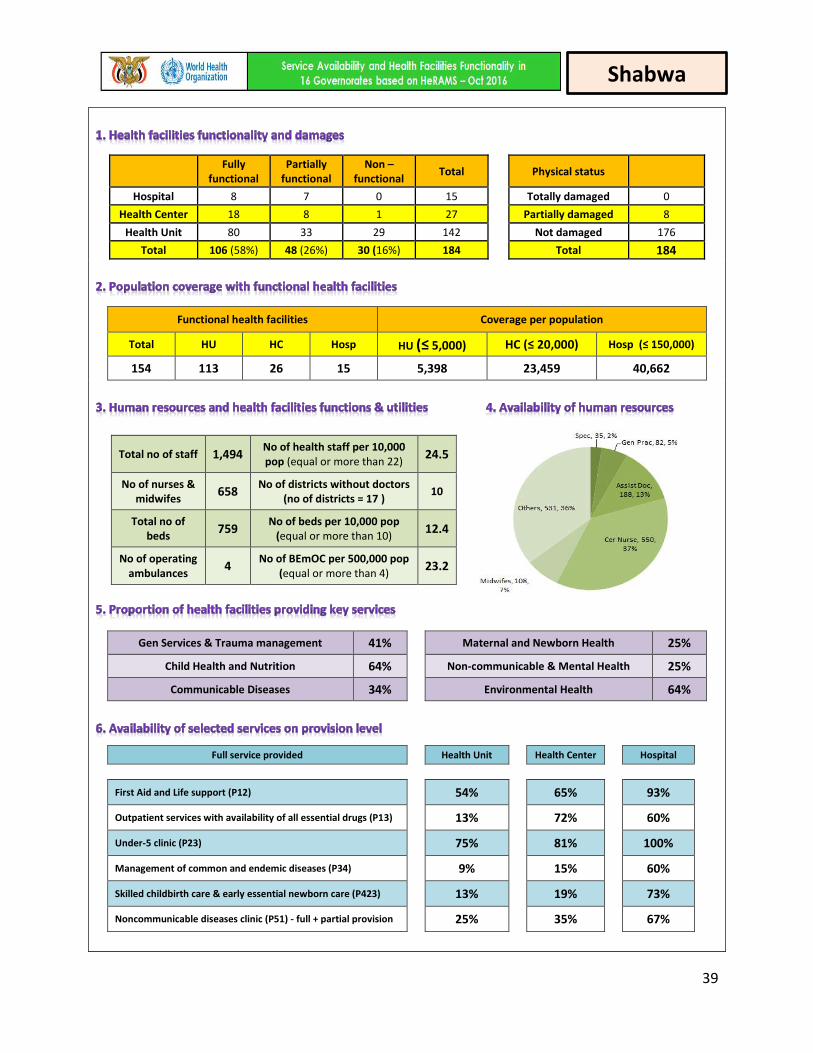
39
Fully
functional Partially
functional Non –
functional Total
Physical status
Hospital 8 7 0 15 Totally damaged 0
Health Center 18 8 1 27 Partially damaged 8
Health Unit 80 33 29 142 Not damaged 176
Total 106 (58%) 48 (26%) 30 (16%) 184 Total 184
Functional health facilities Coverage per population
Total HU HC Hosp HU (≤ 5,000) HC (≤ 20,000) Hosp (≤ 150,000)
154 113 26 15 5,398 23,459 40,662
Total no of staff 1,494 No of health staff per 10,000 pop (equal or more than 22)
24.5
No of nurses & midwifes
658 No of districts without doctors
(no of districts = 17 ) 10
Total no of beds
759 No of beds per 10,000 pop
(equal or more than 10) 12.4
No of operating ambulances
4 No of BEmOC per 500,000 pop
(equal or more than 4) 23.2
Gen Services & Trauma management 41% Maternal and Newborn Health 25%
Child Health and Nutrition 64% Non-communicable & Mental Health 25%
Communicable Diseases 34% Environmental Health 64%
Full service provided Health Unit Health Center Hospital
First Aid and Life support (P12) 54% 65% 93%
Outpatient services with availability of all essential drugs (P13) 13% 72% 60%
Under-5 clinic (P23) 75% 81% 100%
Management of common and endemic diseases (P34) 9% 15% 60%
Skilled childbirth care & early essential newborn care (P423) 13% 19% 73%
Noncommunicable diseases clinic (P51) - full + partial provision 25% 35% 67%
Shabwa
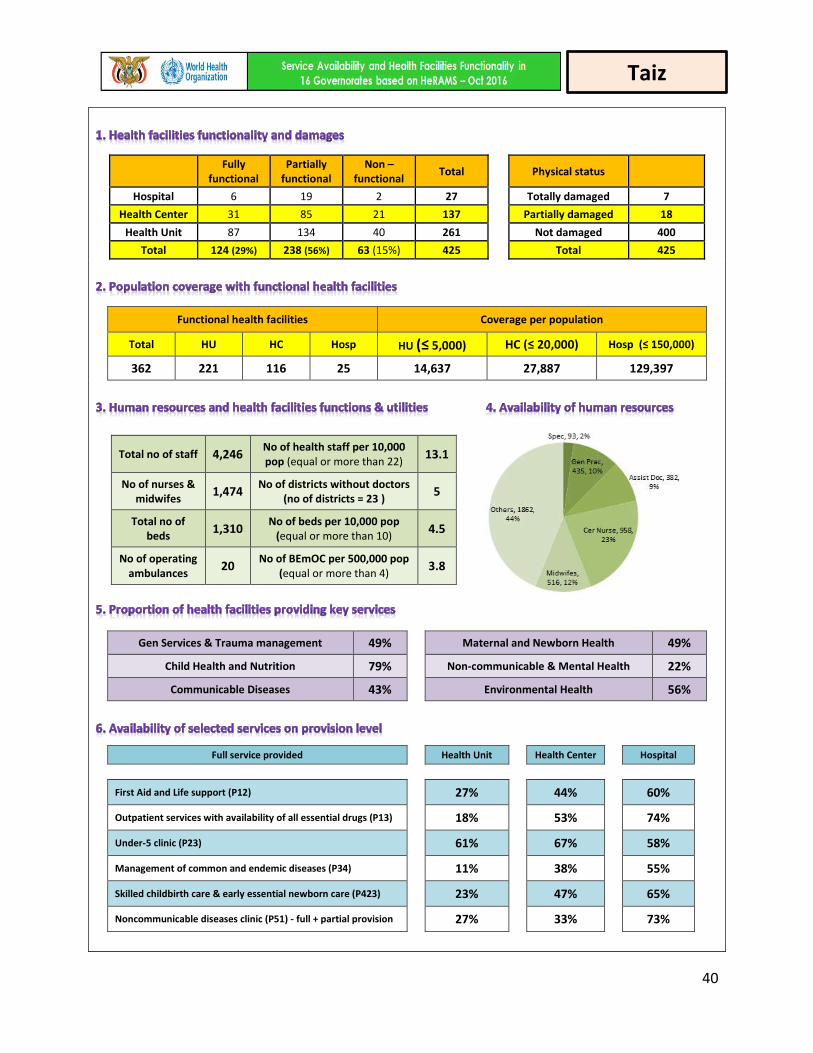
40
Fully
functional Partially
functional Non –
functional Total
Physical status
Hospital 6 19 2 27 Totally damaged 7
Health Center 31 85 21 137 Partially damaged 18
Health Unit 87 134 40 261 Not damaged 400
Total 124 (29%) 238 (56%) 63 (15%) 425 Total 425
Functional health facilities Coverage per population
Total HU HC Hosp HU (≤ 5,000) HC (≤ 20,000) Hosp (≤ 150,000)
362 221 116 25 14,637 27,887 129,397
Total no of staff 4,246 No of health staff per 10,000 pop (equal or more than 22)
13.1
No of nurses & midwifes
1,474 No of districts without doctors
(no of districts = 23 ) 5
Total no of beds
1,310 No of beds per 10,000 pop
(equal or more than 10) 4.5
No of operating ambulances
20 No of BEmOC per 500,000 pop
(equal or more than 4) 3.8
Gen Services & Trauma management 49% Maternal and Newborn Health 49%
Child Health and Nutrition 79% Non-communicable & Mental Health 22%
Communicable Diseases 43% Environmental Health 56%
Full service provided Health Unit Health Center Hospital
First Aid and Life support (P12) 27% 44% 60%
Outpatient services with availability of all essential drugs (P13) 18% 53% 74%
Under-5 clinic (P23) 61% 67% 58%
Management of common and endemic diseases (P34) 11% 38% 55%
Skilled childbirth care & early essential newborn care (P423) 23% 47% 65%
Noncommunicable diseases clinic (P51) - full + partial provision 27% 33% 73%
Taiz
41
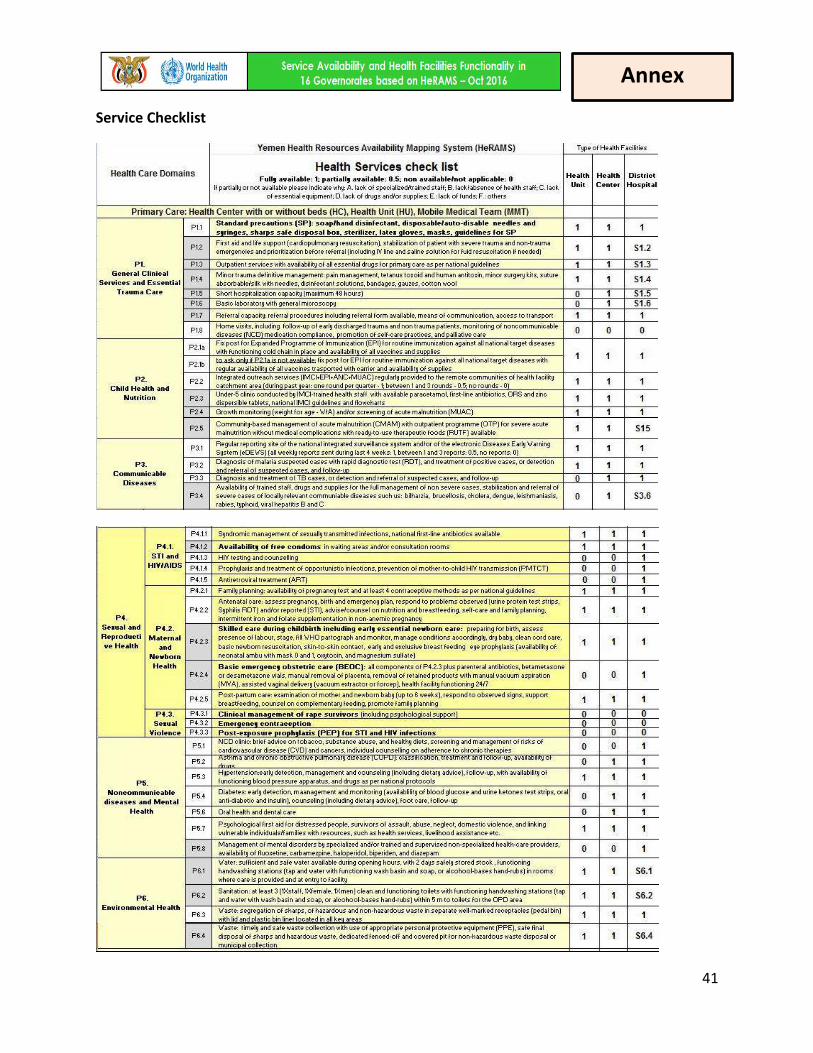
Service Checklist
Annex


![Corp Govn[1]. 14 03 2009](https://img.pdfslide.us/doc/110x75/577d39991a28ab3a6b9a273b/corp-govn1-14-03-2009.jpg)


