Embed Size (px)
Citation preview
Diabetologia (1995) 38:1176-1182
Diabetologia �9 Springer-Verlag 1995
Serum proinsulin levels are disproportionately increased in elderly prediabetic subjects L. Mykki inen 1,2, S. M. Haffner 2, J. Kuusisto 1 , K. Pyiiriilii 1 , C. N. Ha les 3, M. Laakso 1
1 Department of Medicine, University of Kuopio, Kuopio, Finland 2 Division of Clinical Epidemiology, Department of Medicine, University of Texas Health Science Center, San Antonio, Texas,
USA 3 Department of Clinical Biochemistry, Addenbrooke's Hospital, Cambridge, UK
Summary Insulin resistance and impaired insulin se- cretion are thought to be the primary defects in the pathogenesis of non-insul in-dependent diabetes mel- litus (NIDDM). Disproport ionately increased proin- sulin relative to insulin levels are suggested to be an early indicator of a failing pancreas. We examined the relationship of fasting specific insulin, proinsulin, and 32, 33 split proinsulin concentrations, and the proinsulin: insulin ratio to the risk of developing N I D D M 3.5 years later in 65-74-year-old non-dia- betic Finnish subjects participating in a populat ion- based study (n = 892) on diabetes and heart disease. Al together 69 subjects developed N I D D M over a 3.5-year follow-up (cases). The cases were compared to randomly-selected gender-matched control sub- jects (n = 69) and control subjects matched for gen- der, glucose tolerance status (normal or impaired), and body mass index (n = 69). There were no differ- ences in insulin concentrat ions between cases and random or matched control subjects [median and in- terquarti le range; 123 (77-154), 108 (74-143), 118 (83-145) pmol/1, p = 0.271]. R a n d o m control subjects had lower proinsulin and 32,33 split proinsulin con-
centrations and split proinsulin: insulin ratios com- pared to cases [5.7 (3.8-9.0) vs 7.3 (4.8-10.0) pmol/1, p = 0.005; 7.3 (4.5-13.0) vs 10.4 (7.1-18.0)pmol/1, p = 0.002; 0.073 (0.057-0.110) vs 0.097 (0.060-0.135), p = 0.003]. Matched control subjects had lower proin- sulin concentrations and proinsulin: insulin ratios compared to cases [5.9 (4.0-7.7) vs 7.3 (4.8- 10.0) pmol/1, p = 0.019; 0.048 (0.035-0.071) vs 0.064 (0.045-0.100), p = 0.008]. When cases were com- pared to matched control subjects a 1 SD increase in baseline proinsulin: insulin ratio was associated with a 1.37-fold risk (p = 0.020) of developing diabetes. Moreover, this association was independent of fast- ing glucose concentrat ion at baseline. Thus, in el- derly prediabetic subjects disproportionately in- creased proinsulin concentration, an indicator of de- fective insulin secretion, i s associated with conver- sion to diabetes over a short t ime period. [Dia- betologia (1995) 38: 1176-1182]
Key words Proinsulin, insulin, insulin secretion, non- insul in-dependent diabetes mellitus, epidemiology, follow-up study.
Insulin resistance [1-8] and impaired insulin secretion [9-11] are thought to be the primary defects in the pathogenesis of non-insul in-dependent diabetes mel-
Received: 6 July 1994 and in revised form: 4 February 1995
Corresponding author: Dr. L. Mykk~inen, Department of Med- icine, University of Kuopio, R O. Box 1777, FIN-70210 Kuopio, Finland Abbreviations: NIDDM, Non-insulin-dependent diabetes mel- litus; IRI, immunoreactive insulin; OR, odds ratio; CI, confi- dence interval.
litus (NIDDM). Low acute insulin response to intra- venous glucose was not associated with the risk of N I D D M [6] or was only a minor risk factor com- pared to insulin resistance [8] in the two prospective studies which have assessed both insulin resistance and acute insulin response in subjects who subse- quently developed NIDDM. It is, however, not known whether acute insulin response is the optimal measure of insulin secretion. Impaired beta-cell func- tion is manifested in part by disproportionately in- creased proinsulin relative to insulin levels [12]. Sub- jects with N I D D M have a disproport ionate elevation
L. Mykkfinen et al.: Proinsulin in prediabetic subjects
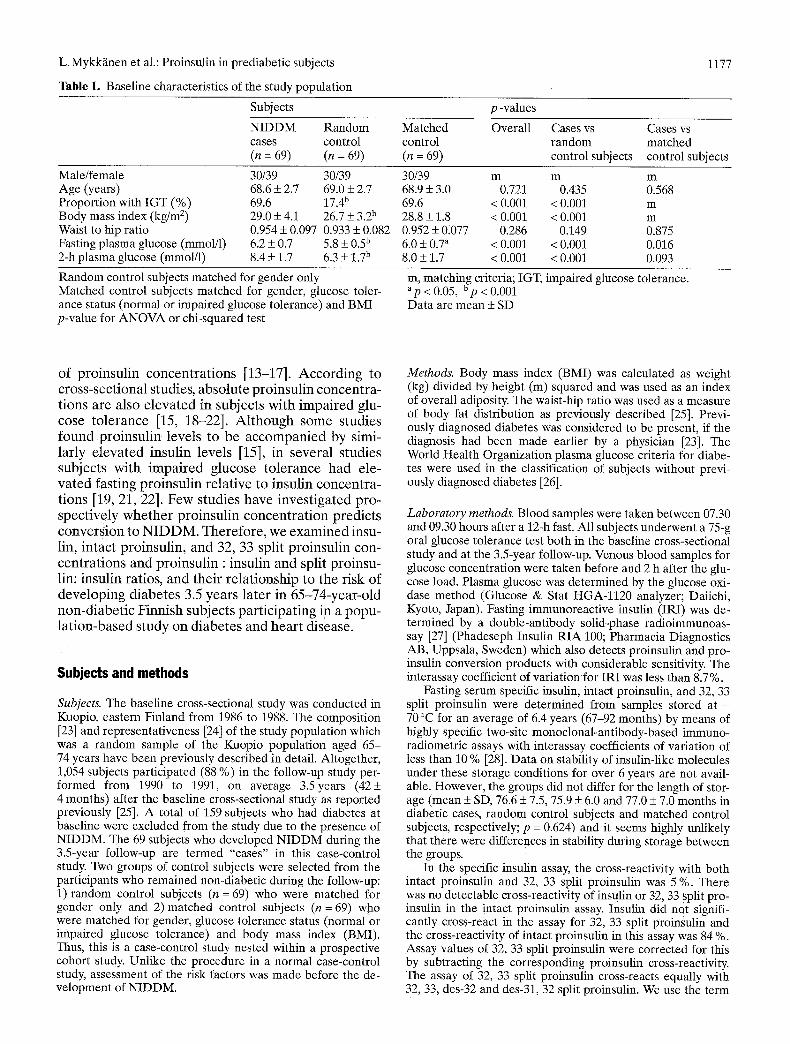
Table 1. Baseline characteristics of the study population
1177
Subjects
NIDDM Random cases control (n = 69) (n = 69)
p -values
Matched Overall Cases vs Cases vs control random matched (n = 69) control subjects control subjects
Male/female Age (years) Proportion with IGT (%) Body mass index (kg/m 2) Waist to hip ratio Fasting plasma glucose (mmol/1) 2-h plasma glucose (mmol/1)
30/39 30/39 68.6 + 2.7 69.0 + 2.7 69.6 17.4 b 29.0 + 4.1 26.7 + 3.2 b 0.954 + 0.097 0.933 + 0.082 6.2 + 0.7 5.8 + 0.5 b 8.4 + 1.7 6.3 _+ 1.7 b
30/39 m m m 68.9 + 3.0 0.721 0.435 0.568 69.6 < 0.001 < 0.001 m 28.8 + 1.8 < 0.001 < 0.001 m 0.952 + 0.077 0.286 0.149 0.875 6.0 + 0.7 a < 0.001 < 0.001 0.016 8.0 + 1.7 < 0.001 < 0.001 0.093
Random control subjects matched for gender only Matched control subjects matched for gender, glucose toler- ance status (normal or impaired glucose tolerance) and BMI p-value for ANOVA or chi-squared test
m, matching criteria; IGT, impaired glucose tolerance. ap < 0.05, Up < 0.001 Data are mean + SD
of proinsul in concen t ra t ions [13-17]. Accord ing to cross-sect ional studies, abso lu te proinsul in concen t ra - t ions are also e l eva ted in subjects wi th i m pa i r e d glu- cose to le rance [15, 18-22]. A l t h o u g h some studies found p ro insu l in levels to be a c c o m p a n i e d by simi- larly e l eva ted insulin levels [15], in severa l s tudies subjects wi th i m p a i r e d glucose to le rance had ele- va t ed fast ing proinsul in re la t ive to insulin concen t ra - t ions [19, 21, 22]. Few studies have inves t iga ted pro- spectivelY w h e t h e r pro insu l in concen t r a t i on predic ts conver s ion to N I D D M . The re fo re , we exam i ned insu- lin, in tact proinsul in , and 32, 33 split pro insul in con- cen t ra t ions and pro insu l in : insulin and split proinsu- lin: insulin ratios, and the i r re la t ionship to the risk of deve lop ing d iabe tes 3.5 years la te r in 65-74-year -o ld non-d iabe t i c Finnish subjects par t i c ipa t ing i~a a popu - l a t ion -based s tudy on d iabe tes and hea r t disease.
Subjects and methods
Subjects. The baseline cross-sectional study was conducted in Kuopio, eastern Finland from 1986 to 1988. The composition [23] and representativeness [24] of the study population which was a random sample of the Kuopio population aged 65- 74 years have been previously described in detail. Altogether, 1,054 subjects participated (88 %) in the follow-up study per- formed from 1990 to 1991, on average 3.5years (42+ 4 months) after the baseline cross-sectional study as reported previously [25]. A total of 159 subjects who had diabetes at baseline were excluded from the study due to the presence of NIDDM. The 69 subjects who developed NIDDM during the 3.5-year follow-up are termed "cases" in this case-control study. Two groups of control subjects were selected from the participants who remained non-diabetic during the follow-up: 1) random control subjects (n--69) who were matched for gender only and 2)matched control subjects (n = 69) who were matched for gender, glucose tolerance status (normal or impaired glucose tolerance) and body mass index (BMI). Thus, this is a case-control study nested within a prospective cohort study. Unlike the procedure in a normal case-control study, assessment of the risk factors was made before the de- velopment of NIDDM.
Methods. Body mass index (BMI) was calculated as weight (kg) divided by height (m) squared and was used as an index of overall adiposity. The waist-hip ratio was used as a measure of body fat distribution as previously described [25]. Previ- ously diagnosed diabetes was considered to be present, if the diagnosis had been made earlier by a physician [23]. The World Health Organization plasma glucose criteria for diabe- tes were used in the classification of subjects without previ- ously diagnosed diabetes [26].
Laboratory methods. Blood samples were taken between 07.30 and 09.30 hours after a 12-h fast. All subjects underwent a 75-g oral glucose tolerance test both in the baseline cross-sectional study and at the 3.5-year follow-up. Venous blood samples for glucose concentration were taken before and 2 h after the glu- cose load. Plasma glucose was determined by the glucose oxi- dase method (Glucose & Stat HGA-1120 analyzer; Daiichi, Kyoto, Japan). Fasting immunoreactive insulin (IRI) was de- termined by a double-antibody solid-phase radioimmunoas- say [27] (Phadeseph Insulin RIA 100; Pharmacia Diagnostics AB, Uppsala, Sweden) which also detects proinsulin and pro- insulin conversion products with considerable sensitivity. The interassay coefficient of variation for IRI was less than 8.7 %.
Fasting serum specific insulin, intact proinsulin, and 32, 33 split proinsulin were determined from samples stored at - 70 ~ for an average of 6.4 years (67-92 months) by means of highly specific two-site monoclonal-antibody-based immuno- radiometric assays with interassay coefficients of variation of less than 10 % [28]. Data on stability of insulin-like molecules under these storage conditions for over 6 years are not avail- able. However, the groups did not differ for the length of stor- age (mean + SD, 76.6 + 7.5, 75.9 + 6.0 and 77.0 _+ 7.0 months in diabetic cases, random control subjects and matched control subjects, respectively; p = 0.624) and it seems highly unlikely that there were differences in stability during storage between the groups.
In the specific insulin assay, the cross-reactivity with both intact proinsulin and 32, 33 split proinsulin was 5 %. There was no detectable cross-reactivity of insulin or 32, 33 split pro- insulin in the intact proinsulin assay. Insulin did not signifi- cantly cross-react in the assay for 32, 33 split proinSulin and the cross-reactivity of intact proinsulin in this assay was 84 %. Assay values of 32, 33 split proinsulin were corrected for this by subtracting the corresponding proinsulin cross-reactivity. The assay of 32, 33 split proinsulin cross-reacts equally with 32, 33, des-32 and des-31, 32 split proinsulin. We use the term
1178 L. Mykk~inen et al.: Proinsulin in prediabetic subjects
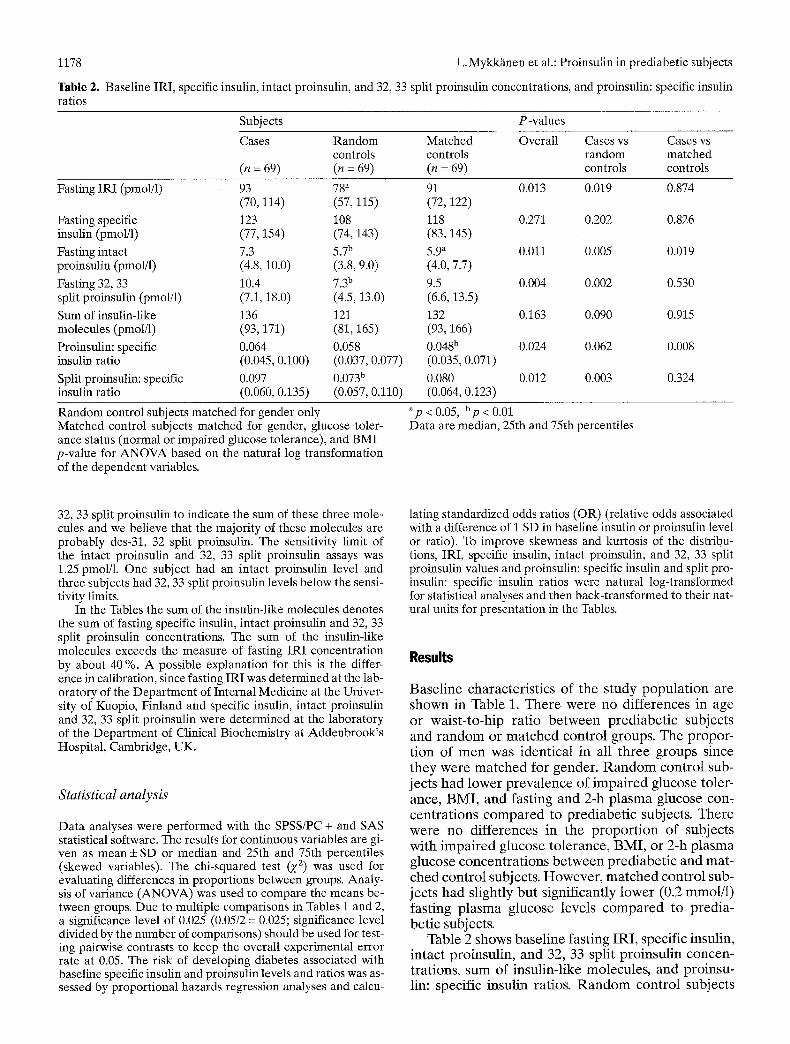
Table 2. Baseline IRI, specific insulin, intact proinsulin, and 32, 33 split proinsulin concentrations, and proinsulin: specific insulin ratios
Subjects P-values
Cases Random Matched Overall Cases vs Cases vs controls controls random matched
(n = 69) (n = 69) (n = 69) controls controls
Fasting IRI (pmol/l) 93 78 a 91 0.013 0.019 0.874 (70, 114) (57, 115) (72, 122)
Fasting specific 123 108 118 0.271 0.202 0.826 insulin (pmol/1) (77, 154) (74, 143) (83, 145)
Fasting intact 7.3 5.7 b 5.9 a 0.011 0.005 0.019 proinsulin (pmol/1) (4.8, 10.0) (3.8, 9.0) (4.0, 7.7)
Fasting 32, 33 10.4 7.3 b 9.5 0.004 0.002 0.530 split proinsulin (pmol/1) (7.1, 18.0) (4.5, 13.0) (6.6, 13.5)
Sum of insulin-like 136 121 132 0.163 0.090 0.915 molecules (pmol/1) (93, 171) (81, 165) (93,166) Proinsulin: specific 0.064 0.058 0.048 b 0.024 0.062 0.008 insulin ratio (0.045, 0.100) (0.037, 0.077) (0.035, 0.071)
Split proinsulin: specific 0.097 0.073 b 0.080 0.012 0.003 0.324 insulin ratio (0.060, 0.135) (0.057, 0.110) (0.064, 0.123)
Random control subjects matched for gender only Matched control subjects matched for gender, glucose toler- ance status (normal or impaired glucose tolerance), and BMI p-value for ANOVA based on the natural log transformation of the dependent variables.
ap < 0.05, bp < 0.01 Data are median, 25th and 75th percentiles
32, 33 split proinsulin to indicate the sum of these three mole- cules and we believe that the majority of these molecules are probably des-31, 32 split proinsulin. The sensitivity limit of the intact proinsulin and 32, 33 split proinsulin assays was 1.25 pmol/1. One subject had an intact proinsulin level and three subjects had 32, 33 split proinsulin levels below the sensi- tivity limits.
In the Tables the sum of the insulin-like molecules denotes the sum of fasting specific insulin, intact proinsulin and 32, 33 split proinsulin concentrations. The sum of the insulin-like molecules exceeds the measure of fasting IRI concentration by about 40 %. A possible explanation for this is the differ- ence in calibration, since fasting IRI was determined at the lab- oratory of the Department of Internal Medicine at the Univer- sity of Kuopio, Finland and specific insulin, intact proinsulin and 32, 33 split proinsulin were determined at the laboratory of the Department of Clinical Biochemistry at Addenbrook's Hospital, Cambridge, UK.
Statistical analysb
Data analyses were performed with the SPSS/PC + and SAS statistical software. The results for continuous variables are gi- ven as mean + SD or median and 25th and 75th percentiles (skewed variables). The chi-squared test (y 2) was used for evaluating differences in proportions between groups. Analy- sis of variance (ANOVA) was used to compare the means be- tween groups. Due to multiple comparisons in Tables i and 2, a significance level of 0.025 (0.05/2 = 0.025; significance level divided by the number of comparisons) should be used for test- ing pairwise contrasts to keep the overall experimental error rate at 0.05. The risk of developing diabetes associated with baseline specific insulin and proinsulin levels and ratios was as- sessed by proportional hazards regression analyses and calcu-
lating standardized odds ratios (OR) (relative odds associated with a difference of i SD in baseline insulin or proinsulin level or ratio). To improve skewness and kurtosis of the distribu- tions, IRI, specific insulin, intact proinsulin, and 32, 33 split proinsulin values and proinsulin: specific insulin and split pro- insulin: specific insulin ratios were natural log-transformed for statistical analyses and then back-transformed to their nat- ural units for presentation in the Tables.
Results
Basel ine characteris t ics of the s tudy popu la t ion are shown in Table 1. T h e r e were no dif ferences in age or waist- to-hip rat io b e tw een pred iabe t ic subjects and r a n d o m or m a t ch ed cont ro l groups. The propor- t ion of m e n was ident ical in all t h ree groups since they were m a t c h e d for gender . R a n d o m contro l sub- jects had lower p reva lence of impai red glucose toler- ance, BMI, and fasting and 2-h p lasma glucose con= cent ra t ions c o m p a r e d to pred iabe t ic subjects. The re were no di f ferences in the p ropo r t i on of subjects with impai red glucose to lerance , BMI , or 2-h p lasma glucose concent ra t ions b e t w e e n pred iabe t ic and mat- ched cont ro l subjects. Howeve r , m a t c h e d cont ro l sub- jects had slightly bu t significantly lower (0.2 mmol/1) fasting plasma glucose levels c o m p a r e d to predia- bet ic subjects.
Table 2 shows basel ine fasting IRI, specific insulin, intact proinsulin, and 32, 33 split proinsul in concen- trations, sum of insulin-like molecules, and proinsu- lin: specific insulin ratios. R a n d o m cont ro l subjects
L. Mykkfinen et al.: Proinsulin in prediabetic subjects
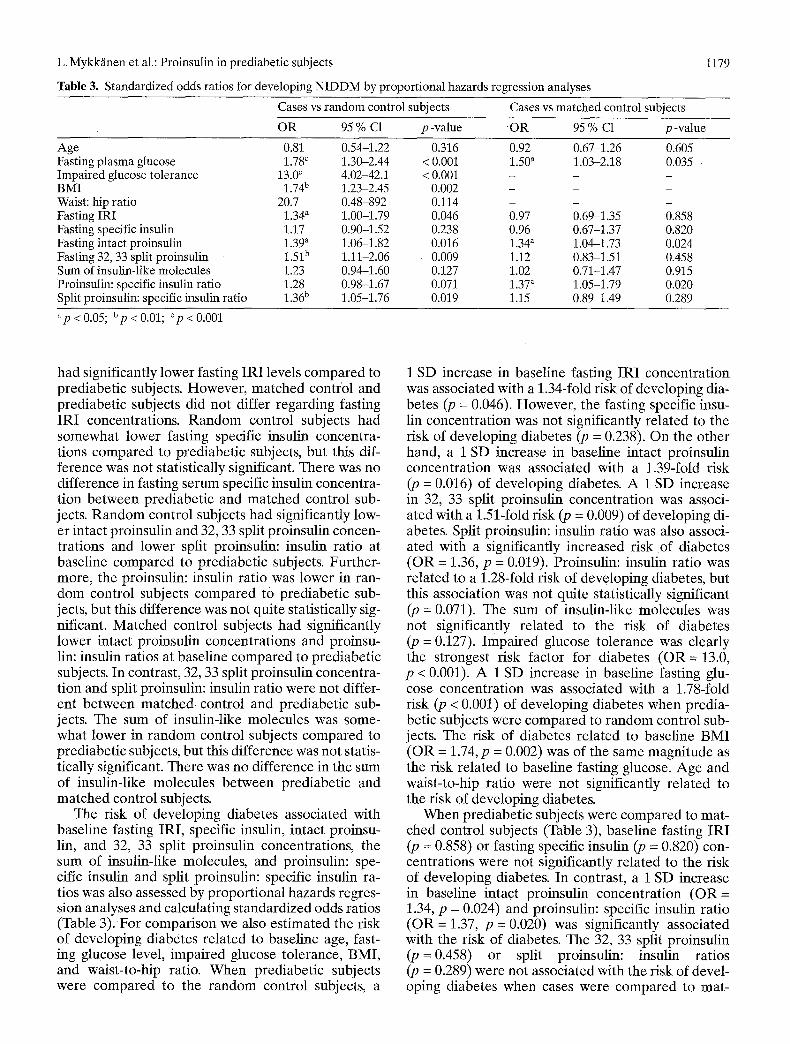
Table 3. Standardized odds ratios for developing NIDDM by proportional hazards regression analyses
1179
Cases vs random control subjects Cases vs matched control subjects
OR 95 % C1 p-value OR 95 % C1 p-value
Age 0.81 Fasting plasma glucose 1.78 c Impaired glucose tolerance 13.0 ~ BMI 1.74 b Waist: hip ratio 20.7 Fasting IRI 1.34 a Fasting specific insulin 1.17 Fasting intact proinsulin 1.39 ~ Fasting 32, 33 split proinsulin 1.51 b Sum of insulin-like molecules 1.23 Proinsulin: specific insulin ratio 1.28 Split proinsulin: specific insulin ratio 1.36 b
0.54-1.22 0.316 0 . 9 2 0.67-1.26 0.605 1.30-2.44 < 0.001 1.50 a 1.03-2.18 0.035 4.02-42.1 < 0.001 - - - 1.23-2.45 0.002 - - - 0.48-892 0.114 - - - 1.00-1.79 0.046 0 . 9 7 0.69-1.35 0.858 0.90-1.52 0.238 0 . 9 6 0.67-1.37 0.820 1.06-1.82 0.016 1.34" 1.04-1.73 0.024 1.11-2.06 0.009 1 .12 0.83-1.51 0.458 0.94-1.60 0.127 1 .02 0.71-1.47 0.915 0.98-1.67 0.071 1.37 ~ 1.05-1.79 0.020 1.05-1.76 0.019 1 .15 0.89-1.49 0.289
ap < 0.05; bp < 0.01; Cp < 0.001
had significantly lower fasting IRI levels compared to prediabetic subjects. However, matched control and prediabetic subjects did not differ regarding fasting IRI concentrations. Random control subjects had somewhat lower fasting specific insulin concentra- tions compared to prediabetic subjects, but this dif- ference was not statistically significant. There was no difference in fasting serum specific insulin concentra- tion between prediabetic and matched control sub- jects. Random control subjects had significantly low- er intact proinsulin and 32, 33 split proinsulin concen- trations and lower split proinsulin: insulin ratio at baseline compared to prediabetic subjects. Further- more, the proinsulin: insulin ratio was lower in ran- dom control subjects compared to prediabetic sub- jects, but this difference was not quite statistically sig- nificant. Matched control subjects had significantly lower intact proinsulin concentrations and proinsu- lin: insulin ratios at baseline compared to prediabetic subjects. In contrast, 32, 33 split proinsulin concentra- tion and split proinsulin: insulin ratio were not differ- ent between ma tched control and prediabetic sub- jects. The sum of insulin-like molecules was some- what lower in random control subjects compared to prediabetic subjects, but this difference was not statis- tically significant. There was no difference in the sum of insulin-like molecules between prediabetic and matched control subjects.
The risk of developing diabetes associated with baseline fasting IRI, specific insulin, intact proinsu- lin, and 32, 33 split proinsulin concentrations, the sum of insulin-like molecules, and proinsulin: spe- cific insulin and split proinsulin: specific insulin ra- tios was also assessed by proportional hazards regres- sion analyses and calculating standardized odds ratios (Table 3). For comparison we also estimated the risk of developing diabetes related to baseline age, fast- ing glucose level, impaired glucose tolerance, BMI, and waist-to-hip ratio. When prediabetic subjects were compared to the random control subjects, a
1 SD increase in baseline fasting IRI concentration was associated with a 1.34-fold risk of developing dia- betes (p = 0.046). However, the fasting specific insu- lin concentration was not significantly related to the risk of developing diabetes (p = 0.238). On the other
h a n d , a 1 SD increase in baseline intact proinsulin concentration was associated with a 1.39-fold risk (p = 0.016) of developing diabetes. A 1 SD increase in 32, 33 split proinsulin concentration was associ- ated with a 1.51-fold risk (p : 0.009) of developing di- abetes. Split proinsulin: insulin ratio was also associ- ated with a significantly increased risk of diabetes (OR = 1.36, p = 0.019). Proinsulin: insulin ratio was related to a 1.28-fold risk of developing diabetes, but this association was not quite statistically significant (p = 0.071). The sum of insulin-like molecules was not significantly related to the risk of diabetes (p = 0.127). Impaired glucose tolerance was clearly the strongest risk factor for diabetes (OR = 13.0, p < 0.001). A 1 SD increase in baseline fasting glu- cose concentration was associated with a 1.78-fold risk (p < 0.001) of developing diabetes when predia- betic subjects were compared to random control sub- jects. The risk of diabetes related to baseline BMI (OR = 1.74, p -- 0.002) was of the same magnitude as the risk related to baseline fasting glucose. Age and waist-to-hip ratio were not significantly related to the risk of developing diabetes.
When prediabetic subjects were compared to mat- ched control subjects (Table 3), baseline fasting IRI (p = 0.858) or fasting specific insulin (p = 0.820) con- centrations were not significantly related to the risk of developing diabetes. In contrast, a 1 SD increase in baseline intact proinsulin concentration (OR = 1.34, p = 0.024) and proinsulin: specific insulin ratio (OR--1.37, p = 0.020) was significantly associated with the risk of diabetes. The 32, 33 split proinsulin (p -- 0.458) or split proinsulin: insulin ratios (p -- 0.289) were not associated with the risk of devel- oping diabetes when cases were compared to mat-
1180 L. Mykkfinen et al.: Proinsulin in prediabetic subjects
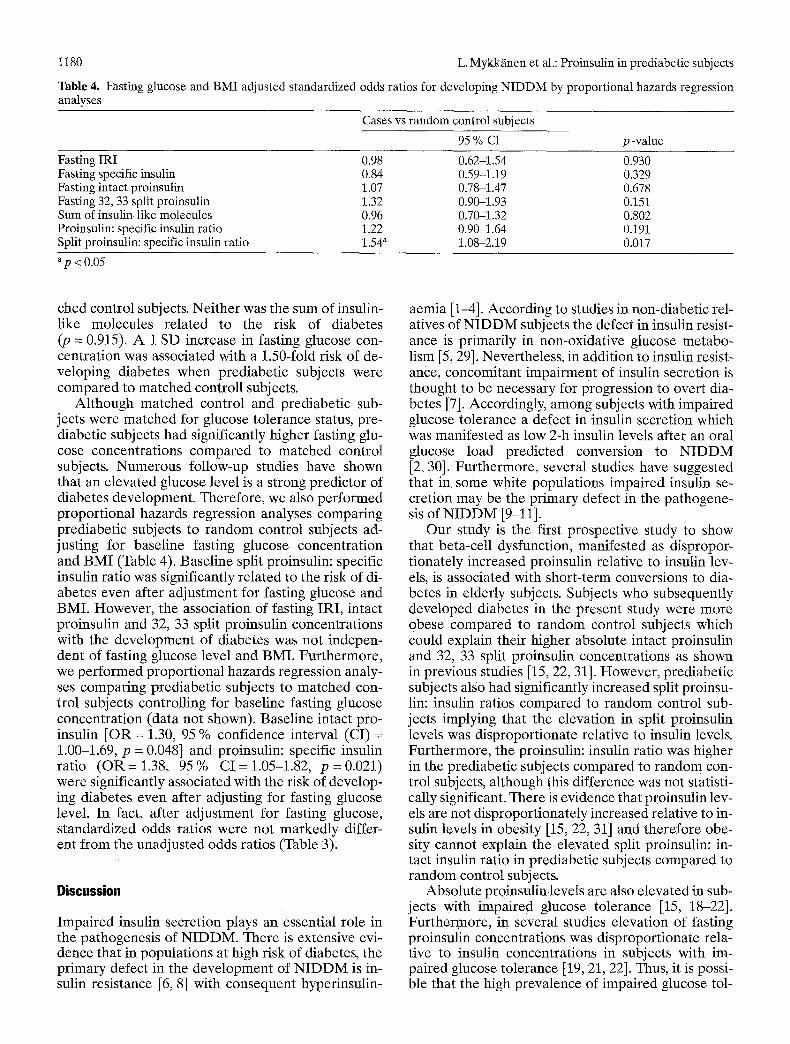
Table 4. Fasting glucose and BMI adjusted standardized odds ratios for developing NIDDM by proportional hazards regression analyses
Fasting IRI Fasting specific insulin Fasting intact proinsulin Fasting 32, 33 split proinsulin Sum of insulin-like molecules Proinsulin: specific insulin ratio Split proinsulin: specific insulin ratio
Cases vs random control subjects
95 % C1 p-value
0.98 0.62-1.54 0.930 0.84 0.59-1.19 0.329 1.07 0.78-1.47 0.678 1.32 0.90-1.93 0.151 0.96 0.70-1.32 0.802 1.22 0.90-1.64 0.191 1.54 a 1.08-2.19 0.017
a p < 0 . 0 5
ched control subjects. Neither was the sum of insulin- like molecules related to the risk of diabetes (p = 0.915). A 1 SD increase in fasting glucose con- centration was associated with a 1.50-fold risk of de- veloping diabetes when prediabetic subjects were compared to matched controll subjects.
Although matched control and prediabetic sub- jects were matched for glucose tolerance status, pre- diabetic subjects had significantly higher fasting glu- cose concentrations compared to matched control subjects. Numerous follow-up studies have shown that an elevated glucose level is a strong predictor of diabetes development. Therefore, we also performed proportional hazards regression analyses comparing prediabetic subjects to random control subjects ad- justing for baseline fasting glucose concentration and BMI (Table 4). Baseline split proinsulin: specific insulin ratio was significantly related to the risk of di- abetes even after adjustment for fasting glucose and BMI. However, the association of fasting IRI, intact proinsulin and 32, 33 split proinsulin concentrations with the development of diabetes was not indepen- dent of fasting glucose level and BMI. Furthermore, we performed proportional hazards regression analy- ses comparing prediabetic subjects to matched con- trol subjects controlling for baseline fasting glucose concentration (data not shown). Baseline intact pro- insulin [OR = 1.30, 95 % confidence interval (CI)= 1.00-1.69, p = 0.048] and proinsulin: specific insulin ratio (OR = 1.38, 95 % CI = 1.05-1.82, p = 0.021) were significantly associated with the risk of develop- ing diabetes even after adjusting for fasting glucose level. In fact, after adjustment for fasting glucose, standardized odds ratios were not markedly differ- ent from the unadjusted odds ratios (Table 3).
Discussion
Impaired insulin secretion plays an essential role in the pathogenesis of NIDDM. There is extensive evi- dence that in populations at high risk of diabetes, the primary defect in the development of NIDDM is in- sulin resistance [6, 8] with consequent hyperinsulin-
aemia [1-4]. According to studies in non-diabetic rel- atives of NIDDM subjects the defect in insulin resist- ance is primarily in non-oxidative glucose metabo- lism [5, 29]. Nevertheless, in addition to insulin resist- ance, concomitant impairment of insulin secretion is thought to be necessary for progression to overt dia- betes [7]. Accordingly, among subjects with impaired glucose tolerance a defect in insulin secretion which was manifested as low 2-h insulin levels after an oral glucose load predicted conversion to NIDDM [2, 30]. Furthermore, several studies have suggested that in some white populations impaired insulin se- cretion may be the primary defect in the pathogene- sis of NIDDM [9-11].
Our study is the first prospective study to show that beta-cell dysfunction, manifested as dispropor- tionately increased proinsulin relative to insulin lev- els, is associated with short-term conversions to dia- betes in elderly subjects. Subjects who subsequently developed diabetes in the present study were more obese compared to random control subjects which could explain their higher absolute intact proinsulin and 32, 33 split proinsulin concentrations as shown in previous studies [15, 22. 31]. However, prediabetic subjects also had significantly increased split proinsu- lin: insulin ratios compared to random control sub- jects implying that the elevation in split proinsulin levels was disproportionate relative to insulin levels. Furthermore. the proinsulin: insulin ratio was higher in the prediabetic subjects compared to random con- trol subjects, although this difference was not statisti- cally significant. There is evidence that proinsulin lev- els are not disproportionately increased relative to in- sulin levels in obesity [15, 22, 31] and therefore obe- sity cannot explain the elevated split proinsulin: in- tact insulin ratio in prediabetic subjects compared to random control subjects.
Absolute proinsulin levels are also elevated in sub- jects with impaired glucose tolerance [15. 18-22]. Furthermore. in several studies elevation of fasting proinsulin concentrations was disproportionate rela- tive to insulin concentrations in subjects with im- paired glucose tolerance [19, 21, 22]. Thus, it is possi- ble that the high prevalence of impaired glucose tol-
L. Mykkfinen et al.: Proinsulin in prediabetic subjects
erance in prediabetic subjects could explain their ele- vated intact proinsulin and 32, 33 split proinsulin con- centrations and proinsulin: specific insulin and split proinsulin: specific insulin ratios compared to ran- dom control subjects. Accordingly, intact proinsulin and 32, 33 split proinsulin concentrations were not significantly related to the risk of diabetes after ad- justing for fasting glucose level and BMI (Table 4). However, the association of split proinsulin: specific insulin ratio with the risk of developing diabetes was independent of baseline fasting glucose level and BMI (Table 4). Furthermore, we also found in this study that prediabetic subjects had elevated intact proinsulin concentrations and proinsulin: insulin ra- tio compard to control subjects matched for glucose tolerance status and BMI. Moreover, the increased risk of developing diabetes associated with baseline intact proinsulin concentration and proinsulin: spe- cific insulin ratio was independent of baseline fasting glucose concentration in prediabetic subjects com- pared to matched control subjects (data not shown). This means that increased proinsulin: insulin ratio in prediabetic subjects was not entirely due to the high prevalence of impaired glucose tolerance or some- what higher fasting glucose concentration compared to matched control subjects but was related to the prediabetic state.
It is unclear why the risk of diabetes was more clo- sely related to the split proinsulin: insulin ratio if pre- diabetic subjects were compared to random control subjects and to proinsulin: insulin ratio if prediabetic subjects were compared to matched control subjects. A possible explanation is that the 32, 33 split proinsu, lin assay is less precise at low serum concentrations than the assay of intact proinsulin. This is due to the 32, 33 split proinsulin assay being inherently a little less sensitive than the assay of intact proinsulin and the need to subtract the intact proinsulin cross-reac- tivity which adds further potential error.
Impaired glucose tolerance was clearly the strong, est risk factor for diabetes in the present study (Ta- ble 3). Fasting glucose level and BMI at baseline were also strong predictors of the development of di- abetes which is in accordance with previous findings [3, 4]. However, baseline proinsulin concentration and proinsulin: specific insulin ratio were essentially as valid as predictors of diabetes risk as was fasting glucose when prediabetic subjects were compared to subjects matched for obesity and impaired glucose tolerance.
We have previously reported [25] that a high fasting IRI level is a risk factor for developing diabetes in the same elderly cohort as this case-control study. That was also the situation in the present case-control study when subjects who subsequently developed dia- betes were compared to random control subjects (Ta- bles 2, 3). Although prediabetic subjects also had somewhat higher fasting specific insulin concentra-
1181
tions than random control subjects, specific insulin concentration was not significantly associated with the risk of developing diabetes. There were no differ- ences in the fasting IRI or specific insulin levels be- tween prediabetic subjects and matched control sub- jects implying that elevated insulin levels in predia- betic subjects were at least partially related to im- paired glucose tolerance and obesity. Accordingly, the association of baseline fasting IRI concentration with the risk of developing diabetes was not indepen- dent of fasting glucose level and BMI when predia- betic subjects were compared to random control sub- jects (Table 4). This contrasts with earlier studies in which fasting IRI concentration predicted the devel- opment of diabetes even after adjustment for obesity [6] or fasting glucose level and obesity [3]. These diver- gent results may be due to the lower power of the nes- ted case-control design of the present study as com- pared to prospective cohort design of the previous studies [3, 6]. Furthermore, our study population was elderly and the follow-up period was only 3.5 years; therefore the lack of association between fasting IRI and specific insulin and subsequent diabetes when prediabetic subjects were compared to matched con- trol subjects in this study may not be generalizable to younger age groups or to longer periods of follow-up. Lastly, we used specific insulin as contrasted to IRI in previous studies. In Tables 2 and 3 fasting IRI was sig- nificantly related to risk of diabetes when cases were compared to random control subjects.
Disproportionately high fasting proinsulin relative to insulin levels in prediabetic subjects could be caused by increased clearance of insulin or decreased clearance of proinsulin. Although the metabolic clear- ance rate of proinsulin is markedly lower compared to insulin [32], in the basal state proinsulin and insulin concentrations are expected to be in equilibrium. Therefore, we only assessed the fasting proinsulin: in- sulin ratio. The disproportionately elevated fasting proinsulin concentration could also be due to hyperse- cretion of proinsulin by secretion of immature proin- sulin-rich granules in beta cells in response to an in- creased demand for insulin [18]. The prediabetic sub- jects were, however, matched with a control group for obesity and impaired glucose tolerance which are both conditions associated with an increased demand for insulin. It is possible that prediabetic subjects had a reduced beta-cell mass which would require in- creased insulin production of each beta cell to main- tain the same degree of insulin output. Finally, hyper- proinsulinaemia in prediabetic subjects could be re- lated to an intrinsic beta-cell defect and impaired pro- cessing of proinsulin or release of insulin [12].
In conclusion, our results show that prediabetic subjects have disproportionately increased proinsu- lin relative to insulin levels but similar specific insu- lin levels compared to matched control subjects. Thus, in elderly prediabetic subjects disproportion-
1182
a te ly inc reased pro insu l in levels, an ind ica tor of de- fec t ive insulin secret ion, was assoc ia ted with conver- sion to d iabe tes ove r a shor t pe r i od of t ime.
Acknowledgements. This work was supported by grants from the Medical Research Council of the Academy of Finland.
References
1. Saad MF, Knowler WC, Pettitt D J, Nelson RG, Mott DM, Bennett PH (1989) Sequential changes in serum insulin concentration during development of non-insulin-depen- dent diabetes. Lancet I: 1356-1359
2. Sicree RA, Zimmet PZ, King HOM, Coventry JS (1987) Plasma insulin response among Nauruans. Prediction of de- terioration in glucose tolerance over 6 yr. Diabetes 36: 179- 186
3. Haffner SM, Stern MR Mitchell BD, Hazuda HP, Patterson JK (1990) Incidence of type II diabetes in Mexican Ameri- cans predicted by fasting insulin and glucose levels, obe- sity, and body-fat distribution. Diabetes 39:283-288
4. Charles MA, Fontbonne A, Thibult N, Warnet J-M, Ross- elin GE, Eschwege E (1991) Risk factors for NIDDM in white population: Paris Prospective Study. Diabetes 40: 796-799
5. Eriksson J, Franssila-Kallunki A, Ekstrand A, Saloranta C, Widen E, Schalin C, Groop L (1989) Early metabolic de- fects in persons at increased risk for non-insulin-depen- dent diabetes mellitus. N Engl J Med 321:337-343
6. Warram JH, Martin BC, Krolewski AS, Soeldner JS, Kahn CR (1990) Slow glucose removal rate and hyperinsuline- mia precede the development of type II diabetes in the off- spring of diabetic parents. Ann Intern Med 113:909-915
7. Saad MF, Knowler WC, Pettitt D J, Nelson RG, Charles MA, Bennett PH (1991) A two-step model for develop- ment of non-insulin-dependent diabetes. Am J Med 90: 229-235
8. Lillioja S, Mott DM, Spraul M e t al. (1993) Insulin resist- ance and insulin secretory dysfunction as precursors of non-insulin-dependent diabetes mellitus. Prospective stud- ies of Pima Indians. N Engl J Med 329:1988-1992
9. Luft R, Wajngot A, Efendic S (1981) On the pathogenesis of maturity-onset diabetes. Diabetes Care 4:58-63
10. O'Rahilly SR Nugent Z, Rudenski AS, Hosker JR Burnett MA, Darling R Turner RC (1986) Beta-cell dysfunction, ra- ther than insulin insensitivity, is the primary defect in famil- ial type 2 Diabetes. Lancet II: 360-364
11. Arner R Pollare T, Lithell H (1991) Different aetiologies of type 2 (non-insulin-dependent) diabetes mellitus in obese and non-obese subjects. Diabetologia 34:483-487
12. Porte D, Kahn SE (1989) Hyperproinsulinemia and amy- loid in NIDDM. Clues to etiology of islet/3-cell dysfunc- tion? Diabetes 38:1333-1336
13. Ward WK, LaCava EC, Paquette TL, Beard JC, Wallum B J, Porte Jr. D (1987) Disproportionate elevation of immu- noreactive proinsulin in type 2 (non-insulin-dependent) di- abetes mellitus and in experimental insulin-resistance. Dia- betologia 30:698-702
14. Temple RC, Carrington CA, Luzio SD, Owens DR, Schnei- der AE, Sobey WJ, Hales CN (1989) Insulin deficiency in non-insulin-dependent diabetes. Lancet I: 293-295
15. Saad MF, Kahn SE, Nelson RG et al. (1990) Disproportion- ately elevated proinsulin in Pima Indians with noninsulin- dependent diabetes mellitus. J Clin Endocrinol Metab 70: 1247-1253
L. Mykkfinen et al.: Proinsulin in prediabetic subjects
16. Clark PM, Levy JC, Cox L, Burnett M, Turner RC, Hales CN (1992) Immunoradiometric assay of insulin, intact pro- insulin and 32, 33 split proinsulin and radioimmunoassay of insulin in diet-treated type 2 (non-insulin-dependent) di- abetic subjects. Diabetologia 35:469-474
17. Davis SN, Piatti PM, Monti L, Brown MD, Branch W, Hales CN, Alberti KGMM (1993) Proinsulin and insulin concentrations following intravenous glucose challenge in normal, obese, and non-insulin-dependent diabetic sub- jects. Metabolism 42:30-35
18. Yoshioka N, Kuzuya T, Matsuda A, Taniguchi M, Iwamoto Y (1988) Serum proinsulin levels at fasting and after oral glucose load in patients with type 2 (non-insulin-depen- dent) diabetes mellitus. Diabetologia 31:355-360
19. Williams DRR, Byrne C, Clark PMS (1991) Raised proin- sulin concentration as early indicator of/3-cell dysfunc- tion. BM1303:95-96
20. Reaven GM, Chen Y-DI, Hollenbeck CB, Sheu WHH, Ostrega D, Polonsky KS (1993) Plasma insulin, C-peptide, and proinsulin concentrations in obese and nonobese indi- viduals with varying degrees of glucose tolerance. J Clin Endocrinol Metab 76:44-48
21. Davies MJ, Rayman G, Gray IR Day IL, Hales CN (1993) Insulin deficiency and increased plasma concentration of intact and 32/33 split proinsulin in subjects with impaired glucose tolerance. Diabet Med 10:313-320
22. Shiraishi I, Iwamoto Y, Kuzuya T, Matsuda A, Kumakura S (1991) Hyperinsulinaemia in obesity is not accompanied by an increase in serum proinsulin/insulin ratio in groups of human subjects with and without glucose intolerance. Dia- betologia 34:737-741
23. Mykk~inen L, Laakso M, Uusitupa M, Py6rfil~i K (1990) Prevalence of diabetes and impaired glucose tolerance in elderly subjects and their association with obesity and fam- ily history of diabetes. Diabetes Care 13:1099-1105
24. Mykkfinen L, Laakso M, Penttilfi I, Py~Srfil~i K (1991) As- ymptomatic hyperglycemia and cardiovascular risk factors in the elderly. Atherosclerosis 88:153-161
25. Mykkfinen L, Kuusisto J, Py6rfil~i K, Laakso M (1993) Car- diovascular disease risk factors as predictors of type 2 (non-insulin-dependent) diabetes mellitus in elderly sub- jects. Diabetologia 36:553-559
26. World Health Organization (1985) Diabetes mellitus. Re- port of a WHO Study Group. (Technical Report Series No. 727). World Health Organization, Geneva
27. Hales CN, Randle PJ (1963) Immunoassay of insulin with insulin antibody precipitate. Biochem J 88:137-146
28. Sobey WJ, Beer SF, Carrington CA et al. (1989) Sensitive and specific two-site immunoradiometric assays for human insulin, proinsulin, 65-66 split and 32-33 split proinsulins. Biochem J 260:535-541
29. Gulli G, Ferrannini E, Stern M, Haffner S, DeFronzo RA (1992) The metabolic profile of NIDDM is fully estab- lished in glucose-tolerant offspring of two Mexican-Ameri- can NIDDM parents. Diabetes 41:1575-1586
30. Saad MF, Knowler WC, Pettitt DJ, Nelson RG, Mott DM, Bennett PH (1988) The natural history of impaired glu- cose tolerance in the Pima Indians. N Engl J Med 319: 1500-1506
31. Koivisto VA, Yki-J~rvinen H, Hartling SG, Pelkonen R (1986) The effect of exogenous hyperinsulinemia on proin- sulin secretion in normal man, obese subjects, and patients with insulinoma. J Clin Endocrinol Metab 63:1117-1120
32. Bergenstal RM, Cohen RM, Lever E et al. (1984) The met- abolic effects of biosynthetic human proinsulin in individu- als with type i diabetes. J Clin Endocrinol Metab 58: 973- 979