Embed Size (px)
Citation preview

series of inancial newsletters, which as the names suggests, ofers an in-depth look at the inances of Ontario.
FO
CU
S O
N F
INA
NC
E 2
| A
LO
OK
INT
O O
NT
AR
IO’S
FIN
AN
CE
SV
ICT
OR
FE
DE
LI


2FOCUS
ON FINANCE A L O O K I N T O O N T A R I O ’ S F I N A N C E S
V I C T O R F E D E L I , M P P
O N T A R I O P C F I N A N C E C R I T I C ISBN 978-0-9739509-4-6


Introduction ...............................................................................................................................................8
Preface ........................................................................................................................................................12
The State of Ontario ...........................................................................................................................18
ENERGY ........................................................................................................................................................19
Ontario Being Led Down Green Garden Path .................................................................................19
Gas Plant Scandal ....................................................................................................................................27
NEW TAXES .................................................................................................................................................33
Pension Tax ................................................................................................................................................36
Carbon Tax .................................................................................................................................................37
RED TAPE .....................................................................................................................................................38
Debt and Deicit ....................................................................................................................................42
THE DRUMMOND REPORT .................................................................................................................45
ONTARIO’S SPENDING ...........................................................................................................................47
California Dreaming; Ontario’s Nightmare ......................................................................................47
My Big Fat Greek Ontario ......................................................................................................................50
Ontario’s Check Engine Light Is On .....................................................................................................51
Why Ontario’s Spiraling Debt Matters ................................................................................................53
Ontario’s Fall Economic Statement: No Plan To Balance ............................................................59
Ontario’s Hidden Deicit ..........................................................................................................................69
Conidential Advice to Cabinet: “No Plan” .........................................................................................78
The so-called “wage freeze” ....................................................................................................................86
No Plan to Retire the “Debt Retirement Charge”..............................................................................91
My Final Thoughts ...............................................................................................................................98


INTRODUCTION

A L o o k i n t o O n t a r i o ’ s F i n a n c e s | I n t r o d u c t i o n
- 8 -
Last year I wrote Focus on Finance, with the hope it would ring the alarm bell in Ontario
to draw attention that all is not right with our inances.
Since that time many individuals, associations, rating agencies, and members of the
media have weighed in – all ringing the same alarm bell.
Just reading this page alone will give you an idea of what is happening with Ontario’s
inances. Drafting the News Releases for each of these issues provided me with the impetus to write Focus on Finance 2.
Since last year, Moody’s debt rating agency changed its outlook from “stable” to
“negative”, expressing their concerns over the government’s ability to eliminate the
deicit in 3 years. They stated, “Ontario’s persistently large deicits, and its tendency to delay the most signiicant cost cutting measures towards the latter years of its projected timeline for returning to a balanced budget, increase the risk that the
province will be unable to achieve its goal”.
The Conference Board of Canada said Ontario can’t meet its pledge to balance the
books by 2017/18 without spending cuts or tax hikes.
The Auditor General said “Ontario’s debt continues to grow faster than the province’s
economy, which could have negative implications for the province’s inances”. She concluded the consequences of high debt include “the ‘crowding out’ of other
spending, greater vulnerability to a rise in interest rates, and a possible downgrading
of the province’s credit rating which would lead to higher future borrowing cost”.
The Ontario Chamber of Commerce titled their report on Ontario’s debt and deicit How Bad Is It? It opens with “Some experts are calling it a crisis and think that the
Government of Ontario should be taking every step possible to balance its books”.
It also states, “Ontario’s iscal situation is becoming increasingly dire ... we are likely to reach a state of crisis unless the province cuts spending and changes the ways it
does business”.
- 9 -
A L o o k i n t o O n t a r i o ’ s F i n a n c e s | I n t r o d u c t i o n
The Fraser Institute’s study, Ontario’s Debt Balloon, calculates that 66 per cent of
the increase in debt since the 2008 recession is directly attributable to day-to-day
expenses exceeding revenues on an annual basis. It states, “Ontario’s debt has grown
by $117 billion since the recession, largely because of government borrowing to fund
day-to-day expenses – not investments in infrastructure”.
Jamison Steeve, of the Institute for Prosperity and Competitiveness and the Martin
Prosperity Institute at University of Toronto, penned a Toronto Star column Ontario
Needs Major Shift to Get Economy on Track. In it he states, “Ontario’s economy is not
producing as much wealth as planned, hoped, or expected. It is time for Ontario to
take a new course to grow the economy”.
The Canadian Federation of Independent Business declared “Ninety-seven per cent
of small businesses are concerned about the state of Ontario’s economy, with 67 per
cent very concerned”. In addition, 91 per cent of small businesses want to see the
provincial budget balanced by 2017/18.
Last summer, I thought the most alarming, and disappointing revelation came during
the reading of the Fall Economic Statement. Charles Sousa, Ontario’s Finance Minister,
confessed that revenue would be down $500 million from his budget forecast – of
only 4 months earlier! How can we trust a word this government says, when they were
half-a-billion dollars of, in only 4 months?
Then, something even more alarming appeared in an answer to a routine ‘Order Paper’
question I posed. I asked for a line-by-line accounting of how the Ministry will balance
the budget by 2017/18. I have been asking for this, because every document from
the Liberal government simply shows a Revenue total, Expense total, and magically
balances in 2017/18, without showing any of the ‘guts’ of the charts. This response
came the same as all the others; no guts, just totals. But it was the wording that
was alarming.

For the last couple of years, the government had been going to great pains to stress
it is “on track” to balance the province’s books by 2017/18. But in the Order Paper
answer, they stated they were “committed” to balancing by 2017/18. That’s a far less
certain statement, and similar to the “aspirational” term the Premier was using last
year, but quickly retreated from. The shift in language suggests there’s a whole lot of
hoping and wishing going on, and not a lot of evidence to back it up.
After all, as you will read in the coming pages, when I was our lead on the Gas Plant
Scandal hearings, we were able to obtain ‘Conidential Advice to Cabinet’ documents that revealed the government is “not on track to meet deicit targets”.
That’s it, simply put, from Premier Kathleen Wynne’s own Ministry of Finance
documents. They are NOT on track to balance.
BUDGET 2015 UPDATE
Just as this book was going to press, the Finance Minister announced the deicit for Ontario will come in at $10.9 billion. He announced this as great news for Ontario,
because the deicit was forecast to be $12.5 billion. Now before you join the fanfare, there are two facts you need to review. First, the deicit in 2013 was $9.2 billion, it grew to $10.5 billion last year, and has grown to $10.9 billion this year – we’re going
the wrong way – there’s nothing to celebrate here! Secondly, as the chart on page 15
illustrates, two years ago the announced deicit was actually forecast at $10.5 billion – $400 million lower! But last year, the government lufed up the forecast to $12.5 billion so they could announce they beat their estimate, rather than be forced to
announce that they had failed miserably.
This is the kind of slight-of-hand the government uses when it comes to reporting
numbers.
This is another reason why I wrote this book – Focus on Finance presents the
government’s own insider documents to give you a real look into Ontario’s inances.
A L o o k i n t o O n t a r i o ’ s F i n a n c e s | I n t r o d u c t i o n
- 1 0 -

PREFACE

- 1 2 -
A L o o k i n t o O n t a r i o ’ s F i n a n c e s | P r e f a c e
This morning more than 500,000 men and women in Ontario woke up without a job.
Caterpillar. Wrigley’s. Heinz. These are all companies that announced they’re shutting
their Ontario operations and heading for greener pastures. Oh, they’re still making,
earth moving equipment, chewing gum, and ketchup. They’re just not making them in
Ontario anymore.
With Ontario boasting amongst the highest energy prices in North America, the highest
payroll taxes in Canada, over 8 years with unemployment higher than the national
average, and a government about to institute a carbon tax and a pension tax, is it any
wonder companies are abandoning Ontario in record numbers? There were 2,700 fewer small businesses in Ontario last year compared to the year before. In addition,
other companies are bypassing Ontario as they search for a place to set up shop.
What happened to this once-powerful province; the envy of all Canada?
Ontario, once the economic engine of Confederation, has become a ‘have-not’
province, now relying on $3 billion in annual equalization payments from the federal
Government. Jason Kirby of Maclean’s magazine, called the government’s strategy
“a hodgepodge of hope, pray, and blame Ottawa.” In fact, according to the Globe
and Mail’s Bill Curry, Ontario will get an additional $1.25 billion in transfer payments
this year, bringing their total to $20.4 billion: the most of any province. Before this
Liberal Government took oice in Ontario, we had a low debt-to-GDP ratio. Low unemployment. Cheap hydro. Less red tape. But look at what’s happened over the
past decade.
Skyrocketing energy rates. New taxes. Crushing red tape. A job-killing trifecta!
Families open their hydro bills to ind they are now paying amongst the highest electricity prices in North America. Businesses, which in the past set up shop in Ontario
for our cheap hydro, are leaving in record numbers. Hydro rates have more than
tripled in 11 years and last year the government told us they will increase a further 42
per cent by 2018.
A L o o k i n t o O n t a r i o ’ s F i n a n c e s | P r e f a c e
- 1 3 -
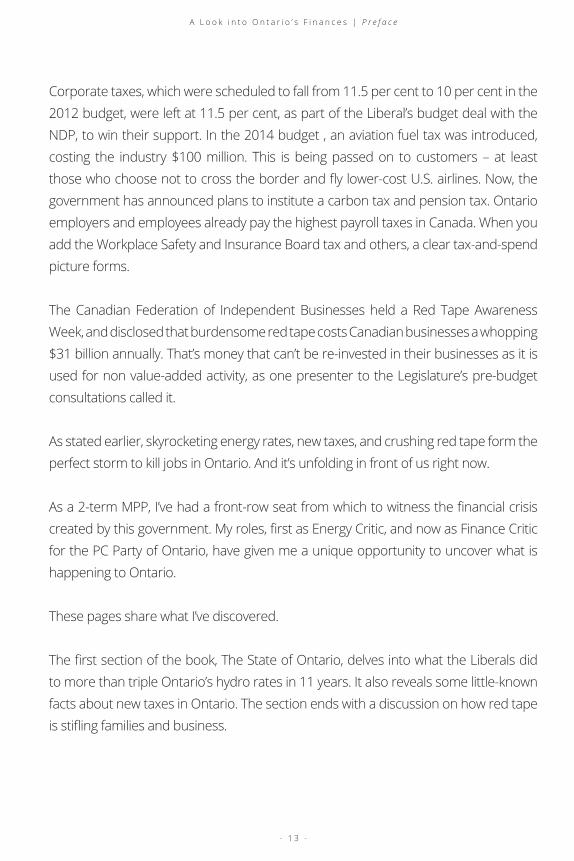
Corporate taxes, which were scheduled to fall from 11.5 per cent to 10 per cent in the
2012 budget, were left at 11.5 per cent, as part of the Liberal’s budget deal with the
NDP, to win their support. In the 2014 budget , an aviation fuel tax was introduced,
costing the industry $100 million. This is being passed on to customers – at least
those who choose not to cross the border and ly lower-cost U.S. airlines. Now, the government has announced plans to institute a carbon tax and pension tax. Ontario
employers and employees already pay the highest payroll taxes in Canada. When you
add the Workplace Safety and Insurance Board tax and others, a clear tax-and-spend
picture forms.
The Canadian Federation of Independent Businesses held a Red Tape Awareness
Week, and disclosed that burdensome red tape costs Canadian businesses a whopping
$31 billion annually. That’s money that can’t be re-invested in their businesses as it is
used for non value-added activity, as one presenter to the Legislature’s pre-budget
consultations called it.
As stated earlier, skyrocketing energy rates, new taxes, and crushing red tape form the
perfect storm to kill jobs in Ontario. And it’s unfolding in front of us right now.
As a 2-term MPP, I’ve had a front-row seat from which to witness the inancial crisis created by this government. My roles, irst as Energy Critic, and now as Finance Critic for the PC Party of Ontario, have given me a unique opportunity to uncover what is
happening to Ontario.
These pages share what I’ve discovered.
The irst section of the book, The State of Ontario, delves into what the Liberals did to more than triple Ontario’s hydro rates in 11 years. It also reveals some little-known
facts about new taxes in Ontario. The section ends with a discussion on how red tape
is stiling families and business.
- 1 4 -
A L o o k i n t o O n t a r i o ’ s F i n a n c e s | P r e f a c e
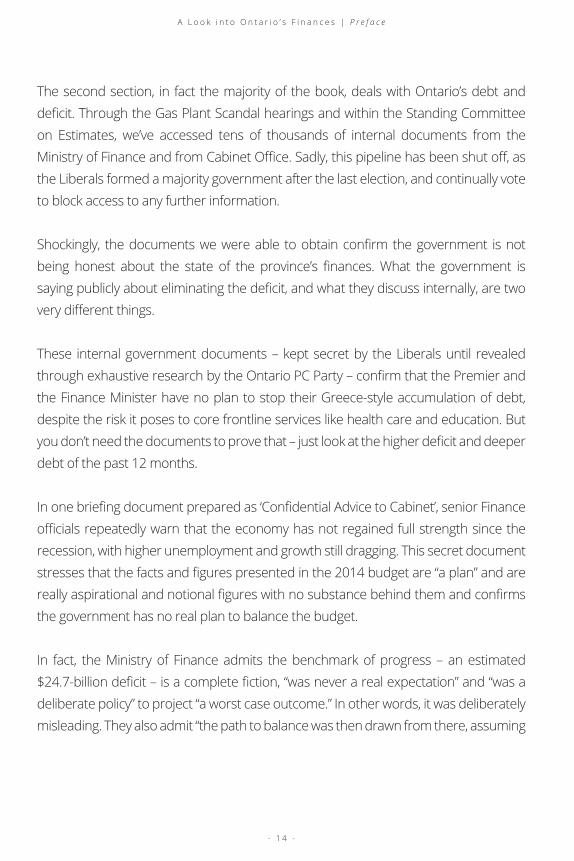
The second section, in fact the majority of the book, deals with Ontario’s debt and
deicit. Through the Gas Plant Scandal hearings and within the Standing Committee on Estimates, we’ve accessed tens of thousands of internal documents from the
Ministry of Finance and from Cabinet Oice. Sadly, this pipeline has been shut of, as the Liberals formed a majority government after the last election, and continually vote
to block access to any further information.
Shockingly, the documents we were able to obtain conirm the government is not being honest about the state of the province’s inances. What the government is saying publicly about eliminating the deicit, and what they discuss internally, are two very diferent things.
These internal government documents – kept secret by the Liberals until revealed
through exhaustive research by the Ontario PC Party – conirm that the Premier and the Finance Minister have no plan to stop their Greece-style accumulation of debt,
despite the risk it poses to core frontline services like health care and education. But
you don’t need the documents to prove that – just look at the higher deicit and deeper debt of the past 12 months.
In one brieing document prepared as ‘Conidential Advice to Cabinet’, senior Finance oicials repeatedly warn that the economy has not regained full strength since the recession, with higher unemployment and growth still dragging. This secret document
stresses that the facts and igures presented in the 2014 budget are “a plan” and are really aspirational and notional igures with no substance behind them and conirms the government has no real plan to balance the budget.
In fact, the Ministry of Finance admits the benchmark of progress – an estimated
$24.7-billion deicit – is a complete iction, “was never a real expectation” and “was a deliberate policy” to project “a worst case outcome.” In other words, it was deliberately
misleading. They also admit “the path to balance was then drawn from there, assuming

A L o o k i n t o O n t a r i o ’ s F i n a n c e s | P r e f a c e
- 1 5 -
a straight-line trajectory of declining deicits”, and “it was assumed that spending would be constrained to whatever it takes to hit these targets.” Essentially, someone laid a
ruler across a graph, drew a straight line, and that’s the extent of the government’s
plan to balance the budget. They also divulged, “Over the medium-term, we have
notional targets by sector that add up to the deicit numbers, but not yet full plans to deliver on them. For the extended outlook, neither sector targets nor plans yet exist”.
The once-secret document concludes “in order to hit the deicit targets, spending growth going forward has to decrease dramatically”. But as we’ve seen, that restraint
never materialized.
Even after the irst Liberal-NDP budget of 2012 received credit rating downgrades from Standard & Poor and Moody’s Investor Service, the Liberals continued to rack
up debt. The documents warn that Ontario is the biggest single borrower among
all states and provinces globally, and even if the government backed of its 2017-18 target for balancing the budget, it wouldn’t do any good – even adding “6 more years”
to the timeline.
Ontario’s Fiscal Targets to Balance
(Fis
cal B
alan
ce $
Bil
lio
ns)
‘09-10 ‘10-11 ‘11-12 ‘12-13 ‘13-14 ‘14-15 ‘15-16 ‘16-175
-
(5.0)
(10.0)
(15.0)
(20.0)
(25.0)
‘17-18
ACTUAL MEDIUM-TERM OUTLOOK EXTENDED OUTLOOK
0.5
(12.6)
(10.5)
(7.2)
(3.5)
(15.9)(17.3)
(19.7)
(24.7)

- 1 6 -
A L o o k i n t o O n t a r i o ’ s F i n a n c e s | P r e f a c e
The Liberal government has no plan to shift course from their race to the bottom.
Jamison Steeve, Executive Director of the Institute for Prosperity and Competitiveness
and the Martin Prosperity Institute at the University of Toronto, wrote in the Toronto
Star, “Basically, Ontario’s economy is not producing as much wealth as planned, hoped
or expected.” The report went on to say: “Ontario’s prosperity gap with its North
American peers is going in the wrong direction. In 2013, Ontario slipped to 15th out
of 16 peer jurisdictions on GDP per capita. Furthermore, the prosperity gap increased
by $180 from last year and now stands at $11,180. What does this mean? It means less money in the pockets of regular Ontarians. And it means less money in the public
cofers to purchase the public goods that can improve the lives of all Ontarians.”
Rating agencies signaled their concern last year by downgrading Ontario. In July,
relecting the growing debt burden and subdued growth outlook, Moody’s Investors Service changed the outlook on Ontario’s debt rating from stable to negative, afecting approximately $250 billion in debt securities. After failing to heed the rating agencies’
spring warnings, the province was again downgraded by Fitch Ratings in December
2014 from AA to AA-, saying “diicult actions” will be necessary for the province to achieve its target of eliminating the annual deicit. In February, Moody’s again warned Ontario about its debt burden, reporting that the province will have a more diicult time than Quebec achieving a balanced budget and paying down debt. They forecast
that by the end of the year Ontario’s government debt would equal around 244 times
its total revenue.
It’s time the Premier comes clean to the Legislature and the people of Ontario. She has
been saying there is a plan in place, while her own senior Finance oicials plead with her that it’s not the case.

THE
STATE OF
ONTARIO

- 1 8 -
A L o o k i n t o O n t a r i o ’ s F i n a n c e s | T h e S t a t e o f O n t a r i o
The majority of these pages will discuss Ontario’s debt and deicit, and be illed with many numbers. So to ease you into it, let’s start with a few anecdotal stories mixed in
with some cold hard facts.
In January, 2014 and again in 2015, my Legislative colleagues and I toured Ontario in a
series of pre-budget consultations and inance roundtables. All three parties met with business groups, social advocacy groups, and individuals. After visiting over one dozen
cities, from Fort Erie to Fort Francis, a deinite theme arose. Skyrocketing energy rates. New taxes. Crushing red tape.
We certainly knew that skyrocketing energy was a very important issue, and I’m going
to spend the next 14 pages on that topic.
Given that the Liberals have planned to institute a carbon tax and a pension tax, we
also suspected that these new taxes would dominate the conversation – and they did!
We’ve also been hearing from a lot of businesses that red tape is killing them, but the
biggest surprise was hearing that from the social organizations as well.
It quickly became apparent that all is not well in Ontario. Let’s start with energy.

- 1 9 -
A L o o k i n t o O n t a r i o ’ s F i n a n c e s | T h e S t a t e o f O n t a r i o
ENERGY
In 2011, after serving my irst three months as PC Energy Critic, it was apparent that while energy rates had doubled, they were about to skyrocket. The Auditor General
had just presented his scathing report on the Green Energy Act and the Liberals
showed no sign of changing course. I put pen to paper and in January 2012 the
following column was published in Ontario newspapers.
Ontario Being Led Down Green Garden Path
Sitting in the Mayor’s chair in North Bay for seven years aforded me plenty of opportunity to interact with provincial politicians. I raised an eyebrow a couple
years ago when I irst heard an MPP use the expression “dirty coal” at a non-energy announcement. Then I noticed each Liberal MPP worked the phrase into their
speeches, regardless of the topic. As a life-long marketing executive, I cracked
a smile, knowing that this spin was laying the groundwork for the real hit. That
came in 2009, in the form of a document entitled The Green Energy Act (GEA).
The stated purpose was to ‘green’ Ontario’s energy sector through conservation
and renewable energy generation. To ensure that no one got in its way, the
Government removed all municipal planning powers over the development of
renewable energy generation.
In many ways the GEA put the desires of the renewable power industry ahead of
the needs of Ontario businesses and electricity consumers.
For instance, when you neutralize the municipality (the public’s only forum to ight a rezoning), toss around phrases like “dirty coal” (which stiles naysayers), and put a ‘green’ label on it (which minimizes opposition), you’ve got a perfect storm for
procedural abuses, failed iscal oversight, and gross misuse of taxpayer dollars.
Now, as a newly-elected MPP and PC Energy Critic, I’ve spent the past three
months meeting with industry stakeholders from all sides, assessing the GEA.

- 2 0 -
A L o o k i n t o O n t a r i o ’ s F i n a n c e s | T h e S t a t e o f O n t a r i o
It will be no surprise to anyone who pays a hydro bill, that I believe the GEA to be
a complete disaster. What may surprise you are some of the people who agree
with that assessment. Here’s a quick recap of what has happened with power,
under Premier Dalton McGuinty.
The Feed-in-Tarif (FIT) Program pays out massive subsidies for wind and solar contracts to produce power we don’t need. This continues to drive up the cost
of electricity – it rose 26 per cent between 2008 and 2010. It is projected to rise
another 46 per cent by 2014.
Even McGuinty knew what would happen next. Years earlier, while serving as
Energy Critic he stated, “I am not going out on much of a limb when I say there is a
direct correlation between hydro rates and our rate of unemployment in Ontario.
As the rates go up, so will the rate of unemployment.”
As a result of skyrocketing energy prices, manufacturing plants, forestry mills,
and mineral processors close and move to where they ind cheaper power. In Timmins, a city of 43,000, Xstrata Copper axed 672 employees and moved just
across the border to set up shop in Quebec, where hydro is cheaper. It afected another 4,000 employees province-wide.
In total, Ontario has lost 300,000 manufacturing jobs in recent years. This has
resulted in even lower demand for hydro, and we now generate far more power
than needed. Unlike a commodity, you can’t store electricity. So we pay the U.S.
and Quebec to take this surplus power of our hands. We’ve paid them $1.8 billion over the past six years; $420 million in the irst 10 months of 2011 alone. Their industries use this cheap power to compete even harder with our manufacturers,
and so the downward spiral continues.
If the province stays on this current path, your hydro bills are going to increase
dramatically.
- 2 1 -
A L o o k i n t o O n t a r i o ’ s F i n a n c e s | T h e S t a t e o f O n t a r i o
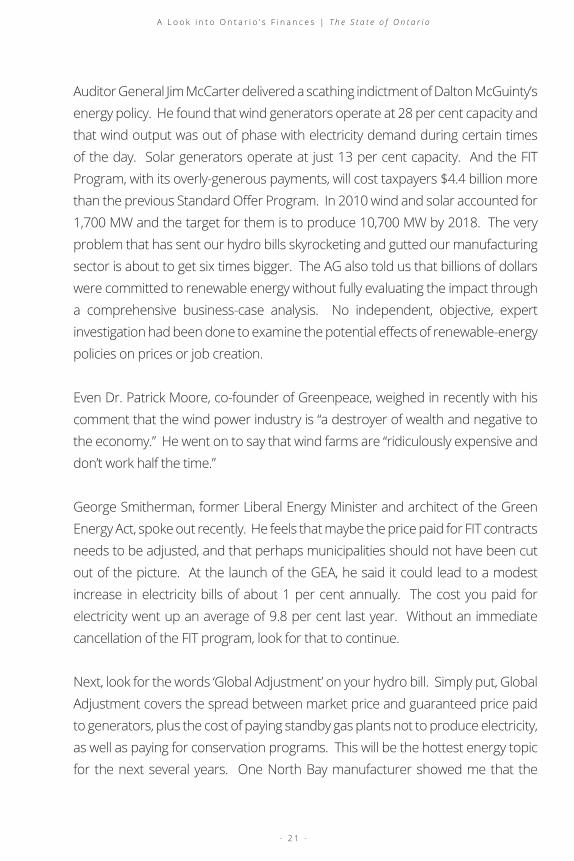
Auditor General Jim McCarter delivered a scathing indictment of Dalton McGuinty’s
energy policy. He found that wind generators operate at 28 per cent capacity and
that wind output was out of phase with electricity demand during certain times
of the day. Solar generators operate at just 13 per cent capacity. And the FIT
Program, with its overly-generous payments, will cost taxpayers $4.4 billion more
than the previous Standard Ofer Program. In 2010 wind and solar accounted for 1,700 MW and the target for them is to produce 10,700 MW by 2018. The very
problem that has sent our hydro bills skyrocketing and gutted our manufacturing
sector is about to get six times bigger. The AG also told us that billions of dollars
were committed to renewable energy without fully evaluating the impact through
a comprehensive business-case analysis. No independent, objective, expert
investigation had been done to examine the potential efects of renewable-energy policies on prices or job creation.
Even Dr. Patrick Moore, co-founder of Greenpeace, weighed in recently with his
comment that the wind power industry is “a destroyer of wealth and negative to
the economy.” He went on to say that wind farms are “ridiculously expensive and
don’t work half the time.”
George Smitherman, former Liberal Energy Minister and architect of the Green
Energy Act, spoke out recently. He feels that maybe the price paid for FIT contracts
needs to be adjusted, and that perhaps municipalities should not have been cut
out of the picture. At the launch of the GEA, he said it could lead to a modest
increase in electricity bills of about 1 per cent annually. The cost you paid for
electricity went up an average of 9.8 per cent last year. Without an immediate
cancellation of the FIT program, look for that to continue.
Next, look for the words ‘Global Adjustment’ on your hydro bill. Simply put, Global
Adjustment covers the spread between market price and guaranteed price paid
to generators, plus the cost of paying standby gas plants not to produce electricity,
as well as paying for conservation programs. This will be the hottest energy topic
for the next several years. One North Bay manufacturer showed me that the

- 2 2 -
A L o o k i n t o O n t a r i o ’ s F i n a n c e s | T h e S t a t e o f O n t a r i o
Global Adjustment, nonexistent on their 2009 hydro bills, is now $1,700/month,
while their electricity charge is $1,400/month. Another hometown company’s
annual Global Adjustment is seven igures – for a line-item they never factored into their budgets. The Global Adjustment is expected to increase tenfold, from
$700 million in 2006 to $8.1 billion in 2014. This will certainly cause more Ontario
manufacturers to close up shop and move to cheaper locales.
Also, watch for the Smart Meter charges to hit home. Environment Commissioner
Gord Miller weighed in recently, reminding us that reducing peak demand was the
prime driver for introducing smart meters in the irst place, yet there is no data to show if it’s helping consumers conserve. The computer system that runs the
Smart Meters cost $250 million, and the bill is now due. Your local utility will be
adding 75 cents a month to repay that purchase. And where a traditional meter
costs 65 cents to read, these electronic meters cost $1.50 plus another 90 cents
for the towers and controllers. In addition, your local utility will be adding a $1.50
monthly fee to pay for their share of the $1 billion spent on the actual Smart
Meter units. Total it all up and you’ll see a further $4.00 a month added to your
bill this year.
Let’s not forget the cancellation of the Oakville power plant and cancelling,
demolishing, and relocating the Mississauga power plant. These cancellations
were nothing more than political ‘seat savers’ and may cost taxpayers $1 billion.
That bill will come due this year, followed by the bill for the new plants, once the
government igures out where to locate them. This comes at a time when industry experts are questioning the reliability of the GTA power grid.
The path this government is on will continue to be destructive to Ontario. By
contrast, the PC Party will get rid of the fantasy energy world of the GEA. We will
end the unnecessary and unnecessarily rich subsidies to the few in the renewables
industry and go back to a power system built to supply the people of the province
with reasonably priced electricity.

- 2 3 -
A L o o k i n t o O n t a r i o ’ s F i n a n c e s | T h e S t a t e o f O n t a r i o
Remember, that column was written at the end of 2011 – it’s remarkable how accurate
those predictions were – especially the billion dollar prediction of the gas plant
cancellations and Global Adjustment hitting $8 billion by 2014 (it reached $7.7 billion)!
Any government paying attention would have known the inancial mess it created.
What we saw was a government with a social engineering plan in mind – the Green
Energy Act. When this disaster started, Ontario produced 25 per cent of its energy from
green energy – water power – the cleanest, greenest, most reliable and afordable source of renewable energy. Now, several years and $50 billion later, Ontario still
produces 25 per cent from green energy; 22 per cent from water and 3 per cent from
wind (Ontario Energy Board, January 2015). There is absolutely nothing green about
their version of green energy.
Since writing that column, a few more facts have surfaced, including more details
on the Global Adjustment charge. The Auditor General pointed out wind generators
operate at 28 per cent capacity and wind makes energy mostly at night when we don’t
need the extra power. So we have been paying Quebec and the U.S. to take that
surplus power. In her recent report, the Auditor General estimates that between 2006
and 2013 the revenue from selling surplus power was $2.6 billion lower than what it
cost Ontario ratepayers to produce it. Whenever wind does blow during the day, and
power is produced, the government is contracted to take that power. But not knowing
whether wind would generate power that day, they would have already contracted for
all the power they needed. So they spill water over Niagara Falls onto idle generators,
costing us about $300 million annually not to produce power.
And when that reduction is maxed out, they turn to nuclear plants, and redirect the
steam away from the generators and vent it outside. That little exercise, done on ive diferent days last year, cost the ratepayers $80 million. Add together the $500 million lost to Quebec and the U.S., the $300 million in spilled water, and the $80 million
in vented steam, and that’s almost $1 billion in extra payments due to wind power,

- 2 4 -
A L o o k i n t o O n t a r i o ’ s F i n a n c e s | T h e S t a t e o f O n t a r i o
or ‘the law of unintended consequences’. In fact, the Auditor General estimates that
between 2006 and 2015 Ontario ratepayers will have paid $50 billion to cover the cost
of paying generators a premium for their output compared to what it would sell for on
the province’s wholesale electricity market.
Wind proponents will quickly tell you that because only 3 per cent of Ontario’s
power came from wind, it was not their fault your hydro bills skyrocketed. They
are not accounting for the above-explained money wasted as a consequence of
wind-generated power contracts; and that’s the billion dollars added to the Global
Adjustment. When all this started, electricity sold for 4.3 cents per kilowatt hour in
2003. Today, at peak times of day, energy sells for 14.4 cents per kilowatt hour – more
than triple the 2003 hydro rates.
The Auditor’s General are not alone in their concerns. Here are some worldwide
headlines: Italy Cuts Solar Subsidy; Dutch Pull Plug on Wind Subsidies; UK Solar
Subsidies Slashed; Germany Slashes FIT; and Spain Halts Renewable Subsidies to
Curb $31 Billion of Debts.
The Auditor General stated the FIT program loses two to four manufacturing jobs for every
so-called green job created.
While other jurisdictions are realizing what a disaster this has been, Ontario is still
doubling down. When the column was written, wind and solar accounted for 1,700
megawatts of power, and the target was to produce 10,700 megawatts by 2018. The
very problem that has sent your hydro bills skyrocketing and gutted our manufacturing
sector was set to get six times bigger! Because of so much community pushback
on these installations, whether for health concerns, property values, environmental
reasons, and a whole host of community activism, there has been a partial retreat
and the target has been re-set down to about 6,500 megawatts. However, there’s no
comfort in knowing the problem is only going to be four times greater!
“

- 2 5 -
A L o o k i n t o O n t a r i o ’ s F i n a n c e s | T h e S t a t e o f O n t a r i o
The retreat by the Energy Minister to reduce FIT subsidies and give token input to
municipalities is an admission their energy plan is a failed social experiment. But
reducing the subsidies will NOT solve the problem. The Liberals will still be spilling
water, venting steam, and draining jobs into Quebec and the U.S.
While the government claimed the Green Energy Act would create 50,000 jobs, the
Auditor General stated the FIT program loses two to four manufacturing jobs for every
so-called green job created. In Timmins, Xstrata Copper, Ontario’s single-largest user
of power, moved their smelter 115 kilometers across the border into Quebec, lured
by low hydro rates, and terminated their 672 Ontario employees. This should have
been a warning to the government. Instead, we now have hundreds more examples
of companies leaving Ontario for cheaper power, and there are more added every
single day.
There are also companies that simply will not locate in Ontario because of our high
hydro rates. The Montreal Gazette revealed that Innovation Metals, a Toronto-based
irm, announced plans to set up the world’s irst independent centralized rare-earth ore separation plant in Becancour, Quebec. The company chose the location over
several potential sites in Ontario citing Quebec’s low industrial power rate as a major
factor. It’s estimated the rare-earth metals reinery will require an investment of more than $200 million and the creation of about 300 new jobs. Furthermore, according to
a recent Ring of Fire report released by the Ontario Chamber of Commerce, current
electricity rates make it so there is no business case to locate a ferrochrome smelter
or stainless steel plant in the province.
Clearly, the province’s competitiveness sufers from its high electricity prices for industrial users. But it’s also afecting the commercial sector, according to a Canadian Federation of Independent Business survey. The report stated “97 per cent of small
businesses are concerned about the current state of Ontario’s economy, with 67 per
cent very concerned.” It also stated “93 per cent wanted the government to reduce
energy costs”.

- 2 6 -
A L o o k i n t o O n t a r i o ’ s F i n a n c e s | T h e S t a t e o f O n t a r i o
In December, 2014 we learned that the government’s green energy project has gone
even more of track. The Auditor General released her annual report outlining how the overall costs related to implementing smart metering in Ontario had reached $1.9
billion – twice the original estimate. The report also noted that the government’s stated
objective of reducing power demand at peak times is not being met. The Minister of
Energy, Bob Chiarelli, shocked reporters after Auditor General Bonnie Lysyk presented
her annual report by stating, “Why are my numbers more credible than hers? First, the electricity system is very complex, is very diicult to understand”, suggesting the Auditor General, who had a decade of experience at Manitoba Hydro, an MBA, and CPA
designation, just didn’t get it. Most recently, the program was awarded the provincial
‘Teddy’ award from the Canadian Taxpayers Federation for government waste.
Professor Ian Lee of Ottawa’s Sprott School of Business summarized Ontario’s energy
situation in a Toronto SUN article. “Over the last eight years, the government of
Ontario has squandered an energy-competitive advantage that keeps the province
competitive with northeastern U.S. states, such as New York, Pennsylvania, Michigan,
and Ohio,” he said. Failed Liberal policies mean we’ve lost that competitive edge. “The
government squandered it to drive up energy prices by subsidizing people at 10 times
above the market price to put in solar panels to produce a surplus of electricity –
that we didn’t need in the irst place – which we then sold at a loss to the Americans to exacerbate the competitive advantage we have handed them by squandering our
cost advantage on energy,” he said.
We’ll give the last word on this to Carol Goar of the Toronto Star, as she sums up
the Liberal’s Green Energy Act. “The rollout was costly and ill-conceived. It drove up
electricity prices, undermined public support for wind and solar power, riled rural
Ontarians, and left a trail of aggrieved investors and producers”.

- 2 7 -
A L o o k i n t o O n t a r i o ’ s F i n a n c e s | T h e S t a t e o f O n t a r i o
Gas Plant Scandal
Any chapter on energy wouldn’t be complete without mentioning the Liberal Gas Plant
Scandal. It tells you all you really need to know about what is in the heart of, and what
drives the Liberal Party of Ontario and the McGuinty-Wynne Government. Ontarians
wanted to know the answers to two key questions – how much did the cancelling of
the two gas plants cost, and who ordered the cover-up. The Auditor General answered
the irst question, but we still don’t have the answer to the second. It shouldn’t have to take an OPP criminal investigation and the threat of jail doors slamming to get that
answer. Unfortunately, while Premier Kathleen Wynne continues to talk about being
open and transparent, she is doing the exact opposite.
Using her new majority government, she has shut down the Gas Plant Scandal
committee, not allowing the inal witnesses to appear. Meanwhile, two OPP search warrant applications have been released conirming that deliberate eforts were made to keep government information secret. The documents name Premier McGuinty’s former Chief of Staf and several other key stafers in the former Premier’s oice as complicit in deleting vital Gas Plant Scandal Documents.
You may ind a little hyperbole and vitriol in these next couple of pages. After all, as the PC lead for most of the Gas Plant Scandal, I had a front-row seat. Working through
summer and winter Legislative breaks, with daily meetings and twice-weekly televised
Hearings, we faced an entrenched Liberal opposition. Premier Dalton McGuinty
mocking me didn’t help. After I irst announced in the Legislature that this would be another “billion dollar scandal”, the then-Premier responded in the London Free Press,
“I am waiting for the day when somebody says, ‘Actually it’s $400 trillion’. What was the
latest number? $1.3 billion? Do I hear 1.7? When are we going to get to 2.8? It’s kind of an interesting game. In total we are talking a $230-million cost.”
By $230 million, he was referencing the $190 million for Mississauga and $40 million for
Oakville the Liberals claimed was the total cost to Ontarians. The two Auditors General
released their indings which proved it actually cost $275 million for Mississauga and

- 2 8 -
A L o o k i n t o O n t a r i o ’ s F i n a n c e s | T h e S t a t e o f O n t a r i o
$815 million for Oakville – totaling $1.1 billion, the estimate we announced in 2012,
which the now-disgraced former Premier mocked!
A little history
It was in October, 2010 when the Liberals cancelled a contracted gas power plant in
Oakville. Then in September, 2011, with Kathleen Wynne as co-chair of the Liberal
election campaign, a decision was made just days before the election to cancel a
similar but smaller plant already under construction in Mississauga. There was public
opposition to both plants in the locations where they were supposed to be built from
day one. The Liberals didn’t listen and forged ahead. It was only when they realized
they could lose ive seats in the 2011 election that they changed course. Kathleen Wynne herself has admitted the cancellations were “a political decision.” As we now
know, Ontarians are paying dearly for this latest Liberal scandal, to the tune of $1.1
billion.
While the Oakville plant never broke ground, there was an approved contract.
Documents released to the Standing Committee on Justice show the political
considerations that led to the decision to cancel the plant in 2010. They also detail
meetings between senior staf in the Premier’s oice in which the proponent believed they were promised to be “made whole” – or compensated for the full value of their
20-year contract. When then Energy Minister Brad Duguid met with the proponent
two days before the announced cancellation, he had no idea such a deal had been
ofered. He was out of the loop. Documents show the proponents then “blew a gasket” and told Duguid to “go talk to your bosses”.
This set in motion months of negotiations. At one point, a deal was in place to move
the plant to Cambridge, but it was never consummated. The most telling document
is the one showing that in April, 2011, the proponent had rejected a second counter-
ofer worth $712 million. This was key because when the Premier tried to tell Ontarians the Oakville cancellation only cost $40 million in September, 2012, it wasn’t logical or
believable. No one is going to turn down a $712 million ofer to settle for $40 million.
- 2 9 -
A L o o k i n t o O n t a r i o ’ s F i n a n c e s | T h e S t a t e o f O n t a r i o
Later we would learn that Cabinet, with Kathleen Wynne as Chair and with her
signature on the document, would sign of on “Project Vapour” – essentially a process that wrote a blank cheque in order to reach a deal. In essence, the deal was to move
from the court system into a private arbitration venue where the proceedings and the
results would be kept secret. In order to secure an agreement, the Liberals waived
valid defences and gave up the beneit of judicial limits on damages. The Liberals hid the majority of the settlement costs on the hydro bill, while only talking publicly about
the much smaller taxpayer portion of the costs.
Cabinet, with Kathleen Wynne as Chair and with her signature on the document, would sign of on“Project Vapour” – essentially a process that wrote
a blank cheque in order to reach a deal.
While the Oakville plant never broke ground, the Mississauga plant was already partly
built when that cancellation was announced. But construction continued on the site
for nearly two months as the proponent had a contract, and intended to fulill it. Construction only stopped after the Government made concessions in 10 “side deals”,
as the Auditor General phrased it. These questionable side deals drove up the cost of
the Mississauga cancellation. The Government irst insisted the cost was $180 million, then $190 million. The Auditor put the inal cost at $275 million, because those side deals added another $85 million onto hydro bills.
In both cases, the costs were driven up because of where the Liberals, and Liberals
alone, decided to relocate the gas plants. The Mississauga plant is now to be built in
Lambton, while the Oakville plant is to be constructed near Napanee. Because they’re
being moved so far away from where the power is needed – the southwest Greater
Toronto Area – and in the case of Napanee, far from the source of the natural gas, the
costs soared dramatically. The Auditor General testiied before the Justice Committee that the Liberal decision to move the Oakville plant so far away from where the power
is needed, was responsible for $513 million in added costs – nearly half of the total
scandal cost!
“
- 3 0 -
A L o o k i n t o O n t a r i o ’ s F i n a n c e s | T h e S t a t e o f O n t a r i o
Just getting the documents to piece together the real story of this scandal revealed
the true nature of what drives the Ontario Liberals. In May, 2012, my former colleague
MPP Rob Leone of Cambridge asked the Energy Minister a simple question before the
Estimates Committee – what did it cost to cancel the Oakville and Mississauga power
plants? The Minister refused to provide an answer. So a motion was passed compelling the government to turn over documents related to the cancellations within two weeks.
The deadline came and went – no documents. This was our irst clue the government had something to hide – and as time would show us, had lots to hide.
Only under the threat of being found in Contempt of the Legislature did the Energy
Minister inally release the documents four months after the initial request. At that time, we were told we had all the gas plant documents. Then, two weeks later, shockingly
we received another 20,000. Mr. McGuinty shut down the Legislature and resigned as
premier three days later setting the stage for Ms. Wynne to take over. We would later
hear sworn testimony that an Energy Ministry stafer with long-held Liberal ties, was sent to the Ontario Power Authority to instruct them to withhold certain documents.
Then in February 2013, even more documents came forward. And later, even more.
The total, according to Premier Wynne, is now over 300,000 – that’s 18 months after
being told the 36,000 were all the documents!
It was testimony to the Justice Committee that helped reveal the most unseemly side
to this story. The former Chief of Staf to the Energy Minister admitted he regularly deleted emails. We now had proof that there was indeed a cover-up, as we alleged
from the day they tried to pawn of the 36,000 documents as ‘everything’. That led to an investigation by the Privacy Commissioner, who revealed there had been
a widespread attempt by senior staf in the Premier’s oice to delete and destroy records. She concluded “laws had been broken.”
I called the OPP to report a crime – the theft of data belonging to the people of Ontario.
MPP Rob Leone and I wrote to the Commissioner of the Ontario Provincial Police
to ile a criminal complaint. In the year since, OPP investigators have visited Premier Wynne’s oice, executed a search warrant at a data storage warehouse, executed a

- 3 1 -
A L o o k i n t o O n t a r i o ’ s F i n a n c e s | T h e S t a t e o f O n t a r i o
Wynne. We’re still waiting for those emails to be produced and now they likely never
will be.
The cover-up is more sinister than the original cancellation
of the gas plants.
The most sobering lesson of the gas plant scandal may be this – if the Liberals had
won just one more seat in the 2011 election, none of this would have ever come to
light. The Liberals would have retained their majority. Any attempt at Committee to
get documents would have been voted down by the Liberals; the Gas Plant Scandal
hearings would never have happened. The Liberals have tried to stall, delay, and
thwart us at every turn in our bid to get to the truth. They cannot be trusted. They
have consistently put their own interests, and the interests of the Liberal Party, ahead
of the people of Ontario. And now, using her majority government, Kathleen Wynne
has shut down the Gas Plant Scandal Committee and we may never get to the truth.
“
further search warrant, and have recently been awarded a warrant to explore a senior
government oicial’s BlackBerry.
As a result of information obtained from the irst warrant, the OPP allege the former Chief of Staf to the Premier instructed the boyfriend of his Deputy to wipe 24 computers within the Premier’s oice. To accomplish this, he’s alleged to have provided the boyfriend with global access to override passwords.
As a result of information obtained from the second warrant, the OPP told us $10,000
of taxpayer funds was paid to this boyfriend to delete the Gas Plant Scandal iles. The Liberal Party of Ontario repaid the $10,000 – an admission they did pay to
destroy evidence.
Sadly, the government still has refused to turn over many more documents the now
defunct Committee had requested. They’ve admitted there are thousands of back-up
tapes where deleted emails relating to the gas plant scandal could be located, but still
have not produced them. More than 1,200 of those back-up tapes belong to Kathleen

- 3 2 -
A L o o k i n t o O n t a r i o ’ s F i n a n c e s | T h e S t a t e o f O n t a r i o
While we still search for answers regarding the cover-up, we do know this self-serving
act cost the people of Ontario – as taxpayers and as ratepayers – an astounding $1.1
billion. Part of that cost has already shown up on our skyrocketing hydro bills, and
more will be added as the terms of settlement dictate.
The two Auditors General who were involved stated it best. In referencing the
Mississauga Gas Plant cancellation, AG Jim McCarter stated, ‘The people of Ontario
will have essentially paid for two power plants, but have just got one.” On the Oakville
Power Plant cancellation, AG Bonnie Lysyck said, “The gas plant cancellations cost
“signiicantly more than may have been necessary” because of a number of what she calls “questionable decisions” by the Premier’s oice.

- 3 3 -
A L o o k i n t o O n t a r i o ’ s F i n a n c e s | T h e S t a t e o f O n t a r i o
NEW TAXES
Liberals love to tax and spend. They believe it is good for the economy to add a Health
Tax or HST – remember it was supposed to add 600,000 jobs! They believe it’s their
privilege to spend your money on things like wind energy, ORNGE, cancelling gas
plants, and bailing out the MaRS real estate deal. Sadly they continue to spend more
than they take in, so they have borrowed annually and grown out debt. The increased
taxes and debt load have burdened the economy to the point we have lost 300,000
manufacturing jobs in the past decade and have seen 8 years with unemployment
higher than the national average.
There are a number of other factors at play. You’ve just read how we got to the highest
energy prices in North America. We have the highest payroll taxes in Canada. Our
corporate taxes, which were scheduled to fall from 11.5 per cent to 10 per cent in
the 2012 budget, were left at that level, as part of the Liberal’s deal with the NDP, to
win their support. But with so much Liberal spending in place, it’s still not enough
revenue. Two years ago the deicit was $9.2-billion. Last year it grew to $10.5-billion. And this year, the deicit skyrocketed to $10.9-billion. Our debt-to-GDP is scheduled to hit 41.2%.
There are a few other new taxes you may not have heard about yet. At the beginning
of 2013, the Workplace Safety and Insurance Board required independent contractors
and operators to pay WSIB coverage, even though most already have cheaper and
better private insurance. Mandatory coverage for the construction industry under
Ontario’s workers’ compensation system is tantamount to a tax on small businesses,
independent trades people, and contractors. This is cutting into the earnings of
small businesses and contractors, and for some, it could be the straw that breaks
their inancial backs. The legislation forces independent operators, sole proprietors, partners in a partnership, and executive oicers of corporations in the construction industry, to now pay WSIB premiums. This is a tax on hard-working Ontarians designed
to cover up the Liberal government’s mess; a $14-billion unfunded liability at the WSIB.

- 3 4 -
A L o o k i n t o O n t a r i o ’ s F i n a n c e s | T h e S t a t e o f O n t a r i o
Last year I held a news conference in my constituency oice where local woodworker Steve Ciglen, painter Brent Tremblay, and general contractor John Best, were on
hand. They all said they have long held private insurance that ofers more extensive coverage and have nothing to gain from handing over a portion of their earnings
to the WSIB. “This is a form of legal extortion,” said Tremblay, describing the bill as
“ugly” and “oppressive.” He said the legislation, which requires him to pay premiums
of between 7% and 8% on his own income, couldn’t have come at a worse economic
time. And Tremblay said additional costs for businesses will translate into higher prices
for customers.
Best said most independent operators like himself, who already have insurance,
aren’t likely to make a WSIB claim against their own businesses. And the three local
tradesmen also agreed that most independent operators will likely hang onto their
existing insurance despite Bill 119, making the legislation that much more of an
expense. Ciglen said his policy ofers a rebate minus his claims after 20 years. And Best said his rates are based on a long history with his carrier – something he doesn’t want
to lose, especially in light of eforts to repeal the legislation. The three local tradesmen argue the law will only help to fuel the underground economy with cash-strapped
operators and customers wanting to keep prices low.
If you really want to shake investor conidence, you can do what the Liberal government did to raise taxes in their 2007 budget. They made a sudden change to the tax structure
for diamond mines, very close to the start of production at the Victor Mine, Ontario’s
irst and only diamond mine. The diamond royalty, which works like income tax, would range 5% to 13% depending on annual production values.
At the time of the budget announcement, De Beers Canada had already invested
approximately one billion dollars in the construction of the Victor Project, which was
scheduled to start production in 2008. The De Beers Board and shareholders approved
the Victor Project budget based on current policies and tax regimes including the ixed 5% Mining Tax Act rate for developments in the far north.

- 3 5 -
A L o o k i n t o O n t a r i o ’ s F i n a n c e s | T h e S t a t e o f O n t a r i o
When the Liberals formed the government in 2003, Ontario was ranked the #1
mining jurisdiction in the world. Today we have fallen to #23. Is it any wonder? The government brought in the Far North Act, which cuts of half of Northern Ontario from exploration. This has caused many mining companies to pull up stakes in Ontario and
head elsewhere where a more mining-friendly regime exists. You may have heard of
the Ring of Fire. It’s a mineral-rich area of land, about 300 km due west of Attawapiskat,
rich with chromite (used in making stainless steel). Thankfully, it was discovered before
the Far North Act was brought in, or we may never have found that site.
The Government proposed to introduce a diamondroyalty system after De Beers Canada had alreadyinvested approximately one billion dollars in the
construction of the Victor Project.
I have toured the camps in the Ring of Fire on four occasions. While I was excited in
2011, it’s depressing to visit there now. On my recent trip there were fewer than a
dozen people working; down from over 250 at its peak. The problem? This government has dithered on participating with the infrastructure development. One company had
invested over $700 million on the project. They have since left – not just the Ring of
Fire, but have closed all their oices in Ontario. Another company has spent over $200 million drilling and delineating their ore body. They are ready to go into production.
Sadly, on my last trip, they were down to a skeleton staf. When I asked why they were no longer drilling, they replied, “Why should we continue to spend our shareholder’s
dollars when there’s no way to get the ore out to the market?”
Not only are the threats of new taxes and slow government response cited as reasons
for lack of development in the Ring of Fire, but the CFIB also indicates red tape, in
the form of the de facto moratorium on exploration permits, as a logjam that must
be cleared. With all of these factors taken together, it is not surprising that the
Frasier Institute’s Mining Survey ranked Ontario 23rd internationally in terms of its
attractiveness for mining – a drop of nine spots from a year ago.
“

- 3 6 -
A L o o k i n t o O n t a r i o ’ s F i n a n c e s | T h e S t a t e o f O n t a r i o
This March, the Ontario Chamber of Commerce released a scathing report on the
Ring of Fire. They call on the government of Ontario to “act now” to develop the region.
They gave the province a failing grade for their lack of infrastructure and permitting
delays, allowing activity and investment to grind to a halt. The Chamber warns, “Ontario
needs to move quickly on development of the stalled Ring of Fire…or risk losing huge
economic beneits”.
Eight years have passed since this discovery of the century, and the government has
done nothing (except hint that they may implement a Chromite Tax once the mines
get into production). In my home town of North Bay, we had 66 mining and machining
companies, primarily engaged in the exploration ield. They supplied a lot of products to the Ring of Fire. Now that exploration has halted, many companies have had
massive layofs, and one company moved to New Brunswick for their lower business taxes, lower payroll taxes, and much lower energy costs!
Pension Tax
The government’s Ontario Retirement Pension Plan (ORPP) is a wide-reaching payroll
tax that will negatively afect businesses across Ontario and drive jobs out of the province. Maclean’s magazine’s Jason Kirby summed up the ORPP stating that “…while
the details are still fuzzy, the plan will impose new payroll taxes on those businesses
that don’t already ofer a workplace pension plan the government deems satisfactory. In short: bigger government and higher taxes. No wonder the Wynne government has
to pay companies to move to Ontario.”
The CFIB has come out strongly against the proposed ORPP on behalf of their
members, stating that 86 per cent of small business owners surveyed did not
support the plan. What’s more concerning is that 69 per cent of these owners would
freeze or cut salaries and 53 per cent would reduce their number of employees if
the plan were implemented. A new survey of businesses from the Ontario Chamber
of Commerce also indicates that only 26 per cent of businesses believe they can
shoulder the inancial burden associated with the ORPP. In their survey, 44 per cent of

- 3 7 -
A L o o k i n t o O n t a r i o ’ s F i n a n c e s | T h e S t a t e o f O n t a r i o
Another new tax that threatens the manufacturing and business sector is the Carbon
Tax. Many groups have raised concerns with the carbon tax implementation, including
the Canadian Manufacturers & Exporters who expressed: “It will also be critical that
Ontario not act unilaterally. Failure to act in parallel on a North American basis would
put Ontario manufacturers at a signiicant competitive disadvantage.” Ontario cannot aford to drive investment elsewhere. If the province implements a carbon tax we will lose high paying jobs and manufacturing investment.
I found Gwyn Morgan’s Globe and Mail column, Wynne’s green scheme could deal
massive blow to Ontario and Canada, to be the best summary of what will happen.
He notes the similarities between what’s being proposed in Ontario and the carbon
trading system that was established in Europe 10 years ago:
“As in Ontario, the story begins with huge subsidies for wind and solar power that
drove up electricity prices precipitously. Cap-and-trade handed wind and solar power
companies a second windfall by creating a ‘carbon trading market’ that allowed them
to sell ‘carbon ofsets’ from their low-emission projects. On the other hand, many factories and industrial plants, already struggling with high power costs, found it more
proitable to shut down and sell their carbon credit allocation in the carbon trading market. As a result, the bulk of Europe’s emissions reductions have been achieved
by the departure of energy-intensive industries to overseas locations. Many of the
products consumed by Europeans are now produced in countries without emissions
limits ...”
businesses indicated they would reduce their current payroll or hire fewer employees
in the future. The Chamber is calling on the Government of Ontario to reconsider
its proposed approach and further assess its negative impact on the economy. Alan
O’Dette, President and CEO of the OCC, stated that “The ORPP is a blanket solution to
a problem that requires a targeted approach.”
Carbon Tax

- 3 8 -
A L o o k i n t o O n t a r i o ’ s F i n a n c e s | T h e S t a t e o f O n t a r i o
RED TAPE
I prefer to call this chapter, Death by a Thousand Paper Cuts! From iling taxes to applying for government permits, how much does red tape cost you? At least $10 billion a year and a lot of stress. A report entitled Impact of Regulation on Canadian Individuals, for the irst time, quantiies the cost of the most common red tape headaches faced by ordinary Canadians. The $10 billion igure takes into account the following:
Complying with personal income tax obligations ($6.7 billion, excluding actual
taxes paid);
Applying for and renewing passports ($645 million);
Applying for and renewing driver’s licenses and vehicle registrations ($1.7 billion);
And time spent complying with these and other regulatory
obligations (excluding personal income tax)
The Government heard irst-hand from smallbusiness owners in Ontario about how red tape
cost them $11 billion a year.
Businesses and consumers are both afected by red tape. Government rules, permits, and paperwork are involved in everything from renovating a home, to applying for a
student loan, to going ishing. CFIB has previously pegged the direct cost of regulation on all Canadian businesses at $31 billion per year. The data on cost to individuals
begins to provide a fuller picture of the total cost of regulation for Canadians. And in a
series of roundtables with CFIB members in 2012, the Government heard irst-hand from small business owners in Ontario about how red tape costs them $11 billion a
year, and takes them away from their business and creating jobs.
The report also includes a public opinion poll in which almost half of the respondents
said that excessive regulation adds signiicant stress to their lives.
“

Ontario also received a dis-honourable mention in the CFIB’s Paperweight Award. The
Ontario Ministry of Labour won the dubious distinction for making it mandatory for
directors, owners, and independent contractors in the construction industry to buy
the Workplace Safety and Insurance Board (WSIB) coverage. See last chapter!
As mentioned in the opening pages, throughout the dozens of cities all three parties
visited, red tape was a common theme. We’ve been hearing from a lot of businesses
that red tape is killing them, but the biggest surprise was hearing the same issue from
the community organizations. Whether it was a Social Planning Council or a Poverty
Action Group, the common phrase was “We can’t send our case workers to the house,
because they’re busy illing out government forms for six hours a day.”
In 1996, the Progressive Conservative government developed a Red Tape Commission
to reduce red tape for small businesses and individuals and to promote business
planning within the broader public sector. In addition to annual reviews of all regulations
administered by every Ministry of the government, the Commission also initiated
speciic policy reviews, such as a ‘Highway Incident Management Study’ which sought to develop better coordination of emergency services dealing with highway accidents.
Originally established as a temporary body, the Commission was re-constituted in
2000 as a permanent body. In December 2003, the newly elected Liberal government
discontinued the Commission. Death by a thousand paper cuts!
A L o o k i n t o O n t a r i o ’ s F i n a n c e s | T h e S t a t e o f O n t a r i o


DEBT
AND
DEFICIT

- 4 2 -
A L o o k i n t o O n t a r i o ’ s F i n a n c e s | D e b t a n d D e f i c i t
It took 23 premiers and 136 years to accumulate a debt of $139 billion dollars. It took
Dalton McGuinty, along with his successor Kathleen Wynne, only 11 years to more
than double that debt.
Over the past year, we have learned even more about the dismal state of our province’s
inances. According to the Auditor General, the net debt as a percentage of GDP will top 40% this year – about the same as Ukraine. Since the recession the per-person
debt burden grew by an astonishing $7,800 to $21,000. The province already spends
more on debt interest than on postsecondary education, and interest payments are
continuing to increase by about 7 per cent a year, making them the fastest-rising cost
for the government over the next four years.
Simply put – we spend far more money than we take in.
Remembering that this is taxpayer’s money being spent, there is a philosophical
diference at play. Liberals (and the NDP) want to tax and spend – with them deciding which projects get the spending. Conservatives believe that money should stay with
those who earned it – the people and the businesses – and they will spend it, spurring
the economy.
As an entrepreneur and iscal conservative, I believe less government, lower costs, and fewer regulations are what create economic activity.
In the past decade in Ontario, we have seen just the opposite occur. Over the past
decade, our government got much bigger; just look at bureaucracies such as the
LHINs and the OPA (now merged into the IESO), each costing about $300 million.
We have new taxes; think the Health Tax, Diamond Tax, aviation fuel tax, and the
coming carbon tax and pension tax.
And the Canadian Federation of Independent Business held a Red Tape Awareness
Week showcasing the burdensome red tape in Ontario.
- 4 3 -
A L o o k i n t o O n t a r i o ’ s F i n a n c e s | D e b t a n d D e f i c i t
Businesses like to locate in a well-managed jurisdiction. They like to locate in places that
have a lower overhead and encourage companies to make money. Those jurisdictions
know that greater proits bring more investment and hiring. Today we have exactly the opposite of what is needed to create jobs and wealth in Ontario. We have more
government, higher taxes, and more regulations.
The Ontario Chamber of Commerce recently released two reports. First, their guide
to Ontario’s debt and deicit situation entitled How Bad Is It? The title alone should give you some indication that it’s bad – now we just need to calibrate how bad! They also
published the 2015 version of their Emerging Stronger series. Both reports indicate
the worsening economic climate for businesses in Ontario. For example, their Ontario
Business Conidence Index found that only 29% of the 1,500 businesses surveyed are conident in the Ontario Economy in a global context, down from 42% in 2013. When you look at the sector-speciic breakdown of those statistics one realizes that only 54% of energy/utilities sector is conident in their economic outlook, compared to 87% last year, and the average sector-speciic conidence is 58%, down from 74%.
We have a government that absolutely loves spending other people’s money to
promote their own causes. The Gas Plant Scandal is a prime example. The government
spent $1.1 billion dollars to save Liberal seats in the 2011 election. The Green Energy
Act is another. This social engineering experiment resulted in Ontario going from
being one of the cheapest electricity jurisdictions to one of the most expensive in
North America. All this after spending billions of borrowed dollars.
Liberals believe that taxing you and spending your money will somehow increase
economic activity, despite the fact that no other jurisdiction has achieved this goal. The
results of their 11-year tax-and-spend binge speak volumes. But in spite of a horrible
economic record, they’re going to continue this practice, as promised by the Premier
and the Finance Minister in the 2014 Fall Economic Statement. Jamison Steeve,
Executive Director of the Institute for Prosperity and Competitiveness at the University
of Toronto, summarized it in the Toronto Star as “Basically, Ontario’s economy is not
producing as much wealth as planned, hoped or expected”. So we have more taxes
and more spending coming. That means continuing deicits and growing debt.

- 4 4 -
A L o o k i n t o O n t a r i o ’ s F i n a n c e s | D e b t a n d D e f i c i t
Jean-François Wen, University of Calgary Professor of Economics and author of the
Fraser Institute’s Report, Ontario’s Debt Balloon, calculates that 66% of the increase
in debt since the 2008/09 recession is directly attributable to day-to-day expenses
exceeding revenues on an annual basis. Wen writes, “Governments typically borrow
money as a means to inance long-term assets such as roads, schools or hospitals. But in Ontario’s case, the province has gone deeper into debt to pay for day-to-day
expenses”. Livio Di Matteo, Economist at Lakehead University, wrote that it’s a “travesty”
that in only one generation Ontario has declined from having Canada’s strongest and
most productive economy to having its weakest. This decline will only continue as the
Liberals tax and spend plan continues to drive down private investment, suppress
productivity and economic growth, kill job creation, and cause “a deterioration of …
public inances.”
- 4 5 -
A L o o k i n t o O n t a r i o ’ s F i n a n c e s | D e b t a n d D e f i c i t
Don Drummond called for a “sharp degree ofiscal restraint; take daring iscal action”
to balance the budget.
Don Drummond outlined some big-ticket reforms that he said would be “an important
turning point in the province’s history.” He called for a “sharp degree of iscal restraint.” He said “The government must take daring iscal action early” and we must act “swiftly and boldly.” To balance the budget will require “tough decisions” and the treatment
will be “diicult” and “most of the burden … must fall on spending.” He called for “a wrenching reduction from the path that spending is now on.”
Here we are, more than three years later, and the Liberals are planning further studies
whether to take any of the urgent actions recommended by their own economist.
THE DRUMMOND REPORT
The Liberals needed to buy time and get themselves through the 2011 election. That’s
when they called on economist Don Drummond to recommend savings and reforms
to Ontario’s public service, so it could better deliver programs for the long haul.
On February 15, 2012 his 543-page Report, which suggested ending Ontario’s
unafordable $1.1 billion electricity rebate and marginally increasing class sizes, was presented to the Legislature. In all, 362 recommendations warned that Ontario needs
immediate action to avoid going down the path of Greece – and the options get a
whole lot worse the longer we wait.
The Toronto Star’s headline read “Drummond recommends a radical overhaul to get
Ontario back to balanced budgets.” The column went on to say “The Liberals and New
Democrats have already challenged Drummond’s extra gloomy economic growth and
deicit projections.”
“
- 4 6 -
A L o o k i n t o O n t a r i o ’ s F i n a n c e s | D e b t a n d D e f i c i t
Two months after the Drummond Report was released, and two days after the
2012 budget passed, one of the world’s major credit rating agencies downgraded
Ontario, citing the province’s swollen debt burden and tough economic times
ahead. Moody’s Investor Service’s decision to downgrade Ontario came one day
after another inluential rating agency, Standard & Poor, issued a stern warning and a dimmer outlook. Previously it had downgraded Ontario from AA to AA-,
similar to the downgrade from DBRS. Warren Lovely of CIBC World Markets
commented that the province’s rating could be knocked down further if it fails to
stabilize its debt burden if it sees an unexpected deterioration in debt afordability.
The Auditor General has reported on the many consequences of high debt which
includes the “crowding out” of other spending, a greater vulnerability to a rise in interest
rates, and possible credit rating downgrades. Bonnie Lysyk stated, “At some point,
the creditors will come knocking if the government keeps borrowing to pay its bills,”
and only weeks later they did. Both Moody’s and Fitch rating agencies downgraded
Ontario last year. Moody’s also released a separate report in February outlining how
Ontario’s debt burden is in fact worse than that of Quebec’s, because we have no plan
for dealing with it.
There are two parts to any formula to get us out of the massive deicit hole the Liberals have dug: increased revenues and reduced spending. In the spring of 2014, the Bank
of Canada issued a lower forecast for growth. It was a warning to the Liberals that their revenue targets may be in jeopardy. Instead of taking that into account, the Liberals passed the budget In July with their revenue igures unchanged. Then, just four months later, the government admitted it had fallen $500 million short of its
revenue forecast and had to take a $300 million dip into the province’s reserve fund. It should be concerning that their forecasts are so wrong in such a short period of time.
So in reality, we’ll have less revenue and increased spending – exactly the opposite
of what we need. (If you were following Ontario politics in 1991, this has a familiar
ring. Bob Rae and his New Democratic Party tried it. Do I have to tell you how that
worked out?)

- 4 7 -
A L o o k i n t o O n t a r i o ’ s F i n a n c e s | D e b t a n d D e f i c i t
Any family having trouble paying their bills knows you don’t run out and buy a swimming
pool. You don’t go on a spending spree. Basically, what the Liberals proposed to do was
use their MasterCard to pay of their Visa, and their Visa to pay of their MasterCard.
In response to the 2013 Fall Economic Statement, the Wall Street Journal reported that
Ontario’s iscal situation is worse than California’s and the province will have trouble hitting its deicit target. At the same time, the Globe and Mail called the Liberal plan “equal parts lunacy, desperation, and a return to failed 1970s-style state planning.”
They added, “There is a very clear sense in which the Ontario government is playing
‘blame the victim’ for the sorry state of the provincial economy.”
ONTARIO’S SPENDING
I irst wrote about Ontario’s deicit after former Finance Minister Dwight Duncan stated “I do not want Ontario to become like California”. He said that about the same time
the Fraser Institute published a report comparing deicits of the two jurisdictions. To research this thoroughly, I promised my wife a lovely 4-day trip to San Francisco where
we would use that city as our home-base to tour three bankrupt California cities. We’re
still married. The result was my widely-published February 2013 column talking about
deicits and other similarities.
California Dreaming; Ontario’s Nightmare
The dismal inancial situations facing Ontario and California are clearly compared in a recently-released study. Both jurisdictions have crushing deicits of about $16-billion. Sadly for us, California is about three times our size, making it a iscal darling compared to us.
After reading many similar articles, I headed to California to see irsthand what Ontario might look like in the near future.
- 4 8 -
A L o o k i n t o O n t a r i o ’ s F i n a n c e s | D e b t a n d D e f i c i t
My wife Patty and I have fond memories from our many previous trips through
California. You can imagine our surprise, this time, at the sight of garbage piling
up along the highway between San Francisco and Stockton, the city that joined
San Bernardino and Vallejo in declaring bankruptcy. These three are the tip of the
iceberg – many more cities are teetering on the edge.
Assigning blame for California’s problems depends on which side of the political
spectrum you fall. The right points the inger at high public-sector wages and generous pensions and beneits. The left blames the bursting of the real estate bubble. What cannot be disputed is the fact that the cities in bankruptcy
overspent. When assessments fell, revenues fell – and they couldn’t pay their bills.
According to Michael Lewis, in his gripping book Boomerang, Vallejo is the city to
pity most. “The lobby of City Hall is completely empty. It’s just a collection of empty cubicles. Eighty per cent of the city’s budget – and the lion’s share of the claims that had thrown it into bankruptcy – were wrapped up in the pay and beneits.”
Now, the City Manager runs the entire city of 116,000 with a staf of one. “When she goes out to the bathroom she has to lock the door.”
On our trip, we passed hundreds of wind turbines as we drove to the historic
community of Sonora. This is in the heart of gold country, established in the
original gold rush of 1849. Today, thanks to expensive energy, the mines are
closed and logging operations are silent. Museums were closed because of
staing cuts. The streets were empty. But we did see a lot of casinos!
The comparison to Ontario is inevitable. Mine processors here have closed –
Xstrata Copper in Timmins shed 672 employees and moved to Quebec for
cheaper power. We were the #1 mining jurisdiction in the world; today we’ve
fallen to #28. The forestry sector is devastated – there are 60 closed mills today.
The Far North Act has banned logging and mining exploration from another
225,000 square kilometres of land.

- 4 9 -
A L o o k i n t o O n t a r i o ’ s F i n a n c e s | D e b t a n d D e f i c i t
As in California, wind turbines are popping up in rural Ontario. But our turbine
owners are ofered the highest subsidies in the world. This has caused energy rates in Ontario to rise to amongst the highest in North America.
The Liberals have cancelled the slots-at-racetrack program, which netted the
province $1.2 billion annually, opting to sprinkle 29 casinos throughout Ontario.
I ask this simple question: Is that the best we can do?
We have 600,000 unemployed in Ontario today. There are 300,000 fewer
manufacturing jobs. These people need hope, not another short-term money
grab by a government unable to control its tax-and-spend ways.
California was once the ultimate realization of the American dream. Similarly,
Ontario was once the engine of Confederation. Both have fallen on hard times,
but as usual California is leading the way. If we heed the warning of Stockton, San
Bernardino, Vallejo, and many other cities on the verge of bankruptcy, Ontario can
lead again.
And we can avoid turning the nightmare into reality.
Shortly after the California comparisons, we started to hear the word Greece pop
up in discussions. In his book, A Nation in the Red, Murray Holland states, “The Greek tragedy started ... when the government became the ‘nanny’ of the citizens. The handouts and freebies started, unions rose to power ... and the government spent more than it took in and borrowed the deicit. Because the government borrowed so much and put it into the economy by giving it to citizens, its debt mushroomed over the years, and interest expense ate away a substantial amount of the cash that was borrowed.” Sound familiar? I wanted to dig deeper into this, to present statistics on why Ontario was being compared to
Greece. The result was my May 2013 column comparing the two jurisdictions.

- 5 0 -
A L o o k i n t o O n t a r i o ’ s F i n a n c e s | D e b t a n d D e f i c i t
My Big Fat Greek Ontario
I sat through the new Liberal Government’s irst budget, and all I can say is “Opa”. We may well be on our way to our own Greek-style tragedy.
You don’t need to be an economist named Drummond to know that Ontario is
where Greece was in the 1980s. From 1984-94 Greece’s net debt-to-GDP ratio
went from 37 percent to 66 percent. Today Ontario is at 37 percent and if we
maintain the spending status quo, we too will reach 66 percent by 2019.
The Drummond Report was a warning to Ontario: ix this now or it will destroy you. Instead, last year we saw spending actually up $3.6 billion, while revenue was
up only $2.6 billion. We deinitely don’t have a revenue problem in Ontario; we have a spending problem.
Our debt is not a function of the global recession or tsunami, as I continue to hear
in the Legislature. It’s the refusal of the government to control spending, and their
lack of political will to balance the budget. Low interest rates make carrying this
large debt possible, but even the slightest increase in rates will cause trauma for
the budget.
I recently attended a luncheon where the speaker, Niels Veldhuis, presented
Ontario’s Debt: Surpassing California, Heading for Greece? He told us that over the last 9 years, our GDP was up 3.3 percent while our program spending went up 6.6
percent. Had we just matched our spending to the GDP rate, last year’s budget
would have been $91 billion instead of $115 billion – and yes, that would have
meant a surplus as opposed to a deicit.
The solutions to Ontario’s problems aren’t hard to igure out; they’re just not easy to do. Ontario needs a government that has a plan to reduce spending and
create jobs, and the courage to implement it. But it’s hard to justify these tough
decisions if people don’t know how serious the problem is here in Ontario.

- 5 1 -
A L o o k i n t o O n t a r i o ’ s F i n a n c e s | D e b t a n d D e f i c i t
The budget presented to Ontarians ofers no reform, shows no sense of understanding the severity of our debt crisis, or the urgency required to ix the problem. It appears Ontario is headed to become the next Greek tragedy.
When the City of Detroit declared bankruptcy, the inevitable comparisons surfaced
again, and I provided a summary of our similarities and my obvious conclusions. My
3rd inance-related column appeared in September 2013.
Ontario’s Check Engine Light Is On
The recent bankruptcy of Detroit is another warning sign to Ontario that without
hitting the brakes, we too are headed for a iscal clif.
Detroit, once the very symbol of industrial might, iled what will be the largest municipal bankruptcy in U.S. history. Their budget deicit is more than $380 million and their long-term debt is estimated to be $20 billion.
The motor city’s population declined from a peak of 1.8 million in the 1950s to
700,000. There are 78,000 abandoned structures. Police, ire, and ambulance services are unreliable – their leets are in disrepair, and police response times average 58 minutes.
In a letter approving the move, Governor Rick Snyder wrote “The city’s creditors,
as well as its many dedicated public servants, deserve to know what promises the
city can and will keep. The only way to do those things is to radically restructure
the city.” He added the decision follows decades of decline for Detroit, “a period in
which reality was often ignored”.
In many ways, Detroit is a warning light to the rest of the global economy, and
especially to Ontario. Their debt is $27,000 for each resident. In Ontario, we each
owe $20,000. Detroit is estimated to owe $9 billion for pensions and beneits.
- 5 2 -
A L o o k i n t o O n t a r i o ’ s F i n a n c e s | D e b t a n d D e f i c i t
Here, our unfunded pension liability is estimated at $100 billion; a problem that
will only increase as Baby Boomers reach retirement.
But the Detroit bankruptcy is only the latest warning sign that Ontario is
headed down the wrong road. Over the last year, several studies have been
released making other comparisons.
Ontario is now where Greece was in the 1980s. Their net debt-to-GDP ratio
went from 37 percent to 66 percent. Today Ontario’s is at 37 percent, and if we
maintain the spending status quo, we too will reach 66 percent by 2019.
Ontario and California also face similar dismal inancial situations. Both jurisdictions have crushing deicits of comparable size. Sadly for us, California is about three times our size, making it a iscal darling compared to us.
The Drummond Report proved to us the burden of eliminating our debt must
fall on spending. It states, “To balance the budget, the province must target a
spending level in 2017-18 that is 17 percent lower than the sum found in the
Status Quo Scenario – a wrenching reduction from the path that spending is now on”.
Instead of taking necessary action, the Liberals have taken us farther down the
road with the same failed approach of the last decade.
The solutions to Ontario’s problems aren’t hard to igure out – they’re just not easy to do. Ontario needs a government that has a plan to reduce spending and
create jobs, and the courage of their convictions to get the job done. The Ontario
PCs have put forward bold ideas in a series of 14 white papers to date, and stand
ready to lead Ontario back from the brink into prosperity.
Without structural changes, our economy will be running on fumes – and we all
know what comes next.

- 5 3 -
A L o o k i n t o O n t a r i o ’ s F i n a n c e s | D e b t a n d D e f i c i t
You’ve read philosophies on left vs. right; tax-and-spend vs. lower taxes, fewer
regulations. They are philosophical diferences. One can argue either side. But what can’t be debated are facts, so when I became Finance Critic for the Ontario PC party,
I began publishing Fedeli Focus on Finance. Six issues were produced in advance of
last year’s budget. Here is the issue dealing with debt and deicit.
Why Ontario’s Spiraling Debt Matters
Ontario’s iscal problem is much deeper, and much harder to solve, than most people recognize.
The debt is rising exponentially. In the last decade alone, it has doubled in size
from $139 billion in 2003 to $273 billion in 2013. While it’s understandable that a
global inancial crisis can push a government into debt, ive years later we have to stop the pattern of overspending before it gets even further out of control. There is a
common misconception that the current Ontario deicit is temporary because it was the result of “stimulus spending” that will soon disappear. However, the so-called
“stimulus” of 2009 never went away. It simply got built into annual spending
outlays, which are projected to continue indeinitely. As a result, Ontario’s rapidly increasing debt will lead to rapidly increasing interest payments. We are likely to face rising
interest rates in the coming years, which will make this problem worse. If we don’t take
action to address this problem, interest payments will soon crowd out core programs
Ontarians care about.Ontario Debt
Billions
Source: RBC Economics, Provincial Fiscal Tables, October 22, 2013
$0
$50
$100
$150
$200
$250
$300
81-82
82-83
83-84
84-85
85-86
86-87
87-88
88-89
89-90
90-91
91-92
92-93
93-94
94-95
95-96
96-97
97-98
98-99
99-00
00-01
01-02
02-03
03-04
04-05
05-06
06-07
07-08
08-09
09-10
10-11
11-12
12-13
13-14
Ontario Debt

- 5 4 -
A L o o k i n t o O n t a r i o ’ s F i n a n c e s | D e b t a n d D e f i c i t
It’s true that Ontario isn’t the only province adding to its debt. The recession that
spanned 2008 - 2009 caused a number of provinces to go into the red. But the amount
of debt Ontario accumulated during this time is anything but typical. The government
has no plan to address the debt problem. Without quick action, Ontario is heading
towards a classic debt spiral.
Increase in Debt per Capita since 2003
$0QUE ONT NB MAN PEI FEDERAL AB NS BC
$1,000
$2,000
$3,000
$4,000
$5,000
$6,000
$7,000
$8,000
$9,000
$10,000
Source: RBC Economics, Provincial Fiscal Tables, October 22, 2013
The government is adding an astonishing $20 billion to the debt this year alone.
This includes the $12 billion deicit projected for 2013-14 plus capital expenses like infrastructure. This igure is little changed from the $24 billion added to the debt in 2009, when the Liberals tabled their massive “stimulus” spending budget. In other
words, the government has barely slowed down the rate of piling on debt since the
height of the inancial crisis. “One-time” stimulus spending has become baked in as baseline spending.
An enormous amount of debt means we pay an enormous amount in debt interest.
Currently, we pay about $10.4 billion every year just to cover our debt interest costs.
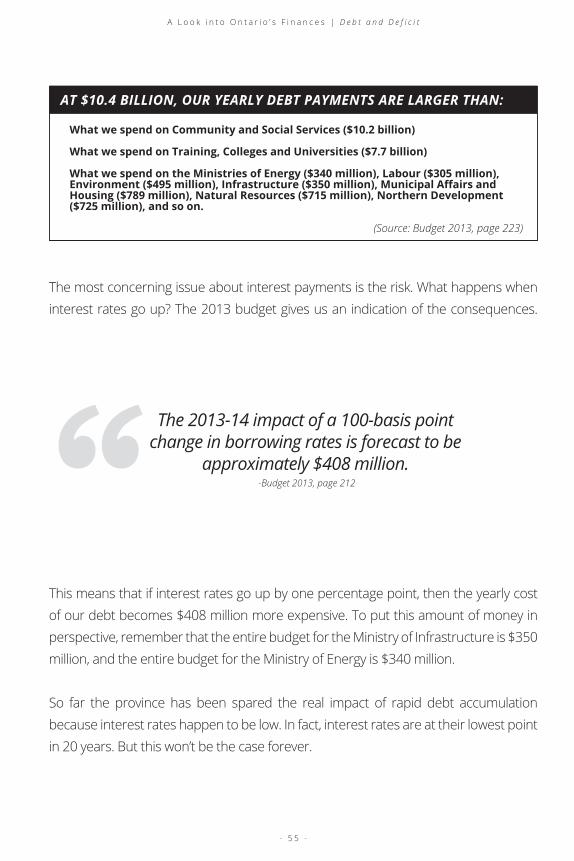
- 5 5 -
A L o o k i n t o O n t a r i o ’ s F i n a n c e s | D e b t a n d D e f i c i t
The most concerning issue about interest payments is the risk. What happens when
interest rates go up? The 2013 budget gives us an indication of the consequences.
This means that if interest rates go up by one percentage point, then the yearly cost
of our debt becomes $408 million more expensive. To put this amount of money in
perspective, remember that the entire budget for the Ministry of Infrastructure is $350
million, and the entire budget for the Ministry of Energy is $340 million.
So far the province has been spared the real impact of rapid debt accumulation
because interest rates happen to be low. In fact, interest rates are at their lowest point
in 20 years. But this won’t be the case forever.
AT $10.4 BILLION, OUR YEARLY DEBT PAYMENTS ARE LARGER THAN:
What we spend on Community and Social Services ($10.2 billion)
What we spend on Training, Colleges and Universities ($7.7 billion)
What we spend on the Ministries of Energy ($340 million), Labour ($305 million), Environment ($495 million), Infrastructure ($350 million), Municipal Afairs and Housing ($789 million), Natural Resources ($715 million), Northern Development ($725 million), and so on.
(Source: Budget 2013, page 223)
-Budget 2013, page 212“The 2013-14 impact of a 100-basis point
change in borrowing rates is forecast to be approximately $408 million.

- 5 6 -
A L o o k i n t o O n t a r i o ’ s F i n a n c e s | D e b t a n d D e f i c i t
E�ective Interest Rate on Total DebtP
er C
ent
Source: Ontario Public Accounts (1991-2012) and Ontario Financing Authority
10.9
4.1
0
2
4
6
8
10
12
90-91
91-92
92-93
93-94
94-95
95-96
96-97
97-98
98-99
99-00
00-01
01-02
02-03
03-04
04-05
05-06
06-07
07-08
08-09
09-10
10-11
11-12
12-13(in
terim
)
-Drummond Report, page 2
“Debt is costly, since interest must be paid
on the province’s outstanding bonds and other obligations. Unusually low interest rates in
recent years have allowed Ontario to borrow cheaply, but as interest rates rise to more normal
levels, so will the cost of servicing the growing debt, and that will divert dollars away
from public programs.
Even based on the government’s most optimistic assumptions, debt interest costs are
about to start spiking in the next few years, after remaining relatively lat for the last two decades because of low interest rates.
Debt interest will increase from $10.4 billion in 2012-13 to $14.5 billion in 2017-18, the
year the government plans to balance the budget. This represents an increase of $4.1
billion, or 40 per cent in only 5 years.

- 5 7 -
A L o o k i n t o O n t a r i o ’ s F i n a n c e s | D e b t a n d D e f i c i t
Given the extended period of consolidation and the ambitious expenditure targets, in Moody’s
view, there are signiicant risks surrounding the province’s ability to achieve their medium-term iscal
targets and stabilize and then reverse the recent accumulation in debt.
-Moody’s Investors Service, 2012“
As we get deeper into the debt spiral, the outlook gets even worse. That’s because
investors and credit rating agencies start to associate a greater risk to our debt,
meaning we have to pay higher premiums in order to borrow money.
Interest on Debt
1995
1996
1997
1998
1999
2000
2001
2002
2003
2004
2005
2006
2007
2008
2009
2010
2011
2012
2013
2014
2015
2016
2017
$0
$2
$4
$6
$8
$10
$12
$14
$16
Billions
Source: Ontario Ministry of Finance
40%increase
Why should we care what independent credit rating agencies say about our debt? As explained above, the government spends more money than it has, so it borrows
the rest. Credit rating agencies like Moody’s Investors Service, Standard & Poor’s
(S&P), Dominion Bond Rating Service (DBRS) and Fitch Ratings are all global irms that

- 5 8 -
A L o o k i n t o O n t a r i o ’ s F i n a n c e s | D e b t a n d D e f i c i t
analyze the credit worthiness of a number of organizations, including government.
The stronger the credit rating, the less risky it is for an investor to lend money to the
government and usually the less expensive it is for the government to borrow. The
weaker the rating, the more expensive it is to borrow.
RECENT ONTARIO CREDIT RATING DOWNGRADES
October 22, 2009: DBRS downgraded Ontario from AA to AA (low) October 29, 2009: S&P downgraded Ontario from AA to AA- April 26, 2012: Moody’s downgraded Ontario to Aa2 (stable) from Aa1 (negative)
These various downgrades wiped away years of previous progress repairing Ontario’s credit rating. Under the previous government, Ontario received four upgrades to its long-term debt rating and nine rating improvements in total.
(Source: Budget 2003, page 113)
Conclusion
The current government’s rapidly growing debt payments pose one of the most
signiicant risks to the province’s ability to provide core public services.
Key Questions
What is the government’s current projection for the amount of debt Ontario will
accumulate between now and 2017-18, the target for balancing the budget?
Does the government’s iscal plan take into account the likelihood of further credit-rating downgrades?
Does the government plan to reduce spending in other areas to ofset the increased debt interest costs? Or will the government simply issue more debt to cover these costs?

- 5 9 -
A L o o k i n t o O n t a r i o ’ s F i n a n c e s | D e b t a n d D e f i c i t
As I mentioned earlier, the results of the Liberals 10-year tax-and-spend binge are
skyrocketing hydro rates, high taxes, and crushing red tape. But in spite of a horrible
economic record, they’re going to continue this practice, as promised by the Premier
and the Finance Minister in the 2013 Fall Economic Statement. So we have more
taxing and more spending coming. That means continuing deicits and a growing debt. Here is my Focus printed in response to the 2013 Fall Economic Statement.
Ontario’s Fall Economic Statement: No Plan to Balance
Last week’s Fall Economic Statement, and the supporting comments by the Liberal
government, went further than ever before in revealing the shift away from taking
action to balance the budget that began when Kathleen Wynne replaced Dalton
McGuinty as premier.
It is clearer than ever that the government has no plan to balance the budget, and for
the irst time, the government spoke openly about the possibility of not meeting even its own modest deicit reduction targets.
It’s important to remember how we got here. When the government irst faced dei-
cits after the 2008 inancial crisis, it announced a set of targets for returning to a
Ontario Deficit Trends
($ B
illi
on
s)
Source: Ontario Ministry of Finance data
‘10-11 ‘11-12 ‘12-13 ‘13-14 ‘14-15 ‘15-16 ‘16-17 ‘17-18
2
0
-2
-4
-6
-8
-10
-12
-14
-16
Deficit/Target
Historical Trend
Future Targets Trend
- 6 0 -
A L o o k i n t o O n t a r i o ’ s F i n a n c e s | D e b t a n d D e f i c i t
balanced budget, taking a full ten years before planning to balance in 2017-18. It did not,
however, announce any plan for how those targets would actually be met. Critics
observed that the announced plan delayed serious restraint to close the iscal gap until the last few years of the plan, but the government asked for trust.
Until 2012, the McGuinty government refused to recognize that serious changes
in policy would be required to close Ontario’s unprecedented iscal hole. But after the 2011 election, the McGuinty government began to acknowledge that it wasn’t
going to make it to a balanced budget – ever – on the track it was following. Most
importantly, the Drummond Report concluded that at current course and speed,
rather than balancing, “the deicit would more than double to $30.2 billion in 2017–18 and net public debt would reach $411.4 billion, equivalent to just under 51 per cent of
the province’s GDP.” (Drummond Report, page 2)
The Drummond Report laid out a series of recommendations, all of which had to
be implemented (or alternatives found) in order to meet even the 2017-18 target to
balance. The government rejected some of Drummond’s recommendations out of
hand and turned away from the toughest measures.
It did begin to experiment, very tentatively, with a few restraint measures it had
previously insisted were unnecessary, mainly by passing a legislative freeze on teacher
pay, and circulating a draft bill to enforce a broader public sector wage freeze. But
it still refused to lay out a speciic plan for how to balance, or to acknowledge what speciic restraint measures would be required.
After Kathleen Wynne replaced Dalton McGuinty as premier in 2013, the government’s
brief lirtation with restraint ended. The 2013 budget proposed a deicit that actually represented an increase over the previous year’s deicit, from $9.8 billion to $11.7 billion. The government dropped the draft wage freeze bill, made unilateral concessions to undo
the legislated teacher wage freeze, and stopped even talking about a wage freeze policy
(see Page 86 for more detail). The years with deicit targets that required real restraint were getting ever closer, yet the government was moving to less restraint, not more.

- 6 1 -
A L o o k i n t o O n t a r i o ’ s F i n a n c e s | D e b t a n d D e f i c i t
Budget 2013 did not present a plan to balance
Based on the 2013 budget, the Ontario PC Caucus calculated what spending restraint
the government’s targets implicitly required. Working from the expenditure totals
presented in the budget, the analysis showed that even if the government achieved
aggressive restraint in health, education, social services and justice, it would still need
to cut everything else by 30 per cent in order to realize its balanced-budget target
of 2017.
These deep, across-the-board cuts would target ministries such as transportation,
environment, and municipal afairs and housing. We called this “the hole” in the government’s iscal plan, because there was never any explanation given for where these savings would be found. Each year as revenue projections are revised
downward, the hole gets bigger and bigger if the government plans to balance the
budget on schedule.
No Plan to Balance
Surplus/(Deficit)
2012
47.8
22.4
7.4
13.8
4.0
18.3
113.6
10.4
124.0
-
(9.8) (11.7) (10.1) (7.2) (3.5) 0.5
114.2 116.8 120.5 124.9 130.1 134.4
48.9
24.1
7.7
14.3
4.1
17.8
117.0
10.6
127.6
1.0
49.8
24.6
7.8
15.0
4.1
17.0
118.3
11.1
129.5
1.2
50.8
24.8
7.8
15.2
4.1
16.1
118.8
12.2
131.0
1.2
N/A
N/A
N/A
N/A
N/A
N/A
118.8
13.4
132.1
1.5
N/A
N/A
N/A
N/A
N/A
N/A
118.0
14.5
132.4
1.5
2013 2014 2015 2016 2017
Sources: 2013 Ontario Budget Pages 109 and 209
Total Revenue
Expense
Total Programs
Total Expense
Health
Education
Post Secondary and Training
Children’s and Social Services
Justice
Other
Interest on Debt
Reserve
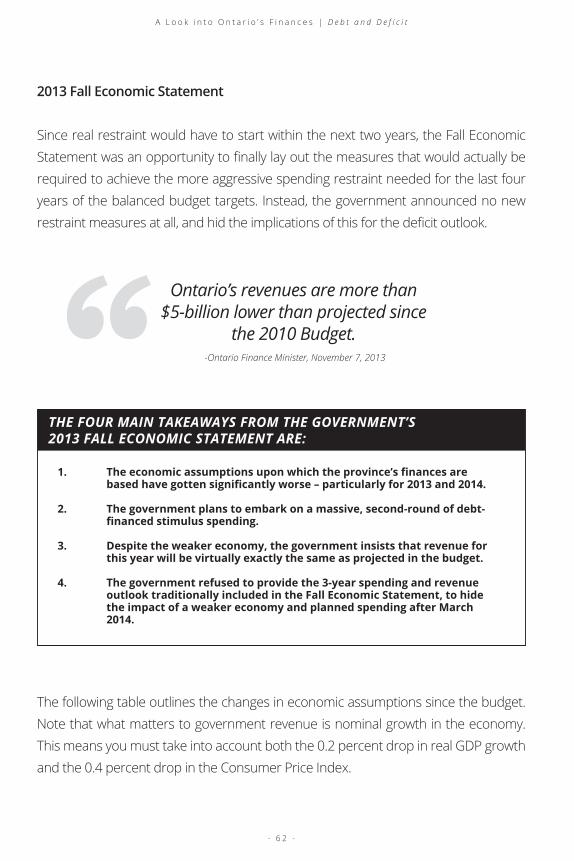
- 6 2 -
A L o o k i n t o O n t a r i o ’ s F i n a n c e s | D e b t a n d D e f i c i t
Ontario’s revenues are more than $5-billion lower than projected since
the 2010 Budget.
2013 Fall Economic Statement
Since real restraint would have to start within the next two years, the Fall Economic
Statement was an opportunity to inally lay out the measures that would actually be required to achieve the more aggressive spending restraint needed for the last four
years of the balanced budget targets. Instead, the government announced no new
restraint measures at all, and hid the implications of this for the deicit outlook.
-Ontario Finance Minister, November 7, 2013“THE FOUR MAIN TAKEAWAYS FROM THE GOVERNMENT’S 2013 FALL ECONOMIC STATEMENT ARE:
1. The economic assumptions upon which the province’s inances are based have gotten signiicantly worse – particularly for 2013 and 2014.
2. The government plans to embark on a massive, second-round of debt- inanced stimulus spending.
3. Despite the weaker economy, the government insists that revenue for this year will be virtually exactly the same as projected in the budget.
4. The government refused to provide the 3-year spending and revenue outlook traditionally included in the Fall Economic Statement, to hide the impact of a weaker economy and planned spending after March 2014.
The following table outlines the changes in economic assumptions since the budget.
Note that what matters to government revenue is nominal growth in the economy.
This means you must take into account both the 0.2 percent drop in real GDP growth
and the 0.4 percent drop in the Consumer Price Index.

- 6 3 -
A L o o k i n t o O n t a r i o ’ s F i n a n c e s | D e b t a n d D e f i c i t
Also note that economic growth for next year has been revised downward, which
explains why this year’s Fall Economic Statement difers from previous years in that it does not contain a Medium-Term Outlook. Primarily, this implies the government
does not want to restate the projections for next year, where the government is
expecting a further reduction in revenue and increase in spending.
TABLE 2.6
(Per Cent Increase)
Changes in Ministry of Finance Key Economic Forecast Assumptions:2013 Budget Compared to 2013 Fall Economic Statement (FES)
Real Gross Domestic Product
Nominal Gross Domestic Product
Retail Sales
Housing Starts (000s)
Primary Household Income
Compensation of Employees
Net Operating Surplus - Corporations
Employment
Job Creation (000s)
Consumer Price Index
Key External Variables
U.S. Real Gross Domestic Product
WTI Crude Oil ($ US per Barrel)
Canadian Dollar (Cents US)
3-month Treasury Bill Rate1
(Per Cent)
10-year Government Bond Rate1
(Per Cent)
p = Ontario Ministry of Finance planning projection.1 Government of Canada interest rates.
Sources: Statistics Canada, Canada Mortgage and Housing Corporation, Bank of Canada, U.S. Energy Information
Administration, U.S. Bureau of Economic Analysis, Blue Chip Economic Indicators (October 2013) and Ontario Ministry
of Finance.
1.5
3.0
2.5
61.0
2.8
2.8
3.3
1.2
83
1.5
2.1
94
98.0
1.0
2.0
2.3
4.1
3.8
60.0
3.9
3.7
5.0
1.4
98
2.0
2.7
98
99.5
1.2
2.6
2.1
3.8
3.8
58.0
3.6
3.7
4.6
1.4
97
1.8
2.6
98
96.5
1.1
3.0
2.4
4.2
3.8
65.0
4.2
4.3
4.0
1.5
107
2.0
3.1
99
100.0
1.9
3.2
2.5
4.3
3.8
65.0
4.4
4.2
4.2
1.6
114
2.0
2.9
96
97.0
1.9
3.3
1.3
2.5
1.9
59.0
2.9
2.9
(3.6)
1.5
104
1.1
1.6
99
97.4
1.0
2.3
2013p
2013Budget
2013FES
2014p
2013Budget
2013FES
2015p
2013Budget
2013FES

- 6 4 -
A L o o k i n t o O n t a r i o ’ s F i n a n c e s | D e b t a n d D e f i c i t
And yet despite the slowdown in the economy, almost none of these changes
afect the government’s revenue projections. Consider the accuracy required to come within 0.0094 percent of your original revenue projection, when personal income
taxes are expected to be $700-million lower, sales taxes $250-million lower and health
premiums $70-million lower. The Federal government’s Fall Economic Update showed
the same slowing economy, and therefore showed $1.3 billion lower revenue than
projected in its budget. If Ontario’s revenue declined the same percentage as federal
revenue, the deicit would have increased from $11.7 billion to $12.3 billion.
TABLE 3.1
($ Millions)
2013-14 In-Year Fiscal Performance
Revenue
Expense
Programs
Interest on Debt
Total Expense
Reserve
Surplus (Deficit)
Note: Numbers may not add due to rounding.
116,845
116,983
10,605
127,588
1,000
(11,743)
BudgetPlan
116,834
116, 970
10,605
127,575
1,000
(11,741)
CurrentOutlook
(11)
(13)
-
(13)
-
2
In-YearChange
In fact, the in-year change for the 2013 deicit projection from the budget plan to the current outlook is a mere $2 million ($11.743 billion compared to $11.741 billion).
Similarly, consider the accuracy required to come within 0.02% of this year’s budget
deicit projection, despite being of by billions of dollars when the auditor general reviews the actual results. The government has a demonstrated pattern of
over-estimating its deicit projections in the budget, slightly revising those igures 6 months later and then “outperforming” their targets by 20-40 percent in the end.
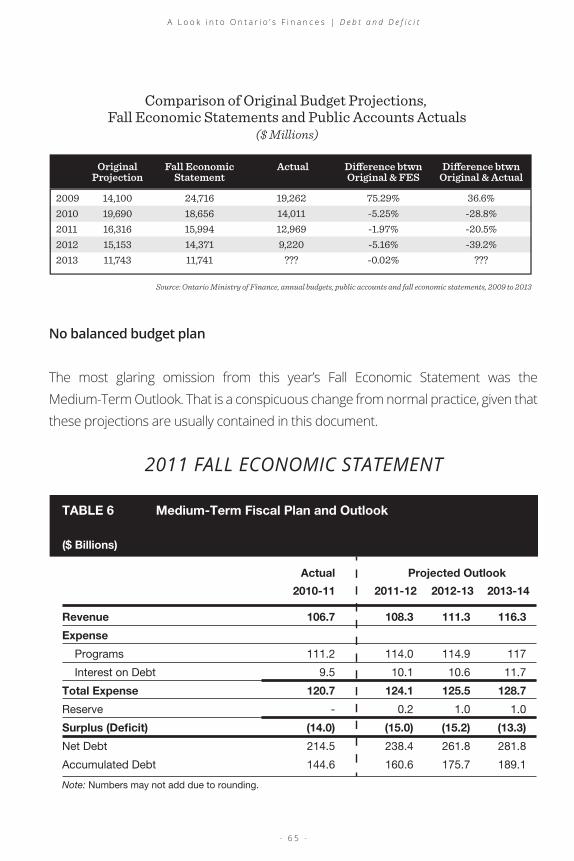
- 6 5 -
A L o o k i n t o O n t a r i o ’ s F i n a n c e s | D e b t a n d D e f i c i t
Comparison of Original Budget Projections, Fall Economic Statements and Public Accounts Actuals
($ Millions)
Source: Ontario Ministry of Finance, annual budgets, public accounts and fall economic statements, 2009 to 2013
2009
2010
2011
2012
2013
14,100
19,690
16,316
15,153
11,743
24,716
18,656
15,994
14,371
11,741
19,262
14,011
12,969
9,220
???
75.29%
-5.25%
-1.97%
-5.16%
-0.02%
36.6%
-28.8%
-20.5%
-39.2%
???
OriginalProjection
Fall EconomicStatement
Actual Dierence btwnOriginal & FES
Dierence btwnOriginal & Actual
No balanced budget plan
The most glaring omission from this year’s Fall Economic Statement was the
Medium-Term Outlook. That is a conspicuous change from normal practice, given that
these projections are usually contained in this document.
TABLE 6
($ Billions)
Medium-Term Fiscal Plan and Outlook
Revenue
Expense
Programs
Interest on Debt
Total Expense
Reserve
Surplus (Deficit)
Net Debt
Accumulated Debt
Note: Numbers may not add due to rounding.
106.7
111.2
9.5
120.7
-
(14.0)
214.5
144.6
Actual
2010-11
108.3
114.0
10.1
124.1
0.2
(15.0)
238.4
160.6
111.3
114.9
10.6
125.5
1.0
(15.2)
261.8
175.7
116.3
117
11.7
128.7
1.0
(13.3)
281.8
189.1
Projected Outlook
2011-12 2012-13 2013-14
2011 FALL ECONOMIC STATEMENT

- 6 6 -
A L o o k i n t o O n t a r i o ’ s F i n a n c e s | D e b t a n d D e f i c i t
TABLE
($ Billions)
Medium-Term Fiscal Plan and Outlook
Revenue
Expense
Programs
Interest on Debt
Total Expense
Reserve
Surplus (Deficit)
Note: Numbers may not add due to rounding.
109.8
112.7
10.1
122.7
-
(13.0)
Actual
2011-12
113.0
115.8
10.6
126.4
1.0
(14.4)
116.6
117.0
11.2
128.2
1.2
(12.8)
121.6
117.9
12.3
130.3
1.5
(10.1)
Projected Outlook
2012-13 2013-14 2014-15
2013 FALL ECONOMIC STATEMENT
2012 FALL ECONOMIC STATEMENT
(NO MEDIUM-TERM
FISCAL PLAN PRESENTED)
The Fall Economic Statement was also the irst acknowledgement, albeit implicit, that the Liberal iscal plan isn’t working. In his address to the Legislature, Minister Sousa made it clear his government’s priority is to continue to spend.
-Ontario Fall Economic Statement 2013“
However, should global economic conditions falter, causing revenue growth to fall further, our priority is clear – this government will continue
to protect investments in jobs and families ahead of short-term targets.
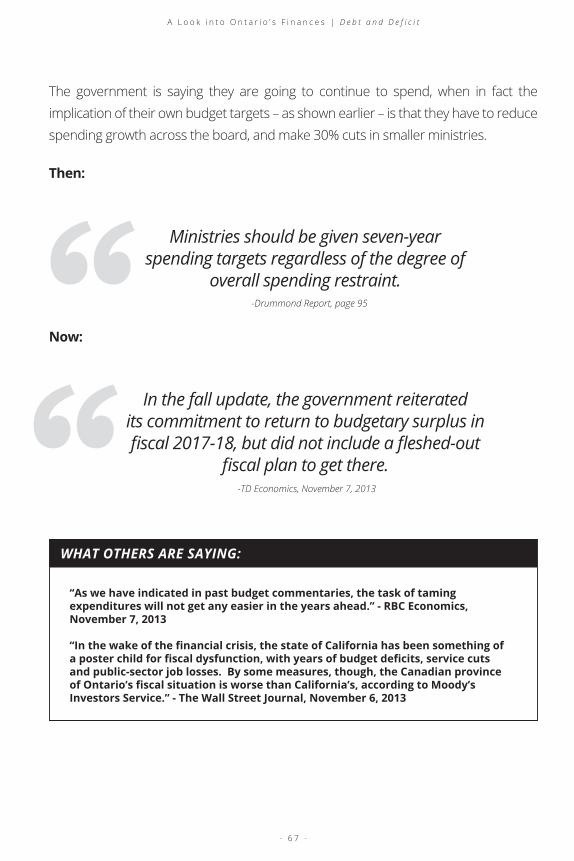
- 6 7 -
A L o o k i n t o O n t a r i o ’ s F i n a n c e s | D e b t a n d D e f i c i t
Then:
Now:
-Drummond Report, page 95
-TD Economics, November 7, 2013
““
Ministries should be given seven-year spending targets regardless of the degree of
overall spending restraint.
In the fall update, the government reiterated its commitment to return to budgetary surplus in iscal 2017-18, but did not include a leshed-out
iscal plan to get there.
The government is saying they are going to continue to spend, when in fact the
implication of their own budget targets – as shown earlier – is that they have to reduce
spending growth across the board, and make 30% cuts in smaller ministries.
WHAT OTHERS ARE SAYING:
“As we have indicated in past budget commentaries, the task of taming expenditures will not get any easier in the years ahead.” - RBC Economics, November 7, 2013
“In the wake of the inancial crisis, the state of California has been something of a poster child for iscal dysfunction, with years of budget deicits, service cuts and public-sector job losses. By some measures, though, the Canadian province of Ontario’s iscal situation is worse than California’s, according to Moody’s Investors Service.” - The Wall Street Journal, November 6, 2013

- 6 8 -
A L o o k i n t o O n t a r i o ’ s F i n a n c e s | D e b t a n d D e f i c i t
Conclusion
The current government has said the economy will be worse. It has
acknowledged it might not meet its targets due to continued stimulus spending.
And then, suspiciously, it has refused to provide the standard information showing
what the planning assumptions are for revenue and spending beyond the current
year. Our conclusion is that the government is hiding the truth, because these igures would demonstrate the province is not on track to balance the budget by 2017-18.
Key Questions
What is the efect of the slowing economy on the government’s current revenue, spending and debt projections for the next 3 years?
Why did the government deviate from the normal practice of including this
information in the Fall Economic Statement?

- 6 9 -
A L o o k i n t o O n t a r i o ’ s F i n a n c e s | D e b t a n d D e f i c i t
I realize that this has been a complicated read so far. Sadly, it’s about to get more
complicated. You see, we have a hidden deicit in Ontario, and it’s responsible for our growing debt. In a nutshell, about a decade ago, the government completed its
shift to ‘accrual’ accounting. So now what shows up in the deicit is only the annual depreciation of all of our capital spending, not how much we actually spent
constructing buildings and building infrastructure. This is fully explained in this issue
of Focus.
Ontario’s Hidden Deicit
Everyone who follows government policy is accustomed to explaining the diference between debt and deicit.
We repeat it endlessly: the debt is how much we’ve borrowed in total over many years,
whereas the deicit is the net addition to the debt in just one year.
But if that’s true, then how is it that our deicit is $11.7 billion, but our debt is going up $20 billion? If the deicit is the yearly addition to the debt, doesn’t that mean our deicit is $20 billion?
Well, if the government were operating under the same accounting rules as
Premier Rae and Premier Harris, then yes, the deicit would in fact be $20 billion, not $11.7 billion.
The government doesn’t show this $20 billion igure, but it’s easy to calculate from two numbers buried on page 221 of Budget 2013. You just subtract last year’s net debt
from this year’s (the black circle minus the grey circle on the following page). This isn’t
a secret; it’s hidden in plain sight. Bond traders know all about it.

- 7 0 -
A L o o k i n t o O n t a r i o ’ s F i n a n c e s | D e b t a n d D e f i c i t
2013 Ontario Budget (page 221)
TABLE 1.7 Impact of Fiscal Actions
Programs
Interest on Debt1
114.2
113.6
10.4
124.0
-
(9.8)
252.8
168.2
Expense
Revenue
TABLE 2.22
($ Billions)
Medium-Term Fiscal Plan and Outlook
Total Expense
Reserve
Net Debt
Accumulated Deicit1 Interest on debt expense is net of interest capitalized during construction of tangible capital assets of $0.2 billion in 2012-13, $0.3 billion in 2013-14, $0.4 billion in 2014-15 and $0.4 billion in 2015-16Note. Numbers may not add due to rounding.
Surplus/(Deicit)
Interim2012-13
116.8
117.0
10.6
127.6
1.0
(11.7)
272.8
179.9
Plan2013-14
120.5
118.3
11.1
129.5
1.2
(10.1)
290.1
190.1
2014-15 2015-16Outlook
124.9
118.8
12.2
131.0
1.2
(7.2)
303.9
197.3
If we look at this over the last decade, we can see that Budget 2013 was not the only
year the reported deicit and the annual increase in debt were not the same:
Deficit vs. Debt Increase
Bil
lio
ns
of
Do
llar
s
Source: Ontario Ministry of Finance
-5.0
0.0
5.0
10.0
15.0
20.0
Reported Deficit
25.0
2004 2005 2006 2007 2008 2009 2010 2011 2012 2013
Annual Increase in Net Debt
Note: in 2010, the government re-stated its historical net debt to reflect the consolidation of hospital, school board and college net debt with the province’s. The re-statement only goes back to 2005-06 (when the original consolidation was done), so this analysis has been adjusted to eliminate the $8 billion increase in reported net debt that year, which was attributable to the consolidation.

- 7 1 -
A L o o k i n t o O n t a r i o ’ s F i n a n c e s | D e b t a n d D e f i c i t
Now, how does that square with our story that the deicit is the amount that the debt goes up each year? How is it possible that we’re borrowing an extra $20 billion in 2013, and that this is only 17 per cent less than the incremental borrowing at the
peak of the global inancial crisis in 2009 ($24 billion)? Is it really possible that the total deicits since 2004 are $72 billion, but the debt has gone up $125 billion over the same period? Why are the black bars so diferent from the grey bars – why is the deicit not the amount the debt increased each year, like we so often tell people?
-Secretary of Cabinet and Former Deputy Minister of Finance,Internal Cabinet Documents, November 11, 2011“
We were never in real surplus – always borrowed
The reason is a quirk of accounting, and we should be paying as much attention to the
black bars as the grey ones. WARNING: you now have to endure two paragraphs of
accounting – but it really is an important point to understand.
Before 2002, the black bars and the grey bars were the same. The reason is that
the government’s accounting back then was more or less on a cash basis, meaning
that with some small exceptions, the deicit really was the amount the debt went up each year.
Then about a decade ago, the government completed its shift to ‘accrual’ accounting.
The biggest change in the new accounting system was in how capital investments
like buildings and roads factored into the deicit calculation. Under the new system, instead of showing the cost of a building in the deicit when the money is actually spent (like we did until 2002), that cost is spread out over decades, and shows up in
the deicit a little bit at a time over the life of the building. In other words, what shows up in the deicit is the annual depreciation of all of our buildings, not how much we
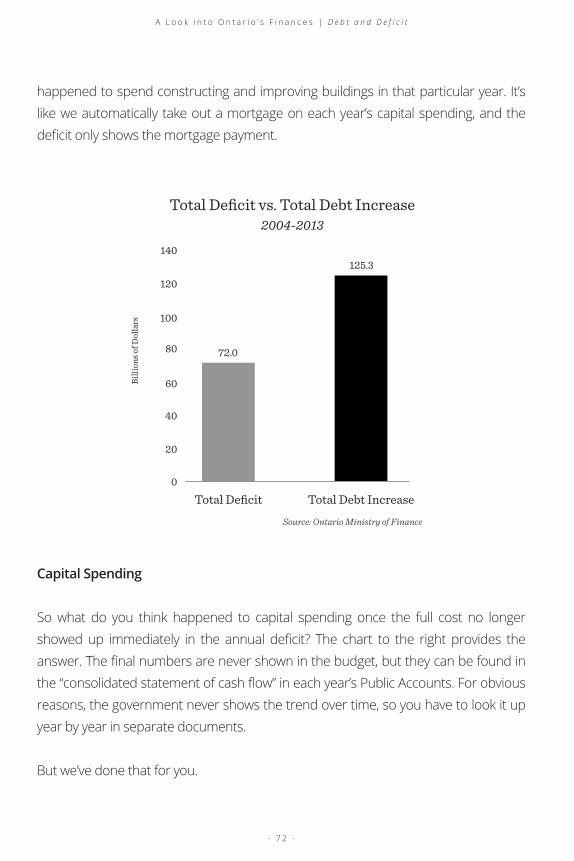
- 7 2 -
A L o o k i n t o O n t a r i o ’ s F i n a n c e s | D e b t a n d D e f i c i t
happened to spend constructing and improving buildings in that particular year. It’s
like we automatically take out a mortgage on each year’s capital spending, and the
deicit only shows the mortgage payment.
Total Deficit vs. Total Debt Increase2004-2013
Billions of Dollars
Source: Ontario Ministry of Finance
Total Deficit Total Debt Increase
0
20
40
60
72.0
125.3
80
100
120
140
Capital Spending
So what do you think happened to capital spending once the full cost no longer
showed up immediately in the annual deicit? The chart to the right provides the answer. The inal numbers are never shown in the budget, but they can be found in the “consolidated statement of cash low” in each year’s Public Accounts. For obvious reasons, the government never shows the trend over time, so you have to look it up
year by year in separate documents.
But we’ve done that for you.

- 7 3 -
A L o o k i n t o O n t a r i o ’ s F i n a n c e s | D e b t a n d D e f i c i t
Cash Capital Spending vs. AmoritizationB
illi
on
s o
f D
oll
ars
Source: Public Accounts of Ontario, 2003-2012
Capital Spending (impact on debt)
2003 2004 2005 2006 2007 2008 2009 2010 2011 2012
Amortization of Capital Assets (impact in deficit)
0.0
2.0
4.0
6.0
8.0
10.0
12.0
Perhaps it should be no surprise that when the government no longer had to include
the full impact of capital spending in the deicit, they increased capital spending. But what is shocking is the rate at which the government increased capital spending –
nearly 800%!
By 2012, the government was able to spend $11.6 billion on capital, while only $3.9
billion of amortization – $7.7 billion less – showed up in the oicial deicit. Back in 2003, the diference was only $0.5 billion, less than 10% as much.
In 1994-95, when Premier Rae set what was then the record for the largest deicit ever ($10.8 billion), he had to include the full cost of capital spending in the deicit right away. He, or someone who cared about him, complained bitterly in the notes on page
6 of the 1994-95 Public Accounts about the unfairness of having to expense all capital
costs right away, but nobody did anything about it for another eight years.

- 7 4 -
A L o o k i n t o O n t a r i o ’ s F i n a n c e s | D e b t a n d D e f i c i t
To be clear, there’s nothing sinister about the new ‘accrual’ approach – it’s consistent
with how businesses account for capital investments. But if the government suddenly
increases its customary capital spending – like it did in the last decade – then that
sudden extra spending does not create a correspondingly large increase in the deicit.
Why This Understates Ontario’s Financial Problems
On a cash basis, we’ve shown Ontario is spending $20 billion more than it takes in (see
the black bar for 2013, back in our second chart on page 70).
This cash number matters for two reasons. First, we pay interest on the actual cash
debt. So next year, Ontario will be paying interest on $20 billion more debt, not on
$11.7 billion more.
Second, even if we had an extra $11.7 billion in revenue, the situation wouldn’t be
sustainable – we couldn’t aford to keep doing what we’re doing. In the long haul, the oicial deicit would catch up to the cash borrowing requirement, because the amortization built into the deicit will grow (even if we forget about the extra interest cost already mentioned). We’d need an extra $20 billion a year to keep up with the
current pace of spending, not an extra $11.7 billion.
In case you think that this is all in aid of constructing streetcar tracks and other
infrastructure that might conceivably spur economic growth, the government helpfully
provides some sobering data.
In fact, over 60% of the accumulated capital since the government started
amortizing is in buildings and land. Only 21% ($26 billion out of $123 billion total) is for
transportation infrastructure like roads and transit.
Of course, these investment numbers only cover what the government paid for
directly; the capital investment associated with public-private partnerships like those
used to construct many hospitals today is of-book, so only the annual payments
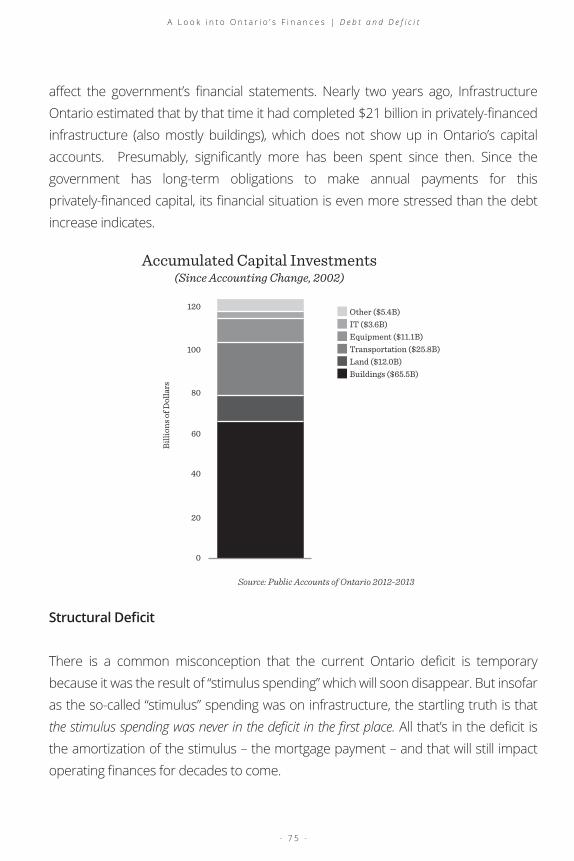
- 7 5 -
A L o o k i n t o O n t a r i o ’ s F i n a n c e s | D e b t a n d D e f i c i t
afect the government’s inancial statements. Nearly two years ago, Infrastructure Ontario estimated that by that time it had completed $21 billion in privately-inanced infrastructure (also mostly buildings), which does not show up in Ontario’s capital
accounts. Presumably, signiicantly more has been spent since then. Since the government has long-term obligations to make annual payments for this
privately-inanced capital, its inancial situation is even more stressed than the debt increase indicates.
Accumulated Capital Investments(Since Accounting Change, 2002)
Bil
lio
ns
of
Do
llar
s
Source: Public Accounts of Ontario 2012-2013
Other ($5.4B)
IT ($3.6B)
Equipment ($11.1B)
Transportation ($25.8B)
Land ($12.0B)
Buildings ($65.5B)
0
20
40
60
80
100
120
Structural Deicit
There is a common misconception that the current Ontario deicit is temporary because it was the result of “stimulus spending” which will soon disappear. But insofar
as the so-called “stimulus” spending was on infrastructure, the startling truth is that
the stimulus spending was never in the deicit in the irst place. All that’s in the deicit is the amortization of the stimulus – the mortgage payment – and that will still impact
operating inances for decades to come.

- 7 6 -
A L o o k i n t o O n t a r i o ’ s F i n a n c e s | D e b t a n d D e f i c i t
Furthermore, over ive years after the recession, the “infrastructure” stimulus is not just permanent, but bigger than ever, and the government is planning to keep it in
place indeinitely.
- Ontario Budget 2013, Page xviii“Investments in modern infrastructure will continue.
The 2013 Budget provides more than $35 billion for infrastructure investments
over the next three years.
Conclusion
Ontario’s debt is growing much faster than the oicial deicit number alone explains, and the most critical question is what to do about it. Understanding the challenge we
face is essential.
The deicit we’ve all been taught about – the amount the debt goes up every year – is not $11.7 billion right now, but rather $20 billion. It peaked at $24 billion in 2009, and
has come down only 17% since then.
The $11.7 billion deicit isn’t going away on the government’s current path. It wasn’t caused by temporary stimulus spending, as many of us assumed, and there’s a hidden
pressure building under it, as the amortization of all of the ongoing capital spending
increasingly hits the bottom line.
Key Questions
How much is the government planning to increase the actual net debt before its
balance budget target date of March 2018?

- 7 7 -
A L o o k i n t o O n t a r i o ’ s F i n a n c e s | D e b t a n d D e f i c i t
How much will the actual net debt increase exceed the reported deicit between now and 2018? How much will the debt go up in the irst year of supposedly balanced budgets?
Does the government ever plan to stop increasing the net debt?
- 7 8 -
A L o o k i n t o O n t a r i o ’ s F i n a n c e s | D e b t a n d D e f i c i t
So far in this lengthy discussion on debt and deicit, we’ve addressed why debt matters, the Fall Economic Statement, and our hidden deicit. If we know all of the facts that have been presented, then certainly the Liberal government knows them
as well. So why do they continue to suggest they’ll balance the budget by 2017-
18? Is there something they know that we don’t? The actual answer is “Yes”, they do know more; they just haven’t told us, as it’s not very good news. In this Focus, I
disclose Ministry of Finance and Conidential Cabinet documents that illustrate, in the government’s own words, they have no way to balance the budget by 2017-18.
Conidential Advice to Cabinet: “No Plan”
In the 2013 Ontario budget, the current government went to great pains to stress that
it is “on track” to balance the province’s books by 2017-18. In fact, the Premier and the
Finance Minister have repeated this in the Legislature and put it in writing as recently
as this month.
However, there is much evidence that casts serious doubts about the validity of this
claim. For instance, as raised in a previous edition of Focus, there was no mention in
the 2013 Budget of the $6 billion of savings the government had previously booked
from an across-the-board public sector wage freeze. There is no explanation as to
whether this was still being factored into the government’s planning, or conversely, if it
wasn’t, how the government plans to make up for that $6 billion discrepancy.
The Standing Committee on Estimates received thousands of internal documents
from the Ministry of Finance and from Cabinet that conirm the government is NOT being honest about the state of the province’s inances. This issue will highlight many other budget shortfalls that have been uncovered through these newly-released
documents. This will prove that what the government is saying publicly about
eliminating the deicit, and what they discuss internally, are two very diferent things.

- 7 9 -
A L o o k i n t o O n t a r i o ’ s F i n a n c e s | D e b t a n d D e f i c i t
– Government of Ontario (Ministry of Finance) Internal Document, March 2013
– Government of Ontario (Ministry of Finance) News Release, May 2, 2013.
““
For 2014-15 and 2015-16, not on track to meet 2012 Budget deicit targets.
The government is on track to meet the steadily declining deicit targets outlined in the 2012 Budget
and achieve a $0.5 billion surplus in 2017-18.
vs.
In late February 2013, the Ministry of Finance clearly identiied that the government is at least $3.5 billion of the pace needed to balance the budget by 2017-18 ($1 billion in 2014- 15, and $2.5 billion in 2015-16) (See Appendix A). It states that the “Fiscal Gap”
stems from “existing ministry Results-Based Plans falling short of managing within
allocations.” As this chart illustrates, only two days after that assessment, the number
is revised upward to $3.6 billion.
Cabinet was well aware of this $3.6 billion gap when it went on a retreat on the third
week of March, 2013. But instead of taking decisive action to reduce this massive hole
in their budgeting, Cabinet discussions actually resulted in an increase to the shortfall.
Out-Year Fiscal Gap
2013-14
Plan
Interim Outlook Range
2014-15
Medium-Term
2015-16
Fis
cal B
alan
ce B
illi
on
s o
f D
oll
ars
Source: Ontario Ministry of Finance, March 1, 2013
(15.0)
(10.0)
(5.0)
0
5.0
(11.4)(10.1)
(7.2)
[1.4][2.2]
Out-Year Fiscal Gap

- 8 0 -
A L o o k i n t o O n t a r i o ’ s F i n a n c e s | D e b t a n d D e f i c i t
The March 24th slide deck below states the discrepancy had grown to $4.5 billion
($1.9 billion in 2014-15 and $2.6 billion in 2015-16). A document dated May 2 – the
day the budget was presented – shows that the “multi-year expense plans remains
largely unchanged” from a Ministry wrap-up meeting that followed. That means that
the government knew when it presented its budget that this shortfall existed, yet
publicly insisted they were “on track” to balancing.
It needs to be noted that the diference in the shortfall pre- and post-cabinet retreat – $900 million – is the same value of concessions ofered to the Third Party in order to ensure passage of the budget (Canadian Press, May 2, 2013). It raises the question of
whether the government and Third Party already had a budget deal in place in March
2013, if not earlier.
Perhaps equally troubling is the fact there are still no projections here for 2017-18.
That could in fact mean the discrepancy to balance is even greater than the $4.5 billion
stated in these documents.
In a previous Focus edition, we highlighted the fact that the Fall Economic
Statement failed to include the medium-term outlook, breaking with tradition. This
would have included tables showing how revenue, spending, and debt will look for
the next three years. Now, the Finance Minister has announced he would not be
presenting the Third Quarter results by the February 15 deadline as required under
the Fiscal Transparency and Accountability Act, 2004. It’s been several months since
the government has reported real numbers or any inancial details. Thanks to these newly-discovered documents, we begin to understand why.
Fiscal Outlook 2014-15 and BeyondNo plans in place to achieve out-year deficit targets from 2012 Budget
- Cabinet retreat outcomes that increase 2013-14 spending also add to out-year gap
- Overall fiscal gap now at $1.9B in 2014-15 and $2.6B in 2015-16
Source: Ontario Ministry of Finance, March 24, 2013

- 8 1 -
A L o o k i n t o O n t a r i o ’ s F i n a n c e s | D e b t a n d D e f i c i t
Key Acions to Eliminate the DeficitReducing pension expense through agreements and pension reforms
No funding for incremental compensaion increases for new collecive agreements. Salaries fordesignated groups frozen unil 2017-18
Slowing growth rate of health care spending to an annual average of 2.0 per cent
Source: Ontario Ministry of Finance
Commercially Sensiive Informaion
Key Acions to Eliminate the DeficitReducing pension expense through agreements and pension reforms
No funding for incremental compensaion increases for new collecive agreements. Salaries fordesignated groups frozen unil 2017-18
Slowing growth rate of health care spending to an annual average of 2.0 per cent
Source: Ontario Ministry of Finance
On several of the versions of this slide, parts were redacted.
This version was not redacted, revealing there was nothing Commercially Sensitive, just politically sensitive.
There’s also another issue the government attempted to hide in these documents,
but ultimately failed to do so. All mentions of public sector compensation – even
the most benign mentions – were blacked out in these documents, labelling it as
“Commercially Sensitive Information”. However, they missed blacking-out a couple
versions. By comparing the two documents above, it’s clear the government was
attempting to keep an important fact from the public sector unions and the public
at large. The Government will need to extend public sector wage restraint past the
existing two years to which it has publicly committed itself.
In another presentation prepared for cabinet shortly after the budget in early May,
the gravity of the situation becomes apparent. Two scenarios for program growth

- 8 2 -
A L o o k i n t o O n t a r i o ’ s F i n a n c e s | D e b t a n d D e f i c i t
expense are presented by Finance oicials. They indicate that in order to reach balance, program spending reductions of $6.1 billion to $6.9 billion will be required outside of the
core ministries identiied (Health, Education, Post-Secondary, Justice, Social Services).
One slide ends with “Changes since 2012 Budget show a deterioration in the iscal outlook beyond 2013-14 (based on current economic information).”
Five-Year Program Growth Scenario B
Per
Cen
t
Source: Confidential Advice to Cabinet
8.0
6.0
2.02.9
1.6
2.9
0.6 0.7
6.9
1.3
(9.6)
4.0
2.0
0
(2.0)
(4.0)
(6.0)
(8.0)
(10.0)
Health
Sector
Education
Sector
Postsecondary
and Train
ing
Sector
Children’s and
Social S
ervices
Sector
Justice
Sector
Other
Programs
Program
Expense
Interest o
n
Debt
Total E
xpense
CPI
(2016-17 and 2017-18)
Cumulative decline inOther Programs of $6.9B(or 38%) by 2017-18

- 8 3 -
A L o o k i n t o O n t a r i o ’ s F i n a n c e s | D e b t a n d D e f i c i t
The Premier’s Brieing
In late January 2013, Ministry of Finance oicials prepared a lengthy brieing package for whoever would be chosen as new leader and Premier.
A cover letter dated February 13, 2013 from Secretary of Cabinet Peter Wallace is
addressed to “Premier” Kathleen Wynne, and three of her advisors.
In that package is an appendix which included a “Summary of Status of Key Items with
Fiscal Implications.” That list included the Ontario Northland divestment, LHIN reform
legislation, reforms to physiotherapy services, and casino modernization.
The package included a document (below) that later triggered a further Auditor
General Report. The document stated the divestment of Ontario Northland
would actually cost up to $790 million; much diferent than the $265 million the government claimed it would save in the 2012 budget. The Auditor General conirmed in December, that in fact total divestment of Ontario Northland would cost $820 million.
The sale would leave a $1.1 billion dollar gap in the budget; not proceeding with the
sale will leave the $265 million savings out of the budget, plus the millions spent on
the sale, to date.
That same document also refers to the government’s casino modernization plan.
The government had plans to establish 29 new casinos across Ontario and expected
to increase Ontario Lottery and Gaming revenues by more than $1 billion a year by
2017-18 as a result. It noted two major risks to achieving that – the “potential delay
in establishing a GTA casino”, and the “potential relocation of slots from Woodbine
Racetrack”. As we now know, a GTA casino site still hasn’t been selected, and may
never happen, and the government has backed away from its rapid casino expansion
plans. The forecasted revenue will not materialize in the 2017/18 budget.
The brieing package also lists 25 new spending items approved that weren’t included in the 2012 Budget or Fall Economic Statement, and also makes mention
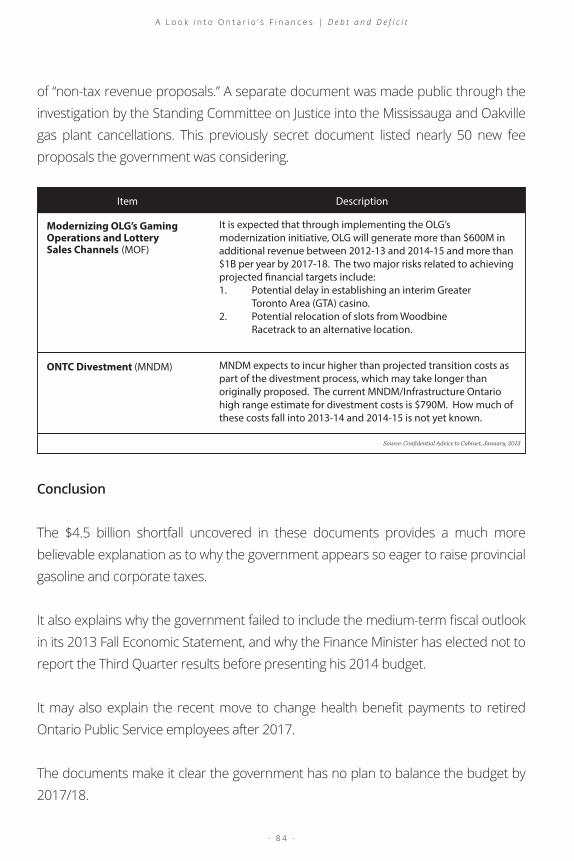
- 8 4 -
A L o o k i n t o O n t a r i o ’ s F i n a n c e s | D e b t a n d D e f i c i t
of “non-tax revenue proposals.” A separate document was made public through the
investigation by the Standing Committee on Justice into the Mississauga and Oakville
gas plant cancellations. This previously secret document listed nearly 50 new fee
proposals the government was considering.
Item Description
Modernizing OLG’s GamingOperations and LotterySales Channels (MOF)
It is expected that through implementing the OLG’s
modernization initiative, OLG will generate more than $600M in
additional revenue between 2012-13 and 2014-15 and more than
$1B per year by 2017-18. The two major risks related to achieving
projected �nancial targets include:
1. Potential delay in establishing an interim Greater
Toronto Area (GTA) casino.
2. Potential relocation of slots from Woodbine
Racetrack to an alternative location.
ONTC Divestment (MNDM) MNDM expects to incur higher than projected transition costs as
part of the divestment process, which may take longer than
originally proposed. The current MNDM/Infrastructure Ontario
high range estimate for divestment costs is $790M. How much of
these costs fall into 2013-14 and 2014-15 is not yet known.
Source: Confidential Advice to Cabinet, January, 2013
Conclusion
The $4.5 billion shortfall uncovered in these documents provides a much more
believable explanation as to why the government appears so eager to raise provincial
gasoline and corporate taxes.
It also explains why the government failed to include the medium-term iscal outlook in its 2013 Fall Economic Statement, and why the Finance Minister has elected not to
report the Third Quarter results before presenting his 2014 budget.
It may also explain the recent move to change health beneit payments to retired Ontario Public Service employees after 2017.
The documents make it clear the government has no plan to balance the budget by
2017/18.

- 8 5 -
A L o o k i n t o O n t a r i o ’ s F i n a n c e s | D e b t a n d D e f i c i t
Key Questions
Why has the government insisted it is “on track” to balance the budget when Ministry
of Finance documents show this isn’t the case?
What steps does the government plan to take to address their $4.5 billion
budget shortfall?
Does the government plan to raise taxes and/or fees to pay for this $4.5 billion
shortfall? If so, which ones?
Will the government table its medium-term iscal outlook in the 2014 budget?
Why is the government trying to hide its plans for extending public sector wage
restraint from public scrutiny and from their public sector union partners?
Did the government and the Third Party already have a budget deal agreed to in
March of last year, two months before its passage, that increased the iscal shortfall to $4.5B? Is a similar deal already done for the 2014 budget?
NOTE: A few days after this Focus on Finance was presented, the Liberal government attempted to silence me. They brought forward a Contempt motion against me in the Legislature. They claim this material contained conidential government documents and my releasing them was a breach.
This was purely a diversion tactic by the Liberals, to have the media focus on this rather than the fact they have a $4.5 billion gap in their budget.
I fought back and within days of the false charges, the Clerk of the Estimates Committee
acknowledged that all the documents I disclosed were indeed in the public domain. The Liberal ‘libel chill’ tactic, as it is called, failed, and the interest in my Fedeli Focus on Finance series has never been greater!

- 8 6 -
A L o o k i n t o O n t a r i o ’ s F i n a n c e s | D e b t a n d D e f i c i t
One major factor inluencing the debt and deicit in Ontario is the lack of commitment to a real public sector wage freeze. The Liberals talk about it; they’ve even pretended
to have implemented one. But as this Focus will prove, there is no across the board
public sector wage freeze in Ontario.
The so-called “wage freeze”
More than one million people work for one of Ontario’s thousands of government
employers. These range from your local school and hospital to the provincial
bureaucracy, our casinos and liquor stores. So it’s not surprising that salaries and
beneits for government workers are the single biggest expense in the provincial budget. Controlling these costs was the primary tool the government said it would
use to wrestle down Ontario’s historic budget deicits by 2017-18. However, recent research – using Ministry of Labour data – reveals the government has not succeeded
in freezing wages for government workers. In fact, there are hundreds of examples of
deals agreed to by the government that have resulted in wage increases.
-Ontario Minister of Finance, July 20, 2010“We can’t manage the deicit without addressing
what is the single biggest line in our budget – public-sector compensation.
Public-sector compensation costs make up 55 cents of every dollar spent on programs.
Prior to the recession the government had been exceedingly generous in handing out
pay increases.
Public-Sector Settlements Average Annual Growth
1
2
3
4
Per
Cen
t
1996-20031991-1995
1.9 2.02.9
2004-2009Source: Presentation by Finance Minister Dwight Duncan
to Ontario public-sector unions, July 20, 2010

- 8 7 -
A L o o k i n t o O n t a r i o ’ s F i n a n c e s | D e b t a n d D e f i c i t
Instead of using legislation, the government sought to achieve its pay freeze through
thousands of individual negotiations. Remember – there are 4,000 collective
agreements in Ontario’s government sector. Seven out of every ten public employees
are members of a labour union.
The 2010 budget did legislate a freeze for non-unionized employees, which it claimed
would save $750 million. It was only revealed later by the Canadian Press that the
government’s freeze did not include things like performance bonuses, which went to
98 per cent of eligible managers.
In the 2012 budget, the government reiterated its commitment to freezing
compensation, estimating this would save $6 billion over three years. (See table below.)
2012 Ontario Budget (pg 66)
TABLE 1.7 Impact of Fiscal Actions
Expense Management Measures (1.0)
(0.9)
(0.1)
(2.0) (5.3) (10.4) (17.7)
(1.7) (4.9)
Compensation Restraint (2.1) (6.0)
Cost Avoidance (1.5) (6.8)
(2.2)
(3.0)
(5.2)
Expense Measures
TABLE 1.7
($ Billions)
Impact of Fiscal Actions
Total Expense Measures
2012-13 2013-14 2014-15
3-yearimpact
However, without using legislation to enforce it, the freeze was always going to
be diicult to implement. Even with respect to legislation used to freeze teacher compensation – known as “Bill 115” – approximately 40 per cent of teachers
continued to move through the salary grid collecting pay increases. And in an efort to repair the relationship between the current government and Ontario’s teachers’
unions, the premier promised elementary teachers they would receive a 2 per cent
wage increase next fall without asking for concessions or ofsets. According to the Globe and Mail, the deal “will cost the treasury $112 million every year.”

- 8 8 -
A L o o k i n t o O n t a r i o ’ s F i n a n c e s | D e b t a n d D e f i c i t
NUMEROUS EXCEPTIONS WERE MADE TO THE GOVERNMENT’S WAGE FREEZE, INCLUDING:
MPAC: Employees at the Municipal Property Assessment Corporation received wage increases of 2.0 per cent in the irst two years and 2.2 per cent in the third and fourth years.
Metrolinx: Workers at this provincial transit agency saw wage increases of 2.0 per cent in each of the irst and second years and 2.3 per cent in the inal year.
Ontario Medical Association: In November 2012 the government handed out a $100 million compensation increase.
LCBO: This summer employees received “signing bonuses” of roughly $1,600 per employee.
OLG Slots at Woodbine: A week after the LCBO deal, employees at OLG’s Slots at Woodbine were given up to $1,200 signing bonuses over two years.
The list goes on… with exceptions to the wage freeze made for workers at:
University of Windsor Ontario Teachers Pension Plan Board Ontario Power Generation Pan Am Games Committee Niagara Parks Commission Ryerson University Royal Conservatory of Music Elementary Teachers’ Federation Alcohol and Gaming Commission Hydro One
Since a wage freeze went into efect in 2010, approximately 8 out of 10 collective agreements in the Broader Public Sector have included compensation increases. (For more information, see accompanying spreadsheet.) This igure does not include the revisions to the teacher wage freeze – “Bill 115” – made by the premier in the spring. Ontario’s Auditor General is currently reviewing those costs and is expected to report back in early 2014.

- 8 9 -
A L o o k i n t o O n t a r i o ’ s F i n a n c e s | D e b t a n d D e f i c i t
In past negotiated settlements, public-sector salary increases have often exceeded the inlation
rate. Even after the government’s announcement in 2010 that it would not fund such increases, most collective agreements negotiated since have still
resulted in wage increases.
A Wage Freeze is Still Necessary
The government set a target to eliminate Ontario’s enormous budget shortfalls by
2017-18, but it never laid out a plan to do that.
This work was contracted out to independent economist Don Drummond, formally of
TD Bank, who warned that, instead of balancing, the current plan would actually triple
the province’s debt to $411 billion by 2017 if the government kept spending on such
a huge scale.
Even before the release of the Drummond Report, the government had been warned
its iscal plan was unlikely to balance the budget by 2017-18.
-Auditor General, 2011
“Provincial revenue forecasts are no better than when the government said it required
a wage freeze to meet its balanced-budget targets. No further expenditure restraint
has been announced to ofset these increases, and the government has already backed of of some of its existing plans.
Before stepping down last year, the previous premier and inance minister went so far as to draft legislation to provide a legal framework for enforcing the wage freeze,
since negotiations weren’t working. Entitled The Protecting Public Services Act, this 84-
page piece of legislation has not been tabled by the current government. In fact, the
2013 budget removed all references to a wage freeze and instead proposed to “work
together” to achieve desired outcomes.

- 9 0 -
A L o o k i n t o O n t a r i o ’ s F i n a n c e s | D e b t a n d D e f i c i t
Rather than a wage freeze, per se, the inance minister now says the government will “advocate for wage constraint,” refuses to use the term “wage freeze,” and appears to
be explicitly backing away from the policy of his predecessor.
-Budget 2012
-Ontario Minister of Finance, September 2013
Where collective agreements cannot be negotiated that are consistent with the iscal plan… the government will consider all options to meet its iscal goals, including intervention through legislation or other means.
We’re working closely with the stakeholders involved to administer negotiations within the pay envelope that we now have.
Then: Now:
Conclusion
Ontario has a serious problem, and the government is not being honest about it.
Key Questions
If the government’s wage freeze has failed, does the province’s iscal plan still include the estimated $6-billion savings from this measure?
If the government’s wage freeze has failed, does it still expect to balance the budget
by 2017-18?
- 9 1 -
A L o o k i n t o O n t a r i o ’ s F i n a n c e s | D e b t a n d D e f i c i t
We’ve already covered some of the additional sources of revenue the government has
been using to attempt to balance the budget. Sources such as Federal Equalization
payments of over $10 billion, received since becoming a ‘have-not’ province, come to
mind. In this Focus you will discover a shocking source of revenue that took almost 10
years to come to light.
No Plan to Retire the “Debt Retirement Charge”
In his 2011 annual report, former Ontario Auditor General Jim McCarter noted that
the provincial government had not provided the public a full accounting on the status
of the Debt Retirement Charge (DRC) for some time, even though it was required to
do so by law.
McCarter noted in his report that the original amount of debt, which the DRC was
intended to pay of, was $7.8 billion, yet there was still a balance, even though the current government had collected $8.7 billion by March 31, 2011. Surprisingly, the
government now claims that it still owed $5.8 billion as of that date!
The original $7.8 billion igure was established in 1999 during the restructuring of the province’s former electricity utility, Ontario Hydro, and was never subsequently
challenged by the current government until diicult questions started to be asked. We have now discovered the government had re-set the debt to $11.9 billion, a secret it
kept to itself from 2004 until after the 2011 election.
More Questions than Answers Remain
The most recent annual report from newly-appointed Auditor General Bonnie Lysyk
states the amount collected has since grown to $10.6 billion as of last year, while the
government claims $3.9 billion is still owed and refuses to say speciically when it will be fully paid of. Ontario households and employers can be forgiven for scratching

- 9 2 -
A L o o k i n t o O n t a r i o ’ s F i n a n c e s | D e b t a n d D e f i c i t
Section 85 (of the Electricity Act, 1998) requires that the Minister of Finance “from time to time” determine the amount of the outstanding residual stranded debt
and make this determination public. -Oice of the Auditor General of Ontario, 2011 Annual Report, page 12“
their heads and wondering why this surcharge remains on their monthly electricity
bills, where all of this money has really gone, and what is the plan for ending it.
A Little History
In 2002, Ontario families and employers began paying a speciic surcharge on their monthly electricity bills in order to pay back debts accumulated by the former
Ontario Hydro. The amount of that debt was $7.8 billion, and it was estimated that by
2012 enough money would be collected to meet these obligations. The DRC is applied
at a rate of 0.7 cents per kilowatt hour (kWh). With average residential use ranging
between 800 kWh and 1,000 kWh per month, this equates to between $5.60 and
$7.00 on an average monthly bill. Beginning in 2010, the government applied the
Harmonized Sales Tax to the DRC. In total, the DRC raises close to $1 billion a year in
annual revenue.
As 2012 approached, the government pushed back the estimated date for paying
of the residual stranded debt from 2012 to “somewhere between 2015 and 2018.” In the most recent annual report from the agency in charge – the Ontario Electricity
Financial Corporation (OEFC) – even this date range was omitted. Why? (Source: Ontario Electricity Financial Corporation, Annual Report, 2012)
After the Auditor General pointed out in 2011 the government’s failure to comply with
its reporting requirements, the Ministry of Finance provided a long-awaited update
on the Debt Retirement Charge on May 15, 2012. It stated the remaining residual
stranded debt was $4.5 billion, leading to numerous questions, such as how was
it possible to collect $8.7 billion and only pay down $3.3 billion worth of debt? The

- 9 3 -
A L o o k i n t o O n t a r i o ’ s F i n a n c e s | D e b t a n d D e f i c i t
government claimed that there was interest owed on the debt, even though the
deinition of the residual stranded debt and DRC, as written into law, does not include interest payments: “the deinition of residual stranded debt in section 85 [of the Electricity Act] does not include interest or other [Ontario Electricity Financial Corporation] expenses.” (Source: Oice of the Auditor General of Ontario, 2011 Annual Report, page 125)
This, of course, begs the question – where did this money go and why are we still
paying the DRC?
Yearly Revenues from the Ontario Debt Retirement Charge
(2002 to Present)
Source: Ontario Electricity Financing Corporation
2013-14:
2012-13:
2011-12:
2010-11:
2009-10:
2008-09:
2007-08:
2006-07:
2005-06:
2004-05:
2003-04:
2002-03:
$957 million (2013 Budget projection)
$957 million (2013 Budget interim figure)
$952 million
$944 million
$907 million
$970 million
$982 million
$991 million
$1.021 billion
$997 million
$1.0 billion
$889 million
TOTAL $11.6 BILLION
Ontario Ministry of Finance on August 18, 2011:
Amount of debt to be paid of = $7.8 billion
Ontario Ministry of Finance on May 15, 2012:
Amount of debt to be paid of = $11.9 billion
-Ontario Electricity Financial Corporation, Annual Report 2010-11, released August 18, 2011; and, Ontario Ministry of Finance, press release, May 15, 2012

- 9 4 -
A L o o k i n t o O n t a r i o ’ s F i n a n c e s | D e b t a n d D e f i c i t
The $4 Billion Question
The most curious aspect of the government’s update in 2012 was the fact it
retroactively restated the 2004 amount of residual stranded debt as $11.9 billion – a
$4.1 billion increase from the original amount. However, a review of the 2004 annual
report from the Ontario Electricity Financing Corporation makes no mention of this
sudden increase. In fact, neither does any annual report up to the 2011 election. The
igure used was $7.8 billion in 11 consecutive annual reports. In essence, it was like a credit card bill we kept paying, but no one ever told us how much was left. When that
number was inally revealed, the original balance jumped $4 billion.
Residual Stranded Debt Since April 1, 1999
Initial Stranded Debt
OEFC Unfunded LiabilityResidual Stranded Debt
Note: Unfunded Liability amounts are from OEFC Annual Reports from 1999-00 to 2012, and the Annual Financial Statements for 2013. Sources: Residual Stranded Debt value for April 1, 1999, as announced on April 1, 1999. Values for the period from March 31, 2000, to March 31, 2010, as estimated by the Ontario Ministry of Finance in the 2012 Budget and for March 31, 2011, to March 31, 2013, as determined by the Minister of Finance in accordance with a regulation made under the Electricy Act, 1998.
7.85.9 6.3
7.7 7.5
11.99.9
8.57.6
6.75.6 5.4 5.8
4.53.9
April 1, 1
999
March 3
1, 2000
March 3
1, 2001
March 3
1, 2002
March 3
1, 2003
March 3
1, 2004
March 3
1, 2005
March 3
1, 2006
March 3
1, 2007
March 3
1, 2008
March 3
1, 2009
March 3
1, 2010
March 3
1, 2011
March 3
1, 2012
March 3
1, 2013
25
20
15
10
($ B
illi
on
s)
5
0
Where did all this money go if it wasn’t paying of $7.8 billion of residual stranded debt? The auditor gave one major clue in his 2011 annual report:
- 9 5 -
A L o o k i n t o O n t a r i o ’ s F i n a n c e s | D e b t a n d D e f i c i t
“External legal advisers we engaged to assist us … conirmed our view that section 85 of the Electricity Act, 1998, which is titled ‘The Residual Stranded Debt and
the Debt Retirement Charge’, allows the DRC to be used for any purpose that is in
accordance with [the government’s] objectives and purposes, and not just the retirement of the residual stranded debt.” (Source: Oice of the Auditor General of Ontario, 2011 Annual Report, page 12)
While it appears the current government clearly exploited this loophole, it is
nevertheless a loophole.
When originally implementing the DRC, the Minister of Energy of the former
government said explicitly it was the government’s policy that: “All revenues from
the DRC will go directly to the Ontario Electricity Financial Corporation to be used
exclusively to service the residual stranded debt. Once the residual stranded debt has
been retired, the DRC will end.” (Source: Oice of the Auditor General of Ontario, 2011 Annual Report, page 124)
It was therefore a deliberate change in government policy not to use separate
accounting to track the residual stranded debt. In a 2011 brieing to the Ontario PC Caucus, government oicials conirmed that they combine revenues collected through the DRC revenues with other electricity-related revenue streams, which are
then all applied together to the overall unfunded liability. The amount of remaining
residual stranded debt is then recalculated, each year, to derive a remaining balance.
What’s Really Going on Here?
Two things – irst, the Debt Retirement Charge is not earmarked toward the residual stranded debt, even though that is its intended purpose. Second, the government really
has no plan to ever eliminate the DRC. Take a second look at the igure above. Between 2010 and 2011, the amount of debt owed actually increased from $5.4 billion to $5.8
billion – over the same period the government raised $950 million in DRC revenues.

- 9 6 -
A L o o k i n t o O n t a r i o ’ s F i n a n c e s | D e b t a n d D e f i c i t
Is it any wonder the government cannot present its long-term plan to eliminate
the DRC?
The most recent government update on the remaining residual stranded debt
igure came in the 2013 Fall Economic Statement at $3.9 billion – which, coincidentally, is roughly the diference between the original estimate and government’s revised estimate for 2004.
Conclusion
If the government had properly managed the electricity system and directed money
collected through the DRC toward its intended purpose, the residual stranded debt
should have been paid of by now, and the charge should have come of Ontario electricity bills. Instead, it appears that when the government needed money for other
expenses, it diverted these funds toward those purposes, prolonging the amount of
time Ontario families and employers will be required to pay the DRC.
Key Questions
If the government has collected roughly $1 billion in DRC revenues every year for the
past 12 years, why is it not able to give a speciic date for when the residual stranded debt will be paid of?
How does the government explain the fact that it used $7.8 billion for the amount of
debt each and every year for 8 years, only to revise this estimate upwards to $11.9
billion immediately following the 2011 election?I started out talking to you about what every MPP hears throughout our travels:

MY
FINAL
THOUGHTS

- 9 8 -
A L o o k i n t o O n t a r i o ’ s F i n a n c e s | M y F i n a l T h o u g h t s
I started out talking to you about what every MPP hears throughout our travels:
skyrocketing energy rates, new taxes, and crushing red tape. From there you were
provided considerable evidence that the inances in Ontario are far worse than the government has disclosed, and even amongst themselves, the Liberals acknowledge
they have no plan to balance the budget.
Let me conclude by saying there is a very disturbing scenario playing out right now.
The Liberals have been hiding any real numbers.
In October 2013, Finance Minister Charles Sousa failed to deliver the long-range
assessment of Ontario’s iscal environment, as he was obligated to do, under the Fiscal Transparency and Accountability Act.
Here is what I asked him during Question Period: “Minister, The Fiscal
Transparency and Accountability Act states, “Within two years after each
provincial election, the minister shall release a long-range assessment of Ontario’s iscal environment.” Minister, you’re two weeks late. When will you be releasing this
assessment that you were legally required to release?”
Minister Sousa responded: “We have a Fall Economic Statement that’s coming out
shortly. We’ve produced irst-quarter results that achieve our opportunities and that show the success we’ve had to date.”
So he’ll show us the numbers in the Fall Economic Statement! However, when it came
out, there were no Medium-Term Outlook numbers included. In addition, individual
ministry expense numbers were not listed for 2016-2017 – just the Total Program
spending – which magically falls in 2017 to balance the budget. Still no numbers!
Then in February, 2014, the Minister announced he would not be presenting their 3rd
Quarter Results on February 15; as is also required under the Fiscal Transparency and
Accountability Act.
- 9 9 -
A L o o k i n t o O n t a r i o ’ s F i n a n c e s | M y F i n a l T h o u g h t s
The government is hiding the truth, because any one of these three sets of igures would demonstrate the province is not on track to balancing the budget by 2017-18.
I continue to ask important inance questions almost every day during Question Period. Sadly, this government will not take that opportunity to set the record straight
or to tell us what their plan for Ontario is.
They continue to tell the Legislature, the inancial community, and the public one thing, while their own once-secret documents prove they know the complete opposite to
be true.
Companies continue to leave Ontario. And the Liberals continue to introduce
new taxes.
Lately, the government has taken to delecting any concern you may have about their inances, by talking about selling beer and wine in grocery stores, or selling parts of Hydro One. These are purely intended for two reasons: to have you debating
those issues rather than looking at the real issue of debt and deicit, and to use any new-found revenue to reduce the deicit.
They continue to tell us that they will put revenue from the sale of assets into the
newly-created Trillium Trust. But we caught the Liberals red-handed during the
Budget deliberations. The Act states the government ‘may’ put a ‘portion’ of any asset
sale into the Trust. We brought Amendments forward to change ‘may’ to ‘must’ and
‘portion’ to ‘all’. After all, if the intent was to put all the money into the Trillium Trust,
then say so. But the Liberals voted the Amendments down – meaning they are now
free to put any revenue from the sale of an asset right into general revenue, and apply
it against the deicit.
As a inal push, we proposed an Amendment, “Within 90 days of the sale of an asset, the Auditor General report to the Legislature on what was sold, how much was

- 1 0 0 -
A L o o k i n t o O n t a r i o ’ s F i n a n c e s | M y F i n a l T h o u g h t s
received, and where the money went”. That’s pretty simple, isn’t it? Yet again, the Liberals voted down the Amendment. So much for being “open and transparent”.
Closer inspection of the Budget revealed the full story. Asset sales are included in the
“other non-tax revenue” table. And page 232 of the Budget is quite revealing, showing
asset sales of $900 million this year and $1 billion next year. Almost $2 billion in asset
sales have already been booked and built into the budget – and these assets have yet
to be sold. So much for putting the money into the Trillium Trust, as promised – and
now we know why the Liberals voted against our three Amendments.
John Ivison said it best in his National Post column when he wrote, “Too bad Charles
Sousa, the province’s inance minister, had already lufed the books for this year and next with net revenue gains from “asset optimization” totaling $2 billion”.
Yes, it is indeed too bad the Liberals have lufed the books. As a result, we will be paying for their mismanagement for generations to come.


If you would like to download previous editions of Fedeli Focus on Finance, please go
to www.Fedeli.com and click on the ‘your MPP at work’ link.
In addition, if you would like to receive future editions of Focus, go to
www.Fedeli.com and type your address in the subscription box on the front page.


Victor Fedeli
MPP, Nipissing
PC Finance Critic
Victor Fedeli is a life-long entrepreneur, specializing in communications.
In 1989, his Fedeli Corporation was named 34th in the 50 Best Places to Work in Canada.
In 2003, he successfully ran for Mayor of the City of North Bay, and served two terms.
On October 6, 2011 Vic was elected MPP for Nipissing. Within a month, he was named as the Ontario PC Energy Critic. After serving two years, he was named PC Finance Critic.
In this new role, Vic began publishing Fedeli Focus on Finance, a monthly series of inancial newsletters, which as the names suggests, ofers an in-depth look at the inances of Ontario.
His shocking revelations – through internal government documents kept secret by the Liberals until revealed through exhaustive research by the Ontario PC Party – are what prompted this publication.