Embed Size (px)
Citation preview
S. Kiselev, R. Romashkin – LomonosovMoscow State University

Climate changesPopulation Income changesVulnerabilityThe dynamics of agriculture

Year + 0,65 Winter - 2,09Spring + 0,74Summer + 1,83Autumn +1,86
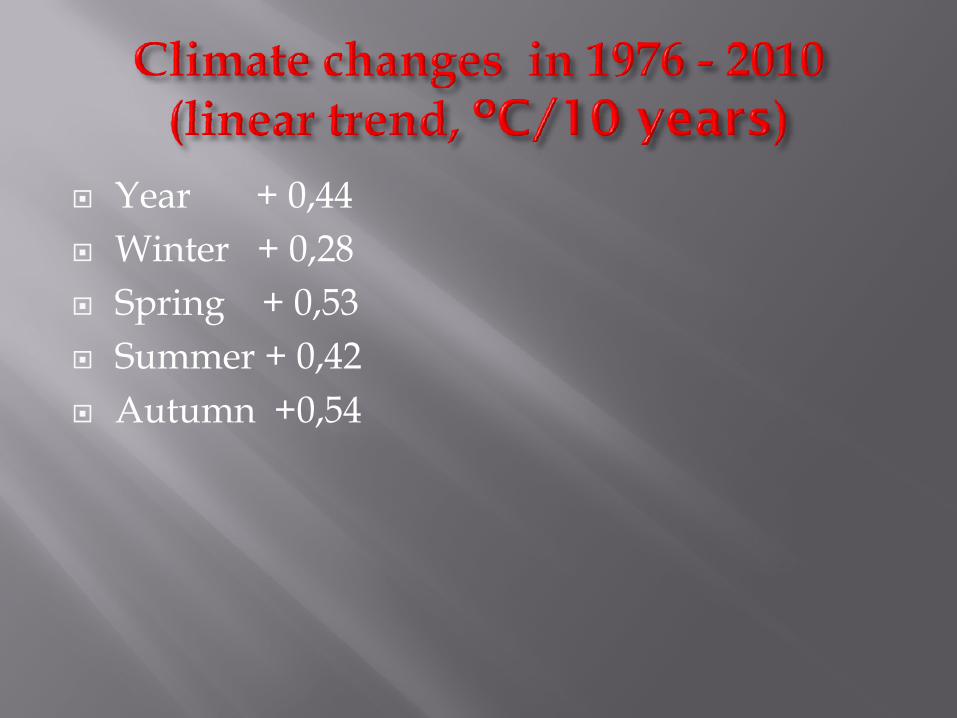
Year + 0,44 Winter + 0,28Spring + 0,53Summer + 0,42Autumn +0,54

Average speed of changes (trend) of temperature for January (º С/10 year) 1976 по 2010

Average speed of changes (trend) of precipitation in Spring -(mm/10 years) 1976 - 2010


9
expansion of cultivated area and increasing lands suitable for agriculture increasing favorable period for vegetationincrease of warm supplyimproving of wintering for crops
increase of dangerous events (severe droughts, forest fires, etc.)increase of anomaliesincrease of aridity for arid areas (south of Russia, south of Siberia)lack of water resources degradation of soil fertility

Decade Total PopulationGrowth Rate
Rural PopulationGrowth Rate
Urban PopulationGrowth Rate
1960-1969 0.87 -0.95 2.45
1970-1979 0.58 -1.38 1.77
1980-1989 0.64 -0.71 1.24
1990-1999 -0.01 0.14 -0.06
2000-2009 -0.34 -0.32 -0.35


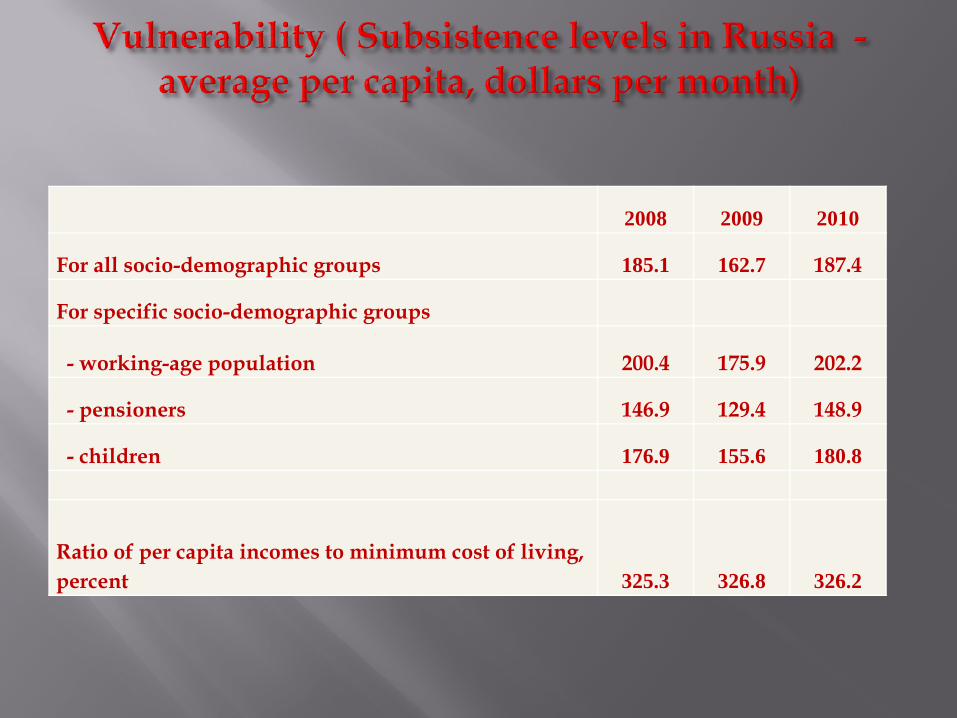
2008 2009 2010
For all socio-demographic groups 185.1 162.7 187.4
For specific socio-demographic groups
- working-age population 200.4 175.9 202.2
- pensioners 146.9 129.4 148.9
- children 176.9 155.6 180.8
Ratio of per capita incomes to minimum cost of living, percent 325.3 326.8 326.2

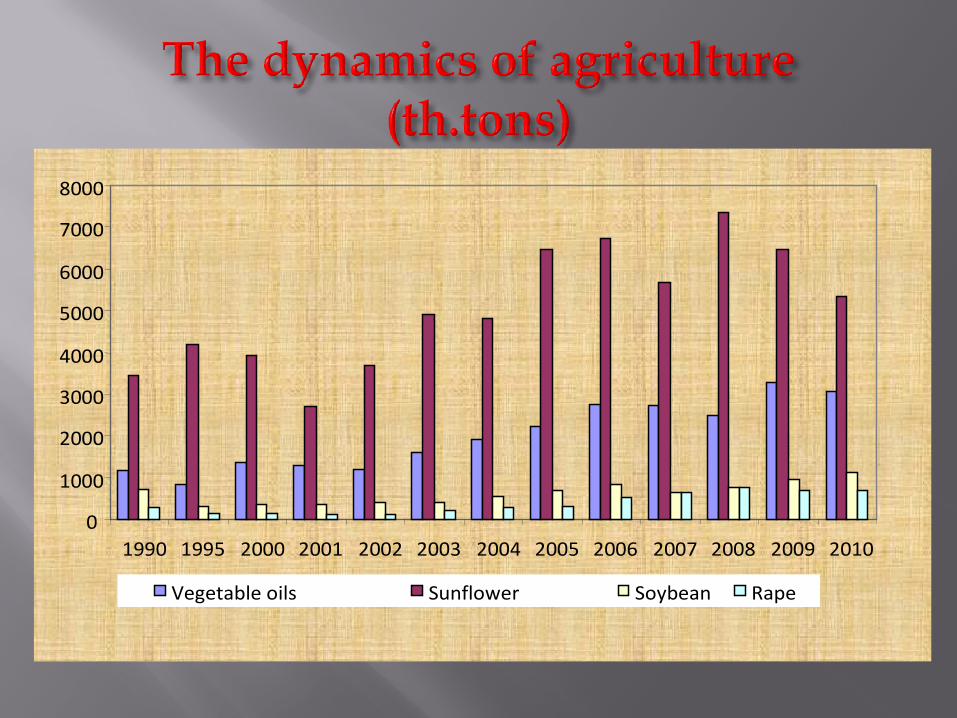
0
1000
2000
3000
4000
5000
6000
7000
8000
1990 1995 2000 2001 2002 2003 2004 2005 2006 2007 2008 2009 2010
Vegetable oils Sunflower Soybean Rape

89,1
106,9
99,1
81,3
63,469,3
88,6
47,9
65,5
85,2 86,6
67,2 78,1
60,9
97,1
108,2
81,578,2
77,8
54,7
0
20
40
60
80
100
120
1991 1992 1993 1994 1995 1996 1997 1998 1999 2000 2001 2002 2003 2004 2005 2006 2007 2008 2009 2010

All GCMs demonstrate the increase in temperature for all parts of Russia (realistic!)

All models demonstrate the increase in precipitation for most parts of Russia (realistic!)

Period of scenario implementation, years Region 30-40 60-70 90-100 30-40 60-70 90-100 Feed Crops Grain Crops
North 22 32 31 26 24 13 North-West 21 24 30 22 12 22 Kaliningrad 22 22 20 34 25 29 Central 19 24 17 27 25 13 Volgo-Vyatka 21 30 19 20 26 11 Black Soil Center 20 24 7 15 15 -7 Volga River, North 24 30 8 16 19 -10 Volga River, South 5 14 1 7 30 20 Northern Caucasus 2 3 -7 -6 -7 -13 Urals 14 28 17 11 16 -7 Siberia, West 6 19 1 -7 -1 -23 Siberia, East 0 0 -4 -12 -18 -24 Far east 6 13 7 10 12 5 Russia 13 21 11 11 14 -1 Changes of yield in percentage of current level

GDP Per Capita Scenarios

Production
Area
Yield
Net Exports

Production
Area
Yield
Net Exports

-1000
-500
0
500
1000
1500
2000
2500
3000
3500
4000
1990
1991
1992
1993
1994
1995
1996
1997
1998
1999
2000
2001
2002
2003
2004
2005
2006
2007
2008
2009
Energy Industrial and Manufacturing Use of solvents and other products AgricultureLand use change and forestry Wastes

25
Resource saving technologiesNew varieties of cropsWinter cropsForestationIrrigationSpecial government policy (insurance programs, safety net programs, support ag. research,etc.)