Embed Size (px)
Citation preview

Implementation and real-traffic assessment of a new infotainment interface concept.
Master’s Thesis in the Automotive Engineering
SERGEJS DOMBROVSKIS Department of Applied Mechanics Division of Vehicle Safety CHALMERS UNIVERSITY OF TECHNOLOGY Göteborg, Sweden 2010 Master’s Thesis 2010:56


MASTER’S THESIS 2010:56
Implementation and real-traffic assessment of a new infotainment interface concept.
Master’s Thesis in the Automotive Engineering
SERGEJS DOMBROVSKIS
Department of Applied Mechanics Division of Vehicle Safety
CHALMERS UNIVERSITY OF TECHNOLOGY
Göteborg, Sweden 2010

Implementation and real-traffic assessment of a new infotainment interface concept. Master’s Thesis in the Automotive Engineering SERGEJS DOMBROVSKIS
© SERGEJS DOMBROVSKIS, 2010
Master’s Thesis 2010:56 ISSN 1652-8557 Department of Applied Mechanics Division of Vehicle Safety Chalmers University of Technology SE-412 96 Göteborg Sweden Telephone: + 46 (0)31-772 1000 Cover: Remote View input-output hardware configuration. The principal schematic of the HMI test setup used in this project. Department of Applied Mechanics Göteborg, Sweden 2010

I
Implementation and real-traffic assessment of a new infotainment interface concept. Master’s Thesis in the Automotive Engineering SERGEJS DOMBROVSKIS
Department of Applied Mechanics Division of Vehicle Safety Chalmers University of Technology
ABSTRACT
In-vehicle infotainment systems (IVIS) of tomorrow must meet very high demands for interaction safety, ease of use and flexibility. The growing functionality of IVIS pushes the development of entirely new interfaces that overcome limitations of the current designs. In this thesis we implemented and tested “Remote View” – an interface that adds a head-up display to a conventional touchscreen interface in order to improve secondary task safety.
We implemented four variants of Remote View interface using touchscreen and touchpad as input devices. For comparison, conventional touchscreen interface and touchpad input for touchscreen were also tested. The main goal of this thesis was to test safety impact and acceptance of a new hybrid interface comprising Remote View. We hypothesized that Remote View would have allowed to use touchscreen graphics user interface (GUI) more safely without compromising the flexibility and usability of interaction.
This thesis covers: prototype development, real-traffic test experiment (design and performance), and both safety and usability analysis for Remote View interface. The real-traffic experiment was conducted with 22 participants using an instrumented EuroFOT vehicle on a public highway in Gothenburg, Sweden. EuroFOT is the largest European on-going project collecting real-traffic data for intelligent vehicle systems evaluation.
Our results show that, on average, participants felt safer and more comfortable using Remote View than conventional touchscreen interface while performing secondary tasks. However, the objective metrics neither support nor contradict this feedback from the participants. In addition, it was found that controlling a remote screen with touchpad provides a good compromise between conventional touchscreen interface and Remote View.
In conclusion, we recommend 1) further research and improvements for Remote View and 2) use of touchpad for GUI interaction. This study was performed as a part of Master’s thesis at Chalmers University of Technology for Volvo Car Corporation.
Key words:
Real-traffic experiment, hybrid Human Machine Interface, Head Up Display, touchpad, touchscreen, secondary task, safety, IVIS.

II

CHALMERS, Applied Mechanics, Master’s Thesis 2010:56 III
Contents
ABSTRACT I
CONTENTS III
PREFACE VI
NOTATIONS VII
1 INTRODUCTION 1
1.1 Purpose 1
1.2 Objective 2
1.3 Automotive engineering 3
1.4 Constraints 3
1.5 Hypothesis 4
1.6 Thesis outline 4
2 BACKGROUND 6
2.1 Review of previous studies 6 2.1.1 Guidelines and standards 6 2.1.2 Research projects 7
2.2 Performance factors 11 2.2.1 Cognitive workload 11 2.2.2 Physical ergonomics 12 2.2.3 Display location 12 2.2.4 Multimodality 12 2.2.5 Interaction principles 13 2.2.6 Interruptability 14 2.2.7 Usability 14 2.2.8 Customer experience 14 2.2.9 Flexibility 15 2.2.10 Technical aspects 15
2.3 Experimental studies 16
2.4 Interpretation of HMI research 17
2.5 HMI technologies 19 2.5.1 Head up display 19 2.5.2 Instrument cluster display 20 2.5.3 High mounted display 20 2.5.4 Innovative display technologies 21 2.5.5 Touchscreen 21 2.5.6 Conventional controls and displays 22 2.5.7 Steering wheel controls 22 2.5.8 Rotary-haptic control 23 2.5.9 Haptic mouse 23 2.5.10 Touchpad 23

CHALMERS, Applied Mechanics, Master’s Thesis 2010:56 IV
2.5.11 Remote touchscreen 24 2.5.12 Voice control 24 2.5.13 Eye tracking pointing 24 2.5.14 Free gesture recognition 25
2.6 State of the art HMI 25 2.6.1 The HMI next 26
3 METHOD 27
3.1 Early stages 27
3.2 Remote View concepts 28 3.2.1 Definition and description 28 3.2.2 Interaction principle 30 3.2.3 Purpose and tradeoffs 31
3.3 Test software and use scenarios 32 3.3.1 Iterative Remote View development 33
3.4 Experimental setup 35
3.5 Test scenario 39
3.6 Test procedure 41
3.7 Metrics 42 3.7.1 Task completion time (TCT) 43 3.7.2 Standard deviation of lane position (SDLP) 44 3.7.3 Lane departure frequency 45 3.7.4 Steering wheel reversal rate (SRR) 46 3.7.5 Mean vehicle speed 47 3.7.6 Standard deviation of vehicle speed (SD-speed) 48
3.8 Questionnaire 48
3.9 Processing of results 48 3.9.1 Minimal data validity threshold 49 3.9.2 Lane change noise quality control 49 3.9.3 Baseline definition and processing 52 3.9.4 Data loss estimates 52 3.9.5 Correlation analysis 53 3.9.6 Statistical analysis 53
4 RESULTS 54
4.1 Objective metrics 54 4.1.1 Data loss 54 4.1.2 Correlation analysis results 55 4.1.3 Task completion time 56 4.1.4 Steering wheel reversal rate 57 4.1.5 Standard deviation of lane position 60 4.1.6 Driving speed 60 4.1.7 Lane departure frequency 61 4.1.8 Eye tracker data 62

CHALMERS, Applied Mechanics, Master’s Thesis 2010:56 V
4.2 Subjective ratings 64 4.2.1 Usability and acceptance 64 4.2.2 Safety ratings 67 4.2.3 Input device ratings 68 4.2.4 Ratings of selection methods 69
5 DISCUSSION 72
5.1 Remote View safety benefit 72 5.1.1 Static and dynamic Remote View 72 5.1.2 RV input devices 73 5.1.3 Head up display 76 5.1.4 Overall Remote View safety potential 77
5.2 Remote View usability and acceptance 79
5.3 Input and selection methods 81 5.3.1 Touchpad for in-vehicle use 81 5.3.2 Clickable touchscreen 83
5.4 Notes and observations 84 5.4.1 Methodology of field HMI studies 85
5.5 Further research 86
6 CONCLUSIONS 88
REFERENCES 90
APPENDIX 1 – PRELIMINARY REMOTE VIEW SPECIFICATION 98
APPENDIX 2 – REMOTE VIEW TEST PROCEDURE SCRIPT 105
APPENDIX 3 – INFORMATION AND CONSENT FORM 120
APPENDIX 4 – COMMENTS AND NOTES FROM QUESTIONNAIRES 121

CHALMERS, Applied Mechanics, Master’s Thesis 2010:56 VI
Preface
This project was initiated by Volvo Car Corporation to develop “Remote View” – an innovative idea for infotainment interface proposed by Henrik Lind. This study was conducted as a part of Master’s degree in the Automotive Engineering. The project involved explorative research, development of prototype, testing and analysis of results. All stages of the project were performed during March – October 2010 in SAFER Vehicle and Traffic Safety Centre at Chalmers University of Technology.
During this project I received a lot of guidance from the examiner Marco Dozza whose help at the result analysis stage was invaluable. Of great help with experience, advice and support were the Volvo Cars employees Robert Broström, Mikael Ljung Aust, Jordanka Kovaceva, Staffan Davidson, Annie Rydström and many more great people from VCC and SAFER. The driving experiment would not be possible without 22 persons who volunteered to test our HMI setup in 2 hours long sessions.
It was a great experience with a possibility to try out all stages of automotive HMI concept implementation, demonstrations to the management and academic writing.
Finally the greatest credit and gratitude goes to Henrik Lind who spent countless hours on making this project happen and was very supportive throughout the months of work.
Göteborg October 2010
Sergejs Dombrovskis

CHALMERS, Applied Mechanics, Master’s Thesis 2010:56 VII
Notations AAM Alliance of Automobile Manufacturers ACC Automatic Cruise Control ADAS Advanced Driver Assistance System ANOVA ANalysis Of VAriance CL instrument CLuster FOT Field Operational Tests GUI Graphical User Interface HBK Haptic Barrel Key HCD Human Centred Design HCI Human Computer Interaction/Interface HDD Head-Down Display HMI Human Machine Interaction/Interface HMS High Mounted Screen HUD Head-Up Display HVAC Heating, Ventilation and Air Conditioning IT Information Technology ITS Intelligent Transport Systems IVIS In-Vehicle Information Systems LCT Lane Change Test LDW Lane Departure Warning system MSDLP Modified SDLP OEM Original Equipment Manufacturer RH Rotary-Haptic RV Remote View RVd dynamic Remote View RVd1 dynamic Remote View with TS input RVd2 dynamic Remote View with TP input RVs static Remote View RVs1 static Remote View with TS input RVs2 static Remote View with TP input SDLP Standard Deviation of Lane Position SD-speed Standard deviation of vehicle speed SRR Steering wheel Reversal Rate SUS System Usability Scale SW Steering Wheel TCT Task Completion Time TP TouchPad TS TouchScreen TS1 conventional TouchScreen interface TS2 TouchScreen display with TP input VDT Visual Detection Task


CHALMERS, Applied Mechanics, Master’s Thesis 2010:56 1
1 Introduction
Can you imagine a perfect car infotainment system? What would you do with such system? Would it be safe to do it while driving? It is possible to imagine seemingly flawless system that could require virtually no effort to control and that would present to us virtually any type of content. For example, dialogue based voice and gesture interface that would understand your intentions from half of a spoken word and project individualized visual content directly into driver’s eye. Such system would probably be better than anything available in modern vehicles, but it would not enable us to watch TV, read news and write emails simultaneously while driving. The limitless possibilities of technological progress can make our dreams real, but the limited capacity of a human operator remains. Until the perfect autopilot replaces the driver, in-vehicle human machine interaction (HMI) will be balancing the compromise to bring our dreams into the car while maintaining traffic safety.
The subject of this Master's thesis is a research into a potential infotainment solution what would allow to use existing in-vehicle infotainment safer than before and possibly bring in new features without compromising driving safety. The thesis will describe the approach to HMI issues, development of the concepts, testing process, results and conclusions in line with initial targets. The following sections discuss the basic information about the purpose and objectives of this study.
1.1 Purpose
In the recent decades there has been a great number of research and development in the area of in-vehicle information systems (IVIS) driven by technology, safety, market trends and other considerations. Since the introduction of multifunctional displays for trip computers the integration of functions and features of IVIS has gone a long way. A number of sources (Palo et al. 2009; Tonnis et al. 2006; Ford Motor Company 2010a) state that current trends in automotive HMI are driven by many technological features that must be integrated in multifunctional interfaces. Not only the number and complexity of IVIS functions is increasing, but also new user expectations and new technologies (Selker 2008; BMW Group 2009) drive the changes and improvements to existing HMIs. In fact the influence of information technology (IT) on car development is so significant that the whole vehicle can be viewed as a complex computer system (Tonnis et al. 2006).
In parallel to IVIS functionality development lots of research is done to study and improve the safety of interaction with IVIS. National and international efforts such as eSafety (ERTICO 2008), AIDE (Gustav Markkula et al. 2008), HUMANIST (Mårdh 2008; Cacciabue & Re 2008) and OPTIVe (Palo et al. 2009) work towards improving safety of IVIS. As a result manufacturers are actively studying HMI problems and present new solutions with more safe design.
Notably, nevertheless many international efforts attempted to develop the most sophisticated HMI solutions there are still many principally different HMI solutions on the market today and even more diversity may come in the future. As concluded in European AIDE project (Deregibus et al. 2008) nowadays there can be no “best in-

CHALMERS, Applied Mechanics, Master’s Thesis 2010:56 2
vehicle HMI”. As a part of product and brand differentiation HMI can not be easily standardized and there is no clear winner as the absolute best approach to HMI design.
Recent US consumer study (J.D.Power and Associates 2009) showed that drivers clearly favour IVIS with touchscreens (TS) – all top ranking (5 stars) systems included TS input. The flexibility and accessibility of TS is well known in the industry (Rydström et al. 2005; Yang et al. 2007), but at the same time TS are often criticized for relatively high impact on driving safety compared to remote controlled interfaces (Rydström 2009; Ecker et al. 2009; Wittmann et al. 2006). From safety perspective it is of great interest to develop a solution that would capture TS advantages while providing greater safety.
In the light of increasing body of knowledge about IVIS safety and massive technology driven development, the present study aims to contribute with a new concept of interaction that makes use of recent technology developments and has the potential to improve the safety of a complete HMI solution. The functionality described in this thesis addresses the need for a flexible, feature-rich system that is possibly safer than currently used interfaces. Notably the goal is to find an improvement over comparable interfaces and not necessarily to design the absolute best system from the safety perspective. Comparable interface could be an interface that offers similar flexibility, efficiency, customer experience, and is used in the same use cases as the proposed concept.
1.2 Objective
The primary long-term target of this thesis topic is to reduce distraction caused by the use of multifunctional IVIS while driving. The new proposal must be positively rated by experiment participants in order to show the potential of good acceptance and usability of the evaluated concept. The potential advancement is expected from a concept named “Remote View” (RV) that is based on touchscreen IVIS.
The specific objectives of this work are:
1. to implement the Remote View concept idea for in-vehicle use;
2. to design and implement experimental study in real traffic for Remote View assessment;
3. to assess safety benefit and user acceptance of the Remote View interface.
The results of this study shall be statistically valid and should be comparable to previous research data. The experimental design and study procedures were inspired by similar studies (Rydström 2009; Chilakapati 2009) performed at the Open Arena Lindholmen Science Park and Volvo Car Corporation.
Additionally, in early stages, this thesis work had a wider explorative scope focusing on all the latest technologies that could be applied in IVIS. The initial objective was to look for alternatives, competing solutions, and relevant technologies that could be considered for future IVIS development.

CHALMERS, Applied Mechanics, Master’s Thesis 2010:56 3
1.3 Automotive engineering
Every task, study or problem can be approached from a multitude of perspectives. It is important to consider that the background and academic objectives of the specific student significantly influence the content of the work.
The present thesis work is done as a part of the Automotive Engineering Master Programme at the Chalmers University of Technology. The program is a continuation of the Mechanical Engineering education but offers a great flexibility that suits the needs of the automotive industry. Apart from the mandatory focus on fundamental automotive knowledge such as powertrain, chassis and safety students are free to specialize in any area related to automotive industry. Such an approach corresponds with a need for specialists with cross-functional competence and a good insight into requirements of the automotive industry. In this case, the basic Automotive Engineering education is complimented with human factors and product development focus.
From my personal view the IVIS as an integral part of the complete automotive product. That means that the set of considerations applied to IVIS is not limited to safety or usability, but instead attempts to cover complete set of criteria. Some of the considerations implicitly are: safety, latest technologies, blind control, costs, usability, efficiency, ergonomics, branding, design, originality, HCI trends, customer experience, reliability, availability, design guidelines, research studies, competing solutions, additional features, flexibility, etc. Nevertheless the main objectives of this work are constrained to driving safety and user acceptance of the proposed Remote View concept.
1.4 Constraints
In order to keep the focus and fit the constraints of the Master’s thesis the work was has a number of limitations.
• The design of a touchscreen graphics user interface (GUI) is beyond the scope of this thesis, therefore GUI is made exclusively for test scenarios and results are not directly comparable to commercial touch or remote control GUIs.
• The driving experiment must have minimal amount of variables among studied setups that permits efficient data collection and analysis while satisfying research objectives. Amount of research questions had to be limited to maintain manageable amount of variables between the studied interfaces.
• Because of focus on safety analysis, experimental design can be a limiting factor for exploring full usability potential. Ecological validity may be affected in order to provide more consistent safety measurements.

CHALMERS, Applied Mechanics, Master’s Thesis 2010:56 4
• The studied population was chosen only among the employees of Volvo Car Corporation. More varied sample could have provided less bias and more generalizable results.
• Due to shortcomings of the experimental protocol, the objective metrics presented in the present study have specific limitations that are described in Sections 3.6 and 4.1).
1.5 Hypothesis
The experimental part of the present study addresses hypotheses that are related to complete interface concepts and also specific hardware used in the test setup. In order to fully understand the list of hypotheses it may be necessary to consult the Method Chapter of the thesis. There are two main developed variants of RV – dynamic and static (see Section 3.2.1). Touchscreen interface was tested alongside RV concepts in order to provide comparison. As well RV was implemented and tested for use with touchscreen and touchpad input (see Sections 3.2.1 and 3.3.1). The test setup also featured “clickable touchscreen” that provides haptic feedback and additional selection method for touchscreen (see Section 3.4). The main hypotheses are:
• Remote View is safer to use while driving than touchscreen.
• Users will prefer to use Remote View over touchscreen while driving.
• Static Remote View is less demanding than dynamic Remote View.
• Touchpad is viable as an input device for touchscreen GUI during driving.
• Touchscreen is viable as an input device for HUD during driving.
• Users will rate haptic feedback on touchscreen positively.
1.6 Thesis outline
This report is structured in 6 mayor chapters:
1. Introduction – the present chapter. Contains the purpose, objectives and main reasons for conducting this study
2. Background is focused on literature review including both scientific sources and also commercial information about available technologies and market needs. We introduce the major influences and considerations of this study.
3. Method chapter covers the methodology of the complete project. Apart from documenting all stages of the thesis work process, method chapter contains the description of Remote View HMI concepts, the performed experiment and also

CHALMERS, Applied Mechanics, Master’s Thesis 2010:56 5
discusses the methodology of an HMI analysis using real-traffic driving experiment approach.
4. Results chapter presents the actual results collected from the Remote View assessment experiment. Results are structured by objective and subjective metrics providing overview for all relevant data independent from tested hypotheses.
5. Discussion chapter of the thesis attempts to interpret the results together with additional knowledge on the subject. Detailed evaluation of concepts together with possible causes should provide support for the recommendations and conclusions based on this study. Discussion also partially covers the observations and experience concerning methodology of the driving experiment in live traffic conditions.
6. Conclusions provide very brief summary and the most relevant findings from the present study.

CHALMERS, Applied Mechanics, Master’s Thesis 2010:56 6
2 Background
In order to efficiently contribute to HMI development and advancements in IVIS safety it is necessary to take into account the mayor work done in the HMI area and the most critical factors affecting IVIS usability and safety. The section about experimental studies briefly introduces the basics of experimental design and approach used in this thesis work. Then the HMI technologies section presents the evaluation of HMI components that are suitable for IVIS. Finally a summary of the state of the art HMI solutions is presented together with a peek into the upcoming advancements.
2.1 Review of previous studies
The research work performed in HMI area can be structured into individual scientific studies performed independently and also within companies, into guidelines and standards which have the status of recognized collections of knowledge and into national or international research projects that often present comprehensive results that drive HMI development. Of course there are lots of internal advanced engineering projects, studies, product tests that are performed by companies offering HMI related products, but that information is often inaccessible or of poor quality for academic reference.
2.1.1 Guidelines and standards
The IVIS as all IT based systems are developing much faster than it is possible to standardize (Palo et al. 2009, p.5). New technology brings new possibilities that were not accounted for in previous years, for example semi-transparent display technologies fit in the middle between vision obscuring displays and head-up displays which are regarded as acceptable for placement in driver’s primary field of vision. Nevertheless there are several guidelines available for HMI design (Cacciabue & Re 2008; UMTRI Driver Interface Group 2010). The most comprehensive and relevant guidelines for European manufacturers must be the European Statement of Principles (Commission of the European Communities 2008) and a comparable document from the Alliance of Automobile Manufacturers (AAM) in USA (Driver Focus-Telematics Working Group 2006).
Both European Statement of Principles and AAM guidelines are very close to one another and have been mutually influenced. In both cases guidelines do not apply to voice control, heads-up displays (HUD) or advanced driver assistance systems (ADAS). The content includes both suggested principles and methods for verification and also points to relevant legislation that governs specific aspects.
The guidelines suggest following the “no obstruction” of driver’s field of view principle, limited glance durations, placement of displays as close to driver’s field of view as possible and careful presentation of information to avoid unnecessary distraction and facilitate quick perception of information. AAM suggests verifying

CHALMERS, Applied Mechanics, Master’s Thesis 2010:56 7
HMI systems by measuring glance duration (less than 2s individual glance requirement) and vehicle control in comparison to use of classic radio (number of lane exceedences or variation in headway distance). Standardized occlusion method (ISO 16673: 2007; Pettitt et al. 2007) is presented and suggested for verification use. And European guidelines also mention Lane change test (LCT) as a possible metric for distraction (ERTICO 2008, p.35; ISO 26022/PRF 2010).
For new concept development guidelines provide the basic direction but it is important to note that guidelines are not always applicable to brand new concepts because of limited scope on well known HMI technologies. Nevertheless, it is recommended to follow guidelines where applicable and develop systems that do not require changes in legislation for market introduction.
2.1.2 Research projects
During the last decade there was a number of national and international attempts to design optimal IVIS interface. These projects involved many experienced specialists, leading companies, multiple prototypes, design iterations, studies and significant resources. For reference this section presents four latest projects from Europe. These projects provided many deliverables that were useful for concept assessment in the present study. Nevertheless the Remote View concept is not a complete solution as the interfaces presented in these projects (the concepts include voice control, steering wheel controls, etc.) and RV is employing technologies (full-colour HUD and touchpad) that were not included in the demonstrated systems. Consequently the RV concept could not be directly based on any of the studied HMI projects.
2.1.2.1 IVSS – Intelligent Vehicle Safety Systems
OPTIVe IVSS project in Sweden was concluded in 2009 (Palo et al. 2009). Within this project there were 5 advanced engineering projects at Volvo Car Corporation that developed a complete IVIS interface through 3 mayor iterative prototypes (Figure 1). The system has a high mounted multifunctional display that is controlled by steering wheel controls (thumbwheel and buttons) and also multifunctional rotary knobs on the central stack.
The system was designed to be accessible, efficient, flexible and safe to use. The project identified the usefulness of the HUD and big multifunctional displays for system output. Steering wheel input is considered to be the primary and safest control method. As well study specifies the importance of “wow” effect and unique design of the system in order to facilitate customer satisfaction. The resulting HMI from this project is due to be in production on Volvo passenger cars in 2010.

CHALMERS, Applied Mechanics, Master’s Thesis 2010:56 8
Figure 1 The first and second prototypes from the IVSS HMI project.
2.1.2.2 AIDE – Adaptive Integrated Driver-Vehicle Interface
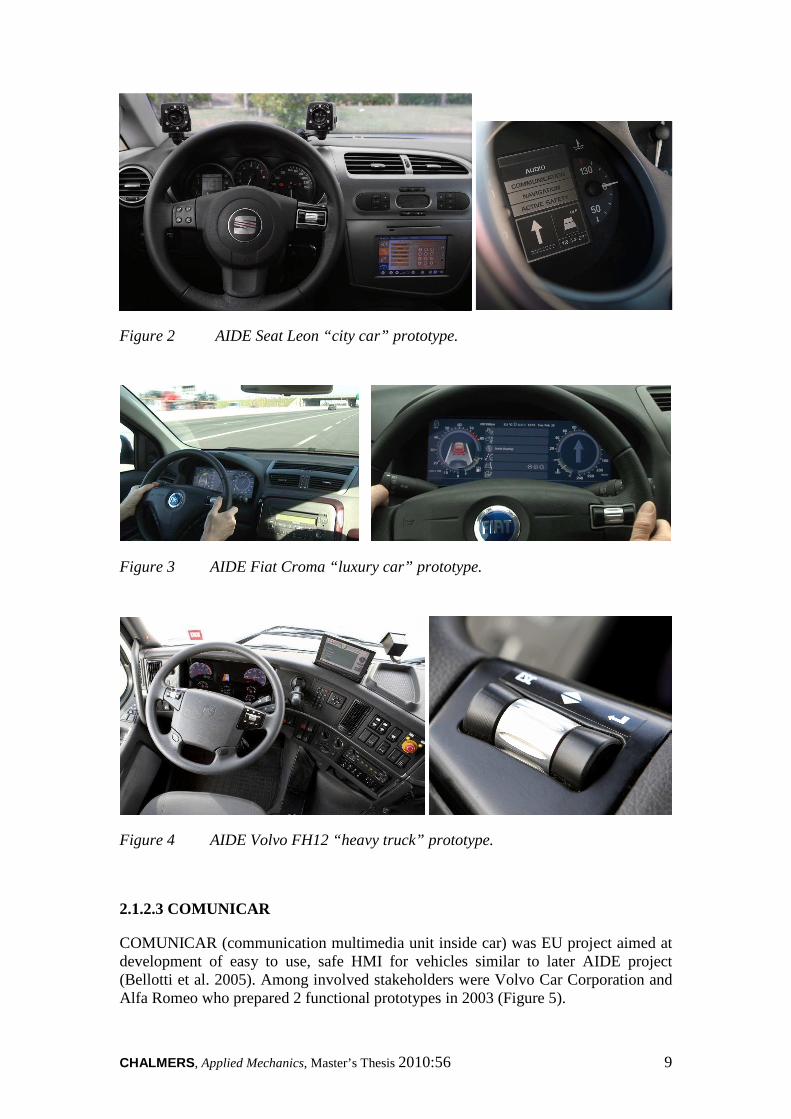
The European Union AIDE project was concluded in 2008 (Deregibus et al. 2008; Rué 2007; Gustav Markkula & E. Johansson 2009). The project conducted over 4 year period included 28 stakeholders with among others mayor European OEMs such as Fiat, BMW, PSA group, Seat (Volkswagen) and Volvo Technology.
The 3 final prototypes by Seat (Figure 2), Fiat (Figure 3) and Volvo Technology Corporation (Figure 4) demonstrate interfaces with haptic barrel key (HBK) on a steering wheel as a main input device. The most noticeable feature of the 3 concepts must be the diversity of solutions. The AIDE project focused on system architecture and safety aspects while it is stated in the concluding document that HMI is an area of competitive advantage and customization that must be OEM specific (Deregibus et al. 2008). The resulting HMI components form a flexible solution that can be implemented in a variety of ways.
Seat implementation consists of large touchscreen for primary GUI and an instrument cluster display controlled by one HBK and additional steering wheel buttons.
Fiat solution uses one HBK to control reconfigurable instrument cluster panel.
Volvo truck solution uses two HBK on the steering wheel and two colour displays – one in instrument cluster and one in the center of the dashboard. In addition Volvo truck also features LED HUD display.
All prototypes have extensive implementation of voice control input-output in addition to manual controls. The project results suggest that the systems are favoured by more than half of respondents and show measurable safety improvements.
As well the methodology used in AIDE development is suggested as a tool for HMI solution evaluation. Most helpful for the present study was the deliverable 2.2.5 about driving performance assessment metrics (Östlund et al. 2005).
CHALMERS, Applied Mechanics, Master’s Thesis 2010:56 9
Figure 2 AIDE Seat Leon “city car” prototype.
Figure 3 AIDE Fiat Croma “luxury car” prototype.
Figure 4 AIDE Volvo FH12 “heavy truck” prototype.
2.1.2.3 COMUNICAR
COMUNICAR (communication multimedia unit inside car) was EU project aimed at development of easy to use, safe HMI for vehicles similar to later AIDE project (Bellotti et al. 2005). Among involved stakeholders were Volvo Car Corporation and Alfa Romeo who prepared 2 functional prototypes in 2003 (Figure 5).

CHALMERS, Applied Mechanics, Master’s Thesis 2010:56 10
Figure 5 Alfa Romeo 147 and Volvo S60 based COMUNICAR prototypes
The resulting HMI from COMUNICAR project uses rotary-haptic controller to control high mounted multifunctional display and also featured reconfigurable instrument cluster. The research work had an emphasis on information management system, user centred design and GUI development. This project can be considered as surpassed by the AIDE and IVSS projects, but it is exemplary that the current HMI in Mercedes Benz (DaimlerChrysler was involved in COMUNICAR project) and Alfa Romeo cars follow the concepts developed in this project.
2.1.2.4 HUMANIST
The HUMAN centred design for Information Society Technologies (HUMANIST) European Union project was conducted in parallel to AIDE in 2004-2008. This project united 23 research organizations from 15 countries in order to develop a broad knowledge base in human factors in IVIS, ADAS and traffic related subjects (HUMANIST website 2004). The project offers a large quantity of public deliverables covering topics such as:
• The report on assessment methods (BASt & TRL 2004) contains one of the most comprehensive reviews on methods for IVIS safety studies (for 2004) that are summed together in one 21 pages long matrix.
• Complete IVIS assessment methodology with tools and methods (A. Stevens et al. 2006) has updated and extended matrix of methods and presents initial structure of an assessment methodology for IVIS and ADAS studies.
• The proposal for common methodologies for analysing driver behaviour (Janssen 2007) contains the most brief and easy to use selection of recommended methods and metrics for driving performance, driver state and usability measuring.
• Common methodology document on test scenario defining (Veste et al. 2007) describes methodology used in HUMANIST, ADVISORS and AIDE projects that is applicable for any IVIS or ADAS study.

CHALMERS, Applied Mechanics, Master’s Thesis 2010:56 11
• Specification of knowledge database on guidelines and design criteria (Cacciabue & Re 2008) covers IVIS classification, HMI design guidelines and state of the art review of IVIS applications.
• Review of knowledge on human centred design (Mårdh 2008) contains guidelines and code of practice for human centred design (HCD) of IVIS, joint cognitive model of driver-vehicle-environment, several methods for IVIS review and also introduces SafeTE method for IVIS evaluation (Engström & Mårdh 2007). The HCD for IVIS application aims to ensure usability and safety of new designs.
• Review of user groups and their needs for ADAS and IVIS (VTT 2006) provides overlook at relevant user groups in relation to design of intelligent transport systems (ITS).
• Review of distraction effects from IVIS (BASt 2007) discuses naturalistic driving field studies (FOT) and situation awareness approaches for IVIS effect studies.
The mentioned reports provide a great introduction to HMI research and allow taking advantage of the knowledge summarized by many experts from whole Europe.
2.2 Performance factors
Successful HMI design relies on a number of factors that must be accounted for in design process. The factors reviewed in this section are mostly safety related but also cover important product success factors.
2.2.1 Cognitive workload
Driving a car is a complex task that in extreme cases can overload driver’s mental capacity in its own regard (Cacciabue & Re 2008, p.20). Driving a vehicle is always considered as a primary task that can not be impaired by IVIS use (Commission of the European Communities 2008, p.4). Depending on classification interaction with IVIS is considered to be the secondary task (Mårdh 2008, p.17) but it can also be considered as a tertiary task (Tonnis et al. 2006, p.128; AblaBmeier et al. 2007, p.2250).
To manage the cognitive load on driver IVIS solutions must be optimized for quick perception (Commission of the European Communities 2008, p.17), consistency, good task support from system and limited use of attention grabbing content such as video. To maximize safety, IVIS interface must be designed with a mindset towards reducing cognitive workload from principal layout throughout design of individual details and content. Therefore workload measurements are among the most important objectives of the experimental verification and testing of HMI.

CHALMERS, Applied Mechanics, Master’s Thesis 2010:56 12
2.2.2 Physical ergonomics
From human factors perspective general ergonomics can be divided into cognitive and physical parts (IEA 2010). Clearly HMI requires physical interaction that is subjected to human physical limitations and anthropometric differences. As a prerequisite for successful HMI the physical ergonomics of the solution must be always maintained at a good level (Niedermaier et al. 2009, p.2): controls must be easily reachable, hands and body must have adequate support for task manipulation, text must be legible and the overall driving environment should follow the ergonomics requirements and standards.
2.2.3 Display location
Studies have shown that display location has critical impact on secondary task safety (Wittmann et al. 2006; Normark 2009; Rydström 2009). Display position affects the time it takes for a driver to shift view onto the display and back and how efficiently it is possible to use peripheral vision for vehicle control while interacting with IVIS.
The best display position and technology for in-vehicle displays currently is the head up display (AblaBmeier et al. 2007; Kosaka et al. 2006; Liu & Wen 2004). HUD has both the advantage of very good positioning but also better spacial presentation for easier eye refocusing. Proven HUD safety benefit and developments in HUD technology (BMW Group 2009, p.26) allow considering HUD as a more central part of the HMI solution and actively using HUD as a GUI display device.
For other display placement the general rule applies that the angle of view must be as small as possible from the normal road view. AblaBmeier et al. showed in 2007 that even small changes in display position can significantly influence safety, therefore it is considered critical to indicate display position in every HMI study and consider the display position when comparing results.
The most affected by poor display position are usually touchscreens (TS) which are often positioned very low on the central stack following traditional reach requirements. But the examples of cars such as Cadillac SRX (2010) or Infinity M56 (2010) show that it is possible to position TS in a relatively high position similar to remote controlled displays. For touchscreen studies display location is critical both for good reach and for best possible view. There is a possibility that low touchscreen position in most studies is the reason for poor touchscreen safety performance (Rydström 2009, p.27) which is also supported by studies that indicate good TS performance (Horrey et al. 2003).
2.2.4 Multimodality
In the context of this work multimodality is defined as a possibility for input and output via different senses. By using several modalities simultaneously it is possible to better utilize human capacity and prevent overload of single senses (Wickens 2008). For example it is easier to combine tasks in visual and audio modalities than if

CHALMERS, Applied Mechanics, Master’s Thesis 2010:56 13
the tasks share the same modality (driving and talking or driving and reading). Most common interaction is through tactile input and visual output but that is only one solution. Voice recognition is already successfully used for IVIS input (MAIX 2009; Ford Motor Company 2010b). Similarly audio signals and voice is used for system output, for example reading of text messages and playlist tracks. It is possible to add haptic feedback to tactile interaction as well as additional force and vibration actuators for utilising haptic output. For example Infinity uses active “eco pedal” that can communicate excess fuel consumption by force feedback on the foot (Nissan Motor Co. 2008).There is support that users prefer combination of visual, audio (signals; speech) and haptic (vibration) feedback all together (Serafin et al. 2007; Pitts et al. 2009). Therefore haptic feedback and audio-voice interaction are important technologies for modern in-vehicle HMI. In this project multimodality was not central to the development because of focus on touchscreen GUI interaction safety. Nevertheless some aspects of haptic feedback could be implemented in the test setup and there is no doubt that more multimodal additions could benefit a complete HMI solution that would include the tested interfaces.
2.2.5 Interaction principles
Probably the most important and fundamental difference between HMI solution lies in the interaction principle behind the interface. Interaction principles define flexibility, design constraints, some principal aspects of efficiency and safety therefore interaction principle is a major factor of HMI success. Today there are 2 most common primary ways of interaction with the system on the market: rotary controller and touchscreen. As well many OEMs offer multifunctional GUIs with steering wheel control and voice recognition in addition to the primary input method. Other control methods for multifunctional IVIS interfaces available on the market today are “Remote touch” controller by Lexus and Denso, directional navigation buttons or joystick (used in Volvo, some Mercedes cars and others), scroll wheel and wireless remote control with directional navigation buttons (mostly for passenger use).
Often viewed as separate topic are the alphanumeric entry methods that can be on-screen keyboard (typical for TS and directional navigation buttons), circular and linear lists (typical for rotary controllers), numeric keypad (available in Volvo Mercedes, Peugeot and other cars), voice recognition and also fingertip writing which is introduced on a market in an Audi A8 (in 2010). In theory it is possible to realize and optimize text input in a variety of ways (MacKenzie & Soukoreff 2002, p.166) but the main limitations are the intuitiveness and user acceptance. The text input is very significant for multifunctional IVIS (Kern et al. 2009, p.4706; Graf et al. 2008, p.1686; Yang et al. 2007) but voice recognition promises to solve most of the problems.
Voice recognition has reached the level of maturity that makes users demand and actively use such functionality (MAIX 2009; Ford Motor Company 2010b). Considering ongoing development and more widespread availability of voice recognition it can be argued that in the future voice recognition will be the primary mean for alphanumeric entry and therefore other alternatives are becoming less important in terms of usability and safety performance.

CHALMERS, Applied Mechanics, Master’s Thesis 2010:56 14
2.2.6 Interruptability
It is well established that the driver must be able to interact with the system efficiently by individual glances no longer than 2s each (Driver Focus-Telematics Working Group 2006, p.39; Bach et al. 2009, p.458). The driver may divert full attention to driving at any moment. As a consequence it is important that the system supports very long interruptions between interaction chunks from the driver. That means no “time-out”, easy resume of interaction at any system state, no endless repeating of voice prompts, and possibly additional system support for resuming interaction (mostly for voice prompts – additional information about current system state after long break).
Another aspect of interruptability in IVIS design lies in active driver workload management or pacing of information (Cacciabue & Re 2008, p.21). Many research projects study the benefits of pacing and there are systems already on the market that can delay phone calls, warning messages, etc. (Palo et al. 2009, p.6; Bellotti et al. 2005, p.37; Gustav Markkula & E. Johansson 2009, p.16). For IVIS application pacing can be implemented as temporary blocking of features and warning signals for the driver to focus on driving when necessary as well as timing and intensity of voice messages.
2.2.7 Usability
Usability is the focus of the human centred design perspective in IVIS human factors (Mårdh 2008, p.17). Usability performance suggests ease of use, pleasant emotions, intuitiveness, accessibility and efficiency of interaction (Niedermaier et al. 2009). The interface should adopt and be suitable for different users considering their demands, expectations, previous experience, age and culture. There are many guidelines and recommendations in usability for good interface design from computer interaction domain that apply well to modern multifunctional IVIS interfaces. Some of these guidelines are presented in (Mårdh 2008, pp.19, 46; H. W. Johansson 2005, p.18).
It is important to take into account that achieving good usability is a complex task that goes beyond the principal controls, interaction method and GUI as it is tested in most IVIS safety studies. Therefore usability results of research prototypes can be lower compared to the true potential of a fully developed solution.
2.2.8 Customer experience
Besides practical and safety requirements HMI is also a very important aspect of car’s competitive advantage (Deregibus et al. 2008; Ford Motor Company 2010b). It is not enough to provide a solution that is perfect from an engineering perspective – multiple sources state that customer experience is essential for successful HMI (Palo et al. 2009, p.12; Norberg n.d., p.47; Niedermaier et al. 2009, p.445). Therefore HMI design benefits from distinctive, innovative solutions and original design that must also meet the usability and safety requirements.

CHALMERS, Applied Mechanics, Master’s Thesis 2010:56 15
2.2.9 Flexibility
The concept of a multifunctional IVIS suggests integration of all possible comfort and information features as well as expandable platform for user customizable applications. The requirements of today already demand internet browsing, 3D map manipulation and intuitive multimedia content navigation. Therefore success of future IVIS solution will be heavily dependent on the flexibility of control and interaction possibilities of the HMI. In terms of flexibility TS GUI is currently the most promising alternative because it offers the same freedom as most smart-phones and tablet PCs. On the other hand the dedicated controls for audio and HVAC (Heating, Ventilation and Air Conditioning) offer next to no flexibility yet these HMI controls are still used in most vehicles and remain demanded by customers.
Because the range of HMI components used in cars spans from dedicated and inflexible to do-anything very flexible interfaces with many partial solutions in-between (directional buttons; rotary-pushable controllers; rotary-pushable-tiltable controllers with additional buttons and X-Y axis joystick…) it is important to distinguish between levels of flexibility that an HMI component provides. In general less flexible solutions like rotary controllers have their advantages, for example when navigating lists (Rydström et al. 2009) but may be very inconvenient for complex interaction (for example Web browsing) compared to more flexible HMI. In-vehicle HMI is used not only during driving. User might want to access the most complex features while stationary or a passenger might use the IVIS instead of driver. As a result there is a need for HMI components in a vehicle that are very flexible, but perhaps inferior to other alternatives in certain scenarios. The solution could be in hybrid interfaces which combine multiple GUIs and input devices for system control with different interaction methods. Complete hybrid HMI solution has the potential to fulfil highest efficiency-safety targets as well as offer maximum flexibility and accessibility.
2.2.10 Technical aspects
Finally the HMI solution is always dependent on the actual hardware and software implementation. Even the best HMI can be disappointing if the implementation struggles from poor framerate, long loading times, delayed response to user input or program errors.
The latest engineering principles for user interfaces (Ademar 2009) suggest that the implementation should be both well integrated in its hardware and modular in the software. Integrated hardware solution makes it easier to seamlessly control and display IVIS data on multiple devices such as TS, instrument cluster display and HUD simultaneously while processing inputs from multiple different input devices. The modular software development allows easy customization, fitting and expansion of existing software to multiple products and product generations.

CHALMERS, Applied Mechanics, Master’s Thesis 2010:56 16
2.3 Experimental studies
While performance factors influence the success of an HMI solution the most widely used and reliable way to evaluate concepts is performing an experimental study. Experimental setup can wary from presentation of concept on paper drawings up to testing a production ready prototype in an instrumented vehicle on a public road. The most common approach is to use driving simulator (Bach et al. 2009, p.457) but the present study was performed in an instrumented car on a public road. Simulators offer a good balance of cost, time, validity and control over an experiment while instrumented car avoids all simulation fidelity issues for a price of less control over the environment and more noise in measurements. Ultimately in this case the choice of setup was determined by the availability of an instrumented car and problems with access to the driving simulator.
Instrumented vehicles were used even before driving simulators were technically viable but always had many limitations on their use. For HMI studies the main limitation was the complexity of data collection using instrumented vehicle compared to computer generated simulation that has precisely calculated values for all aspects of the simulation. Today instrumented vehicles approach versatility of driving simulators because of availability of data logging from a multitude of built in sensors that are present in a production vehicle, new sensors such as lane-tracking cameras, GPS positioning and radars that can provide data on external environment and availability of compact eye tracker equipment, video recording and necessary computers that can be fitted in a test vehicle. Naturalistic field operational tests (FOT) have developed robust instrumented vehicles that can be often used for HMI research without any modifications. All together instrumented vehicles are more affordable, more efficient and more available in automotive industry than before.
The most believable experimental setting for any driving study is in real traffic. Driving on public road in a real vehicle removes most concerns over unnatural driver behaviour compared to simulated environment where among other issues driver has no penalty even for making a fatal driving mistake. The challenge lies in the limited control over real driving scenario and many confounding factors that can not be excluded from real life setting. The realism and fidelity of real traffic experiment is counterbalanced by noise in measurements, unexpected external events and ethical limitations. Nevertheless, projects such as various FOT projects (Brusselmans 2008) and for example AIDE project demonstrate how real-traffic data is used in modern traffic safety studies. The present study used EuroFOT (ERTICO – ITS Europe 2009) instrumented vehicle from Volvo Car Corporation for assessment of HMI concepts on a public highway. Because there is not enough knowledge on real traffic experiments for HMI evaluation in addition to defined goals, this thesis also provides thorough review of used methodology and experience from the driving experiment and data processing.
Experiment always faces the question of how to efficiently capture the studied effects while maintaining good ecological validity and possibly also be comparable to related studies. Good references for experimental design are the reports from AIDE, HUMANIST and VTI (A. Stevens et al. 2006; Janssen 2007; Östlund et al. 2006; Östlund et al. 2005). These documents summarize and review the methods and

CHALMERS, Applied Mechanics, Master’s Thesis 2010:56 17
metrics for IVIS testing and provide recommendations for making an informed decision.
Another aspect of experimental design is the test scenario definition, and yet again there is a good support from HUMANIST project in this area (Veste et al. 2007). Following a tested methodology helps to ensure quality of experimental design with high work efficiency.
Apart from objective results, from a test scenario there are additional findings possible from an interview and questionnaires for participants (Palo et al. 2009, p.24). There were no definite guidelines found for the content of questionnaires, therefore examples from other studies can be used as well as literature for market research (McQuarrie 1996).
Finally, for every study it is important to identify relevant related studies that help to anticipate results, potential problems and serve as a comparison for result analysis. The present study was inspired by previous study performed at Lindholmen Science Park (Rydström 2009, p.24) that studied several IVIS interfaces in a fixed base simulator. To estimate Remote View effects and define hypotheses a number of papers were reviewed that included HUD displays or touchscreen interfaces in the test setup. Majority of published research was done using driving simulator setups of various complexities. Because there are major differences between different HMI studies there should be no reasons not to compare results from real-traffic experiment to studies performed in various simulated conditions. The reviewed papers are references along the thesis report where necessary.
2.4 Interpretation of HMI research
Even though there is a lot of research done addressing HMI safety while driving, there are many limitations and problems that must be considered when drawing conclusions. In many cases authors’ interpretations can be misleading or the authors’ themselves state many possible reasons for observed results. Even if the study was done up to the best standards there is still a room for uncertainty. Here are some suggestions for spotting problems in automotive HMI studies.
Test environment fidelity may be a factor for differences in driver behaviour. Studies addressing simulator validity or comparing simulated and controlled driving environments (Engström et al. 2005; Östlund et al. 2006; Alm 2007; Bach et al. 2008) have shown that even though fidelity is not crucial, certain observation can be noted – for example increased lateral and longitudinal deviations in simulated environments and differences in eye glance duration. These metrics are safety relevant therefore differences between environments caused by level of immersion or simulator setup problems can influence the absolute measurements and overall safety evaluation.
Unjust test setup – there are cases when compared setups are unevenly optimized, for example in (Ecker et al. 2009) the studied proposed concept is compared to “simpleTouch” interface that is missing several GUI optimizations that provide additional unjustified advantage to the new concept.

CHALMERS, Applied Mechanics, Master’s Thesis 2010:56 18
Too many variables – when compared setups are very different from one another (for example differ in input device, output device and interface all together) it can be difficult to assess the individual weight of each variable in the end result. In gesture interface study (Alpern & Minardo 2003) researchers compared simple radio to gesture interface with HUD visual presentation. Among the results they presented the following quote: “[The gesture interface] helped me keep my attention on the driving more because I didn’t have to take my eyes off the road.” This quote supports HUD display while researchers used it to promote gesture interface.
Implementation details – it is important to know the specifics of the studied HMI setup and experimental protocol before interpreting the results. Possibly the most valuable are the notes and observations about the experiment that can reveal potential for improvements. For example touchscreen interface performance may be reduced because of poor display position (Fuller & Tsimhoni 2009, p.19), unsuccessful GUI software (slow response, inconsistent, poorly visible, too small GUI elements, and various optimization issues) or unresponsive touch sensor (common with older resistive touchscreens). Thus the results presented in most studies may be interpreted as the performance of a concept with the corresponding list of implementation problems. Depending on implementation details, results from one study may be more significant than from another study of a same issue.
Biased presentation of results – results can be presented un-normalized, without taking into account principle differences or the compared setups can be poorly matched. For example visual presentation of navigation information on IVIS is compared only to passenger instructions (Burnett 2000, p.3.1.3), where it could be compared to system’s voice guidance or perhaps reading a paper map while driving.
Correlations between metrics – the overwhelming majority of research papers in automotive HMI area do not present correlation analysis between metrics. It is not uncommon to see strongly correlated metrics to be presented as independent results supporting each other. For example total glance time is likely to be correlated to task completion time in the work by (Fuller & Tsimhoni 2009, p.12). It is often up to reader to interpret which metrics have common confounding factors and which truly provide additional ground for discussion.
Safety definition – the research in HMI evaluation methods is still ongoing and even though there are more common methods (Bach et al. 2009; Östlund et al. 2006; Mårdh 2008) and a few standards for assessing safety (lane change test and occlusion method) there is no proven method for determining unacceptable safety performance. In practice, if there is an interest in positive conclusions, most of results can be interpreted as acceptable for in-vehicle use. Instead of looking for acceptable/unacceptable interfaces it is more reasonable to look for relative comparisons. HMI studies can often motivate which interfaces are better or worse compared to one another, but rarely can interpret the real-world significance of the observed differences.
Long-term effects – for some concepts it is essential that users get familiar with system and attempt to use advanced functionality. Interfaces that are optimized for advanced users may underperform in common short test sessions compared to more accessible or more familiar interface. An example from office environment – beginner will tend to use mouse and GUI to perform copy/paste commands in text editor while

CHALMERS, Applied Mechanics, Master’s Thesis 2010:56 19
in long-term most people find keyboard shortcuts more efficient and worth memorizing. Suitable test procedure that can demonstrate such advantage may be necessary. A common approach is to increase task complexity in order to amplify performance differences and motivate users to adopt advanced functionality, but there is room for unconventional approaches. An example from human computer interaction (Bailly et al. 2008) shows how authors chose completely new method instead of more common scenario execution related measurements. Participants were asked to memorize the structure of several evaluated marking menus to show the advantage of proposed concept as more logical and easy to use than alternatives. Their approach did not provide usual results such as task completion time, but nevertheless provided good objective support to their concept, while avoiding long-term effect issues in experiment results.
In addition it is self explanatory that with so many influencing factors the results from each study can be compared only within the actual study. The list of problems mentioned in this section has no ambition to be complete – the sole purpose is to prepare the reader for interpreting the differences in findings from HMI studies.
2.5 HMI technologies
This section summarizes the result of latest technology analysis that are suitable for HMI use. It covers hardware input-output components with limited attention to interaction principles for each technology. The data comes from many years of car and computer news monitoring as well as additional search for relevant data among publications, OEM websites and tech blogs.
2.5.1 Head up display
Nowadays HUDs are offered by manufacturers such as BMW, Buick, Saab and Peugeot. All current HUDs have no more than 3 possible image colours and have limited resolution. The amount of displayed information is fairly limited to most crucial information from instrument cluster and simple navigation directions. In the upcoming years it is expected that full-colour HUDs will become available to customers and the information content of HUDs will become richer. Both from safety and user experience perspective HUD is a very attractive HMI technology that is currently being actively developed by automotive industry.

CHALMERS, Applied Mechanics, Master’s Thesis 2010:56 20
2.5.2 Instrument cluster display
With development of displays it is already possible to fully replace conventional instruments by full colour displays. Today for example Jaguar already has models with TFT display replacing all instruments while Ford uses 2 multifunctional displays surrounding a single traditional dial in the centre of CL. The big area of such displays allows presenting large variety of graphical information and dynamically reconfiguring CL area to suit current task, mode or user preference. Therefore CL area can be actively used as a part of the complete IVIS as an additional display or other new purposes.
2.5.3 High mounted display
Most displays that require some sort of remote interaction in latest vehicles can be classified as high mounted screens (HMS). Brands such as BMW, Lexus, Acura-Honda and many others have chosen HMS as a central part of their IVIS interfaces.
HMS is usually associated with favourable high and distant position on the dashboard that is difficult to achieve if the screen needs to be within reach of an arm. The safety benefit of high screen position is usually the main argument in favour of remote controlled HMS interface.
Notably depending on interior design, HMS display position may have little to no advantage over placement of some touchscreens (for example in a number of SUVs, Audi A8 2011 or Hyundai Equus 2010). As well vehicles such as Cadillac CTS 2008 have integrated touchscreen in a position that from a visibility standpoint is comparable to any HMS.

CHALMERS, Applied Mechanics, Master’s Thesis 2010:56 21
2.5.4 Innovative display technologies
Augmented reality HUD images from (Doshi et al. 2009) and (T. Poitschke et al. 2008)
Apart from variations and evolutions of existing displays and their positions there are more innovative solutions that have not yet been adopted by production vehicles. Among these technologies are various HUD solutions, for example full windscreen sized projected HUD image (Doshi et al. 2009; GM Media 2010) or augmented reality HUD displays that would allow to present projected image in relation to background and drivers point of view (T. Poitschke et al. 2008). Simplified augmented reality HUD – Virtual Cable (Making Virtual Solid 2010) is advertised as market ready display technology for navigation directions. Different proposals for curved displays, from bent in one plane up to spherical displays that can also be touch sensitive (BMW Group 2009, p.30). 3D stereoscopic displays – that can present depth of an image. And notably half transparent and holographic displays that do not fully obscure the scenery behind them, for example (Hoshi et al. 2009).
2.5.5 Touchscreen
Possibly the most widely used type of IVIS interface, touchscreens can be found on cars from more than 20 brands and almost all aftermarket built in or portable navigation systems. TS represents both output and input device therefore it is often subject of a compromise for good placement that allows for good reach, good visibility and good integration in interior design.
Notably mayor driver for touchscreen interfaces are the smartphone expansion with sophisticated finger operated GUIs and responsive capacitive sensors. Widespread adoption of such devices and the possibility to apply the same interaction principles in-car together with growing demand for IVIS flexibility secure great future potential for TS use in vehicles.

CHALMERS, Applied Mechanics, Master’s Thesis 2010:56 22
2.5.6 Conventional controls and displays
Even with the most sophisticated multi functional interfaces there are very few cars in production that do not make use of conventional controls. An up to date example of car with minimal conventional controls can be Mercedes Benz S class 2010. The reason for great reliance on conventional controls is first of all efficiency and customer demand for easy access to the most essential features such as HVAC and audio system controls that do not require understanding of the car-specific IVIS interface. Another important factor is that apart from latest upmarket vehicles most current cars do not have multifunctional IVIS as standard equipment and therefore must include conventional controls.
Notably some car manufacturers also include a smaller single colour display for conventional information such as interior temperature, clock or current radio station. These displays also provide additional efficiency by enabling independent interaction with basic functions without disturbing for example navigation information on the main infotainment display.
2.5.7 Steering wheel controls
Majority of OEMs offer some control over car functions from the steering wheel. In some cases it is even possible to navigate main IVIS interface using SW controls (Volvo S60 2011). From the car control perspective it is very good to keep both hands on the steering wheel but also such controls are usually not exclusive, because there should be a way for the front passenger to interact with IVIS system as well. Because of inherent driver focus SW controls are often used for more focused GUIs that are better suited for use while driving than the main interface (for example in Ford MyFord Touch system). It is yet to be seen a production use of more complex controls than a 4 way switch or a clickable rotating controller on a SW.

CHALMERS, Applied Mechanics, Master’s Thesis 2010:56 23
2.5.8 Rotary-haptic control
Input devices most commonly used with high positioned display are variations of rotary controller. These controllers are usually placed either next to gear selector or on the centre stack among conventional controls. Despite wide adoption by the industry rotary controller can be a limiting factor of HMI flexibility. An example of the problem can be seen in evolutions of the Audi MMI interface. Over the years Audi first added joystick and now touchpad in addition to RH controller to cope with a need for more navigation flexibility. As well brands such as Infinity and Cadillac try to combine rotary controller input together with touchscreen interface to achieve better overall solution.
2.5.9 Haptic mouse
An innovation from Lexus, joystick like controller that controls highly optimized mouse pointer driven interface is positioned as a better alternative to touchscreen. “Remote touch” overcomes most flexibility issues and initial complexity of Rotary controller while fixing ergonomics issues of TS interfaces. The mayor drawbacks are the complexity and related affordability of the interface for cheaper cars and limited adoption by the industry. While still beneficial to Lexus the technology could remain exclusive to a single brand of upmarket cars.
2.5.10 Touchpad
An input device that is well known to public from portable computers has great potential for future use in cars. The fist example of touchpad use in a production car is in Audi A8 2011. Audi uses TP only for fingertip writing and map navigation, but it is clear that TP can rival touchscreen as one more interface offering the highest level of flexibility. As an interesting alternative to TS, touchpad is one of the subjects of the present study.

CHALMERS, Applied Mechanics, Master’s Thesis 2010:56 24
2.5.11 Remote touchscreen
In 2010 Mercedes presented a functional prototype of a solution named “cam touchpad”. In this system user interacts with touchpad that is as big as GUI screen while the fingers are filmed and shown over the GUI image. The remote touchscreen is promising to fully overcome ergonomic limitations of standard touchscreens while offering the same usability and user acceptance. The present implementation is rather bulky with camera mounted in the centre stack. As of today there is no confirmation on future applications of present concept. As well it is not known how comparable the usability of remote touchscreen is to conventional touchscreen. Until further publications or implementation in production vehicle this technology remains very promising, but uncertain.
2.5.12 Voice control
Besides different methods of interaction that involve driver’s hands a strong alternative of voice recognition and also voice feedback is already present in most premium cars as well as many others. The current voice technology level has reached comfortable recognition rates and rapidly develops in dialogue systems accepting more and more natural speech input. Speech is already a de-facto required in-car interface for premium IVIS control, but it is always in addition to other interfaces. It is unlikely that voice control could replace tactile-visual interfaces despite the known advantages.
2.5.13 Eye tracking pointing
Beyond the available interaction principles, technology developments could potentially enable even better HMI solutions. One such potentially feasible technology could be eye tracker based pointing on the GUI. Such system could potentially reduce the hand motion to pressing a couple of buttons on the steering wheel while maintaining flexibility and directness of a touchscreen GUI.
CHALMERS, Applied Mechanics, Master’s Thesis 2010:56 25
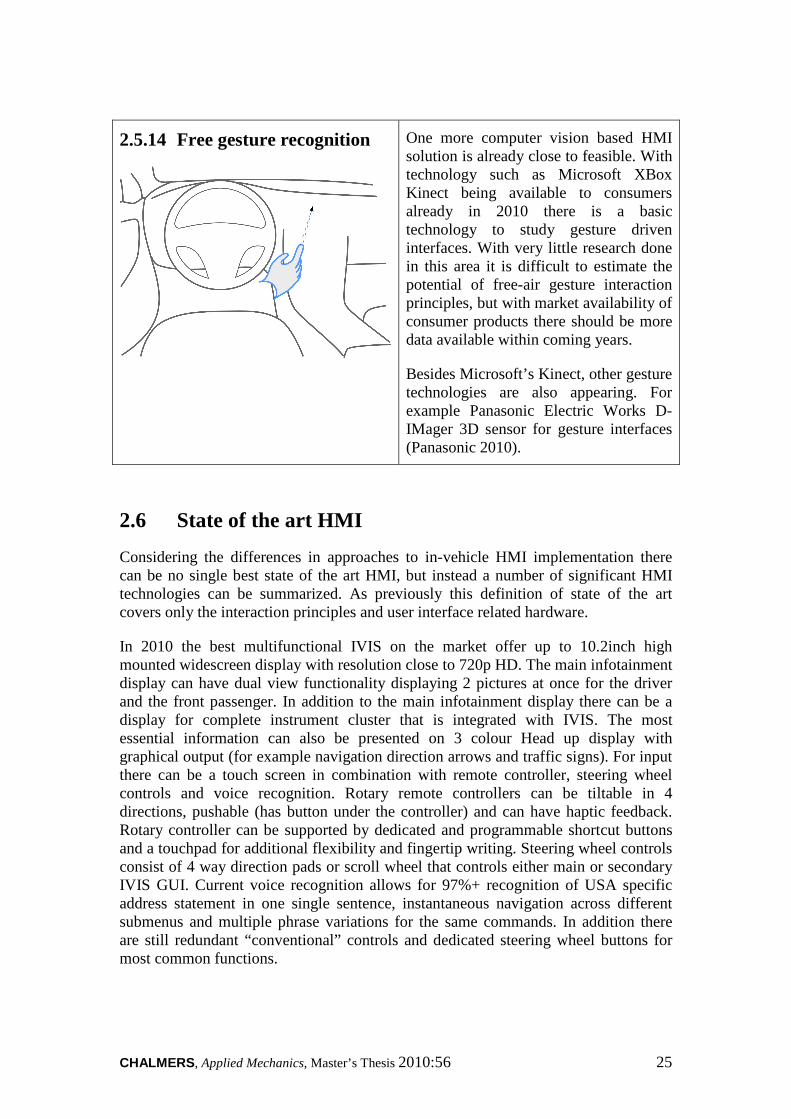
2.5.14 Free gesture recognition
One more computer vision based HMI solution is already close to feasible. With technology such as Microsoft XBox Kinect being available to consumers already in 2010 there is a basic technology to study gesture driven interfaces. With very little research done in this area it is difficult to estimate the potential of free-air gesture interaction principles, but with market availability of consumer products there should be more data available within coming years.
Besides Microsoft’s Kinect, other gesture technologies are also appearing. For example Panasonic Electric Works D-IMager 3D sensor for gesture interfaces (Panasonic 2010).
2.6 State of the art HMI
Considering the differences in approaches to in-vehicle HMI implementation there can be no single best state of the art HMI, but instead a number of significant HMI technologies can be summarized. As previously this definition of state of the art covers only the interaction principles and user interface related hardware.
In 2010 the best multifunctional IVIS on the market offer up to 10.2inch high mounted widescreen display with resolution close to 720p HD. The main infotainment display can have dual view functionality displaying 2 pictures at once for the driver and the front passenger. In addition to the main infotainment display there can be a display for complete instrument cluster that is integrated with IVIS. The most essential information can also be presented on 3 colour Head up display with graphical output (for example navigation direction arrows and traffic signs). For input there can be a touch screen in combination with remote controller, steering wheel controls and voice recognition. Rotary remote controllers can be tiltable in 4 directions, pushable (has button under the controller) and can have haptic feedback. Rotary controller can be supported by dedicated and programmable shortcut buttons and a touchpad for additional flexibility and fingertip writing. Steering wheel controls consist of 4 way direction pads or scroll wheel that controls either main or secondary IVIS GUI. Current voice recognition allows for 97%+ recognition of USA specific address statement in one single sentence, instantaneous navigation across different submenus and multiple phrase variations for the same commands. In addition there are still redundant “conventional” controls and dedicated steering wheel buttons for most common functions.

CHALMERS, Applied Mechanics, Master’s Thesis 2010:56 26
2.6.1 The HMI next
Judging by technology development it can be expected that industry may soon adopt interfaces compatible with modern internet browsing that would include touchscreen, remote touch, touchpad or comparable input device. Rotary controllers are unlikely to remain sufficient for leading IVIS interfaces because of limited flexibility. Head up displays should be able to provide higher resolution and full colour reproduction that would allow use of HUDs for more tasks. In addition to highly flexible primary GUI the need for secondary GUI should remain. Secondary GUI with more limited but simple to navigate structure could be more appropriate for use while driving and can also be displayed on the HUD. Voice recognition and voice feedback should continue to grow in importance and may be the dominating interface for complex alphanumeric entry. As well fingertip writing could become the preferred tactile method for alphanumeric entry enabling more efficient search based interfaces and reducing the advantage of “talking to the car” versus silent tactile interaction. In order to satisfy changing user preferences and enable fast growing internet services it may be viable to closely link nomadic devices to in-vehicle IVIS. The link may be in terms of smartphone control using car HMI or even tighter integration of 3rd party software and services with IVIS.
Better hardware and more demanding infotainment applications are merely the tools and drivers of the future HMI. One more feature or slightly better display is unlikely to significantly improve safety or customer experience, the challenge is to utilize the technology in a more efficient way. Therefore the present study is one of the attempts to improve HMI solutions with innovative use of latest available hardware. The Method chapter introduces Remote View concept (Section 3.2) that is our proposal for a new way to utilize HUD technology in combination with touchscreen.

CHALMERS, Applied Mechanics, Master’s Thesis 2010:56 27
3 Method
This chapter presents all the steps in present study. The majority of work was performed at SAFER Vehicle and Traffic Safety Centre at Lindholmen Science Park with some of the work done at Volvo Car Corporation. The main sections include:
1. Early stages – describes the work done prior to final concept selection.
2. Remote View concepts – presents the main HMI concept developed during this project.
3. Test software and use scenarios – description of all tested concepts, HMI functionality and software limitations.
4. Experimental setup – description of all equipment and hardware used in the real-traffic experiment.
5. Test scenario – real-traffic experiment scenario architecture and summary.
6. Test procedure – describes the procedures followed during testing and encountered limitations.
7. Metrics – thorough discussion of all objective metrics obtained from the data.
8. Questionnaire – brief information about subjective result collection.
9. Processing of results – description of steps, procedures and limitations followed during data processing.
3.1 Early stages
The present project started with planning, review of publications, and preparation of several reviews. During pre-study a State of the art review of production HMI hardware was prepared - 25 examples from most mayor OEMs complete with comparison table. Parts of that review are used for Sections 2.6 State of the art HMI and 2.5 HMI technologies.
Even though Remote View idea was suggested from the beginning of this project, during initial research the objective was set to be explorative. Explorative research focused on better use of HUD to improve infotainment HMI performance. Several alternative HMI concepts were evaluated and one alternative to Remote View was developed to the level of an animated prototype. Evaluation table with 6 alternative HMI concepts was used to present the strengths and weaknesses of the proposed concepts in comparison to best known alternatives. Additionally a review of HMI components from the future perspective was written. The explorative phase was finalized with a presentation of 2 most promising concepts which included Remote View. Feedback from a number of HMI specialists from Volvo Car Corporation indicated that both concepts are worth to investigate further, but to manage the scale of the project it was decided to continue work only with Remote View concept. Because the alternative concept received very good feedback from experts it is considered to be valuable intellectual property of the author and is subject to non-disclosure agreement.

CHALMERS, Applied Mechanics, Master’s Thesis 2010:56 28
Finally before the start of implementation a complete preliminary Remote View specification was written. Specification contains detailed definition, interaction principle, purpose, detailed descriptions of specific features and functions of the RV and a table with all identified GUI use scenarios. The GUI use scenario table serves a purpose of resolving compatibility issues between RV navigation and certain features of TS GUI design. The preliminary specification can be seen in Appendix 1.
3.2 Remote View concepts
From the beginning of this study the main objective was to develop the Remote View idea. In the following sub-sections the outcome of Remote View prototype development is presented. All Remote View descriptions represent the state of the concept as it was prepared for the driving experiment of this study.
3.2.1 Definition and description
Remote View (RV) is an in vehicle HMI element or functionality that enables interaction with fully featured multifunctional graphics user interface (GUI) located on the additional head up display. RV is meant to be controlled from Touch Screen (TS) or Touch Pad (TP) and therefore is most suitable for TS GUI, but could also be adapted to HMIs with alternative input methods. The main feature of Remote View is the ability to fully interact with primary infotainment GUI while looking at the image projected on the road ahead.
Figure 6 shows the main hardware setup of the Remote View: HUD – full colour HUD capable of presenting main touchscreen GUI in readable
size and resolution. TSx – touchscreen used as the primary HMI and also usable as an input device
for operating Remote View TP – touchpad, one more input device used to control pointer on both displays.
Figure 6 Remote View input-output hardware configuration.

CHALMERS, Applied Mechanics, Master’s Thesis 2010:56 29
Two different Remote View implantations were developed and tested:
Dynamic (RVd) – In dynamic mode HUD shows only a part of the complete GUI image (Figure 7). Remote View allows seamless navigation of RVd focus point and making selections on the touchscreen. The dynamic mode potentially allows using more affordable HUD with smaller image dimensions and fairly low resolution while securely presenting even the smallest GUI details. Magnification level could also be user configurable.
Figure 7 Example of the dynamic RV (RVd) view on the HUD and on the TS.
Static (RVs) – The static mode is as simple as a duplicate of the touchscreen GUI shown on the HUD (Figure 8). With an addition of a mouse pointer it is possible to control such view from both TS and TP. In this mode it is essential that the GUI elements are big and detailed enough to be readable on the HUD.
Figure 8 Example of the static RV (RVs) view on the HUD and on the TS.
In all cases Remote View is designed to work simultaneously with any touchscreen GUI with a possibility to choose preferred way of using the complete system at any moment – for example driver can initiate a task with a glance towards TS and continue interaction using RV image on the HUD, later while standing at the traffic light driver can switch to TS interaction because additional driving safety is not needed. As a more complex add-on to TS interface RV is not expected to replace TS. RV is intended for users already familiar with the TS interface in their car. As well the auto-hiding RV image was developed that displays RV image on the HUD only when needed and turns off HUD when not in use. In order to provide maximum usability a number of optimizations and features for RV were implemented which are covered in Section 3.3 Test software and use scenarios.

CHALMERS, Applied Mechanics, Master’s Thesis 2010:56 30
3.2.2 Interaction principle
Depending on input device RV can be controlled differently. Touchscreen always remains unchanged and therefore works in absolute positioning mode – pointer is always directly under the finger surface (the same as on all touchscreen devices). On the other hand TP was tested in conventional relative mode – pointer changes position proportionally to the direction of movement on the TP surface (the same as on all notebook computers). Theoretically it is also possible to use TP in absolute pointing mode, but this mode was dropped at early stages in development as confusing compared to more familiar relative mode.
Together with pointing devices there can be a number of selection methods that work both with RV and also with touchscreen display: tapping on TS, pressing into TS, tapping on TP, clicking buttons next to TP, pressing into TP or second finger tap on a multitouch surface. Out of 6 proposed selection techniques 5 were actually tested and are described in detail in Section 3.4 Experimental setup.
The actual interaction with RV resembles usage of mouse pointer on a computer, but can be more complex in RVd mode. In most simple RVs mode with TP input there are no differences from regular TP usage on a computer. For selection user has to tap/click on a GUI object. To drag an object with TP input requires holding down mouse button that can also be achieved by double-tapping on a movable GUI object. To drag an object using TS user has to simply touch it. Because without looking at TS user does not know where he/she is pointing, most functions are activated on release of a finger. The normal interaction in RV mode with TS input follows this pattern:
1. Putting down finger in any point on the TS and observing pointer position on the HUD;
2. Dragging the finger over TS surface until pointer on the HUD highlights the target object;
3. Performing selection by tapping in the same spot or pressing into the screen.
Note that RV setup should also include TP therefore user can always switch to TP input as well as use TS in conventional way as needed.
Interaction with RVd mode on the other hand includes the dimension of panning the focus point – controlling which part of the complete GUI is visible in the HUD. In Figure 7 an example of RVd view is shown. The general pointer behaviour is the same as for RVs mode, but the focus point follows 2 basic rules:
1. No snapping – If the pointer is over not-interactive background the pointer position is equal to the focus point position and RVd view directly follows the pointer.
2. Snapping mode – snapping can be used differently, 2 tested options are:
• If the pointer hovers over interactive GUI object (button), focus point fluently snaps to the centre of the highlighted object (Figure 7),

CHALMERS, Applied Mechanics, Master’s Thesis 2010:56 31
• If the pointer enters specific area of the GUI, focus point follows the defined rule, for example snaps to the centreline – focus point follows pointers x-axis position but the y coordinate is equal to constant value.
Snapping mode is one of the optimizations developed for RV usability improvement. More complete list of optimizations is described in Section 3.3 Test software and use scenarios.
3.2.3 Purpose and tradeoffs
The main question behind Remote View concept development was: “How can we improve the safety of infotainment interface considering that we already have TS in a car?” With TS as a prerequisite RV is meant to be an affordable optional feature that could enable safer usage of infotainment system while driving. The complete RV concept had to stand up to many HMI development challenges:
Safety – the primary objective of RV concept was to demonstrate potential for significant safety improvement compared to usual TS without significantly changing the actual TS GUI and without interfering with normal TS operation.
Acceptance – TS is renowned for its accessibility and ease of use therefore Remote View must offer user experience that would motivate people to use RV instead of existing TS while driving. Such acceptance can be from safety feeling, additional comfort, higher efficiency or other possible advantage over TS.
Flexibility – RV must be as flexible as the best TS interfaces. No simplifications or limitations to TS GUI could be accepted. Unlike most secondary GUIs with simple menu structure used in cars, RV aims to provide all features of the primary TS interface in a more safe way.
Technology – RV is an example of an innovative use of latest hardware. RV in its current form is not possible without full colour HUD and a capacitive touchscreen.
Hybrid interface – RV is also an experiment into hybrid interface development. System with several display and input device options should satisfy wider range of user requirements and offer a better overall user experience compared to a compromise based only on the “best” interface.
As with any HMI solutions RV has several tradeoffs. It inherits all drawbacks of high visual demand from TS GUI. Because of more complex interaction it was expected that the task completion time will be longer than for TS. The same added complexity was accepted because of intention that RV will only compliment standard TS interface and is intended for users with sufficient experience in the TS GUI of their vehicle.
Even though the RV idea is promising great benefits, there were also potential negative effects that had to be investigated. Some concerns were raised about too high complexity of the RVd mode. Effects of HUD use are also not fully understood – the possible problems of cognitive tunnelling and eye refocusing could not be ruled out

CHALMERS, Applied Mechanics, Master’s Thesis 2010:56 32
(Engström & Mårdh 2007, p.30). Another potential problem was the issue of an additional tracking task – mouse pointing that could interfere with the primary task of maintaining lane position. Nevertheless RV idea is technically feasible, future proof and potentially safer than TS. In order to draw any conclusions it was necessary to perform usability testing and collect driving performance data.
3.3 Test software and use scenarios
The mayor part of the project was the development of a functional study prototype. During a period of approximately 1 month both Remote View modes were coded using Macromedia Director MX. In order to accelerate development and ensure compatibility with existing simulator platform it was decided to base Remote View experiment software of the HMI code developed by Volvo Technology for Lindholmen Science Park driving simulator.
The software development included both Remote View implementation and further development of existing TS GUI. The final GUI has new visual design, many additions and adaptations for RV testing and 2 out of 4 tasks were made from scratch. Because of significant changes only destination entry and phone dialling tasks are comparable to older HMI software used in previous studies (Rydström 2009, p.6).
An important addition to the test GUI is the support for selection by pressing a physical button under touchscreen surface. It allows performing selection without taking off finger from the touchscreen. User can drag the finger on the surface to navigate and directly press into the screen to precisely select targeted point. This selection method is very important for Remote View usability and had to be supported.
The test software used in driving experiment contains 4 use scenarios and 6 types of GUI screens. Table 1 shows all 6 variants of GUI screens for touchscreen and an example of RVd mode image. In RVs mode HUD displays the same image as touchscreen only in smaller overall size and with a round “spotlight” pointer.
Table 1 Use cases and subtasks of the Remote View test GUI
Subtask – use case Touchscreen GUI RVd image
MP3 list – scrollable list.
48 entries long list which can be panned with a finger (“flipped”) over text or dragged by the handle on the right side. In RVd mode uses snapping to line to help navigating the GUI.

CHALMERS, Applied Mechanics, Master’s Thesis 2010:56 33
Sound Settings – continuous adjustments.
Draggable sliders with snapping to marked positions. In RVd mode uses snapping to line as in MP3 list case.
Destination entry – alphanumeric entry via on-screen keyboard.
Typing 6 characters long word using ABC keyboard. In RVd mode features static text input field and letter preview before selection.
Phone dialling – alphanumeric entry via on-screen number pad.
Typing 6 characters long number using numpad. In RVd mode features same enhancements as destination entry screen.
Simple menu
All tasks included navigation over 2 levels of simple menus. Simple menu consists of 6 big static buttons
Start/error screen
Simple screen that introduces each task and appears every time user makes a wrong selection in a subtask. User has to select “OK” to continue.
In the results and discussion chapters only the four main sub-tasks are used for analysis. The four sub-tasks include only the actual unique screens without the Simple menu part of each task. The Simple menu is not analysed primarily because of very brief interaction times that are too short for robust metric analysis.
3.3.1 Iterative Remote View development
Compared to the initial specification the final RV test software has many mayor additions. The reason for substantial changes was the continuous testing and search for usability improvements that would be difficult to accomplish without direct

CHALMERS, Applied Mechanics, Master’s Thesis 2010:56 34
involvement into the software development process. Most notably in the initial specification it was assumed that there is no need for mouse pointer. Relative input from touchpad was considered unnecessary and RVs mode was not specified at all. Other improvements added during development were the Remote View position indicator, many changes and adjustments to object highlighting and some improvements to the test program, for example the display of current task objective in a header of all GUI screens that significantly reduced cognitive load of memorizing each objective.
Following the initial concept the software was optimized for the dynamic RV mode in combination with TS input (RVd1). This combination was most extensively tested and all other modes were derived from RVd1. An example of a feature added during initial testing was RV position indicator – small graphical indicator of current view in relation to the full GUI that is located in the upper right corner of the RVd image (Table 1).
During the Remote View development it was assumed that TS is the primary input device, but Touchpad support was added as well. In fact initial test protocol did not include touchpad input in a full scale assessment. Consequently interfaces were not at all optimized for TP input. There are no TP specific additions to the interface that make certain GUI parts unintuitive and inefficient. For example MP3 list panning using TP is very cumbersome. There was no “mouse over” hovering highlight, which is useful for TP input. The test program was only made to be compatible with TP input, but there are many significant optimizations that could be implemented in future touchpad studies.
In total 6 test interfaces were prepared for comparison testing which are a combination of 3 variants of GUI display and 2 input devices (Table 2):
• TS1 & TS2 – Reference regular touchscreen interaction (TS1) and also touchpad input with image on TS (TS2). HUD is not used. TS selection by tapping (conventional TS interaction) and pressing-in. Touchpad selection by tapping, pressing-in or using any of the surrounding buttons (selection methods are the same for all 6 interfaces).
• RVs1 & RVs2 – Remote View concept with Static HUD image. The HUD is always ON and displays full redundant image from TS. Only addition is a round “spotlight” pointer. In RVs1 case only TS is allowed and in RVs2 case only TP is allowed for input.
• RVd1 & RVd2 – Remote View concept with Dynamic HUD image. The HUD is always ON, shows round “spotlight” pointer but RV image is a zoomed-in portion of the complete TS GUI (see Figure 7 or Table 1 for examples). RVd image is panned by dragging finger on TS surface and in addition snaps to relevant on-screen objects. HUD also features position indicator in the upper right corner to facilitate navigation. In RVs1 case only TS is used and in RVs2 case only TP is used for input.

CHALMERS, Applied Mechanics, Master’s Thesis 2010:56 35
Table 2 Main differences between tested concepts
Interface Input Output GUI view type
TS1 Touchscreen Touchscreen full
TS2 Touchpad Touchscreen full
RVs1 Touchscreen Head-up display full (static)
RVs2 Touchpad Head-up display full (static)
RVd1 Touchscreen Head-up display zoomed-in (dynamic)
RVd2 Touchpad Head-up display zoomed-in (dynamic)
3.4 Experimental setup Initial plan was to perform all experiments in the driving simulator at the Lindholmen Science Park, but because of organizational changes another test platform was used. The experiment was performed in an instrumented car while driving in live traffic. The complete list of used hardware follows (Figure 9):
• Test-bed: 2010 model year Volvo XC70 test vehicle with automatic gearbox equipped with EuroFOT (ERTICO – ITS Europe 2009) compatible logging system. The equipment includes:
o CAN bus logger for recording of all onboard signals.
o 4 video cameras (road view ahead, back view, pedal view and interior view capturing driver’s movement from interior mirror position).
o Forward collision warning and adaptive cruise control with radar and vision system (ACC was not used during experiments).
o Lane departure warning system with lane tracking camera.
o GPS position data.
o SmartEye eye tracking system.

CHALMERS, Applied Mechanics, Master’s Thesis 2010:56 36
Figure 9 Remote View experimental setup with HUD, TS and TP.
• HMI platform : laptop with Windows XP running Remote View test software and HMI data logging using “WireShark 1.2.8” (open source network protocol analyzer).
• Clickable touchpad (TP): Cirque Easy Cat USB touchpad (Figure 10). Custom “clickability” by placing 4 buttons underneath TP that are connected to mouse button. Touchpad is capacitive, without multitouch support, and both hardware buttons were configured as left mouse button.
HUD substitute
(LCD display image reflected in a mirror)
Clickable touchscreen
(with sun visor and hand support)
Clickable touchpad

CHALMERS, Applied Mechanics, Master’s Thesis 2010:56 37
Figure 10 Modified touchpad with added physical buttons underneath.
• Clickable touchscreen (TS): 7" capacitive widescreen touchscreen from development kit 88-F-PMC-70-MDL-01 by Touch International (VGA d-sub, 1024x768, without multitouch support). Custom “clickability” by placing 5 buttons underneath the screen that are connected to right mouse button. Custom flexible screen fixture with palm-rest, sun protection hood and screen border frame. Screen mounted on adjustable fixture frame about 19º down from horizon (Figure 11).
Figure 11 Custom touchscreen installation for Remote View experiment.
• HUD substitute: Custom cardboard mirror holder over 7" widescreen monitor (VGA d-sub, 1024x768). Capable of displaying 640x480 mirrored image. Assembly is placed on top of dashboard as far as possible under the windscreen (Figure 12). HUD position obscured part of the center road view, but it was observed that there was enough visibility for comfortable driving due to relatively small size of display.
Sensitive surface
Buttons next to TP
4 buttons underneath
Sun visor
External frame
Display with inner frame
5 buttons behind the touchscreen display
Hand support

CHALMERS, Applied Mechanics, Master’s Thesis 2010:56 38
Figure 12 Head up display substitute for Remote View experiment (also rectangular enclosure of the eye tracker can be seen in front of instrument cluster).
• Additional hardware: USB-VGA adapter, Apple Airport Express wireless router, USB hub, additional USB mouse, 220V DC-AC convertor.
The complete test setup was made to be installed and uninstalled from a vehicle within few hours. As the setup had to be removable and the study had a strictly limited budget, there were several limitations:
• The touchscreen was positioned closer to the driver than it would be positioned if the screen would be built into a dashboard. As well screen was installed in rather high position (19º from horizon) as it is assumed that display height is a significant performance factor (see 2.2.3 Display location).
• It was not possible to use actual projected HUD display. For simulating colour HUD a simple custom construction with an LCD screen and a mirror was used. This setup is similar to some HUD setups used in simulator studies (Normark 2009, p.76). Image quality was more than adequate with good readability in bright sunlight. But despite good display position and image quality the present setup does not project image 2-3 meters away from the driver therefore it is more difficult to refocus during driving and it might have negative impact on perception of the road environment compared to actual projected HUD.
• Touchpad position was limited to the available space on the console and therefore it was positioned in un-ergonomic position too far behind gear selector. Most drivers had to adopt awkward arm position to efficiently use the TP. Better TP position could improve physical comfort of prolonged use.
• Simultaneously with Remote View testing the present study also could evaluate alternative input devices. The test setup features 5 different selection methods:
• Tapping on TS – the conventional selection method on TS devices.

CHALMERS, Applied Mechanics, Master’s Thesis 2010:56 39
• Pressing into TS – physical displacement and button “click” feedback from custom made TS assembly gave a new dimension to TS interaction. This method was specifically implemented for RV modes, but it is also interesting as a potential improvement to regular TS.
• Tapping on TP – all modern touchpad pointing devices support tapping for selection and double-tapping for dragging. This method requires the capacitive touchpad surface and therefore is the primary input method for TP.
• Clicking buttons next to TP – even though TP supports tapping, most TPs come with physical mouse buttons. The experiment observed the importance of physical buttons while driving. When interaction requires dragging a GUI object, additional buttons are simpler than double-tapping alternative. Furthermore physical buttons may be preferable in other use cases too.
• Pressing into TP – consistently with clickable touchscreen, touchpad was also equipped with buttons that allow physical displacement and button feedback under the whole TP surface.
During training drivers had at their disposal 4 out of 6 test interfaces with 2 display devices, 2 pointing devices and 5 selection methods available simultaneously. Such hybrid setup gives the freedom of finding the most suitable combination and permits switching between devices depending on task or traffic situation. As a result it was expected that participants will have enough experience and possibility to compare each element to provide clear judgement.
3.5 Test scenario
The test scenario was initially defined for simulated environment, but as an experiment was performed in an instrumented car in live traffic the current scenario description reflects the actual conditions experienced during testing.
The studied population were 22 drivers who represent a mix of experienced drivers from various age and gender groups. It was defined that participants should represent both population that often uses modern touchscreen devices and also people who have little to no touchscreen use experience. There were no professional drivers; otherwise it is assumed that if person willingly agrees to take part in experiment, their driving experience is sufficient. Because of budget limitations and confidentiality issues the participants were selected among Volvo Car Corporation employees. This means that population was limited to persons with higher education, technical profession and it was very difficult to reach gender balance target.
The real-traffic driving was performed on a highway with up to 110km/h speed limit. Drivers were instructed to maintain their lane and drive forward along with the traffic. There were no additional requirements or interference apart from secondary HMI testing.
Scenario architecture is summarized in Table 3 using formatting provided by HUMANIST project (Veste et al. 2007, p.20).

CHALMERS, Applied Mechanics, Master’s Thesis 2010:56 40
Table 3 Scenario architecture (based on HUMANIST methodology)
Global Objective of investigation
Evaluation of 4 versions of Remote View infotainment HMI in comparison with touchscreen
Specific objective Collecting measured data and subjective feedback about safety and usability aspects of tested interfaces.
Driver’s characteristics
Studied population Gender: 2 female and 20 male participants (initial target – 50% female, 50% male)
Background: All professionally working in automotive industry R&D, some working specifically with HMI.
Age: 26 … 47 years, median age – 38.
Driving experience: Criteria set to be “if the person is willing to take part in driving experiment, he/she must be experienced enough”. No professional drivers.
Touchscreen experience: 50% use smartphone (iOS based, Android based or comparable device), 50% do not use modern TS devices regularly.
System characteristics
Type of system Multifunctional IVIS (navigation, media, phone, etc.). Fully operational development prototype with only the necessary functionality and minimalistic GUI design.
Additional details are covered in Section 3.3 Test software and use scenarios.
Man Machine interaction 1) Reference touchscreen interaction (TS1).
2) TS with touchpad input (TS2).
3) Four variants of Remote View prototypes. See details in Sections 3.3 Test software and use scenarios and 3.2.2 Interaction principle.
Interaction mode Input: haptic (touchscreen, touchpad and supporting selection buttons)
Output: visual only (TS or HUD)
Driving Situation characteristics
Road context Highway with separating barrier and 2+ lanes in each

CHALMERS, Applied Mechanics, Master’s Thesis 2010:56 41
direction. Speed limit up to 110km/h.
Infrastructure Some moderate bends and inclination changes along the road.
Local driving goal Driving forward at a comfortable pace or behind the vehicle up front without changing lanes.
Traffic Very dependent on time. Moderate to light traffic in most cases, with heavy traffic on some occasions (down to 20km/h and continuously changing speed).
Weather Good visibility summer time, dry conditions.
Lighting Daylight, direct sunlight or overcast.
External events Mostly minor disturbances such as individual slower moving vehicles or heavy traffic.
3.6 Test procedure
For the purpose of organizing the experiment a separate Procedure script was written prior to experiment. In addition to step by step instructions for test procedure the document also contains descriptions of experiment’s purpose, expected results, method, collected data and the forms used for collecting notes and subjective feedback. The complete procedure script with modifications introduced after the initial test runs is included in Appendix 2.
The experiments were performed during 6 days long period. Out of 24 planned tests 22 were conducted. All participants signed a consent form before driving. The consent form is available in Appendix 3. Some tests were as short as 1.5 hours but majority of tests were done precisely in 2 hours (Figure 13):
• 30-40 min – introduction, first try and stationary training;
• 20 min – driving training on the way to highway (in rush hours up to 30 min);
• 20-30 min – interface tests (in exceptional cases up to 45 min);
• Remaining time – road back to parking, interview and, if enough time was left, filling in the questionnaire while stationary.

CHALMERS, Applied Mechanics, Master’s Thesis 2010:56 42
0h
Introduction, First try, Stationary training
Drivingtraining Testing
Road back, Interview, Questionnaire
1h 2h
30 – 40 min 20 – 30 min20 min ~ 30 min
Figure 13 Actual experimental session timeline.
In order to fit complete experimental session in 2 hours it was necessary to limit randomization between interfaces. As practical tests showed that 3 interfaces with TS input usually take longer time than TP input interfaces, it was decided to always perform 3 TS input interface tests on the way away from start/finish and consequently perform 3 TP input tests on the way back. If full randomization was to be used on the chosen test route there would be an uncertainty of how far to drive away from start/finish to manage all tests on the way back before the last exit from the highway. If longer test sessions would be possible, the solution for example could be to perform all 6 interface tests in randomized order while driving away and then repeat all 6 tests on the way back. In existing conditions decision was made in favour of testing all interfaces in 2 hour session limit against more robust and scientifically correct fully randomized protocol. This mayor issue is further discussed in relation to results in Section 4.1.
3.7 Metrics
For objective interface evaluation a number of metrics were analysed. The choice of metrics was based on literature review, but the final set was determined after analysis of actual collected data. Not all planned metrics were actually used because of various issues with data collection, confounding factors and data quality limitations.
Driving in live traffic makes it challenging to collect reliable data. The logged data includes artefacts from various traffic conditions, variations in road environment, sensor limitations and unexpected driver behaviour. Some of these confounding factors can be identified and accounted for, but in many cases it is not possible and therefore metrics may contain considerable amounts of noise. Common considerations caused by live traffic environment were:
• As the vehicle speed is directly affected by traffic none of the longitudinal control metrics are considered usable for driving performance analysis.
• Longitudinal control metrics were usable only after data clean-up routines.
• Ethical considerations and accident risk limits the complexity of test setup. In order to limit stress it was decided not to include Visual Detection Task (VDT) that was planned for mental workload measurement. As well participants often chose not to test most difficult interfaces because of safety concerns.

CHALMERS, Applied Mechanics, Master’s Thesis 2010:56 43
The metrics analyzed for Remote View study should provide the necessary amount of results to draw conclusions on the main hypotheses. In addition to metrics analyzed for Remote View study, more metrics could be derived from the logged data. Because of time constraints within a context of a Master’s thesis only the most indicative available metrics were used. Most metrics are used for safety assessment, but mean vehicle speed and standard deviation of speed were prepared for confounding factor analysis against other metrics. The metrics are summarized in Table 4.
Table 4 Objective metrics used for Remote View safety analysis
3.7.1 Task completion time (TCT)
Description & meaning:
Time between start and end of every sub-task. Longer TCT has negative safety influence because of longer exposure to increased risk while dealing with secondary tasks. Provides basic usability and efficiency rating.
Notably it is also possible that an interface can be slow, but providing significantly better comfort and vehicle control. Study from (Sasanouchi et al. 2005, p.8) and also results from (Horrey et al. 2003, pp.1882, 1883) suggest that even if TCT using HUD is longer, standard lane deviation is still smaller, therefore TCT can not be directly related to safety. TCT from safety perspective must be interpreted in combination with other safety relevant metrics.
Overall it was expected that Remote View concept will take more time to interact with than TS because RV can be classified as a remote controlled interface and studies show that TS is often significantly faster (Rydström 2009).
Possible confounding factors:
The results were indirectly affected by traffic conditions and personal approach to task completion of every test person. Some people were trying to finish task as quickly as possible while some even made breaks while performing a single task.
Type of metric: Continuous value (within 1…200 s, depending on sub-task)
Task impact: Not all subtasks were equally optimized for each interface:
• It was not optimal to select tracks in MP3 list in RVs1 and RVd1 modes because users could not use “pressing into the screen” for selection. Instead only basic tapping on the screen was possible.
• The menu part of the Sound settings task was simpler than other menu subtasks because of very favourable button positions – it required only minimal pointer movement to complete the subtask.
• The first 4 participants did not have clickable TS possibility in

CHALMERS, Applied Mechanics, Master’s Thesis 2010:56 44
RVs1, RVd1 and TS1 modes because of hardware issues.
Data quality: • All the data was recorded by HMI computer and has up to 60Hz data sampling precision.
Requirements: A check for outliers is needed to limit data variation.
3.7.2 Standard deviation of lane position (SDLP)
Description & meaning:
An indicator of a lane keeping performance. Bigger SDLP suggest increased risk of lane departures and increased visual workload. Under heavy cognitive workload SDLP can also decrease compared to baseline driving.
∑=
−−
=n
ii xx
nSDLP
1
2)(1
1
ix – distance to the edge of the left lane
x – mean distance to the edge of the left lane
n – number of data points
SDLP metric is very sensitive to data sample duration. To address TCT differences a variant of SDLP called Modified SDLP can be used. MSDLP is proposed by AIDE project and includes filtering of data with high pass filter that ensures reliable SD value after as little as 10 seconds of interval duration (Östlund et al. 2005).
From available studies it is difficult to predict the results of the RV test interfaces. Previously Horrey (Horrey et al. 2003, pp.1882, 1883) found no difference in absolute lane deviation when comparing HUD to TS tasks. Paper by Sasanouchi (Sasanouchi et al. 2005, p.8) shows that for most tasks HUD with steering wheel buttons is safer than conventional controls.
Possible confounding factors:
• In some cases if the vehicle in front of the test car was driving very poorly it could have affected SDLP. Drivers tend to use leading vehicle as a reference, therefore lane position variation of the leading vehicle can impact SDLP metric.
• Steering wheel grip might affect the lateral control of the vehicle. If participants altered grip between interfaces it might have an impact on the results.
• Lane position could be affected by traffic and road geometry.
• There were cases of overtaking and manoeuvring during testing that invalidate the lane position data because driver is intentionally deviating from the lane centre. To account for

CHALMERS, Applied Mechanics, Master’s Thesis 2010:56 45
lane changes all data during detected lane change events is omitted.
Type of metric: Continuous value (within 0 … 0.5 meters).
Task impact: The longer task completion times also impact the SDLP metric. At least within first 60 seconds SDLP is directly affected by interval duration. Such effect can be misleading and completely outweigh the driving performance differences. MSDLP metric is also provided in order to avoid this limitation.
Data quality: • Part of the data is missing because of insufficient tracking quality from the lane tracking camera.
• Data with detected lane changes is omitted from analysis.
Requirements: • At least 90% of data points must be valid.
• The minimum acceptable duration of analyzed interval for MSDLP metric is 10 seconds (using 0.1Hz filtering).
3.7.3 Lane departure frequency
Description & meaning:
Relative amount of registered cases of unintentional driving over the lane marking. Every lane departure is a rough lane tracking mistake that could potentially lead to an accident. As the number of performed tests for interfaces is not equal, the actual metric used is the ratio of departures per interface test.
From published data (Sasanouchi et al. 2005, p.8) it is known that number and severity of exceedences was lower when using HUD compared to conventional controls.
Possible confounding factors:
• It is possible that the total number of lane departures is proportional to total TCT. In such case faster interfaces are also less likely to record as many lane departures as comparable interface with longer task completion times.
• In some cases drivers detected lane departure by sound and vibration from the rumble strips on the right edge of the highway. These near-departures and other undetected lane departures are not counted.
• The presence of LDW system could have affected driver judgment of safety risk leading driver to rely on warnings for lateral tracking assistance (Östlund et al. 2005, p.23). If such adaptation takes place, lane departure events can be treated as anticipated driving support message instead of critical failure of tracking task.
• There are very few recorded lane departure events for some

CHALMERS, Applied Mechanics, Master’s Thesis 2010:56 46
interfaces making the data very sensitive to individual recorded events.
Type of metric: Integer (within 0 … 30 occurrences per interface)
Task impact: None – lane departures were counted for a complete interface test
Data quality: • Detection threshold defined by existing LDW system.
• Data covers only the lane departures detected by the LDW system, therefore it required reliable data from the lane tracking camera.
Requirements: • All lane departures must be manually confirmed to prevent accounting for lane changes and special cases. In special cases people had several lane departures in a row or had lane departures while being distracted from the secondary task because of a random event. Such cases have little connection to tested interfaces and therefore could be considered as unreliable.
3.7.4 Steering wheel reversal rate (SRR)
Description & meaning:
The number of steering wheel adjustments per minute. Depending on cut off frequency and minimal angular threshold SRR can be tuned to be indicative of overall HMI impact (visual load) or more specifically cognitive workload (Gustav Markkula & Engström 2006, p.10). Both variants are used:
• Visual SRR – fLP = 0.6 Hz and 2 deg gap size.
• Cognitive SRR – fLP = 2.0 Hz and 0.1 deg gap size.
In case of visual SRR another gap size of 3 degrees was also calculated, but after comparison of results it was decided that 2 degree gap is more suitable for data from the present study.
Increased SRR values indicate greater effort in coping with corresponding visual or cognitive workload (Östlund et al. 2005, p.128; Gustav Markkula & Engström 2006, p.4). As with most known metrics there is no known exact relation between SRR and driving safety (E. Johansson et al. 2004, p.19; Östlund et al. 2005, p.72), nevertheless method is used and regarded as sensitive to driver workload.
It is expected that RV concepts will show advantage over TS interface in terms of SRR on the basis of results from Liu (Liu & Wen 2004, p.691). Liu showed that Steering wheel angle variation (deg) and Lateral acceleration variation (ft/s2) were worse for head-down display (HDD) compared to HUD.

CHALMERS, Applied Mechanics, Master’s Thesis 2010:56 47
Possible confounding factors:
• Steering wheel related metrics are influenced by most of the surrounding factors such as traffic, speed, lane width, road curvature, driving strategy, etc. (Östlund et al. 2005, p.47)
• Some drivers used very aggressive corrective steering between glances to the TS. On the other hand when looking at the HUD the driving was much more fluent and comfortable. Such differences that could indicate stress and discomfort are not visible on SRR data. Uneven steering corrections were previously observed and demonstrated using time series analysis (Östlund et al. 2005, p.54), but the data from live traffic environment is often too noisy for analysis.
Type of metric: Continuous value with range dependent on chosen parameters [1/minute]
Task impact: None
Data quality: • Data is sampled with 10Hz frequency and better than 0.1deg resolution.
• Data with detected lane changes is omitted from analysis.
Requirements: At least 90% of data points must be valid.
3.7.5 Mean vehicle speed
Description & meaning:
Average driving speed during sub-task. This metric is used only for testing of confounding effects against other metrics. It is expected that there is no statistically significant impact of driving speed on test results.
Possible confounding factors:
In live traffic speed is mostly dependant on traffic conditions and therefore longitudinal control parameters can not be analyzed as a driving performance indicator.
Type of metric: Continuous value within 10-120 km/h
Task impact: Previous studies show that secondary task can cause drivers to slow down to compensate for increased workload (Östlund et al. 2006, p.75).
Data quality: Data with detected lane changes is omitted from analysis because during lane changes speed is often increased for overtaking or passing by slower vehicle.
Requirements: At least 90% of data points must be valid.

CHALMERS, Applied Mechanics, Master’s Thesis 2010:56 48
3.7.6 Standard deviation of vehicle speed (SD-speed)
Description & meaning:
Metric of variation of speed during sub-task. Because of additional complexity of driving with rapidly changing speed while performing secondary task, high SD-speed could lead to decreased driving performance. The metric is specifically introduced in order to quantify speed control complexity introduced by traffic conditions.
Possible confounding factors:
In live traffic speed is mostly dependant on traffic conditions and therefore longitudinal control parameters can not be analyzed as a driving performance indicator.
Type of metric: Continuous value within 0-10 km/h
Task impact: none
Data quality: Data with detected lane changes is omitted from analysis.
Requirements: At least 90% of data points must be valid.
3.8 Questionnaire
In order to collect subjective responses from test participants a four page questionnaire and a few interview questions were prepared. Both forms are included in the end of Appendix 2.
Most questions were prepared specifically for this experiment and are related to user preferences or background information. During the test session experiment leader also collected notes and comments expressed by test person. Collected questionnaire data can be analyzed quantitatively while notes give more personal insight into individual impressions.
To collect sufficient usability and acceptance data it was decided to use proven methodologies recommended by the Humanist project (Janssen 2007, p.16). To score usability participants filled in System Usability Scale (SUS) (Brooke 1996) as a part of the final questionnaire. For rating of user acceptance another tested methodology was adopted - Van der Laan acceptance scale (Van Der Laan et al. 1997).
3.9 Processing of results
As a result of using new test-bed the processing of results for RV study required considerable effort for pre-processing and result extraction. Processing of results was done using MatLab R2010a, MS Excel, PASW Statistics 18 and EuroFOT (ERTICO – ITS Europe 2009) log viewer – FOTware 3.0.
The pre-processing consisted of:

CHALMERS, Applied Mechanics, Master’s Thesis 2010:56 49
• Decoding of WireShark log data and preparing timestamp data for synchronizing between HMI logs and EuroFOT logs.
• Importing HMI subtasks as defined events into EuroFOT log structure.
• Manual synchronization check of HMI and FOT timing by video.
• Adding custom time offsets between HMI and FOT logs to improve synchronization (estimated precision of achieved synchronization is +/- 1 second).
Major part of data processing involved ensuring the highest quality of analyzed data. Data processing included addressing the corrupted data, selection of baseline, cross checking for confounding factors and maintaining at least 90% of valid data for every sub-task’s metric. Finally, correlation and statistical analyses were used to identify significant results.
3.9.1 Minimal data validity threshold
Performing testing in live traffic environment almost for certain introduces data losses for reasons of sensor performance or unexpected events during testing. A common issue is an occasional loss of lane position data due to unreliable lane marking or weather conditions. In case of EuroFOT data all unreliable lane position data was excluded from analysis judging by lane tracking quality signal value. An example of unexpected event can be the participant starting discussion about the present task in the middle of the interface test or change of lane in order to avoid traffic merging into the highway.
When corrupt data intervals can be identified they are excluded from analysis. For purposes of limiting uncertainty due to lost data a minimum threshold of 90% of original interval length is adopted. The threshold check prevents processing of metrics for individual sub-tasks that contain less than 90% of usable data and counts the complete interval as lost data.
3.9.2 Lane change noise quality control
For most drivers lane changes are natural part of highway driving that are performed nearly on skill level without thorough decision-making. Even though participants were instructed not to change lanes during interface tests there was a significant amount of recorded lane changes. If lane changes are not excluded from analysis of lane position dependant metrics they introduce very rough mistakes in calculations. It was calculated that baseline data including lane changes produced more than 50% higher mean MSDLP result than during TS1 interface therefore the metric was misleading. This section describes how lane changes were treated during data clean-up in present study.

CHALMERS, Applied Mechanics, Master’s Thesis 2010:56 50
Because the test vehicle is equipped with LDW system there were next to no cases of lane changes without using turn indicators. Therefore turn indicator usage is a very reliable identifier of a lane change in this study. Figure 14 present an actual extreme example where within analyzed time interval driver made 2 lane changes. Figure 14 “a” shows the original signal, “b” shows which data was deleted by lane change clean-up algorithm and “c” shows the final data used to calculate SDLP and MSDLP metrics. Initially it was implemented that algorithm removes only the data during turn indicator activity (left side of Figure 14). It is clearly seen that for this case deleting time intervals with active turn indicators did not remove enough lane change noise from the signal (MSDLP = 0.39 m). According to (Toledo & Zohar 2007, p.74) lane changes on average take about 4.6 seconds and the example data in Figure 14 suggest that lane change at 80 km/h extends to slightly more than 5 seconds. Improved algorithm deletes additional 5 seconds of data after switching off turn indicators (right side of Figure 14). For this example second method could almost completely erase lane change noise from the data (MSDLP = 0.11 m).
An important conclusion following the ~5 second long lane change duration and 90% data quality threshold is that any studied interval shorter than 50 seconds will very likely be excluded from analysis all together because of insufficient data. In present study majority of tasks are less than 50 seconds long leaving small room for errors introduced by rough lane change clean-up algorithm. As a result all data from interface tests is cleaned up using the logic of “turn indicator activity time + 5 sec”. Even though “turn indicator activity time + 5 sec” is used in present study it is important to understand the limitations of this approach.
The possible issues from “turn indicator activity time + 5 sec” algorithm are:
• Not deleting enough noise in case of very long lane change;
• Deleting excess amounts of usable data in case of very short lane change;
• Ignoring the beginning of lane change if the turn indicators are turned on late;
• Counting interrupted lane changes when driver turns on the indicator but then changes his/her mind and stays in initial lane.
• Not counting lane changes made without using turn indicators.
The present solution uses only indirect information on lane change event and a fixed time interval. If the listed issues are too significant to be ignored a more complex algorithm for lane change duration estimation is needed. For example more advanced algorithm could use the lane position data or vehicle dynamics data to precisely sense beginning and end of the manoeuvre.
As well simple deletion of invalid data is also an issue. For better data treatment the filtering code could be developed to:
• Compensate for spikes in data continuity (Figure 14 c) where deviation based metrics would register very high change (jerk). Better filtering code could delete corrupted data so that joined parts meet at the same value – make the joins of data as smooth as possible.

CHALMERS, Applied Mechanics, Master’s Thesis 2010:56 51
0 100 200 300 400 500 600-3.5
-3
-2.5
-2
-1.5
-1
-0.5
0
0 100 200 300 400 500 600-3.5
-3
-2.5
-2
-1.5
-1
-0.5
0
0 100 200 300 400 500 600-3.5
-3
-2.5
-2
-1.5
-1
-0.5
0
0 100 200 300 400 500 600-3.5
-3
-2.5
-2
-1.5
-1
-0.5
0
0 100 200 300 400 500 600-3.5
-3
-2.5
-2
-1.5
-1
-0.5
0
Figure 14 Lane position data example at ~ 80 km/h (baseline for TestPerson19):
a – Original signal;
b – Detecting and clearing lane change noise;
c – Resulting data after clean-up.
a
c
b
Deleted data during turn indicator activity only:
Deleted data during turn indicator activity + 5 sec:

CHALMERS, Applied Mechanics, Master’s Thesis 2010:56 52
• Address the change in mean speed after lane changes if the lane change was meant to pass slower vehicle. If after lane change vehicle travels significantly faster than before (while overtaking or because the road is free) the change of mean speed can corrupt longitudinal control metrics. Same is true if speed becomes significantly slower (after overtaking or merging into traffic flow). Better filtering code could attempt to use different averages after each lane change.
Overall lane changes present a very complex problem for data processing which can not be fully resolved by logical filtering. If possible test procedures should prevent lane changes from occurring or the data that contains lane changes should be omitted from analysis completely.
3.9.3 Baseline definition and processing
The purpose of baseline is to provide comparison of all results against driving without any specific objective. Often baseline is recorded while participant is consciously driving to the best of his/her abilities for a specified time. Such baseline shows how good a driver can possibly drive the vehicle without any additional load but may not be indicative of how person drives in normal conditions. In this study baseline measurements were approached with a goal to capture natural driving performance, instead of the best possible performance.
The baseline used in the present study is defined as a data sample that excludes all lane changes and poor lane tracking and after all clean-up is precisely 50 seconds long. The road interval is defined by a known GPS longitude end point. Because the test sessions included driving to and from the main testing highway there was a possibility to analyze any part of the approximately 20 min long way back after interface testing as a baseline. The chosen road interval is fairly straight and simple highway road with speed limit 80 km/h, 2 lanes in each direction with separating barrier and rather light traffic. The drawback of chosen road interval is that the speed limit is lower than on the main highway and lanes are slightly narrower. The drivers were not informed about any baseline measurements and were driving freely straight ahead. In most cases during baseline drivers were engaged in conversation with test leader that could be comparable to casual conversation with passengers.
The natural baseline is interesting as an indicator of a comfortable, acceptable level of driving performance. If secondary task performance is not significantly different from such baseline it could be interpreted as driver is able to compensate for additional load from HMI. If driving performance is significantly worse than natural baseline level it is likely that drivers will find such HMI inappropriate for use while driving.
3.9.4 Data loss estimates
Data loss estimates prior to data assessment provide a perspective on result uncertainty. Data loss is estimated based on amount of actually usable data samples – unique values for specific test person and specific metric in comparison to theoretical maximum. Common reasons for data loss may be:

CHALMERS, Applied Mechanics, Master’s Thesis 2010:56 53
• Tests were interrupted or incomplete – if the participant chooses not to perform a certain interface test while driving.
• Insufficient data quality – if more than 10% of data is unusable, complete data interval should be skipped.
• Data not suitable for calculation of metric – some metrics may have specific limitations. The different data requirements cause each metric to have individual amount of total usable data samples.
• Other reasons – data may not be used because it is classified as an outlier, experimental setup problems significantly impacted user performance or there were rough deviations from test procedure during specific tests.
3.9.5 Correlation analysis
The final stage in result processing was the testing for correlations between various metrics. It can be expected that some metrics are affected by time (for example SDLP) and it must be confirmed that traffic and road environment did not have direct effect on driving performance. Correlation analysis was performed on interface level with n=6+1 and then on task level with n=4x6+1=25. In all cases baseline was included in calculations. If metrics are found to be correlated with one another it can significantly alter the possible conclusions from the affected metrics. As correlation results are critical for interpreting all metrics, they are presented and discussed first.
3.9.6 Statistical analysis
The main methods of statistical analysis were:
• Paired two-tail t-tests for comparing differences between two cases;
• Two-way repeated-measures ANOVA with pairwise comparisons (with Bonferroni adjustment for multiple comparisons) was used for comparison of multiple interfaces. If Mauchly's Test of Sphericity indicated that assumption of sphericity was violated, Greenhouse-Geisser corrections for degrees of freedom were used.
The statistical significance threshold was set to α-value of .05. In the present study it was possible to test hypotheses mostly using t-tests on specific interface pairs. Most objective result analysis is based on t-tests. Nevertheless, t-tests were not sufficient for subjective result analysis where more than 2 cases needed to be compared simultaneously. System Usability Scale results and subjective road awareness results were analysed using repeated-measures ANOVA.
Statistical analysis was the last stage of result processing. Results of statistical analysis are presented together with corresponding metrics in the next chapter.

CHALMERS, Applied Mechanics, Master’s Thesis 2010:56 54
4 Results
This chapter contains all results that were found significant. Results are presented in 2 major sections. Objective metrics are based on logged data from HMI software and test car while the subjective results present test person impressions. Readers can observe that objective and subjective results do not always follow comparable trends therefore it is important to match objective and subjective indications before drawing any conclusions. Detailed discussion of the results merging objective and subjective data is the subject of the next chapter.
For reference about interface abbreviations consult Table 2 on page 35.
4.1 Objective metrics
In Section 3.7 most of the considered metrics were discussed. Due to many confounding factors and data quality issues not all metrics were used as initially planned (see Sections 3.7; 4.1.8 and 4.1.2 for details). The main metrics that were found to be sufficiently reliable for interpretation are task completion time (TCT) and two steering wheel reversal rate metrics (visual SRR and cognitive SRR).
Due to limitations of experimental protocol, collected data must be split in 2 blocks (see Section 3.6 for details about test protocol). Interfaces in the first randomized block (TS1, RVd1 and RVs1) were always performed before interfaces from the second block (TS2, RVd2 and RVs2). Consequently order effect must be expected. Because block 2 was always performed after first 3 interfaces (unless some of them were not tested by person) it can be expected that participants had more experience and therefore performed better during 2nd block than during block 1. In order to better interpret the objective metrics readers are advised to study subjective results and the discussion (Chapter 5).
The presented result graphs display error bars based on standard deviation values. Standard deviation is not adjusted for within subject designs therefore deviations include all individual differences between subjects.
4.1.1 Data loss
After data processing and calculation of all metrics, resulting data loss was assessed. Specific data loss estimates are shown together with corresponding metrics in this chapter. Most significant reasons for data loss were:
• Not all interfaces were tested 22 times. During training it was often clear that some of the concepts are too difficult to handle. Only TS1, TS2 and RVs2 interfaces were tested by all 22 participants. 21 person tested RVs1 but only 13 and 14 participants completed respectively RVd1 and RVd2 trials. Therefore RVd modes have roughly 40% less recorded data than TS and RVs modes.

CHALMERS, Applied Mechanics, Master’s Thesis 2010:56 55
• More than 10% of data was unusable. As long as 10% of subtask data interval was compromised by poor lane tracking or a lane change maneuver, the complete 100% of data interval were excluded from analysis.
• Data not suitable for calculation of metric – In case of MSDLP metric it was required that data intervals are more than 10 seconds long, therefore the quickest interfaces suffer great data loss in this metric.
4.1.2 Correlation analysis results
Correlation analysis revealed several statistically significant results (Table 5). Four metrics were found correlated to task completion time:
Table 5 Correlation with TCT, mean speed and SD of speed on task level (including baseline, n = 25)
Correlation with TCT
Correlation with mean speed
Correlation with SD-speed
TCT 1,00 0,18 - 0,90 *p<.001
SDLP 0,78 *p<.001 0,42 *p<.05 0,67 *p<.0012
MSDLP 0,69 *p<.001 0,29 - 0,60 *p<.012
SRR 3deg 0,14 - -0,10 - 0,15 -
SRR 2deg 0,04 - -0,12 - 0,06 -
SRR 0,1deg 0,25 - 0,16 - 0,24 -
Lane departure frequency 1
0,97 1 *p<.01 0,11 1 - 0,97 1 *p<.012
• Both SDLP and MSDLP metrics were found to be significantly correlated to TCT r(25) = 0.78, p<.001 and r(25) = 0.69, p<.001. While it was known that SDLP is dependent on sample interval length, correlation between MSDLP and TCT was not expected. Because of very strong influence of TCT on the two lane position metrics, both metrics are not suitable for standalone interpretation.
• Standard deviation of speed was found to be highly related to TCT with r(25)=0.90, p<.001. This result can not be fully explained, because both TCT
1 – This measure is calculated only on interface level with n = 6.
2 – These correlations are in consequence of strong correlation between SD-speed and TCT.

CHALMERS, Applied Mechanics, Master’s Thesis 2010:56 56
and change of driving speed could have affected each other. It is assumed that there can be confounding effect and both metrics follow similar pattern.
• Even though there are many concerns about lane departure frequency data quality (see Sections 3.7.3 and 4.1.7 for details), the obtained data is correlated to TCT with r(6) = 0.97, p<.01.
Correlation test confirmed that mean driving speed was not a significant confounding factor in the present study. As SD-speed is strongly correlated to TCT there are also correlations with SDLP, MSDLP and lane departure frequency.
4.1.3 Task completion time
Overall results: Task completion time clearly shows substantial differences among concepts. Average TCT across all four tasks is presented in Figure 15 and in more detail for every specific task in Figure 16. From Figure 16 it can be seen that TCT results follow similar pattern in all 4 tested tasks. In Block 1, TS1 interface clearly is the best in terms of TCT and, even though interfaces from Block 2 might have advantage because of order effect, TS1 is substantially faster than all tested interfaces.
Block 1
13,77
52,69
46,71
0
10
20
30
40
50
60
70
80
90
TS1 RVd1 RVs1
TC
T (
s)
Block 2
20,83
39,93
28,58
0
10
20
30
40
50
60
70
80
90
TS2 RVd2 RVs2
Figure 15 Task completion time across four sub-tasks (interface level).
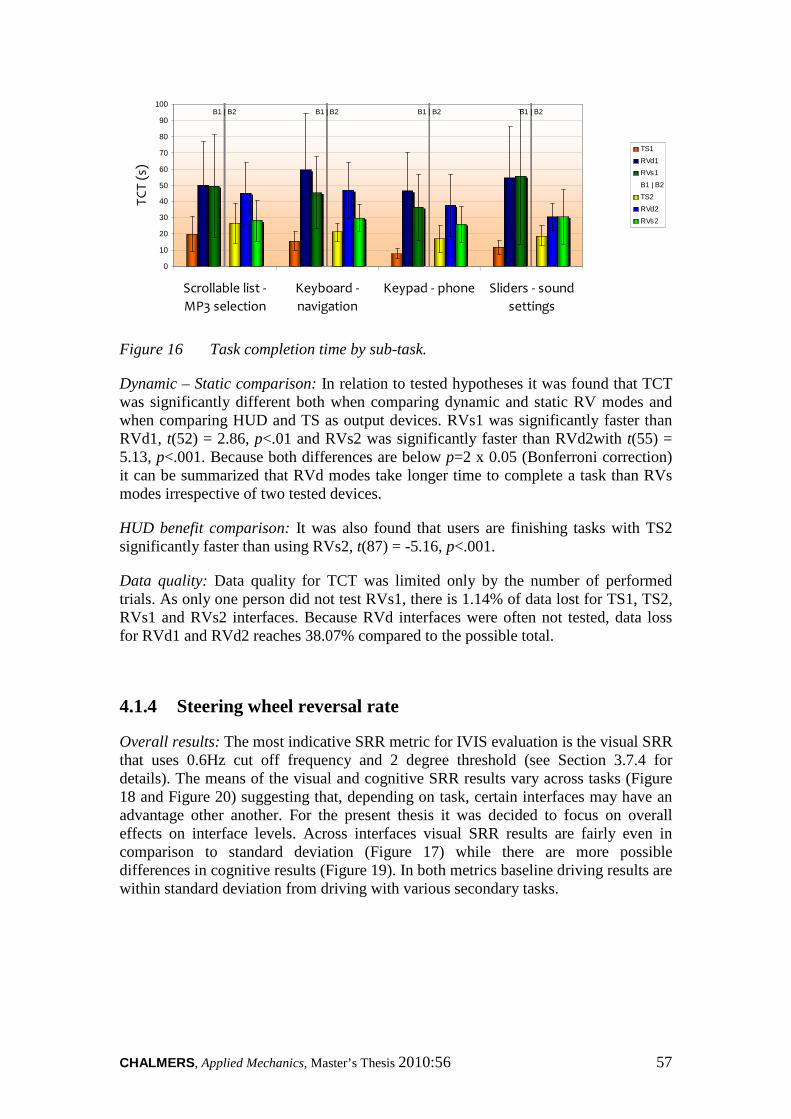
CHALMERS, Applied Mechanics, Master’s Thesis 2010:56 57
B1 | B2 B1 | B2 B1 | B2 B1 | B2
0
10
20
30
40
50
60
70
80
90
100
Scrollable list -
MP3 selection
Keyboard -
navigation
Keypad - phone Sliders - sound
settings
TC
T (
s)TS1
RVd1
RVs1
B1 | B2
TS2
RVd2
RVs2
Figure 16 Task completion time by sub-task.
Dynamic – Static comparison: In relation to tested hypotheses it was found that TCT was significantly different both when comparing dynamic and static RV modes and when comparing HUD and TS as output devices. RVs1 was significantly faster than RVd1, t(52) = 2.86, p<.01 and RVs2 was significantly faster than RVd2with t(55) = 5.13, p<.001. Because both differences are below p=2 x 0.05 (Bonferroni correction) it can be summarized that RVd modes take longer time to complete a task than RVs modes irrespective of two tested devices.
HUD benefit comparison: It was also found that users are finishing tasks with TS2 significantly faster than using RVs2, t(87) = -5.16, p<.001.
Data quality: Data quality for TCT was limited only by the number of performed trials. As only one person did not test RVs1, there is 1.14% of data lost for TS1, TS2, RVs1 and RVs2 interfaces. Because RVd interfaces were often not tested, data loss for RVd1 and RVd2 reaches 38.07% compared to the possible total.
4.1.4 Steering wheel reversal rate
Overall results: The most indicative SRR metric for IVIS evaluation is the visual SRR that uses 0.6Hz cut off frequency and 2 degree threshold (see Section 3.7.4 for details). The means of the visual and cognitive SRR results vary across tasks (Figure 18 and Figure 20) suggesting that, depending on task, certain interfaces may have an advantage other another. For the present thesis it was decided to focus on overall effects on interface levels. Across interfaces visual SRR results are fairly even in comparison to standard deviation (Figure 17) while there are more possible differences in cognitive results (Figure 19). In both metrics baseline driving results are within standard deviation from driving with various secondary tasks.
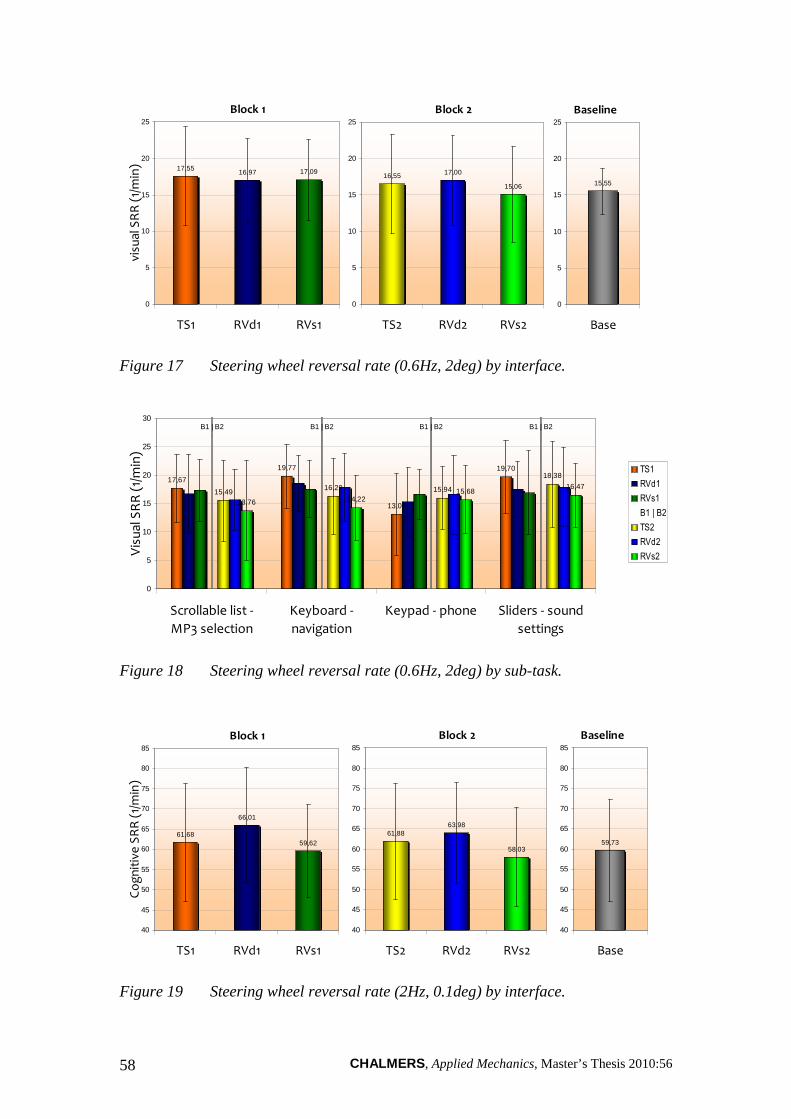
CHALMERS, Applied Mechanics, Master’s Thesis 2010:56 58
Block 1
17,5516,97 17,09
0
5
10
15
20
25
TS1 RVd1 RVs1
visu
al S
RR
(1/
min
)
Block 2
16,55 17,00
15,06
0
5
10
15
20
25
TS2 RVd2 RVs2
Baseline
15,55
0
5
10
15
20
25
Base
Figure 17 Steering wheel reversal rate (0.6Hz, 2deg) by interface.
17,67
19,77
13,05
19,70
B1 | B2 B1 | B2 B1 | B2 B1 | B2
15,4916,29 15,94
18,38
13,76 14,2215,68
16,47
0
5
10
15
20
25
30
Scrollable list -
MP3 selection
Keyboard -
navigation
Keypad - phone Sliders - sound
settings
Vis
ual
SR
R (
1/m
in)
TS1
RVd1
RVs1
B1 | B2
TS2
RVd2
RVs2
Figure 18 Steering wheel reversal rate (0.6Hz, 2deg) by sub-task.
Block 1
61,68
66,01
59,62
40
45
50
55
60
65
70
75
80
85
TS1 RVd1 RVs1
Co
gn
itiv
e S
RR
(1/
min
)
Block 2
61,8863,98
58,03
40
45
50
55
60
65
70
75
80
85
TS2 RVd2 RVs2
Baseline
59,73
40
45
50
55
60
65
70
75
80
85
Base
Figure 19 Steering wheel reversal rate (2Hz, 0.1deg) by interface.

CHALMERS, Applied Mechanics, Master’s Thesis 2010:56 59
B1 | B2 B1 | B2 B1 | B2 B1 | B2
40
50
60
70
80
90
Scrollable list -
MP3 selection
Keyboard -
navigation
Keypad - phone Sliders - sound
settings
Co
gn
itiv
e S
RR
(1/
min
)TS1
RVd1
RVs1
B1 | B2
TS2
RVd2
RVs2
Figure 20 Steering wheel reversal rate (2Hz, 0.1deg) by sub-task.
Dynamic – Static comparison:
• There is a significant difference in visual SRR results only between RVd2 and RVs2, t(53) = 2.51, p<.05, but no clear difference between RVd1 and RVs1 t(49) = 0.36, p>.05. As a result, according to visual SRR criteria during RVs2 there were significantly fewer reversals per minute than during RVd2 tests.
• Cognitive SRR results show clear statistical significance between both dynamic and static concepts. RVd2 differs from RVs2 with t(53) = 4.85, p<.001 and RVd1 differs from RVs1 with t(49) = 5.93, p<.001. Both interface comparisons show that is terms of cognitive SRR static presentation causes fewer steering wheel reversals than during RVd modes.
HUD benefit comparison:
• In terms of visual SRR there is no difference among TS2 and RVs2, t(81) = 1.73, p>.05. Because t-test result (p=.087) is not far from significance threshold of p<.05, additional ANOVA tests were performed. Two-way repeated measures ANOVA on task level confirmed that there are no significant effects among TS2 and RVs2 data. Main effect of interface was not significant, F(1,16) = 3.81, p>.05. Analysis by tasks also did not show significant differences, F(3,48) = 2.20, p>.05. Finally there were no interaction effects between tasks and interfaces in case of TS2 and RVs2, F(3,48) = 0.87, p>.05.
• Contrary to visual metric, in terms of cognitive SRR, TS2 causes significantly more reversals per minute than RVs2, t(81) = 2.62, p<.05.
Data quality: SRR data was marginally affected by lane changes. Only 2.84% of TS and RVs data was unusable. In case of RVd interfaces 40.63% from possible maximum of data is missing. Practical data loss can exceed quoted percentages because of paired comparison. For t-tests on interface level possible maximum number of measurements N = 88 (4 tasks performed by 22 test persons). Used data intervals include no less than 90% of initial interval length.
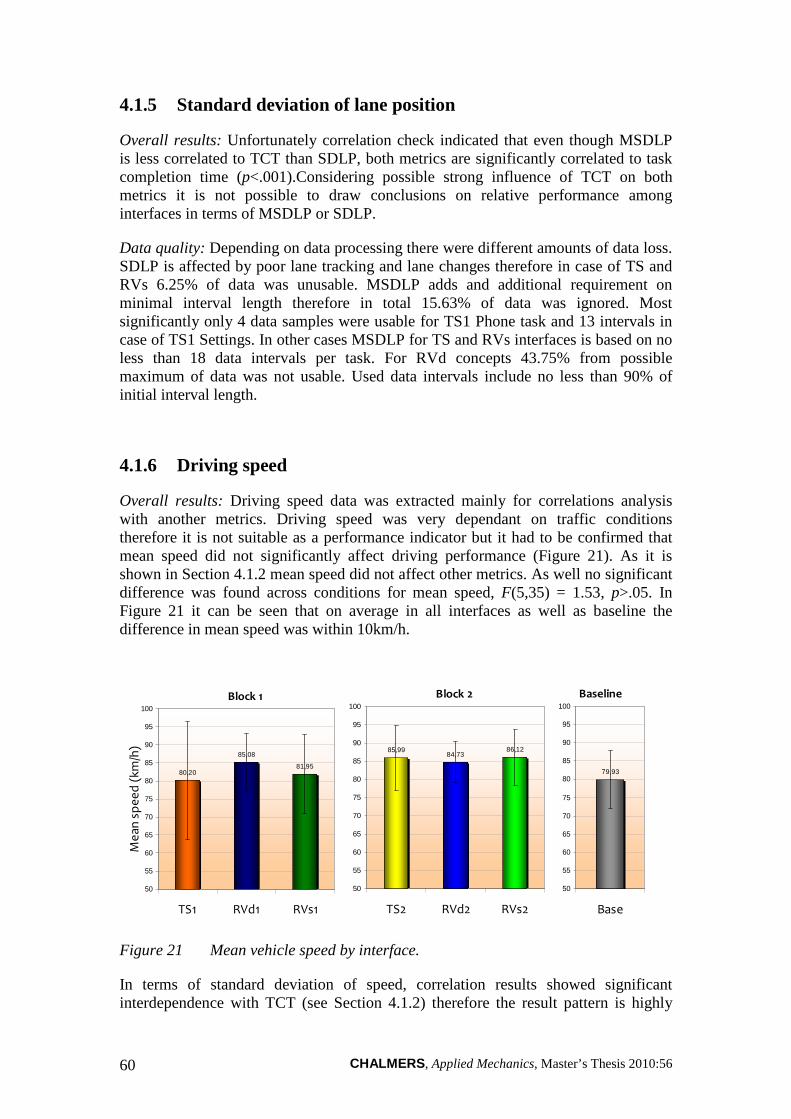
CHALMERS, Applied Mechanics, Master’s Thesis 2010:56 60
4.1.5 Standard deviation of lane position
Overall results: Unfortunately correlation check indicated that even though MSDLP is less correlated to TCT than SDLP, both metrics are significantly correlated to task completion time (p<.001).Considering possible strong influence of TCT on both metrics it is not possible to draw conclusions on relative performance among interfaces in terms of MSDLP or SDLP.
Data quality: Depending on data processing there were different amounts of data loss. SDLP is affected by poor lane tracking and lane changes therefore in case of TS and RVs 6.25% of data was unusable. MSDLP adds and additional requirement on minimal interval length therefore in total 15.63% of data was ignored. Most significantly only 4 data samples were usable for TS1 Phone task and 13 intervals in case of TS1 Settings. In other cases MSDLP for TS and RVs interfaces is based on no less than 18 data intervals per task. For RVd concepts 43.75% from possible maximum of data was not usable. Used data intervals include no less than 90% of initial interval length.
4.1.6 Driving speed
Overall results: Driving speed data was extracted mainly for correlations analysis with another metrics. Driving speed was very dependant on traffic conditions therefore it is not suitable as a performance indicator but it had to be confirmed that mean speed did not significantly affect driving performance (Figure 21). As it is shown in Section 4.1.2 mean speed did not affect other metrics. As well no significant difference was found across conditions for mean speed, F(5,35) = 1.53, p>.05. In Figure 21 it can be seen that on average in all interfaces as well as baseline the difference in mean speed was within 10km/h.
Block 1
80,20
85,08
81,95
50
55
60
65
70
75
80
85
90
95
100
TS1 RVd1 RVs1
Me
an s
pe
ed
(km
/h)
Block 2
85,9984,73
86,12
50
55
60
65
70
75
80
85
90
95
100
TS2 RVd2 RVs2
Baseline
79,93
50
55
60
65
70
75
80
85
90
95
100
Base
Figure 21 Mean vehicle speed by interface.
In terms of standard deviation of speed, correlation results showed significant interdependence with TCT (see Section 4.1.2) therefore the result pattern is highly

CHALMERS, Applied Mechanics, Master’s Thesis 2010:56 61
similar to the pattern of TCT. The correlation suggests that there is a connection between the two metrics but the exact nature of correlation could not be explained.
Data quality: Vehicle speed based data has the same data loss as SRR data. Only 2.84% of TS and RVs data was unusable. In case of RVd interfaces 40.63% from possible maximum of data is missing. Used data intervals include no less than 90% of initial interval length.
4.1.7 Lane departure frequency
In Section 4.1.2 it was shown that lane departure frequency was significantly correlated to task completion time. In addition lane departure frequency results should be observed with caution because of many data quality issues (see Section 3.7.6). In case of the “best” interfaces TS1 and TS2, just 3 lane departures were detected during 22 interface tests, but if there is at least one more lane departure that was not detected by LDW system the resulting frequency would be significantly bigger. As well in case of RVs1 interface out of 16 detected lane departures it could be argued that 4 are not accountable, because drivers were influenced by another events, therefore the presented frequency of 0.76 under different judgment can as well be equal to 0.57.
Despite of high uncertainty in actual frequency values the results presents interesting possible overall trend (Figure 22). The pattern suggests that despite the interface differences, dangerous driving mistakes (lane departures) occur more frequently when overall time on task is longer
Block 1
0,0
0,2
0,4
0,6
0,8
1,0
1,2
TS1 RVd1 RVs1
Lan
e d
ep
art
ure
fe
qu
en
cy
Block 2
0,0
0,2
0,4
0,6
0,8
1,0
1,2
TS2 RVd2 RVs2
Figure 22 Lane departure frequency by interface.

CHALMERS, Applied Mechanics, Master’s Thesis 2010:56 62
4.1.8 Eye tracker data
Among the collected data EuroFOT test vehicle provides also eye tracker information. As the data is collected using image processing of the driver’s face view it is has many limitations and data quality may be insufficient.
After pre-processing of results it was decided not to use eye tracker data for analysis because of the following reasons:
• The eye tracker used in the test setup can not reliably discriminate between glances towards HUD display and road view. Because of this limitation it is impossible to calculate any of the commonly used eye metrics for RV modes. With data available only for TS1 and TS2 it is of limited use for testing of hypotheses.
• People were told to look exclusively at HUD while performing RV mode tests. On one hand such instructions reduce ecological validity of experimental trials but on the other hand, if participants would have a freedom to use both TS and HUD, safety related measurements could have been compromised. In RV mode it would be very difficult to discriminate between effects of HUD and effects of TS on driving performance. Nevertheless in regular use of RV equipped interface drivers tend to glance at TS for extra reassurance or comfort even when mostly using HUD display.
• Looking at the data from TS1 (Figure 23, Figure 24) and also TS2 it can be seen that there is a big spread around eye road centre position caused by placement of non-transparent HUD display. Because different people could have adopted different strategies to monitor the road in given conditions it is difficult to estimate the PRC (percent road centre) metric that was initially considered to be used in analysis.
• The data quality results from TS1 and TS2 interfaces are considerably worse than for RV modes. For TS interfaces only ~55% of data was usable. As well in Figure 24 it can be seen that glances towards TS display are on the edge of the data range. All together there is a great likelihood that eye tracker data is missing critically important amount of data and any conclusions from this data set can be misleading.

CHALMERS, Applied Mechanics, Master’s Thesis 2010:56 63
Figure 23 Eye tracker point density histogram for TS1 (resolution – 50x50).
Figure 24 Eye tracker intensity map for TS1 (left) and RVs2 (right) at 200x200 point resolution.

CHALMERS, Applied Mechanics, Master’s Thesis 2010:56 64
4.2 Subjective ratings
After performing all tests every test person expressed their opinion on a number of questions. Subjective ratings were provided by participants only after they had practical experience with interfaces while driving.
In order to limit complexity for participants it was decided to group interfaces by most significant similarities. As a result most subjective results are given to RVs and RVd modes without distinguishing between input devices. In some cases all four RV interfaces were classified as one – infotainment interface with GUI displayed on the HUD. When both successful and unsuccessful RV modes are combined together participants were instructed to rate their preferred type out of all applicable RV modes. In subjective results TS usually represents TS1 – common touchscreen interface. TS2 mode was not explicitly included in questionnaire, because initially it was not considered to be interesting as an independent concept.
Data quality: The interview questions were answered by all 22 participants, but not all questionnaire data was collected. One questionnaire out of 22 was lost, and could not be retrieved therefore most questions had been answered by 21 person. As well some questionnaire questions were not answered. Because there were only a few cases of missing replies, the data loss can not be substantial.
4.2.1 Usability and acceptance
Using VanDer Laan’s acceptance scale (Van Der Laan et al. 1997) it was found that on average participants rated static Remote View (RVs) as close second right behind touchscreen interface (TS) in both usefulness and satisfying dimensions (Figure 25).
If results are separated by touchscreen experience of participants the acceptance ranking changes. Figure 26 shows acceptance results depending on replies on background question "Do you use iPhone or another comparable touchscreen device?" People who are not frequent users of touchscreen interfaces gave considerably higher overall scores to RVs over TS. Nevertheless because TS users preferred TS to RVs the overall result is close to equal (Figure 25).
In all cases dynamic RV mode was rated very negatively by majority of participants.

CHALMERS, Applied Mechanics, Master’s Thesis 2010:56 65
-2
-1,5
-1
-0,5
0
0,5
1
1,5
2
-2 -1,5 -1 -0,5 0 0,5 1 1,5 2
Satisfying
Use
fuln
ess
RVd average
RVs average
TS average
Figure 25 Overall Van Der Laan’s acceptance scale results.
-2
-1,5
-1
-0,5
0
0,5
1
1,5
2
-2 -1,5 -1 -0,5 0 0,5 1 1,5 2
Satisfying
Use
fuln
ess
-2
-1,5
-1
-0,5
0
0,5
1
1,5
2
-2 -1,5 -1 -0,5 0 0,5 1 1,5 2
Satisfying
Use
fuln
ess
RVd average
RVs average
TS average
Figure 26 Van Der Laan’s acceptance scale results by TS experience: Left – only users with little to no experience with smartphones; Right – only frequent smartphone users.
From usability perspective SUS scale showed advantage of TS over RVs modes and very low score of the RVd modes (Figure 27). One-way repeated measures ANOVA analysis of SUS scores confirmed that there was at least one significantly different result among TS, RVs and RVd, F(2,34) = 70.31, p<.001. Pairwise comparisons showed that TS score is significantly bigger than RVs score (p<.05) and that RVd is rated inferior to RVs (p<.001). In case of SUS scores there were no substantial differences when grouping participants by touchscreen device experience.

CHALMERS, Applied Mechanics, Master’s Thesis 2010:56 66
29,9
68,580,0
0102030405060708090
100
RVd average RVs average TS average
Figure 27 System Usability Scale scores.
Acceptance results are also supported by replies to the question about which interface person would like to have in his/her next car. Figure 28 shows amount of no/maybe/yes replies in favour of RVd, RVs and TS. It can be seen that participants selected RVs in about as many cases as TS. While dynamic Remote View was interesting to no more than 4 out of 21 respondents.
17
2 2
0
7
14
2
4
15
0
2
4
6
8
10
12
14
16
18
No Maybe Yes
Nu
mb
er
of
rep
lies
Dynamic
Remote View
Remote View
(Static)
Touch Screen
Figure 28 Willingness to use RV or TS based interfaces (“In my next car I would like to have:”).
Finally acceptance for concepts was also expressed by explicitly ranking interfaces by their future value (Figure 29). Ranking does not allow equal rating therefore it is very significant which place is given to a concept. Note that RV modes were presented as “touchscreen with Remote View together” because RV is not a self sufficient interface for main infotainment GUI. Results show that RVs earned slightly higher interest from test persons than TS. In case of RVd concept almost half of participants rated RVd as “inappropriate” or “not promising at all”. Overall RVd is clearly the least accepted interface option.

CHALMERS, Applied Mechanics, Master’s Thesis 2010:56 67
promising in your opinion
10 10
2
00 0
10
12
0
2
10 10
0
2
4
6
8
10
12
14
Not at
all
3rd 2nd 1st
Nu
mb
er
of
rep
lies
RVd
RVs
TS
Figure 29 Ranking of concept by “which is the most promising”.
4.2.2 Safety ratings
There was one specific question addressing the safety aspects of the interfaces. Participants ranked their perceived awareness of the forward road on a scale from 1 to 5. Figure 30 shows both average rating and amount of specific scores given. One-way repeated measures ANOVA analysis with N=18 found that there is at least one significant difference among results, F(2,34) = 16.90, p<.001. Pairwise comparisons specified that RVd was significantly worse than two alternatives (RVd–TS p<.01; RVd–RVs p<.001), but difference between RVs and TS could not be counted as significant (p>.05). Because ANOVA showed close to significant difference between TS and RVs and because there were 21 pairs of ratings for TS and RVs instead of N=18 when counting in RVd, it was decided to perform additional paired t-test. Paired t-test confirmed that collected data allows to conclude that RVs is rated significantly higher than TS in terms of perceived road awareness, t(20) = 2.43, p<.05.
Overall RVs interface is rated as the best for maintaining road awareness while driving. Histogram of given scores shows the details of score distribution. RVd mode is clearly rated as poor by participants with three exceptions. TS received mixed results with nearly equal amount of better and worse than average ratings. Finally RVs mode was rated as better than average with median rating of 4.

CHALMERS, Applied Mechanics, Master’s Thesis 2010:56 68
1,57
3,52
2,95
1,00
1,50
2,00
2,50
3,00
3,50
4,00
4,50
5,00
RVd RVs TS
Ave
rag
e r
atin
g9
6
0
3
00
4 4
11
2
1
8
4
7
1
0
2
4
6
8
10
12
1 2 3 4 5
Nu
mb
er
of
rep
lies
RVd
RVs
TS
Figure 30 Subjective awareness of the forward road.
4.2.3 Input device ratings
As the tested interfaces included both touchscreen and touchpad, participants were asked to select their preferred input device among the two tested alternatives. Figure 31 shows the data collected from questionnaires. The input device choices were highly dependent on given task and interface implementation. To sum up the results Figure 32 shows that TS was rated as the most efficient in half of the use cases. But in 35% of cases participants were equally satisfied with both devices and in 15% of use cases TP was the preferred input device. Note that current test setup was optimized for TS input and software contained no optimizations for TP use.
7
9
14
12
1010
8
5
7 7
4 4
2 2
4
0
2
4
6
8
10
12
14
16
Simple
menu
MP3 list Keyboard Keypad Sound
settings
Nu
mb
er
of
rep
lies
TS
Both
TP
Figure 31 Preferred input device by use cases

CHALMERS, Applied Mechanics, Master’s Thesis 2010:56 69
50%
35%
15%
0%
10%
20%
30%
40%
50%
60%
TS Both TP
Pe
rce
nt
of
cho
ice
s
Figure 32 Preferred input device for all 5 tested use cases.
To assess the significance of TP input alternative as an addition to TS GUI participants replied if they would like TP in their next car. In Figure 33 it can be seen that the total amount of people saying either “maybe” or “yes” to TP was equal to the amount of replies in favour of TS.
1 1
7
12
0
2
4
15
0
2
4
6
8
10
12
14
16
18
N/A No Maybe Yes
Nu
mb
er
of
rep
lies
Touch Pad
with buttons
Touch Screen
Figure 33 Willingness to use TP for infotainment control compared to TS (“In my next car I would like to have:”).
4.2.4 Ratings of selection methods
The test setup featured modified touchpad that allowed performing selection using tapping (no buttons needed), physical buttons or pressing into the surface of the TP (see Figure 10 for additional explanation). As it is theoretically possible to perform all interaction only using the touch sensitive part of touchpad it was assessed if users would accept omitting the additional buttons. In Figure 34 it can be seen that almost one half of participants said “no” to TP without buttons while almost everybody is interested in TP with buttons.

CHALMERS, Applied Mechanics, Master’s Thesis 2010:56 70
touchpad:
1 1
7
12
1
10
8
2
0
7
8
6
0
2
4
6
8
10
12
14
N/A No Maybe Yes
Nu
mb
er
of
rep
lies
Touch Pad
with buttons
Touch Pad
(no buttons)
Clickable
Touch Pad
Figure 34 Willingness to use certain type f touchpad (“In my next car I would like to have:”).
Another selection option is using physically depressible touch sensitive surface with button feel. From Figure 34 it can be seen that user attitude for clickable touchpad is unclear. About the same numbers of people selected each of the options (“no”, “maybe”, “yes”). Notably the tested clickable TP prototype required uncomfortably high click force that discouraged participants in practical use of clickable TP function.
In case of clickable touchscreen interest was higher than interest in clickable TP. If “maybe” and “yes” replies are interpreted as “participant is interested in the feature”, it can be said that 84% of people who were interested in conventional TS also expressed interest in the clickable TS feature (Figure 35). Notably clickable TS was not tested by 4 out of 22 test persons due to hardware problems. As well the results from Figure 35 may not be entirely indicative of interest in the stand alone clickable TS. It is possible that interest in clickable TS is affected by the major role of clickable TS feature for RVs1 and RVd1 interface usability. If the person wants to use RVs1 mode it is likely that he/she will also want to have clickable TS. Nevertheless it is likely that obtained results are close to interest in standalone clickable touchscreen.

CHALMERS, Applied Mechanics, Master’s Thesis 2010:56 71
1
4
9
7
0
2
4
15
0
2
4
6
8
10
12
14
16
18
N/A No Maybe Yes
Nu
mb
er
of
rep
lies
Clickable
Touch Screen
Touch Screen
Figure 35 Willingness to use clickable TS compared to standard TS (“In my next car I would like to have:”).
Overall participants could also rate all available selection methods by their usefulness on a scale from 1 to 5 (Figure 36). Results show that the buttons next to touchpad are the primary selection method for TP while driving. Regular interaction with TS was rated significantly better than proposed alternative clickable TS. And while clickable TP was rated as the least useful, tapping on TP was rated as better than average.
3,71
4,29
2,673,05
4,24
1,0
1,5
2,0
2,5
3,0
3,5
4,0
4,5
5,0
Tapping on
Touch Pad
Buttons
Next to
Touch Pad
Clickable
Touch Pad
Clickable
Touch
Screen
Tapping on
Touch
Screen
Ave
rag
e r
atin
g
Figure 36 Rating of selection method usefulness for RV concept.

CHALMERS, Applied Mechanics, Master’s Thesis 2010:56 72
5 Discussion
In this section we discuss the results from the previous chapter in relation to the initial hypotheses. Further, we present some additional findings. Individual sections focus on Remote View evaluation, input methods and additional findings. Finally suggestions for further research are presented.
5.1 Remote View safety benefit
The primary objective of this study was to develop and test Remote View interfaces to produce safer interface than common touchscreen IVIS. In practice the first question is which of the tested RV interfaces are successful? – reducing the scope from four tested RV variants down to as many as practically feasible. The second question is how these best RV implementations compare to TS1 and TS2 in terms of safety?
For reference about interface abbreviations consult Table 2 on page 35.
5.1.1 Static and dynamic Remote View
The greatest difference between Remote View interfaces was in the image presentation (for more details see Section 3.2.1 Definition and description):
• RVs – static mode requires sufficiently big, high resolution HUD image but is more conventional from user perspective.
• RVd – dynamic mode overcomes limitations of HUD image size and poor readability but adds a layer of complexity to the interaction principle.
Results from TCT show that both dynamic modes were significantly slower than comparable static Remote View. Shorter time on task is favourable both to reduce exposure to increased risk while performing secondary task and also in terms of usability.
Visual steering wheel reversal rate metric shows that RVd2 was significantly inferior to RVs2 (see Section 4.1.4). Comparison in between RVd1 and RVs1 resulted in no statistical significance. Such difference between implementations of dynamic and static modes can be attributed to input device effects on performance: TS input for RV may be the main factor affecting visual SRR performance irrespective of dynamic or static presentation. On the other hand with TP input RVs2 performed better than RVd2.
Cognitive SRR metric provides an indication of the mental workload level associated with interaction with the interface together with ongoing driving task. The results from cognitive SRR show very significant advantage of RVs modes in both comparisons RVs1 vs. RVd1 and RVs2 vs. RVd2. Cognitive SRR results are in alignment with numerous comments and feedback from participants. Most

CHALMERS, Applied Mechanics, Master’s Thesis 2010:56 73
participants were complaining about very complex interaction with RVd modes (see appendix 4 for a list of comments) and often could not navigate the interface in RVd modes even though they successfully navigated the same GUI using TS1 interface. Results show that the added complexity of RVd over RVs was apparently measured by cognitive SRR metric and RVs is substantially better than RVd.
In addition to objective results all test persons expressed their opinion about the interfaces in terms of subjective awareness of the forward road (Figure 30). It was expected that the use of HUD display would have increased the confidence and safety feeling of the drivers because of no need to look away from the road. Results did confirm that RVs modes were the highest rated among the tested interfaces, but RVd modes were rated very poorly. The reason for poor rating of RVd modes is in generally very negative attitude of participants towards the RVd interfaces and very high cognitive demand of RVd which may subjectively cancel the positive effects of display position.
Overall RVd modes in comparison to RVs modes are characterized by poor TCT performance, poor cognitive SRR results, strongly negative subjective ratings and a great number of negative subjective feedback from participants. In addition, at least 5 participants out of 22 did not test RVd mode because they were not able to comprehend the interface or because feeling unsafe while using RVd modes (all 22 participants tested RVs2, TS2 and TS1 interfaces and only one person chose not to perform full test run using RVs1). Based on all results it can be concluded that Static modes are much better than dynamic modes. Even though some participants accepted RVd modes as a possible alternative to RVs, there were even more participants who could not confidently handle RVd at all. We suggest that RVd modes are not suitable for use while driving, primarily because RVs mode offers all the advantages of RVd and also outperforms RVd in most analyzed metrics.
5.1.2 RV input devices
Another major difference between RV interfaces was the input device used:
• RVs1 and RVd1 used touchscreen – TS is available by default because it is the same input device as the normal TS1 interface on which RV interfaces are based on. If TS is the optimal solution then no other input device needs to be added to TS and HUD setup.
• RVs2 and RVd2 used touchpad – TP is a widespread and cost efficient pointing device that has conquered portable computer market. TP is a logical addition to a TS based interface because it allows controlling mouse pointer in a familiar way. TP also offers a number of advantages that will be discussed further.
In terms of objective measurements, the limitations of the experimental protocol do not allow to compare objective metrics from interfaces with TS and TP input directly (see Section 3.6 and 4.1 for details about the issue). This limitation was accepted because of assumption that there is a great difference between interactions with two input devices therefore users should not have an advantage in TP interfaces because of
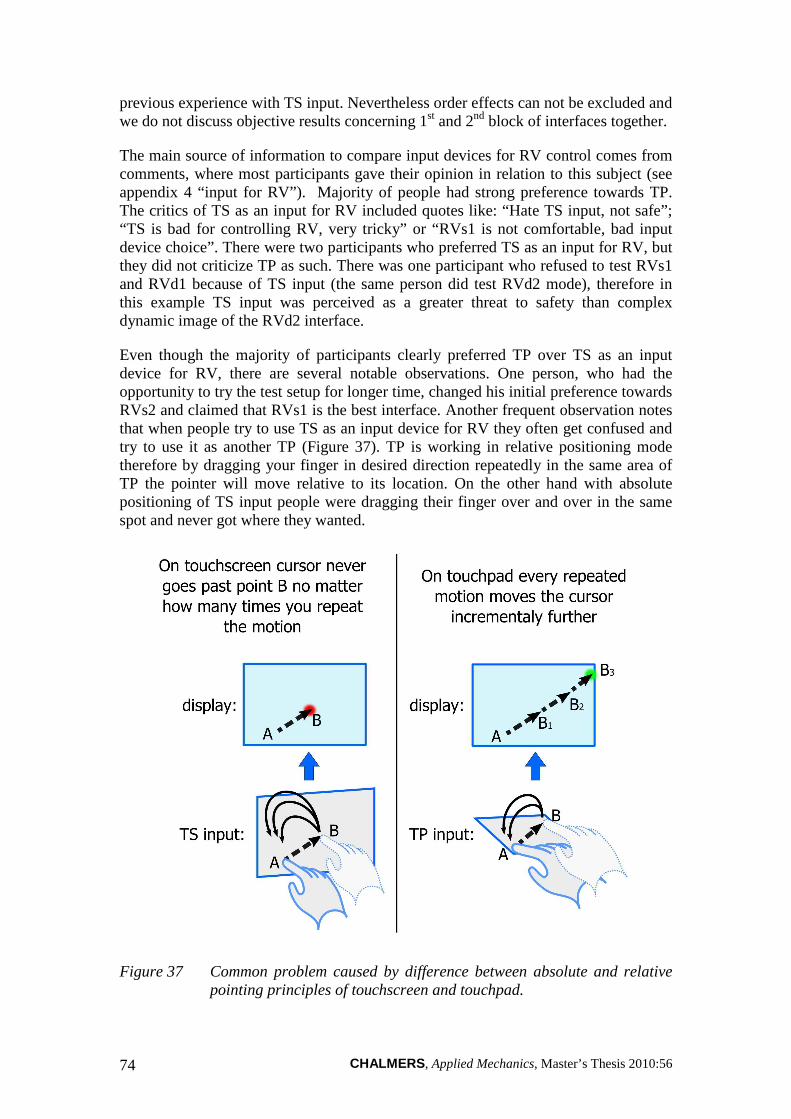
CHALMERS, Applied Mechanics, Master’s Thesis 2010:56 74
previous experience with TS input. Nevertheless order effects can not be excluded and we do not discuss objective results concerning 1st and 2nd block of interfaces together.
The main source of information to compare input devices for RV control comes from comments, where most participants gave their opinion in relation to this subject (see appendix 4 “input for RV”). Majority of people had strong preference towards TP. The critics of TS as an input for RV included quotes like: “Hate TS input, not safe”; “TS is bad for controlling RV, very tricky” or “RVs1 is not comfortable, bad input device choice”. There were two participants who preferred TS as an input for RV, but they did not criticize TP as such. There was one participant who refused to test RVs1 and RVd1 because of TS input (the same person did test RVd2 mode), therefore in this example TS input was perceived as a greater threat to safety than complex dynamic image of the RVd2 interface.
Even though the majority of participants clearly preferred TP over TS as an input device for RV, there are several notable observations. One person, who had the opportunity to try the test setup for longer time, changed his initial preference towards RVs2 and claimed that RVs1 is the best interface. Another frequent observation notes that when people try to use TS as an input device for RV they often get confused and try to use it as another TP (Figure 37). TP is working in relative positioning mode therefore by dragging your finger in desired direction repeatedly in the same area of TP the pointer will move relative to its location. On the other hand with absolute positioning of TS input people were dragging their finger over and over in the same spot and never got where they wanted.
Figure 37 Common problem caused by difference between absolute and relative pointing principles of touchscreen and touchpad.

CHALMERS, Applied Mechanics, Master’s Thesis 2010:56 75
When TS surface is used to control external display there is no obvious difference between the tactile sensations of using TP and TS. As a result, if the driver was less focused on a secondary task, several people were falling back to the established TP paradigm even after many successful attempts with TS input. In order to be proficient with TS input for RV, users needed to break the previous assumptions on TP interaction and learn the alternative way of treating touch sensitive surface. Only after such long term adaptation took place it is possible to realize the true potential of TS input.
As important as long enough learning period was the ability to use “clickable touch screen” selection method. The first 4 participants who could not use clickable TS selection method (see Section 3.6 about the issue) soon demonstrated that it is not easy for most people to use regular tapping on TS when you are not looking at the TS image. Once again on TP there is no need for precise tapping but, on TS the exact point of tapping is essential. If after successful highlighting of the desired GUI button the person lifts up the finger and taps in slightly different place, cursor instantly follows to the unknown point and performs unexpected selection. With training person can learn to lift up the finger very little and precisely tap back in the same point, but it is not an easy and accessible exercise.
The proposed solution of “clickable TS” overcomes the problem by allowing users to press into the screen to perform selection. By pressing in people do not have the problem of displacing the cursor away from the targeted GUI element and there is less finger movement involved. As an added bonus the haptic “click” feedback enhances the experience. Clickable TS is further discussed in Section 5.3.1.
The strongest appeal of RVs1 mode comes from combining TS1 and RVs interaction together. Feedback from users and observations suggest that if driver uses short glances to TS to help with RVs1 interaction the overall experience can be very good. Short glances to TS1 can help when RVs1 interaction feels confusing. With practice users can improve the understanding about the HUD-TS interaction in RVs1 mode reducing the need to glance on TS while using RVs. Glances and input from TS during interaction with RVs2 mode was also used by participants successfully but it requires additional switching between input devices. With existing data it is not possible to rate which combination is the best (TS1 + RVs1 or TS1 + RVs2) and both combinations could be used efficiently after sufficient practice.
Because of longer learning process of the TS input for RV it can be suggested that Remote View without TP would be too intimidating for a great number of users who would never overcome the initial resistance of TS input for RV control. Therefore TP or possibly another pointing device is necessary for every RV setup despite the possibility to use existing TS input. TS input for RV applications greatly benefits from “clickable TS” functionality to the extent that suggests that there should be a possibility to press into the screen to select in order to efficiently use TS for RV input. It can be expected that in an experiment as short as the present study most participants will not be able to use TS input proficiently because of insufficient practice and consequently TS input will be inferior to TP input irrespectively of the true potential of TS as an input device for RV. It can be argued that if TS requires so long learning period it poses a safety risk and is not worth developing. On the other hand TS would be available in any RV setup without any added cost and some users do find it satisfying to use after initial challenge.

CHALMERS, Applied Mechanics, Master’s Thesis 2010:56 76
5.1.3 Head up display
Remote View was developed with an assumption that, if driver is able to efficiently use HUD for interacting with IVIS, driving performance should improve compared to conventional touchscreen IVIS (BMW Group 2009, p.28). To test this assumption it was possible to compare the impact of using nearly identical interfaces with image displayed on HUD and on TS. RVs2 and TS2 modes differ only in the display device used and the results are very interesting.
TCT results show that TS2 is significantly faster than RVs2 in all tasks (Figure 15 and Figure 16). Because interaction was identical, this difference can be caused only by display differences. A possible explanation can be the added time pressure of looking away from the road when using TS2 – because driver is consciously looking away from the road, there could be a stronger motivation to finish the task as quickly as possible. Other reason can be the better focusing on secondary task with TS2 because of no simultaneous monitoring of surrounding road view with RVs2.
Visual SRR comparison found no difference among TS2 and RVs2 results indicating identical driving performance with both display types (Section 4.1.4). Such results can be due to very successful TS implementation that enabled rather good driving performance even without HUD display. Alternatively HUD substitute underperformed compared to actual projected HUD image (Figure 38). It is possible that without favourable projection distance of the actual automotive HUD the studied prototype did not reflect the true potential of a head-up display. The success of implementation could be also attributed to favourable high touchscreen position and intuitive interface that allowed short enough glances to the touchscreen. This result raises question whenever there is practical benefit of adding HUD to a well positioned touchscreen display.
Figure 38 Principle of an automotive HUD (source: http://www.conti-online.com)

CHALMERS, Applied Mechanics, Master’s Thesis 2010:56 77
Unlike visual SRR results, cognitive SRR metric showed that interaction with TS2 is more mentally demanding than interaction with RVs2 (see Section 4.1.4). This result supports the assumption that drivers feel more pressure when looking down at TS. The result also is in alignment with conclusions from (Horrey et al. 2003, p.1883) who found that NASA-TLX indicated lower mental workload for HUD compared to TS. Additional pressure may reduce comfort during long term interaction with the system, but can also be a positive effect. If driver is more focused and more alert it may be possible to temporarily compensate for less optimal interface performance and the total exposure to risk is reduced (see TCT results).
As interesting as the objective measurements was the feedback from participants (all feedback is collected in appendix 4). There were no observed difficulties in use of TS2 or RVs2 interfaces and there are indications that TS2 could be a viable interface without HUD addition. One particular comment was: “TS2 feels more comfortable than RVs2, I look there then there – it does not suck you in”. TS2 interface has all the advantages of touchpad input (see Section 5.3.1 for more details) while well positioned TS display can be comparable to HUD in terms of overall driving performance. Nevertheless there are comments from numerous participants who recognized advantage of HUD compared to head down display as the main advantage of RV interfaces.
The data from this study did not reveal advantages of HUD substitute in comparison to a well positioned TS display. Considering that this test setup did not include fully featured HUD equipment and mixed feedback from users, we suggest that further studies should return to the question of HUD vs. head down display. The performance of TS2 interface was very solid and we recommend including TS2 interface in any potential studies of RVs2 interface as a possible alternative to Remote View.
5.1.4 Overall Remote View safety potential
Overall TP is the recommended primary input device for any RV implementation. While TS input is mostly perceived as poor alternative, some users prefer RVs1 mode and there is no conclusive data that would suggest that TS input for RV should not be allowed. Together with conclusions from the Section 5.1.1 it can be suggested that RVs2 mode is the best Remote View interface among the four tested alternatives. RVs1 mode can not be self sufficient Remote View solution but nevertheless is a valuable addition to RVs2 type of interface. RVs1 mode can be especially useful if the user likes to combine TS1 interaction with RVs interaction depending on the task and driving situation. Because of poor performance of dynamic modes, neither RVd2 nor RVd1 are suitable for future consideration. In the following sections only RVs2 and RVs1 modes are discussed when evaluating Remote View performance.
Based of observations and feedback we assume that RVs1 results were affected by the longer learning curve of the interface. Therefore RVs1 results may reflect struggling with unfamiliar interface more than the potential performance of the interface. Contrary to RVs1 mode, interfaces with TP input did not suffer as much from insufficient learning period. Even users who do not use TP daily did not encounter noticeable problems in interaction with TP. As for TS1 interaction, there were no observed learning issues involved. Users could intuitively navigate TS1 without any

CHALMERS, Applied Mechanics, Master’s Thesis 2010:56 78
external support right from the first try during the introduction to the test setup. Considering learning effects only the RVs2 mode should be directly compared to TS1 and TS2 modes, because most people were able to learn these interfaces within the training period and felt comfortable during testing.
To answer the initial hypothesis of whenever Remote View can be safer than touchscreen it is necessary to compare TS1 interface with RVs2. As explained previously (see Section 3.6 and 4.1 for details) such analysis can not be fully justified for the presented objective metrics. The TS1 and RVs2 can be compared using subjective results and some additional observations can be extracted from the objective metrics. Based on objective data there are several indications:
• No matter the order effects all Remote View interfaces require longer time to interact with the system compared to TS1 (Figure 15 and Figure 16). TCT advantage of TS1 was expected as the TS1 is a direct interaction interface – touch what you see. All other interfaces require additional action of aligning pointer to the target GUI element and only then it is possible to perform selection. TS1 outperforms the best RVs2 mode by a factor of 2 even when RVs2 was always tested after TS1. Short task completion time can be an advantage in terms of less exposure to increased risk, but observations and TS2 results (see 5.1.3) suggest that short TCT can also be influenced by stress of managing short glances to the TS display instead of more comfortable gazes to and around the HUD.
• Cognitive SRR metric (Section 4.1.4) could potentially clarify the assumption of extra effort involved in timesharing during glances to TS display. Even though cognitive SRR graph shows promising trend in support of RVs1 being less mentally demanding than TS1, the ANOVA analysis did not find any significant difference between TS1 and RVs1, F(1,20) = 0.61, p>.05.
Subjective ratings of interface safety support the safety potential of Remote View (see Section 4.2.2 for results). The RVs interfaces were rated significantly better than TS in terms of road awareness while driving. In addition many comments support the perceived safety benefit of HUD use for interaction with infotainment system. (see appendix 4 “RVs in general”). The positive comments included: “A lot better when you drive.” or “It is really great to have information on the HUD. Even though it is harder to use, it is still less distracting”. But there was also negative feedback among the comments: “Feels no difference between HUD and TS in road awareness”; “I am disappointed in HUD – I thought it would be helpful, but when looking at HUD I don’t see anything, I don’t see lane marking”. The negative feedback was often in connection to inability to utilize peripheral vision while looking at the HUD display. Because the road was in the field of view there we suggest 3 possible explanations:
• Because of refocusing to HUD display (Figure 9), the road view could be too much out of focus to remain informative. It is possible that an actual projected HUD image can avoid such refocusing issue because the projected image appears further away from the driver. Therefore it is possible that with more appropriate HUD display the overall driving performance and feedback could improve.

CHALMERS, Applied Mechanics, Master’s Thesis 2010:56 79
• Another explanation could be the cognitive tunnelling effect (Engström & Mårdh 2007, p.30). The reason for poor safety impression of HUD in Remote View interface can be the shift of attention to the interface that locks out the information from peripheral vision. For people who experience cognitive tunnelling there would be little benefit from Remote View display and the longer task completion time could outweigh most Remote View advantages.
• Lastly there may be person specific limitations. It is known that there are various vision disorders that may not be prominent in everyday life. Efficiently using visual input from peripheral view while interacting with HUD display is not a trivial everyday task. Because of limited knowledge in the area, we do not discuss the assumption further, but we suggest that HUD efficiency studies should be linked to knowledge about limitations of human vision in population.
The collected data delivers support for Remote View safety potential but there are several remaining concerns. It is likely that with true HUD display and additional optimizations for TP interaction RVs2 interface can be convincingly safer than TS1. The feedback from majority of participants does suggest that RVs is safer than TS1. Overall the data from this study does not allow to support of deny RVs2 safety advantage over TS1. Further studies are required to investigate HUD use for infotainment interaction.
5.2 Remote View usability and acceptance
While safety improvement is the primary objective in RV development, the HMI solution must also be positively perceived by customers. Safe system that is not used by anybody would not add any value to the end product. The main user acceptance metric used in the present study – Van Der Laan’s acceptance scale shows promising results.
Both in “satisfying” and “usefulness” dimensions of Van Der Laan’s scale results indicate that RVs is nearly equal to well known TS1 interface (Figure 25). Moreover users who do not use TS interfaces frequently found RVs as considerably better than TS1 while driving (Figure 26). As an additional support participants also expressed comparably high interest in RVs both in terms of willingness to own and use (Figure 28) and in terms of potential future value (Figure 29). The fact that RVs is rated nearly equal to well known and familiar TS1 interface suggests that with more practice and added optimizations Remote View can be the preferred interface for use while driving.
For HMI solution usability is as important as the general acceptance of the interface. Main usability conclusions can be drawn from SUS score and from average task completion time (TCT). SUS score results (Figure 27) showed that TS1 was rated marginally higher (p<.05) than RVs with overall averages of 80 points for TS1 and 68.5 points for RVs. In comparison the truly disliked interface RVd was rated at 29.9 points. The SUS result corresponds to TCT results where it can be seen that TS1 is at least twice as fast as the best RV mode (see discussion in 5.1.4). Considering that at least half of the participants are using TS devices and undeniable speed advantage of

CHALMERS, Applied Mechanics, Master’s Thesis 2010:56 80
TS1 interface, the 15% advantage of TS1 over RVs in usability ratings indicates very promising performance of the Remote View interfaces. Moreover it is important to consider usability assessment conditions:
• Majority of participants chose TP input together with static presentations (RVs2) as their preferred Remote View interface, but the test software was not at all optimized for TP input (see Section 3.3.1). As a result SUS score reflects comparison of purposely developed TS1 interface against TP input that was added in the very end without any TP specific optimizations.
• The test procedure was optimized for safety metric acquisition that involved rather strict use constraints during testing (see 1.4 Constraints). An example of constraints is the restriction to look only at the HUD while testing RV modes. In some cases a quick glance to TS display would help to overcome certain hindrance in RV interaction, streamlining the experience and avoiding unnecessary frustration. Consequently usability perception of RV modes could improve in more natural use environment where RV mode is an optional addition to the basic TS1 interface.
Even more information about usability and acceptance can be elicited from user feedback. Many comments and observations support hypothesis that TS1 is often preferred for short and direct interactions with an interface while RVs2 or TS2 were more comfortable for longer and more complex tasks. TS1 is very direct and satisfying to use when all what is needed is to quickly push a big “OK” button (“TS1 – very direct, straightforward”), but some participants noted decreased confidence and physical discomfort when using TS1 for longer periods (“TS1 - fast but loosing
contact with the road; bad for weak or sick arms”). RVs modes are slower but allow for more secure and comfortable interaction (“Really like HUD – it is easier to do something and drive”). As a result when people wish safety and comfort they would chose RVs, but while standing at the traffic light or if only a couple of presses are required TS1 remains better option than RVs. Collected subjective feedback supports the initial goal of making supplementary interface to touchscreen that is safer. When safety is not an issue – TS is used but RVs often takes over as the preferred interface while driving.
Overall collected usability and acceptance data shows great potential in RVs interfaces. Despite anticipated disadvantage of longer TCT compared to TS1, Remote View is frequently chosen as the preferred interface for use while driving due to perceived safety and added comfort of touchpad input. It is important to stress that almost all participants considered TS1 interface as an essential part of complete RV solution therefore the results should not be interpreted as if RV could replace conventional touchscreen interaction in vehicle. Another important limitation is the range of interfaces tested in the experiment – it is not known how the tested interfaces would compare against other possible alternatives. Nevertheless it can be confirmed that there is a high likelihood that users will prefer to use Remote View over touchscreen while driving.

CHALMERS, Applied Mechanics, Master’s Thesis 2010:56 81
5.3 Input and selection methods
During Remote View testing it was possible to evaluate how touchpad compares to direct touchscreen interaction. As well feedback for 5 different selection methods provides valuable details on optimal implementation of input devices.
5.3.1 Touchpad for in-vehicle use
If touchpad is to be integrated in a vehicle for HMI navigation it is of great interest to know which features are necessary for TP to be intuitive, safe and without unused features. With these considerations there were 3 TP variations assessed:
• TP without buttons – the most minimalistic design that allows for greater design freedom, minimal costs and in principle allows complete control over cursor.
• TP with buttons – conventional TP setup with extra hardware selection buttons. This variant should satisfy any person who uses TP with their computer.
• Clickable TP – prototype that adds physical buttons under the surface of TP allowing for pressing into the surface to select. This concept is similar to contemporary Apple “Multi-Touch trackpad“ (Figure 39) and was added in addition to clickable touchscreen concept (see next section)
Figure 39 Touchpad with buttons by Cirque and clickable multi-touch touchpad without additional buttons from Apple MacBook (source: www.cirque.com; www.apple.com)
Participant answered questions on their selection method preferences and additional observations were noted during the experiments. There are at least 2 substantial indications among the collected TP data.
In order to assess suitability of TP for use in car the main question was to choose which input device was the most suitable for specific use case. Section 4.2.3 and Figure 32 show that on average only in 50% of cases TS was preferred for controlling the touchscreen GUI. In more than one third of cases TP is subjectively as good as TS and 15% of replies favour TP for specific use scenario. The definitive conclusion from these replies is that there is a range of reasons that make TP a valuable addition to the TS interface. The possible reasons can be:

CHALMERS, Applied Mechanics, Master’s Thesis 2010:56 82
• Better physical ergonomics (reach, posture);
• More precise control (easy to pinpoint exact position for click; reassuring selection using hardware button);
• No time pressure and precision demands of every touch of the TS;
• Easier interaction chunking (several secure attempts to position and verify cursor can be made before actual selection);
• More comfortable input in case of long fingernails (it is possible to position TP at an oblique angle to the hand);
• Possibility not to touch the display with a finger (for aesthetics and cleanness).
The high interest in TP for use together with TS is also supported by results on willingness to use TP (Figure 33). As many people who would like TS in their next car would also want TP (if both “maybe” and “yes” answers are counted as positive). It must be noted that participants rated suitability of TP for complete RV setup, therefore TP may have received more than fair support from participants as TP is very important for interaction with HUD.
In terms of variants of TP for in-vehicle use average rating of selection method usefulness for RV (range from 1 to 5, Figure 36) showed that TP with buttons is about as useful as TS, tapping on TP is also rather useful selection method but clickable TP is considerably less useful with result closer to “not at all” than to “very useful” on the rating scale. The results of the willingness to own question show that, if TP would not have additional buttons, only half of the participants would be interested in such device (Figure 34). Poor support for no button TP may be caused by higher complexity and agility required to operate button less TP for complex use scenarios. Not all TP users use the tapping selection method on their computers and the button becomes even more important when TP is used in a moving vehicle. The clickable TP received more support (Figure 34) but the observations are less promising. Almost nobody actually used clickable TP functionality while using the setup on the move. Participants expressed interest in clickable TP as in a novelty that might be potentially useful to them, but failed to demonstrate any practical use of the feature. The fact that clickable TP was not actively used is confirmed by the result of selection method usefulness ratings. Figure 36 shows that clickable TP was rated as the least useful selection method. A possible explanation can be the poor implementation of clickable TP. It was noted that clickable TP prototype required too high pressing force to activate the buttons. Previous assessment of clickable TP (MacKenzie & Oniszczak 1998, p.343) and fairly widespread use in Apple computers suggest that for stationary use clickable TP is a valid alternative. Unfortunately it is not possible to state if clickable TP was not useful or it was the fault of the specific prototype.
Overall we can recommend TP for further studies as a possible addition not only to Remote View setup but also to a conventional TS interface. An example of support for TP from one user can be the quote: “TP has the best potential as a future input device. It needs multitouch, fingertip writing, scroll zone and additional optimization”. For best results users should have a redundant setup with both TS and TP, allowing the most suitable choice for given task and use scenario. If TP is used

CHALMERS, Applied Mechanics, Master’s Thesis 2010:56 83
for mouse pointer control there is a strong support that it is essential to have selection buttons in addition to the touch-sensitive surface. Buttons improve accessibility and possibly also safety of TP. The present data does not answer the questions about clickable TP potential and there were no observed examples of use cases where clickable TP functionality would add to the interaction experience.
5.3.2 Clickable touchscreen
One necessary hardware element of touchscreen controlled Remote View interfaces is the clickable TS. The ability to press into the screen to select was specifically implemented for RV usability improvement both on hardware and software levels. The clickable TS concept is very similar to clickable touchpad, but because of differences in pointing principles there is a great difference between the two.
84% of participants who would like TS in their car also expressed interest in the clickable TS (Figure 35). The results from the rating of selection method usefulness for RV were less convincing – with very mediocre rating on clickable TS usefulness (Figure 36). Nevertheless it was observed that most participants heavily relied on clickable TS functionality when using RVs1 and RVd1 modes. For remote interaction with HUD, clickable TS allows to simplify interaction and reduce amount of errors caused by tapping in different point than intended. It is absolutely clear that for successful use of RVs1 mode clickable TS or comparable input enhancement over conventional TS is necessary.
An alternative to tested clickable TS could be an adaptation of pressure sensitive click threshold (no moving parts, same press into the screen operation) and vibration feedback. As a proof of concept there is a commercially available device BlackBerry Storm 9550 that employs pressure sensitive display with force feedback, while BlackBerry Storm 9530 (Figure 40) had the clickable TS similar to the one used in the present study (BalckBerry 2010) Use of force feedback could improve the system by providing only meaningful feedback when the press has actually resulted in an input recognized by the system. As well force feedback may be applicable in other ways to improve interaction (Ecker et al. 2009, p.3). More studies are necessary to clarify the advantages and disadvantages of different solutions for added haptic feedback in TS interaction.
Figure 40 BlackBerry Storm 9530 with clickable touchscreen (source: na.blackberry.com)

CHALMERS, Applied Mechanics, Master’s Thesis 2010:56 84
In addition to usefulness for RV control clickable TS may also be useful for normal TS interaction. From published studies it is known that users often prefer combination of visual, audio (signals; speech) and haptic (vibration) feedback all together (Serafin et al. 2007; Pitts et al. 2009) therefore our findings comply with haptic feedback studies. From observations it was noted that for some people find its satisfying to use clickable TS functionality also in cases of TS1 because of clear “click” that confirms the selection. The effect was expected to affect people without TS use experience, but it was observed even among people who daily use iPhone. Overall it is not easy to generalize the collected feedback to different use scenarios of clickable TS. It can be said that clickable TS is very useful for RVs1 mode, it is a valuable add-on to conventional TS to some of the users but nevertheless could be surpassed by a more sophisticated haptic feedback solution.
5.4 Notes and observations
In addition to the main hypotheses and discussion there were a number of potentially valuable findings noted during the Remote View study. This section contains individual notes and observations that were not directly related to the discussed issues.
Upset driver mistakes. It was noted that all people can make dangerous mistakes and drive unsafely after getting upset for some reason. The reason can be unexpected behaviour of the interface, after repeated unsuccessful attempts to perform task or after noticing random mistype/mistake. Such dangerous driving has little or nothing to do with the safety of the interface. Metrics such as lane departure frequency may be directly affected by this behaviour and consequently produce misleading results. It is possible to review the video and audio recordings (if available) to asses if the rough driving mistake comes from actual interaction or follows unrelated distraction.
Need for robust HMI. Despite testing the test software during development by a number of persons, as soon as the HMI prototype was tested while driving, several minor problems were discovered. Using a system as a secondary task amplifies the requirements for interface quality. For example GUI element that caused no problems while stationary can appear too small and difficult to catch while the vehicle is moving. Failing to perform action several times in a row is very disturbing and can be the cause of upset driver mistakes discussed previously. Consequently we suggest that any interface can be dangerous if the system does not perform as expected. Touchscreen GUI presents a special challenge because the interaction robustness heavily depends on GUI design, screen responsiveness and ergonomics.
Steering wheel grip. It has been observed that some users chose different way of holding the steering wheel depending on interface. For example shorter driver might hold on to the top of the steering wheel to better reach the TS and afterwards hold the steering wheel at the bottom when using TP positioned on the middle console. In such cases it may be argued that driving performance in terms of for example SDLP can be misleading. Different grips would alter the nature of steering input and could potentially impact the HMI interface assessment.
Touchscreen ergonomics. It was observed that all users tend to use certain hand support while interacting with touchscreen. Existing setup included pronounced hand

CHALMERS, Applied Mechanics, Master’s Thesis 2010:56 85
support underneath the high positioned display that was used by all participants (Figure 11). In a moving vehicle it is important to provide stable hand support next to TS that simplifies precise selection and reduces strain from an arm. We believe that good hand support is essential for comfortable use of high position touchscreen input.
TCT and Lane departure frequency. The correlation tests found that lane departure frequency is significantly correlated to task completion time (see Section 4.1.2). Even considering the unreliable data collection methods there is a considerable difference in lane departure amounts among interfaces (Figure 22). While the available data is not robust we can observe the trend that suggests that task completion time could be directly related to the probability of lane departure. Potential explanation could be the gradually decreasing road awareness during long term interaction with the system. If TCT can be directly linked to probability of major driving mistakes that could potentially change the weight of different safety related metrics in the overall safety assessment of IVIS. Nevertheless the present study can not be used as a support for this assumption due to poor lane departure event data quality.
5.4.1 Methodology of field HMI studies
Field driving studies have an undeniable appeal of the tests with the highest possible driving fidelity in comparison to alternatives such as studies on a closed test track, various driving simulator setups or laboratory tests such as occlusion method (ISO 16673: 2007; Pettitt et al. 2007). The present study was partially an experiment into performing the HMI assessment using EuroFOT instrumented vehicle in live traffic. Insights from the tested methodology are presented here.
Confounding factors. It is well known that performing studies in uncontrolled environment leads to many potential issues with data quality. In the Methodology chapter of the report Section 3.7 discusses the identified issues and confounding factors for metrics processed in this study.
MSDLP metric. One issue with data analysis was introduced by MSDLP metric (Östlund et al. 2005). It was known that SDLP metric can not be used with variable TCTs, therefore the most up to date comparable metric was used – MSDLP. Recommendations from AIDE project claim that MSDLP calculated using 0.1Hz high pass filter must eliminate interval duration effects on data longer than 10 seconds (Östlund et al. 2005, p.120). In principle high pass filtering is difficult to justify because of high likelihood of omitting relevant low frequency data about driver’s vehicle control efforts, but the main issue is that the correlation analysis shoved very strong relationship between TCT and MSDLP metrics (p<0.001). Based on observed correlation we argue that MSDLP metric may be misleading and clearly fails to eliminate interval length effects on field lane position data.
TCT variation. To overcome effects of the variations in task duration for safety metric analysis a possible solution is to standardize task duration to a fixed number. In such setup the results from the TCT metric would be lost but the gain is in much more robust safety metrics such as SDLP, frequency of lane departures or any other metrics that are be influenced by interval time. Fixed TCT condition is a viable alternative to usual testing not only in field studies but also for simulator tests.

CHALMERS, Applied Mechanics, Master’s Thesis 2010:56 86
TCT and speed variation. It was observed that during some tests that were performed in very condensed traffic drivers may change their time sharing strategy if the traffic flow is un-even. We propose that changing traffic speed may be very significant contributor to the TCT performance. In fact it is likely that change in speed in the range of 30 – 70 km/h is much more demanding than driving at the legal speed limit. In order to confirm this assumption we analyzed standard deviation of speed during the interface tests.
Cause-effect uncertainty. To test speed variation impact on analyzed metrics an additional metric of standard deviation of speed was calculated for correlation analysis. The obtained results show very significant (p<.001) correlation between TCT and SD-speed (see Table 5). In this case we can interpret the correlation in many ways. It is possible that TCT is causing the increase in SD-speed. It is also possible that in some cases when SD-speed is induced by traffic speed fluctuations the effect is reversed. The third interpretation could be that there is another undefined confounding factor that inks the two metrics. To provide conclusive interpretation it would require at least a separate data analysis effort. Because of time constraints we can not give a clear interpretation of this effect.
Eye tracking data quality. In the present study eye tracker data quality issues, caused by insufficient field of view and limited accuracy, completely prevented the use of eye related metrics in safety assessment. Section 4.1.8 “Eye tracker data” discusses the issues encountered with the data collected from the standard eye tracker of the EuroFOT vehicles.
5.5 Further research
The results of Remote View development and testing strongly suggest several directions of further research. The best Remote View interfaces could be tested with better implementation and with different test procedures:
• As the current setup was optimized only for TS input, there is a great room for improvement if TP is used to full potential. The list of necessary additions to be tested includes scrolling areas, snapping to buttons, fingertip writing, better size and positioning of the TP and more.
• Remote View with real projected HUD. To assess the true potential of peripheral vision while using infotainment interface an actual HUD setup should be tested. Considering up to 3 m long focus distance of HUD image, there could be a great difference in vehicle control compared to results obtained in present study.
• Improved experimental design. While driving in live traffic has its merits an alternative test procedure, for example driving on test track with leading vehicle could bring much cleaner data and more potentially usable metrics. Ensuring that HMI tasks are longer or exactly as long as defined minimum and using more sophisticated eye tracking equipment could provide greater pool of data for analysis. As well for better data quality most studied effects can be tested in driving simulator.
CHALMERS, Applied Mechanics, Master’s Thesis 2010:56 87
• To better assess usability and acceptance of Remote View and Touchpad a more natural use environment should be tested. There are indications that for best performance driver should be able to freely choose which input device to use and which display to look at every moment. Free choice might improve overall satisfaction and prevent frustration when certain aspect of interaction feels unintuitive or inefficient.
• Additional testing of Remote View interfaces could include long-term use experiment by HMI experts. Qualified researchers could assess long-term effects after the necessary learning period and initial interest. Testing how useful a new interface is in daily environment is one of the most valuable usability and acceptance information obtainable. With existing setup one of the persons who tried different modes on several occasions commented that after initial “break-in” period RVs1 mode became his favorite, topping all other options.
• It would be valuable to compare RV interfaces to alternative proposals that make use of HUD display. Potential alternatives include: Using steering wheel mounted controls and different pointing devices as an input for Remote View. Use of HUD with dedicated GUI that is not as flexible as touchscreen IVIS.
• Further analysis of haptic feedback. Clickable touchscreen should be compared to other implementations, for example vibration feedback or other haptic devices. It is already known that haptic feedback can improve user experience, but not enough information is available to compare different possible implementations.
Additional tests would help clarifying hypotheses raised by present study and give final answer on actual safety performance of Remote View based interfaces compared to relevant alternatives.
For future studies the most promising interface is RVs2, nevertheless TS2 should also be tested alongside RVs2, because the results of this study suggest that TS2 could be the optimal compromise between TS1 and RVs2 from safety perspective. RVs1 mode is mostly interesting for long-term experiments, because of observed steep learning curve that ensures poor performance among first time users. Lastly dynamic modes of RV demonstrated consistently poor performance in all regards therefore we suggest that RVd interfaces are not worth developing further.

CHALMERS, Applied Mechanics, Master’s Thesis 2010:56 88
6 Conclusions
The present chapter summarizes the main findings and provides the final answers for the hypotheses.
For reference about interface abbreviations consult Table2 on page 32.
In this study the Remote View interface was implemented with four variants (RVs1, RVs2, RVd1 and RVd2) which were tested together with two additional interfaces (TS1 and TS2). Following the study objectives, a real-traffic driving experiment was performed with 22 participants. The collected data was used to assess safety, usability and acceptance of the Remote View variants. The main findings in this work were:
1. Static Remote View with touchpad input (RVs2) proved to be the best RV concept. RVs2 mode received the best subjective feedback from the participants among all tested interfaces; surpassing even the reference TS1 interface. However, objective results did not confirm its suggested safety advantages over TS1 interface. Notably the tested RVs2 prototype was far from optimal. In this thesis, we proposed a number of additional optimizations and experiment methodology changes that would most likely improve the results of RVs2. However, the extent to which RVs2 can actually outperform TS1 still needs to be tested by future experiments.
2. Static Remote View with touchscreen input (RVs1) provided mixed results, probably due to the extensive learning necessary to master the touchscreen input for interaction with a HUD. Because of difficulties in the learning process there is the possibility that a user would not learn to use RVs1 mode. If a person masters the RVs1 interface, it is possible that RVs1 may be as useful as RVs2. While we can not recommend RVs1 as an alternative to RVs2, there are no obstacles for inclusion of RVs1 mode into RVs2 based HMI setup because RVs1 requires no additional hardware or development costs over RVs2. Future studies should investigate whether with extensive learning, RVs1 would show the same performance as RVs2.
3. Both dynamic Remote View modes (RVd1 & RVd2) were unsuccessful. Despite great focus on developing and optimizing dynamic zoomed-in view, the results from the field test and the participant feedback was consistently poor and negative. Conceptually RVd1 and RVd2 modes allow using a cheaper HUD displays and finer GUI details because of configurable GUI magnification, but we must conclude that dynamic Remote View is not suitable for in-vehicle use.
4. Touchpad as an input for touchscreen GUI (TS2) is the unexpected success of this study. TS2 received good feedback from the participants and appears to be a compromise between TS1 and RVs2 in terms of safety and usability. We found a number of reasons that support the idea to add TP to an existing TS interface. Depending on a use scenario and users’ preferences, TP can substantially supplement the TS interface and broaden the appeal of IVIS with little added cost. Our results strongly support the use of TP as an add-on to a TS interface.
5. Conventional touchscreen interface (TS1) in the tested implementation performed very well. As it was expected with well optimized GUI, there are few issues with accessibility and efficiency of the interface. TS1 was consistently faster than any RV concept and all participants managed to intuitively learn the system without

CHALMERS, Applied Mechanics, Master’s Thesis 2010:56 89
assistance. Safety relevant performance was not compared to known alternative interfaces, but the feedback from participants and collected metrics suggest that TS1 had no major safety drawbacks. The rather good safety performance of TS1 could be caused by responsive TS hardware and high placement of the display that allowed shorter glances away from the road.
Hypothesis results. The analysis of data provided answers to our hypotheses:
• Remote View is safer to use while driving than touchscreen? We found that Remote View (especially RVs2) may have the potential to be safer than conventional touchscreen, but the present test setup and collected data were not sufficient to provide conclusive result.
• Users will prefer to use Remote View over touchscreen while driving? User feedback suggests that drivers are likely to use Remote View while driving because of perceived safety, control and ergonomics advantages over TS1.
• Static Remote View is less demanding than dynamic Remote View? Based on cognitive SRR results and participant feedback, we conclude that static Remote View is less cognitively demanding than dynamic modes. Furthermore based on our findings, we do not recommend dynamic RV modes for in-vehicle use.
• Touchpad is viable as an input device for touchscreen GUI during driving? Touchpad was very well accepted and all results support the assumption that TP is suitable for use together with TS GUI.
• Touchscreen is viable as an input device for HUD during driving? The viability of TS for HUD control during driving was confirmed on basic level. Most participants were able to use RVs1 mode and some found it very useful, but several issues such as difficult learning process and inferior ergonomics compared to TP suggest that touchscreen should not be used as a single available input device for Remote View.
• Users will rate haptic feedback on touchscreen positively? Clickable touchscreen functionality was very useful for RVs1 mode and was also used in TS1 mode by some participants. It can be said that clickable TS is favourable for some users and it does not produce negative effects for the rest. However, conclusive evidence about usefulness of clickable TS as a standalone feature of TS interface can not be shown by the results of the present study.
Additional findings. Along with the main results which addressed the main objectives of this thesis, we found several other noteworthy findings. For example, we found evidence which supports the usefulness of touchpad for touchscreen GUI navigation. We could confirm that high acceptance and usability is achievable even for interfaces that are much less efficient than TS – without compromising flexibility of TS interface. And we presented our notes and observations that could not be confirmed, but may be valuable for initiating further research in IVIS safety.
Finally, because various interfaces have their strengths and weaknesses we see hybrid interfaces as the most appropriate solution for IVIS interaction. Redundant controls for the same IVIS offer the freedom of choice and therefore satisfy the greatest number of users. For example the Remote View test setup allows to use simple, fast and direct touchscreen interface while waiting for a traffic light and then comfortably operating the same GUI using touchpad with head-up display while driving.

CHALMERS, Applied Mechanics, Master’s Thesis 2010:56 90
References
AblaBmeier, M. et al., 2007. Eye Gaze Studies Comparing Head-Up and Head-Down Displays in Vehicles. In Multimedia and Expo, 2007 IEEE International Conference on. Beijing, China, pp. 2250-2252. Available at: http://ieeexplore.ieee.org/xpls/abs_all.jsp?arnumber=4285134 [Accessed April 20, 2010].
Ademar, F., 2009. Embedded.com - Adapting UI designs to multiple embedded/mobile device display needs. Available at: http://www.embedded.com/design/opensource/222000182?_requestid=47437 [Accessed April 26, 2010].
Alm, T., 2007. Simulator-Based Design : Methodology and vehicle display application, Available at: http://liu.diva-portal.org/smash/record.jsf?searchId=1&pid=diva2:23241 [Accessed April 20, 2010].
Alpern, M. & Minardo, K., 2003. Developing a car gesture interface for use as a secondary task. In CHI '03 extended abstracts on Human factors in computing systems. Ft. Lauderdale, Florida, USA: ACM, pp. 932-933. Available at: http://doi.acm.org/10.1145/765891.766078 [Accessed April 20, 2010].
Bach, K.M. et al., 2009. Interacting with in-vehicle systems: understanding, measuring, and evaluating attention. In Proceedings of the 2009 British Computer Society Conference on Human-Computer Interaction. Cambridge, United Kingdom: British Computer Society, pp. 453-462. Available at: http://portal.acm.org/citation.cfm?id=1671011.1671070 [Accessed April 20, 2010].
Bach, K.M. et al., 2008. You can touch, but you can't look: interacting with in-vehicle systems. In Proceeding of the twenty-sixth annual SIGCHI conference on Human factors in computing systems. Florence, Italy: ACM, pp. 1139-1148. Available at: http://doi.acm.org/10.1145/1357054.1357233 [Accessed April 21, 2010].
Bailly, G., Lecolinet, E. & Nigay, L., 2008. Flower menus: a new type of marking menu with large menu breadth, within groups and efficient expert mode memorization. In Proceedings of the working conference on Advanced visual interfaces. Napoli, Italy: ACM, pp. 15-22. Available at: http://portal.acm.org/citation.cfm?id=1385569.1385575 [Accessed April 23, 2010].
BalckBerry, 2010. BlackBerry - SurePress Touch Screen Phone Technology. BalckBerry. Available at: http://na.blackberry.com/devices/features/surepress.jsp [Accessed October 5, 2010].
BASt, 2007. HUMANIST - Final review of driver distraction effects due to the interaction with IVIS, 6th Framework Programme - Priority 2 “Information Society Technologies” “HUMAN centred design for Information Society Technologies”. Available at: http://www.noehumanist.org/deliverables.php?category=TFD.
BASt & TRL, 2004. HUMANIST - Impact of IVIS on driver workload and distraction: Review of assessment methods and recent findings, 6th Framework Programme - Priority 2 “Information Society Technologies” “HUMAN centred design for

CHALMERS, Applied Mechanics, Master’s Thesis 2010:56 91
Information Society Technologies”. Available at: http://www.noehumanist.org/deliverables.php?category=TFD.
Bellotti, F. et al., 2005. COMUNICAR: designing a multimedia, context-aware human-machine interface for cars. Cogn. Technol. Work, 7(1), pp.36-45.
BMW Group, 2009. BMW Innovation Days 2009 – Interior, Infotainment, Mobility. Available at: https://www.press.bmwgroup.com/pressclub/p/gb/pressDetail.html?outputChannelId=8&id=T0056674EN_GB&left_menu_item=node__2367.
Brooke, J., 1996. SUS: A quick and dirty usability scale. In Usability evaluation in industry. Taylor and Francis.
Brusselmans, A., 2008. Welcome to FOT-Net. Available at: http://www.fot-net.eu/ [Accessed October 12, 2010].
Burnett, G., 2000. Usable vehicle navigation systems: are we there yet? In Vehicle Electronic Systems 2000 - European conference and exhibition. Leatherhead, UK, pp. 3.1.1-3.1.11.
Cacciabue, P.C. & Re, C., 2008. HUMANIST - Specification of knowledge database on guidelines and design criteria, 6th Framework Programme - Priority 2 “Information Society Technologies” “HUMAN centred design for Information Society Technologies”. Available at: http://www.noehumanist.org/deliverables.php?category=TFC.
Chilakapati, R.K., 2009. Intrusiveness of visual detection task on secondary and driving task performance - A driving simulator study. Text.Thesis.Masters.H2. Göteborg: Chalmers tekniska högskola. Available at: http://publications.lib.chalmers.se/cpl/record/index.xsql?pubid=95005 [Accessed April 22, 2010].
Commission of the European Communities, 2008. Commision recommendation of 26/V/2008 on safe and efficient in-vehicle information and communication systems: Update of the European Statement of Principles on Human-Machine Interface. Available at: http://www.esafetysupport.org/en/esafety_activities/european_commission/.
Deregibus, E. et al., 2008. AIDE Final HMI (description of the overall AIDE HMI both HW and SW), Available at: http://www.aide-eu.org/pdf/sp3_deliv_new/aide_d3_4_4_summary.pdf.
Doshi, A., Shinko Yuanhsien Cheng & Trivedi, M., 2009. A Novel Active Heads-Up Display for Driver Assistance. Systems, Man, and Cybernetics, Part B: Cybernetics, IEEE Transactions on, 39(1), pp.85-93.
Driver Focus-Telematics Working Group, 2006. Statement of Principles, Criteria and Verification Procedures on Driver Interactions with Advanced In-Vehicle Information and Communication Systems. Available at: http://www.autoalliance.org/index.cfm?objectid=8B8E45B6-C296-BA16-3EF6CED240E0CA90.

CHALMERS, Applied Mechanics, Master’s Thesis 2010:56 92
Ecker, R. et al., 2009. pieTouch: a direct touch gesture interface for interacting with in-vehicle information systems. In Proceedings of the 11th International Conference on Human-Computer Interaction with Mobile Devices and Services. Bonn, Germany: ACM, pp. 1-10. Available at: http://doi.acm.org/10.1145/1613858.1613887 [Accessed April 20, 2010].
Engström, J., Johansson, E. & Östlund, J., 2005. Effects of visual and cognitive load in real and simulated motorway driving. Transportation Research Part F: Traffic Psychology and Behaviour, 8(2), pp.97-120.
Engström, J. & Mårdh, S., 2007. SafeTE final report, Vägverket. Available at: http://publikationswebbutik.vv.se/shopping/ShowItem____2907.aspx [Accessed April 20, 2010].
ERTICO, 2008. eSafety Recommendation Note, Available at: http://www.esafetysupport.org/en/esafety_activities/28_recommendations/.
ERTICO – ITS Europe, 2009. euroFOT // Press release: Intelligent vehicles tested across European roads. Available at: http://www.eurofot-ip.eu/en/media_desk/press_releases/ [Accessed October 11, 2010].
Ford Motor Company, 2010a. FORD INTRODUCES SIGNATURE INTERIOR EXPERIENCE: MYFORD TOUCH DRIVER CONNECT TECHNOLOGY. Ford Motor Company Newsroom. Available at: http://media.ford.com/article_display.cfm?article_id=31713 [Accessed April 21, 2010].
Ford Motor Company, 2010b. FORD SYNC HITS 2 MILLION MARK; BOOSTS RESALE VALUE, PURCHASE CONSIDERATION AND CUSTOMER SATISFACTION | Ford Motor Company Newsroom. Ford Motor Company Newsroom. Available at: http://media.ford.com/article_display.cfm?article_id=32262 [Accessed April 26, 2010].
Fuller, H. & Tsimhoni, O., 2009. Glance strategies for using an in-vehicle touch-screen monitor. Available at: http://deepblue.lib.umich.edu/handle/2027.42/62469 [Accessed October 12, 2010].
GM Media, 2010. GM Reimagines Head-Up Display Technology. Available at: http://media.gm.com/content/media/us/en/news/news_detail.brand_gm.html/content/Pages/news/us/en/2010/Mar/0317_hud [Accessed September 14, 2010].
Graf, S. et al., 2008. In-car interaction using search-based user interfaces. In Proceeding of the twenty-sixth annual SIGCHI conference on Human factors in computing systems. Florence, Italy: ACM, pp. 1685-1688. Available at: http://portal.acm.org/citation.cfm?id=1357317 [Accessed April 20, 2010].
Horrey, W.J., Wickens, C.D. & Alexander, A.L., 2003. The Effects of Head-Up Display Clutter and In-Vehicle Display Separation on Concurrent Driving Performance. Human Factors and Ergonomics Society Annual Meeting Proceedings, 47, pp.1880-1884.

CHALMERS, Applied Mechanics, Master’s Thesis 2010:56 93
Hoshi, T. et al., 2009. Touchable Holography. Available at: http://www.alab.t.u-tokyo.ac.jp/~siggraph/09/TouchableHolography/SIGGRAPH09-TH.html [Accessed September 14, 2010].
HUMANIST website, 2004. HUMANIST_Consortium Description. Available at: http://www.noehumanist.org/consortium.php [Accessed April 24, 2010].
IEA, 2010. What is Ergonomics. International Ergonomics Association. Available at: http://www.iea.cc/01_what/What%20is%20Ergonomics.html [Accessed October 21, 2010].
ISO 16673:, 2007. Road vehicles - Ergonomic aspects of transport information and control systems - Occlusion method to assess visual demand due to the use of in-vehicle systems. Available at: http://www.iso.org/iso/iso_catalogue/catalogue_tc/catalogue_detail.htm?csnumber=38035 [Accessed April 23, 2010].
ISO 26022/PRF, 2010. Road vehicles - Ergonomic aspects of transport information and control systems - Simulated lane change test to assess in-vehicle secondary task demand. Available at: http://www.iso.org/iso/catalogue_detail.htm?csnumber=43361 [Accessed April 23, 2010].
J.D.Power and Associates, 2009. Navigation Usage and Satisfaction Study. Available at: http://businesscenter.jdpower.com/news/pressrelease.aspx?ID=2009249 [Accessed April 22, 2010].
Janssen, W., 2007. HUMANIST - Final proposal for common methodologies for analysing driver behaviour, 6th Framework Programme - Priority 2 “Information Society Technologies” “HUMAN centred design for Information Society Technologies”. Available at: http://www.noehumanist.org/deliverables.php?category=TFE.
Johansson, E. et al., 2004. AIDE - Review of existing techniques and metrics for IVIS and ADAS assesment, VTEC, CRF, BASt. Available at: http://www.aide-eu.org/res_sp2.html.
Johansson, H.W., 2005. In-Vehicle Screen Density : Driver distraction and User Preferences for Low vs High Screen Densisty, Available at: http://urn.kb.se/resolve?urn=urn:nbn:se:liu:diva-4336 [Accessed April 20, 2010].
Kern, D. et al., 2009. Writing to your car: handwritten text input while driving. In Proceedings of the 27th international conference extended abstracts on Human factors in computing systems. Boston, MA, USA: ACM, pp. 4705-4710. Available at: http://portal.acm.org/citation.cfm?doid=1520340.1520724 [Accessed April 21, 2010].
Kosaka, H. et al., 2006. Evaluation of a New In-vehicle HMI System Composed of Steering Wheel Switch and Head-Up Display -Comparison with a center-cluster panel when the number of switch pushes is the same for each HMI-. In 2006 SAE World Congress. Detroit, Michigan. Available at: http://www.sae.org/technical/papers/2008-01-0559 [Accessed April 20, 2010].

CHALMERS, Applied Mechanics, Master’s Thesis 2010:56 94
Liu, Y. & Wen, M., 2004. Comparison of head-up display (HUD) vs. head-down display (HDD): driving performance of commercial vehicle operators in Taiwan. International Journal of Human-Computer Studies, 61(5), pp.679-697.
MacKenzie, I.S. & Oniszczak, A., 1998. A comparison of three selection techniques for touchpads. In Proceedings of the SIGCHI conference on Human factors in computing systems. Los Angeles, California, United States: ACM Press/Addison-Wesley Publishing Co., pp. 336-343. Available at: http://doi.acm.org/10.1145/274644.274691 [Accessed April 20, 2010].
MacKenzie, I.S. & Soukoreff, R.W., 2002. Text Entry for Mobile Computing: Models and Methods,Theory and Practice. Human-Computer Interaction, 17(2), p.147.
MAIX, 2009. Automotive Voice UI Usability Study User Survey, Aachen, Germany: Nuance. Available at: http://www.nuance.com/industries/automotive/whitepapers/AutomotiveUsabilityStudy_Final.pdf.
Making Virtual Solid, 2010. Virtual Cable™ Car Navigation - Safe, Simple and Intuitive. Available at: http://www.mvs.net/index.html [Accessed October 12, 2010].
Markkula, G., Amditis, A. & Engström, J., 2008. AIDE - Adaptive Integrated Driver-vehicle Interface, Fraunhofer IAO. AIDE homepage. Available at: http://www.aide-eu.org/ [Accessed September 28, 2010].
Markkula, G. & Engström, J., 2006. A Steering Wheel Reversal Rate Metric for Assessing Effects of Visual and Cognitive Secondary Task Load. ITS2006, p.12.
Markkula, G. & Johansson, E., 2009. Adaptive Integrated Driver-Vehicle interfacE (AIDE) EU research project. Available at: www.vti.se/11338.epibrw.
McQuarrie, P.E.F., 1996. The Market Research Toolbox: A Concise Guide for Beginners: A Short Guide for Beginners, Sage Publications, Inc.
Mårdh, S., 2008. HUMANIST - Final Reviews of knowledge on Human Centred Design applied to IVIS and ADAS systems, 6th Framework Programme - Priority 2 “Information Society Technologies” “HUMAN centred design for Information Society Technologies”. Available at: http://www.noehumanist.org/deliverables.php?category=TFC.
Niedermaier, B. et al., 2009. The New BMW iDrive --- Applied Processes and Methods to Assure High Usability. In Proceedings of the 2nd International Conference on Digital Human Modeling: Held as Part of HCI International 2009. San Diego, CA: Springer-Verlag, pp. 443-452. Available at: http://portal.acm.org/citation.cfm?id=1601765.1601816 [Accessed April 20, 2010].
Nissan Motor Co., 2008. WORLD FIRST ECO PEDAL HELPS REDUCE FUEL CONSUMPTION. Nissan/Infiniti News Room. Available at: http://www.nissannews.com/newsrelease.do?id=542 [Accessed October 12, 2010].
Norberg, S., Touchpad as interaction input control for use of In-Vehicle Infotainment Systems. Text.Thesis.Masters.H3. Available at:

CHALMERS, Applied Mechanics, Master’s Thesis 2010:56 95
http://publications.lib.chalmers.se/cpl/record/index.xsql?pubid=97392 [Accessed April 21, 2010].
Normark, C., 2009. Towards optimized instrument panels, Lulea: Lulea University of Technology. Available at: http://www.ltu.se/web/1.39383?l=en&pureId=2709980&pureFamily=dk.atira.pure.families.publication.shared.model.Publication.
Palo, P., Broström, R. & Normark, C.J., 2009. OPTIVe - Optimized system Integration for safe Interaction In Vehicles, IVSS Project Report. Available at: http://www.ivss.se/templates/Page.aspx?id=204.
Panasonic, 2010. Proprietary 3D Image Sensor "D-IMager" to be released | News Release 2010 | News | Panasonic Electric Works | Panasonic. Available at: http://panasonic-electric-works.net/news/2010/1005/1005-01.html [Accessed September 14, 2010].
Pettitt, M., Burnett, G. & Stevens, A., 2007. An extended keystroke level model (KLM) for predicting the visual demand of in-vehicle information systems. In Proceedings of the SIGCHI conference on Human factors in computing systems. San Jose, California, USA: ACM, pp. 1515-1524. Available at: http://doi.acm.org/10.1145/1240624.1240852 [Accessed April 20, 2010].
Pitts, M.J. et al., 2009. Assessing subjective response to haptic feedback in automotive touchscreens. In Proceedings of the 1st International Conference on Automotive User Interfaces and Interactive Vehicular Applications. Essen, Germany: ACM, pp. 11-18. Available at: http://doi.acm.org/10.1145/1620509.1620512 [Accessed April 20, 2010].
Poitschke, T. et al., 2008. Contact-analog information representation in an automotive head-up display. In Proceedings of the 2008 symposium on Eye tracking research & applications. Savannah, Georgia: ACM, pp. 119-122. Available at: http://doi.acm.org/10.1145/1344471.1344502 [Accessed September 14, 2010].
Rué, M.R., 2007. AIDE City Car Prototype. Available at: http://www.aide-eu.org/news/2007/Leon_AIDE_SEAT_150207.pdf.
Rydström, A., 2009. The Use of Haptics When Interacting with in-Car Interfaces, Luleå. Available at: http://pure.ltu.se/ws/fbspretrieve/2624937.
Rydström, A. et al., 2005. Multifunctional systems in vehicles: a usability evaluation. In Proceedings of CybErg 2005, The Fourth International Cyberspace Conference on Ergonomics, Johannesburg, International Ergonomics Association Press. Available at: http://web.wits.ac.za/NR/rdonlyres/ED198361-041B-4094-9ECF-6B3C8319010F/0/usab2.pdf.
Rydström, A., Broström, R. & Bengtsson, P., 2009. A comparison of two contemporary types if in-car multifunctional interfaces. Manuscript submitted for publication.
Sasanouchi, K. et al., 2005. Development of the Hmi System That Improves the Safety and Operational Convenience By the Combination of Steering Wheel Switch

CHALMERS, Applied Mechanics, Master’s Thesis 2010:56 96
and Head-Up Display. In 2005 SAE World Congress. Detroit, Michigan. Available at: http://www.sae.org/technical/papers/2005-01-0438 [Accessed April 20, 2010].
Selker, T., 2008. Touching the future. Communications of the ACM, 51(12), p.14.
Serafin, C. et al., 2007. User Experience in the U.S. and Germany of In-Vehicle Touch Screens with Integrated Haptic and Auditory Feedback. In SAE World Congress & Exhibition 2007. Detroit, Michigan. Available at: http://www.sae.org/technical/papers/2007-01-0451 [Accessed April 21, 2010].
Stevens, A. et al., 2006. HUMANIST - Report on the tools and methods for integrating methods into an assessment methodology, 6th Framework Programme - Priority 2 “Information Society Technologies” “HUMAN centred design for Information Society Technologies”.
Toledo, T. & Zohar, D., 2007. Modeling Duration of Lane Changes. Transportation Research Record: Journal of the Transportation Research Board, 1999(-1), pp.71-78.
Tonnis, M., Broy, V. & Klinker, G., 2006. A Survey of Challenges Related to the Design of 3D User Interfaces for Car Drivers. In 3D User Interfaces (3DUI'06). 3D User Interfaces (3DUI'06). Alexandria, VA, USA, pp. 127-134. Available at: http://dx.doi.org/10.1109/VR.2006.19 [Accessed April 20, 2010].
UMTRI Driver Interface Group, 2010. All the Major Telematics Guidelines We've Seen. Available at: http://www.umich.edu/~driving/safety/guidelines.html [Accessed April 23, 2010].
Van Der Laan, J.D., Heino, A. & De Waard, D., 1997. A simple procedure for the assessment of acceptance of advanced transport telematics. Transportation Research Part C: Emerging Technologies, 5(1), pp.1-10.
Veste, H.T. et al., 2007. HUMANIST - Common methodology for definition of scenarios environment and selection of most relevant scenarios for data collection, 6th Framework Programme - Priority 2 “Information Society Technologies” “HUMAN centred design for Information Society Technologies”. Available at: http://www.noehumanist.org/deliverables.php?category=TFC.
Wickens, C.D., 2008. Multiple Resources and Mental Workload. Human Factors: The Journal of the Human Factors and Ergonomics Society, 50(3), pp.449 -455.
Wittmann, M. et al., 2006. Effects of display position of a visual in-vehicle task on simulated driving. Applied Ergonomics, 37(2), pp.187-199.
VTT, 2006. HUMANIST - Definition of user groups and review of their specific needs on ITS, 6th Framework Programme - Priority 2 “Information Society Technologies” “HUMAN centred design for Information Society Technologies”. Available at: http://www.noehumanist.org/deliverables.php?category=TFA.
Yang, C. et al., 2007. Flexible Multi-modal Interaction Technologies and User Interface Specially Designed for Chinese Car Infotainment System. In Human-Computer Interaction. HCI Intelligent Multimodal Interaction Environments. pp. 243-

CHALMERS, Applied Mechanics, Master’s Thesis 2010:56 97
252. Available at: http://dx.doi.org/10.1007/978-3-540-73110-8_26 [Accessed April 20, 2010].
Östlund, J. et al., 2006. Effects of cognitive and visual load in real and simulated driving, VTI. Available at: http://www.vti.se/templates/Report____2797.aspx?reportid=5370.
Östlund, J. et al., 2005. AIDE - Driving performance assessment methods and metrics, VTI. VTEC, BMW. Available at: http://www.aide-eu.org/res_sp2.html.

CHALMERS, Applied Mechanics, Master’s Thesis 2010:56 98
Appendix 1 – Preliminary Remote View specification
1. Definition 1.1. Remote View (RV) is an in vehicle HMI element or functionality that
enhances safety by partially (or fully) displaying multifunctional graphics user interface (GUI) on a distant display device that is more safe to look at than the primary GUI display.
1.2. RV is meant to be controlled from Touch Screen (TS) or Touch Pad (TP) and therefore is most suitable for TS GUI, but can also be adapted to HMIs with alternative input methods.
1.3. An example of HMI with RV is shown in Figure 1: 1.3.1. Head Up Display (HUD) – the main display device for RV
functionality. 1.3.2. Instrument Cluster (CL) – one of the possible alternative locations for
RV display, for example, when HUD is not fitted. 1.3.3. Touch Screen (TS) – primary display device for multifunctional GUI
that is also an input device both for regular TS interaction and for controlling RV.
1.3.4. Touch Pad (TP) – alternative or additional input device for controlling RV and possibly also the primary display device.
Figure 1 Example of Remote View input-output hardware setup.
2. Purpose 2.1. Use of RV is likely to significantly improve safety compared to use of
regular TS while driving by enabling efficient use of peripheral vision during interaction (experimental results not yet available – 2010.04.16).
2.2. RV has the potential of enhancing customer experience by offering intuitive and innovative feature in addition to primary in vehicle HMI for small or no added cost.
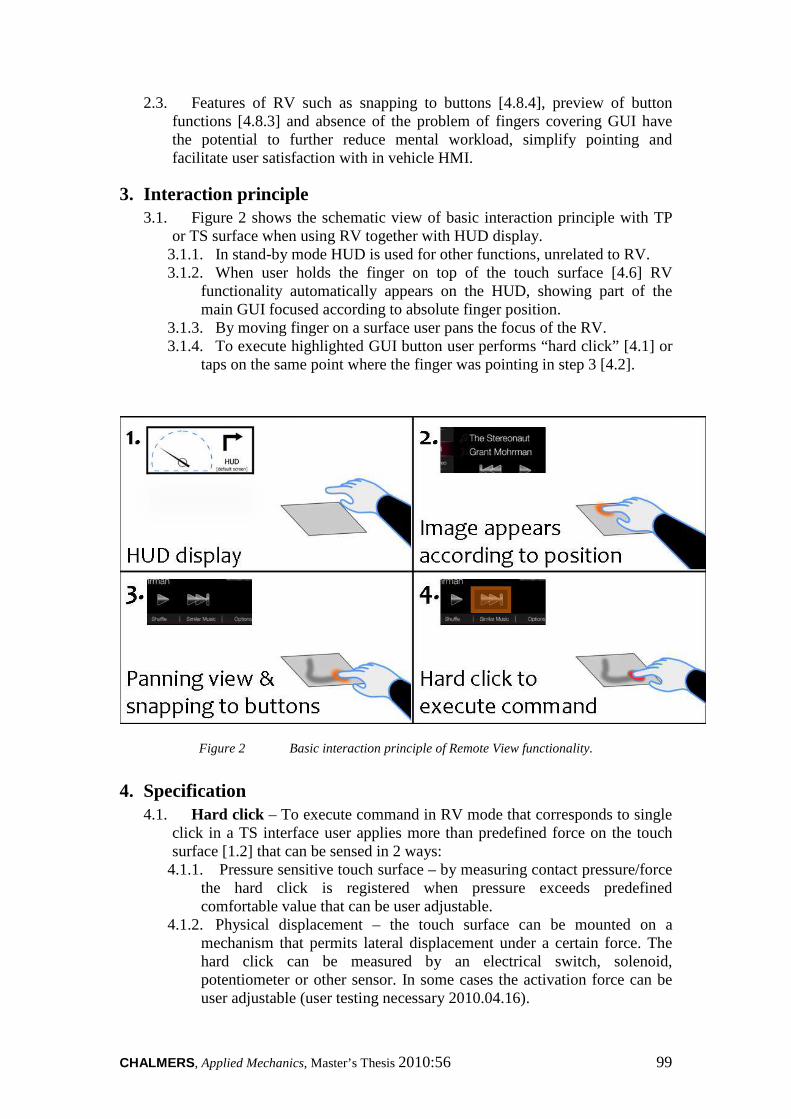
CHALMERS, Applied Mechanics, Master’s Thesis 2010:56 99
2.3. Features of RV such as snapping to buttons [4.8.4], preview of button functions [4.8.3] and absence of the problem of fingers covering GUI have the potential to further reduce mental workload, simplify pointing and facilitate user satisfaction with in vehicle HMI.
3. Interaction principle 3.1. Figure 2 shows the schematic view of basic interaction principle with TP
or TS surface when using RV together with HUD display. 3.1.1. In stand-by mode HUD is used for other functions, unrelated to RV. 3.1.2. When user holds the finger on top of the touch surface [4.6] RV
functionality automatically appears on the HUD, showing part of the main GUI focused according to absolute finger position.
3.1.3. By moving finger on a surface user pans the focus of the RV. 3.1.4. To execute highlighted GUI button user performs “hard click” [4.1] or
taps on the same point where the finger was pointing in step 3 [4.2].
Figure 2 Basic interaction principle of Remote View functionality.
4. Specification 4.1. Hard click – To execute command in RV mode that corresponds to single
click in a TS interface user applies more than predefined force on the touch surface [1.2] that can be sensed in 2 ways:
4.1.1. Pressure sensitive touch surface – by measuring contact pressure/force the hard click is registered when pressure exceeds predefined comfortable value that can be user adjustable.
4.1.2. Physical displacement – the touch surface can be mounted on a mechanism that permits lateral displacement under a certain force. The hard click can be measured by an electrical switch, solenoid, potentiometer or other sensor. In some cases the activation force can be user adjustable (user testing necessary 2010.04.16).

CHALMERS, Applied Mechanics, Master’s Thesis 2010:56 100
4.2. Tapping – Alternative method for single click registering always available to the user is lifting the finger and shortly pressing on the touch surface in the same spot as highlighted before. To improve precision, the tapping zone around focused GUI element could be scaled bigger to cover up to 50% of surrounding neighbour elements’ surface (user testing necessary 2010.04.16).
4.3. Thumb button – 3rd option for single click registering could be a separate button(s) next to touch surface that allows to perform click with a thumb or another finger while highlighting target control with one finger on the touch surface.
4.4. Second finger click – 4th option for single click registering could be taping with a second finger in any place of the touch surface while highlighting target control with one finger on the touch surface. This feature requires multitouch surface.
4.5. Shared TS input – RV is to be designed so that it permits most interaction cases [5.x] with regular TS interface without interference while also automatically activating and controlling RV functionality in an intuitive way.
4.6. RV activation – When user touches the touch surface the following steps apply:
4.6.1. First 0.1s is a delay time. 4.6.2. Next until 0.3s the RV image fades in into the display (HUD). 4.6.3. After 0.3s RV in fully initialized, but if user interrupts touch during the
initial 0.3s, RV immediately closes down. 4.6.4. The timing and delays can be user adjustable.
4.7. RV auto-hiding – RV starts fading out and closes 1.5s after the last time user released the touch surface(s). The delay should be user adjustable within a range of 0.5 to 5 seconds.
4.8. Display considerations – requirements for RV visual presentation: 4.8.1. Safety information – RV image should never prevent driver from
viewing safety critical information on a given display device. Example – part of the HUD always shows speed, navigation instructions and warnings in parallel to RV image.
4.8.2. Dedicated input field – Where user is expected to enter typed data, the upper part of RV image always shows static input field/text box that correlates to the input field in the main GUI.
4.8.3. Preview of input – When typing, dedicated input field should preview highlighted key function (example, hovering over “3” key displays number “3” as a last item in the entry field).

CHALMERS, Applied Mechanics, Master’s Thesis 2010:56 101
4.8.4. Snapping – The image on the RV should snap/center on the meaningful controls/buttons in order to reduce effort of pointing and fine adjustments.
4.8.5. Focus zoom – the option/button in focus should display hover highlighting and get enlarged in comparison to the rest of the controls visible in RV. (The focus zoom is set in relation to global RV zoom, but the amount is not yet defined 2010.04.16).
4.8.6. Zoom – Using pinch gesture on touch surface could zoom into GUI image on the RV to enable comfortable zoom/amount of information balance for individual user. Permanent zoom level adjustment should be an option in the settings.
4.9. Lock-In – Special feature to increase efficiency of RV interaction when navigating lists, performing continuous adjustments or other functions. In Lock-In mode standard GUI is replaced or limited to a certain static image/sub-GUI of fixed size that is more suitable for performing necessary action. The RV Zoom [4.8.6] is disabled in Lock-In mode. It can be implemented in 1 out of 2 possible ways. (possibly user could have and option to select between Lock-In methods):
4.9.1. Double-click Lock-In – By double-clicking on the control’s area or title-bar [4.11.4] zooms into the Lock-In mode. Another double-click Locks-out. Also after RV auto-hide Lock-In mode is reset.
4.9.2. Automatic Lock-In – When user pans the focus into Lock-In area, GUI automatically zooms into Lock-In mode. It may be necessary to show cursor while in Auto Lock-In. When cursor touches the edge of the Auto Lock-In window it automatically Locks-out. Also after RV auto-hide Lock-In mode is reset. (More evaluation needed to confirm validity of this option 2010.04.16)
4.9.3. No Lock-In (applies only if Auto Lock-In is not used) – When RV is focused over pan-able list/map the panning-flipping gestures are active, therefore panning of RV focus window is disabled. To re-gain the control over RV focus user needs to hold the finger in one point for 0.5s and the panning motion switches to RV. On transition the screen could show “water surface ripple” effect around the finger to highlight the change of mode. Lifting the finger instantly returns to default list/map panning mode.
4.10. Hardware considerations – Requirements for hardware implementation: 4.10.1. Colour display – The RV display must reproduce high quality colour
image comparable to the primary GUI display. 4.10.2. Proportions – Input devices that use absolute positioning relationship
to main GUI must have the same proportions as the main GUI. The RV display size and proportions are not regulated.
4.10.3. Relative mode – Touch Pad or similar input device could be used in relative pointing mode instead of normal absolute mode. In case of relative input the RV moves/focuses corresponding to the finger movement in relation to previous focus point. Relative mode allows use of small touch surface without limitation in proportions [4.10.2]. (The usability needs to be tested 2010.04.16)

CHALMERS, Applied Mechanics, Master’s Thesis 2010:56 102
4.11. GUI design optimizations – To ensure best RV performance, the main GUI should have:
4.11.1. RV indicator – GUI should have an indicator (for example, pop-up button in the corner) that signals that RV is active and a click on such button should toggle RV to stay visible even after releasing the touch surface(s).
4.11.2. No spaces – GUI button arrays (buttons positioned together) should not have inactive spaces in-between one another, the margins/padding should be purely visual/cosmetic.
4.11.3. Limited “hold to activate” – GUI should not use delay/continuous hold input for activating pop-up functions (for example, pie-menu [5.5] and switching states [5.3]) on top of the pan-able GUI elements (for example lists, maps). Instead pop-up functions could be accessed after a click on a target.
4.11.4. Content blocks – Some features such as “Lock-In” [4.9] benefit from clear distinction of areas on the GUI. Example – the part of the screen containing pan-able list or continuous adjustment control could have a frame/own cell around it to allow more efficient RV focusing on such content.
4.12. Additional feedback – Multimodal feedback to enhance RV performance 4.12.1. Audio – Sound cues for Snapping focus change, selection and other
features could be implemented and offered as a user selectable option. 4.12.2. Voice – Pronunciation of highlighted letter/number while typing or
reading aloud using text to speech (TTS) in other appropriate cases could be implemented and offered as a user selectable option.
4.12.3. Haptic – Vibration or texture change feedback could be used to enhance pointing and user experience.
5. Specific cases
This chapter describes the relation between different interaction methods in a TS interface and the corresponding control using Remote View according to 4.5.
Regular TS interaction RV interaction
5.1. Single click
(Pressing on “buttons”, selecting list items, etc.)
a) Regular short press (button executed when finger is released – “mouse-up”, but not when first touch registered).
b) “Hard click” can also be used [4.1].
There are 4 alternatives for single clicking while in RV mode:
a) Tapping [4.2] (same as Regular short press).
b) “Hard click” [4.1]. c) Thumb button [4.3] (if button fitted). d) Second finger click [4.4] (if multitouch).

CHALMERS, Applied Mechanics, Master’s Thesis 2010:56 103
5.2. Double click
(Increasing zoom in maps, etc.)
a) All the same options as for Single click, only clicking twice in rapid succession.
Double click is also used to Lock-In [4.9.1], but that should never interfere with regular TS GUI.
a) The same as in TS mode.
5.3. Click and drag
(Rearranging shortcuts, selecting text, etc.)
a) (Incompatible with RV! Use 5.3b instead) Holding a finger in one spot for a few seconds to activate drag mode (iPhone way). Then freely dragging everything you touch.
b) Holding a finger to enter RV mode [4.6], then together with RV indicator [4.11.1] a toggling button should pop-up to enter drag mode. If pressed – RV is deactivated and drag mode (as in 5.3a) is enabled on TS.
“Click and drag” is used for visually demanding tasks that are not recommended for use while driving, therefore full support in RV mode is not necessary.
Drag mode [5.3b] which is displayed only on TS should be an efficient substitute to pure iPhone interaction remake [5.3a].
5.4. Click to unfold menu
(Menu that pops-out on click and hides away when menu item is selected or menu icon is clicked again)
RV should not interfere with such interaction – any Single click action can be used to unfold/fold menu and also selecting menu items.
5.5. Pie menu (marking menu)
(pop-up menu next or around the finger with additional buttons, hides on next click)
a) (Not recommended. Use 5.5b instead) Holding a finger in one spot for a few seconds to activate pie menu.
Additional options (pie menu options) appear after the first Single click on selected item.
Time delay activated marking menus [5.5a] are not very convenient (the principal problems are: time delay until pop-up, unintended activation, no interface cues – confusing), therefore method 5.5b should be a better solution and it is fully compatible with RV.

CHALMERS, Applied Mechanics, Master’s Thesis 2010:56 104
5.6. Pan-flip view (1 finger)
(Scrolling lists, panning map view, continuous adjustments including with or without momentum)
a) Regular dragging/flipping of finger over active area within GUI.
There is Lock-In mode [4.9] for RV to make pan-flip action more efficient.
a) Otherwise No Lock-In 4.9.3 condition applies:
1. User can drag the focus point over pan-flip area and exit it without affecting pan-flip.
2. If user releases finger while focus point (RV center) is above pan-view area the next touch will be considered panning-flipping action.
3. To regain control over RV focus, user holds the finger in one spot according to 4.9.3.
5.7. Multitouch gestures
(any 2 or more finger interaction elements)
RV should not interfere with such interaction – any multitouch gesture works together with RV.
5.8. Proximity controlled GUI elements
(GUI elements that pop-up or become opaque when user’s hand closes in on TS and controls)
RV might need additional proximity sensing for every touch input device [1.3.4], otherwise no special requirements.
5.9. Fingertip writing
(Using part of the TS for writing stroke recognition from fingertip)
Fingertip writing in relation to RV should be treated exactly as Pan-flip view [5.6].
Therefore writing is fully supported by RV.

CHALMERS, Applied Mechanics, Master’s Thesis 2010:56 105
Appendix 2 – Remote View test procedure script
(based on:”Studie: Placering av touch screen”)
Sergejs Dombrovskis, Chalmers Automotive Eng.
2010-07-22
1. Purpose
The study aims to test the potential of a proposal for a new HMI feature that brings together HeadUpDisplay (HUD) and TouchScreen (TS). Simultaneously with Remote View trials experiment will evaluate 5 selection methods, 2 pointing devices and 2 display positions. Experiment is focused on secondary task safety, acceptance and usability of the new HMI hardware. The project is a part of a Master’s thesis work in Automotive Engineering.
2. Expected results
Concept development:
• Fully functional Study prototype. Suitable for demonstration purposes and R&D.
• Preliminary specification of Remote View based on use cases, experiment results and experience from prototype implementation.
Safety data:
• Comprehensive analysis of the safety benefit from Remote View in comparison to touchscreen.
• Logged data from FOT car.
User acceptance data:
• Summary on findings and observations. • Data from Van der Laan’s acceptance scale (recommended by Humanist
project). • Answers to open-ended interview questions.
Usability data:
• Summary on potential problems and important aspects of RV usability. • SystemUsabilityScale score (Brooke quest. – recommended by Humanist
project). • Answers to open-ended interview questions. • Logged data and video recordings from FOT car.

CHALMERS, Applied Mechanics, Master’s Thesis 2010:56 106
3. Method
Description:
• Driving experiment in real traffic using instrumented EuroFOT car and PC based HMI prototype.
Participants
• 20-25 employees of VCC. • Gender balance: preferably 50% female, 50% male. • Driving experience: preferably license for > 5 years and drive regularly. • Touchscreen experience: 50% use iPhone, Android or comparable device,
50% other. • Age: no specific requirement (25 - 60).
Test hardware:
• Test-bed: EuroFOT 102 car Volvo XC70 (PSP478), equipped with: o CAN logger. o 4 video cameras. o FCW-ACC radar and vision system. o LDW vision system. o SmartEye eye tracker.
• HMI platform: Laptop from Lindholmen’s Optive simulator – “Cluster OAL-CLI017”
• Clickable Touchpad (TP): Cirque Easy Cat USB touchpad. Custom “clickability” by placing 4 buttons underneath that are connected to RightMouseButton. Capacitive, no multitouch support, 2 hardware buttons.
• Clickable TS: 7" capacitive widescreen touchscreen from development kit by Touch International (VGA 1024x768, no multitouch). Custom “clickability” by placing 5 buttons underneath the screen that are connected to RightMouseButton. Custom flexible screen fixture with palmrest, sun protection hood and screen border frame. Metal fixture frame for XC70 from “Placering av touch screen” study.
• HUD: Custom cardboard mirror holder over 7" widescreen monitor (VGA 1024x768). Capable of displaying 640x480 mirrored mage. Assembly is placed on top of dashboard as far as possible under the windscreen.
• Additional videocard: Chinese USB-VGA adapter. • Router: wireless Apple Airport Express router for establishing dummy
network connection. • 1 USB hub. • Power connections: three 220V power outlets and one additional 12V power
socket for HUD screen.

CHALMERS, Applied Mechanics, Master’s Thesis 2010:56 107
Test software:
• TS HMI program: “RV test MAIN.exe” (heavily modified Optive HMI program)
• HUD program: “RV test HUD.exe” (Remote View video receiver for RV test MAIN)
• UDP setup: “UDP_installer_V2.1.exe” (should be installed once) • UDP logger: “WireShark1.2.8” (freeware program used to log RV test data
stream)
+ MatLab scripts and Excel data processing sheets.
Display positions:
• TS: high position – about 19º down from horizon. • HUD: partially covering windscreen – Installed on top of dashboard, close to
normal road view ahead.
Test interfaces and tasks:
• TS – Reference regular touchscreen interaction (TS1) and also touchpad input with image on TS (TS2). HUD not used. TS selection by tapping (similar to normal TS) and pressing-in. Touchpad selection by tapping, pressing-in or using any of the buttons.
o Scrollable list selection – Select MP3 track (supports panning, flipping and dragging by position indicator)
o ABC keyboard entry – input of destination. o 123 num-pad entry – dialing a number o Continuous adjustments – adjusting 4 sound equalizer bars (supports
dragging of sliders with snapping support) • RVs – Remote View concept with Static HUD image. The HUD is always ON
and displays full redundant image from TS with added round “spotlight” pointer. Input devices and selection methods the same as for TS case.
o Scrollable list selection – Select MP3 track (same as for TS) o ABC keyboard entry – input of destination. o 123 num-pad entry – dialing a number. o Continuous adjustments – adjusting 4 sound equalizer bars (same as
for TS).
• RVd – Remote View concept with Dynamic HUD image. The HUD is always ON, shows round “spotlight” pointer but RV image is zoomed-in portion of the complete TS GUI. RVd image is panned by dragging finger on TS surface and in addition snaps to relevant on-screen objects. HUD also features position indicator in the upper right corner to facilitate navigation. Input devices and selection methods the same as for TS case.
o Scrollable list selection – Select MP3 track (same as for TS + snapping to centerline)

CHALMERS, Applied Mechanics, Master’s Thesis 2010:56 108
o ABC keyboard entry – input of destination. (has extra static input field with button preview and snapping to all buttons)
o 123 num-pad entry – dialing a number. (has extra static input field with button preview and snapping to all buttons)
o Continuous adjustments – adjusting 4 sound equalizer bars (same as for TS + snapping to centerline)
Driving situation characteristics:
• Road context – Highway with separating barrier and 2+ lanes in each direction.
• Infrastructure – Some moderate bends and inclination changes along the road. • Local driving goal – Driving forward at a comfortable pace or behind the
vehicle up front without changing lanes. • Weather – Good visibility conditions, summer, preferably dry and overcast. • Lighting – daylight conditions, preferably no direct sunlight. • External events – none.
Test route:
• PVE visitor parking – E6 (over Älvsborgsbron bridge) o Driving training
• Highway – E6 in Malmö direction (North) o 3 interface tests with TS input (when finished, find a place to turn
around)
• Highway – E6 back to Göteborg (South direction) o 3 interface tests with TP input
• Astra Zenica exit – PVE visitor parking (road back to VCC) o Interview
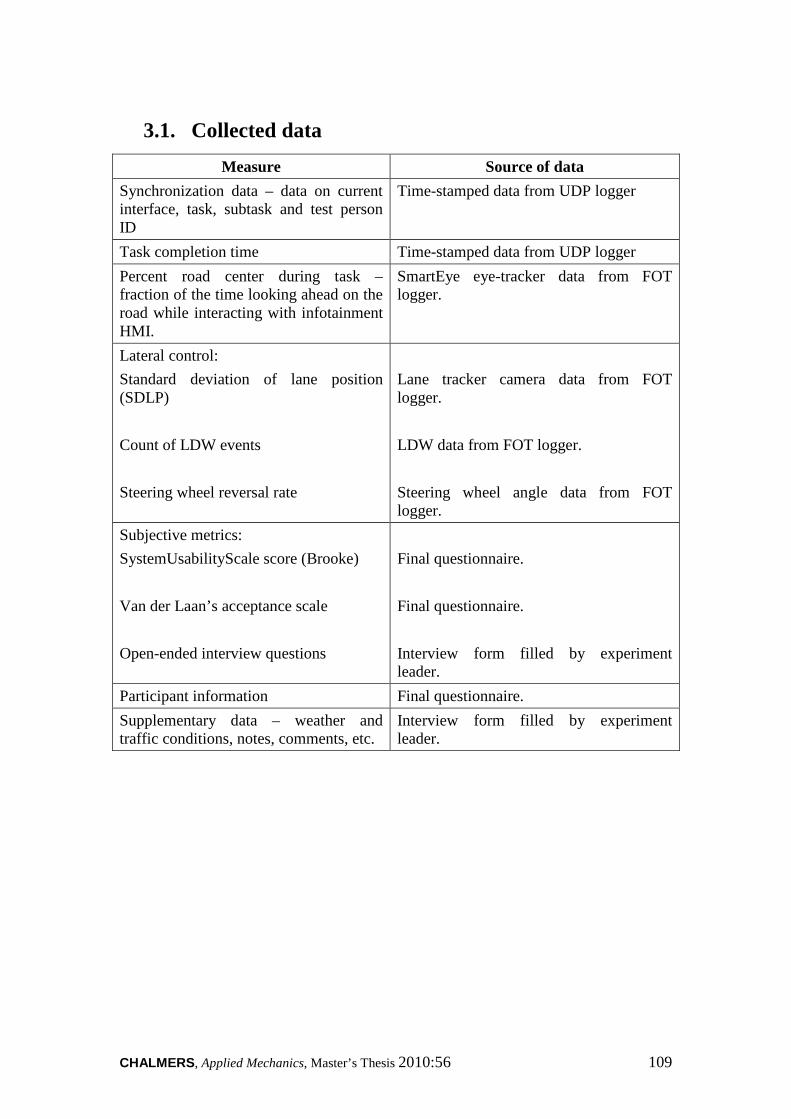
CHALMERS, Applied Mechanics, Master’s Thesis 2010:56 109
3.1. Collected data
Measure Source of data
Synchronization data – data on current interface, task, subtask and test person ID
Time-stamped data from UDP logger
Task completion time Time-stamped data from UDP logger
Percent road center during task – fraction of the time looking ahead on the road while interacting with infotainment HMI.
SmartEye eye-tracker data from FOT logger.
Lateral control:
Standard deviation of lane position (SDLP)
Count of LDW events
Steering wheel reversal rate
Lane tracker camera data from FOT logger.
LDW data from FOT logger.
Steering wheel angle data from FOT logger.
Subjective metrics:
SystemUsabilityScale score (Brooke)
Van der Laan’s acceptance scale
Open-ended interview questions
Final questionnaire.
Final questionnaire.
Interview form filled by experiment leader.
Participant information Final questionnaire.
Supplementary data – weather and traffic conditions, notes, comments, etc.
Interview form filled by experiment leader.

CHALMERS, Applied Mechanics, Master’s Thesis 2010:56 110
4. Procedure script
1. (Preparation before experiment) a. Preparing HMI setup
– Start the engine – Start 220V converter in the boot – Turn on HMI laptop (the following sequence is crucial!) – Plug in HUD VGA cable into laptop’s VGA out – 3rd monitor. – Plug in USB video card into LOWER USB port on laptop (Touchscreen
should be connected to USB video card – 2nd monitor) – Plug in USB hub in to HIGHER USB port on laptop (do not interchange
USB plug positions. Hub has 3 devices connected – touchscreen, touchpad and touchscreen’s physical buttons.)
– Check that all 3 screens are enabled in display properties (“Utöka Windows skrivbordet till denna bildskärm”). And select “Använd den har enheten som primar bildskärm” for touchscreen (2nd monitor).
– Check that RV_settings.ini file has the IP address of the connected router (otherwise you will get a script error in “RV test”)
– Check that in USB touchpad driver all sounds, scroll zones and unused functions are disabled. Right mouse button must be set to work as left mouse button. Double-tapping should be set to slow speed. (all presses on USB touchpad work as left mouse button)
– Check that touching the TS works as left mouse button and pressing into the touchscreen opens right mouse submenu on Desktop.
– (In case of problems – disconnect problematic input device; switch primary screen to 1st and back to 2nd, if necessary also restart computer and check if any button is permanently depressed. Extra measure – remove all mouse devices from device manager and make windows auto-detect them once again)
b. Startup – Start GPS to Kode, turn off navigator’s sound. – Prepare Questionnaire sheets for filling in. – Establish network connection between laptop and router in the car. – Start HMI program: “RV test MAIN.exe” and press Ctrl+3 (switches to 3rd
monitor) – Start HUD program: “RV test HUD.exe” and press Ctrl+2 (switches to 2nd
monitor) – Start UDP logger: “WireShark1.2.8”and Begin capturing UDP data
2. Introduction a. Welcome
– Note the session start time from Laptop’s clock – Hello and welcome to the study

CHALMERS, Applied Mechanics, Master’s Thesis 2010:56 111
b. General information – To begin with I will tell you about this study and what are we going to do. – In this study we want to test the potential of an idea for future infotainment.
You will try using Remote View concept that is an add-on feature to any regular touchscreen interface. Remote View will allow you to use touchscreen while looking at the screen in front of you.
– The experiment is focused on secondary task safety, acceptance and usability of the new Remote View hardware and interaction. The study prototype you see here is just for experimental purposes and was developed as a part of a Master’s thesis project. The actual menu content, text and design of the software you will use is not important for this hardware and interaction method study.
– We will begin with training and getting familiar with the interface while the car is parked. Afterwards, when you are ready we will drive out to Hisingsleden where we will log the experimental sessions. In total you will use 3 interfaces 2 times each while driving on Hisingsleden and E6. I will explain more about driving part after the training.
– The complete experiment session will take about 2 hours.
c. The car and measures – This car is a EuroFOT car equipped with logging system that records most
car data including for example steering wheel angle, speed, GPS position and much more. As well there are 4 video cameras that record the road ahead and partially what we do inside. Eye tracker in-front of you will track the eye movement.
– This car is equipped with are all current Volvo’s active and passive safety systems for maximum comfort during the study.
– After the driving I will ask you some questions and give you a questionnaire to fill in personally.
– Surely all data will be used anonymously and mostly just for statistical analysis.
d. Possibility to quit – Be aware that you have a right to stop, interrupt and quit this experiment at
any moment. You are free to drop the tasks for any reason without explanation. Just say “I want to stop” or “jag vill avbryta” and we can return back to VCC.
e. No spreading of information before the end of study – Important note, we want you not to talk about what have you seen, done or
even what is your opinion about the prototype and study itself to people who will take part in this study afterwards. It is important that everyone has the same information before testing otherwise the results will be corrupted.
– As well the prototype you will use here has been applied for patent and is considered secret.

CHALMERS, Applied Mechanics, Master’s Thesis 2010:56 112
f. Questions – Do you have any questions before training? We will have one more briefing
before driving.
3. Stationary training a. Adjust seating position
– Before we start with HMI, you could adjust the seat and steering wheel so that you are comfortable for a longer drive… (For eye-tracker to be more reliable steering wheel should be set as low as possible and seat should preferably be set higher)
b. Touchscreen introduction – First you will try a simple touchscreen. Just follow the instructions on the
screen and later I will explain more about the hardware we have here. The purpose of using TS is to have a proper comparison for the new interfaces. (explain while participant is using TS, actively assist in learning all features)
– Explain all details about TS interface including input methods available and offer to try everything. Do not mention details about RV or TP yet.
– Check that person has read all texts and tried all features and then: Time the last run using “Training (logged)” mode.
– Now before we move on, please let’s go through touchscreen training once again only this time without interruptions, as quickly as you would during testing. You can use only touchscreen for this task.
c. Remote View accessibility and training – For every odd participant Nr. Start with RVs for every even Nr. – start with
RVd. Time the first run using “Training (logged)” mode. The first 8 participants tried input from TS but the rest should try RV together with TouchPad input only.
– Now I will launch the training in the Remote View mode. The main difference is that you will have an image from touchscreen right in front of you, above the instrument cluster. Before I explain you the details and answer all your questions, first you go trough the complete training yourself. You should attempt to be as efficient as you just did with touchscreen. Remember to try using only the remote screen.
– Write down comments and impressions for first time usage – After the logged run assist in training – explain features and help using the
first RV interface. – After the first try explain all the hardware, including the input methods
available and offer to try everything. – Now we will also try the second variant of RV interface. This one has [static
or dynamic] image in the remote screen… (Explain and help using the second RV interface).
4. Briefing before driving a. Driving introduction
– Now we move on to the driving part. I will explain about training and actual experiments as well as we have a consent form to sign before we begin driving.

CHALMERS, Applied Mechanics, Master’s Thesis 2010:56 113
– Give the consent form to the participant already now.
b. Driving details – Now we will drive out towards E6 in the Malmö direction. We are going
over the Älvsborgsbron bridge and past Frolunda torg. During experiment we will have 6 test runs – every screen together with every input device. All the testing will be n E6 so you will have enough time to practice on the way.
– I will guide you where to drive therefore you don’t have to worry about the road.
c. Possibility to choose and quit – You have the possibility to skip any of the interface that you are not
comfortable with. We already know that some of the interfaces are bad, but we still want to collect the data on exactly How bad they are so that there is a proof that these interfaces are not worth considering ever again. Of course you can still quit the complete experiment and return to VCC without any questions asked.
d. Safe driving – When you will be driving, please drive as you are used to. There will be no
traffic lights or turns and during experiment you should stay in the first lane at a comfortable distance from the vehicle ahead. You should concentrate on safe driving, spending as much time to perform tasks as you think is appropriate. In this study you represent an ordinary driver that could be willingly using infotainment system in his/her car.
– This is not a test of your abilities. We are merely collecting data on relative performance among interfaces. If something is not going right, it is very well accepted and you should continue as necessary until the 4 tasks are complete.
e. Questions – Do you have any questions before we start? This is the last briefing. After we
start driving, unless we need to, we do not have any planned breaks. – I you don’t have any questions, please sign the consent form and we can
begin training on the move when you are ready. Once again, you can quit the experiment at any moment without explanation.
– Once again check UDP logger: “WireShark1.2.8” that everything is running fine.
5. On the move a. Driving training
– Note the time it takes to make a training loop. Keep track that training is within 1 hour from the beginning of test session. Interface order in training is free.
– On the way to E6 we have the time for training. There is no specific sequence or requirements during training, but I suggest you try out

CHALMERS, Applied Mechanics, Master’s Thesis 2010:56 114
everything and concentrate on the things that are the most complicated. You should try to get confident with all interfaces.
b. The experiment – Note the experiment start time from Laptop’s clock. – Select the upcoming experiment following the Sequencing table. Always
keep the next test preselected, so that user can just click once to start when ready.
– Fill in the notes on the form. – If participant accepts, you can start interview already on the way to Volvo
after last scenario.
6. After driving a. Save the WireShark results in the raw data folder writing down TP Nr. as
filename.
b. Interview – go through all questions, write down answers. (the form is attached)
c. Questionnaire – let the participant fill in the form. (the form is attached)
d. Note the experiment end time from Laptop’s clock.
e. If you leave the car – turn off 220V power converter in the boot and shut down laptop.

CHALMERS, Applied Mechanics, Master’s Thesis 2010:56 115

CHALMERS, Applied Mechanics, Master’s Thesis 2010:56 116

CHALMERS, Applied Mechanics, Master’s Thesis 2010:56 117

CHALMERS, Applied Mechanics, Master’s Thesis 2010:56 118

CHALMERS, Applied Mechanics, Master’s Thesis 2010:56 119

CHALMERS, Applied Mechanics, Master’s Thesis 2010:56 120
Appendix 3 – Information and consent form

CHALMERS, Applied Mechanics, Master’s Thesis 2010:56 121
Appendix 4 – Comments and Notes from questionnaires
2010-06-29
1. Key information and abbreviations
RV test setup consisted of:
• 2 input devices: TouchScreen (TS) and TouchPad (TP);
• 3 output views: TouchScreen, Dynamic Remote View (RVd) and Static RV
(RVs).
The 6 resulting combinations which were tested separately were:
• RVd1 – Dynamic RV with TouchScreen input;
• RVd2 – Dynamic RV with TouchPad input;
• RVs1 – Static RV with TouchScreen input;
• RVs2 – Static RV with TouchPad input;
• TS1 – Regular TouchScreen;
• TS2 – TS used with TouchPad input.
The 2 input devices provided 5 different selection methods:
• Tapping on TouchPad;
• Buttons Next to TouchPad;
• Clickable TouchPad –button under touchpad;
• Clickable TouchScreen – button under touchscreen;
• Tapping on TouchScreen.
Number in square brackets after a note or comment indicates TestPerson
number.
Clickable TouchScreen did not work for the first 4 participants. It also never
worked in MP3 list and was unreliable when dragging Sound Settings sliders.
2. Comments & Notes during the first time usage of RV concepts
RVd1 - Couldn’t understand the idea of tracking finger on surface [2]
- Failed to get trough all task by himself [2]
+ No problems – quick, but with many tries and some difficulties [4]
- Tried using TS as it would be TP [6]
* himself started using clickable TS function, used scrolling marker in MP3 [6]
+ Got through fine, “took time to get used to” [8]
RVd2 - feels like “cone football” (wearing disorienting blinds) [10]
++ was good and even used double-tap to drag objects with TP [12, 22]
* did not use buttons, only basic tapping [14]
* did not start using TP button himself [18]
* noted rather too high TP sensitivity, would prefer slower pointer [20]
- I don’t understand why it needs to be zoomed! [22]
RVs1 * No comments [1]
-- Tried using TS as it would be TP [3, 5]
- tried TS clickability, had difficulty tapping on TS precisely, very frustrated[3]
- Feels kind of weird [5]

CHALMERS, Applied Mechanics, Master’s Thesis 2010:56 122
* Scrolled MP3 list in opposite direction even after using it correctly on TS1 [5]
- It is impossible, I have to look to TS to know (but in fact did manage) [7]
RVs2 * slow quite inaccurate mouse operation [9]
+ no problems at all, went straight through [15]
- TS is faster and easier than this [15]
* did not understand to Hold mouse down for dragging objects [17]
* figured out button usage next to TP quickly [18, 21]
- RV feels awkward, I really don’t like it, it is so frustrating [21]
Only the first 8 participants tried RVd1 or RVs1, the rest started with RVd2 or RVs2.
3. Participant comments
RVd in
general
- Too annoying, flickering, confusing, complex [1]
+ good for fine adjustments [1]
- Bad, no overview [3]
+ Quite intuitive, but takes time to learn new device [4]
- takes a lot of attention to use compared to RVs [4]
- I don’t like that, it has too many directions, too jumpy [5]
- you have to actively navigate, not so good [6]
- too demanding [7]
+ not much worse than RVs [8]
- not good, requires to know the GUI layout [9]
- very bad to get used to, difficult to use, had visibility problems [10]
- more difficult, I would need to get paid extra for using RVd [11] (participant
refused to test RVd)
+ Close second to RVs. Could be 1st choice if there are more small details in
GUI. RVd is not as enjoyable as RVs. [12]
- had hard time with it, MP3 selection in RVd mode is Bad. [13]
- needs a lot of concentration, static is more easy [14]
- is very confusing [15]
- too difficult to use [16]
- it is much more difficult to see only part of the screen [18]
+ could be useful in some cases, especially for younger generation [19]
- is very difficult, had to concentrate a lot [20]
- Hate RVd. It is extremely important to see the complete picture, even if the
picture is smaller [21]
- Not safe, takes too much attention [22]
RVs in
general
+ can focus more on the road [1]
+ nice in combination with TP [2]
+ with practice should become safer than TS [2]
* should be projected further away (less refocusing) Much better than RVd,
TP is much better than TS input for any RV mode. [3]
+ Quite intuitive, but takes time to learn new device [4]
+ Feel better, more comfortable, more safety, more control than in case of TS,
eyes on the road. RVs2 is the best [4]
+ a lot better when you drive [5]
- should be used only for certain tasks [7]
+ harder to get used to, but maybe you will appreciate it in the end [7]
+ RV screen is much better than looking down at TS [8]
+ RV is slower, but I would probably react quicker to traffic [8]
+ RV gives better view of the road, prefer RVs to RVd [9]
- Feels no difference between HUD or TS in road awareness [11]

CHALMERS, Applied Mechanics, Master’s Thesis 2010:56 123
+ Really like HUD – it is easier to do something and drive [12]
+ RV is good to have. Felt as it was easier to control car, could use peripheral
vision [12]
+ good, allows for long glances – you can use peripheral vision. It does take
longer to read text on RVs, possibly because of contrast [13]
* enjoyed RVs more than RVd, but would want it bigger. Fonts could be bigger
or image size. [13]
+ it is really great to have information on the HUD, even though it is
harder to use, it is still less distracting. safe feeling [14]
- TS1 is the only good interface to use – quick glance at TS is better than a
long one on RV display [15]
- I am disappointed in HUD – I thought it would be helpful, but when looking
at HUD I don’t see anything, I don’t see lane marking [15]
+ rather good together with TP [16]
+ the HUD screen position is better than TS position [17] (but prefers TS)
- still useful, but not sure it is worth it, could be costly [17]
+ HUD is an obvious advantage. The further the better. HUD image should be
wider, not necessarily higher. Even with not good eyesight RVs is good. [18]
+ HUD must be safer than any other. Especially liked RVs1 (but car control
was rather poor) [19]
+ very nice, felt a bit more control with RVs2 than in case of TS1, felt better
[20]
* RVs2 works, more relaxed [21]
- with HUD display I tend to feel safer than I actually are, it grabs attention
but actually isn’t so safe (was actually driving very relaxed and got 2 lane
departures during RVs2, but in TS1 and TS2 mode drove very nervously,
jerky, but within lane) [21]
+ it is very good to have, especially with proper HUD and on/off choice [22]
TS in
general
+ because of lack of experience in TS use, TS is more simple and therefore
safer [2]
+ like to see where I point [3]
* pleasant MP3 list control [4] (interface IS poorly optimized for TP)
+ very direct, straightforward [6]
+/- fast but loosing contact with the road [10]
- bad for weak or sick arms because of precise positioning required and
uncomfortable arm posture [11]
- I don't feel good touching the screen - you have fingerprints, nasty [12]
+ The only good interface to use [15]
* sweat affects friction on TS surface, that is annoying [15]
* TS was positioned in too good position – too close to driver [18]
* Long fingernails are difficult on capacitive TS, but better than on resistive.
TP is not affected, because it is under different angle. [18]
- even with good control over car you have to actively move back and forth to
glance at the road [20]
* clickable TS is very good [22]
+ TS2 feels more comfortable than RVs2, I look there then there – it does not
suck you in [22]
TP in
general
+ TP is more relaxing, comfortable than TS [1]
* button on TP is very important [1]
* buttons give reliable click response [2]
* is OK, but perhaps TP or trackball on steering wheel could be even better
than tested TP position [7]
* would be interesting to test other devices and TP on steering wheel [16]
- probably not as good as steering wheel buttons [17]

CHALMERS, Applied Mechanics, Master’s Thesis 2010:56 124
+ TP has the best potential as a future input device. It needs multitouch,
fingertip writing, scroll zone and additional optimization. [18]
* TP should be bigger and positioned better [18]
* the sensitivity (speed) of TP should be adjustable [19, 20]
+ more comfortable [21]
+ I can rest my arm, I like it [22]
+ I like that I have both so I can choose. Sometimes it is good to use TP
(even for TS2), but TS is better to have in many tasks. TS + TP is the
optimum [22]
Input
for RV
TS - TS better than TP [1]
TP - TP is much better than TS [2] Hate TS input, not safe [2]
TP - Refused to test RVs1 and RVd1 – too dangerous, bad and hopeless [3]
TP – TP better than TS [4]
TP – TS is bad for controlling RV, very tricky. TP is OK [7]
TP – Relative input is good, don’t like absolute on TS [8]
TP – would rather use TS as TP in RV modes [9]
TS – TS a bit better than TP, but not much [10]
TP – TP was quite nice – more ergonomic. TS input tired arm and was less
precise (but very good at using TS input too) [12]
TP – long-term interaction with TS is tiresome, TP is OK. Sometimes you
forget that TS is not a TP when controlling RV modes [13] (did use advanced
TS positioning in RV modes)
TP – TS is confusing, it is difficult to use TS input for RVs [14]
TP – my arm hurts from RVd1 (first exp., even when using support) [15]
TP – RVs together with TP is rather good [16]
TP – TP is much better than TS for RV control [17]
TP – absolute best input device [18]
TP – liked TS input and also TP (but bad driving with TS input) [19]
TP – incremental adjustment of pointer is important [20]
TP – really want to look at TS when trying to control RV from it! [21]
TP – RVs1 is not comfortable, bad input device choice [22]
Extra
ideas
* Maybe zoomed view (RVd) can be selectively used together with RVs [1]
- in all cases did not feel safe at all [4]
- there is no visual cue for dragged/not-dragged sound slider [7]
* Proximity sensing could be used to zoom into area where you want to
interact (zooming in fluently) to get bigger fonts/view [13]
* Using mouse pointer you can place point of interest closer together on a
map than if you use finger for pointing [18]
4. Additional Notes
Interface
safety
* Comfortable and quick with TS1 but not safe [2]
+ Noticeably safer driving in RV mode [5]
- Many lane departures while using RVs1 and RVd1 [6]
+ Successfully used RVs1 in stop&go traffic (20-60km/h) without
interrupting the task [8]
* Many people had noticeably worse car control when using TS for RV
mode input.
* Some people drove noticeably worse when using any of the RVd
modes.
* People may have different steering wheel grips while using certain
interface or simply on random that can affect steering behavior. [19]
* All people can make dangerous mistakes and drive unsafely after

CHALMERS, Applied Mechanics, Master’s Thesis 2010:56 125
getting upset for some reason. The reason can be unexpected behavior
of the interface, after repeated unsuccessful attempts to perform task,
after noticing random mistype/mistake. Such dangerous driving has
little or nothing to do with the safety of the interface.
- Drove especially bad during RVd1 and RVd2, possibly due to cognitive
demand [20]
Interface
notes
* Many times tried to use clickable TS function [2] (it didn’t work back
then – buttons were not fixed)
- MP3 list was not easy (no iPhone experience) [2]
-- Person had problems with click detection delay on TS [2, 5]
* Started using hand support under TS after short time (tired) [4]
- TP position in test setup un-ergonomic.
* If person presses finger very flat on TS (in case of long fingernails) the
selection is very imprecise.
* All participants didn’t want to memorize tasks (red reminder).
* Most participants used clickable TS when controlling RV modes, but
some also in TS1 mode. Exceptions were for example TP15.
- Most participants tried using TS as TP when looking at remote screen,
even asking for switching TS to TP like operation if possible. [3, 5, 6, 13
and more]
* Most participants no doubt liked using TS1. Questions were
focused on RV modes and their usefulness therefore there are few
positive comments for TS noted.
* Most people like to drag scrolling marker in MP3 list for long distance
scrolling on TS1. Flipping of list is best for smaller distances. (TP can
not be evaluated due to poor interaction optimization)
Software
improvement
notes
* Sound settings sliders are too small to reliably catch on TouchScreen.
Possible script error - clicking on very top/bottom of MP3 list
* In moving car it is often not very easy/reliable to press on a selected
item in a movable list (MP3) without slightly panning the list (may be
worth studying more it terms of optimizing click detection code)