Embed Size (px)
Citation preview
SERENA SOFTWARE
Serena Business Manager 11.0Performance Test Results
Author: RT Tangri2015-12-18
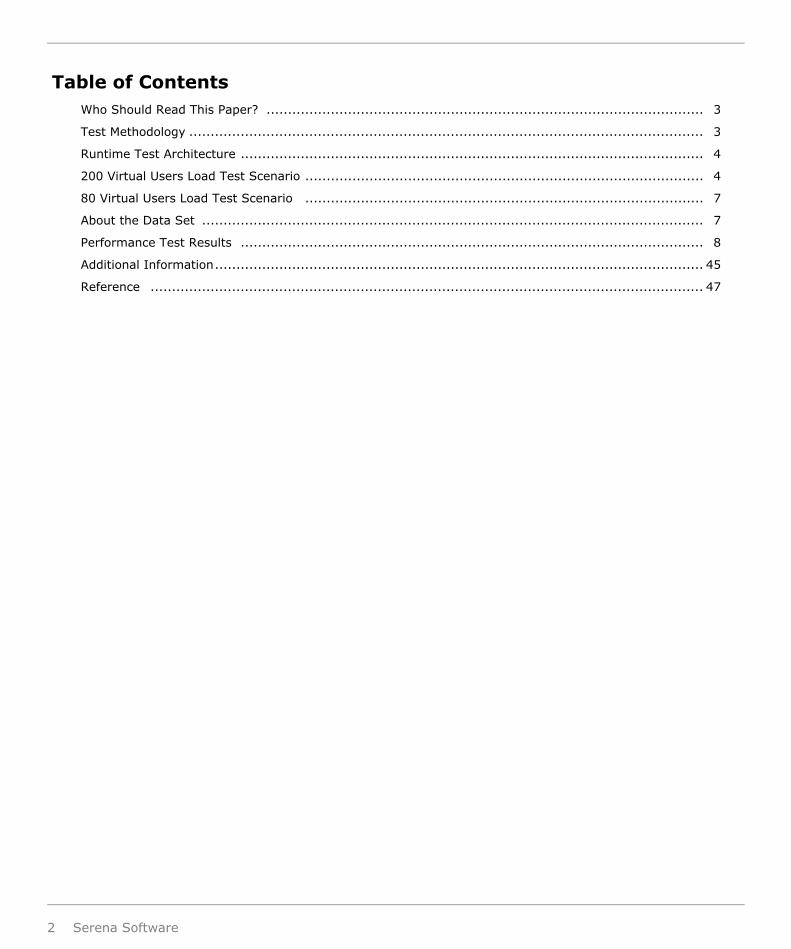
Table of ContentsWho Should Read This Paper? ...................................................................................................... 3
Test Methodology ........................................................................................................................ 3
Runtime Test Architecture ............................................................................................................ 4
200 Virtual Users Load Test Scenario ............................................................................................. 4
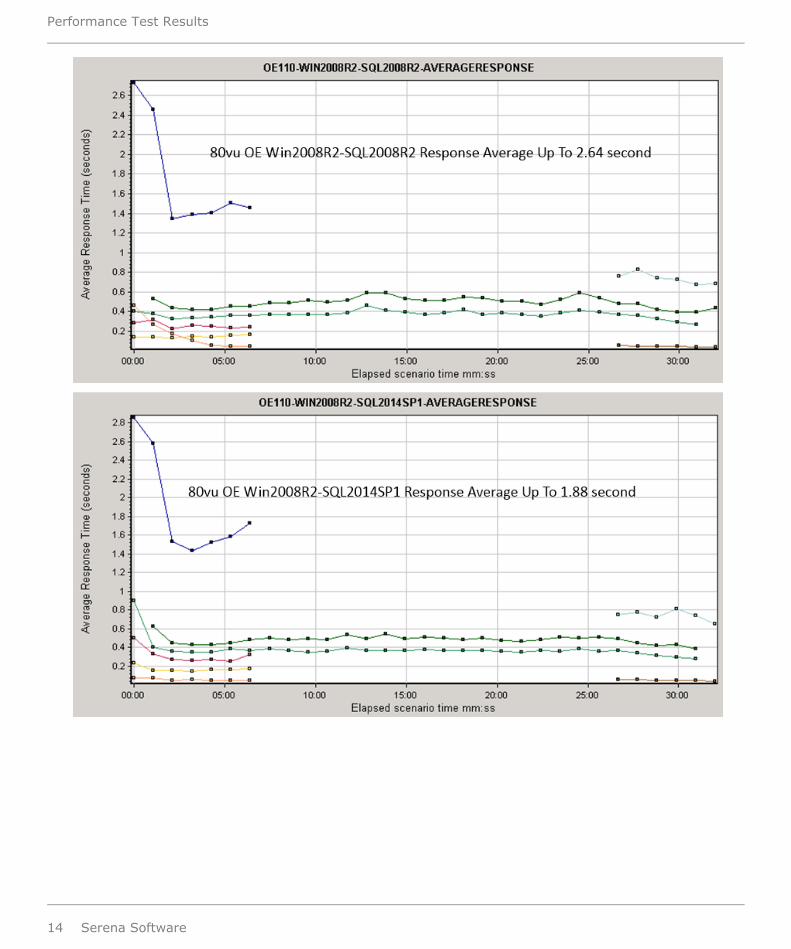
80 Virtual Users Load Test Scenario ............................................................................................. 7
About the Data Set ..................................................................................................................... 7
Performance Test Results ............................................................................................................ 8
Additional Information.................................................................................................................. 45
Reference ................................................................................................................................. 47
2 Serena Software
Who Should Read This Paper?This paper is intended for system administrators or others interested in performance test results for SerenaBusiness Manager 11.0. This paper discusses the performance tests results of 200 virtual users (scaled to 80virtual users for SBM Orchestration Engine) in the on-premise version of Serena Work Center. Theperformance tests were executed on Windows 2008 R2 and the following databases:
• SQL Server 2008 R2
• SQL Server 2014 SP1
• Oracle 11g R2
• Oracle 12c
Test MethodologyTesting was conducted in a private enterprise performance testing lab using HP's LoadRunner 12.00. Thetests measured application response time, throughput, and system resource usage under a load of 200virtual users against a large enterprise data set with a think time pause of 10 seconds between transactions.
This test involved making LoadRunner generate a load by creating virtual users (one unique virtual user wasadded every 5 seconds until the desired load level was reached) to model user activity. Each virtual userthen performed scripted tasks and sent crafted HTTP requests. LoadRunner then used a threading executionmodel to create multiple instances of unique virtual users to create load and concurrency on the SBMapplication. During this test, the 200 virtual users iterated 600 times through each use case (transaction) inthe performance suite. The scripts and the datasets used in this testing can be provided for reference uponrequest.
Serena Business Manager 11.0 Performance Test Results 3
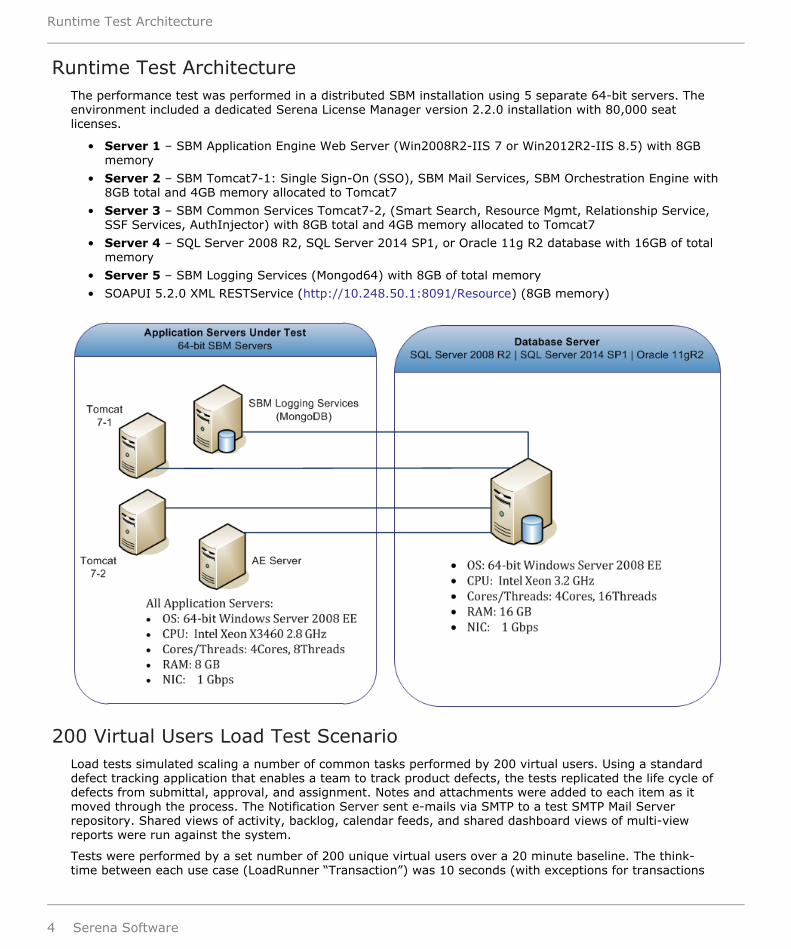
Runtime Test ArchitectureThe performance test was performed in a distributed SBM installation using 5 separate 64-bit servers. Theenvironment included a dedicated Serena License Manager version 2.2.0 installation with 80,000 seatlicenses.
• Server 1 – SBM Application Engine Web Server (Win2008R2-IIS 7 or Win2012R2-IIS 8.5) with 8GBmemory
• Server 2 – SBM Tomcat7-1: Single Sign-On (SSO), SBM Mail Services, SBM Orchestration Engine with8GB total and 4GB memory allocated to Tomcat7
• Server 3 – SBM Common Services Tomcat7-2, (Smart Search, Resource Mgmt, Relationship Service,SSF Services, AuthInjector) with 8GB total and 4GB memory allocated to Tomcat7
• Server 4 – SQL Server 2008 R2, SQL Server 2014 SP1, or Oracle 11g R2 database with 16GB of totalmemory
• Server 5 – SBM Logging Services (Mongod64) with 8GB of total memory
• SOAPUI 5.2.0 XML RESTService (http://10.248.50.1:8091/Resource) (8GB memory)
200 Virtual Users Load Test ScenarioLoad tests simulated scaling a number of common tasks performed by 200 virtual users. Using a standarddefect tracking application that enables a team to track product defects, the tests replicated the life cycle ofdefects from submittal, approval, and assignment. Notes and attachments were added to each item as itmoved through the process. The Notification Server sent e-mails via SMTP to a test SMTP Mail Serverrepository. Shared views of activity, backlog, calendar feeds, and shared dashboard views of multi-viewreports were run against the system.
Tests were performed by a set number of 200 unique virtual users over a 20 minute baseline. The think-time between each use case (LoadRunner “Transaction”) was 10 seconds (with exceptions for transactions
Runtime Test Architecture
4 Serena Software
from Serena Work Center: 60 second think-time before indexer transactions; 90 second think-time beforenotification transactions). The performance workflow consisted of the following actions:
• LoadRunner virtual users ran in multiple threads of execution
• 200 unique virtual users logged in via SSO to Serena Work Center in vuser_init
• Repeated iterate (defect tracking application) use cases
• 200 unique virtual users logged off via SSO from Serena Work Center in vuser_end
SERENA WORK CENTER (SBM APPLICATION ENGINE) USE CASES
Serena Work Center use cases run during virtual user initialization against a large enterprise data set:
• Web SSO Login
• VUser Init Notification Remove All
• Settings Save Preferred Project
• Settings Save Items Per Page 40 And Notification Poll Interval 90 Second
• SWC Home Add Report Widget (Of Multi View Report #1)
• SWC Home Add Activity Widget (My Activity)
Serena Work Center use cases run during virtual user exit against a large enterprise data set:
• SWC Home Delete Report Widget (Of Multi View Report #1)
• SWC Home Delete Activity Widget (My Activity)
• VUser End Notification Remove All
• Web SSO Logout
Serena Work Center use cases iterated by each virtual user against a large enterprise data set:
• Submit-Form
• Submit-Form OK (Submit Item)
• Transition Owner In
• Defect Tracking Activities Tab
• Defect Tracking My Activity After Owner IN
• Defect Tracking Shared Activity Feed View After Owner IN
• Defect Tracking Calendars Tab
• Defect Tracking My Calendar
• Defect Tracking Shared Calendar Feed View After Owner IN
• Transition Owner Out
• Transition Owner Out Ok
• Transition Secondary Owner In
• My Activity After Secondary Owner In
• Shared Activity View All Items I Own Primary and Secondary
• Transition Secondary Owner Out
• Transition Secondary Owner Out Ok
• Transition REST GRID WIDGET (REST Grid Widget is inserted as a Regular Transition in AE Form)
• Transition REST GRID WIDGET OK (calls XML REST Mock Service to exercise AuthInjector componentvia SBMProxy in CommonServices Tomcat7)
• Transition-SyncTest (makes Synchronous AE-WebServices call)
• AddNote
• Add Attachment In Note (27KB JPEG File From Disk)
• AddNote-Ok (Text with HTML5 Tags Includes 27KB JPG + 2KB Note)
Serena Work Center (SBM Application Engine) Use Cases
Serena Business Manager 11.0 Performance Test Results 5
• AddAttachment
• AddAttachment-OK (11KB TXT File From Disk)
• Email_Link
• Email_Link SearchUser
• Email_Link-OK (Message with HTML5 Tags)
• Transition Assign To CCB
• Transition Assign To CCB OK
• Transition Assign To Area Owner
• Transition Assign To Area Owner OK
• Social View Of BUG
• BUGID Lucene Text Search
• BUGStar Lucene Text Search
• BUGIDStar Lucene Text Search
• Attachment Lucene Text Search
• TitleDescription Lucene Text Search
• TitleDescriptionStar Lucene Text Search
• Submitter Lucene Text Search
• User Profile Card
• ContactCard AD Client Logging
• Add then Delete From Favorites
• PinUp Defect Tracking (Application)
• Select Defect Tracking PinUp
• Defect Tracking Manage Views
• Defect Tracking My Dashboard
• Defect Tracking Shared Dashboard View (Of Multi View Report #1)
• Defect Tracking Backlogs Tab
• Defect Tracking Shared Backlog Feed View
• Report Center
• CTOSDS Elapsed Time Duration
• CTOSDS Time in State Duration
• CTOSDS Average Time To State Duration
• CTOSDS Open And Completed Trend
• CTOSDS Entering A State Trend
• CTOSDS State Activity Trend
• Multi-View Report 1
• Static Listing For Performance EG
• Static Listing For Multi-View Performance
• All Issues By Project and State
• All Issues by Issue Type
• Listing Report
• All Open Issues
• My Open Issues
• All Issues by Project and Issue Type
• All Issues by State
• All Issues by Owner
• Notification UI View All
200 Virtual Users Load Test Scenario
6 Serena Software
• Notification UI MarkRead and Remove N (For Each Notification Object)
• Each Iteration Notification Remove All
80 Virtual Users Load Test ScenarioThe SBM Orchestration Engine load test simulated a repeated, scaling number of asynchronous orchestrationevents initiated by virtual users as they submitted items into a complex LoadOE application.
During Submit Item, the orchestration was initiated as a transition that repeatedly updated items withorchestration results by the making following AE Web Service calls:
• AEWebServices71.GetItemsByQuery
• AEWebServices71.UpdateItem
• AEWebServices71.UpdateItemWithName
Tests were performed by a set number of unique virtual users over a 20 minute baseline. The think-timebetween virtual user clicks was 10 seconds.
To test scalability, a set of up to 80 unique virtual users logged in to the SBM User Workspace, submitted anitem into the system to initiate the orchestrations, and then logged out of the system.
The performance workflow consisted of the following actions:
• LoadRunner virtual users ran in multiple threads of execution
• 80 unique virtual users logged in via SSO to Serena Work Center in vuser_init
• Repeated iterate use cases (each is a LoadRunner "Transaction")
• 80 unique virtual users logged off via SSO from Serena Work Center in vuser_end
SERENA WORK CENTER (SBM APPLICATION ENGINE, ORCHESTRATION ENGINE) USE CASES
Serena Work Center use cases run during virtual user initialization against a large enterprise data set:
• Web SSO Login
• VUser Init Notification Remove All
• Select LoadOE App
• PinUp LoadOE App
Serena Work Center use cases run during virtual user exit against a large enterprise data set:
• VUser End Notification Remove All
• Web SSO Logout
Serena Work Center use cases iterated by each virtual user against a large enterprise data set:
• LoadOE Submit Form
• LoadOE Complex Submit OK (Initiates Asynchronous Orchestrations as Transition to Submit Form)
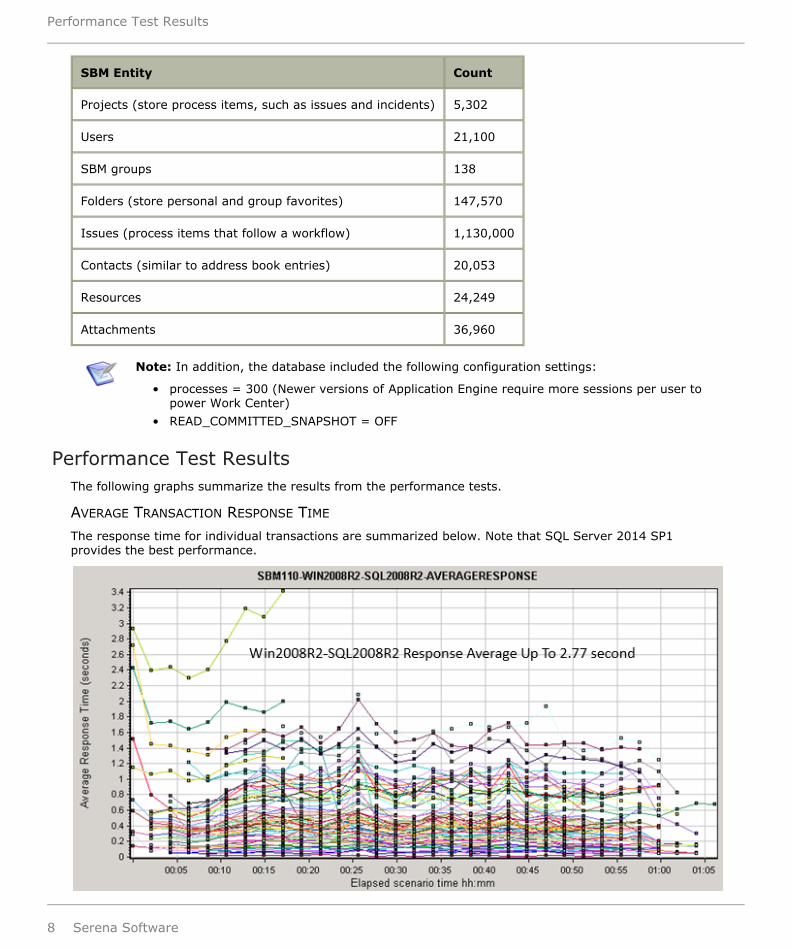
About the Data SetThe large enterprise data set that was used for testing is summarized below.
SBM Entity Count
Workflows (define the process that items follow) 31
Serena Work Center (SBM Application Engine, Orchestration Engine) Use Cases
Serena Business Manager 11.0 Performance Test Results 7
SBM Entity Count
Projects (store process items, such as issues and incidents) 5,302
Users 21,100
SBM groups 138
Folders (store personal and group favorites) 147,570
Issues (process items that follow a workflow) 1,130,000
Contacts (similar to address book entries) 20,053
Resources 24,249
Attachments 36,960
Note: In addition, the database included the following configuration settings:
• processes = 300 (Newer versions of Application Engine require more sessions per user topower Work Center)
• READ_COMMITTED_SNAPSHOT = OFF
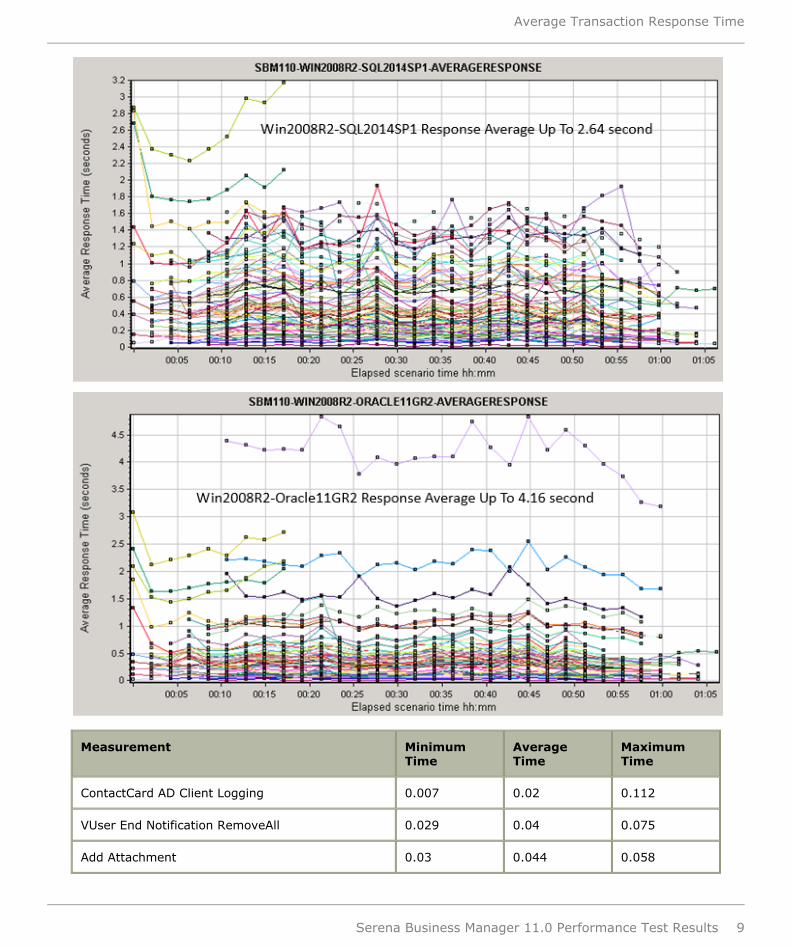
Performance Test ResultsThe following graphs summarize the results from the performance tests.
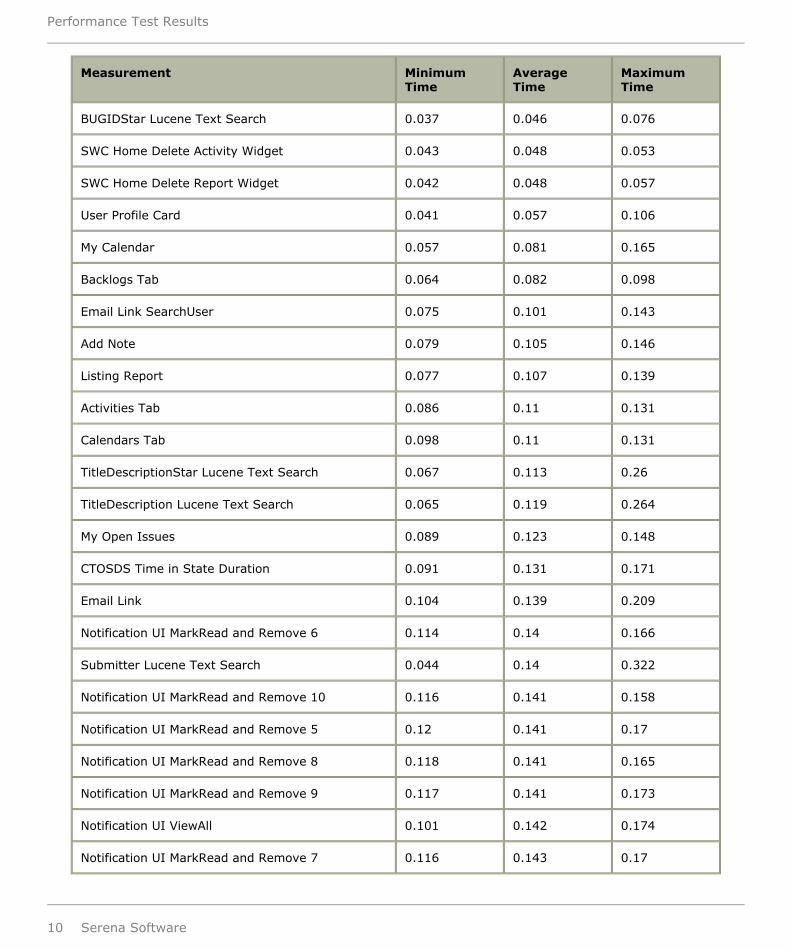
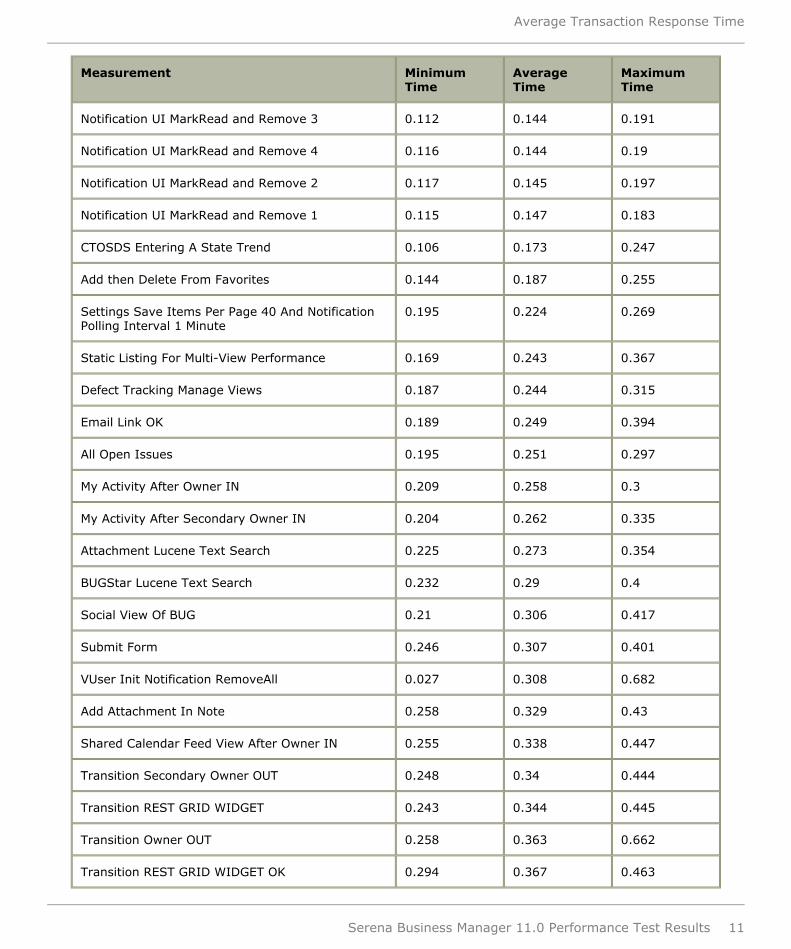
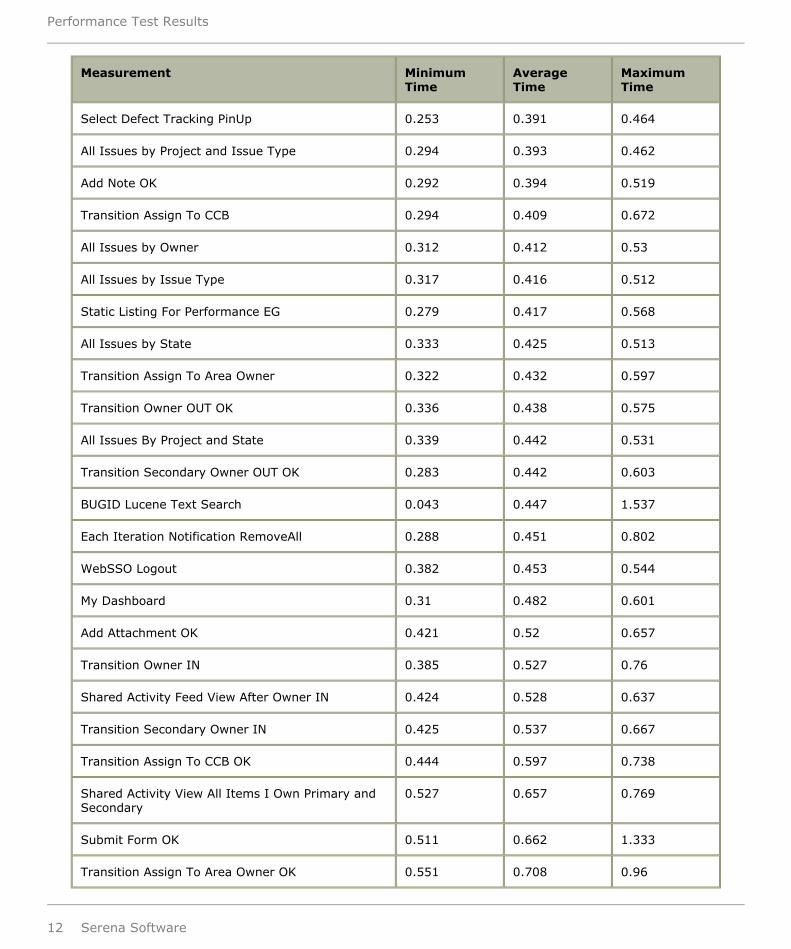
AVERAGE TRANSACTION RESPONSE TIME
The response time for individual transactions are summarized below. Note that SQL Server 2014 SP1provides the best performance.
Performance Test Results
8 Serena Software
Measurement MinimumTime
AverageTime
MaximumTime
ContactCard AD Client Logging 0.007 0.02 0.112
VUser End Notification RemoveAll 0.029 0.04 0.075
Add Attachment 0.03 0.044 0.058
Average Transaction Response Time
Serena Business Manager 11.0 Performance Test Results 9
Measurement MinimumTime
AverageTime
MaximumTime
BUGIDStar Lucene Text Search 0.037 0.046 0.076
SWC Home Delete Activity Widget 0.043 0.048 0.053
SWC Home Delete Report Widget 0.042 0.048 0.057
User Profile Card 0.041 0.057 0.106
My Calendar 0.057 0.081 0.165
Backlogs Tab 0.064 0.082 0.098
Email Link SearchUser 0.075 0.101 0.143
Add Note 0.079 0.105 0.146
Listing Report 0.077 0.107 0.139
Activities Tab 0.086 0.11 0.131
Calendars Tab 0.098 0.11 0.131
TitleDescriptionStar Lucene Text Search 0.067 0.113 0.26
TitleDescription Lucene Text Search 0.065 0.119 0.264
My Open Issues 0.089 0.123 0.148
CTOSDS Time in State Duration 0.091 0.131 0.171
Email Link 0.104 0.139 0.209
Notification UI MarkRead and Remove 6 0.114 0.14 0.166
Submitter Lucene Text Search 0.044 0.14 0.322
Notification UI MarkRead and Remove 10 0.116 0.141 0.158
Notification UI MarkRead and Remove 5 0.12 0.141 0.17
Notification UI MarkRead and Remove 8 0.118 0.141 0.165
Notification UI MarkRead and Remove 9 0.117 0.141 0.173
Notification UI ViewAll 0.101 0.142 0.174
Notification UI MarkRead and Remove 7 0.116 0.143 0.17
Performance Test Results
10 Serena Software
Measurement MinimumTime
AverageTime
MaximumTime
Notification UI MarkRead and Remove 3 0.112 0.144 0.191
Notification UI MarkRead and Remove 4 0.116 0.144 0.19
Notification UI MarkRead and Remove 2 0.117 0.145 0.197
Notification UI MarkRead and Remove 1 0.115 0.147 0.183
CTOSDS Entering A State Trend 0.106 0.173 0.247
Add then Delete From Favorites 0.144 0.187 0.255
Settings Save Items Per Page 40 And NotificationPolling Interval 1 Minute
0.195 0.224 0.269
Static Listing For Multi-View Performance 0.169 0.243 0.367
Defect Tracking Manage Views 0.187 0.244 0.315
Email Link OK 0.189 0.249 0.394
All Open Issues 0.195 0.251 0.297
My Activity After Owner IN 0.209 0.258 0.3
My Activity After Secondary Owner IN 0.204 0.262 0.335
Attachment Lucene Text Search 0.225 0.273 0.354
BUGStar Lucene Text Search 0.232 0.29 0.4
Social View Of BUG 0.21 0.306 0.417
Submit Form 0.246 0.307 0.401
VUser Init Notification RemoveAll 0.027 0.308 0.682
Add Attachment In Note 0.258 0.329 0.43
Shared Calendar Feed View After Owner IN 0.255 0.338 0.447
Transition Secondary Owner OUT 0.248 0.34 0.444
Transition REST GRID WIDGET 0.243 0.344 0.445
Transition Owner OUT 0.258 0.363 0.662
Transition REST GRID WIDGET OK 0.294 0.367 0.463
Average Transaction Response Time
Serena Business Manager 11.0 Performance Test Results 11
Measurement MinimumTime
AverageTime
MaximumTime
Select Defect Tracking PinUp 0.253 0.391 0.464
All Issues by Project and Issue Type 0.294 0.393 0.462
Add Note OK 0.292 0.394 0.519
Transition Assign To CCB 0.294 0.409 0.672
All Issues by Owner 0.312 0.412 0.53
All Issues by Issue Type 0.317 0.416 0.512
Static Listing For Performance EG 0.279 0.417 0.568
All Issues by State 0.333 0.425 0.513
Transition Assign To Area Owner 0.322 0.432 0.597
Transition Owner OUT OK 0.336 0.438 0.575
All Issues By Project and State 0.339 0.442 0.531
Transition Secondary Owner OUT OK 0.283 0.442 0.603
BUGID Lucene Text Search 0.043 0.447 1.537
Each Iteration Notification RemoveAll 0.288 0.451 0.802
WebSSO Logout 0.382 0.453 0.544
My Dashboard 0.31 0.482 0.601
Add Attachment OK 0.421 0.52 0.657
Transition Owner IN 0.385 0.527 0.76
Shared Activity Feed View After Owner IN 0.424 0.528 0.637
Transition Secondary Owner IN 0.425 0.537 0.667
Transition Assign To CCB OK 0.444 0.597 0.738
Shared Activity View All Items I Own Primary andSecondary
0.527 0.657 0.769
Submit Form OK 0.511 0.662 1.333
Transition Assign To Area Owner OK 0.551 0.708 0.96
Performance Test Results
12 Serena Software
Measurement MinimumTime
AverageTime
MaximumTime
Report Center 0.55 0.796 1.008
Transition SyncTest 0.643 0.826 1.175
CTOSDS Elapsed Time Duration 0.796 1.005 1.225
CTOSDS State Activity Trend 0.805 1.043 1.217
Multi-View Report 1 0.815 1.05 1.233
Shared Dashboard View 0.856 1.065 1.251
WebSSO Login 0.982 1.194 1.849
PinUp Defect Tracking 0.844 1.215 1.489
Shared Backlog Feed View 1.16 1.551 2.071
SWC Home Add Report Widget 1.443 1.775 2.179
Settings Save Preferred Project 1.627 1.848 2.414
CTOSDS Average Time To State Duration 1.674 2.12 2.543
SWC Home Add Activity Widget 2.114 2.478 3.082
CTOSDS Open And Completed Trend 3.19 4.163 4.827
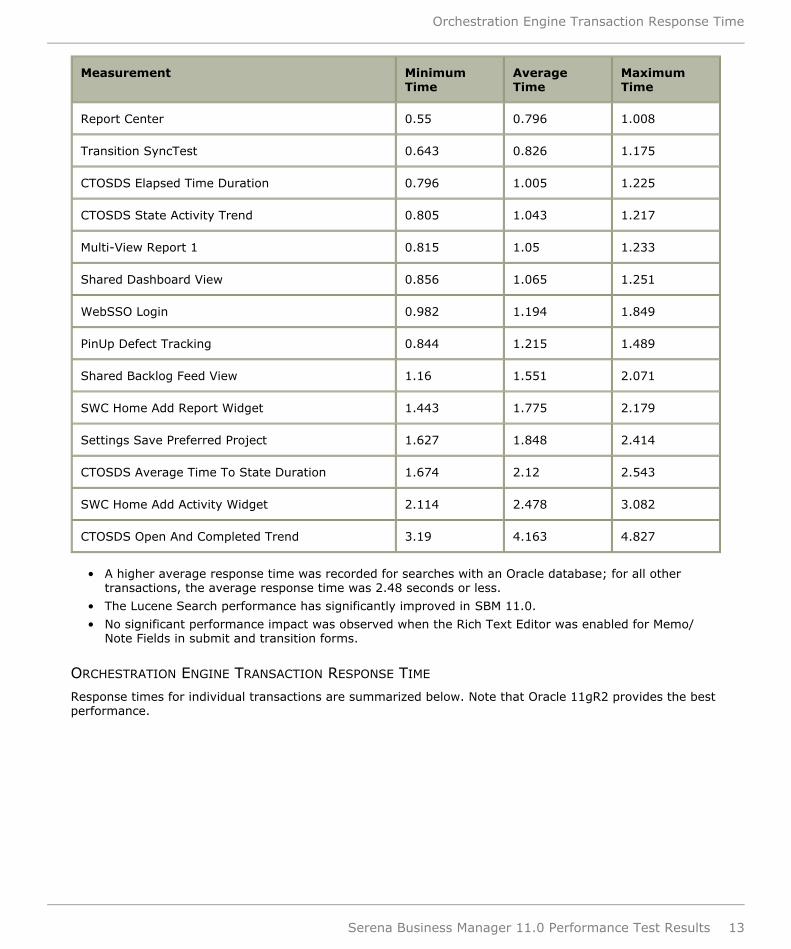
• A higher average response time was recorded for searches with an Oracle database; for all othertransactions, the average response time was 2.48 seconds or less.
• The Lucene Search performance has significantly improved in SBM 11.0.
• No significant performance impact was observed when the Rich Text Editor was enabled for Memo/Note Fields in submit and transition forms.
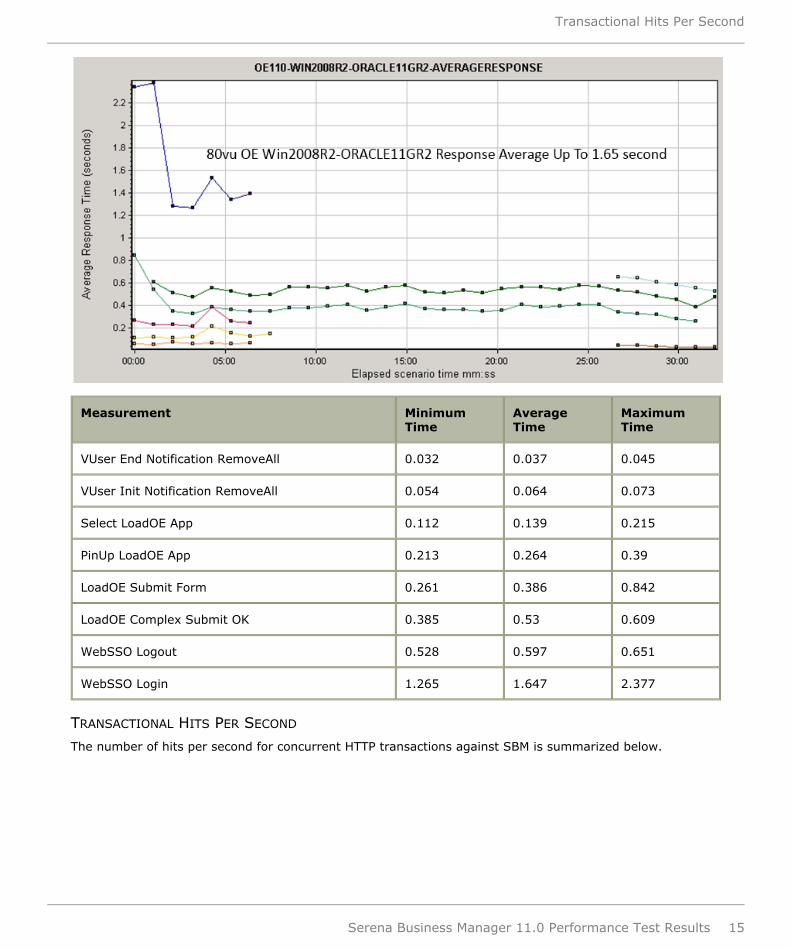
ORCHESTRATION ENGINE TRANSACTION RESPONSE TIME
Response times for individual transactions are summarized below. Note that Oracle 11gR2 provides the bestperformance.
Orchestration Engine Transaction Response Time
Serena Business Manager 11.0 Performance Test Results 13
Performance Test Results
14 Serena Software
Measurement MinimumTime
AverageTime
MaximumTime
VUser End Notification RemoveAll 0.032 0.037 0.045
VUser Init Notification RemoveAll 0.054 0.064 0.073
Select LoadOE App 0.112 0.139 0.215
PinUp LoadOE App 0.213 0.264 0.39
LoadOE Submit Form 0.261 0.386 0.842
LoadOE Complex Submit OK 0.385 0.53 0.609
WebSSO Logout 0.528 0.597 0.651
WebSSO Login 1.265 1.647 2.377
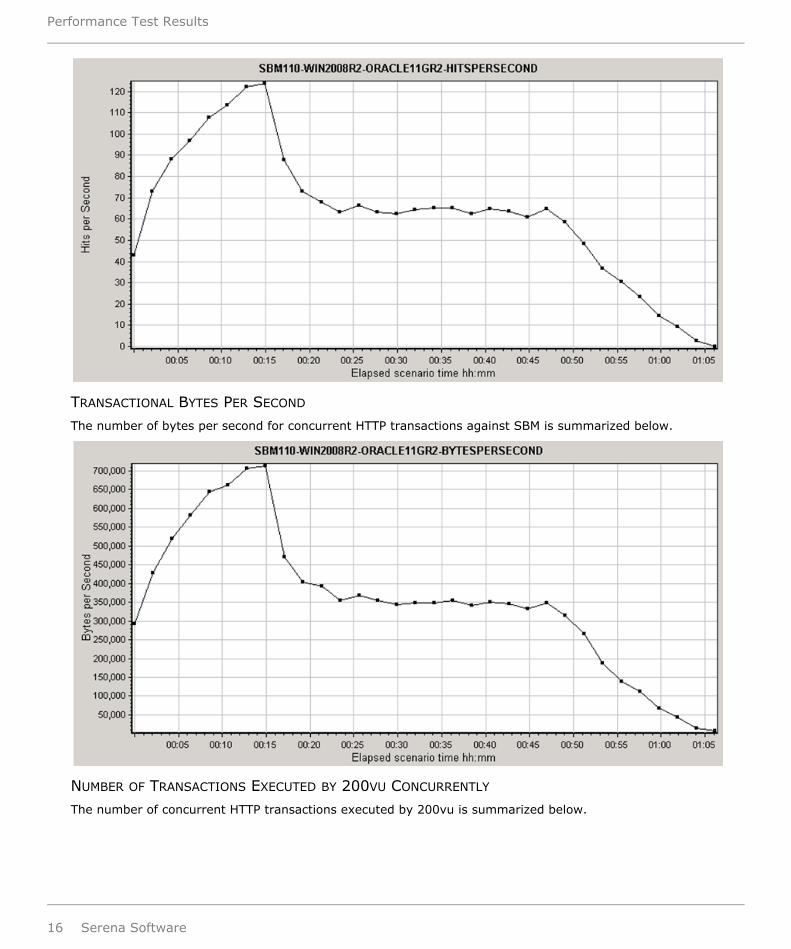
TRANSACTIONAL HITS PER SECOND
The number of hits per second for concurrent HTTP transactions against SBM is summarized below.
Transactional Hits Per Second
Serena Business Manager 11.0 Performance Test Results 15
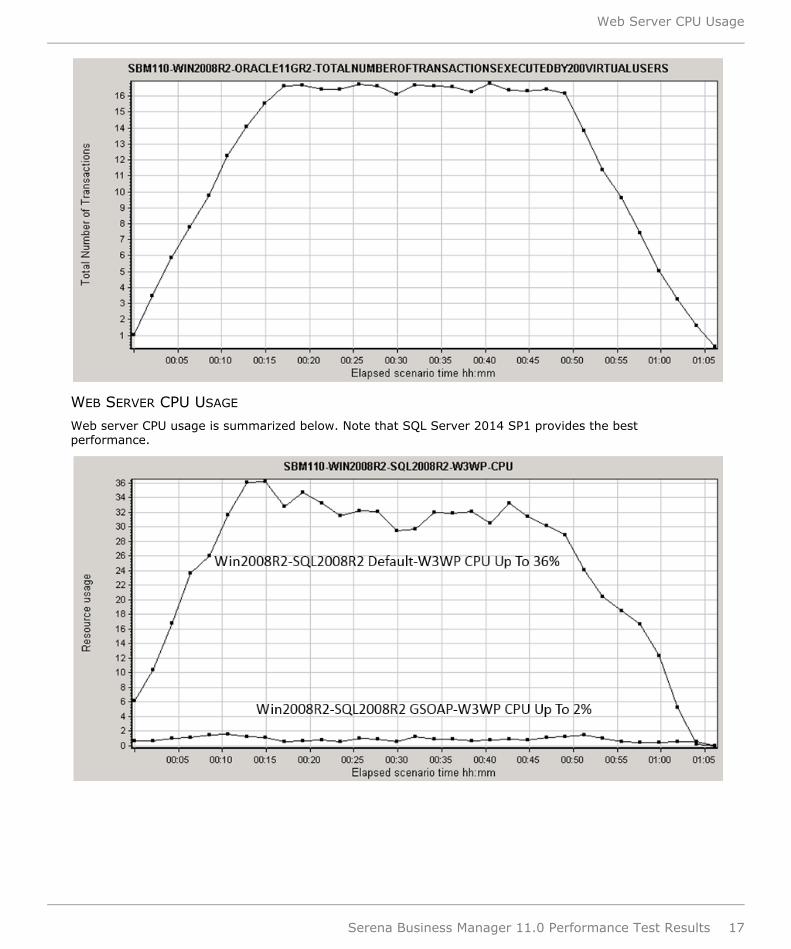
TRANSACTIONAL BYTES PER SECOND
The number of bytes per second for concurrent HTTP transactions against SBM is summarized below.
NUMBER OF TRANSACTIONS EXECUTED BY 200VU CONCURRENTLY
The number of concurrent HTTP transactions executed by 200vu is summarized below.
Performance Test Results
16 Serena Software
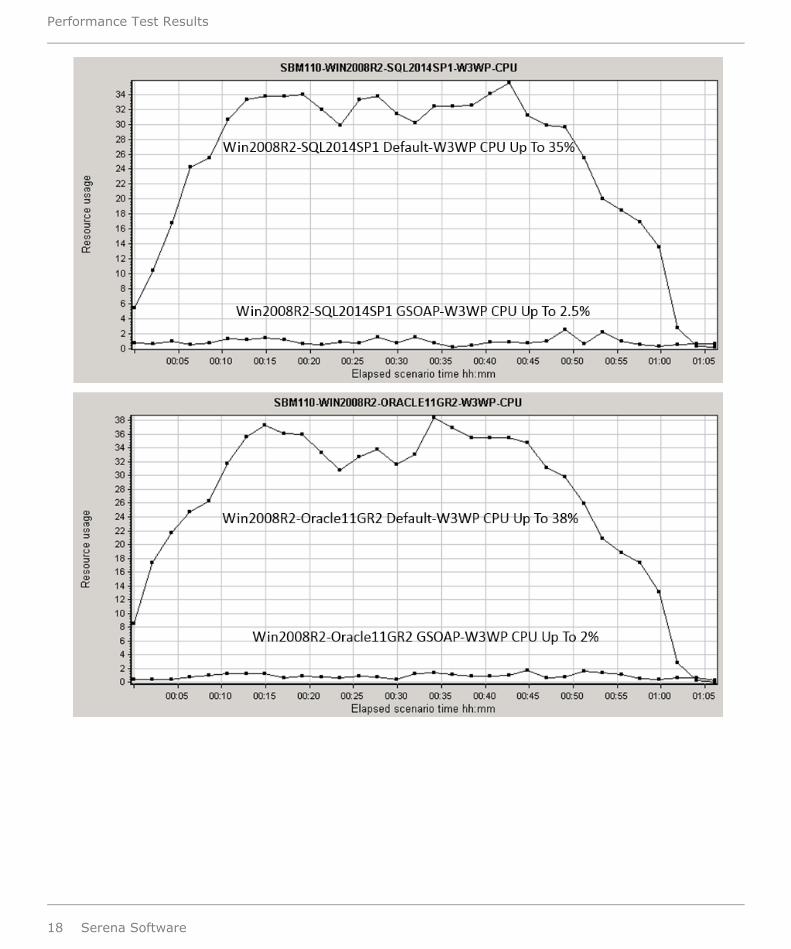
WEB SERVER CPU USAGE
Web server CPU usage is summarized below. Note that SQL Server 2014 SP1 provides the bestperformance.
Web Server CPU Usage
Serena Business Manager 11.0 Performance Test Results 17
Performance Test Results
18 Serena Software
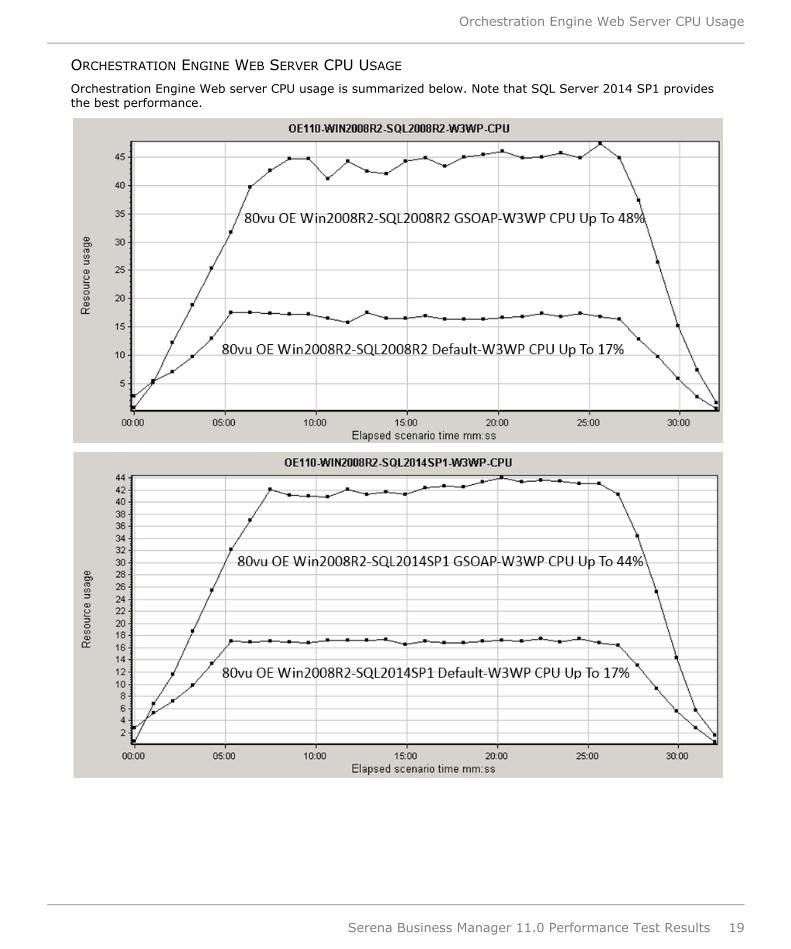
ORCHESTRATION ENGINE WEB SERVER CPU USAGE
Orchestration Engine Web server CPU usage is summarized below. Note that SQL Server 2014 SP1 providesthe best performance.
Orchestration Engine Web Server CPU Usage
Serena Business Manager 11.0 Performance Test Results 19
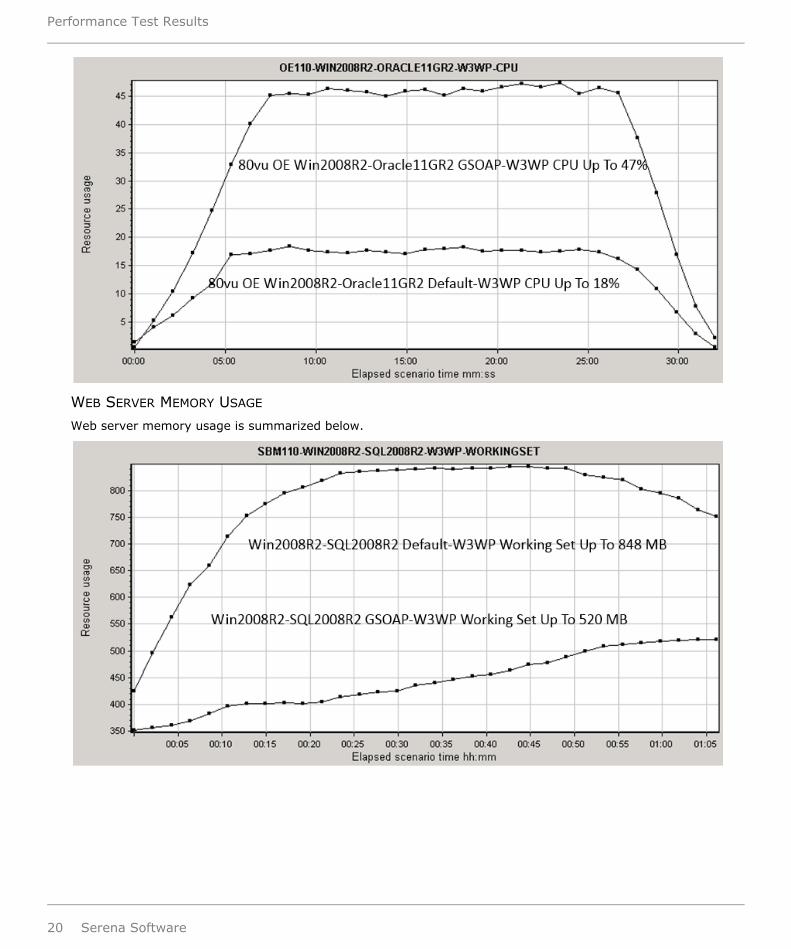
WEB SERVER MEMORY USAGE
Web server memory usage is summarized below.
Performance Test Results
20 Serena Software
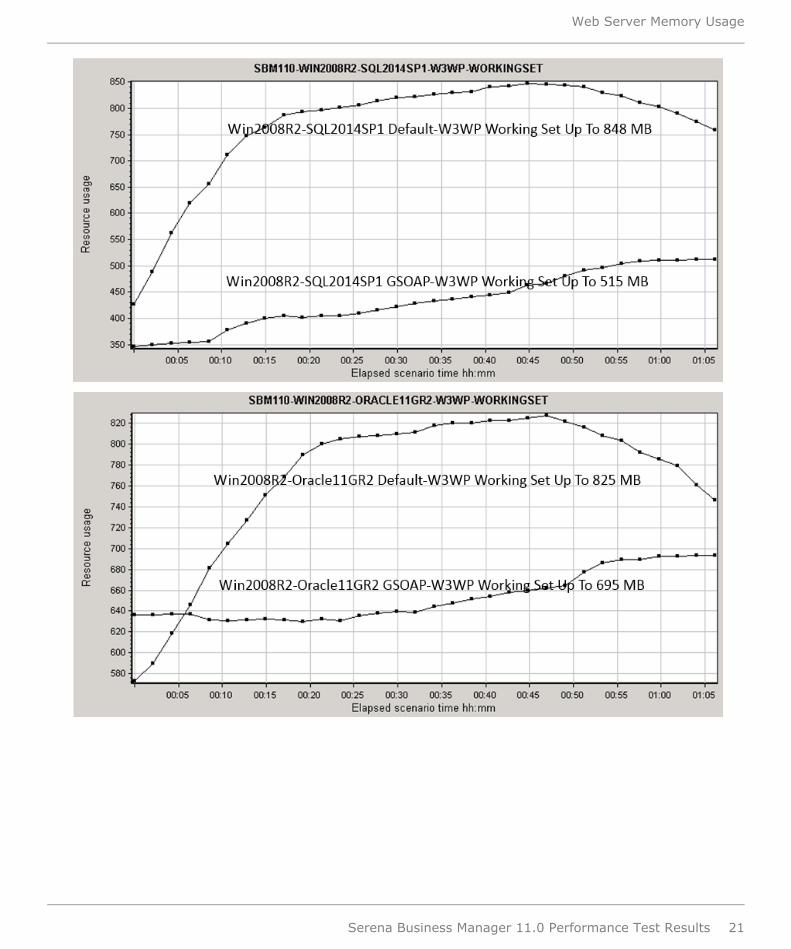
Web Server Memory Usage
Serena Business Manager 11.0 Performance Test Results 21
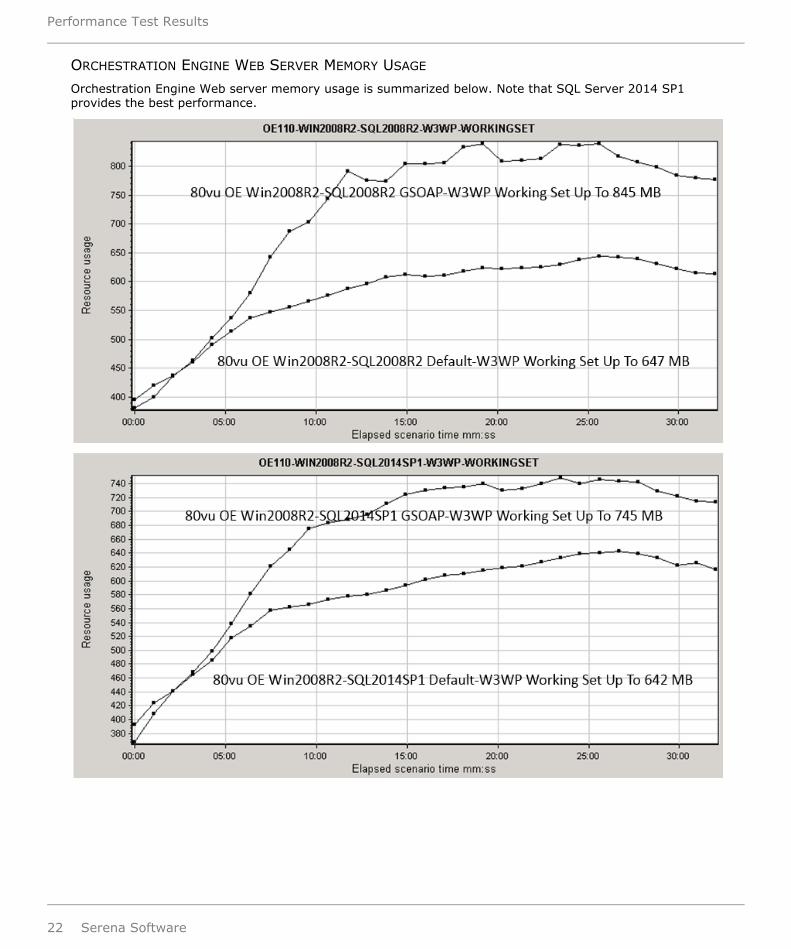
ORCHESTRATION ENGINE WEB SERVER MEMORY USAGE
Orchestration Engine Web server memory usage is summarized below. Note that SQL Server 2014 SP1provides the best performance.
Performance Test Results
22 Serena Software
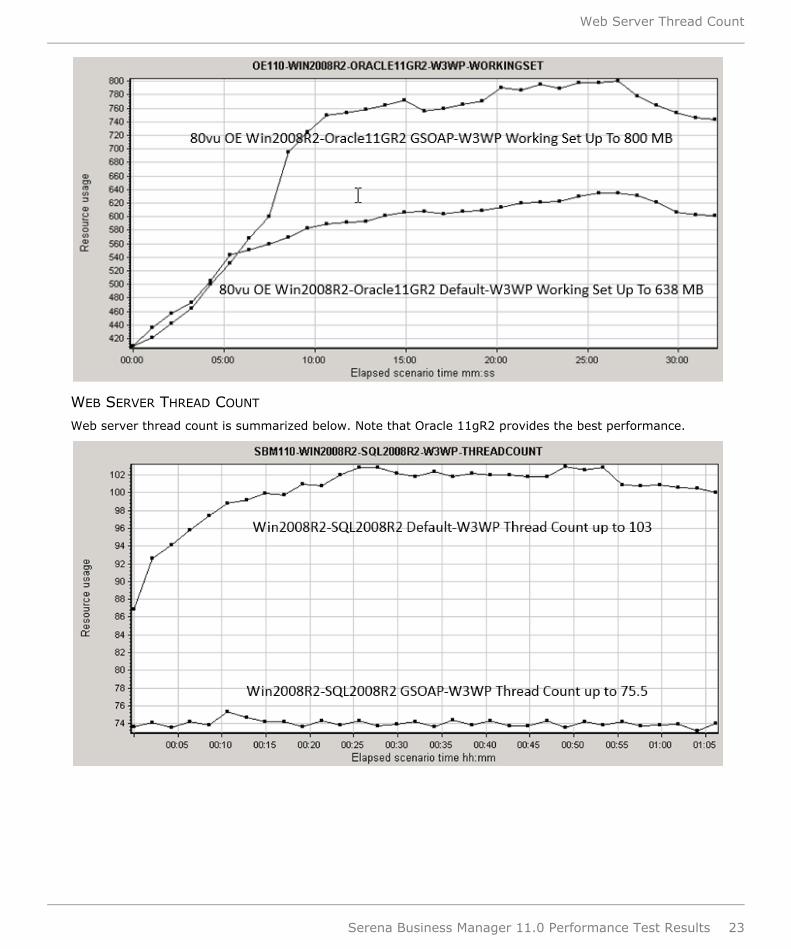
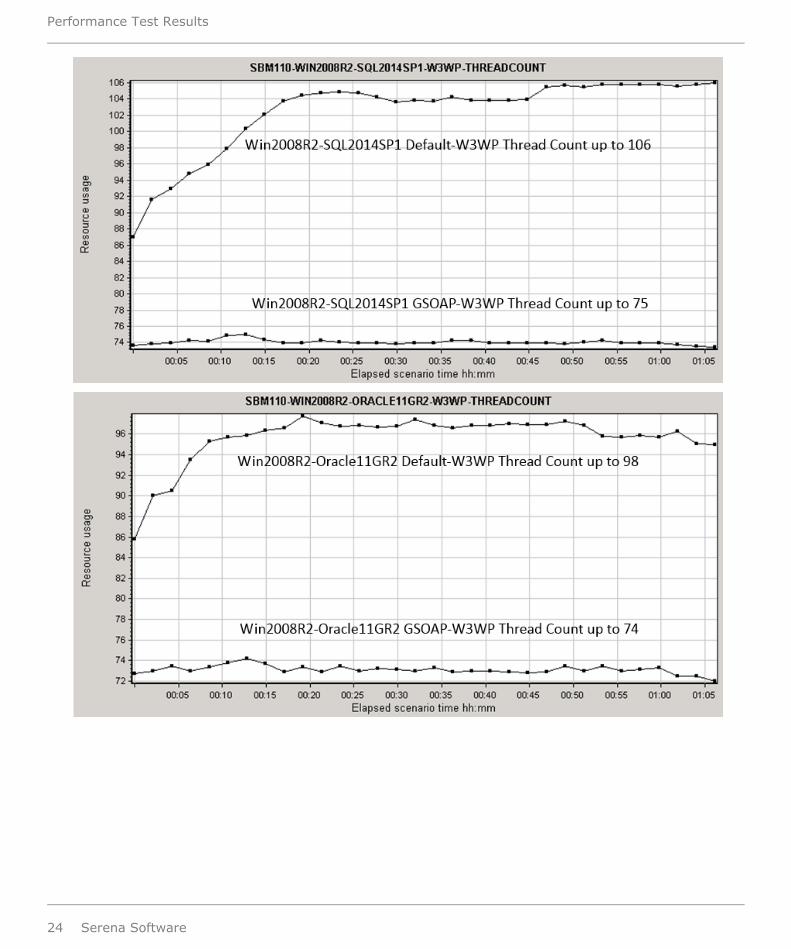
WEB SERVER THREAD COUNT
Web server thread count is summarized below. Note that Oracle 11gR2 provides the best performance.
Web Server Thread Count
Serena Business Manager 11.0 Performance Test Results 23
Performance Test Results
24 Serena Software
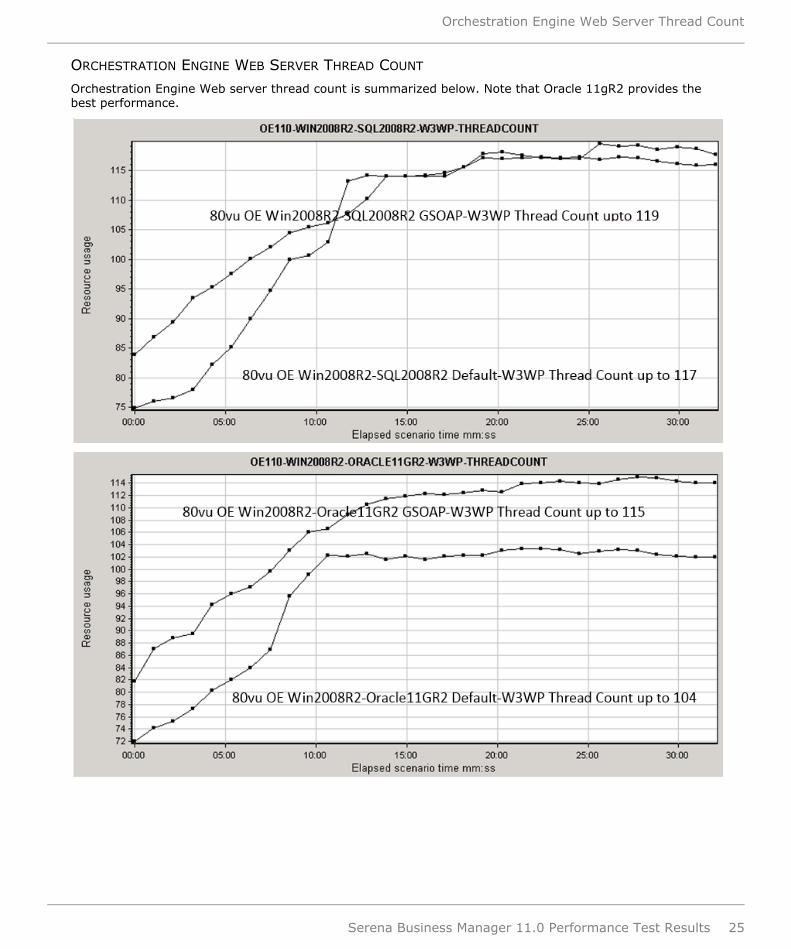
ORCHESTRATION ENGINE WEB SERVER THREAD COUNT
Orchestration Engine Web server thread count is summarized below. Note that Oracle 11gR2 provides thebest performance.
Orchestration Engine Web Server Thread Count
Serena Business Manager 11.0 Performance Test Results 25
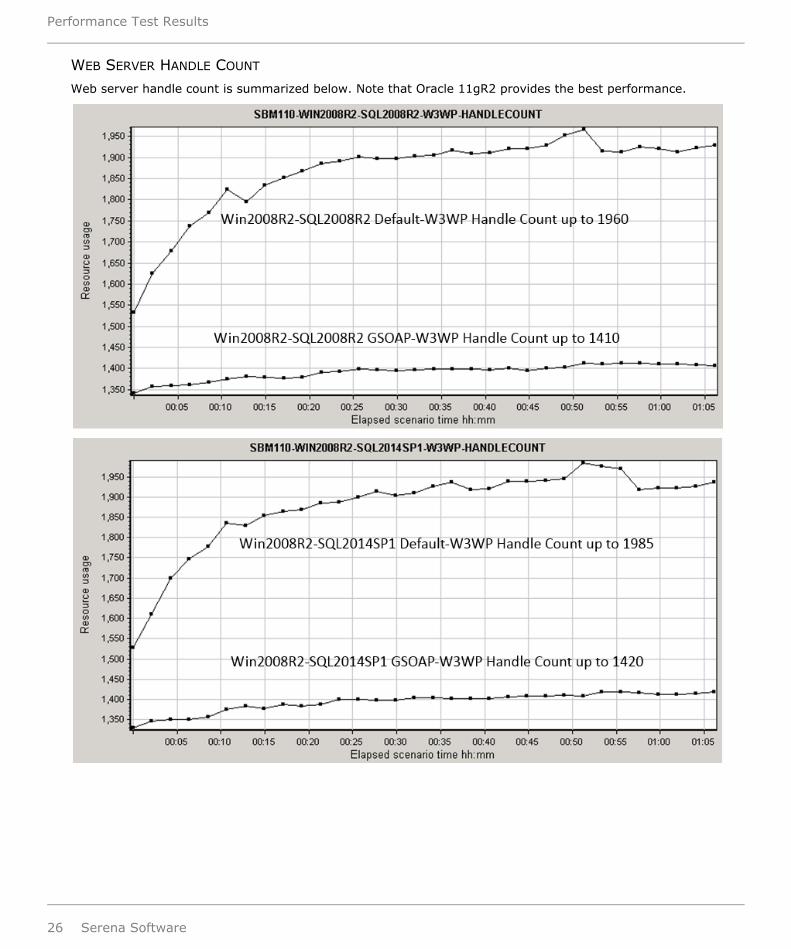
WEB SERVER HANDLE COUNT
Web server handle count is summarized below. Note that Oracle 11gR2 provides the best performance.
Performance Test Results
26 Serena Software
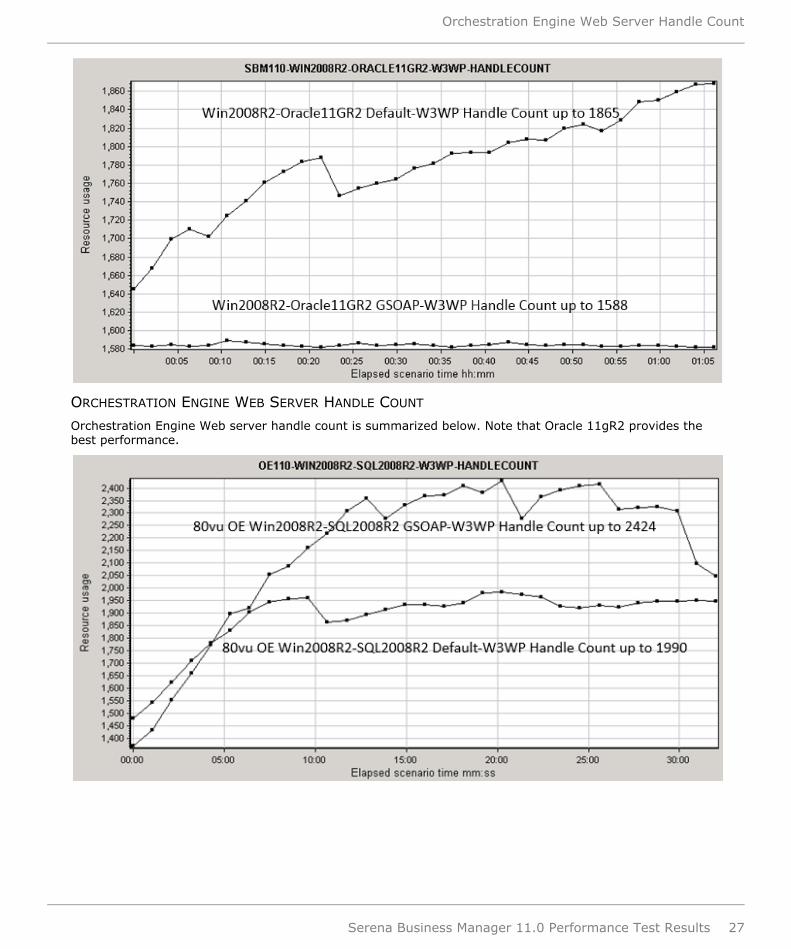
ORCHESTRATION ENGINE WEB SERVER HANDLE COUNT
Orchestration Engine Web server handle count is summarized below. Note that Oracle 11gR2 provides thebest performance.
Orchestration Engine Web Server Handle Count
Serena Business Manager 11.0 Performance Test Results 27
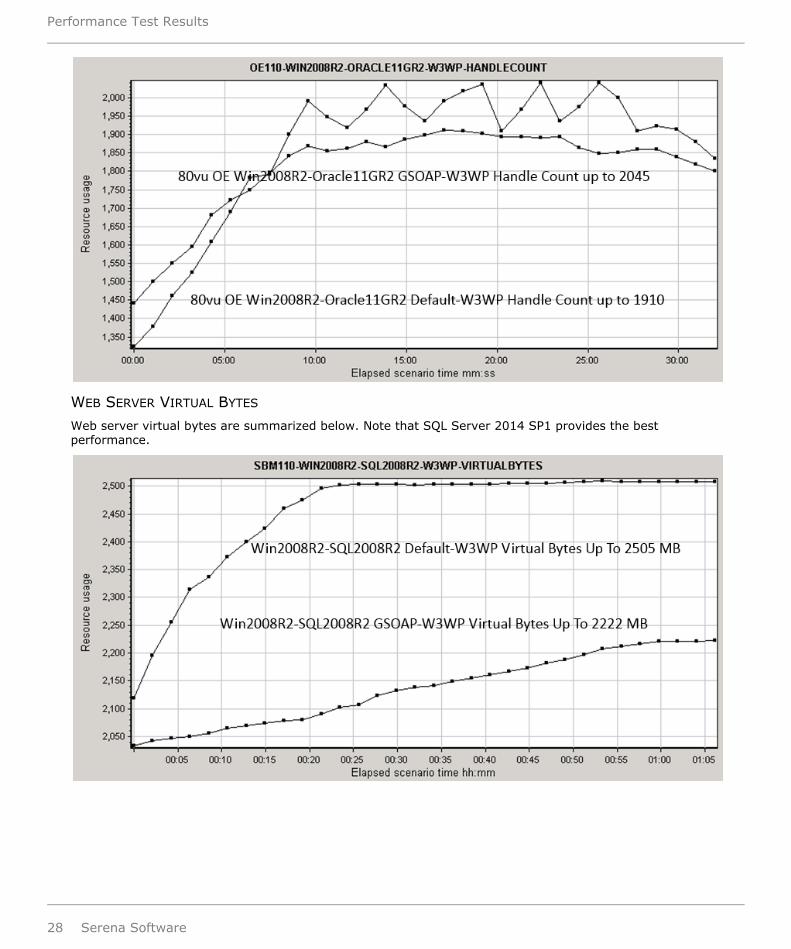
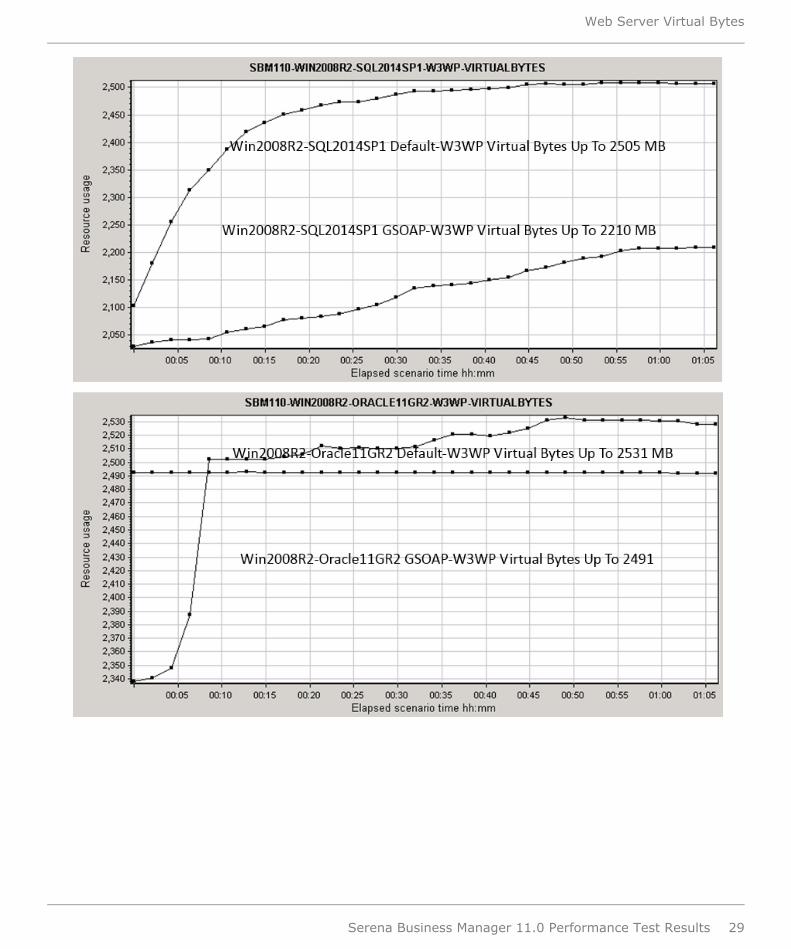
WEB SERVER VIRTUAL BYTES
Web server virtual bytes are summarized below. Note that SQL Server 2014 SP1 provides the bestperformance.
Performance Test Results
28 Serena Software
Web Server Virtual Bytes
Serena Business Manager 11.0 Performance Test Results 29
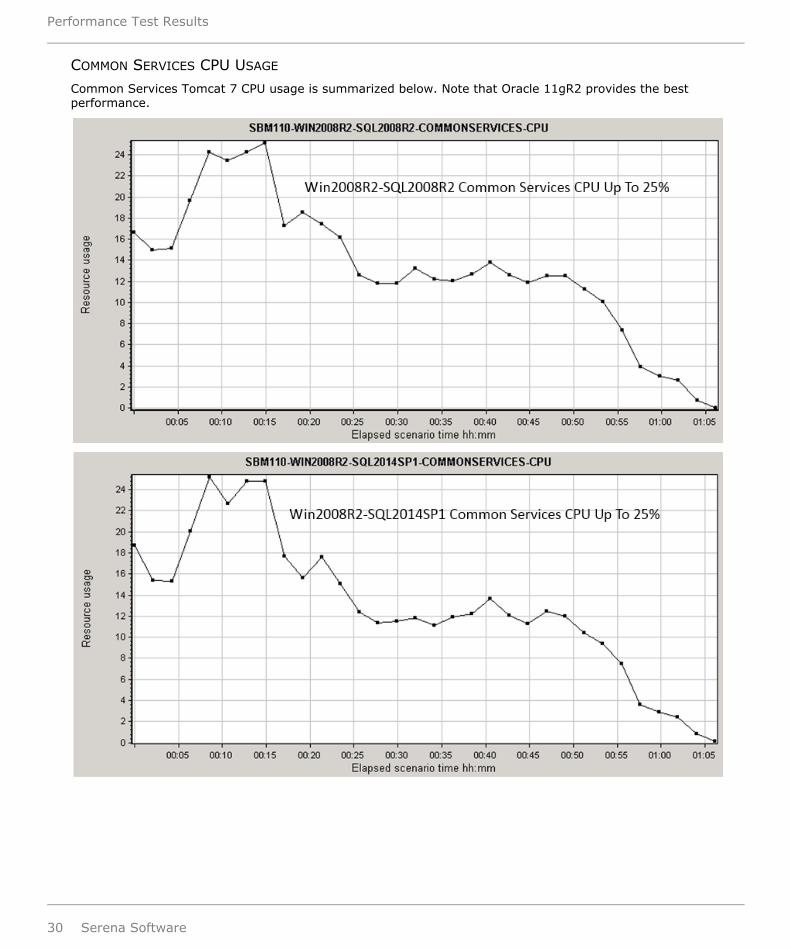
COMMON SERVICES CPU USAGE
Common Services Tomcat 7 CPU usage is summarized below. Note that Oracle 11gR2 provides the bestperformance.
Performance Test Results
30 Serena Software
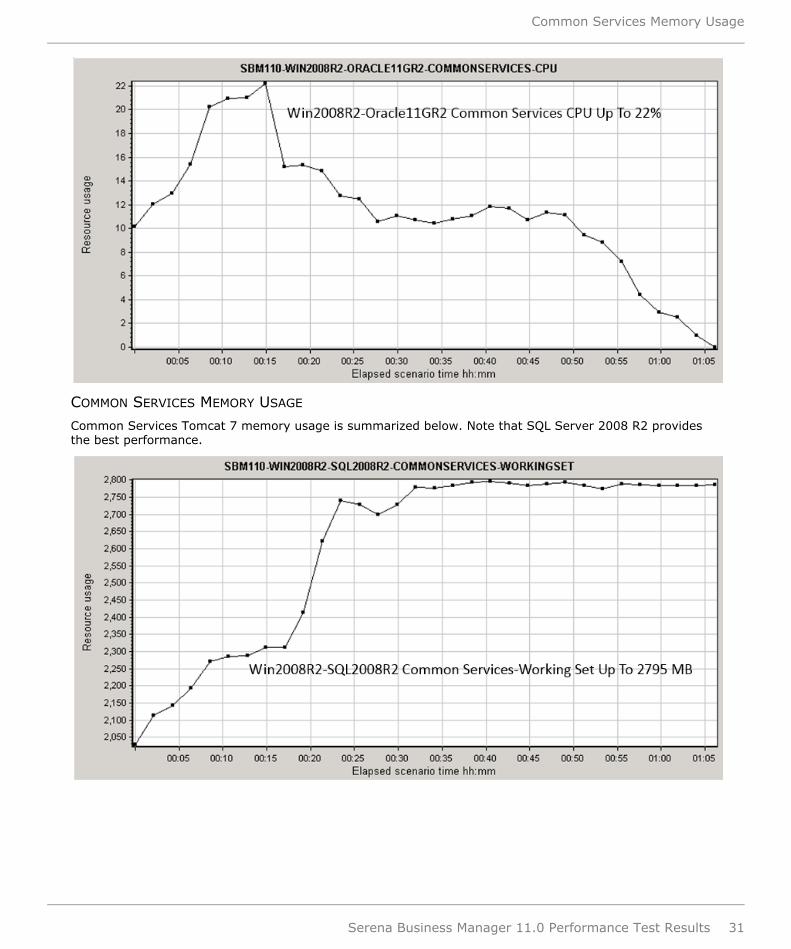
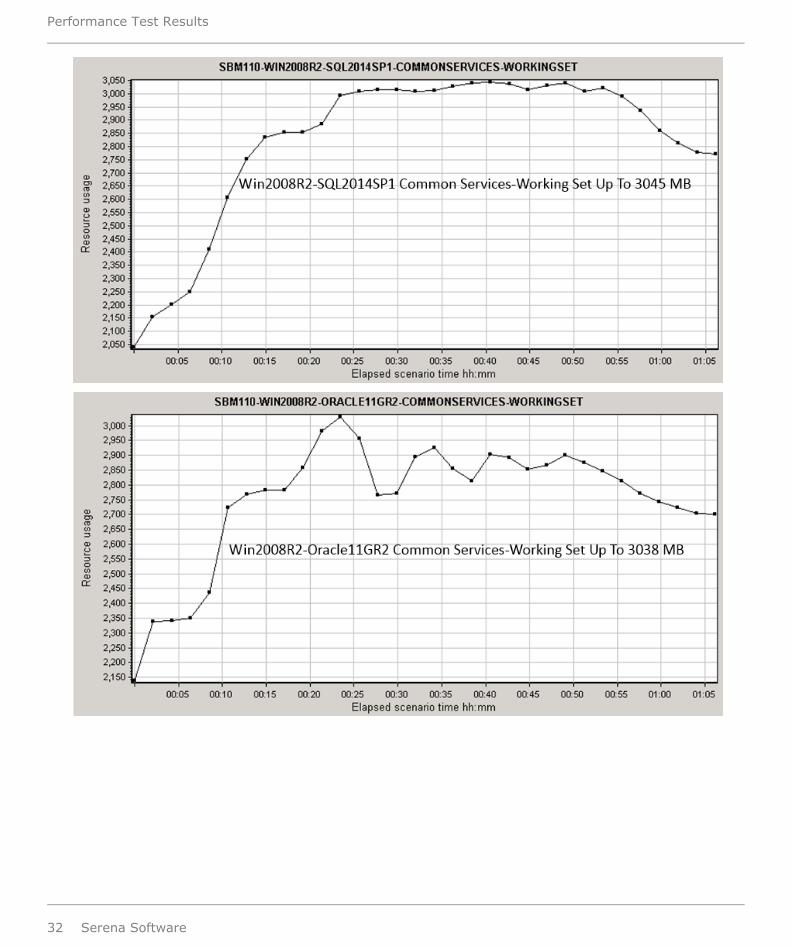
COMMON SERVICES MEMORY USAGE
Common Services Tomcat 7 memory usage is summarized below. Note that SQL Server 2008 R2 providesthe best performance.
Common Services Memory Usage
Serena Business Manager 11.0 Performance Test Results 31
Performance Test Results
32 Serena Software
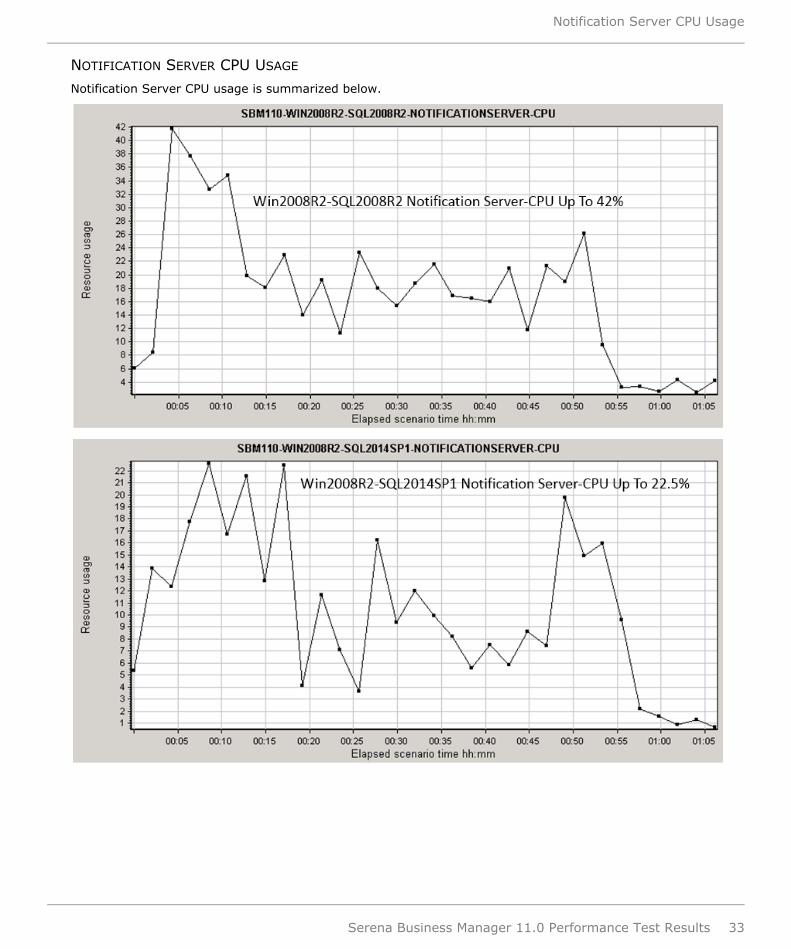
NOTIFICATION SERVER CPU USAGE
Notification Server CPU usage is summarized below.
Notification Server CPU Usage
Serena Business Manager 11.0 Performance Test Results 33
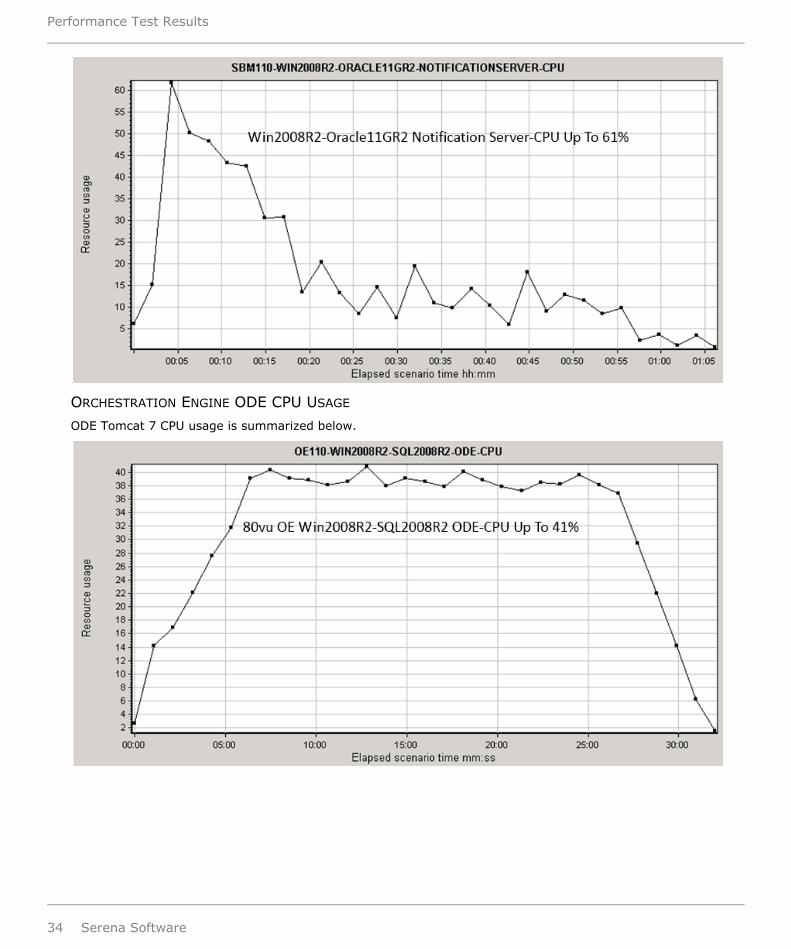
ORCHESTRATION ENGINE ODE CPU USAGE
ODE Tomcat 7 CPU usage is summarized below.
Performance Test Results
34 Serena Software
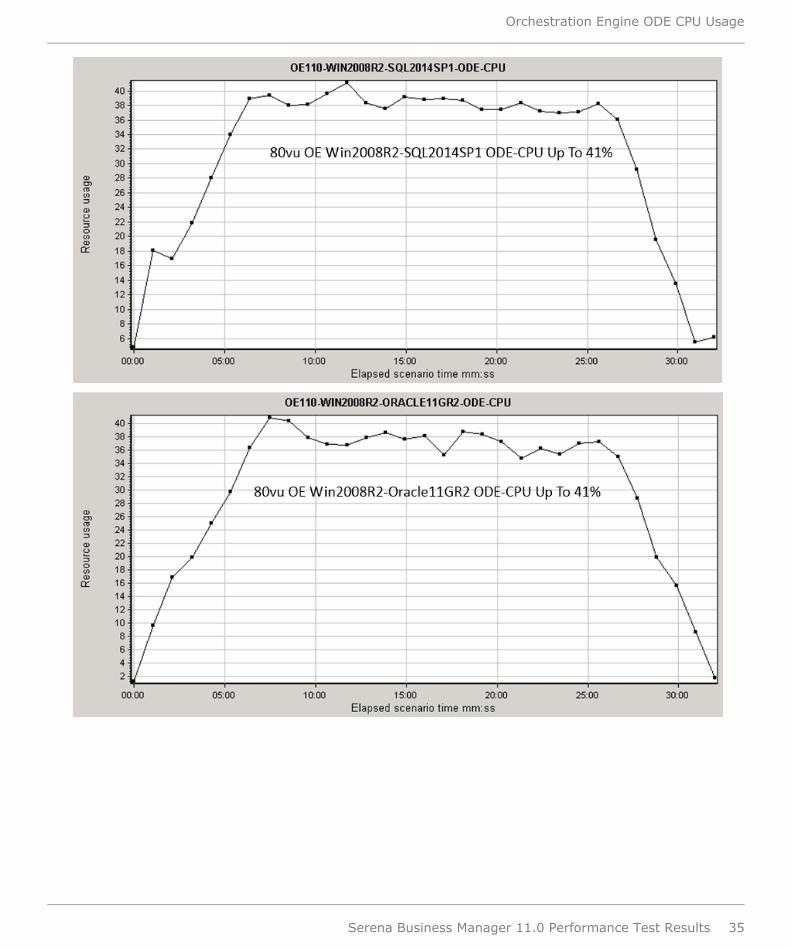
Orchestration Engine ODE CPU Usage
Serena Business Manager 11.0 Performance Test Results 35
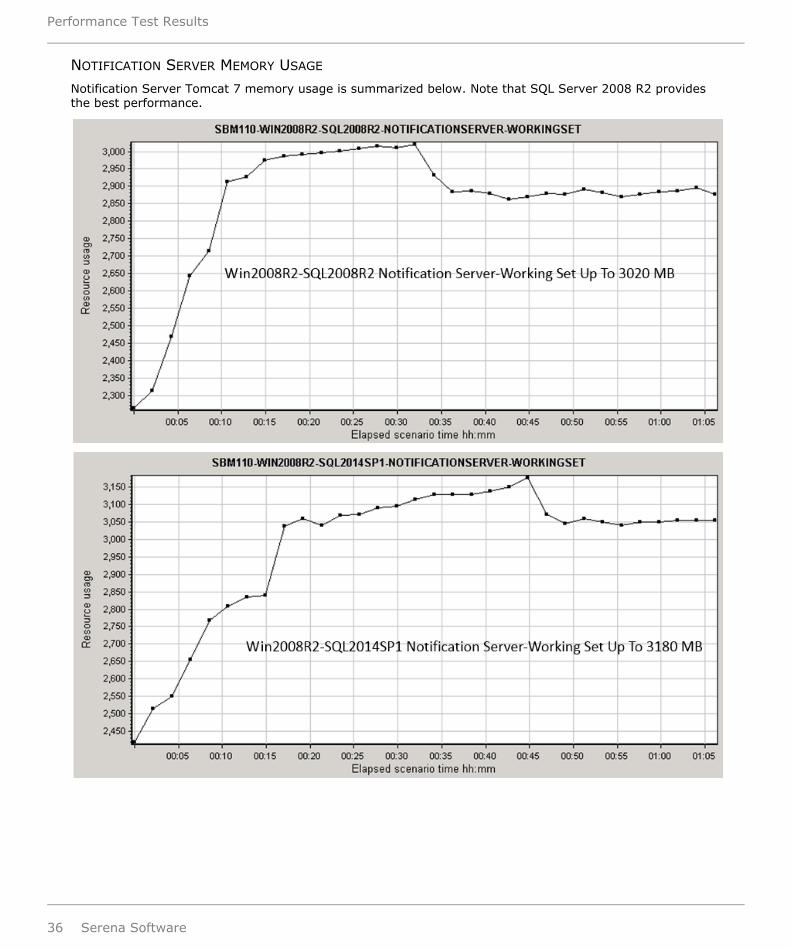
NOTIFICATION SERVER MEMORY USAGE
Notification Server Tomcat 7 memory usage is summarized below. Note that SQL Server 2008 R2 providesthe best performance.
Performance Test Results
36 Serena Software
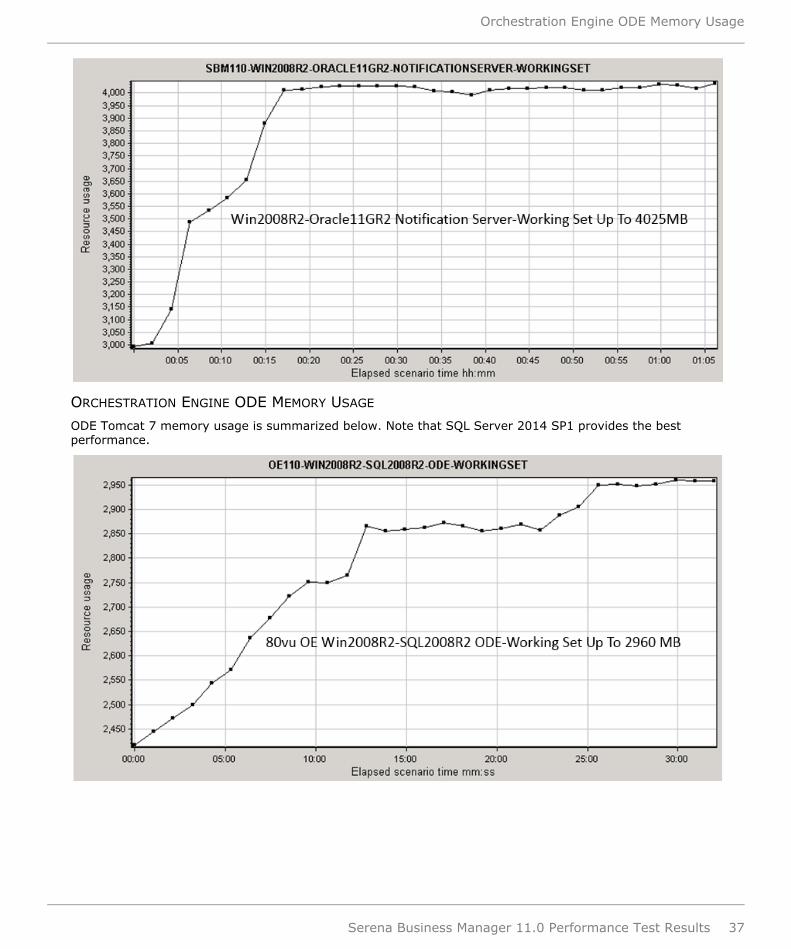
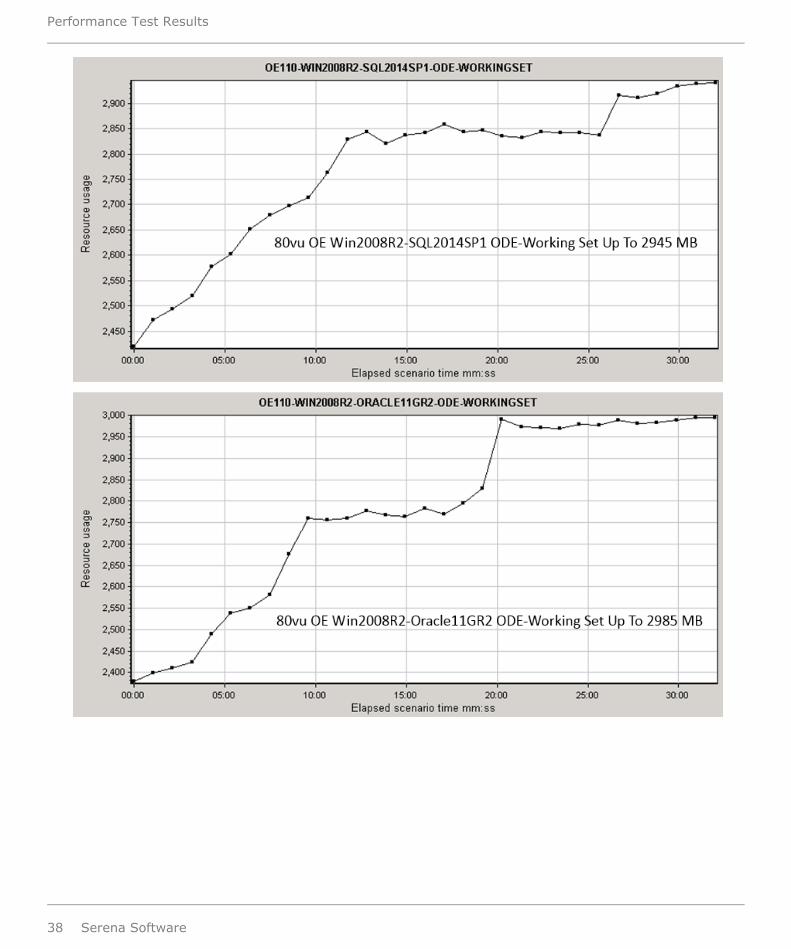
ORCHESTRATION ENGINE ODE MEMORY USAGE
ODE Tomcat 7 memory usage is summarized below. Note that SQL Server 2014 SP1 provides the bestperformance.
Orchestration Engine ODE Memory Usage
Serena Business Manager 11.0 Performance Test Results 37
Performance Test Results
38 Serena Software
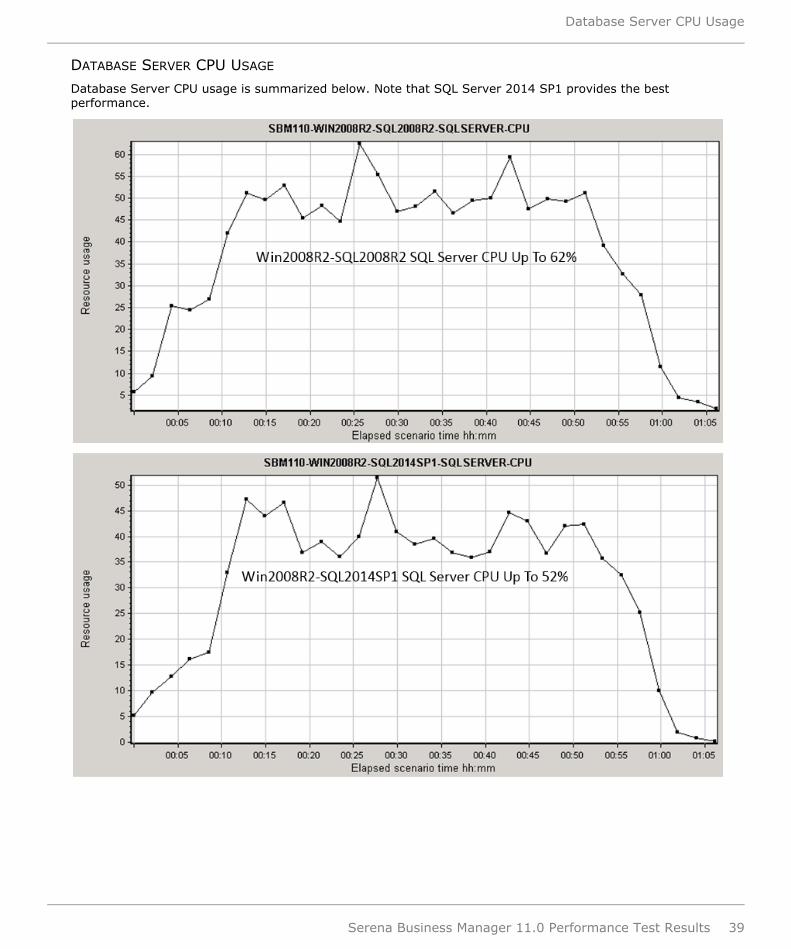
DATABASE SERVER CPU USAGE
Database Server CPU usage is summarized below. Note that SQL Server 2014 SP1 provides the bestperformance.
Database Server CPU Usage
Serena Business Manager 11.0 Performance Test Results 39
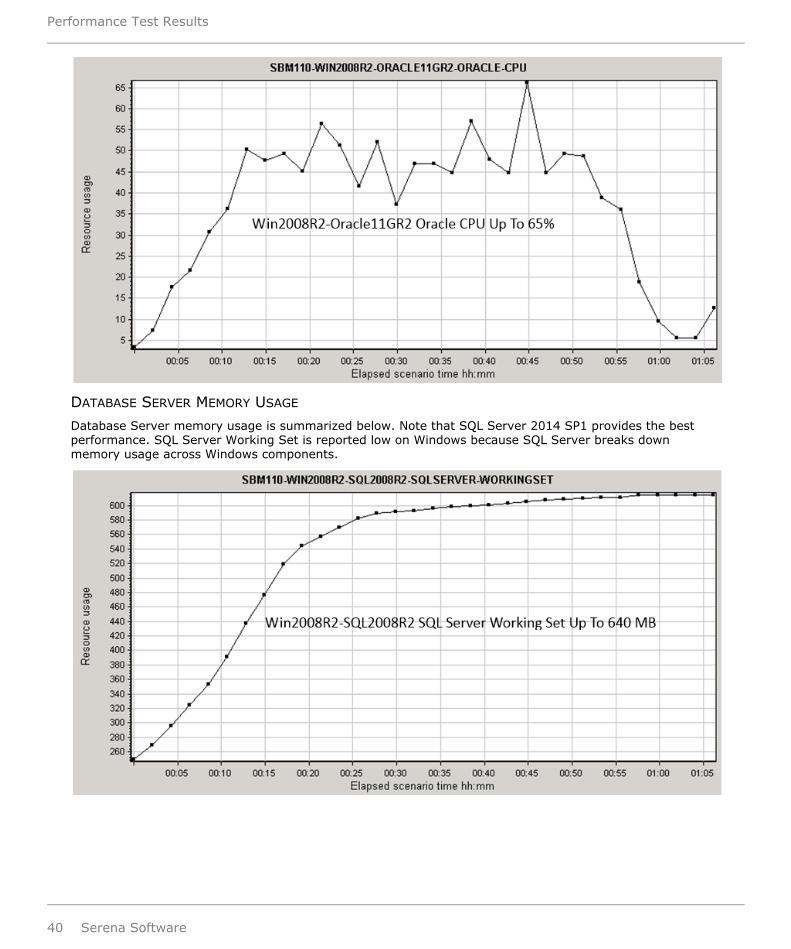
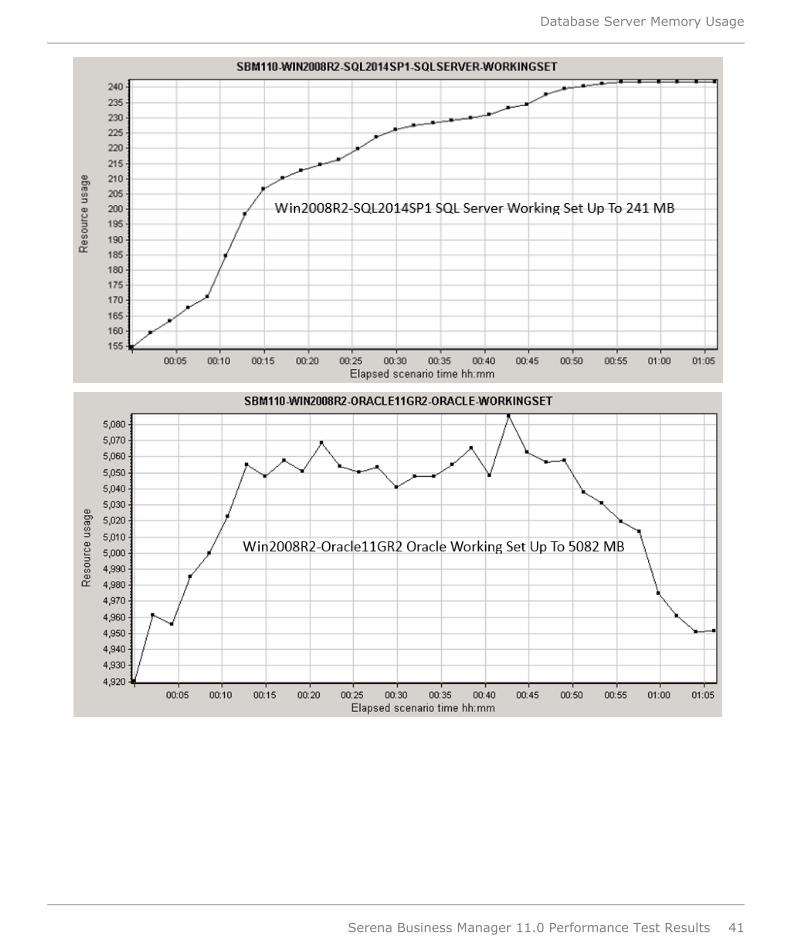
DATABASE SERVER MEMORY USAGE
Database Server memory usage is summarized below. Note that SQL Server 2014 SP1 provides the bestperformance. SQL Server Working Set is reported low on Windows because SQL Server breaks downmemory usage across Windows components.
Performance Test Results
40 Serena Software
Database Server Memory Usage
Serena Business Manager 11.0 Performance Test Results 41
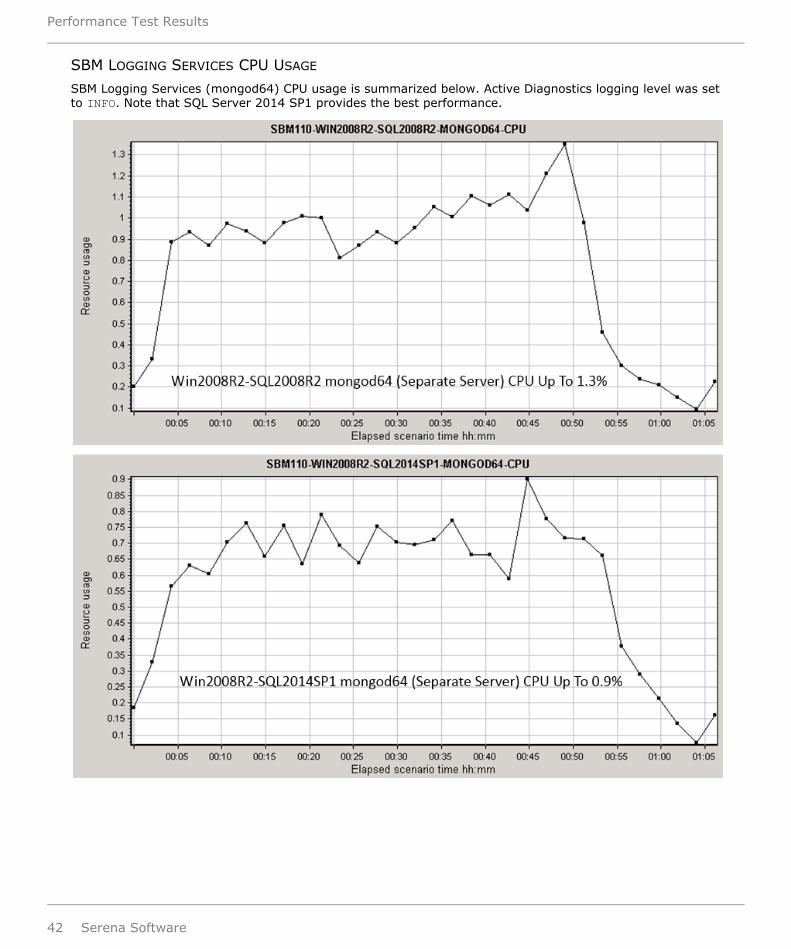
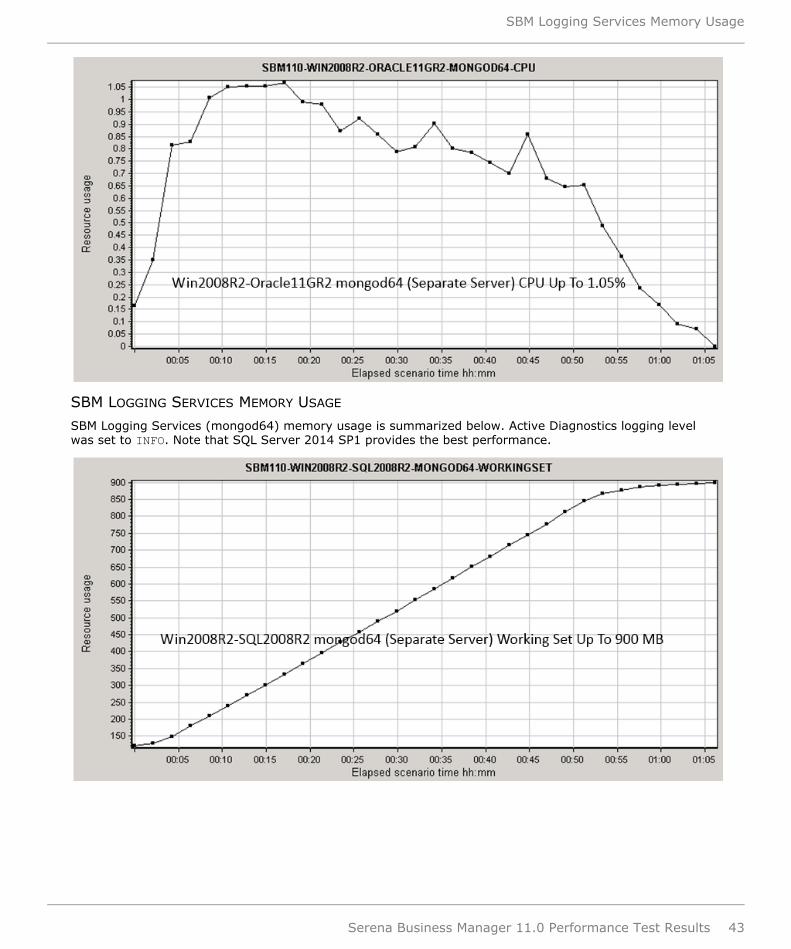
SBM LOGGING SERVICES CPU USAGE
SBM Logging Services (mongod64) CPU usage is summarized below. Active Diagnostics logging level was setto INFO. Note that SQL Server 2014 SP1 provides the best performance.
Performance Test Results
42 Serena Software
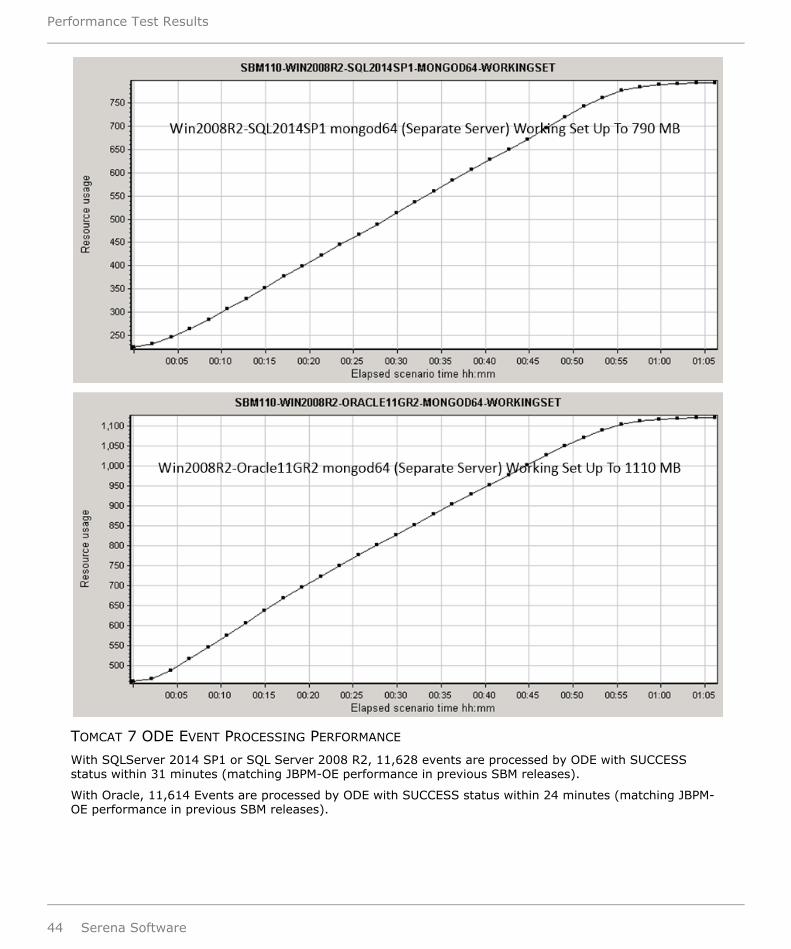
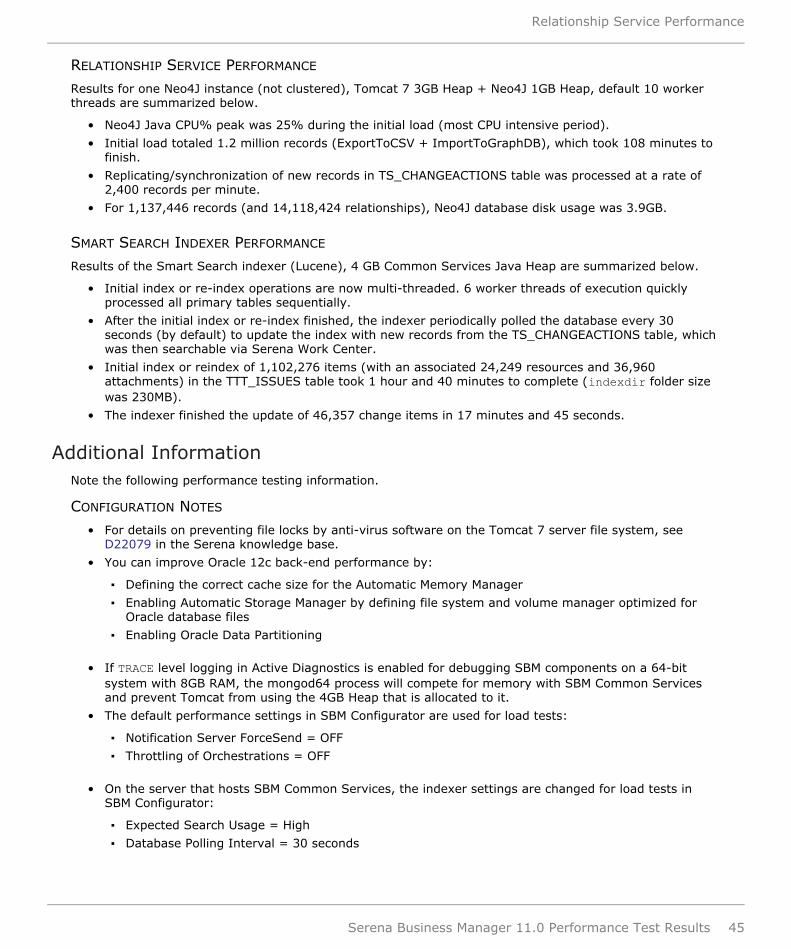
SBM LOGGING SERVICES MEMORY USAGE
SBM Logging Services (mongod64) memory usage is summarized below. Active Diagnostics logging levelwas set to INFO. Note that SQL Server 2014 SP1 provides the best performance.
SBM Logging Services Memory Usage
Serena Business Manager 11.0 Performance Test Results 43
TOMCAT 7 ODE EVENT PROCESSING PERFORMANCE
With SQLServer 2014 SP1 or SQL Server 2008 R2, 11,628 events are processed by ODE with SUCCESSstatus within 31 minutes (matching JBPM-OE performance in previous SBM releases).
With Oracle, 11,614 Events are processed by ODE with SUCCESS status within 24 minutes (matching JBPM-OE performance in previous SBM releases).
Performance Test Results
44 Serena Software
RELATIONSHIP SERVICE PERFORMANCE
Results for one Neo4J instance (not clustered), Tomcat 7 3GB Heap + Neo4J 1GB Heap, default 10 workerthreads are summarized below.
• Neo4J Java CPU% peak was 25% during the initial load (most CPU intensive period).
• Initial load totaled 1.2 million records (ExportToCSV + ImportToGraphDB), which took 108 minutes tofinish.
• Replicating/synchronization of new records in TS_CHANGEACTIONS table was processed at a rate of2,400 records per minute.
• For 1,137,446 records (and 14,118,424 relationships), Neo4J database disk usage was 3.9GB.
SMART SEARCH INDEXER PERFORMANCE
Results of the Smart Search indexer (Lucene), 4 GB Common Services Java Heap are summarized below.
• Initial index or re-index operations are now multi-threaded. 6 worker threads of execution quicklyprocessed all primary tables sequentially.
• After the initial index or re-index finished, the indexer periodically polled the database every 30seconds (by default) to update the index with new records from the TS_CHANGEACTIONS table, whichwas then searchable via Serena Work Center.
• Initial index or reindex of 1,102,276 items (with an associated 24,249 resources and 36,960attachments) in the TTT_ISSUES table took 1 hour and 40 minutes to complete (indexdir folder sizewas 230MB).
• The indexer finished the update of 46,357 change items in 17 minutes and 45 seconds.
Additional InformationNote the following performance testing information.
CONFIGURATION NOTES
• For details on preventing file locks by anti-virus software on the Tomcat 7 server file system, seeD22079 in the Serena knowledge base.
• You can improve Oracle 12c back-end performance by:
▪ Defining the correct cache size for the Automatic Memory Manager
▪ Enabling Automatic Storage Manager by defining file system and volume manager optimized forOracle database files
▪ Enabling Oracle Data Partitioning
• If TRACE level logging in Active Diagnostics is enabled for debugging SBM components on a 64-bitsystem with 8GB RAM, the mongod64 process will compete for memory with SBM Common Servicesand prevent Tomcat from using the 4GB Heap that is allocated to it.
• The default performance settings in SBM Configurator are used for load tests:
▪ Notification Server ForceSend = OFF
▪ Throttling of Orchestrations = OFF
• On the server that hosts SBM Common Services, the indexer settings are changed for load tests inSBM Configurator:
▪ Expected Search Usage = High
▪ Database Polling Interval = 30 seconds
Relationship Service Performance
Serena Business Manager 11.0 Performance Test Results 45
• Serena recommends that you optimize table statistics for large SBM tables with an Oracle database(not required for SQL Server):
exec DBMS_STATS.GATHER_TABLE_STATS (ownname => 'perf' , tabname =>'TS_PROJECTANCESTRYDENORM',cascade => true, estimate_percent => 100, granularity =>'ALL', degree => 8);exec DBMS_STATS.GATHER_TABLE_STATS (ownname => 'perf' , tabname =>'TS_TIMEINSTATE',cascade => true, estimate_percent => 100, granularity =>'ALL', degree => 8);exec DBMS_STATS.GATHER_TABLE_STATS (ownname => 'perf' , tabname =>'TS_TIMEZONEGMTOFFSETDENORM',cascade => true, estimate_percent => 100, granularity =>'ALL', degree => 8);exec DBMS_STATS.GATHER_TABLE_STATS (ownname => 'perf' , tabname =>'TS_CALENDARS',cascade => true, estimate_percent => 100, granularity =>'ALL', degree => 8);exec DBMS_STATS.GATHER_TABLE_STATS (ownname => 'perf' , tabname =>'TS_STATES',cascade => true, estimate_percent => 100, granularity =>'ALL', degree => 8);exec DBMS_STATS.GATHER_TABLE_STATS (ownname => 'perf' , tabname =>'TS_CHANGEACTIONS',cascade => true, estimate_percent => 10, granularity =>'ALL', degree => 8);exec DBMS_STATS.GATHER_TABLE_STATS (ownname => 'perf' , tabname =>'TTT_ISSUES',cascade => true, estimate_percent => 10, granularity =>'ALL', degree => 8);exec DBMS_STATS.GATHER_TABLE_STATS (ownname => 'perf' , tabname =>'TS_PROJECTANCESTRYDENORM',cascade => true, estimate_percent => 100, granularity =>'ALL', degree => 8);exec DBMS_STATS.GATHER_TABLE_STATS (ownname => 'perf' , tabname =>'TS_TIMEINSTATE',cascade => true, estimate_percent => 100, granularity =>'ALL', degree => 8);exec DBMS_STATS.GATHER_TABLE_STATS (ownname => 'perf' , tabname =>'TS_TIMEZONEGMTOFFSETDENORM',cascade => true, estimate_percent => 100, granularity =>'ALL', degree => 8);exec DBMS_STATS.GATHER_TABLE_STATS (ownname => 'perf' , tabname =>'TS_CALENDARS',cascade => true, estimate_percent => 100, granularity =>'ALL', degree => 8);exec DBMS_STATS.GATHER_TABLE_STATS (ownname => 'perf' , tabname =>'TS_STATES',cascade => true, estimate_percent => 100, granularity =>'ALL', degree => 8);
• Oracle ODBC client connection to Oracle server configuration tips:
▪ Another variable for number of sessions used depends on what type of ODBC connectionApplication Engine is making as a client to the Oracle server. ODBC connection as Client10 (SSL) orvia Oracle Advanced Security requires an increase in processes/sessions on the Oracle server.
▪ To avoid server refused the connection errors in the Application Engine Event Viewer andJBDC connection exceptions in the Tomcat 7 server.log in the performance lab at 200vu loadagainst Work Center, increasing the number of processes to 300 and sessions to 400 in Oracle issufficient:
sqlplus system/testauto@hpq5> alter system set processes=300 scope=spfile;
Verify change:
sqlplus system/testaut0@hpq5> show parameters processes;> show parameters sessions;
Additional Information
46 Serena Software
SBM 11.0 REPORTED DEFECTS
The following defects have been submitted against the GA build of SBM 11.0
• DEF275713 – SWC PERF: need re-design commonsvc hasPrivilege cache (too small to supportrestricted attachments searching feature)
PERFORMANCE TEST EXCLUSIONS
The following items were excluded from performance testing.
• System report transactions are not included in 200vu load test.
Reference____
ABOUT SERENA SOFTWARE
Serena Software provides Orchestrated application development and release management solutions to theGlobal 2000. Our 2,500 active enterprise customers, including a majority of the Fortune 100, have madeSerena the largest independent Application Lifecycle Management (ALM) vendor and the only one thatorchestrates DevOps, the processes that bring together application development and operations.
Headquartered in Silicon Valley, Serena serves enterprise customers across the globe. Serena is a portfoliocompany of HGGC, a leading middle market private equity firm.
CONTACT
Web site: http://www.serena.com/company/contact-us.html
Copyright © 2015 Serena Software, Inc. All rights reserved. Serena, TeamTrack, StarTool, PVCS, Comparex, Dimensions, PrototypeComposer, Mariner, and ChangeMan are registered trademarks of Serena Software, Inc. The Serena logo and Version Manager aretrademarks of Serena Software, Inc. All other products or company names are used for identification purposes only, and may betrademarks of their respective owners.
SBM 11.0 Reported Defects
Serena Business Manager 11.0 Performance Test Results 47