Embed Size (px)
Citation preview
7 .
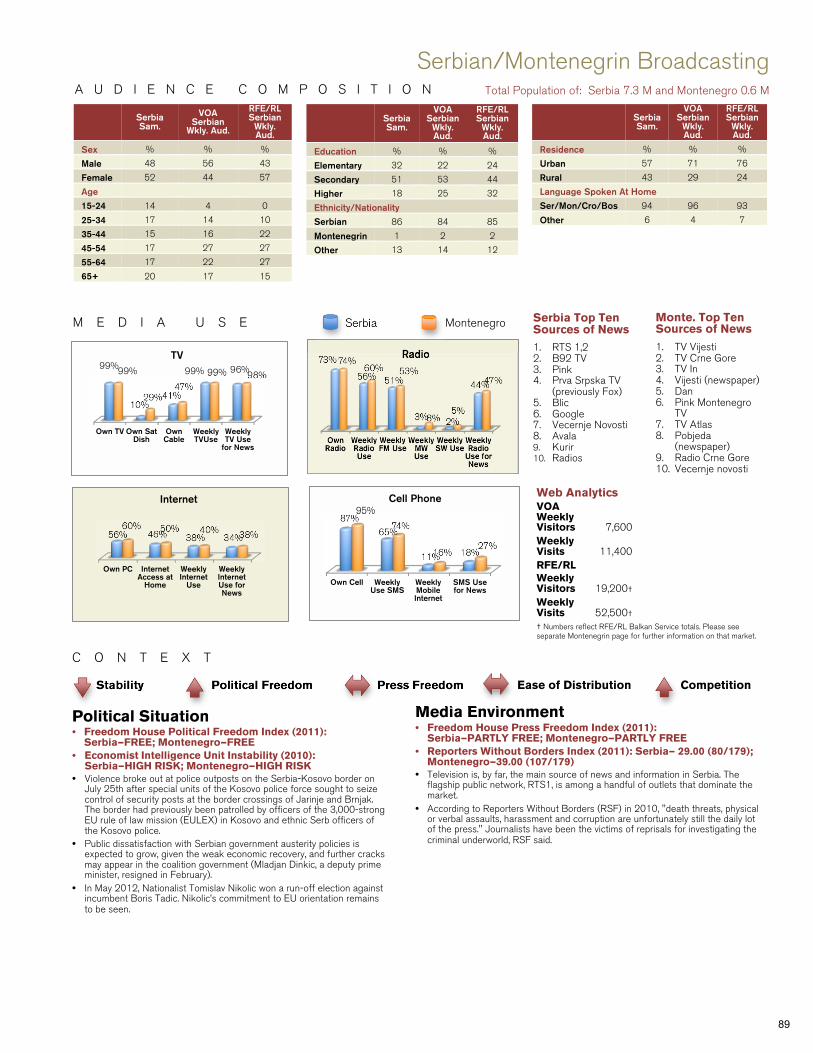
M E D I A U S E Serbia Montenegro
Stability Political Freedom Press Freedom Ease of Distribution Competition
A U D I E N C E C O M P O S I T I O N
C O N T E X T
Serbia Sam.
VOA Serbian
Wkly. Aud.
RFE/RL Serbian
Wkly. Aud.
Sex % % %
Male 48 56 43
Female 52 44 57
Age
15-24 14 4 0
25-34 17 14 10
35-44 15 16 22
45-54 17 27 27
55-64 17 22 27
65+ 20 17 15
Serbia Sam.
VOA Serbian
Wkly. Aud.
RFE/RL Serbian
Wkly. Aud.
Education % % %
Elementary 32 22 24
Secondary 51 53 44
Higher 18 25 32
Ethnicity/Nationality
Serbian 86 84 85
Montenegrin 1 2 2
Other 13 14 12
Serbia Sam.
VOA Serbian
Wkly. Aud.
RFE/RL Serbian
Wkly. Aud.
Residence % % %
Urban 57 71 76
Rural 43 29 24
Language Spoken At Home
Ser/Mon/Cro/Bos 94 96 93
Other 6 4 7
Serbian/Montenegrin Broadcasting Total Population of: Serbia 7.3 M and Montenegro 0.6 M
Serbia Top Ten Sources of News 1. RTS 1,2 2. B92 TV 3. Pink 4. Prva Srpska TV
(previously Fox) 5. Blic 6. Google 7. Vecernje Novosti 8. Avala 9. Kurir 10. Radios
Monte. Top Ten Sources of News
1. TV Vijesti 2. TV Crne Gore 3. TV In 4. Vijesti (newspaper) 5. Dan 6. Pink Montenegro
TV 7. TV Atlas 8. Pobjeda
(newspaper) 9. Radio Crne Gore 10. Vecernje novosti
Political Situation • Freedom House Political Freedom Index (2011):
Serbia—FREE; Montenegro—FREE • Economist Intelligence Unit Instability (2010):
Serbia—HIGH RISK; Montenegro—HIGH RISK • Violence broke out at police outposts on the Serbia-Kosovo border on
July 25th after special units of the Kosovo police force sought to seize control of security posts at the border crossings of Jarinje and Brnjak. The border had previously been patrolled by officers of the 3,000-strong EU rule of law mission (EULEX) in Kosovo and ethnic Serb officers of the Kosovo police.
• Public dissatisfaction with Serbian government austerity policies is expected to grow, given the weak economic recovery, and further cracks may appear in the coalition government (Mladjan Dinkic, a deputy prime minister, resigned in February).
• In May 2012, Nationalist Tomislav Nikolic won a run-off election against incumbent Boris Tadic. Nikolic’s commitment to EU orientation remains to be seen.
Own TV Own Sat Dish
Own Cable
Weekly TVUse
Weekly TV Use
for News
99%
10% 41%
99% 96% 99%
29% 47%
99% 98%
TV
Own Radio
Weekly Radio Use
Weekly FM Use
Weekly MW Use
Weekly SW Use
Weekly Radio
Use for News
73%
56% 51%
3% 2%
44%
74% 60% 53%
8% 5%
47%
Radio
Own PC Internet Access at
Home
Weekly Internet
Use
Weekly Internet Use for News
56% 46% 38% 34% 60% 50% 40% 38%
Internet
Own Cell Weekly Use SMS
Weekly Mobile Internet
SMS Use for News
87%
65%
11% 18%
95%
74%
16% 27%
Cell Phone
Media Environment • Freedom House Press Freedom Index (2011):
Serbia—PARTLY FREE; Montenegro—PARTLY FREE • Reporters Without Borders Index (2011): Serbia— 29.00 (80/179);
Montenegro—39.00 (107/179) • Television is, by far, the main source of news and information in Serbia. The
flagship public network, RTS1, is among a handful of outlets that dominate the market.
• According to Reporters Without Borders (RSF) in 2010, "death threats, physical or verbal assaults, harassment and corruption are unfortunately still the daily lot of the press." Journalists have been the victims of reprisals for investigating the criminal underworld, RSF said.
Web Analytics VOA Weekly Visitors 7,600 Weekly Visits 11,400 RFE/RL Weekly Visitors 19,200† Weekly Visits 52,500† † Numbers reflect RFE/RL Balkan Service totals. Please see separate Montenegrin page for further information on that market.
89
P R O F I L E
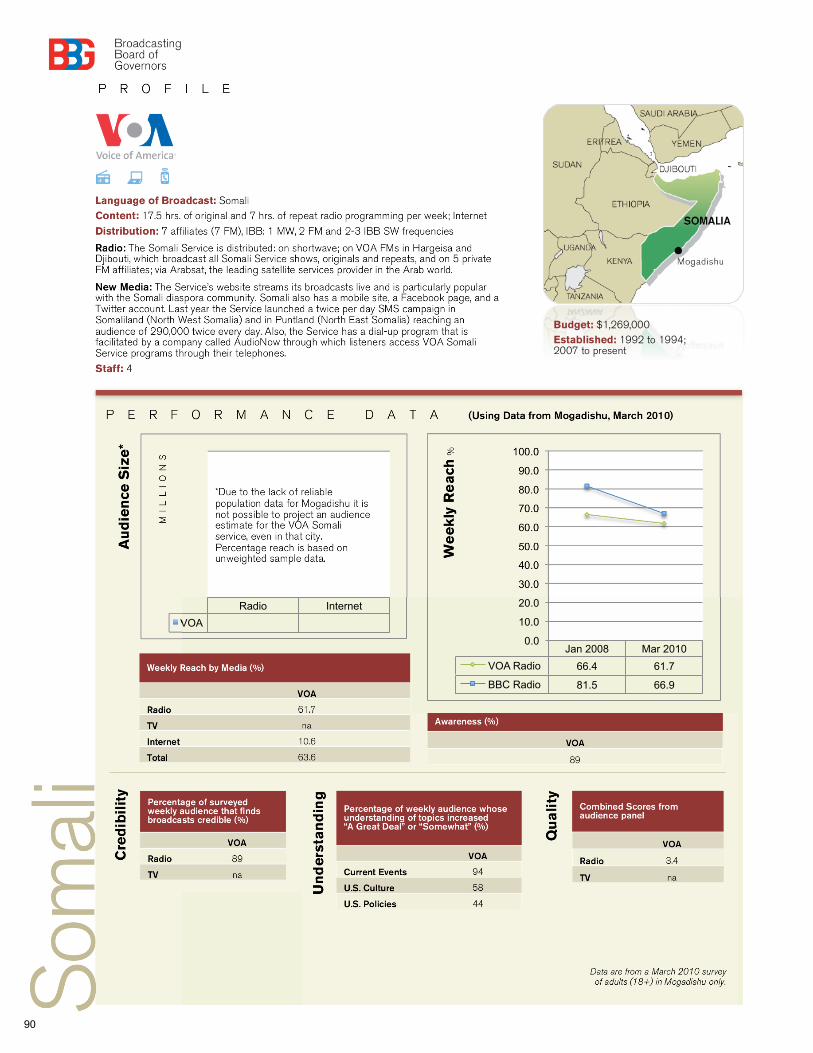
P E R F O R M A N C E D A T A (Using Data from Mogadishu, March 2010)
Language of Broadcast: Somali Content: 17.5 hrs. of original and 7 hrs. of repeat radio programming per week; Internet
Distribution: 7 affiliates (7 FM), IBB: 1 MW, 2 FM and 2-3 IBB SW frequencies
Radio: The Somali Service is distributed: on shortwave; on VOA FMs in Hargeisa and Djibouti, which broadcast all Somali Service shows, originals and repeats, and on 5 private FM affiliates; via Arabsat, the leading satellite services provider in the Arab world.
New Media: The Service’s website streams its broadcasts live and is particularly popular with the Somali diaspora community. Somali also has a mobile site, a Facebook page, and a Twitter account. Last year the Service launched a twice per day SMS campaign in Somaliland (North West Somalia) and in Puntland (North East Somalia) reaching an audience of 290,000 twice every day. Also, the Service has a dial-up program that is facilitated by a company called AudioNow through which listeners access VOA Somali Service programs through their telephones.
Staff: 4
Percentage of surveyed weekly audience that finds broadcasts credible (%)
VOA
Radio 89
TV na
Percentage of weekly audience whose understanding of topics increased “A Great Deal” or “Somewhat” (%)
VOA
Current Events 94
U.S. Culture 58
U.S. Policies 44
Combined Scores from audience panel
VOA
Radio 3.4
TV na
Cre
dib
ilit
y
Som
ali
Qu
alit
y
Un
der
sta
nd
ing
Weekly Reach by Media (%)
VOA
Radio 61.7
TV na
Internet 10.6
Total 63.6
Awareness (%)
VOA
89
Jan 2008 Mar 2010
VOA Radio 66.4 61.7
BBC Radio 81.5 66.9
0.0
10.0
20.0
30.0
40.0
50.0
60.0
70.0
80.0
90.0
100.0
Radio Internet
VOA
Au
die
nce
Siz
e*
MI
LL
IO
NS
We
ekly
Re
ach
%
*Due to the lack of reliable population data for Mogadishu it is not possible to project an audience estimate for the VOA Somali service, even in that city. Percentage reach is based on unweighted sample data.
Data are from a March 2010 survey of adults (18+) in Mogadishu only.
Budget: $1,269,000 Established: 1992 to 1994; 2007 to present
90
A U D I E N C E C O M P O S I T I O N
C O N T E X T
Stability Political Freedom Press Freedom Ease of Distribution Competition
Sample VOA Weekly Audience
Sex % %
Male 64 65
Female 36 35
Age
15-24 27 27
25-34 37 47
35-44 16 18
45-54 5 6
55-64 2 2
65+ <1 <1
Sample VOA Weekly Audience
Education % %
None 27 29
Primary 23 22
Secondary 25 29
Higher 12 14
Ethnicity/Nationality
Somali 98 99
Other 2 1
Sample VOA Weekly Audience
Residence % %
Urban 100 100
Rural na na
Language
Somali 98 99
Arabic 2 1
Somali Broadcasting Total Population of Somalia: 9.9 million
Own TV Own Sat Dish
Own Cable
Weekly TV Use
Weekly TV Use
for News
28% 21% 20% 32% 26%
TV
Own Cell Weekly Use SMS
Mobile Internet
Use
Weekly SMS Use for News
53% 38%
7%
34%
Cell Phone
Top Ten Media Outlets
1. Horn Afrik 2. Capital Voice 3. BBC Somali 4. VOA Somali 5. Radio Shabelle 6. Radio Mogadishu 7. Simba 8. IQK 9. GBC 10. Furqan
Political Situation • Freedom House Political Freedom Index (2011):
NOT FREE • Economist Intelligence Unit Instability (2010): NA • In 2011, the embattled Transitional Federal Government
(TFG) received significant African Union troop support to fight the Islamist insurgent group Al-Shabaab. The coordinated campaign let to success in recapturing all of Mogadishu. Al Shabaab lost much territory, as it had to engage in fighting multiple fronts after Kenyan troops entered Somalia in October 2011 in an attempt to stop kidnappings along the border.
• Elections had been planned for the summer of 2011, but they have been postponed until 2012. The TFG hopes to increase control of a larger area of the country by then.
• The 2011 drought and ensuing famine paired with the continuing instability led to large scale internal migration as well as the flight of tens of thousands of Somalis to Kenyan refugee camps.
• With little rule of law, piracy and terrorism continue to flourish throughout the country.
• Two regions, Somaliland and Puntland, have declared autonomous rule and essentially operate as independent states.
M E D I A U S E
Own Radio
Weekly Radio Use
Weekly FM Use
Weekly MW Use
Weekly SW Use
Weekly Radio
Use for News
89% 89% 88%
9% 11%
87%
Radio
Own PC Internet Access
Weekly Internet
Use
Weekly Internet Use for News
20% 17% 30% 25%
Internet
Top Ten Sources of News
1. Horn Afrik 2. Shabelle 3. Universal TV 4. Al Jazeera 5. Capital Voice 6. Shabelle TV 7. VOA 8. CNN 9. IQK 10. BBC
Media Environment • Freedom House Press Freedom Index (2011): NOT FREE • Reporters Without Borders Index (2011): 88.33 (164/179) • Not surprisingly, Somalia’s media environment has been devastated by the country’s
political and economic vacuum. There are few formally trained journalists, little and low-quality equipment, and insufficient financial resources. The few private radio and TV stations are often closely linked to political factions and subject to political pressure.
• Journalists face incredible risks, with at least 19 journalists having lost their lives and countless others facing harassment and detainment by the various political factions.
• The administrations of Somaliland and Puntland have imposed very tight media controls and censorship. The Islamist insurgent groups have also begun challenging the media: Hizbul Islam threatened violence against broadcasters who played music on air, and Al-Shabaab imposed a ban of its own, threatening reprisal against any station airing BBC or VOA programming. The degree of media freedom differs considerably throughout Somalia. While journalists enjoy a relative amount of freedom in Somaliland, official pressure on the media has increased in Puntland, and in south/central Somalia journalists remain under extreme threat from Islamic elements.
• In the absence of rule of law or critical infrastructure, research of any kind is extremely challenging. There are no reliable estimates of population distribution on which to base national survey samples, and many areas are inaccessible. Even within Mogadishu, active fighting prevents researchers from moving freely. Local interviewers trained and coordinated through research centers in Nairobi, Kenya are able to collect reasonably representative data and conduct in-depth interviews and other qualitative studies, but research of any kind is risky and expensive.
Web Analytics Weekly Visitors 41,600 Weekly Visits 118,000
91
Jun 2005 Dec 2006 Aug 2008
VOA Radio 0.1
Radio Marti 0.1
TV Marti 0.1
0
1
2
3
4
5
P R O F I L E
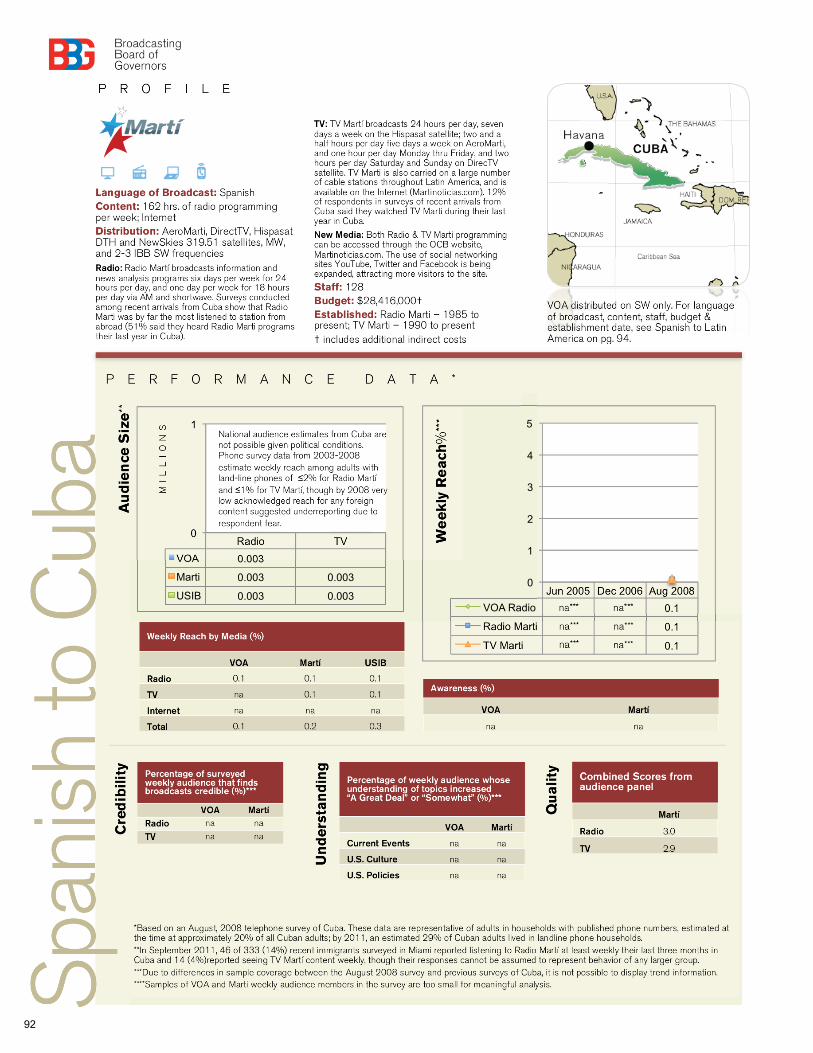
P E R F O R M A N C E D A T A *
Language of Broadcast: Spanish Content: 162 hrs. of radio programming per week; Internet Distribution: AeroMarti, DirectTV, Hispasat DTH and NewSkies 319.51 satellites, MW, and 2-3 IBB SW frequencies Radio: Radio Martí broadcasts information and news analysis programs six days per week for 24 hours per day, and one day per week for 18 hours per day via AM and shortwave. Surveys conducted among recent arrivals from Cuba show that Radio Marti was by far the most listened to station from abroad (51% said they heard Radio Marti programs their last year in Cuba).
Percentage of surveyed weekly audience that finds broadcasts credible (%)***
VOA Martí Radio na na
TV na na
Percentage of weekly audience whose understanding of topics increased “A Great Deal” or “Somewhat” (%)***
VOA Martí
Current Events na na
U.S. Culture na na
U.S. Policies na na
Combined Scores from audience panel
Martí
Radio 3.0
TV 2.9
Cre
dib
ilit
y
Qu
alit
y
Un
der
sta
nd
ing
Weekly Reach by Media (%)
VOA Martí USIB
Radio 0.1 0.1 0.1
TV na 0.1 0.1
Internet na na na
Total 0.1 0.2 0.3
Awareness (%)
VOA Martí
na na
Radio TV
VOA 0.003
Marti 0.003 0.003
USIB 0.003 0.003
0
1 National audience estimates from Cuba are not possible given political conditions. Phone survey data from 2003-2008 estimate weekly reach among adults with land-line phones of ≤2% for Radio Martí and ≤1% for TV Martí, though by 2008 very low acknowledged reach for any foreign content suggested underreporting due to respondent fear.
Au
die
nce
Siz
e**
MI
LL
IO
NS
Span
ish
to C
uba
*Based on an August, 2008 telephone survey of Cuba. These data are representative of adults in households with published phone numbers, estimated at the time at approximately 20% of all Cuban adults; by 2011, an estimated 29% of Cuban adults lived in landline phone households. **In September 2011, 46 of 333 (14%) recent immigrants surveyed in Miami reported listening to Radio Martí at least weekly their last three months in Cuba and 14 (4%)reported seeing TV Martí content weekly, though their responses cannot be assumed to represent behavior of any larger group. ***Due to differences in sample coverage between the August 2008 survey and previous surveys of Cuba, it is not possible to display trend information. ****Samples of VOA and Marti weekly audience members in the survey are too small for meaningful analysis.
VOA distributed on SW only. For language of broadcast, content, staff, budget & establishment date, see Spanish to Latin America on pg. 94.
TV: TV Martí broadcasts 24 hours per day, seven days a week on the Hispasat satellite; two and a half hours per day five days a week on AeroMarti, and one hour per day Monday thru Friday, and two hours per day Saturday and Sunday on DirecTV satellite. TV Marti is also carried on a large number of cable stations throughout Latin America, and is available on the Internet (Martinoticias.com). 12% of respondents in surveys of recent arrivals from Cuba said they watched TV Marti during their last year in Cuba.
New Media: Both Radio & TV Marti programming can be accessed through the OCB website, Martinoticias.com. The use of social networking sites YouTube, Twitter and Facebook is being expanded, attracting more visitors to the site.
Staff: 128 Budget: $28,416,000† Established: Radio Marti – 1985 to present; TV Marti – 1990 to present † includes additional indirect costs
Jun 2005 Dec 2006 Aug 2008
VOA Radio 0.1
Radio Marti 0.1
TV Marti 0.1
0
1
2
3
4
5
We
ekly
Re
ach
%**
*
na*** na***
na*** na***
na*** na***
92
A U D I E N C E C O M P O S I T I O N
C O N T E X T
Stability Political Freedom Press Freedom Ease of Distribution Competition
Sample VOA
Weekly Aud.***
Martí Weekly Aud.***
Sex % % %
Male 47 na na
Female 53 na na Age
18-24 15 na na
25-34 16 na na
35-44 23 na na
45-54 19 na na
55-64 16 na na
65+ 12 na na
Sample VOA
Weekly Aud.***
Martí Weekly Aud.***
Education % % %
None <1 na na
Primary 6 na na
Secondary 19 na na
Associates 20 na na
Trade 31
University 24 na na Ethnicity/Nationality na
Sample VOA
Weekly Aud.***
Martí Weekly Aud.***
Residence % % % na Language
na ***Samples of VOA and Marti weekly audience members in the survey are too small for meaningful analysis.
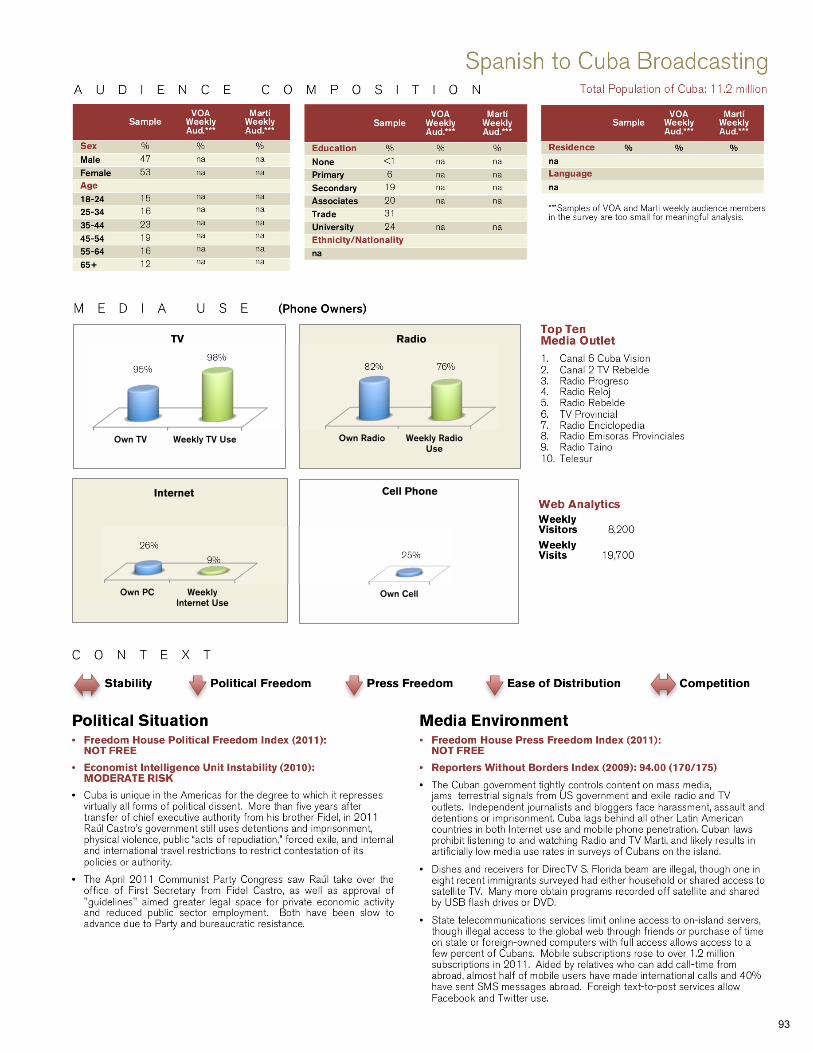
Spanish to Cuba Broadcasting Total Population of Cuba: 11.2 million
Own TV Weekly TV Use
95% 98%
TV
Own Cell
25%
Cell Phone
Top Ten Media Outlet 1. Canal 6 Cuba Vision 2. Canal 2 TV Rebelde 3. Radio Progreso 4. Radio Reloj 5. Radio Rebelde 6. TV Provincial 7. Radio Enciclopedia 8. Radio Emisoras Provinciales 9. Radio Taino 10. Telesur
Political Situation • Freedom House Political Freedom Index (2011):
NOT FREE
• Economist Intelligence Unit Instability (2010): MODERATE RISK
• Cuba is unique in the Americas for the degree to which it represses virtually all forms of political dissent. More than five years after transfer of chief executive authority from his brother Fidel, in 2011 Raúl Castro’s government still uses detentions and imprisonment, physical violence, public “acts of repudiation,” forced exile, and internal and international travel restrictions to restrict contestation of its policies or authority.
• The April 2011 Communist Party Congress saw Raúl take over the office of First Secretary from Fidel Castro, as well as approval of "guidelines" aimed greater legal space for private economic activity and reduced public sector employment. Both have been slow to advance due to Party and bureaucratic resistance.
M E D I A U S E (Phone Owners)
Own Radio Weekly Radio Use
82% 76%
Radio
Own PC Weekly Internet Use
26%
9%
Internet
Media Environment • Freedom House Press Freedom Index (2011):
NOT FREE
• Reporters Without Borders Index (2009): 94.00 (170/175)
• The Cuban government tightly controls content on mass media, jams terrestrial signals from US government and exile radio and TV outlets. Independent journalists and bloggers face harassment, assault and detentions or imprisonment. Cuba lags behind all other Latin American countries in both Internet use and mobile phone penetration. Cuban laws prohibit listening to and watching Radio and TV Marti, and likely results in artificially low media use rates in surveys of Cubans on the island.
• Dishes and receivers for DirecTV S. Florida beam are illegal, though one in eight recent immigrants surveyed had either household or shared access to satellite TV. Many more obtain programs recorded off satellite and shared by USB flash drives or DVD.
• State telecommunications services limit online access to on-island servers, though illegal access to the global web through friends or purchase of time on state or foreign-owned computers with full access allows access to a few percent of Cubans. Mobile subscriptions rose to over 1.2 million subscriptions in 2011. Aided by relatives who can add call-time from abroad, almost half of mobile users have made international calls and 40% have sent SMS messages abroad. Foreigh text-to-post services allow Facebook and Twitter use.
Web Analytics Weekly Visitors 8,200 Weekly Visits 19,700
93
Dec 01
Aug 03
Jan 04
Jun 05
Nov 07
VOA to Venezuela 5.1 3.5 4.1 4.2
VOA to Ecuador 5.4 1.6 2.6
0.0 1.0 2.0 3.0 4.0 5.0 6.0 7.0 8.0 9.0
10.0
P R O F I L E
P E R F O R M A N C E D A T A
A U D I E N C E C O M P O S I T I O N
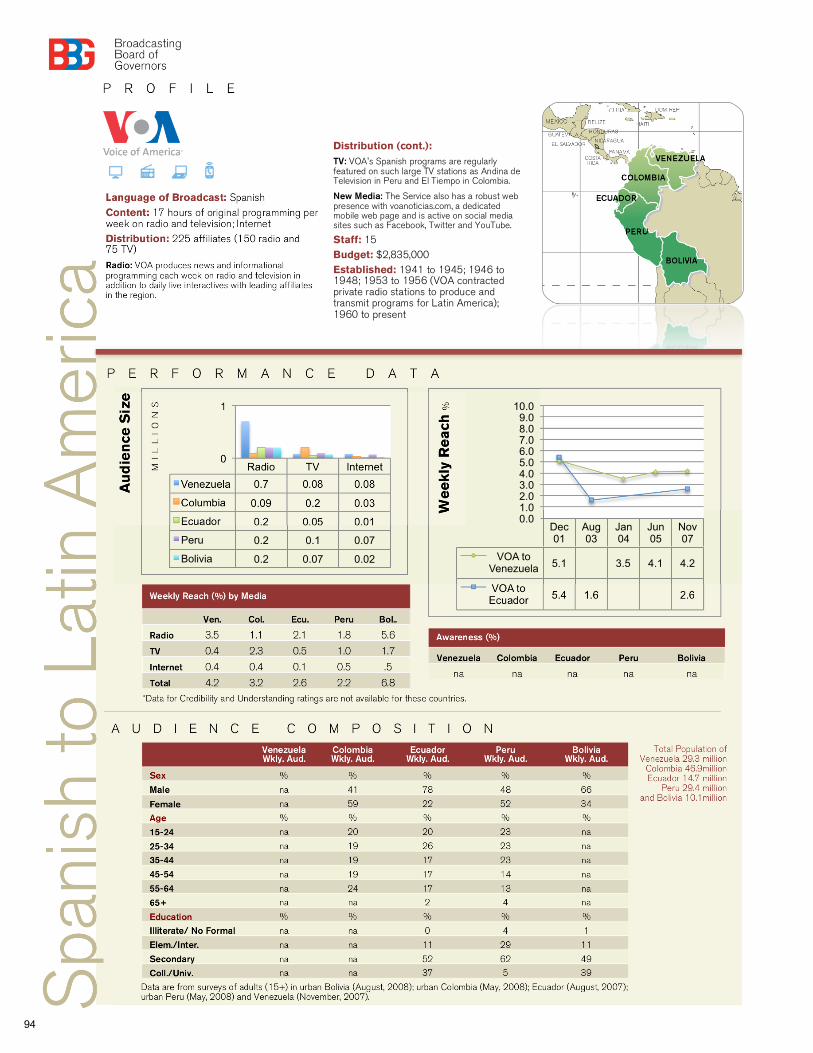
Language of Broadcast: Spanish Content: 17 hours of original programming per week on radio and television; Internet Distribution: 225 affiliates (150 radio and 75 TV)
Radio: VOA produces news and informational programming each week on radio and television in addition to daily live interactives with leading affiliates in the region.
Weekly Reach (%) by Media
Ven. Col. Ecu. Peru Bol..
Radio 3.5 1.1 2.1 1.8 5.6
TV 0.4 2.3 0.5 1.0 1.7
Internet 0.4 0.4 0.1 0.5 .5
Total 4.2 3.2 2.6 2.2 6.8
Awareness (%)
Venezuela Colombia Ecuador Peru Bolivia
na na na na na
Radio TV Internet
Venezuela 0.7 0.08 0.08
Columbia 0.09 0.2 0.03
Ecuador 0.2 0.05 0.01
Peru 0.2 0.1 0.07
Bolivia 0.2 0.07 0.02
0
1
Au
die
nce
Siz
e
Venezuela Wkly. Aud.
Colombia Wkly. Aud.
Ecuador Wkly. Aud.
Peru Wkly. Aud.
Bolivia Wkly. Aud.
Sex % % % % %
Male na 41 78 48 66
Female na 59 22 52 34
Age % % % % %
15-24 na 20 20 23 na
25-34 na 19 26 23 na
35-44 na 19 17 23 na
45-54 na 19 17 14 na
55-64 na 24 17 13 na
65+ na na 2 4 na
Education % % % % %
Illiterate/ No Formal na na 0 4 1
Elem./Inter. na na 11 29 11
Secondary na na 52 62 49
Coll./Univ. na na 37 5 39
Data are from surveys of adults (15+) in urban Bolivia (August, 2008); urban Colombia (May, 2008); Ecuador (August, 2007); urban Peru (May, 2008) and Venezuela (November, 2007).
MI
LL
IO
NS
We
ekly
Re
ach
%
Spa
nish
to L
atin
Am
eric
a
*Data for Credibility and Understanding ratings are not available for these countries.
Total Population of Venezuela 29.3 million
Colombia 46.9million Ecuador 14.7 million
Peru 29.4 million and Bolivia 10.1million
Distribution (cont.): TV: VOA's Spanish programs are regularly featured on such large TV stations as Andina de Television in Peru and El Tiempo in Colombia.
New Media: The Service also has a robust web presence with voanoticias.com, a dedicated mobile web page and is active on social media sites such as Facebook, Twitter and YouTube.
Staff: 15 Budget: $2,835,000 Established: 1941 to 1945; 1946 to 1948; 1953 to 1956 (VOA contracted private radio stations to produce and transmit programs for Latin America); 1960 to present
94
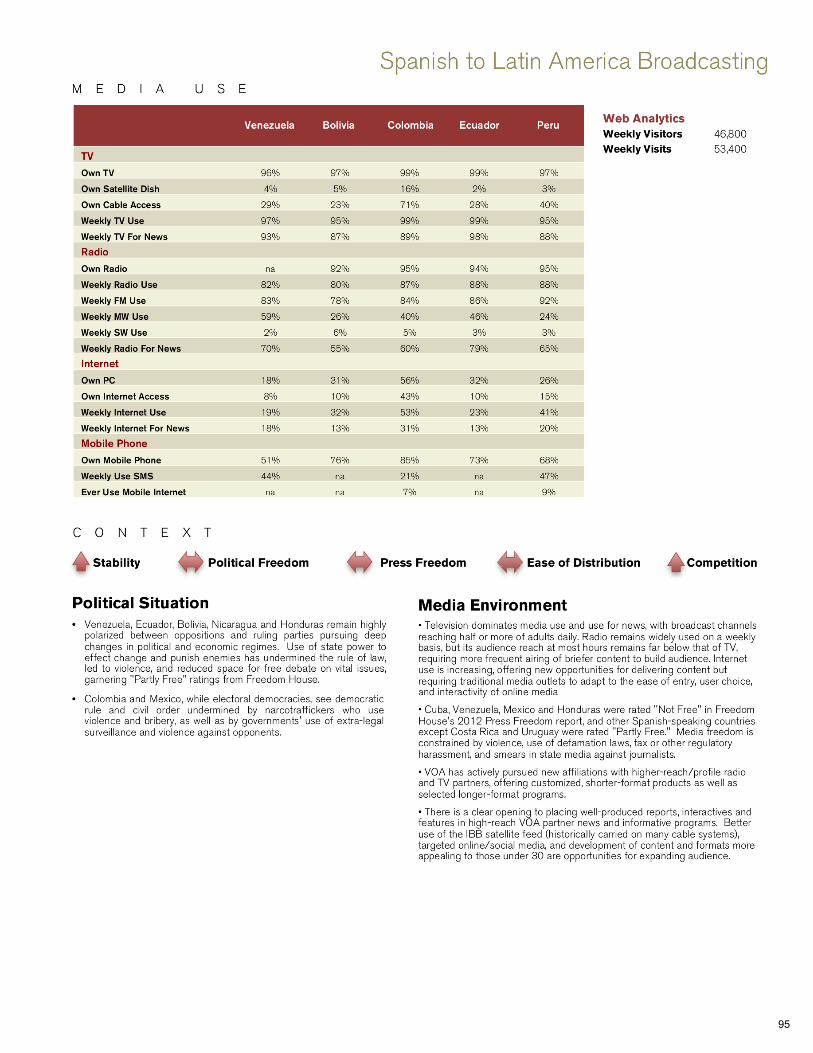
M E D I A U S E
Stability Political Freedom Press Freedom Ease of Distribution Competition
C O N T E X T
Political Situation • Venezuela, Ecuador, Bolivia, Nicaragua and Honduras remain highly
polarized between oppositions and ruling parties pursuing deep changes in political and economic regimes. Use of state power to effect change and punish enemies has undermined the rule of law, led to violence, and reduced space for free debate on vital issues, garnering "Partly Free" ratings from Freedom House.
• Colombia and Mexico, while electoral democracies, see democratic rule and civil order undermined by narcotraffickers who use violence and bribery, as well as by governments' use of extra-legal surveillance and violence against opponents.
Media Environment • Television dominates media use and use for news, with broadcast channels reaching half or more of adults daily. Radio remains widely used on a weekly basis, but its audience reach at most hours remains far below that of TV, requiring more frequent airing of briefer content to build audience. Internet use is increasing, offering new opportunities for delivering content but requiring traditional media outlets to adapt to the ease of entry, user choice, and interactivity of online media
• Cuba, Venezuela, Mexico and Honduras were rated "Not Free" in Freedom House's 2012 Press Freedom report, and other Spanish-speaking countries except Costa Rica and Uruguay were rated "Partly Free." Media freedom is constrained by violence, use of defamation laws, tax or other regulatory harassment, and smears in state media against journalists.
• VOA has actively pursued new affiliations with higher-reach/profile radio and TV partners, offering customized, shorter-format products as well as selected longer-format programs.
• There is a clear opening to placing well-produced reports, interactives and features in high-reach VOA partner news and informative programs. Better use of the IBB satellite feed (historically carried on many cable systems), targeted online/social media, and development of content and formats more appealing to those under 30 are opportunities for expanding audience.
Spanish to Latin America Broadcasting
Venezuela Bolivia Colombia Ecuador Peru
TV
Own TV 96% 97% 99% 99% 97%
Own Satellite Dish 4% 5% 16% 2% 3%
Own Cable Access 29% 23% 71% 28% 40%
Weekly TV Use 97% 95% 99% 99% 95%
Weekly TV For News 93% 87% 89% 98% 88%
Radio
Own Radio na 92% 95% 94% 95%
Weekly Radio Use 82% 80% 87% 88% 88%
Weekly FM Use 83% 78% 84% 86% 92%
Weekly MW Use 59% 26% 40% 46% 24%
Weekly SW Use 2% 6% 5% 3% 3%
Weekly Radio For News 70% 55% 60% 79% 65%
Internet
Own PC 18% 31% 56% 32% 26%
Own Internet Access 8% 10% 43% 10% 15%
Weekly Internet Use 19% 32% 53% 23% 41%
Weekly Internet For News 18% 13% 31% 13% 20%
Mobile Phone
Own Mobile Phone 51% 76% 85% 73% 68%
Weekly Use SMS 44% na 21% na 47%
Ever Use Mobile Internet na na 7% na 9%
Web Analytics Weekly Visitors 46,800 Weekly Visits 53,400
95
P R O F I L E
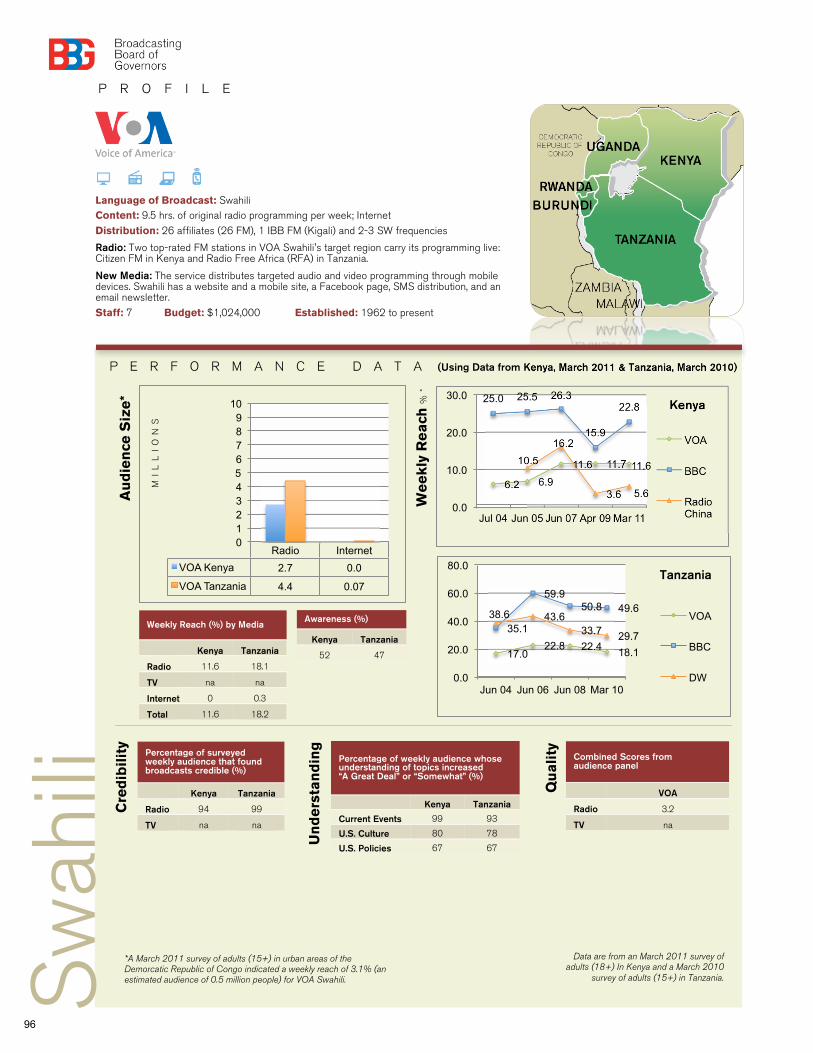
P E R F O R M A N C E D A T A (Using Data from Kenya, March 2011 & Tanzania, March 2010)
Language of Broadcast: Swahili Content: 9.5 hrs. of original radio programming per week; Internet
Distribution: 26 affiliates (26 FM), 1 IBB FM (Kigali) and 2-3 SW frequencies
Radio: Two top-rated FM stations in VOA Swahili's target region carry its programming live: Citizen FM in Kenya and Radio Free Africa (RFA) in Tanzania.
New Media: The service distributes targeted audio and video programming through mobile devices. Swahili has a website and a mobile site, a Facebook page, SMS distribution, and an email newsletter. Staff: 7 Budget: $1,024,000 Established: 1962 to present
Percentage of surveyed weekly audience that found broadcasts credible (%)
Kenya Tanzania
Radio 94 99
TV na na
Percentage of weekly audience whose understanding of topics increased “A Great Deal” or “Somewhat” (%)
Kenya Tanzania
Current Events 99 93
U.S. Culture 80 78
U.S. Policies 67 67
Combined Scores from audience panel
VOA
Radio 3.2
TV na
Cre
dib
ilit
y
Qu
ali
ty
Un
de
rsta
nd
ing
Weekly Reach (%) by Media
Kenya Tanzania
Radio 11.6 18.1
TV na na
Internet 0 0.3
Total 11.6 18.2
Awareness (%)
Kenya Tanzania
52 47
6.2 6.9
11.6 11.7 11.6
25.0 25.5 26.3
15.9
22.8
10.5
16.2
3.6 5.6 0.0
10.0
20.0
30.0
Jul 04 Jun 05 Jun 07 Apr 09 Mar 11
Kenya
VOA
BBC
Radio China
Radio Internet
VOA Kenya 2.7 0.0
VOA Tanzania 4.4 0.07
0 1 2 3 4 5 6 7 8 9
10
Au
die
nce
Siz
e*
Sw
ahili
17.0 22.8 22.4
18.1
35.1
59.9 50.8 49.6
38.6 43.6 33.7 29.7
0.0
20.0
40.0
60.0
80.0
Jun 04 Jun 06 Jun 08 Mar 10
Tanzania
VOA
BBC
DW
Data are from an March 2011 survey of adults (18+) In Kenya and a March 2010
survey of adults (15+) in Tanzania.
MI
LL
IO
NS
We
ek
ly R
ea
ch %
*
*A March 2011 survey of adults (15+) in urban areas of the Demorcatic Republic of Congo indicated a weekly reach of 3.1% (an estimated audience of 0.5 million people) for VOA Swahili.
96
A U D I E N C E C O M P O S I T I O N
Stability Political Freedom Press Freedom Ease of Distribution Competition
C O N T E X T
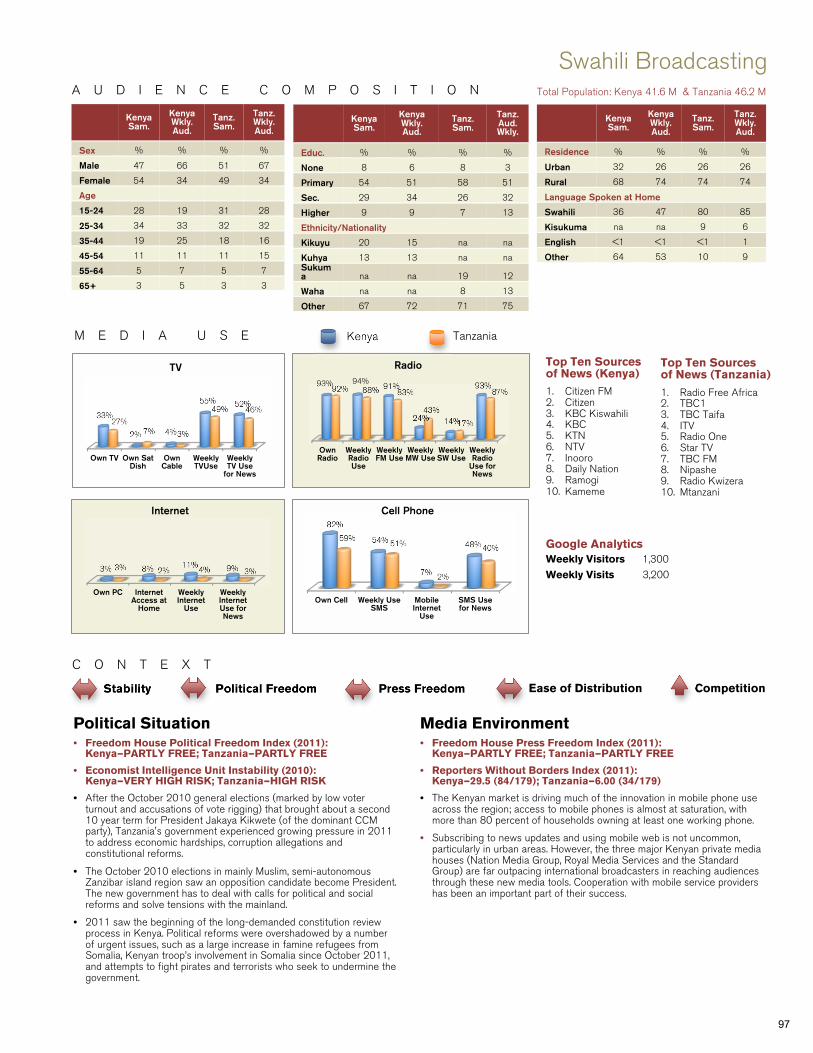
Swahili Broadcasting Total Population: Kenya 41.6 M & Tanzania 46.2 M
Top Ten Sources of News (Tanzania)
1. Radio Free Africa 2. TBC1 3. TBC Taifa 4. ITV 5. Radio One 6. Star TV 7. TBC FM 8. Nipashe 9. Radio Kwizera 10. Mtanzani
Political Situation • Freedom House Political Freedom Index (2011):
Kenya—PARTLY FREE; Tanzania—PARTLY FREE
• Economist Intelligence Unit Instability (2010): Kenya—VERY HIGH RISK; Tanzania—HIGH RISK
• After the October 2010 general elections (marked by low voter turnout and accusations of vote rigging) that brought about a second 10 year term for President Jakaya Kikwete (of the dominant CCM party), Tanzania's government experienced growing pressure in 2011 to address economic hardships, corruption allegations and constitutional reforms.
• The October 2010 elections in mainly Muslim, semi-autonomous Zanzibar island region saw an opposition candidate become President. The new government has to deal with calls for political and social reforms and solve tensions with the mainland.
• 2011 saw the beginning of the long-demanded constitution review process in Kenya. Political reforms were overshadowed by a number of urgent issues, such as a large increase in famine refugees from Somalia, Kenyan troop’s involvement in Somalia since October 2011, and attempts to fight pirates and terrorists who seek to undermine the government.
Own TV Own Sat Dish
Own Cable
Weekly TVUse
Weekly TV Use
for News
33%
2% 4%
55% 52%
27% 7% 3%
49% 46%
TV
Own Radio
Weekly Radio Use
Weekly FM Use
Weekly MW Use
Weekly SW Use
Weekly Radio
Use for News
93% 94% 91%
24% 14%
93% 92% 88% 83%
43%
17%
87%
Radio
Own PC Internet Access at
Home
Weekly Internet
Use
Weekly Internet Use for News
3% 8% 11% 9% 3% 2% 4% 3%
Internet
Own Cell Weekly Use SMS
Mobile Internet
Use
SMS Use for News
82%
54%
7%
48% 59%
51%
2%
40%
Cell Phone
M E D I A U S E Kenya Tanzania
Top Ten Sources of News (Kenya) 1. Citizen FM 2. Citizen 3. KBC Kiswahili 4. KBC 5. KTN 6. NTV 7. Inooro 8. Daily Nation 9. Ramogi 10. Kameme
Kenya Sam.
Kenya Wkly. Aud.
Tanz. Sam.
Tanz. Wkly. Aud.
Sex % % % %
Male 47 66 51 67
Female 54 34 49 34
Age
15-24 28 19 31 28
25-34 34 33 32 32
35-44 19 25 18 16
45-54 11 11 11 15
55-64 5 7 5 7
65+ 3 5 3 3
Kenya Sam.
Kenya Wkly. Aud.
Tanz. Sam.
Tanz. Aud. Wkly.
Educ. % % % %
None 8 6 8 3
Primary 54 51 58 51
Sec. 29 34 26 32
Higher 9 9 7 13
Ethnicity/Nationality
Kikuyu 20 15 na na
Kuhya 13 13 na na Sukuma na na 19 12
Waha na na 8 13
Other 67 72 71 75
Kenya Sam.
Kenya Wkly. Aud.
Tanz. Sam.
Tanz. Wkly. Aud.
Residence % % % %
Urban 32 26 26 26
Rural 68 74 74 74
Language Spoken at Home
Swahili 36 47 80 85
Kisukuma na na 9 6
English <1 <1 <1 1
Other 64 53 10 9
Media Environment • Freedom House Press Freedom Index (2011):
Kenya—PARTLY FREE; Tanzania—PARTLY FREE
• Reporters Without Borders Index (2011): Kenya—29.5 (84/179); Tanzania—6.00 (34/179)
• The Kenyan market is driving much of the innovation in mobile phone use across the region; access to mobile phones is almost at saturation, with more than 80 percent of households owning at least one working phone.
• Subscribing to news updates and using mobile web is not uncommon, particularly in urban areas. However, the three major Kenyan private media houses (Nation Media Group, Royal Media Services and the Standard Group) are far outpacing international broadcasters in reaching audiences through these new media tools. Cooperation with mobile service providers has been an important part of their success.
Google Analytics Weekly Visitors 1,300
Weekly Visits 3,200
97
P R O F I L E
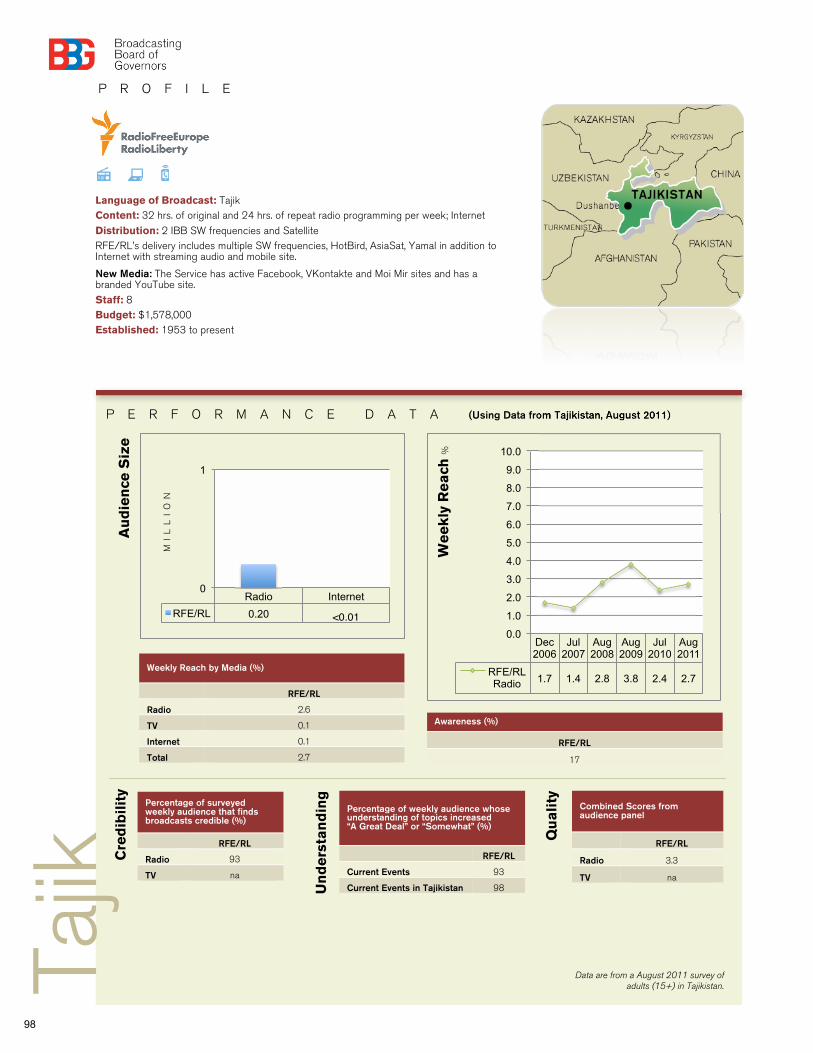
P E R F O R M A N C E D A T A (Using Data from Tajikistan, August 2011)
Language of Broadcast: Tajik Content: 32 hrs. of original and 24 hrs. of repeat radio programming per week; Internet
Distribution: 2 IBB SW frequencies and Satellite RFE/RL’s delivery includes multiple SW frequencies, HotBird, AsiaSat, Yamal in addition to Internet with streaming audio and mobile site.
New Media: The Service has active Facebook, VKontakte and Moi Mir sites and has a branded YouTube site.
Staff: 8 Budget: $1,578,000 Established: 1953 to present
Percentage of surveyed weekly audience that finds broadcasts credible (%)
RFE/RL
Radio 93
TV na
Percentage of weekly audience whose understanding of topics increased “A Great Deal” or “Somewhat” (%)
RFE/RL
Current Events 93
Current Events in Tajikistan 98
Combined Scores from audience panel
RFE/RL
Radio 3.3
TV na
Cre
dib
ilit
y
Tajik
Qu
ali
ty
Un
de
rsta
nd
ing
Weekly Reach by Media (%)
RFE/RL
Radio 2.6
TV 0.1
Internet 0.1
Total 2.7
Awareness (%)
RFE/RL
17
Dec 2006
Jul 2007
Aug 2008
Aug 2009
Jul 2010
Aug 2011
RFE/RL Radio 1.7 1.4 2.8 3.8 2.4 2.7
0.0
1.0
2.0
3.0
4.0
5.0
6.0
7.0
8.0
9.0
10.0
Radio Internet
RFE/RL 0.20
0
1
Au
die
nce
Siz
e
MI
LL
IO
N
We
ek
ly R
ea
ch %
Data are from a August 2011 survey of adults (15+) in Tajikistan.
<0.01
98
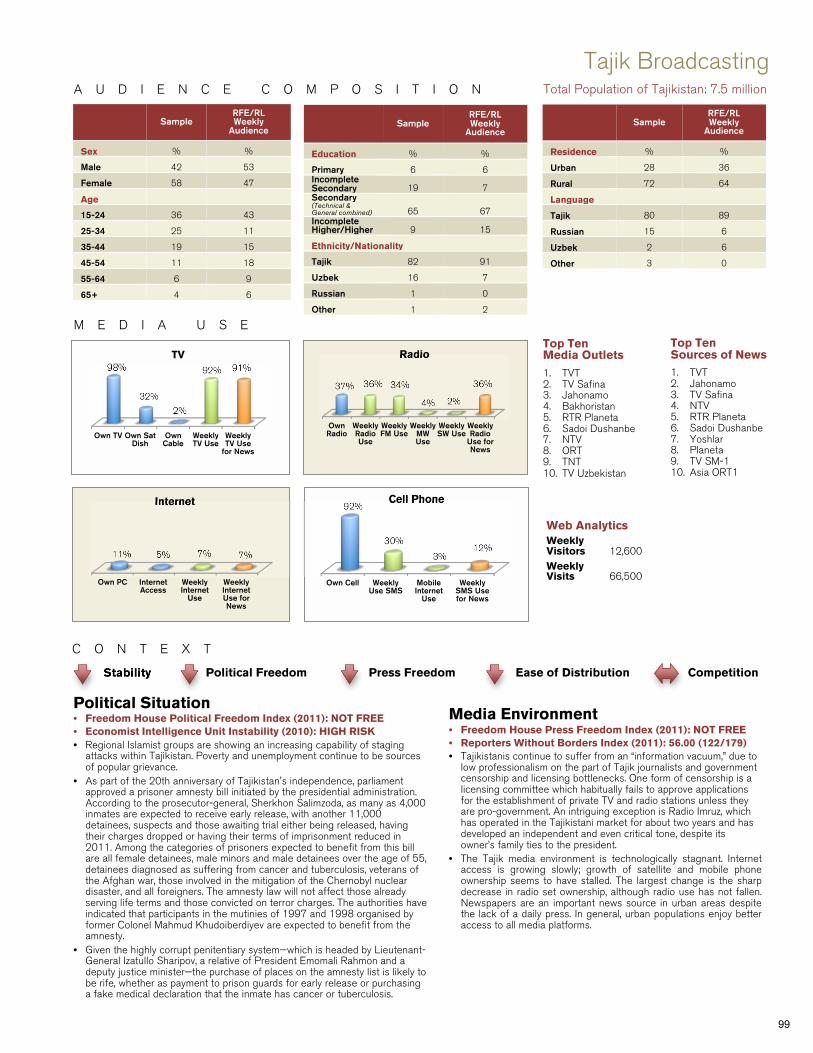
A U D I E N C E C O M P O S I T I O N
C O N T E X T
Stability Political Freedom Press Freedom Ease of Distribution Competition
Sample RFE/RL Weekly
Audience
Sex % %
Male 42 53
Female 58 47
Age
15-24 36 43
25-34 25 11
35-44 19 15
45-54 11 18
55-64 6 9
65+ 4 6
Sample RFE/RL Weekly
Audience
Education % %
Primary 6 6 Incomplete Secondary 19 7 Secondary (Technical & General combined) 65 67 Incomplete Higher/Higher 9 15
Ethnicity/Nationality
Tajik 82 91
Uzbek 16 7
Russian 1 0
Other 1 2
Sample RFE/RL Weekly
Audience
Residence % %
Urban 28 36
Rural 72 64
Language
Tajik 80 89
Russian 15 6
Uzbek 2 6
Other 3 0
Tajik Broadcasting Total Population of Tajikistan: 7.5 million
Own TV Own Sat Dish
Own Cable
Weekly TV Use
Weekly TV Use
for News
98%
32%
2%
92% 91% TV
Own Cell Weekly Use SMS
Mobile Internet
Use
Weekly SMS Use for News
92%
30%
3% 12%
Cell Phone
Top Ten Media Outlets
1. TVT 2. TV Safina 3. Jahonamo 4. Bakhoristan 5. RTR Planeta 6. Sadoi Dushanbe 7. NTV 8. ORT 9. TNT 10. TV Uzbekistan
Political Situation • Freedom House Political Freedom Index (2011): NOT FREE • Economist Intelligence Unit Instability (2010): HIGH RISK • Regional Islamist groups are showing an increasing capability of staging
attacks within Tajikistan. Poverty and unemployment continue to be sources of popular grievance.
• As part of the 20th anniversary of Tajikistan's independence, parliament approved a prisoner amnesty bill initiated by the presidential administration. According to the prosecutor-general, Sherkhon Salimzoda, as many as 4,000 inmates are expected to receive early release, with another 11,000 detainees, suspects and those awaiting trial either being released, having their charges dropped or having their terms of imprisonment reduced in 2011. Among the categories of prisoners expected to benefit from this bill are all female detainees, male minors and male detainees over the age of 55, detainees diagnosed as suffering from cancer and tuberculosis, veterans of the Afghan war, those involved in the mitigation of the Chernobyl nuclear disaster, and all foreigners. The amnesty law will not affect those already serving life terms and those convicted on terror charges. The authorities have indicated that participants in the mutinies of 1997 and 1998 organised by former Colonel Mahmud Khudoiberdiyev are expected to benefit from the amnesty.
• Given the highly corrupt penitentiary system—which is headed by Lieutenant-General Izatullo Sharipov, a relative of President Emomali Rahmon and a deputy justice minister—the purchase of places on the amnesty list is likely to be rife, whether as payment to prison guards for early release or purchasing a fake medical declaration that the inmate has cancer or tuberculosis.
M E D I A U S E
Media Environment • Freedom House Press Freedom Index (2011): NOT FREE • Reporters Without Borders Index (2011): 56.00 (122/179) • Tajikistanis continue to suffer from an “information vacuum,” due to
low professionalism on the part of Tajik journalists and government censorship and licensing bottlenecks. One form of censorship is a licensing committee which habitually fails to approve applications for the establishment of private TV and radio stations unless they are pro-government. An intriguing exception is Radio Imruz, which has operated in the Tajikistani market for about two years and has developed an independent and even critical tone, despite its owner’s family ties to the president.
• The Tajik media environment is technologically stagnant. Internetaccess is growing slowly; growth of satellite and mobile phoneownership seems to have stalled. The largest change is the sharpdecrease in radio set ownership, although radio use has not fallen.Newspapers are an important news source in urban areas despitethe lack of a daily press. In general, urban populations enjoy betteraccess to all media platforms.
Own Radio
Weekly Radio Use
Weekly FM Use
Weekly MW Use
Weekly SW Use
Weekly Radio
Use for News
37% 36% 34%
4% 2%
36%
Radio
Own PC Internet Access
Weekly Internet
Use
Weekly Internet Use for News
11% 5% 7% 7%
Internet
Top Ten Sources of News 1. TVT 2. Jahonamo 3. TV Safina 4. NTV 5. RTR Planeta 6. Sadoi Dushanbe 7. Yoshlar 8. Planeta 9. TV SM-1 10. Asia ORT1
Web Analytics Weekly Visitors 12,600 Weekly Visits 66,500
99
P R O F I L E
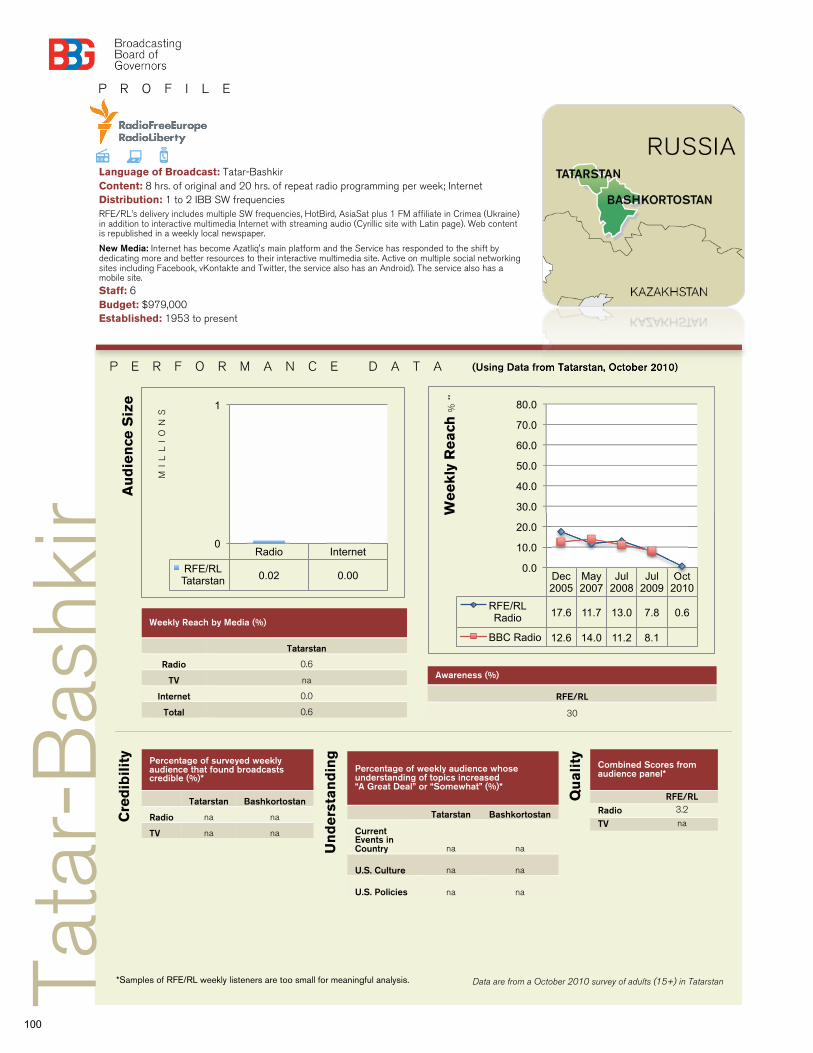
P E R F O R M A N C E D A T A (Using Data from Tatarstan, October 2010)
Language of Broadcast: Tatar-Bashkir Content: 8 hrs. of original and 20 hrs. of repeat radio programming per week; Internet Distribution: 1 to 2 IBB SW frequencies RFE/RL’s delivery includes multiple SW frequencies, HotBird, AsiaSat plus 1 FM affiliate in Crimea (Ukraine) in addition to interactive multimedia Internet with streaming audio (Cyrillic site with Latin page). Web content is republished in a weekly local newspaper.
New Media: Internet has become Azatliq's main platform and the Service has responded to the shift by dedicating more and better resources to their interactive multimedia site. Active on multiple social networking sites including Facebook, vKontakte and Twitter, the service also has an Android). The service also has a mobile site. Staff: 6 Budget: $979,000 Established: 1953 to present
Percentage of surveyed weekly audience that found broadcasts credible (%)*
Tatarstan Bashkortostan
Radio na na
TV na na
Percentage of weekly audience whose understanding of topics increased “A Great Deal” or “Somewhat” (%)*
Tatarstan Bashkortostan
Current Events in Country na na
U.S. Culture na na
U.S. Policies na na
Combined Scores from audience panel*
RFE/RL Radio 3.2
TV na Cre
dib
ilit
y
Qu
ali
ty
Un
de
rsta
nd
ing
*Samples of RFE/RL weekly listeners are too small for meaningful analysis.
Radio Internet
RFE/RL Tatarstan 0.02 0.00
0
1
Au
die
nce
Siz
e
Tata
r-B
ashk
ir
Data are from a October 2010 survey of adults (15+) in Tatarstan
Dec 2005
May 2007
Jul 2008
Jul 2009
Oct 2010
RFE/RL Radio 17.6 11.7 13.0 7.8 0.6
BBC Radio 12.6 14.0 11.2 8.1
0.0
10.0
20.0
30.0
40.0
50.0
60.0
70.0
80.0
Awareness (%)
RFE/RL
30
Weekly Reach by Media (%)
Tatarstan
Radio 0.6
TV na
Internet 0.0
Total 0.6
We
ek
ly R
ea
ch %
**
MI
LL
IO
NS
100
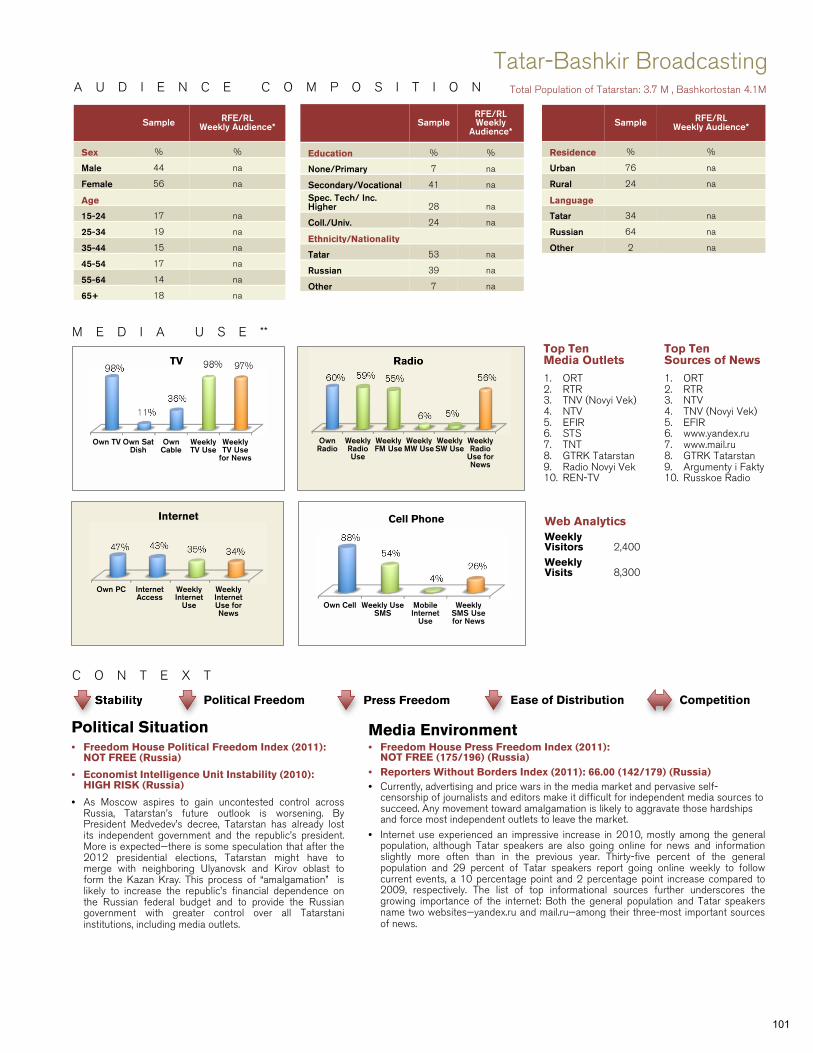
Sample RFE/RL Weekly
Audience*
Education % %
None/Primary 7 na
Secondary/Vocational 41 na Spec. Tech/ Inc. Higher 28 na
Coll./Univ. 24 na
Ethnicity/Nationality
Tatar 53 na
Russian 39 na
Other 7 na
A U D I E N C E C O M P O S I T I O N
C O N T E X T
Tatar-Bashkir Broadcasting Total Population of Tatarstan: 3.7 M , Bashkortostan 4.1M
Top Ten Sources of News
1. ORT 2. RTR 3. NTV 4. TNV (Novyi Vek) 5. EFIR 6. www.yandex.ru 7. www.mail.ru 8. GTRK Tatarstan 9. Argumenty i Fakty 10. Russkoe Radio
Political Situation • Freedom House Political Freedom Index (2011):
NOT FREE (Russia)
• Economist Intelligence Unit Instability (2010): HIGH RISK (Russia)
• As Moscow aspires to gain uncontested control across Russia, Tatarstan’s future outlook is worsening. By President Medvedev’s decree, Tatarstan has already lost its independent government and the republic’s president. More is expected—there is some speculation that after the 2012 presidential elections, Tatarstan might have to merge with neighboring Ulyanovsk and Kirov oblast to form the Kazan Kray. This process of “amalgamation” is likely to increase the republic’s financial dependence on the Russian federal budget and to provide the Russian government with greater control over all Tatarstani institutions, including media outlets.
Top Ten Media Outlets
1. ORT 2. RTR 3. TNV (Novyi Vek) 4. NTV 5. EFIR 6. STS 7. TNT 8. GTRK Tatarstan 9. Radio Novyi Vek 10. REN-TV
Media Environment • Freedom House Press Freedom Index (2011):
NOT FREE (175/196) (Russia) • Reporters Without Borders Index (2011): 66.00 (142/179) (Russia) • Currently, advertising and price wars in the media market and pervasive self-
censorship of journalists and editors make it difficult for independent media sources to succeed. Any movement toward amalgamation is likely to aggravate those hardships and force most independent outlets to leave the market.
• Internet use experienced an impressive increase in 2010, mostly among the generalpopulation, although Tatar speakers are also going online for news and informationslightly more often than in the previous year. Thirty-five percent of the generalpopulation and 29 percent of Tatar speakers report going online weekly to followcurrent events, a 10 percentage point and 2 percentage point increase compared to2009, respectively. The list of top informational sources further underscores thegrowing importance of the internet: Both the general population and Tatar speakersname two websites—yandex.ru and mail.ru—among their three-most important sourcesof news.
Stability Political Freedom Press Freedom Ease of Distribution Competition
Sample RFE/RL Weekly Audience*
Sex % %
Male 44 na
Female 56 na
Age
15-24 17 na
25-34 19 na
35-44 15 na
45-54 17 na
55-64 14 na
65+ 18 na
Sample RFE/RL Weekly Audience*
Residence % %
Urban 76 na
Rural 24 na
Language
Tatar 34 na
Russian 64 na
Other 2 na
M E D I A U S E **
Own TV Own Sat Dish
Own Cable
Weekly TV Use
Weekly TV Use
for News
98%
11% 36%
98% 97% TV
Own Radio
Weekly Radio Use
Weekly FM Use
Weekly MW Use
Weekly SW Use
Weekly Radio
Use for News
60% 59% 55%
6% 5%
56%
Radio
Own PC Internet Access
Weekly Internet
Use
Weekly Internet Use for News
47% 43% 35% 34%
Internet
Own Cell Weekly Use SMS
Mobile Internet
Use
Weekly SMS Use for News
88%
54%
4% 26%
Cell Phone Web Analytics Weekly Visitors 2,400 Weekly Visits 8,300
101
P R O F I L E
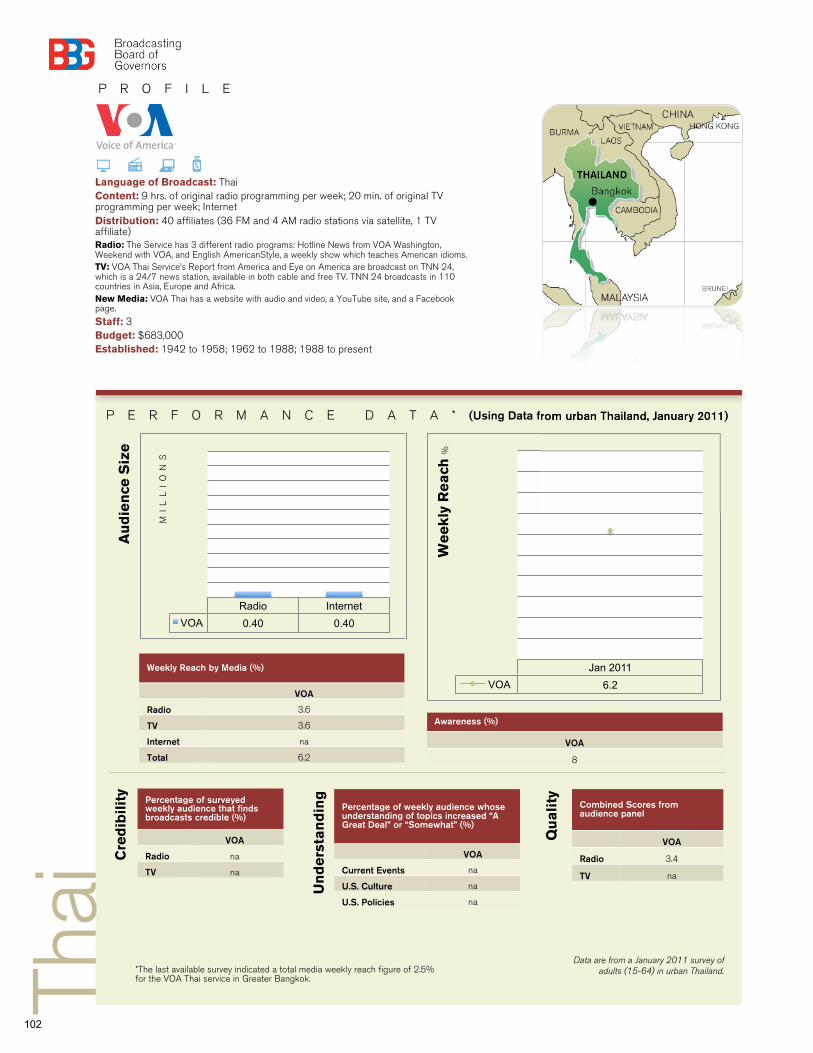
P E R F O R M A N C E D A T A * (Using Data from urban Thailand, January 2011)
Language of Broadcast: Thai Content: 9 hrs. of original radio programming per week; 20 min. of original TV programming per week; Internet Distribution: 40 affiliates (36 FM and 4 AM radio stations via satellite, 1 TV affiliate) Radio: The Service has 3 different radio programs: Hotline News from VOA Washington, Weekend with VOA, and English AmericanStyle, a weekly show which teaches American idioms. TV: VOA Thai Service’s Report from America and Eye on America are broadcast on TNN 24, which is a 24/7 news station, available in both cable and free TV. TNN 24 broadcasts in 110 countries in Asia, Europe and Africa. New Media: VOA Thai has a website with audio and video, a YouTube site, and a Facebook page.
Staff: 3 Budget: $683,000 Established: 1942 to 1958; 1962 to 1988; 1988 to present
Percentage of surveyed weekly audience that finds broadcasts credible (%)
VOA
Radio na
TV na
Percentage of weekly audience whose understanding of topics increased “A Great Deal” or “Somewhat” (%)
VOA
Current Events na
U.S. Culture na
U.S. Policies na
Combined Scores from audience panel
VOA
Radio 3.4
TV na
Cre
dib
ilit
y
Thai
Qu
ali
ty
Un
de
rsta
nd
ing
*The last available survey indicated a total media weekly reach figure of 2.5% for the VOA Thai service in Greater Bangkok.
Weekly Reach by Media (%)
VOA
Radio 3.6
TV 3.6
Internet na
Total 6.2
Awareness (%)
VOA
8
Jan 2011
VOA 6.2
Radio Internet
VOA 0.40 0.40
Au
die
nce
Siz
e
MI
LL
IO
NS
We
ek
ly R
ea
ch %
Data are from a January 2011 survey of adults (15-64) in urban Thailand.
102
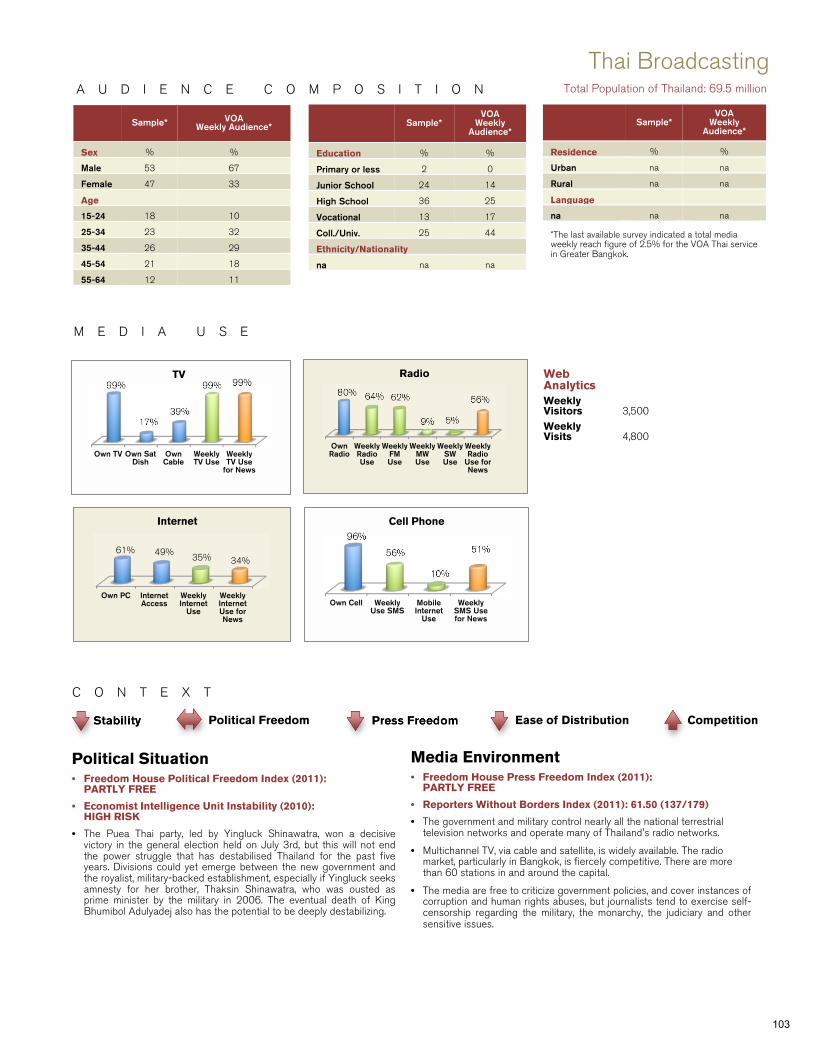
A U D I E N C E C O M P O S I T I O N
C O N T E X T
Stability Political Freedom Press Freedom Ease of Distribution Competition
Sample* VOA Weekly Audience*
Sex % %
Male 53 67
Female 47 33
Age
15-24 18 10
25-34 23 32
35-44 26 29
45-54 21 18
55-64 12 11
Sample* VOA
Weekly Audience*
Education % %
Primary or less 2 0
Junior School 24 14
High School 36 25
Vocational 13 17
Coll./Univ. 25 44
Ethnicity/Nationality
na na na
Sample* VOA
Weekly Audience*
Residence % %
Urban na na
Rural na na
Language
na na na *The last available survey indicated a total media weekly reach figure of 2.5% for the VOA Thai service in Greater Bangkok.
Thai Broadcasting Total Population of Thailand: 69.5 million
Political Situation • Freedom House Political Freedom Index (2011):
PARTLY FREE
• Economist Intelligence Unit Instability (2010): HIGH RISK
• The Puea Thai party, led by Yingluck Shinawatra, won a decisive victory in the general election held on July 3rd, but this will not end the power struggle that has destabilised Thailand for the past five years. Divisions could yet emerge between the new government and the royalist, military-backed establishment, especially if Yingluck seeks amnesty for her brother, Thaksin Shinawatra, who was ousted as prime minister by the military in 2006. The eventual death of King Bhumibol Adulyadej also has the potential to be deeply destabilizing.
M E D I A U S E
Media Environment • Freedom House Press Freedom Index (2011):
PARTLY FREE
• Reporters Without Borders Index (2011): 61.50 (137/179)
• The government and military control nearly all the national terrestrial television networks and operate many of Thailand's radio networks.
• Multichannel TV, via cable and satellite, is widely available. The radio market, particularly in Bangkok, is fiercely competitive. There are more than 60 stations in and around the capital.
• The media are free to criticize government policies, and cover instances ofcorruption and human rights abuses, but journalists tend to exercise self-censorship regarding the military, the monarchy, the judiciary and othersensitive issues.
Web Analytics Weekly Visitors 3,500 Weekly Visits 4,800
Own TV Own Sat Dish
Own Cable
Weekly TV Use
Weekly TV Use
for News
99%
17% 39%
99% 99% TV
Own Cell Weekly Use SMS
Mobile Internet
Use
Weekly SMS Use for News
96%
56%
10%
51%
Cell Phone
Own Radio
Weekly Radio Use
Weekly FM Use
Weekly MW Use
Weekly SW Use
Weekly Radio
Use for News
80% 64% 62%
9% 5%
56%
Radio
Own PC Internet Access
Weekly Internet
Use
Weekly Internet Use for News
61% 49% 35% 34%
Internet
103
P R O F I L E
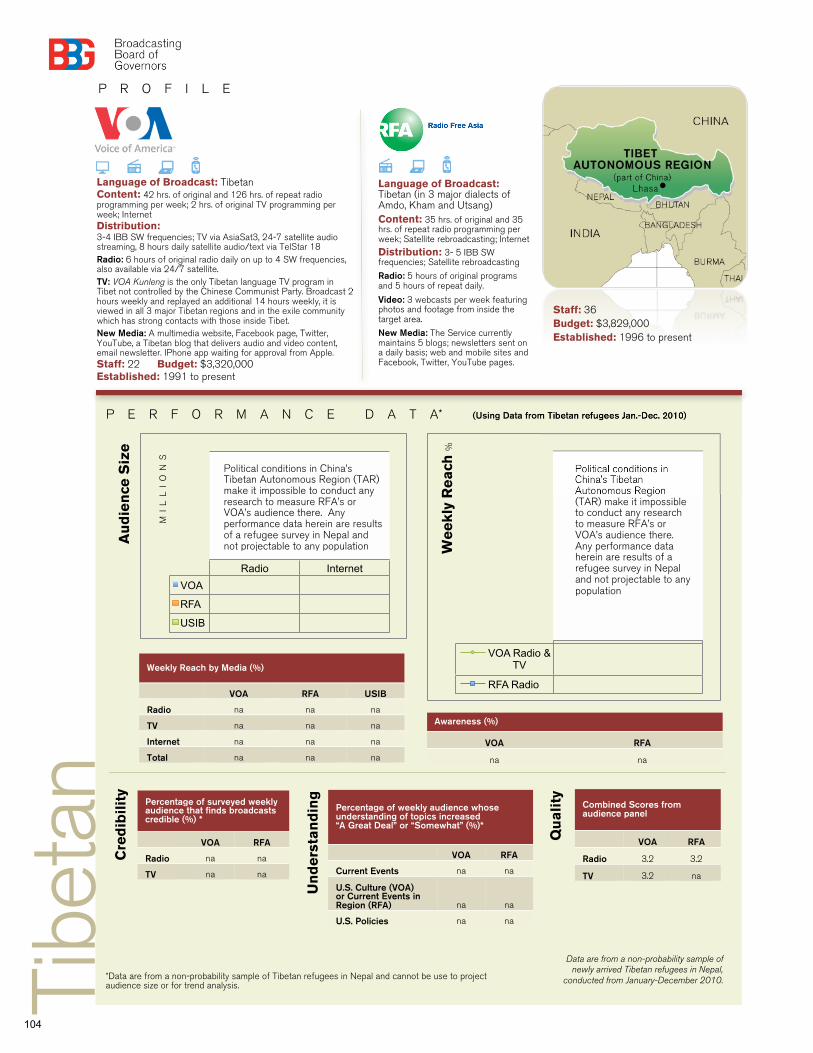
P E R F O R M A N C E D A T A* (Using Data from Tibetan refugees Jan.-Dec. 2010)
Language of Broadcast: Tibetan Content: 42 hrs. of original and 126 hrs. of repeat radio programming per week; 2 hrs. of original TV programming per week; Internet Distribution: 3-4 IBB SW frequencies; TV via AsiaSat3, 24-7 satellite audio streaming, 8 hours daily satellite audio/text via TelStar 18 Radio: 6 hours of original radio daily on up to 4 SW frequencies, also available via 24/7 satellite. TV: VOA Kunleng is the only Tibetan language TV program in Tibet not controlled by the Chinese Communist Party. Broadcast 2 hours weekly and replayed an additional 14 hours weekly, it is viewed in all 3 major Tibetan regions and in the exile community which has strong contacts with those inside Tibet. New Media: A multimedia website, Facebook page, Twitter, YouTube, a Tibetan blog that delivers audio and video content, email newsletter. IPhone app waiting for approval from Apple. Staff: 22 Budget: $3,320,000 Established: 1991 to present
Language of Broadcast: Tibetan (in 3 major dialects of Amdo, Kham and Utsang) Content: 35 hrs. of original and 35 hrs. of repeat radio programming per week; Satellite rebroadcasting; Internet Distribution: 3- 5 IBB SW frequencies; Satellite rebroadcasting Radio: 5 hours of original programs and 5 hours of repeat daily.
Video: 3 webcasts per week featuring photos and footage from inside the target area.
New Media: The Service currently maintains 5 blogs; newsletters sent on a daily basis; web and mobile sites and Facebook, Twitter, YouTube pages.
Percentage of surveyed weekly audience that finds broadcasts credible (%) *
VOA RFA
Radio na na
TV na na
Percentage of weekly audience whose understanding of topics increased “A Great Deal” or “Somewhat” (%)*
VOA RFA
Current Events na na
U.S. Culture (VOA) or Current Events in Region (RFA) na na
U.S. Policies na na
Combined Scores from audience panel
VOA RFA
Radio 3.2 3.2
TV 3.2 na
Cre
dib
ilit
y
Tibe
tan
Qu
ali
ty
Un
de
rsta
nd
ing
*Data are from a non-probability sample of Tibetan refugees in Nepal and cannot be use to project audience size or for trend analysis.
Weekly Reach by Media (%)
VOA RFA USIB
Radio na na na
TV na na na
Internet na na na
Total na na na
Awareness (%)
VOA RFA
na na
VOA Radio & TV
RFA Radio
Radio Internet
VOA
RFA
USIB
Au
die
nce
Siz
e
MI
LL
IO
NS
We
ek
ly R
ea
ch %
Data are from a non-probability sample of newly arrived Tibetan refugees in Nepal,
conducted from January-December 2010.
Political conditions in China’s Tibetan Autonomous Region (TAR) make it impossible to conduct any research to measure RFA’s or VOA’s audience there. Any performance data herein are results of a refugee survey in Nepal and not projectable to any population
Political conditions in China’s Tibetan Autonomous Region (TAR) make it impossible to conduct any research to measure RFA’s or VOA’s audience there. Any performance data herein are results of a refugee survey in Nepal and not projectable to any population
Staff: 36 Budget: $3,829,000 Established: 1996 to present
104
A U D I E N C E C O M P O S I T I O N **
C O N T E X T
Stability Political Freedom Press Freedom Ease of Distribution Competition
Sample VOA
Weekly Aud.
RFA Weekly
Aud.
Sex % % %
Male na na na
Female na na na
Age
15-29 na na na
30-44 na na na
45-59 na na na
60+ na na na
Sample VOA
Weekly Aud.
RFA Weekly
Aud.
Education % % %
None/Informal na na na
Elementary na na na
Secondary na na na
Coll./Univ. na na na
Monastic na na na
Region of Origin
Amdo na na na
Kham na na na
Utsang na na na
Sample VOA
Weekly Aud.
RFA Weekly
Aud.
Residence % % %
Urban na na na
Rural na na na
Nomadic na na na
Language
na na na na **Official 2000 census data suggest 2.4 million of the 5.4 million Tibetans in the PRC live in the Tibetan Autonomous Region (TAR), which consists of the provinces of Amdo, Khamke and Utsang.
Tibetan Broadcasting Total Population of Tibet Province: See note**
Political Situation • Freedom House Political Freedom Index (2011):
NOT FREE (China) • Economist Intelligence Unit Instability (2010):
MODERATE RISK (China) • Thirty-five Tibetans are confirmed to have self-immolated since February 27,
2009, to protest against Chinese rule. In response, Beijing has stepped up security in Tibetan-populated areas, ramped up “patriotic education” in schools and monasteries, and launched concerted attacks against the Dalai Lama as the mastermind behind the self-immolations.
• Throughout the Tibetan autonomous areas of the PRC and beyond, there are intensified jamming efforts and increased restrictions on access to foreign news websites. In domestic media outlets, the government has increased censorship and manipulation of the press and the internet; new interpretations of criminal laws have been used to limit discussions deemed as passing of intelligence injurious to the state.
• According to the State Department’s 2010 Human Rights Report, “The government continued its severe cultural and religious repression of ethnic minorities in Xinjiang Uighur Autonomous Region (XUAR) and Tibetan areas.”
• A few months after the 2008 protests the preceded the Beijing Olympics, authorities announced severe penalties for spreading and listening to ‘rumors.’ Although article 35 of the PRC constitution guarantees freedom of speech, assembly, association and publication, such provisions are subordinated to the “national interest.”
• Key Tibetan cultural leaders including writers, artists and educators continued to be arrested and prosecuted in 2010. Notable among these was Tragyal (Shogdung) arrested for inciting “splittism” after the release of his book critical of Chinese Tibetan policies. Kunchok Tsephel was sentenced to 15 years charged with disclosing state secrets related to his literary website Chodme ‘butter lamp.’
M E D I A U S E
Media Environment • Freedom House Press Freedom Index (2011):
NOT FREE (China) • Reporters Without Borders Index (2011): 136.00
(174/179) (China) • Virtually all Chinese media sources are owned by the state. Xinhua, the
official news agency, has the status of a government ministry. Recognizing the importance and potency of information, authorities have vigorously pursued a policy of expansion of domestic media offerings to compete with and, in many cases, overwhelm external sources.
• Control of information has intensified and broadened to include electronic/new media sources as well as traditional print and broadcast media outlets. There is increased censorship and manipulation of the press and the Internet.
• Authorities have increased the number of Tibetan language broadcasts on television and radio, as well as the number of Tibetan-language newspapers.
• PRC authorities in Tibet continue to spend significant amounts on radio jamming and hindering access to satellite television. Poor reception and jamming continue to be the biggest obstacles to audience growth in Tibet. The vast majority of regular listeners to VOA and RFA report their broadcasts are “not clear” or are difficult to hear.
• Authorities continue to crack down on the use of large satellite dishes, which most easily receive foreign broadcasts, replacing them with cable access or smaller Ku-band dishes.
• Recent research suggests that portable electronic media – including DVDs are a key source of information for Tibetans and anecdotal evidence suggests that recordings of VOA Tibetan television and USIB radio programs are spread this way.
Web Analytics VOA Weekly Visitors 7,000 Weekly Visits 20,800
RFA Weekly Visitors 5,900 Weekly Visits 12,900 Analysis of refugee data -- while not necessarily representative of the home Tibetan population - suggests
that access to media -different than in the rest of China. Only 5% of Tibetan refugees, for example, reported weekly Internet access while 49% reported having satellite TV access.
TV Radio Internet Cell Phone
Media use data is not available.
Media use data is not available.
Media use data is not available.
Media use data is not available.
105
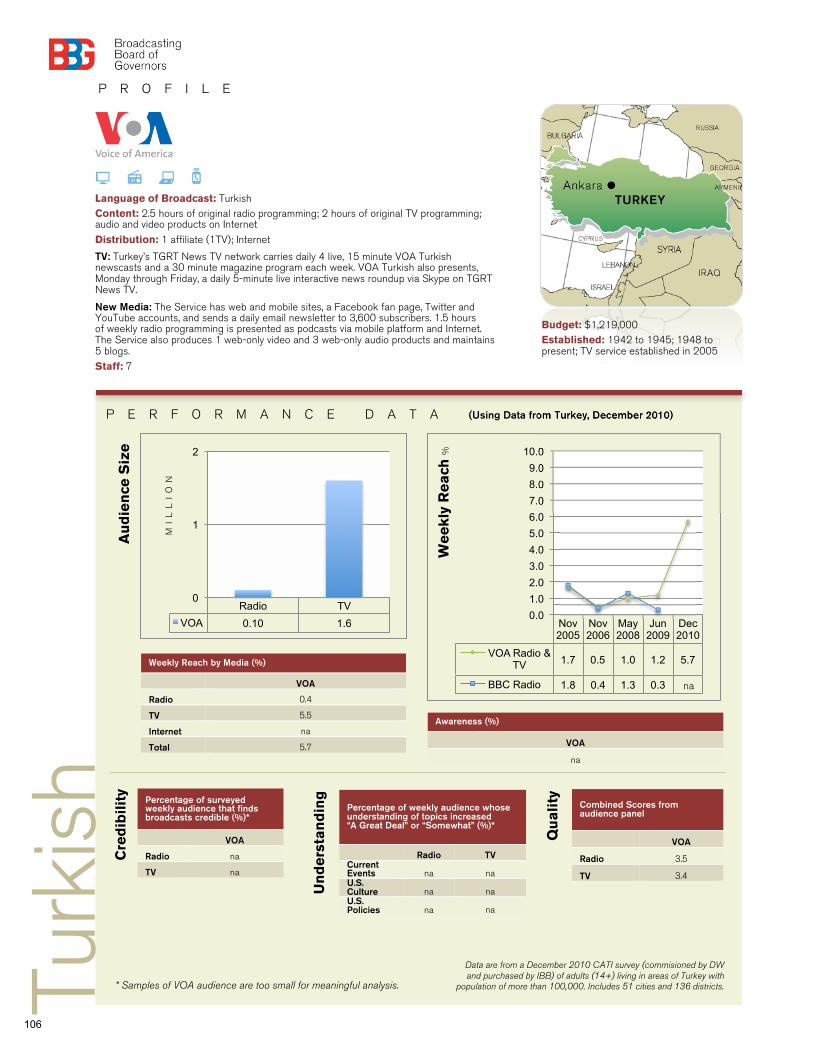
P R O F I L E
P E R F O R M A N C E D A T A (Using Data from Turkey, December 2010)
Language of Broadcast: Turkish Content: 2.5 hours of original radio programming; 2 hours of original TV programming; audio and video products on Internet
Distribution: 1 affiliate (1TV); Internet
TV: Turkey’s TGRT News TV network carries daily 4 live, 15 minute VOA Turkish newscasts and a 30 minute magazine program each week. VOA Turkish also presents, Monday through Friday, a daily 5-minute live interactive news roundup via Skype on TGRT News TV.
New Media: The Service has web and mobile sites, a Facebook fan page, Twitter and YouTube accounts, and sends a daily email newsletter to 3,600 subscribers. 1.5 hours of weekly radio programming is presented as podcasts via mobile platform and Internet. The Service also produces 1 web-only video and 3 web-only audio products and maintains 5 blogs.
Staff: 7
Percentage of surveyed weekly audience that finds broadcasts credible (%)*
VOA
Radio na
TV na
Percentage of weekly audience whose understanding of topics increased “A Great Deal” or “Somewhat” (%)*
Radio TV Current Events na na U.S. Culture na na U.S. Policies na na
Combined Scores from audience panel
VOA
Radio 3.5
TV 3.4
Cre
dib
ilit
y
Turk
ish
Qu
ali
ty
Un
de
rsta
nd
ing
Weekly Reach by Media (%)
VOA
Radio 0.4
TV 5.5
Internet na
Total 5.7
Awareness (%)
VOA
na
Nov 2005
Nov 2006
May 2008
Jun 2009
Dec 2010
VOA Radio & TV 1.7 0.5 1.0 1.2 5.7
BBC Radio 1.8 0.4 1.3 0.3
0.0
1.0
2.0
3.0
4.0
5.0
6.0
7.0
8.0
9.0
10.0
Radio TV
VOA 0.10 1.6
0
1
2
Au
die
nce
Siz
e
MI
LL
IO
N
We
ek
ly R
ea
ch %
* Samples of VOA audience are too small for meaningful analysis.
Data are from a December 2010 CATI survey (commisioned by DW and purchased by IBB) of adults (14+) living in areas of Turkey with
population of more than 100,000. Includes 51 cities and 136 districts.
Budget: $1,219,000 Established: 1942 to 1945; 1948 to present; TV service established in 2005
na
106
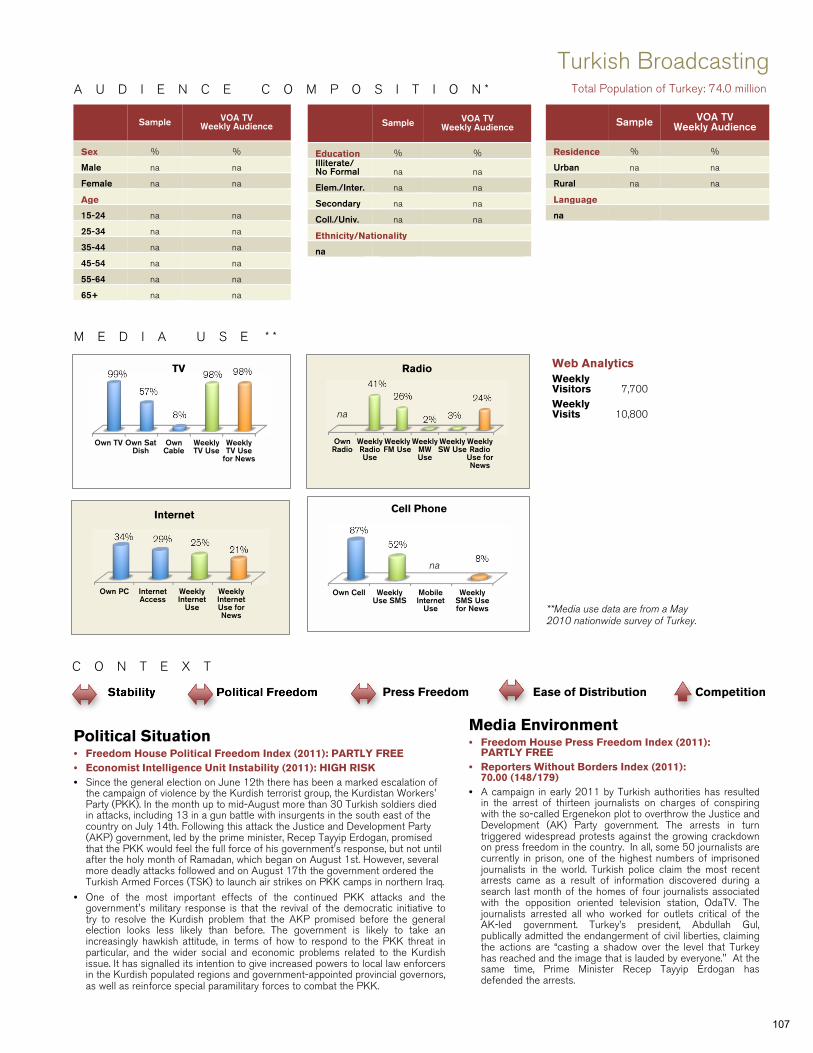
A U D I E N C E C O M P O S I T I O N *
C O N T E X T
Stability Political Freedom Press Freedom Ease of Distribution Competition
Sample VOA TV Weekly Audience
Sex % %
Male na na
Female na na
Age
15-24 na na
25-34 na na
35-44 na na
45-54 na na
55-64 na na
65+ na na
Sample VOA TV Weekly Audience
Education % % Illiterate/ No Formal na na
Elem./Inter. na na
Secondary na na
Coll./Univ. na na
Ethnicity/Nationality
na
Sample VOA TV Weekly Audience
Residence % %
Urban na na
Rural na na
Language
na
Turkish Broadcasting Total Population of Turkey: 74.0 million
Own TV Own Sat Dish
Own Cable
Weekly TV Use
Weekly TV Use
for News
99%
57%
8%
98% 98% TV
Own Cell Weekly Use SMS
Mobile Internet
Use
Weekly SMS Use for News
87%
52%
8%
Cell Phone
Political Situation • Freedom House Political Freedom Index (2011): PARTLY FREE • Economist Intelligence Unit Instability (2011): HIGH RISK • Since the general election on June 12th there has been a marked escalation of
the campaign of violence by the Kurdish terrorist group, the Kurdistan Workers' Party (PKK). In the month up to mid-August more than 30 Turkish soldiers died in attacks, including 13 in a gun battle with insurgents in the south east of the country on July 14th. Following this attack the Justice and Development Party (AKP) government, led by the prime minister, Recep Tayyip Erdogan, promised that the PKK would feel the full force of his government's response, but not until after the holy month of Ramadan, which began on August 1st. However, several more deadly attacks followed and on August 17th the government ordered the Turkish Armed Forces (TSK) to launch air strikes on PKK camps in northern Iraq.
• One of the most important effects of the continued PKK attacks and the government's military response is that the revival of the democratic initiative to try to resolve the Kurdish problem that the AKP promised before the general election looks less likely than before. The government is likely to take an increasingly hawkish attitude, in terms of how to respond to the PKK threat in particular, and the wider social and economic problems related to the Kurdish issue. It has signalled its intention to give increased powers to local law enforcers in the Kurdish populated regions and government-appointed provincial governors, as well as reinforce special paramilitary forces to combat the PKK.
M E D I A U S E * *
Media Environment • Freedom House Press Freedom Index (2011):
PARTLY FREE • Reporters Without Borders Index (2011):
70.00 (148/179) • A campaign in early 2011 by Turkish authorities has resulted
in the arrest of thirteen journalists on charges of conspiring with the so-called Ergenekon plot to overthrow the Justice and Development (AK) Party government. The arrests in turn triggered widespread protests against the growing crackdown on press freedom in the country. In all, some 50 journalists are currently in prison, one of the highest numbers of imprisoned journalists in the world. Turkish police claim the most recent arrests came as a result of information discovered during a search last month of the homes of four journalists associated with the opposition oriented television station, OdaTV. The journalists arrested all who worked for outlets critical of the AK-led government. Turkey’s president, Abdullah Gul, publically admitted the endangerment of civil liberties, claiming the actions are “casting a shadow over the level that Turkey has reached and the image that is lauded by everyone." At the same time, Prime Minister Recep Tayyip Erdogan has defended the arrests.
Own Radio
Weekly Radio Use
Weekly FM Use
Weekly MW Use
Weekly SW Use
Weekly Radio
Use for News
41% 26%
2% 3%
24%
Radio
Own PC Internet Access
Weekly Internet
Use
Weekly Internet Use for News
34% 29% 25% 21%
Internet
Web Analytics Weekly Visitors 7,700 Weekly Visits 10,800
na
na
**Media use data are from a May 2010 nationwide survey of Turkey.
107
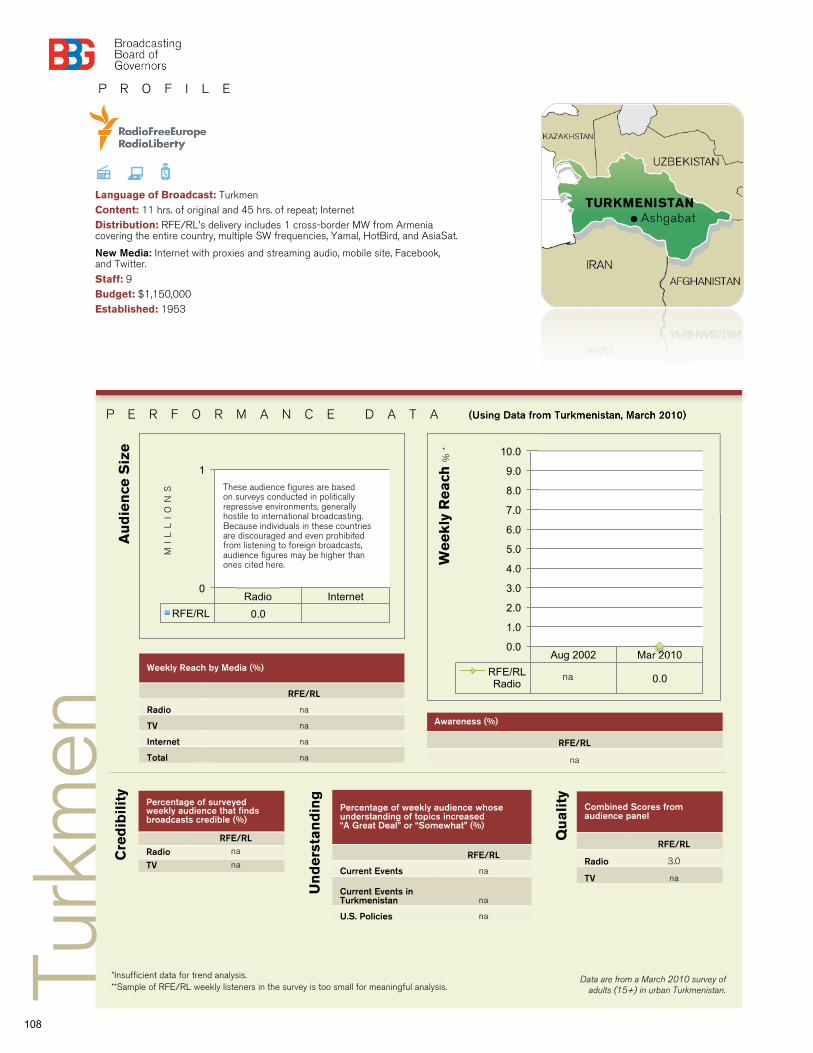
P R O F I L E
P E R F O R M A N C E D A T A (Using Data from Turkmenistan, March 2010)
Language of Broadcast: Turkmen Content: 11 hrs. of original and 45 hrs. of repeat; Internet Distribution: RFE/RL’s delivery includes 1 cross-border MW from Armenia covering the entire country, multiple SW frequencies, Yamal, HotBird, and AsiaSat.
New Media: Internet with proxies and streaming audio, mobile site, Facebook, and Twitter. Staff: 9 Budget: $1,150,000 Established: 1953
Percentage of surveyed weekly audience that finds broadcasts credible (%)
RFE/RL Radio na
TV na
Percentage of weekly audience whose understanding of topics increased “A Great Deal” or “Somewhat” (%)
RFE/RL
Current Events na
Current Events in Turkmenistan na
U.S. Policies na
Combined Scores from audience panel
RFE/RL
Radio 3.0
TV na
Cre
dib
ilit
y
Turk
men
Qu
ali
ty
Un
de
rsta
nd
ing
Weekly Reach by Media (%)
RFE/RL
Radio na
TV na
Internet na
Total na
Awareness (%)
RFE/RL
na
Aug 2002 Mar 2010
RFE/RL Radio 0.0
0.0
1.0
2.0
3.0
4.0
5.0
6.0
7.0
8.0
9.0
10.0
Radio Internet
RFE/RL 0.0
0
1
Au
die
nce
Siz
e
MI
LL
IO
NS
We
ek
ly R
ea
ch %
*
Data are from a March 2010 survey of adults (15+) in urban Turkmenistan.
*Insufficient data for trend analysis. **Sample of RFE/RL weekly listeners in the survey is too small for meaningful analysis.
These audience figures are based on surveys conducted in politically repressive environments, generally hostile to international broadcasting. Because individuals in these countries are discouraged and even prohibited from listening to foreign broadcasts, audience figures may be higher than ones cited here.
na
108
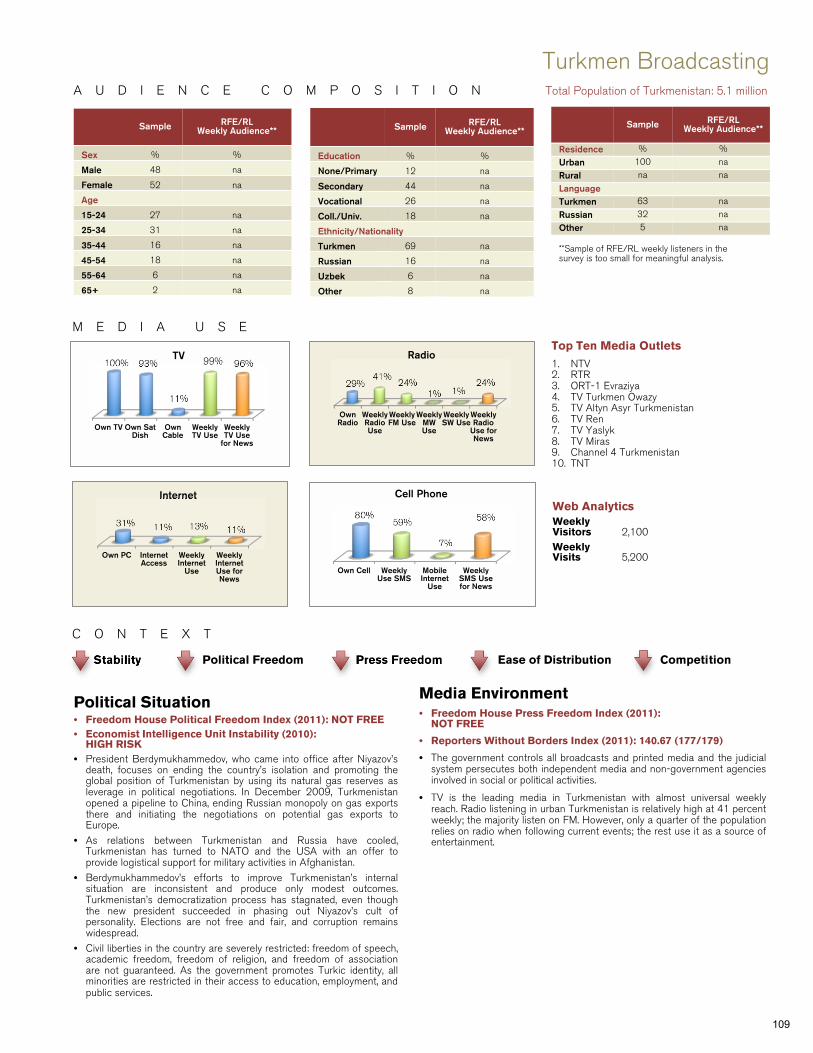
A U D I E N C E C O M P O S I T I O N
C O N T E X T
Stability Political Freedom Press Freedom Ease of Distribution Competition
Sample RFE/RL Weekly Audience**
Sex % %
Male 48 na
Female 52 na
Age
15-24 27 na
25-34 31 na
35-44 16 na
45-54 18 na
55-64 6 na
65+ 2 na
Sample RFE/RL Weekly Audience**
Education % %
None/Primary 12 na
Secondary 44 na
Vocational 26 na
Coll./Univ. 18 na
Ethnicity/Nationality
Turkmen 69 na
Russian 16 na
Uzbek 6 na
Other 8 na
Sample RFE/RL Weekly Audience**
Residence % %
Urban 100 na
Rural na na
Language Turkmen 63 na
Russian 32 na
Other 5 na **Sample of RFE/RL weekly listeners in the survey is too small for meaningful analysis.
Turkmen Broadcasting Total Population of Turkmenistan: 5.1 million
Own TV Own Sat Dish
Own Cable
Weekly TV Use
Weekly TV Use
for News
100% 93%
11%
99% 96% TV
Own Cell Weekly Use SMS
Mobile Internet
Use
Weekly SMS Use for News
80% 59%
7%
58%
Cell Phone
Top Ten Media Outlets
1. NTV 2. RTR 3. ORT-1 Evraziya 4. TV Turkmen Owazy 5. TV Altyn Asyr Turkmenistan 6. TV Ren 7. TV Yaslyk 8. TV Miras 9. Channel 4 Turkmenistan 10. TNT
Political Situation • Freedom House Political Freedom Index (2011): NOT FREE • Economist Intelligence Unit Instability (2010):
HIGH RISK • President Berdymukhammedov, who came into office after Niyazov’s
death, focuses on ending the country’s isolation and promoting the global position of Turkmenistan by using its natural gas reserves as leverage in political negotiations. In December 2009, Turkmenistan opened a pipeline to China, ending Russian monopoly on gas exports there and initiating the negotiations on potential gas exports to Europe.
• As relations between Turkmenistan and Russia have cooled, Turkmenistan has turned to NATO and the USA with an offer to provide logistical support for military activities in Afghanistan.
• Berdymukhammedov’s efforts to improve Turkmenistan’s internal situation are inconsistent and produce only modest outcomes. Turkmenistan’s democratization process has stagnated, even though the new president succeeded in phasing out Niyazov’s cult of personality. Elections are not free and fair, and corruption remains widespread.
• Civil liberties in the country are severely restricted: freedom of speech, academic freedom, freedom of religion, and freedom of association are not guaranteed. As the government promotes Turkic identity, all minorities are restricted in their access to education, employment, and public services.
M E D I A U S E
Media Environment • Freedom House Press Freedom Index (2011):
NOT FREE
• Reporters Without Borders Index (2011): 140.67 (177/179)
• The government controls all broadcasts and printed media and the judicialsystem persecutes both independent media and non-government agenciesinvolved in social or political activities.
• TV is the leading media in Turkmenistan with almost universal weeklyreach. Radio listening in urban Turkmenistan is relatively high at 41 percentweekly; the majority listen on FM. However, only a quarter of the populationrelies on radio when following current events; the rest use it as a source ofentertainment.
Own Radio
Weekly Radio Use
Weekly FM Use
Weekly MW Use
Weekly SW Use
Weekly Radio
Use for News
29% 41%
24% 1% 1%
24%
Radio
Own PC Internet Access
Weekly Internet
Use
Weekly Internet Use for News
31% 11% 13% 11%
Internet Web Analytics Weekly Visitors 2,100 Weekly Visits 5,200
109
P R O F I L E
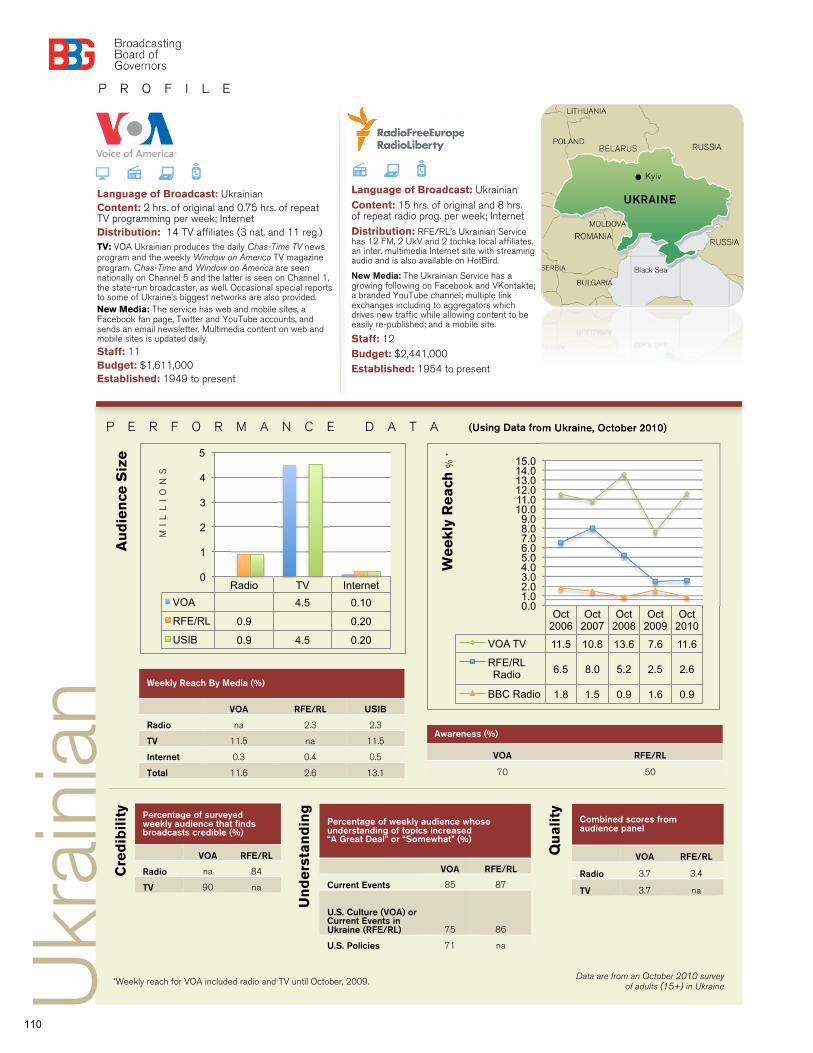
P E R F O R M A N C E D A T A (Using Data from Ukraine, October 2010)
Language of Broadcast: Ukrainian Content: 2 hrs. of original and 0.75 hrs. of repeat TV programming per week; Internet Distribution: 14 TV affiliates (3 nat. and 11 reg.) TV: VOA Ukrainian produces the daily Chas-Time TV news program and the weekly Window on America TV magazine program. Chas-Time and Window on America are seen nationally on Channel 5 and the latter is seen on Channel 1, the state-run broadcaster, as well. Occasional special reports to some of Ukraine’s biggest networks are also provided. New Media: The service has web and mobile sites, a Facebook fan page, Twitter and YouTube accounts, and sends an email newsletter. Multimedia content on web and mobile sites is updated daily. Staff: 11 Budget: $1,611,000 Established: 1949 to present
Language of Broadcast: Ukrainian
Content: 15 hrs. of original and 8 hrs. of repeat radio prog. per week; Internet
Distribution: RFE/RL’s Ukrainian Service has 12 FM, 2 UkV and 2 tochka local affiliates, an inter. multimedia Internet site with streaming audio and is also available on HotBird.
New Media: The Ukrainian Service has a growing following on Facebook and VKontakte; a branded YouTube channel; multiple link exchanges including to aggregators which drives new traffic while allowing content to be easily re-published; and a mobile site.
Staff: 12 Budget: $2,441,000 Established: 1954 to present
Percentage of surveyed weekly audience that finds broadcasts credible (%)
VOA RFE/RL
Radio na 84
TV 90 na
Percentage of weekly audience whose understanding of topics increased “A Great Deal” or “Somewhat” (%)
VOA RFE/RL
Current Events 85 87
U.S. Culture (VOA) or Current Events in Ukraine (RFE/RL) 75 86
U.S. Policies 71 na
Combined scores from audience panel
VOA RFE/RL
Radio 3.7 3.4
TV 3.7 na
Cre
dib
ilit
y
Ukr
aini
an
Qu
ali
ty
Un
de
rsta
nd
ing
*Weekly reach for VOA included radio and TV until October, 2009.
Weekly Reach By Media (%)
VOA RFE/RL USIB
Radio na 2.3 2.3
TV 11.5 na 11.5
Internet 0.3 0.4 0.5
Total 11.6 2.6 13.1
Awareness (%)
VOA RFE/RL
70 50
Oct 2006
Oct 2007
Oct 2008
Oct 2009
Oct 2010
VOA TV 11.5 10.8 13.6 7.6 11.6
RFE/RL Radio 6.5 8.0 5.2 2.5 2.6
BBC Radio 1.8 1.5 0.9 1.6 0.9
0.0 1.0 2.0 3.0 4.0 5.0 6.0 7.0 8.0 9.0
10.0 11.0 12.0 13.0 14.0 15.0
Radio TV Internet
VOA 4.5 0.10
RFE/RL 0.9 0.20
USIB 0.9 4.5 0.20
0
1
2
3
4
5
Au
die
nce
Siz
e
MI
LL
IO
NS
Data are from an October 2010 survey of adults (15+) in Ukraine
We
ek
ly R
ea
ch %
*
110
Web Analytics VOA Weekly Visitors 7,200 Weekly Visits 10,900
RFE/RL Weekly Visitors 44,100 Weekly Visits 107,900
C O N T E X T
Stability Political Freedom Press Freedom Ease of Distribution Competition
Sample VOA
Weekly Aud.
RFE/RL Weekly
Aud.
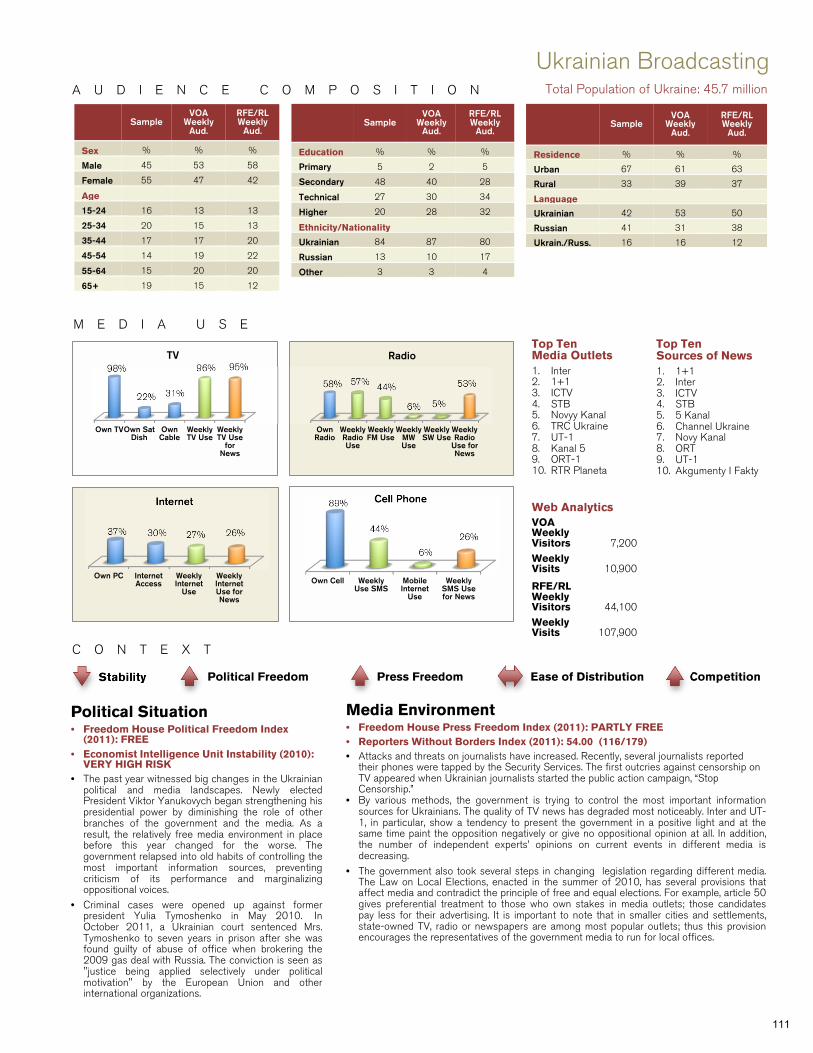
Sex % % %
Male 45 53 58
Female 55 47 42
Age
15-24 16 13 13
25-34 20 15 13
35-44 17 17 20
45-54 14 19 22
55-64 15 20 20
65+ 19 15 12
Sample VOA
Weekly Aud.
RFE/RL Weekly
Aud.
Education % % %
Primary 5 2 5
Secondary 48 40 28
Technical 27 30 34
Higher 20 28 32
Ethnicity/Nationality
Ukrainian 84 87 80
Russian 13 10 17
Other 3 3 4
Sample VOA
Weekly Aud.
RFE/RL Weekly
Aud.
Residence % % %
Urban 67 61 63
Rural 33 39 37
Language
Ukrainian 42 53 50
Russian 41 31 38
Ukrain./Russ. 16 16 12
Ukrainian Broadcasting Total Population of Ukraine: 45.7 million
Own TV Own Sat Dish
Own Cable
Weekly TV Use
Weekly TV Use
for News
98%
22% 31%
96% 95% TV
Own Cell Weekly Use SMS
Mobile Internet
Use
Weekly SMS Use for News
89%
44%
6%
26%
Cell Phone
Top Ten Media Outlets 1. Inter 2. 1+1 3. ICTV 4. STB 5. Novyy Kanal 6. TRC Ukraine 7. UT-1 8. Kanal 5 9. ORT-1 10. RTR Planeta
Political Situation • Freedom House Political Freedom Index
(2011): FREE • Economist Intelligence Unit Instability (2010):
VERY HIGH RISK • The past year witnessed big changes in the Ukrainian
political and media landscapes. Newly elected President Viktor Yanukovych began strengthening his presidential power by diminishing the role of other branches of the government and the media. As a result, the relatively free media environment in place before this year changed for the worse. The government relapsed into old habits of controlling the most important information sources, preventing criticism of its performance and marginalizing oppositional voices.
• Criminal cases were opened up against former president Yulia Tymoshenko in May 2010. In October 2011, a Ukrainian court sentenced Mrs. Tymoshenko to seven years in prison after she was found guilty of abuse of office when brokering the 2009 gas deal with Russia. The conviction is seen as "justice being applied selectively under political motivation" by the European Union and other international organizations.
M E D I A U S E
Media Environment • Freedom House Press Freedom Index (2011): PARTLY FREE • Reporters Without Borders Index (2011): 54.00 (116/179) • Attacks and threats on journalists have increased. Recently, several journalists reported
their phones were tapped by the Security Services. The first outcries against censorship on TV appeared when Ukrainian journalists started the public action campaign, “Stop Censorship.”
• By various methods, the government is trying to control the most important informationsources for Ukrainians. The quality of TV news has degraded most noticeably. Inter and UT-1, in particular, show a tendency to present the government in a positive light and at the same time paint the opposition negatively or give no oppositional opinion at all. In addition,the number of independent experts’ opinions on current events in different media is decreasing.
• The government also took several steps in changing legislation regarding different media.The Law on Local Elections, enacted in the summer of 2010, has several provisions thataffect media and contradict the principle of free and equal elections. For example, article 50gives preferential treatment to those who own stakes in media outlets; those candidatespay less for their advertising. It is important to note that in smaller cities and settlements,state-owned TV, radio or newspapers are among most popular outlets; thus this provisionencourages the representatives of the government media to run for local offices.
Own Radio
Weekly Radio Use
Weekly FM Use
Weekly MW Use
Weekly SW Use
Weekly Radio
Use for News
58% 57% 44%
6% 5%
53%
Radio
Own PC Internet Access
Weekly Internet
Use
Weekly Internet Use for News
37% 30% 27% 26%
Internet
Top Ten Sources of News 1. 1+1 2. Inter 3. ICTV 4. STB 5. 5 Kanal 6. Channel Ukraine 7. Novy Kanal 8. ORT 9. UT-1 10. Akgumenty I Fakty
A U D I E N C E C O M P O S I T I O N
111
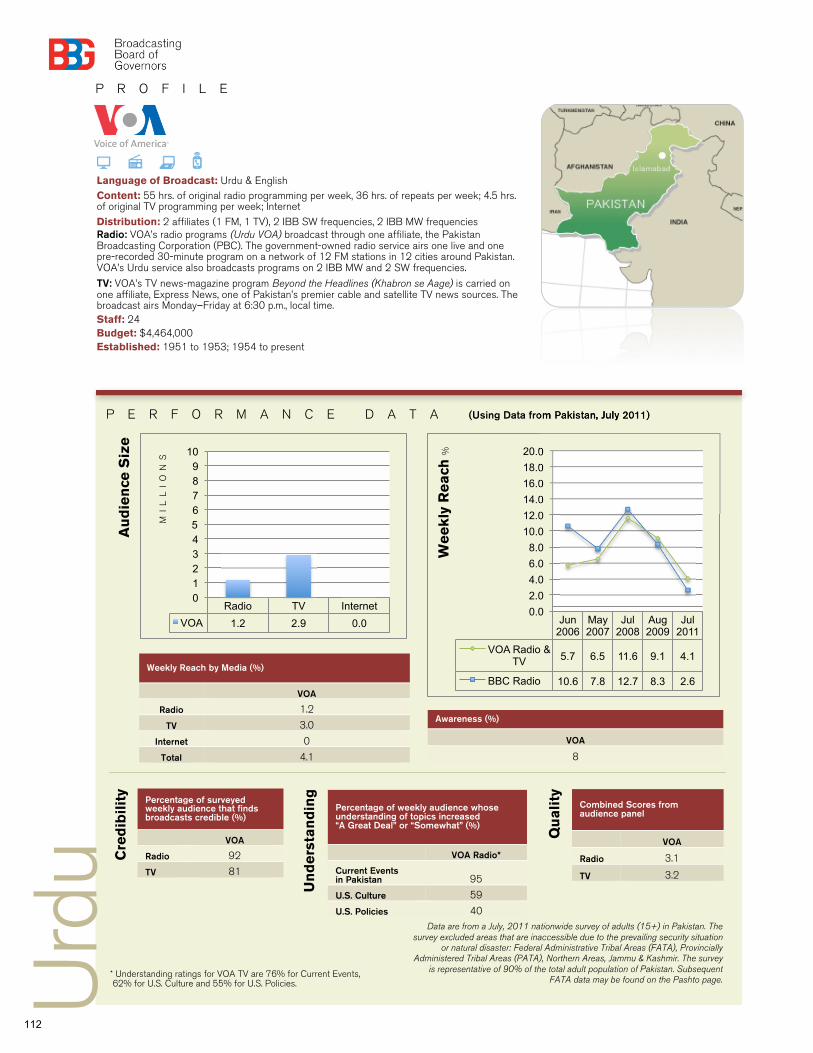
P R O F I L E
P E R F O R M A N C E D A T A (Using Data from Pakistan, July 2011)
Language of Broadcast: Urdu & English Content: 55 hrs. of original radio programming per week, 36 hrs. of repeats per week; 4.5 hrs. of original TV programming per week; Internet
Distribution: 2 affiliates (1 FM, 1 TV), 2 IBB SW frequencies, 2 IBB MW frequencies Radio: VOA’s radio programs (Urdu VOA) broadcast through one affiliate, the Pakistan Broadcasting Corporation (PBC). The government-owned radio service airs one live and one pre-recorded 30-minute program on a network of 12 FM stations in 12 cities around Pakistan. VOA’s Urdu service also broadcasts programs on 2 IBB MW and 2 SW frequencies.
TV: VOA’s TV news-magazine program Beyond the Headlines (Khabron se Aage) is carried on one affiliate, Express News, one of Pakistan’s premier cable and satellite TV news sources. The broadcast airs Monday–Friday at 6:30 p.m., local time. Staff: 24 Budget: $4,464,000 Established: 1951 to 1953; 1954 to present
Percentage of surveyed weekly audience that finds broadcasts credible (%)
VOA
Radio 92
TV 81
Percentage of weekly audience whose understanding of topics increased “A Great Deal” or “Somewhat” (%)
VOA Radio*
Current Events in Pakistan 95
U.S. Culture 59
U.S. Policies 40
Combined Scores from audience panel
VOA
Radio 3.1
TV 3.2
Cre
dib
ilit
y
Urd
u Qu
ali
ty
Un
de
rsta
nd
ing
Weekly Reach by Media (%)
VOA
Radio 1.2
TV 3.0
Internet 0
Total 4.1
Awareness (%)
VOA
8
Jun 2006
May 2007
Jul 2008
Aug 2009
Jul 2011
VOA Radio & TV 5.7 6.5 11.6 9.1 4.1
BBC Radio 10.6 7.8 12.7 8.3 2.6
0.0
2.0
4.0
6.0
8.0
10.0
12.0
14.0
16.0
18.0
20.0
Radio TV Internet
VOA 1.2 2.9 0.0
0 1 2 3 4 5 6 7 8 9
10
Au
die
nce
Siz
e
MI
LL
IO
NS
* Understanding ratings for VOA TV are 76% for Current Events, 62% for U.S. Culture and 55% for U.S. Policies.
Data are from a July, 2011 nationwide survey of adults (15+) in Pakistan. The survey excluded areas that are inaccessible due to the prevailing security situation
or natural disaster: Federal Administrative Tribal Areas (FATA), Provincially Administered Tribal Areas (PATA), Northern Areas, Jammu & Kashmir. The survey
is representative of 90% of the total adult population of Pakistan. Subsequent FATA data may be found on the Pashto page.
We
ek
ly R
ea
ch %
112
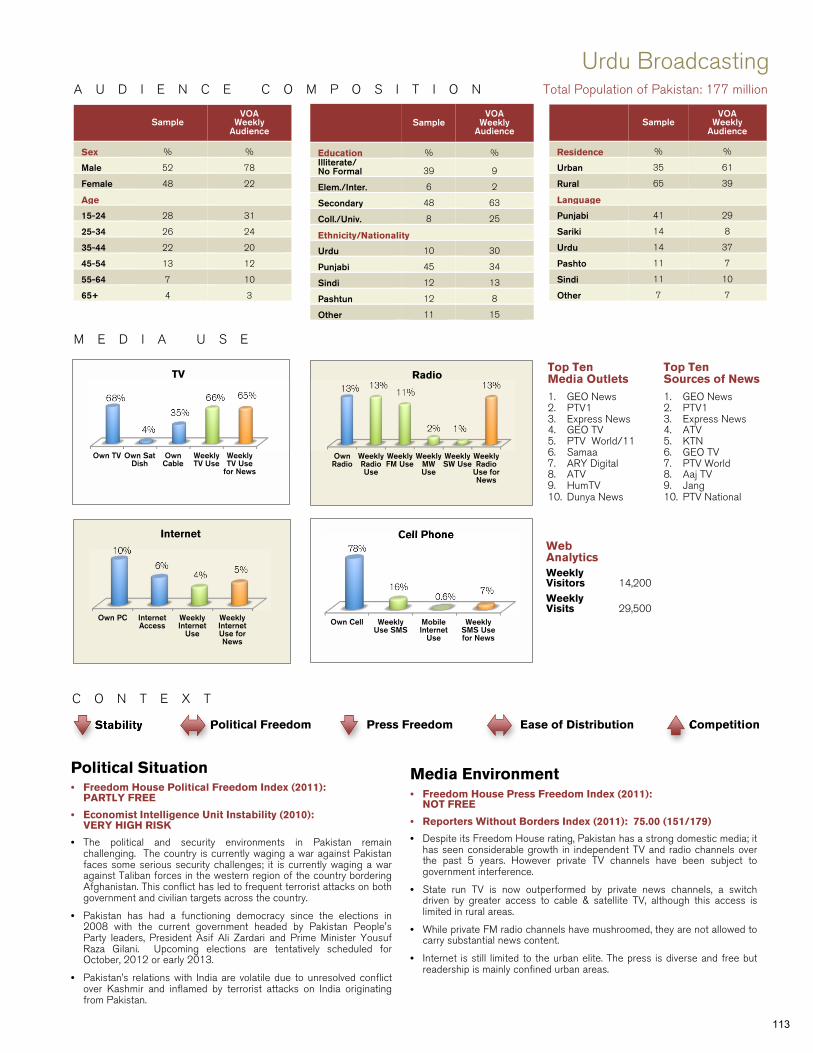
A U D I E N C E C O M P O S I T I O N
C O N T E X T
Stability Political Freedom Press Freedom Ease of Distribution Competition
Sample VOA
Weekly Audience
Sex % %
Male 52 78
Female 48 22
Age
15-24 28 31
25-34 26 24
35-44 22 20
45-54 13 12
55-64 7 10
65+ 4 3
Sample VOA
Weekly Audience
Education % % Illiterate/ No Formal 39 9
Elem./Inter. 6 2
Secondary 48 63
Coll./Univ. 8 25
Ethnicity/Nationality
Urdu 10 30
Punjabi 45 34
Sindi 12 13
Pashtun 12 8
Other 11 15
Sample VOA
Weekly Audience
Residence % %
Urban 35 61
Rural 65 39
Language
Punjabi 41 29
Sariki 14 8
Urdu 14 37
Pashto 11 7
Sindi 11 10
Other 7 7
Urdu Broadcasting Total Population of Pakistan: 177 million
Own TV Own Sat Dish
Own Cable
Weekly TV Use
Weekly TV Use
for News
68%
4%
35%
66% 65%
TV
Own Cell Weekly Use SMS
Mobile Internet
Use
Weekly SMS Use for News
78%
16% 0.6%
7%
Cell Phone
Top Ten Media Outlets 1. GEO News 2. PTV1 3. Express News 4. GEO TV 5. PTV World/11 6. Samaa 7. ARY Digital 8. ATV 9. HumTV 10. Dunya News
Political Situation • Freedom House Political Freedom Index (2011):
PARTLY FREE
• Economist Intelligence Unit Instability (2010): VERY HIGH RISK
• The political and security environments in Pakistan remain challenging. The country is currently waging a war against Pakistan faces some serious security challenges; it is currently waging a war against Taliban forces in the western region of the country bordering Afghanistan. This conflict has led to frequent terrorist attacks on both government and civilian targets across the country.
• Pakistan has had a functioning democracy since the elections in 2008 with the current government headed by Pakistan People's Party leaders, President Asif Ali Zardari and Prime Minister Yousuf Raza Gilani. Upcoming elections are tentatively scheduled for October, 2012 or early 2013.
• Pakistan’s relations with India are volatile due to unresolved conflict over Kashmir and inflamed by terrorist attacks on India originating from Pakistan.
M E D I A U S E
Media Environment • Freedom House Press Freedom Index (2011):
NOT FREE
• Reporters Without Borders Index (2011): 75.00 (151/179)
• Despite its Freedom House rating, Pakistan has a strong domestic media; ithas seen considerable growth in independent TV and radio channels overthe past 5 years. However private TV channels have been subject to government interference.
• State run TV is now outperformed by private news channels, a switchdriven by greater access to cable & satellite TV, although this access islimited in rural areas.
• While private FM radio channels have mushroomed, they are not allowed to carry substantial news content.
• Internet is still limited to the urban elite. The press is diverse and free butreadership is mainly confined urban areas.
Own Radio
Weekly Radio Use
Weekly FM Use
Weekly MW Use
Weekly SW Use
Weekly Radio
Use for News
13% 13% 11%
2% 1%
13% Radio
Own PC Internet Access
Weekly Internet
Use
Weekly Internet Use for News
10%
6% 4%
5%
Internet
Top Ten Sources of News 1. GEO News 2. PTV1 3. Express News 4. ATV 5. KTN 6. GEO TV 7. PTV World 8. Aaj TV 9. Jang 10. PTV National
Web Analytics Weekly Visitors 14,200 Weekly Visits 29,500
113
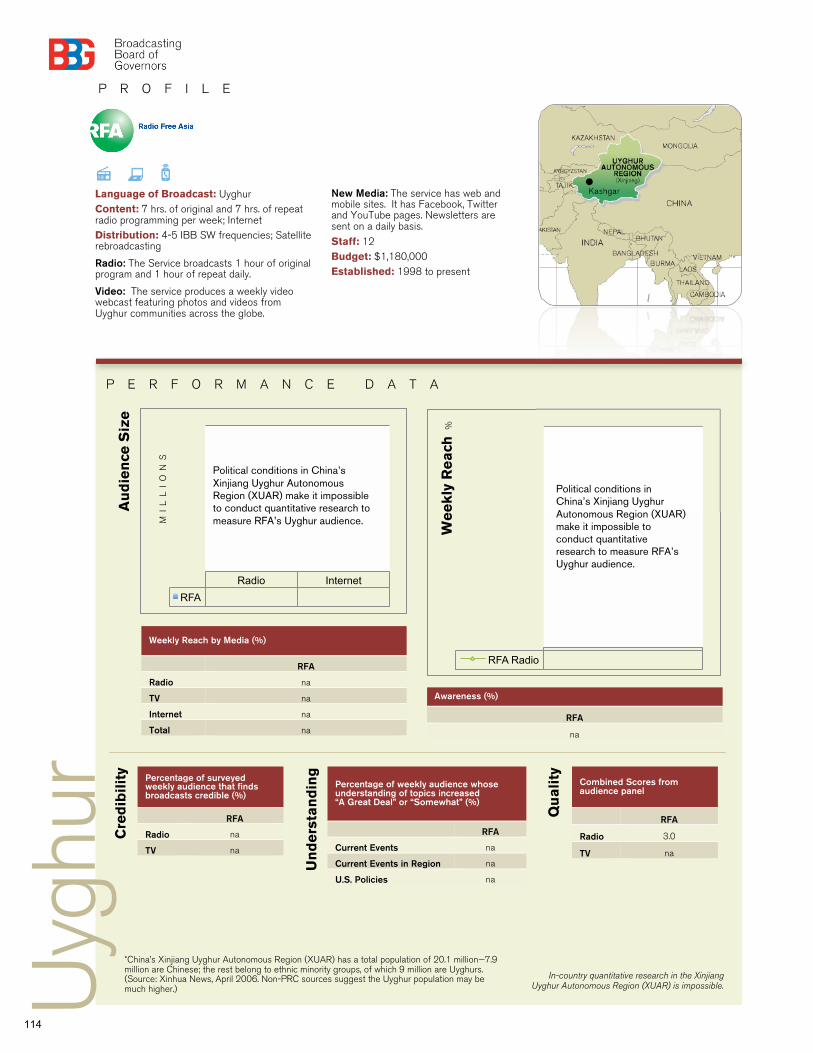
P R O F I L E
P E R F O R M A N C E D A T A
Language of Broadcast: Uyghur Content: 7 hrs. of original and 7 hrs. of repeat radio programming per week; Internet Distribution: 4-5 IBB SW frequencies; Satellite rebroadcasting
Radio: The Service broadcasts 1 hour of original program and 1 hour of repeat daily.
Video: The service produces a weekly video webcast featuring photos and videos from Uyghur communities across the globe.
Percentage of surveyed weekly audience that finds broadcasts credible (%)
RFA
Radio na
TV na
Percentage of weekly audience whose understanding of topics increased “A Great Deal” or “Somewhat” (%)
RFA
Current Events na
Current Events in Region na
U.S. Policies na
Combined Scores from audience panel
RFA
Radio 3.0
TV na
Cre
dib
ilit
y
Uyg
hur
Qu
ali
ty
Un
de
rsta
nd
ing
*China’s Xinjiang Uyghur Autonomous Region (XUAR) has a total population of 20.1 million—7.9 million are Chinese; the rest belong to ethnic minority groups, of which 9 million are Uyghurs. (Source: Xinhua News, April 2006. Non-PRC sources suggest the Uyghur population may be much higher.)
Weekly Reach by Media (%)
RFA
Radio na
TV na
Internet na
Total na
Awareness (%)
RFA
na
RFA Radio
Radio Internet
RFA
Au
die
nce
Siz
e
MI
LL
IO
NS
We
ek
ly R
ea
ch
%
In-country quantitative research in the Xinjiang Uyghur Autonomous Region (XUAR) is impossible.
Political conditions in China’s Xinjiang Uyghur Autonomous Region (XUAR) make it impossible to conduct quantitative research to measure RFA’s Uyghur audience.
Political conditions in China’s Xinjiang Uyghur Autonomous Region (XUAR) make it impossible to conduct quantitative research to measure RFA’s Uyghur audience.
New Media: The service has web and mobile sites. It has Facebook, Twitter and YouTube pages. Newsletters are sent on a daily basis.
Staff: 12 Budget: $1,180,000 Established: 1998 to present
114
A U D I E N C E C O M P O S I T I O N
C O N T E X T
Stability Political Freedom Press Freedom Ease of Distribution Competition
Sample RFA Weekly Aud.
Sex % %
Male na na
Female na na
Age
15-24 na na
25-34 na na
35-44 na na
45-54 na na
55-64 na na
65+ na na
Sample RFA Weekly Aud.
Education % %
Primary or less na na
Junior School na na
High School na na
Vocational na na
Coll./Univ. na na
Ethnicity/Nationality
Han na na
Other na na
Sample RFA Weekly Audience
Residence % %
Urban na na
Rural na na
Language
Mandarin na na
Cantonese na na
Other na na
Uyghur Broadcasting Total Population of Xinjiang: 20.1million*
Political Situation • Freedom House Political Freedom Index (2011):
NOT FREE (China)
• Economist Intelligence Unit Instability (2010): MODERATE RISK (China)
• The Xinjiang Uyghur Autonomous Region of China is far more restricted than the rest of China. Tensions between Uyghurs and the ruling Han majority are at an historic high after violent clashes broke out between Uyghurs and Han Chinese in Xinjiang in July 2009. Chinese authorities responded with a harsh crackdown on Uyghurs in the XUAR.
• Government surveillance of a wide range of activities in the XUAR is systematic and intense. Even the limited freedom of action enjoyed by residents in other areas of China is restricted in Xinjiang. Going beyond simple surveillance, the government literally shut down text messaging and internet in Xinjiang following the ethnic clashes in July 2009.
• As part of its Western development strategy, the Chinese government has put in place policies to encourage Han migration to the XUAR in an attempt to Sinofy the region and further secure Beijing’s control of Uyghur areas.
• The research environment in Xinjiang is extremely sensitive and although limited research is possible in Xinjiang, most Uyghur research is conducted outside of the XUAR in Turkey or Central Asia.
M E D I A U S E
Media Environment • Freedom House Press Freedom Index (2011):
NOT FREE (China) • Reporters Without Borders Index (2011):
136.00 (174/179) (China) • Chinese authorities tightly restrict any content they deem to be sensitive
and this is doubly true of Xinjiang. Media consumers in Xinjiang are limited largely to official Chinese media sources.
• Even under normal circumstances, US International broadcasters are among the most tightly censored media outlets in Xinjiang. RFA radio broadcasts are intensively jammed and international broadcasters’ websites are blocked. Such restrictions present serious obstacles to those in China attempting to access US international broadcaster content.
• After the July 2009 ethnic clashes in the XUAR Chinese media restrictions in the Xinjiang reached a new high. The Internet service was suspended to the whole of the XUAR from July 2009 until May 2010 and even in 2012 Internet restrictions remain severe. Text messaging services were suspended from July 2009 until January 2010 and text message content continues to be monitored.
• Prior to July 2009 many relatively sophisticated young Uyghurs had begun to rely on the Internet and other forms of new media for Uyghur-language sources of news and information. Many Internet-savvy Uyghurs interviewed during qualitative research reported having used proxy servers or anticensorship software to access sensitive or blocked content. As in the rest of China, blogs, podcasts, social networking sites and micro-blogs had become a normal part of many Uyghur Internet users’ online routines. Recent research suggest that portable digital media, especially DVDs, have become a source of news for Uyghurs.
• However, for many Uyghurs in rural XUAR, radio remains an importantsource for Uyghur language news. Radio broadcasts are also looked uponfavorably because listeners are less susceptible to government monitoringthan those accessing sensitive content online.
Web Analytics Weekly Visitors 7,300 Weekly Visits 14,000
TV Radio Internet Cell Phone
Media use data is not available.
Media use data is not available.
Media use data is not available.
Media use data is not available.
115
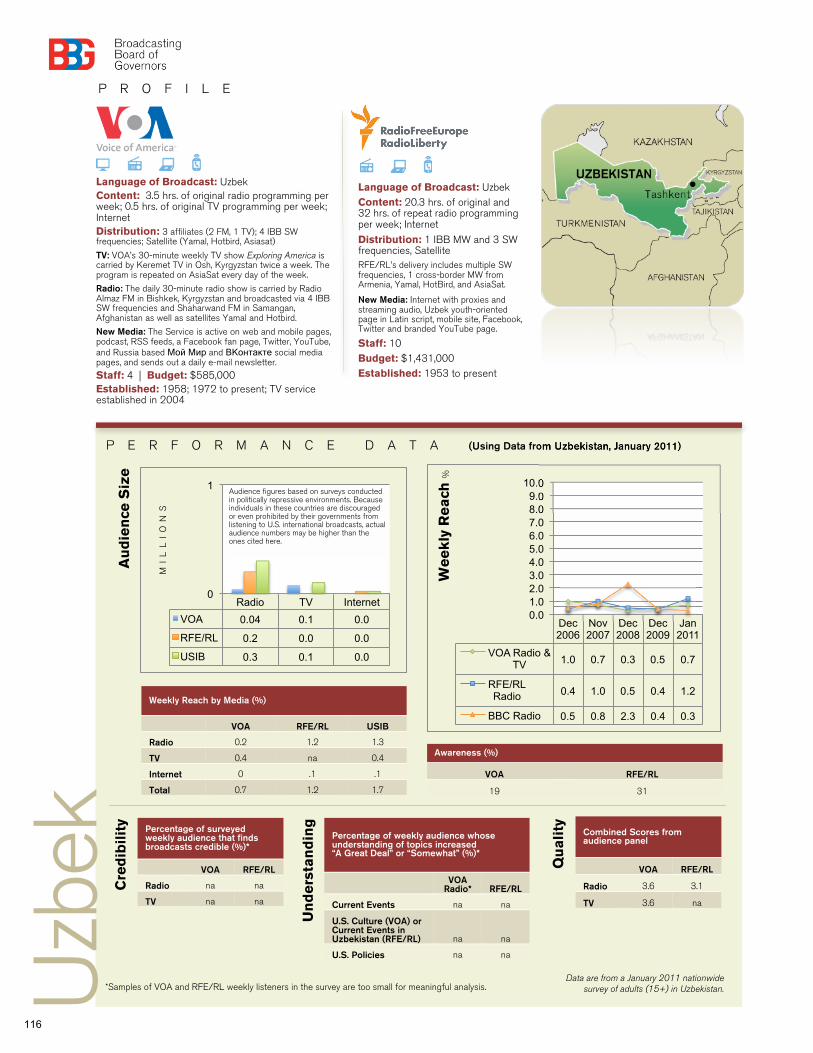
P R O F I L E
P E R F O R M A N C E D A T A (Using Data from Uzbekistan, January 2011)
Language of Broadcast: Uzbek Content: 3.5 hrs. of original radio programming per week; 0.5 hrs. of original TV programming per week; Internet Distribution: 3 affiliates (2 FM, 1 TV); 4 IBB SW frequencies; Satellite (Yamal, Hotbird, Asiasat)
TV: VOA’s 30-minute weekly TV show Exploring America is carried by Keremet TV in Osh, Kyrgyzstan twice a week. The program is repeated on AsiaSat every day of the week.
Radio: The daily 30-minute radio show is carried by Radio Almaz FM in Bishkek, Kyrgyzstan and broadcasted via 4 IBB SW frequencies and Shaharwand FM in Samangan, Afghanistan as well as satellites Yamal and Hotbird.
New Media: The Service is active on web and mobile pages, podcast, RSS feeds, a Facebook fan page, Twitter, YouTube, and Russia based Мой Мир and ВКонтакте social media pages, and sends out a daily e-mail newsletter. Staff: 4 | Budget: $585,000 Established: 1958; 1972 to present; TV service established in 2004
Language of Broadcast: Uzbek Content: 20.3 hrs. of original and 32 hrs. of repeat radio programming per week; Internet
Distribution: 1 IBB MW and 3 SW frequencies, Satellite RFE/RL’s delivery includes multiple SW frequencies, 1 cross-border MW from Armenia, Yamal, HotBird, and AsiaSat.
New Media: Internet with proxies and streaming audio, Uzbek youth-oriented page in Latin script, mobile site, Facebook, Twitter and branded YouTube page.
Staff: 10 Budget: $1,431,000 Established: 1953 to present
Percentage of surveyed weekly audience that finds broadcasts credible (%)*
VOA RFE/RL
Radio na na
TV na na
Percentage of weekly audience whose understanding of topics increased “A Great Deal” or “Somewhat” (%)*
VOA
Radio* RFE/RL
Current Events na na
U.S. Culture (VOA) or Current Events in Uzbekistan (RFE/RL) na na
U.S. Policies na na
Combined Scores from audience panel
VOA RFE/RL
Radio 3.6 3.1
TV 3.6 na
Cre
dib
ilit
y
Uzb
ek
Qu
ali
ty
Un
de
rsta
nd
ing
*Samples of VOA and RFE/RL weekly listeners in the survey are too small for meaningful analysis.
Weekly Reach by Media (%)
VOA RFE/RL USIB
Radio 0.2 1.2 1.3
TV 0.4 na 0.4
Internet 0 .1 .1
Total 0.7 1.2 1.7
Awareness (%)
VOA RFE/RL
19 31
Dec 2006
Nov 2007
Dec 2008
Dec 2009
Jan 2011
VOA Radio & TV 1.0 0.7 0.3 0.5 0.7
RFE/RL Radio 0.4 1.0 0.5 0.4 1.2
BBC Radio 0.5 0.8 2.3 0.4 0.3
0.0 1.0 2.0 3.0 4.0 5.0 6.0 7.0 8.0 9.0
10.0
Radio TV Internet
VOA 0.04 0.1 0.0
RFE/RL 0.2 0.0 0.0
USIB 0.3 0.1 0.0
0
1
Au
die
nce
Siz
e
MI
LL
IO
NS
We
ek
ly R
ea
ch %
Data are from a January 2011 nationwide survey of adults (15+) in Uzbekistan.
Audience figures based on surveys conducted in politically repressive environments. Because individuals in these countries are discouraged or even prohibited by their governments from listening to U.S. international broadcasts, actual audience numbers may be higher than the ones cited here.
116
A U D I E N C E C O M P O S I T I O N
C O N T E X T
Stability Political Freedom Press Freedom Ease of Distribution Competition
Sample VOA
Weekly Aud.*
RFE/RL Weekly Aud.*
Sex % % %
Male 50 na na
Female 50 na na
Age
15-24 29 na na
25-34 26 na na
35-44 18 na na
45-54 14 na na
55-64 8 na na
65+ 5 na na
Sample VOA
Weekly Aud.*
RFE/RL Weekly Aud.*
Education % % %
None/Primary 1 na na
Secondary 58 na na
Technical 28 na na
Higher 13 na na
Ethnicity/Nationality
Uzbek 86 na na
Tajik 3 na na
Russian 2 na na
Other 10 na na
Sample VOA
Weekly Aud.*
RFE/RL Weekly Aud.*
Residence % % %
Urban 53 na na
Rural 47 na na
Language
Uzbek 86 na na
Tajik 4 na na
Russian 4 na na
Other 6 na na *Samples of VOA and RFE/RL weekly listeners in the survey are too small for meaningful analysis.
Uzbek Broadcasting Total Population of Uzbekistan: 28.5 million
Own TV Own Sat Dish
Own Cable
Weekly TV Use
Weekly TV Use
for News
99%
12% 7%
99% 96% TV
Own Cell Weekly Use SMS
Mobile Internet
Use
Weekly SMS Use for News
90%
3%
31%
Cell Phone
40%
Top Ten Media Outlets 1. TV Yoshlar 2. UZ TV 1 3. TV Sport (Tashkent) 4. Markaz TV
(Tashkent) 5. Vodiy Sadosy/
Echo Doliny 6. Uz Radio-4 Yoshlar 7. ORT-1 8. Uz Radio-2 Mashal 9. NTV 10. Namangan TV
Top Ten Sources of News 1. TV Yoshlar 2. Uz TV 1 3. TV Sport (Tashkent) 4. Darakchi 5. ORT-1 6. NTV 7. Vodiy Sadosy/
Echo Doliny 8. Uz Radio-4 Yoshlar 9. RTR 10. Uz Radio-2 Mashal
Political Situation • Freedom House Political Freedom Index (2011):
NOT FREE • Economist Intelligence Unit Instability (2010):
HIGH RISK • The political situation in Uzbekistan is dismal but stable.
The country remains one of the most repressive in the region. Stability is maintained by draconian measures restricting citizens from voicing any opposition to authorities.
• Uzbekistan’s president Islam Karimov started an unconstitutional third term in office in 2008. He and his clan continue to use their power to repress political opposition, freedom of speech, religion, and assembly. The country is also one of the most corrupt in the world -- ranked 177 out of 182 countries surveyed in Transparency International’s 2011 Corruption Perceptions Index.
• As in the Soviet era, the government maintains a system of surveillance of its citizens. It has a widespread network of ‘whistleblowers’ in the mahallas (neighborhood communities) who report to authorities suspicious activities of citizens. The system is also used to carry out surveillance at mosques.
M E D I A U S E
Media Environment • Freedom House Press Freedom Index (2011): NOT FREE • Reporters Without Borders Index (2011): 83.00 (157/179) • The government of Uzbekistan shows no signs of decreasing pressure on media outlets
or civil society despite a somewhat improved relationship with the EU and the UnitedStates in the last year. Complete control of mass media outlets, including the Internet, aswell as harassment of independent journalists, continued in 2011. There are noindependent media sources in Uzbekistan. Self-sustaining private media businesses arepractically nonexistent. TV, in particular, is heavily censored and used by the governmentmainly as a propaganda tool.
• The government has also taken new steps to control the Internet. According to IREX, the government applies sophisticated filtering technology to control the flow of informationvia the Internet. IREX information is supported by accounts from inside the country.According to Expert-Fikri, the government has recently purchased state-of-the-artfiltering software that blocks articles based on keywords and monitors social networksand blogs. The government has blocked the websites of international broadcasters forseveral years—not only Western ones, but also a number of Russia-originated sites thatreport on Uzbekistan, such as fergananews.com, centrasia.ru and uzmetronom.com.
• The spread of recent revolutionary movements across the Middle East will probably leadto further tightening of the Internet in Uzbekistan. As the reaction to the Osh events of2010 demonstrated, the Uzbekistani government is wary of the effects outside demonstrations could have on their internal situation. The Uzbekistani government usedpictures of violence in Osh on domestic TV to relay a message to Uzbekistanis thatrevolutions bring violence and suffering.
Own Radio
Weekly Radio Use
Weekly FM Use
Weekly MW Use
Weekly SW Use
Weekly Radio
Use for News
45% 52% 47%
3% 2%
46%
Radio
Own PC Internet Access
Weekly Internet
Use
Weekly Internet Use for News
11% 5% 6% 5%
Internet Web Analytics VOA Weekly Visitors 3,000 Weekly Visits 6,300
RFE/RL Weekly Visitors 18,500 Weekly Visits 102,600
117
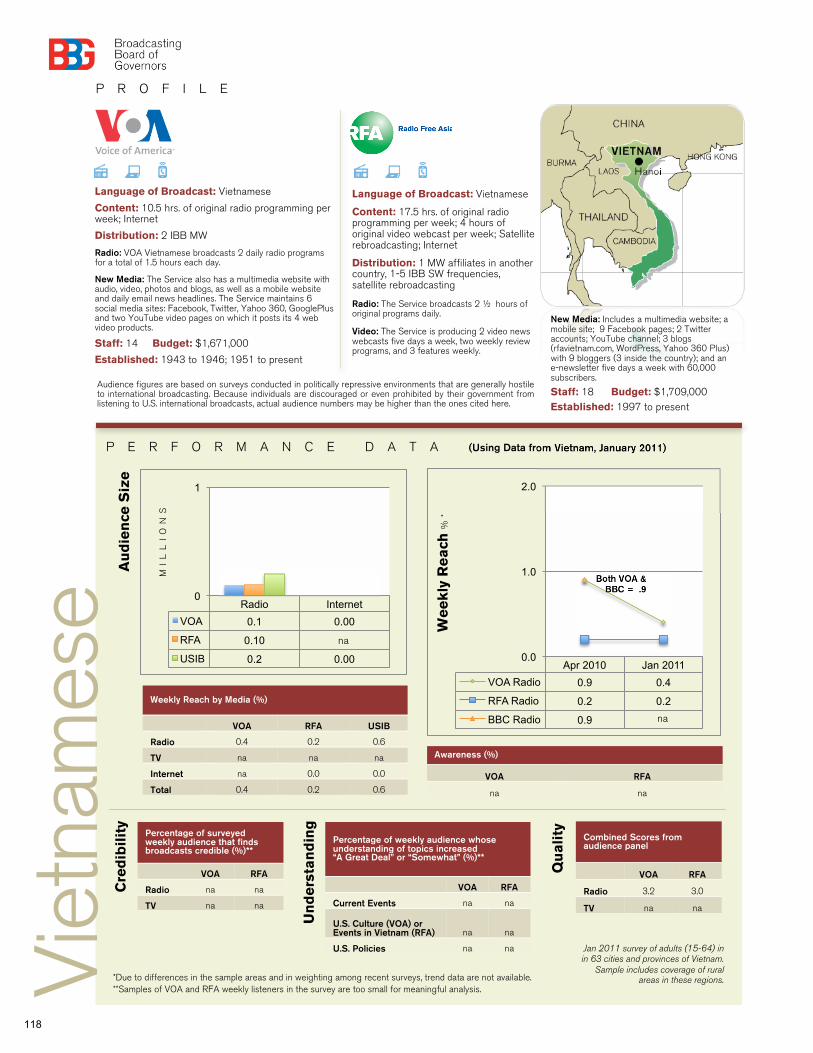
P R O F I L E
P E R F O R M A N C E D A T A (Using Data from Vietnam, January 2011)
Language of Broadcast: Vietnamese
Content: 10.5 hrs. of original radio programming per week; Internet
Distribution: 2 IBB MW
Radio: VOA Vietnamese broadcasts 2 daily radio programs for a total of 1.5 hours each day.
New Media: The Service also has a multimedia website with audio, video, photos and blogs, as well as a mobile website and daily email news headlines. The Service maintains 6 social media sites: Facebook, Twitter, Yahoo 360, GooglePlus and two YouTube video pages on which it posts its 4 web video products.
Staff: 14 Budget: $1,671,000
Established: 1943 to 1946; 1951 to present
Language of Broadcast: Vietnamese
Content: 17.5 hrs. of original radio programming per week; 4 hours of original video webcast per week; Satellite rebroadcasting; Internet
Distribution: 1 MW affiliates in another country, 1-5 IBB SW frequencies, satellite rebroadcasting
Radio: The Service broadcasts 2 ½ hours of original programs daily.
Video: The Service is producing 2 video news webcasts five days a week, two weekly review programs, and 3 features weekly.
Percentage of surveyed weekly audience that finds broadcasts credible (%)**
VOA RFA
Radio na na
TV na na
Percentage of weekly audience whose understanding of topics increased “A Great Deal” or “Somewhat” (%)**
VOA RFA
Current Events na na
U.S. Culture (VOA) or Events in Vietnam (RFA) na na
U.S. Policies na na
Combined Scores from audience panel
VOA RFA
Radio 3.2 3.0
TV na na
Cre
dib
ilit
y
Viet
nam
ese
Qu
ali
ty
Un
de
rsta
nd
ing
*Due to differences in the sample areas and in weighting among recent surveys, trend data are not available. **Samples of VOA and RFA weekly listeners in the survey are too small for meaningful analysis.
Weekly Reach by Media (%)
VOA RFA USIB
Radio 0.4 0.2 0.6
TV na na na
Internet na 0.0 0.0
Total 0.4 0.2 0.6
Awareness (%)
VOA RFA
na na
Apr 2010 Jan 2011
VOA Radio 0.9 0.4
RFA Radio 0.2 0.2
BBC Radio 0.9
0.0
1.0
2.0
Both VOA & BBC = .9
Radio Internet
VOA 0.1 0.00
RFA 0.10
USIB 0.2 0.00
0
1
Au
die
nce
Siz
e
MI
LL
IO
NS
We
ek
ly R
ea
ch %
*
Jan 2011 survey of adults (15-64) in in 63 cities and provinces of Vietnam.
Sample includes coverage of rural areas in these regions.
Audience figures are based on surveys conducted in politically repressive environments that are generally hostile to international broadcasting. Because individuals are discouraged or even prohibited by their government from listening to U.S. international broadcasts, actual audience numbers may be higher than the ones cited here.
New Media: Includes a multimedia website; a mobile site; 9 Facebook pages; 2 Twitter accounts; YouTube channel; 3 blogs (rfavietnam.com, WordPress, Yahoo 360 Plus) with 9 bloggers (3 inside the country); and an e-newsletter five days a week with 60,000 subscribers. Staff: 18 Budget: $1,709,000 Established: 1997 to present
na
na
118