Embed Size (px)
Citation preview
8/12/2019 Ser Sca0707
http://slidepdf.com/reader/full/ser-sca0707 1/137
Project Report
on
SPECIAL CENTRAL ASSISTANCE TO SCHEDULEDCASTES AND SCHEDULED TRIBES IN ANDHRA
PRADESH, MAHARASHTRA, ORISSA ANDTAMILNADU: AN EVALUATION STUDY
submitted to
PLANNING COMMISSIONGOVT. OF INDIA
NEW DELHI
by
Dr. P. SUDHAKARA REDDYProfessor
Dept. of Anthropology
SRI VENKATESWARA UNIVERSITYTIRUPATI – 517 502, A.P
1
8/12/2019 Ser Sca0707
http://slidepdf.com/reader/full/ser-sca0707 2/137
ACKNOWLEDGEMENTS
I am extremely thankful to the Planning Commission, Govt. of
India, New Delhi for the interest shown and for the finances provided forthe study. I am grateful to the Commissioners/ Directors of ST and SC
Welfare in the selected States. I am also thankful to the officials at
District, Taluk/Mandal and grass root level dealing with SCA in the
selected States.
I am very much grateful to Prof. D.K.Behera, Dept of Anthropology,
Sambalpur University, Sambalpur, for his co-operation in providing a
field investigator to work in the tribal areas of Orissa. I am thankful toMr. Shantanu Ozarkar, Dept. of Anthropology, University of Pune, Pune
for providing field investigator to work in the tribal areas of Maharashtra.
I am grateful to Shri Subba Rao, Bharatiya Vidya Bhavan, Mumbai for
sparing his son as field investigator to work in the tribal areas of
Maharashtra. I am grateful to Dr K.Raja Reddy, Vice –President, APMAS,
Hyderabad for his help in analysis of data and other suggestions in
preparing the report.
The project staff comprising of Miss Jyothsna, Research Co-
ordinator, Mr. K.Maheswara Raju, Chennai, Mr. Pradyumna Meher,
Sambalpur, Mrs. M. Sri VIdya, Tirupati, Mr. Chidvilas More, Pune and
Mr. Krishna Rao, Mumbai, Field investigatots who conducted fieldwork
for data collection, and computer feeding of data for analysis. I am
thankful to them for their patience and interest in successful completion
of the study.
I am very much indebted to a number of informants who belong to
SCs and STs in selected States. The word processing of the report
demanded substantial investment of skill and patience from Dr.K.Raja
Reddy and Mrs A.Swapna and I am thankful to them.
Tirupati (P.SUDHAKARA REDDY)
2
8/12/2019 Ser Sca0707
http://slidepdf.com/reader/full/ser-sca0707 3/137
CONTENTS
EXECUTIVE SUMM RY
FindingsFact sheet
CHAPTER-1: INTRODUCTION
1.1 Context of the Study 11.2 Objectives of the Study 51.3 Research Methodology 6
1.4 Limitations of the Study 91.5 Reporting Structure 9
CHAPTER-2: PROFILES
2.1 Profile of Respondents’ Households 112.2 Ministry of Social Justice & Empowerment 122.3 National schedule Casts finance & development
Corporation (NSFDC) 132.4 Assistance to Scheduled Castes Development
Corporations (SCDCs) 132.5 National Safai Karmacharis Finance &
Development Corporation (NSKFDC) 142.6 Ministry of Tribal Affairs 162.7 Sources of TSP Funds 162.8 Development of Forest Villages 232.9 Procedure for Approval of Projects 242.10 Fund Flow Mechanism 242.11 Grants under Article 275(1) of
The Constitution of India 242.12 Funding Pattern 242.13 Monitoring Mechanism 25
CHAPTER-3: PROFILES 26
3.1 Scheduled Castes 263.2 Scheduled Tribes 263.3 Profiles of Sample States 273.4 Profile of the Sample Households 363.5 Membership in SHGs 43
3
8/12/2019 Ser Sca0707
http://slidepdf.com/reader/full/ser-sca0707 4/137
CHAPTER-4: Awareness & Identification of 44
Beneficiaries
4.1 PIAs and Awareness 444.2 Means of Information Flow 454.3 Process of Identification of Beneficiaries 474.4 Choosing the Suitable Scheme 484.5 Awareness on Loan Lending and
Repayment Norms 484.6 Income Generation Activities 494.7 Rationale in Choosing Income Generation
Activity 504.8 Preferences in Selection of Beneficiaries 50
CHAPTER-5 PROCESS OF IMPLANTATION 53
5.1. Scheduled Castes Sub-Plan (SCSP) 535.2 Andhra Pradesh 535.3 Eligibility 575.4 Procedure of Grounding the Schemes 575.5 Self Help Groups 585.6 Individual Schemes 58
5.7 Steps in Monitoring 585.8 Tamilnadu 605.9 Twenty Point Programme 655.10 Tribal Sub-Plan (TSP) 605.11 Monitoring and Evaluation of TSP 695.12 Financial Outlays for Sectoral Proagrammes 705.13 State, Central and centrally sponsored Schemes 705.14 Development of PTGs 71
CHAPTER-6: REPAYMENT OF LOANS 73
6.1 Time Taken in Processing of Applications 736.2 Number of visits made to get FinancialAssistance 74
6.3 Subsidy Component 756.4 Agencies Providing Hand Holding Support 766.5 Components of Loan 776.6 Volume of Financial Assistance 776.7 Mode of Disbursement of Financial Assistance 786.8 Method of Repayment of Loans 796.9 Disbursement of Subsidy 806.10 Period of Repayment of Loan 81
6.11 Rate of Interest 826.12 Loans Outstanding 82
4
8/12/2019 Ser Sca0707
http://slidepdf.com/reader/full/ser-sca0707 5/137
6.13 Defaulting 836.14 Policy Change 83
CHAPTER-7: IMPACT 84
7.1 Peoples Participation and Response 847.2 Self Help Groups 857.3 Andhra Pradesh 867.4 Tamila Nadu 877.5 Maharashtra 887.6 Orissa 907.7 Economic Impact 917.8 Development of Assets 957.9 Response to other Development Programmes 97
CHAPTER-8: ISSUES AND CONCERNS
8.1 Awareness 1008.2 Identification of Beneficiaries 1008.3 Identification of Schemes 1018.4 Infrastructural Facilities 1018.5 Income Generation 1028.6 Employment Generation 1028.7 Constraints in Implementation of the Schemes 1028.8 Local Credit agencies/ Institutions 1038.9 Role of Local Leaders/Political Activists 1048.10 Problems in Group Activities 1048.11 Problems in Individual Activities 1058.12 Income Generation Schemes 1068.13 Financial Institutions/Agencies which
Extend loan Facilities 109
CHAPTER-9: SUMMARY AND CONCLUSIONS 112
9.1 Scheduled Castes Sub-Plan 1139.2 Objectives of the Study 1169.3 Methodology Adapted 117
9.4 Analysis and Results 1179.5 Identification of Beneficiaries 1189.6 Choosing Suitable Schemes 1199.7 Self Help Groups (SHGs) 1209.8 Individual Schemes 1209.9 Bank Linkages 1209.10 Infrastructural Facilities 1219.11 Implementation and Utilization of Grants 1219.12 Monitoring 1239.13 Suggestions 1259.14 Suggestions Given by the Respondents 129
5
8/12/2019 Ser Sca0707
http://slidepdf.com/reader/full/ser-sca0707 6/137
REFERENCES: 132
CHAPTER-1: INTRODUCTION
1.1 Context of the study
The Scheduled Castes, since ages, have been victims of socio-economic
exploitation and have been relegated to low income generating
occupations, inferior trades, unhygienic environment and unclean menial
occupations. Although overt untouchability practices may be declining in
many parts of the country, caste rigidities continue to confine many
Scheduled Caste workers in demeaning occupations, which put them at a
disadvantage when compared to other communities. The forces of
urbanization, social and protective legislations, positive discrimination
and other measures taken by the Government, have led to gradual
improvement in occupational mobility and living standards over the
years, but the living conditions of the majority of Scheduled Castes
continue to show socio-economic backwardness.
The Scheduled Caste (SC) population, according to 2001 Census, is
166.6 million constituting 16.23 per cent of the total population of India.
They are mainly concentrated in Uttar Pradesh (35.1 million), West
Bengal (18.4 million), Tamilnadu (11.8 million), Andhra Pradesh (12.3
million) and Bihar (11.3 million). These States account for 53.36 per centof the total SC population of the country.
Scheduled Tribe (ST) communities are characterized by their distinctive
culture, geographical isolation, shyness of contact with community at
large and socio-economic backwardness. According to the 2001 Census,
the population of Scheduled Tribes (STs) is 84.3 million constituting 8.2
per cent of the total population of the country. More than half of the
Scheduled Tribe population is concentrated in the five States of Madhya
6
8/12/2019 Ser Sca0707
http://slidepdf.com/reader/full/ser-sca0707 7/137
Pradesh (14.51%), Maharashtra (10.17%), Orissa (9.66%), Gujarat
(8.87%), and Rajasthan (8.42%). At the district level, there are 75
districts where ST population is 50 per cent or more as per the 2001
Census. While 91.7 per cent of STs live in rural areas, only 8.3 per centlive in urban areas.
The overall development of the Scheduled Castes (SCs) and Scheduled
Tribes (STs) has been a declared policy of the successive governments in
independent India. Efforts in this direction have aimed at the social,
economic and political upliftment of these groups to bring them at par
with other sections of society through various safeguards and provisions.
Since independence, new strategies and schemes for accelerated
development have been evolved and programmes implemented with a
view to bring the SCs and STs in to the mainstream of the Indian society.
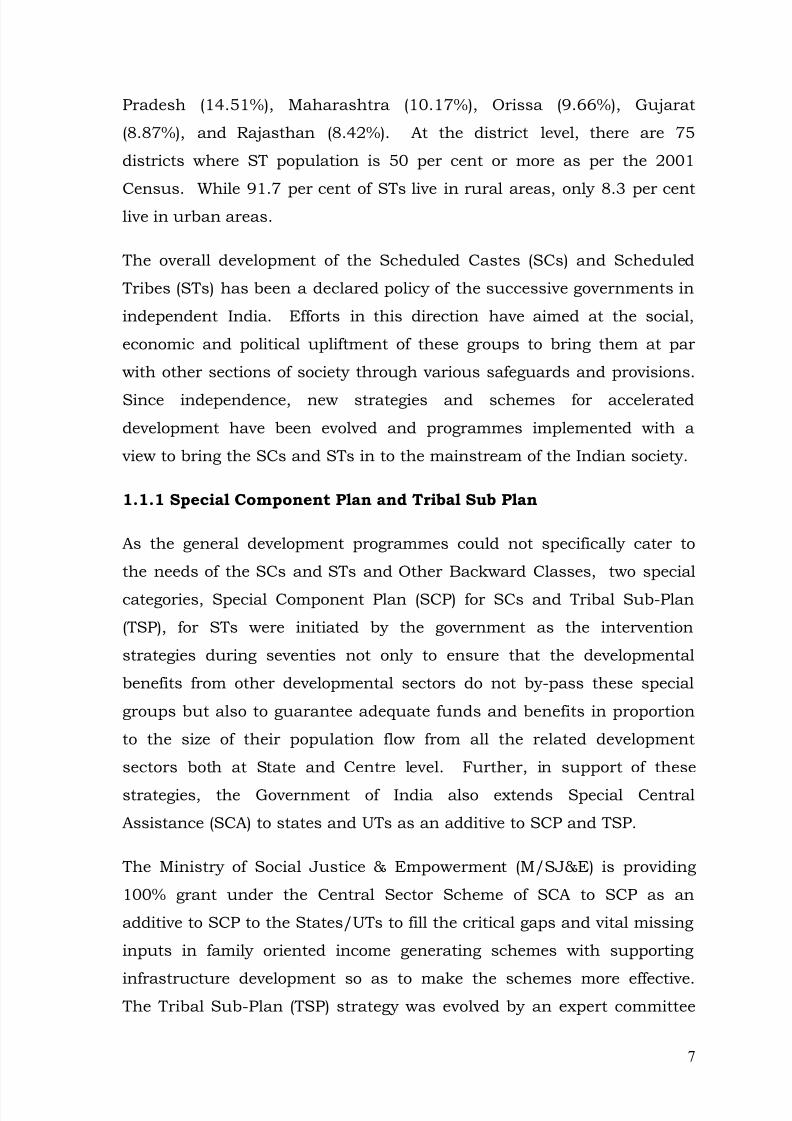
1.1.1 Special Component Plan and Tribal Sub Plan
As the general development programmes could not specifically cater to
the needs of the SCs and STs and Other Backward Classes, two special
categories, Special Component Plan (SCP) for SCs and Tribal Sub-Plan
(TSP), for STs were initiated by the government as the intervention
strategies during seventies not only to ensure that the developmental
benefits from other developmental sectors do not by-pass these special
groups but also to guarantee adequate funds and benefits in proportion
to the size of their population flow from all the related development
sectors both at State and Centre level. Further, in support of these
strategies, the Government of India also extends Special Central
Assistance (SCA) to states and UTs as an additive to SCP and TSP.
The Ministry of Social Justice & Empowerment (M/SJ&E) is providing
100% grant under the Central Sector Scheme of SCA to SCP as an
additive to SCP to the States/UTs to fill the critical gaps and vital missing
inputs in family oriented income generating schemes with supporting
infrastructure development so as to make the schemes more effective. The Tribal Sub-Plan (TSP) strategy was evolved by an expert committee
7
8/12/2019 Ser Sca0707
http://slidepdf.com/reader/full/ser-sca0707 8/137
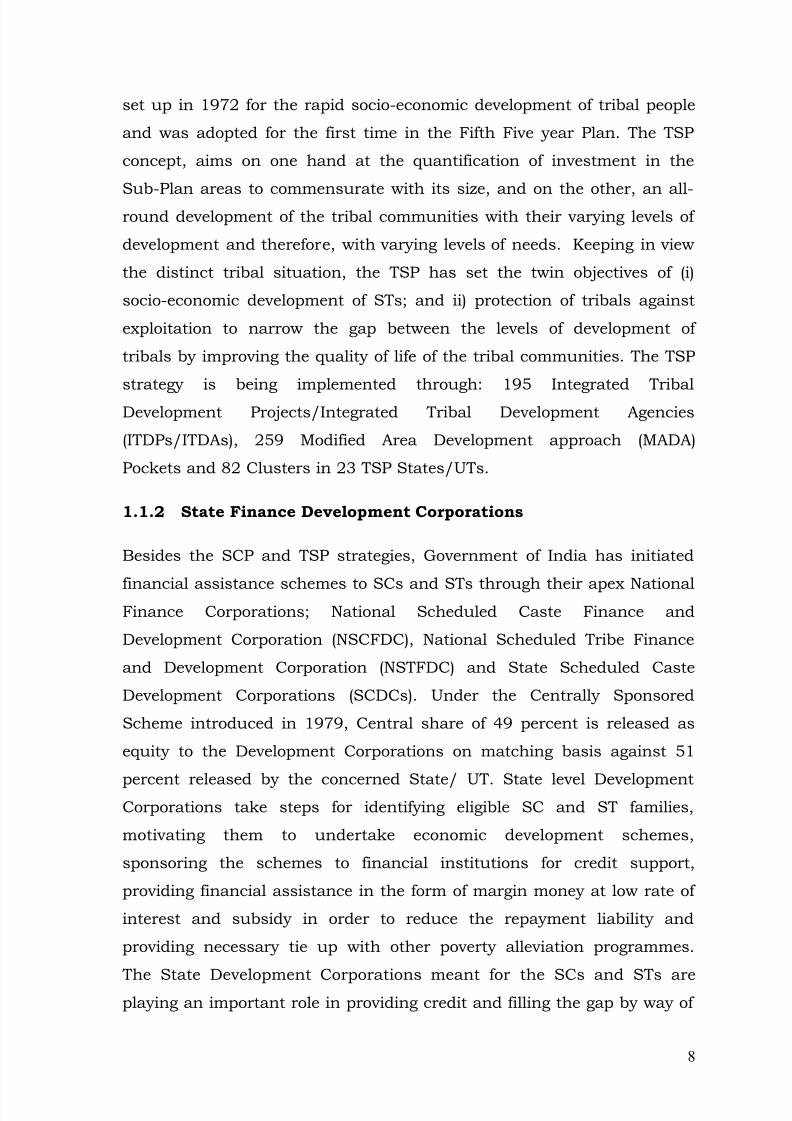
set up in 1972 for the rapid socio-economic development of tribal people
and was adopted for the first time in the Fifth Five year Plan. The TSP
concept, aims on one hand at the quantification of investment in the
Sub-Plan areas to commensurate with its size, and on the other, an all-round development of the tribal communities with their varying levels of
development and therefore, with varying levels of needs. Keeping in view
the distinct tribal situation, the TSP has set the twin objectives of (i)
socio-economic development of STs; and ii) protection of tribals against
exploitation to narrow the gap between the levels of development of
tribals by improving the quality of life of the tribal communities. The TSP
strategy is being implemented through: 195 Integrated TribalDevelopment Projects/Integrated Tribal Development Agencies
(ITDPs/ITDAs), 259 Modified Area Development approach (MADA)
Pockets and 82 Clusters in 23 TSP States/UTs.
1.1.2 State Finance Development Corporations
Besides the SCP and TSP strategies, Government of India has initiated
financial assistance schemes to SCs and STs through their apex NationalFinance Corporations; National Scheduled Caste Finance and
Development Corporation (NSCFDC), National Scheduled Tribe Finance
and Development Corporation (NSTFDC) and State Scheduled Caste
Development Corporations (SCDCs). Under the Centrally Sponsored
Scheme introduced in 1979, Central share of 49 percent is released as
equity to the Development Corporations on matching basis against 51
percent released by the concerned State/ UT. State level DevelopmentCorporations take steps for identifying eligible SC and ST families,
motivating them to undertake economic development schemes,
sponsoring the schemes to financial institutions for credit support,
providing financial assistance in the form of margin money at low rate of
interest and subsidy in order to reduce the repayment liability and
providing necessary tie up with other poverty alleviation programmes.
The State Development Corporations meant for the SCs and STs areplaying an important role in providing credit and filling the gap by way of
8
8/12/2019 Ser Sca0707
http://slidepdf.com/reader/full/ser-sca0707 9/137
margin money loans, bridge loans, micro finance and subsidy to the
target group as channelising agencies of National apex Corporations.
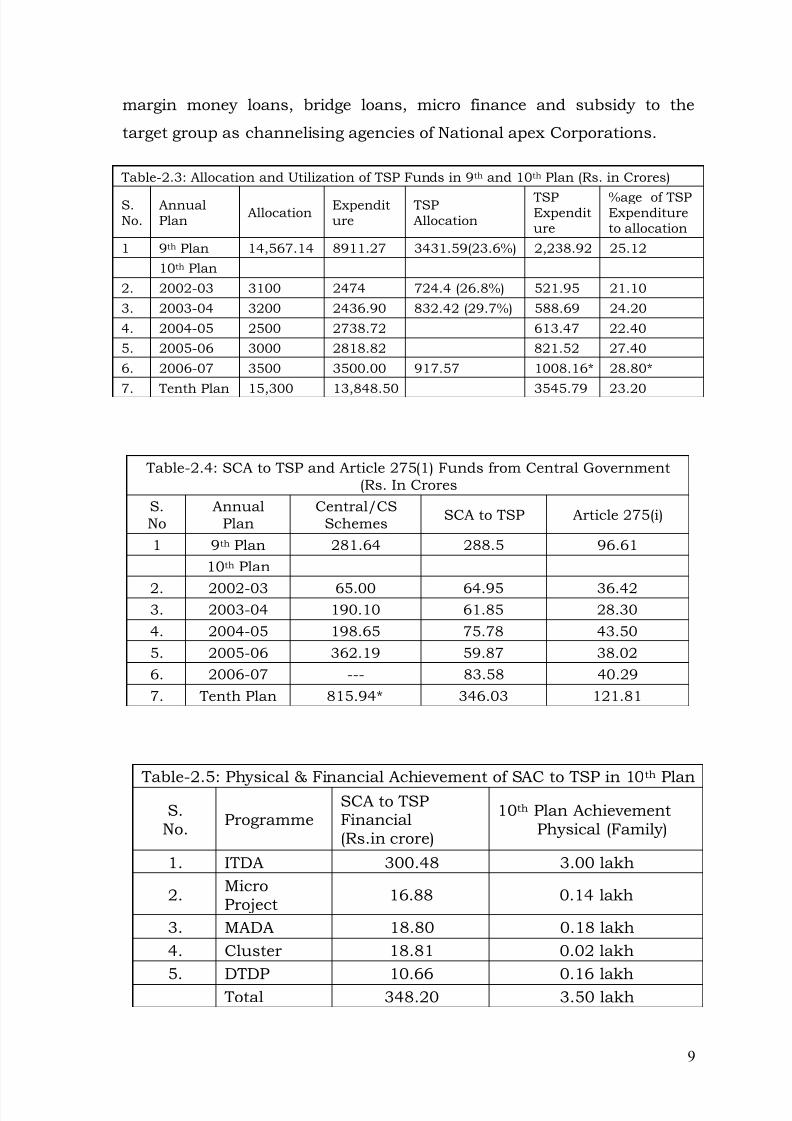
Table-2.3: Allocation and Utilization of TSP Funds in 9 th and 10 th Plan (Rs. in Crores)
S.No.
AnnualPlan Allocation Expendit
ure TSPAllocation
TSPExpenditure
%age of TSPExpenditureto allocation
1 9 th Plan 14,567.14 8911.27 3431.59(23.6%) 2,238.92 25.1210 th Plan
2. 2002-03 3100 2474 724.4 (26.8%) 521.95 21.103. 2003-04 3200 2436.90 832.42 (29.7%) 588.69 24.204. 2004-05 2500 2738.72 613.47 22.405. 2005-06 3000 2818.82 821.52 27.406. 2006-07 3500 3500.00 917.57 1008.16* 28.80*
7. Tenth Plan 15,300 13,848.50 3545.79 23.20
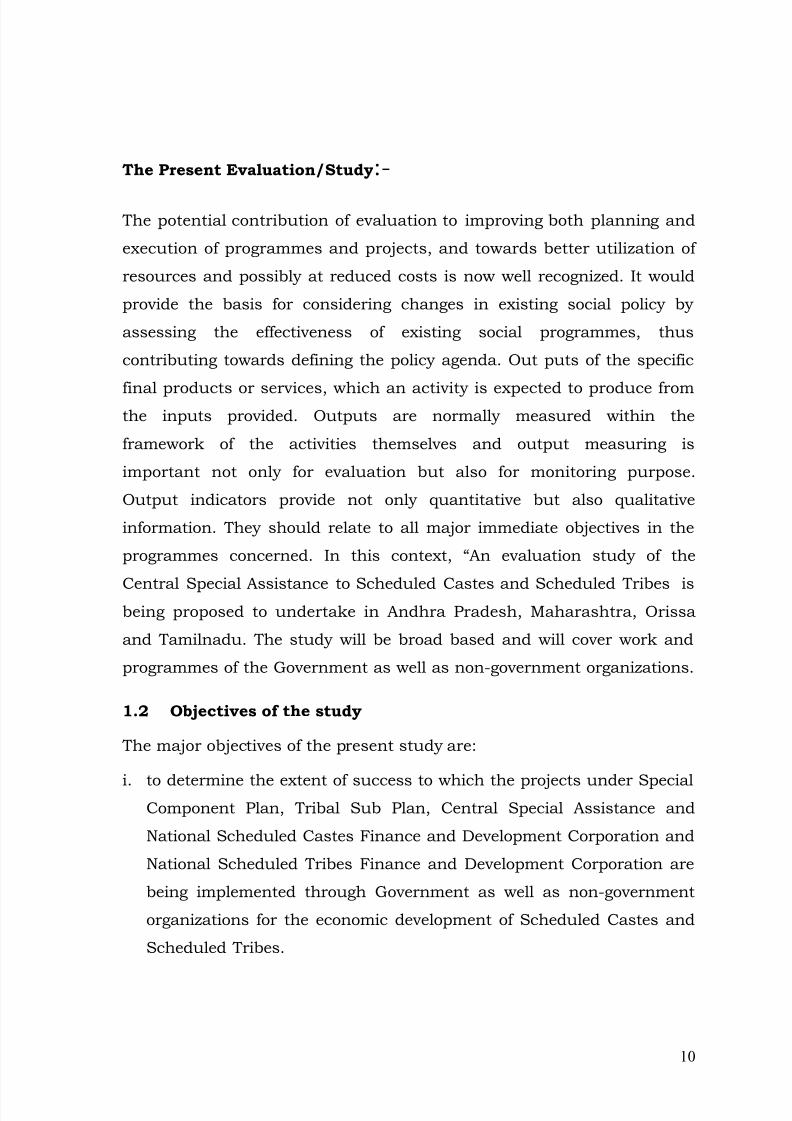
Table-2.4: SCA to TSP and Article 275(1) Funds from Central Government(Rs. In Crores
S.No
AnnualPlan
Central/CSSchemes SCA to TSP Article 275(i)
1 9 th Plan 281.64 288.5 96.6110 th Plan
2. 2002-03 65.00 64.95 36.423. 2003-04 190.10 61.85 28.304. 2004-05 198.65 75.78 43.505. 2005-06 362.19 59.87 38.026. 2006-07 --- 83.58 40.297. Tenth Plan 815.94* 346.03 121.81
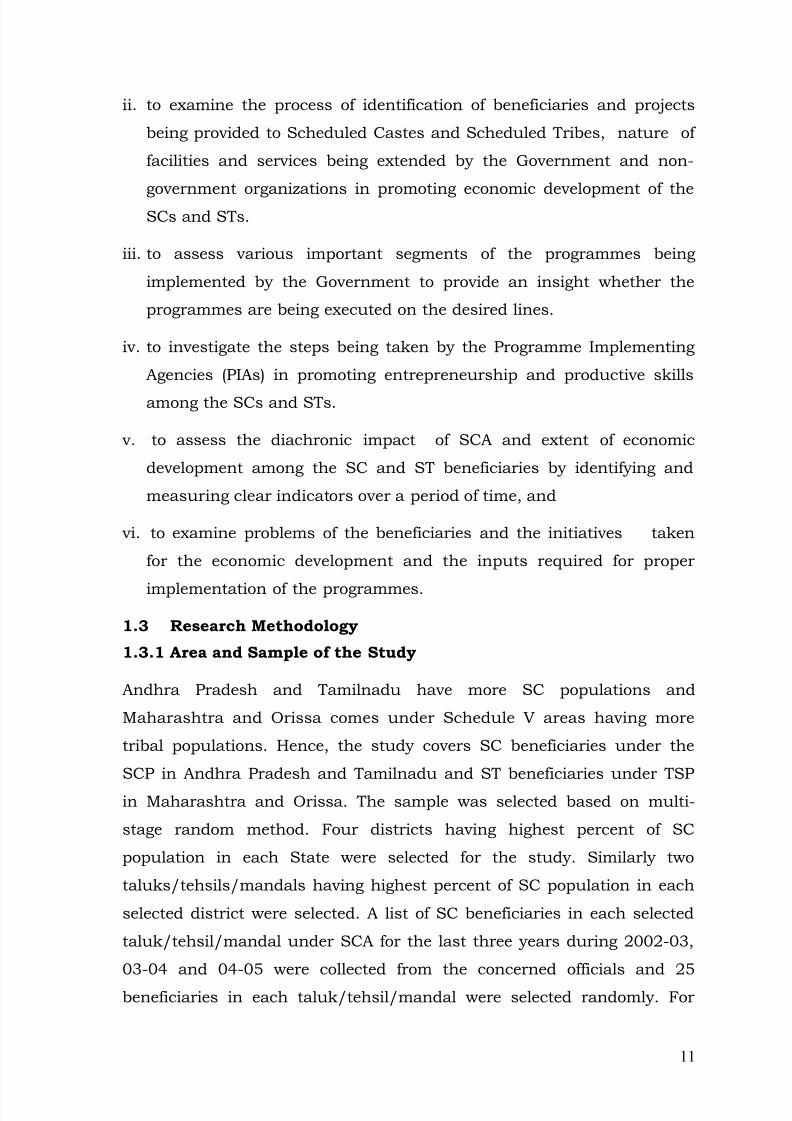
Table-2.5: Physical & Financial Achievement of SAC to TSP in 10 th Plan
S.No. Programme
SCA to TSPFinancial(Rs.in crore)
10 th Plan AchievementPhysical (Family)
1. ITDA 300.48 3.00 lakh
2. MicroProject 16.88 0.14 lakh
3. MADA 18.80 0.18 lakh4. Cluster 18.81 0.02 lakh
5. DTDP 10.66 0.16 lakh Total 348.20 3.50 lakh
9
8/12/2019 Ser Sca0707
http://slidepdf.com/reader/full/ser-sca0707 10/137
The Present Evaluation/Study :-
The potential contribution of evaluation to improving both planning and
execution of programmes and projects, and towards better utilization of
resources and possibly at reduced costs is now well recognized. It would
provide the basis for considering changes in existing social policy by
assessing the effectiveness of existing social programmes, thus
contributing towards defining the policy agenda. Out puts of the specific
final products or services, which an activity is expected to produce fromthe inputs provided. Outputs are normally measured within the
framework of the activities themselves and output measuring is
important not only for evaluation but also for monitoring purpose.
Output indicators provide not only quantitative but also qualitative
information. They should relate to all major immediate objectives in the
programmes concerned. In this context, “An evaluation study of the
Central Special Assistance to Scheduled Castes and Scheduled Tribes isbeing proposed to undertake in Andhra Pradesh, Maharashtra, Orissa
and Tamilnadu. The study will be broad based and will cover work and
programmes of the Government as well as non-government organizations.
1.2 Objectives of the study
The major objectives of the present study are:
i.
to determine the extent of success to which the projects under SpecialComponent Plan, Tribal Sub Plan, Central Special Assistance and
National Scheduled Castes Finance and Development Corporation and
National Scheduled Tribes Finance and Development Corporation are
being implemented through Government as well as non-government
organizations for the economic development of Scheduled Castes and
Scheduled Tribes.
10
8/12/2019 Ser Sca0707
http://slidepdf.com/reader/full/ser-sca0707 11/137
ii. to examine the process of identification of beneficiaries and projects
being provided to Scheduled Castes and Scheduled Tribes, nature of
facilities and services being extended by the Government and non-
government organizations in promoting economic development of theSCs and STs.
iii. to assess various important segments of the programmes being
implemented by the Government to provide an insight whether the
programmes are being executed on the desired lines.
iv. to investigate the steps being taken by the Programme Implementing
Agencies (PIAs) in promoting entrepreneurship and productive skills
among the SCs and STs.
v. to assess the diachronic impact of SCA and extent of economic
development among the SC and ST beneficiaries by identifying and
measuring clear indicators over a period of time, and
vi. to examine problems of the beneficiaries and the initiatives taken
for the economic development and the inputs required for proper
implementation of the programmes.
1.3 Research Methodology
1.3.1 Area and Sample of the Study
Andhra Pradesh and Tamilnadu have more SC populations and
Maharashtra and Orissa comes under Schedule V areas having more
tribal populations. Hence, the study covers SC beneficiaries under the
SCP in Andhra Pradesh and Tamilnadu and ST beneficiaries under TSP
in Maharashtra and Orissa. The sample was selected based on multi-
stage random method. Four districts having highest percent of SC
population in each State were selected for the study. Similarly two
taluks/tehsils/mandals having highest percent of SC population in each
selected district were selected. A list of SC beneficiaries in each selected
taluk/tehsil/mandal under SCA for the last three years during 2002-03,
03-04 and 04-05 were collected from the concerned officials and 25
beneficiaries in each taluk/tehsil/mandal were selected randomly. For
11
8/12/2019 Ser Sca0707
http://slidepdf.com/reader/full/ser-sca0707 12/137
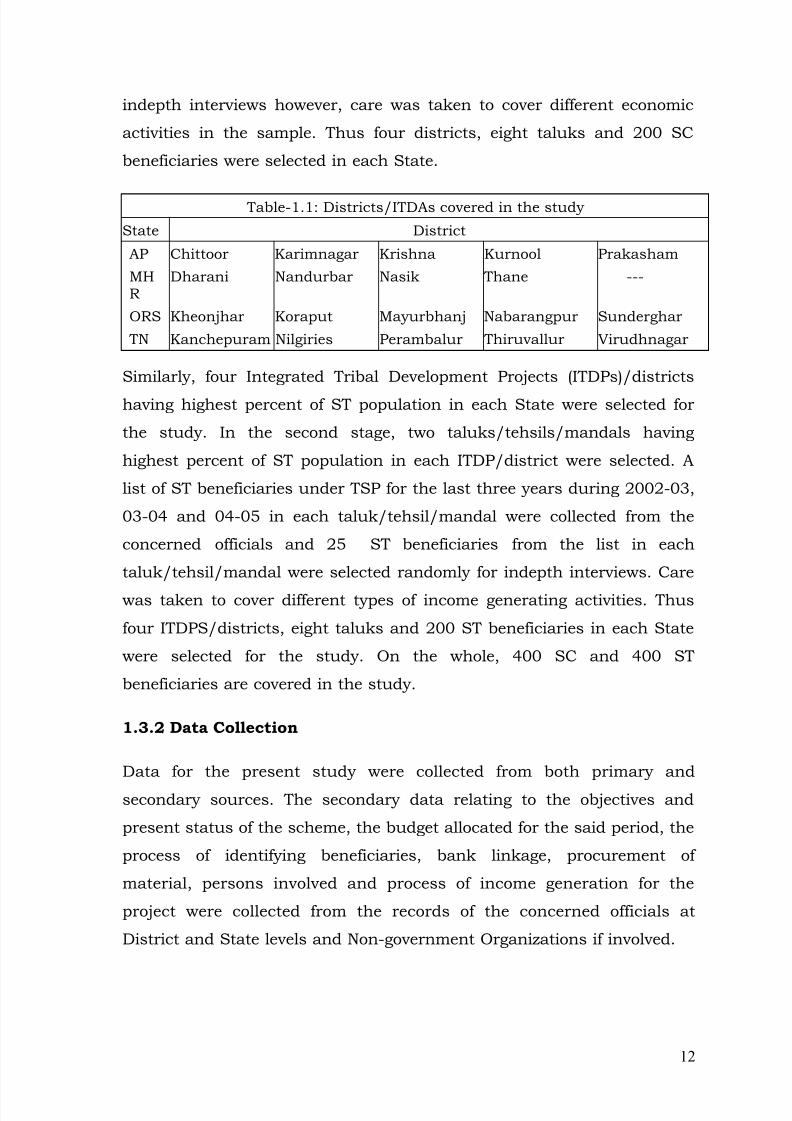
indepth interviews however, care was taken to cover different economic
activities in the sample. Thus four districts, eight taluks and 200 SC
beneficiaries were selected in each State.
Table-1.1: Districts/ITDAs covered in the study
State District
AP Chittoor Karimnagar Krishna Kurnool Prakasham
MHR
Dharani Nandurbar Nasik Thane ---
ORS Kheonjhar Koraput Mayurbhanj Nabarangpur Sunderghar
TN Kanchepuram Nilgiries Perambalur Thiruvallur Virudhnagar
Similarly, four Integrated Tribal Development Projects (ITDPs)/districts
having highest percent of ST population in each State were selected for
the study. In the second stage, two taluks/tehsils/mandals having
highest percent of ST population in each ITDP/district were selected. A
list of ST beneficiaries under TSP for the last three years during 2002-03,
03-04 and 04-05 in each taluk/tehsil/mandal were collected from the
concerned officials and 25 ST beneficiaries from the list in each
taluk/tehsil/mandal were selected randomly for indepth interviews. Care
was taken to cover different types of income generating activities. Thus
four ITDPS/districts, eight taluks and 200 ST beneficiaries in each State
were selected for the study. On the whole, 400 SC and 400 ST
beneficiaries are covered in the study.
1.3.2 Data Collection
Data for the present study were collected from both primary and
secondary sources. The secondary data relating to the objectives and
present status of the scheme, the budget allocated for the said period, the
process of identifying beneficiaries, bank linkage, procurement of
material, persons involved and process of income generation for the
project were collected from the records of the concerned officials at
District and State levels and Non-government Organizations if involved.
12
8/12/2019 Ser Sca0707
http://slidepdf.com/reader/full/ser-sca0707 13/137
The primary data were collected through anthropological fieldwork
including observation, interview schedule, formal and informal
discussions including focus group discussion (FGD) and case study
method. An interview schedule was prepared for the collection of primarydata from the selected beneficiaries. The interview schedule includes
questions relating to socio-economic profile of the beneficiary, awareness
of the schemes, process of applying and getting the assistance under
SCA, problems faced and opinion on getting sanction of the scheme,
establishment and present status of the economic unit, goals and
objectives of the scheme, persons involved, size of accommodation,
infrastructure facilities, their pertinence to the present status, extent ofasset development and income generation, expected and actual inputs
and outputs of the programme. New inputs required for proper
implementation of the programme were also be collected. Output and
input indicators were prepared to measure the effectiveness of the
programme. The questions relating to impact of SCA on the socio-
economic life of the beneficiaries are included in the schedule. The
programme implementing agencies (PIAs) at different levels were
interviewed for getting information relating to implementation of the
programme. The year 2002-03 is considered as base year to study the
impact of the programmes under SCA.
The data through direct observation are as a rule, preferable to data
collected through interview schedules. Inspection as a special on the spot
investigation, either scheduled or unscheduled provided lot of
information to identify facts in actual implementation of the programme.
The management of data includes scrutiny of filled-in schedules and the
preparation of tabulation plan. The data and other qualitative
information were processed using computer on the basis of tabulation
plan prepared for the purpose taking into account the objectives of the
evaluation, the quality and spread of data gathered and the conclusion to
be derived.
1.3.3 Data Analysis
13
8/12/2019 Ser Sca0707
http://slidepdf.com/reader/full/ser-sca0707 14/137
The data were entered in to computer using SPSS software. The
relationships were identified between different variables to prepare tables
keeping in mind the objectives of the study.
1.3.4 Study Team
The study team consists of a Project Director, one co-ordinator, four field
investigators and one computer operator cum clerk. One field
investigator was appointed from each State under study to avoid
language barrier. They visited the rural/tribal areas in their respective
States for collection of both primary and secondary data.
1.3.5 Fieldwork
The Project Director visited the field area to train and introduce the Field
Investigators to the field.
1.4 Limitations of the study
The officials at ITDA level have not given the list of beneficiaries on time
and some of them have not shown much interest in assisting the
investigators. A few of the benificiaries could not be traced because of the
incorrect addresses provided by the concerned officials at the district
head quarters.
1.5 Reporting Structure
The data were analyzed and presented in nine chapters. The importance
and objectives of the study and the methodology followed are discussed
in the first chapter. The second chapter gives a brief introduction on
Special Central Assistance in the States under Study. The socio-economic
profile of the SC and ST beneficiaries under study are discussed in third
chapter. Awareness and the process of identification and selection of
beneficiaries, sanctioning financial assistance under SCA are discussedin fourth chapter. The process of implementation and problems faced by
14
8/12/2019 Ser Sca0707
http://slidepdf.com/reader/full/ser-sca0707 15/137
the beneficiaries in accessing the scheme and opinion of the beneficiaries
on the scheme are discussed in fifth chapter. The process of repayment of
loans and margin money are discussed in sixth chapter. The functioning
of economic units, extent of asset development and income generationare discussed in seventh chapter. The eighth chapter deals with the
issues and problems in the implementation of SCA. The last chapter
provides the summary and conclusions.
15
8/12/2019 Ser Sca0707
http://slidepdf.com/reader/full/ser-sca0707 16/137
CHAPTER-2:
SPECIAL CENTRAL ASSISTANCE (SCA)
Sixth Five Year Plan (1980-85) is the first plan which placed due
emphasis on the development of SCs in terms of Special Component Plan
- a new strategy for comprehensive development with due share of
benefits in physical and financial terms from various programmes of
every sector through cluster and saturation approach. During Seventh
and Eighth Five Year Plans economic development for individual families
and groups of families of SCs, liberation of scavengers and provision of
employment to the sanitation workers; enactment of the Prevention of
Atrocities (POA) Act, 1989, promotion of Voluntary Organizations for
training and mobilizing community resources. The Ninth and Tenth Five
Year Plans emphasized ‘SCs Participation' in the development process
through Panchayati Raj Institutions and the strategies adopted are Social
Empowerment; Economic Empowerment; Social Justice to accelerate the
on-going process of improving the socio-economic status of the SCs.
Ministry of Social Justice & Empowerment utilized funds of Rs. 4923
crores during 10 th plan, which includes Rs. 2070 crores under SCA to
SCP for various income generating schemes and infrastructure facilities
to SCs by the States/U.Ts in the country for the developmentalprogrammes of SCs in the country
2.1 Scheduled Castes Sub-Plan (SCSP)
The nomenclature of Special Component Plan for Scheduled Castes has
been renamed as Scheduled Castes Sub-Plan (SCSP) on the lines of
Tribal Sub Plan to make the beneficiaries aware of the programme meant
for them. The strategy of Scheduled Castes Sub-Plan (SCSP) is one of the
most important interventions through the planning process for social,
16
8/12/2019 Ser Sca0707
http://slidepdf.com/reader/full/ser-sca0707 17/137
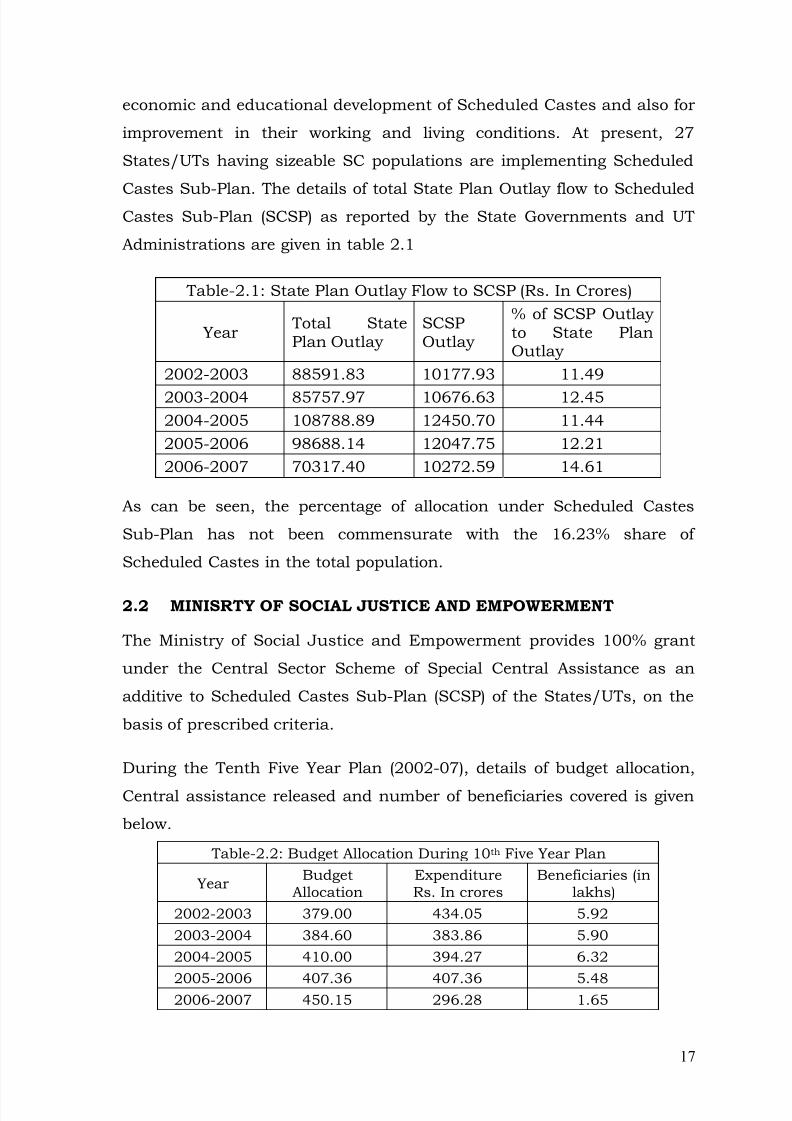
economic and educational development of Scheduled Castes and also for
improvement in their working and living conditions. At present, 27
States/UTs having sizeable SC populations are implementing Scheduled
Castes Sub-Plan. The details of total State Plan Outlay flow to ScheduledCastes Sub-Plan (SCSP) as reported by the State Governments and UT
Administrations are given in table 2.1
Table-2.1: State Plan Outlay Flow to SCSP (Rs. In Crores)
Year Total StatePlan Outlay
SCSPOutlay
% of SCSP Outlayto State PlanOutlay
2002-2003 88591.83 10177.93 11.49
2003-2004 85757.97 10676.63 12.452004-2005 108788.89 12450.70 11.442005-2006 98688.14 12047.75 12.212006-2007 70317.40 10272.59 14.61
As can be seen, the percentage of allocation under Scheduled Castes
Sub-Plan has not been commensurate with the 16.23% share of
Scheduled Castes in the total population.
2.2 MINISRTY OF SOCIAL JUSTICE AND EMPOWERMENT
The Ministry of Social Justice and Empowerment provides 100% grant
under the Central Sector Scheme of Special Central Assistance as an
additive to Scheduled Castes Sub-Plan (SCSP) of the States/UTs, on the
basis of prescribed criteria.
During the Tenth Five Year Plan (2002-07), details of budget allocation,
Central assistance released and number of beneficiaries covered is given
below.
Table-2.2: Budget Allocation During 10 th Five Year Plan
Year BudgetAllocation
ExpenditureRs. In crores
Beneficiaries (inlakhs)
2002-2003 379.00 434.05 5.922003-2004 384.60 383.86 5.902004-2005 410.00 394.27 6.32
2005-2006 407.36 407.36 5.482006-2007 450.15 296.28 1.65
17
8/12/2019 Ser Sca0707
http://slidepdf.com/reader/full/ser-sca0707 18/137
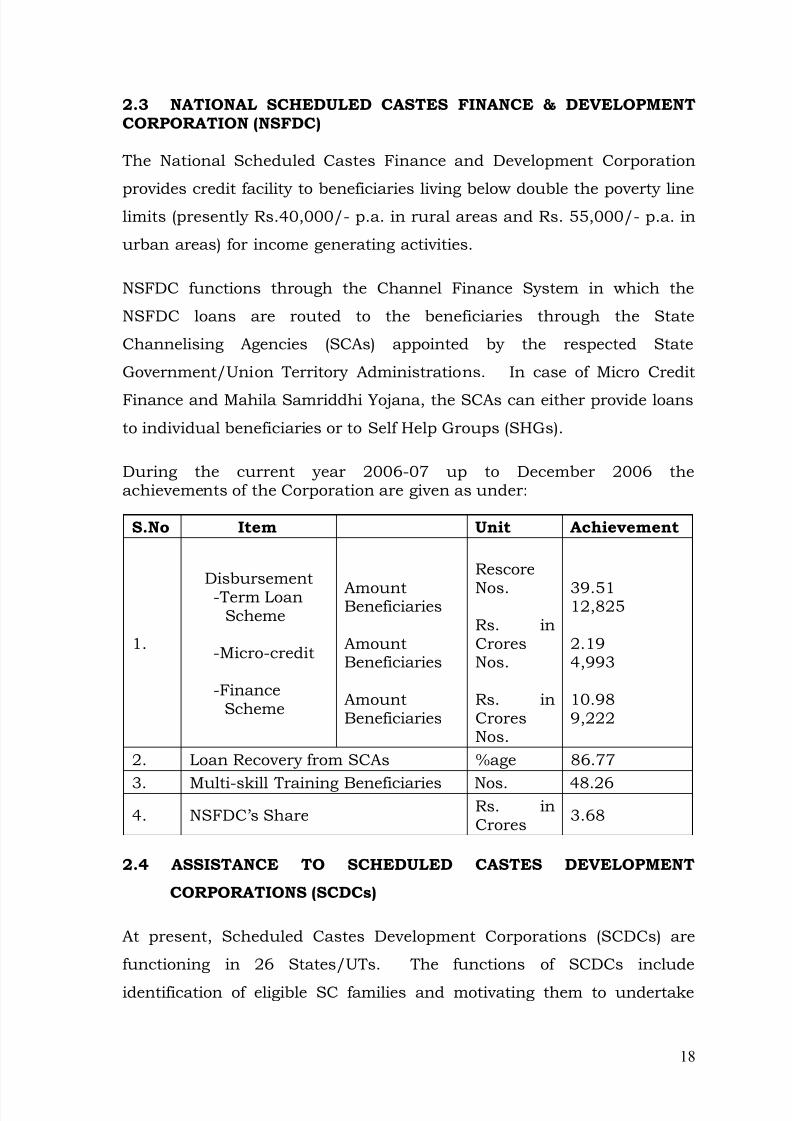
2.3 NATIONAL SCHEDULED CASTES FINANCE & DEVELOPMENTCORPORATION (NSFDC)
The National Scheduled Castes Finance and Development Corporation
provides credit facility to beneficiaries living below double the poverty linelimits (presently Rs.40,000/- p.a. in rural areas and Rs. 55,000/- p.a. in
urban areas) for income generating activities.
NSFDC functions through the Channel Finance System in which the
NSFDC loans are routed to the beneficiaries through the State
Channelising Agencies (SCAs) appointed by the respected State
Government/Union Territory Administrations. In case of Micro Credit
Finance and Mahila Samriddhi Yojana, the SCAs can either provide loans
to individual beneficiaries or to Self Help Groups (SHGs).
During the current year 2006-07 up to December 2006 theachievements of the Corporation are given as under:
S.No Item Unit Achievement
1.
Disbursement-Term Loan
Scheme
-Micro-credit
-FinanceScheme
AmountBeneficiaries
AmountBeneficiaries
AmountBeneficiaries
Rescore
Nos.
Rs. inCroresNos.
Rs. inCroresNos.
39.5112,825
2.194,993
10.989,222
2. Loan Recovery from SCAs %age 86.77
3. Multi-skill Training Beneficiaries Nos. 48.264. NSFDC’s Share Rs. in
Crores 3.68
2.4 ASSISTANCE TO SCHEDULED CASTES DEVELOPMENT
CORPORATIONS (SCDCs)
At present, Scheduled Castes Development Corporations (SCDCs) are
functioning in 26 States/UTs. The functions of SCDCs include
identification of eligible SC families and motivating them to undertake
18
8/12/2019 Ser Sca0707
http://slidepdf.com/reader/full/ser-sca0707 19/137
economic development schemes, sponsoring the schemes to financial
institutions for credit support, providing financial assistance in the form
of margin money at low rate of interest and subsidy in order to reduce
the repayment liability and providing necessary tie up with other povertyalleviation programmes. The SCDCs are playing an important role in
providing credit and missing inputs by way of margin money loans and
subsidy to the target group.
The SCDCs finance employment oriented schemes covering: (i)
Agriculture and allied activities including minor irrigation, (ii) Small Scale
Industry, (iii) Transport and (iv) Trade and Service Sector. SCDCs
finance projects by dovetailing loan component from NSFDC/banks along
with margin money out of their own funds and subsidy out of Special
Central Assistance (SCA).
2.5 NATIONAL SAFAI KARAMCHARIS FINANCE AND
DEVELOPMENT CORPORATION (NSKFDC)
The Mission NSKFDC is to empower the Safai Karamcharis, Scavengers
and their dependents to break them away from traditional occupation,
depressed social condition and poverty and to provide leverage to them to
work their own way up the social and economic ladder with dignity and
pride. The following are the objectives of the Scheme.
1. To promote socio-economic upliftment of Safai
Karamcharis/Scavengers and their dependents by way of providing
financial assistance at concessional rates of interest for any incomegenerating activity through out the country through the State
Channelising Agencies (SCAs).
2. To provide technical and professional training, quality control,
technology up-gradation and common facility centers for carrying
out sanitation works;
19
8/12/2019 Ser Sca0707
http://slidepdf.com/reader/full/ser-sca0707 20/137
The scheme was introduced w.e.f 01.10.2003. Loan under Mahila
Samridhi Yojana is provided to Safai Karmacharis and Scavenger women
and their dependent daughters up to Rs.25,000/- per beneficiary at an
interest rate of 1% per annum from NSKFDC to SCA and 4% per annumfrom SCA to beneficiary.
The reviews also brought out the tardy implementation of the SCP and
TSP by the various States/U.Ts and Central Ministries/Departments,
lacunae in policy implementation, allocation and utilization of funds,
structural inadequacies at the National, State, District, Block and village
level and a need for periodical status reviews and evaluation on the
impact. So, the present study was undertaken for a detailed analysis of
SCP and TSP implementation and monitoring mechanism in the selected
States viz., Andhra Pradesh, Maharashtra, Orissa and Tamilnadu.
The Ministry of Tribal Affairs is implementing about 10 Central Sector
(CS) and 6 Centrally Sponsored Schemes (CSS) for social and economic
empowerment of the tribals. Under ‘Economic Empowerment’ schemes
relating to income generating activities like Vocational Training Centres,National Scheduled Tribe Finance and Development Corporation for
financial assistance with low rate of interest to STs particularly BPL and
women beneficiaries; State Scheduled Tribe Development & Finance
Corporations (SSTDFCs) for assisting entrepreneurship development;
Tribal Co-operative Marketing Development Federation of India Ltd
(TRIFED) for marketing assistance and remunerative prices of the Minor
Forest Produce and surplus agricultural produce. The Ministry of TribalAffairs had released Rs. 641 crores during 9 th Plan for various CS and
CSS and this was doubled to about Rs. 1,322.40 crores during 10 th Plan.
The other point that emerges out is that, the Ministry is releasing funds
in the ratio of 60: 40 for the social and economic development of the
tribals through CS and CSS schemes to the States/U.Ts.
20
8/12/2019 Ser Sca0707
http://slidepdf.com/reader/full/ser-sca0707 21/137
2.6 MINISTRY OF TRIBAL AFFAIRS
SCA is provided to 21 Tribal Sub-Plan States and 2 Union Territories
including the North Eastern States of Assam, Manipur and Tripura.
However, since 2003-04 the funds meant for UTs have been provided in
the budget of Ministry of Home Affairs. The SCA is released for economic
development of the following:
1. ITDP areas (195 Nos), which are generally contiguous areas of the
size of tehsil or block or more in which the ST population is 50% or
more of the total population.
2. MADA pockets (259 Nos), which are identified pockets having 50%or more ST population and a minimum total population of 10,000.
3. Clusters (82 Nos), which are identified pockets having
50% ST population and a minimum population of 5,000.
4. Primitive Tribal Groups (75 in members), characterized by a low
rate of growth of population, Pre-agricultural level of technology
and extremely low level of literacy.
5.
Dispersed tribal population outside the categories at S.No. 1 to 4above.
2.7 Sources of TSP funds
The resources for tribal Development in Orissa State towards TSP are
coming from the following sources: i). Flow of funds from the State Plan,
ii). Flow of funds from Central Sector and Centrally Sponsored Schemes,
iii). SCA to TSP and Article 275(i) of the Constitution of India, iv).Institutional finance.
2.7.1 TRIBAL SUB-PLAN (TSP)
The Tribal Sub-plan (TSP) approach envisages integrated development of
the Tribal areas wherein all programmes irrespective of their sources of
funding operate in unison to achieve the common goal of bringing the
area at par with the rest of the State and to improve the quality of life of
21
8/12/2019 Ser Sca0707
http://slidepdf.com/reader/full/ser-sca0707 22/137
the tribals. The strategy was oriented for taking up family oriented
income generating schemes in the sphere of agriculture, horticulture,
animal husbandry, elimination of exploitation, human resources
development through education and training programmes andinfrastructure development programmes.
The Tribal Sub-Plan (TSP) strategy was evolved for the rapid socio-
economic development of tribal people in the 5 th Five year Plan through
legal and administrative support for narrowing the gap between their
levels of development to that of the general communities. The important
aspect of this strategy is to ensure allocation of funds for TSP areas at
least in proportion to the ST population of each of the State/UT. The
Tribal Sub-Plan Programmes are to be financed by the following sources:
(a) Tribal Sub Plan funds form State /U.T Plans and Central
Ministries/Departments, (b) Special Central Assistance (SCA) to Tribal
Sub Plan (TSP), (c) Grants under Article 275 (1) of the Constitution to the
States/U.Ts, (d) Funds through Central Sector Schemes, (e) Funds from
Centrally Sponsored Schemes and (f) Institutional Finance.
Though the TSP allocations for tribal welfare has increased from fifth five
year plan steadily but the allocations made by the States/UTs are mostly
notional in nature as the expenditure is not even half of the allocation
and most of the governments had not created separate budget heads and
funds were not utilized as per the needs of the tribal groups in the States
with proper monitoring mechanism. Special Central Assistance (SCA) to
Tribal Sub Plan (TSP) is provided by the Ministry of Tribal Affairs to theStates/UTs since 5 th Five year Plan as an additive to State/U.T Plan to
21 States and 2 UTs which are implementing TSP for supporting the
tribal population below the poverty line. The allocation of SCA to TSP
funds is being done routinely and the States/UTs are also not strictly
adhering to the guidelines in their implementation. Grants under Article
275(1) of the Constitution is also being provided to all the 21 TSP States
and 4 tribal majority States as additional Central Assistance for thepromotion of welfare of STs and for raising the level of administration of
22
8/12/2019 Ser Sca0707
http://slidepdf.com/reader/full/ser-sca0707 23/137
Scheduled Areas at par with the rest of the State. The Ministry of Tribal
Affairs has revised the guidelines in 2002 and now the funds are released
based on specific projects, like raising the critical infrastructure,
enhancement of Human Development Indices of STs to bridge the gapsbetween them and general population.
The various reviews, reports and Commission reports observed that SCP
and TSP strategy is not being implemented properly and inter-sectoral
allocation and prioritization is not being done and the allocated funds are
not utilized effectively. Various State Governments have devised their
own mechanism for implementation of SCP and TSP in their States. The
State Government of Maharashtra had initiated a mechanism for effective
operationalisation of SCP and TSP strategy which is known as
‘Maharashtra Model’. Which suggested earmarking funds for SCP and
TSP from the total State Annual and Five Year Plan outlays at least in
proportion to their respective population in the State, designate the
Social Welfare or Tribal Welfare Departments in the State as nodal
departments for the formulation and implementation of SCSP and TSP
and Effective monitoring of the implementation of various schemes under
SCP and TSP of all departments. Ministries of Social Justice &
Empowerment and Tribal Affairs review and monitor the SCP and TSP
periodically. These Ministries are also routinely addressing the
importance of implementation of SCP and TSP by the Sates/U.Ts and
Central Ministries/Departments.
Planning Commission has circulated guidelines for formulation,implementation and monitoring of SCP and TSP to Central
Ministries/Departments during the end of 2006 wherein action plan
issued earlier to States/U.Ts were reiterated again with a stipulation to
earmark funds towards SCP and TSP as per the SC and ST population in
the country, to create a dedicated unit in each Central
Ministry/Department for proper implementation, to create separate
budget head and sub heads for making the funds non-divertible andnon-adherence to the implementation of SCP and TSP may result in non-
23
8/12/2019 Ser Sca0707
http://slidepdf.com/reader/full/ser-sca0707 24/137
approval of Plans of the Central Ministries/Departments. The
nomenclature of the Special Component Plan (SCP) has also been
changed recently to Scheduled Caste Sub Plan (SCSP).
SCA to TSP is provided by this Ministry to the State Governments as an
additive to the State Plan in areas where State Plan provisions are not
normally forthcoming to bring about a more rapid economic development
of tribals in the States. The scheme was launched as early as in Fifth
Five-Year plan. Till the end of Ninth Five Year Plan, the SCA to TSP was
meant for filling up of the critical gaps in the family-based income-
generation activities of the TSP.
From the Tenth five Year Plan period, the objective and scope of SCA to
TSP, which was originally meant for filling up of the critical gaps in the
family-based income-generation activities of the TSP, has expanded to
cover the employment-cum-income generation activities and the
infrastructure incidental thereto not only family-based, but also run by
the Self-Help Groups (SHGs) community. The ultimate objective of
extending SCA to TSP is to boost the demand-based income-generationprogrammes and thus raise the economic and social status of tribals.
2.7.2 Funds from the State Plan
Orissa State is not following single demand budget as in the case of
Maharashtra State. The outlay for TSP is being budgeted under different
Department’s demands under the minor head - Tribal Area Sub-plan. All
the departments of State are allocating funds and the expenditureapproved towards Tribal Development is accounted under this budget
head. The State Government is following the divisible and non-divisible
concept for allocating funds towards TSP in their annual Plans and five
year plans.
The 10 th plan total allocation is Rs. 15,300 crores and the projected TSP
outlay was 4736.31 crores which is 29.5% of the total outlay. During
Annual Plan 2002-03 the allocation was Rs.3,100 crores and the TSP
24
8/12/2019 Ser Sca0707
http://slidepdf.com/reader/full/ser-sca0707 25/137
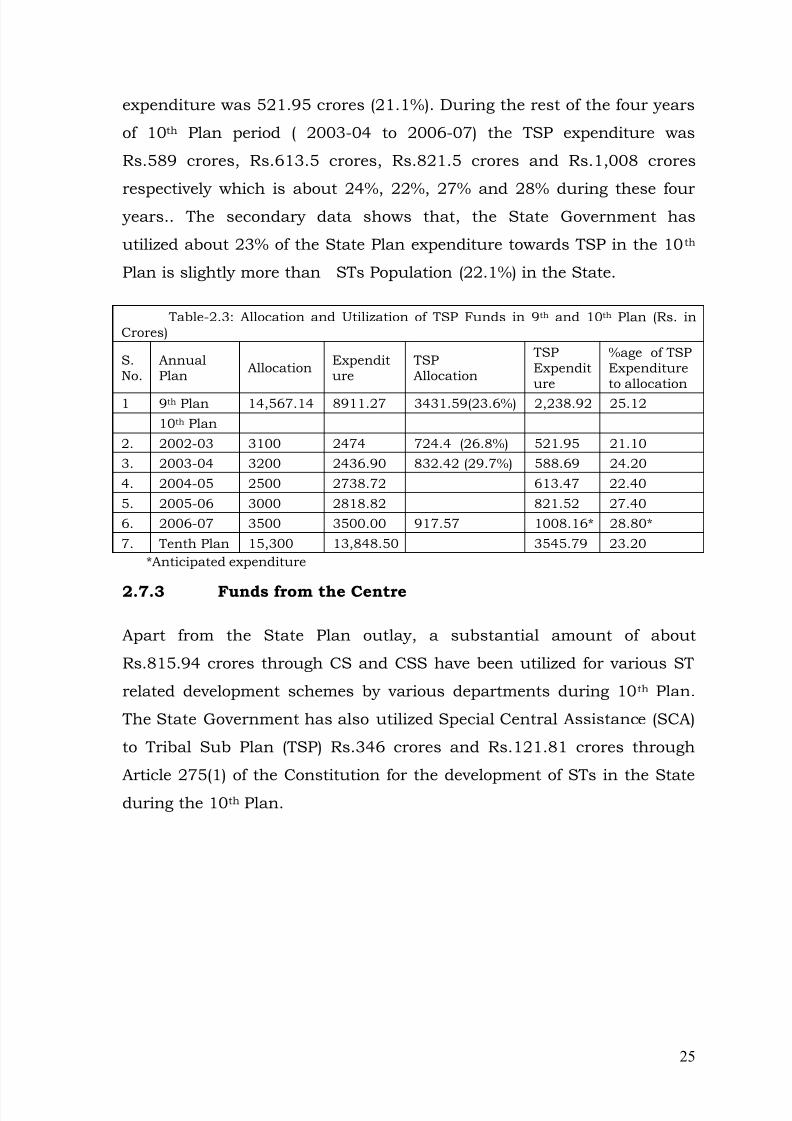
expenditure was 521.95 crores (21.1%). During the rest of the four years
of 10 th Plan period ( 2003-04 to 2006-07) the TSP expenditure was
Rs.589 crores, Rs.613.5 crores, Rs.821.5 crores and Rs.1,008 crores
respectively which is about 24%, 22%, 27% and 28% during these four years.. The secondary data shows that, the State Government has
utilized about 23% of the State Plan expenditure towards TSP in the 10 th
Plan is slightly more than STs Population (22.1%) in the State.
Table-2.3: Allocation and Utilization of TSP Funds in 9 th and 10 th Plan (Rs. inCrores)
S.No.
AnnualPlan Allocation Expendit
ure TSPAllocation
TSPExpenditure
%age of TSPExpenditureto allocation
1 9 th Plan 14,567.14 8911.27 3431.59(23.6%) 2,238.92 25.1210 th Plan
2. 2002-03 3100 2474 724.4 (26.8%) 521.95 21.103. 2003-04 3200 2436.90 832.42 (29.7%) 588.69 24.204. 2004-05 2500 2738.72 613.47 22.405. 2005-06 3000 2818.82 821.52 27.406. 2006-07 3500 3500.00 917.57 1008.16* 28.80*7. Tenth Plan 15,300 13,848.50 3545.79 23.20
*Anticipated expenditure
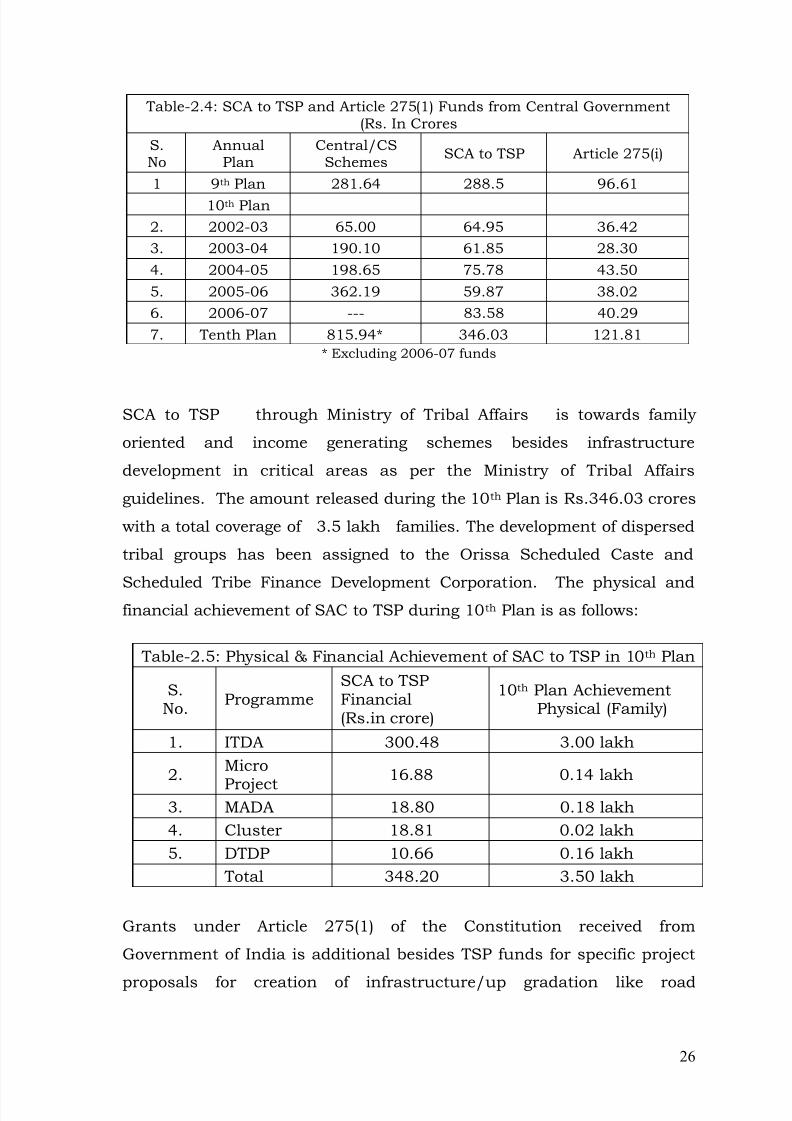
2.7.3 Funds from the Centre
Apart from the State Plan outlay, a substantial amount of about
Rs.815.94 crores through CS and CSS have been utilized for various ST
related development schemes by various departments during 10 th Plan.
The State Government has also utilized Special Central Assistance (SCA)
to Tribal Sub Plan (TSP) Rs.346 crores and Rs.121.81 crores through
Article 275(1) of the Constitution for the development of STs in the State
during the 10 th Plan.
25
8/12/2019 Ser Sca0707
http://slidepdf.com/reader/full/ser-sca0707 26/137
Table-2.4: SCA to TSP and Article 275(1) Funds from Central Government(Rs. In Crores
S.No
AnnualPlan
Central/CSSchemes SCA to TSP Article 275(i)
1 9 th Plan 281.64 288.5 96.6110 th Plan
2. 2002-03 65.00 64.95 36.423. 2003-04 190.10 61.85 28.304. 2004-05 198.65 75.78 43.505. 2005-06 362.19 59.87 38.026. 2006-07 --- 83.58 40.297. Tenth Plan 815.94* 346.03 121.81
* Excluding 2006-07 funds
SCA to TSP through Ministry of Tribal Affairs is towards family
oriented and income generating schemes besides infrastructure
development in critical areas as per the Ministry of Tribal Affairs
guidelines. The amount released during the 10 th Plan is Rs.346.03 crores
with a total coverage of 3.5 lakh families. The development of dispersed
tribal groups has been assigned to the Orissa Scheduled Caste and
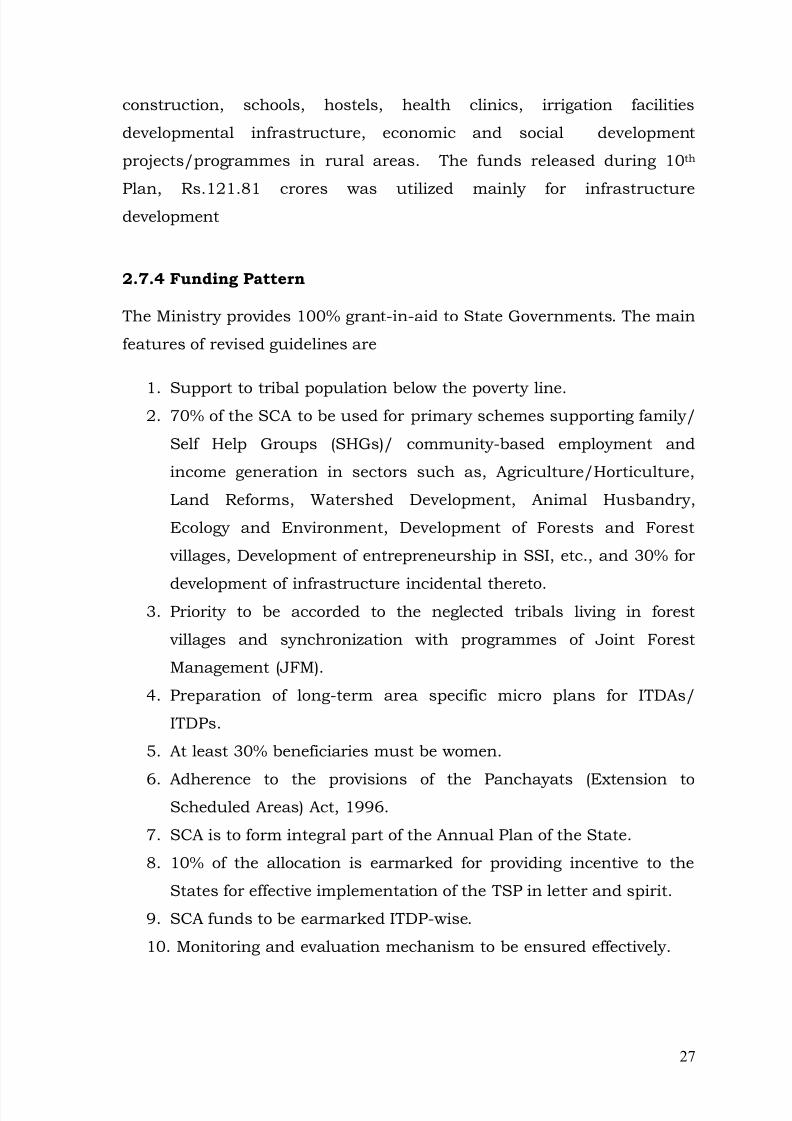
Scheduled Tribe Finance Development Corporation. The physical andfinancial achievement of SAC to TSP during 10 th Plan is as follows:
Table-2.5: Physical & Financial Achievement of SAC to TSP in 10 th Plan
S.No. Programme
SCA to TSPFinancial(Rs.in crore)
10 th Plan AchievementPhysical (Family)
1. ITDA 300.48 3.00 lakh
2. Micro
Project16.88 0.14 lakh
3. MADA 18.80 0.18 lakh4. Cluster 18.81 0.02 lakh5. DTDP 10.66 0.16 lakh
Total 348.20 3.50 lakh
Grants under Article 275(1) of the Constitution received from
Government of India is additional besides TSP funds for specific project
proposals for creation of infrastructure/up gradation like road
26
8/12/2019 Ser Sca0707
http://slidepdf.com/reader/full/ser-sca0707 27/137
construction, schools, hostels, health clinics, irrigation facilities
developmental infrastructure, economic and social development
projects/programmes in rural areas. The funds released during 10 th
Plan, Rs.121.81 crores was utilized mainly for infrastructuredevelopment
2.7.4 Funding Pattern
The Ministry provides 100% grant-in-aid to State Governments. The main
features of revised guidelines are
1. Support to tribal population below the poverty line.2. 70% of the SCA to be used for primary schemes supporting family/
Self Help Groups (SHGs)/ community-based employment and
income generation in sectors such as, Agriculture/Horticulture,
Land Reforms, Watershed Development, Animal Husbandry,
Ecology and Environment, Development of Forests and Forest
villages, Development of entrepreneurship in SSI, etc., and 30% for
development of infrastructure incidental thereto.3. Priority to be accorded to the neglected tribals living in forest
villages and synchronization with programmes of Joint Forest
Management (JFM).
4. Preparation of long-term area specific micro plans for ITDAs/
ITDPs.
5. At least 30% beneficiaries must be women.
6.
Adherence to the provisions of the Panchayats (Extension toScheduled Areas) Act, 1996.
7. SCA is to form integral part of the Annual Plan of the State.
8. 10% of the allocation is earmarked for providing incentive to the
States for effective implementation of the TSP in letter and spirit.
9. SCA funds to be earmarked ITDP-wise.
10. Monitoring and evaluation mechanism to be ensured effectively.
27
8/12/2019 Ser Sca0707
http://slidepdf.com/reader/full/ser-sca0707 28/137
After calculating the entitlement for each of the State on the basis of the
norms, the amount is calculated for MADAs, PTGs, STs in Clusters and
Dispersed Tribal Groups (DTGs) SCA is to be separately earmarked by
each State for implementing projects/ Schemes for the benefits ofMADAs, PTGs, STs in Clusters and PTGs in a focused and well targeted
manner.
The rest of the SCA allocation of each of the State meant for ITDPs is
earmarked by the Ministry of Tribal Affairs for each of the ITDPs of each
State in equal proportion to the population of the STs in these respective
ITDPs as a %age of the total ST population of the ITDPs in a particular
State.
2.8 Development of Forest Villages
Development of forest villages having about 2.5 lakh tribal families is one
of the trust areas of tribal development during the 10 th Five Year Plan.
Accordingly, Planning Commission allocated Rs. 450 Crore to the
Ministry of Tribal Affairs during the remaining years of the 10 th Five Year
Plan for Development of Forest Villages at an average rate of Rs.15 lakh
per village. Accordingly, the Ministry of Tribal Affairs started the
programme for Development of Forest Villages as a part of Special
Central Assistance to Tribal Sub-Plan (SCA to TSP) and provision of
Rs.230 Crore has been made in the budget (2005-06) of the Ministry.
The development envisaged is in terms of providing basic minimum
facilities and services like safe drinking water, health care, primaryeducation, approach roads, drinking water, irrigation and other
infrastructure facilities as well as income-generating activities. The
National Afforestation and Eco-Development Board (NAEB), Ministry of
Environment & Forests issued detailed guidelines for formulation of
projects.
28
8/12/2019 Ser Sca0707
http://slidepdf.com/reader/full/ser-sca0707 29/137
2.9 Procedure for Approval of Projects
Project proposal received from the State Governments are scrutinized by
the NAEB, Ministry of Environment & Forests and thereafter, forwarded
to the Ministry of Tribal Affairs where these are considered for clearance
by the Tripartite Multi-Disciplinary Project Appraisal Committee
(MDPAC). This programme is implemented in close collaboration with the
Ministry of Tribal Affairs, Ministry of Environment & Forests, Planning
Commission and respective State Governments.
2.10 Fund flow Mechanism
After sanction of the project, funds are released by the Ministry of Tribal
Affairs to respective State Governments for onward transfer to FDAs. In
the field, Forest Development Agencies (FDAs) implement the projects.
Subsequent installments are linked to satisfactory implementation of the
work programme and submission of Utilization of Certificate in the
prescribed format by FDAs through State Governments.
2.11 Grants under Article 275(1) of the Constitution of India
Article 275(1) of the Constitution of India guarantees grants from the
Consolidated Fund of India each year for promoting the welfare of
Scheduled Tribes and in pursuance of this Constitution obligation, the
Ministry of Tribal Affairs provides funds through the Central Sector
Schemes “Grants under Article 275(1) of the Constitution of India”.
The Objective of the scheme is promotion of welfare of Scheduled Tribesand administration of Scheduled Areas. The scheme covers all Tribal
Sub-Plan and 4 tribal majority States of the Country.
2.12 Funding Pattern
This is a Central Sector Scheme and 100 percent grants are provided by
the Ministry to meet the cost of each project for tribal development may
be undertaken by the State Governments for raising the level of
29
8/12/2019 Ser Sca0707
http://slidepdf.com/reader/full/ser-sca0707 30/137
administration in Scheduled Areas therein and for welfare of the tribal
people to bring them at par with the rest of the States. The Grants are
provided to the States on the basis of percentage of ST population in the
State.
2.13 Monitoring Mechanism
The State Governments are expected to frame their proposals and
monitoring, evaluation and reporting mechanism in accordance with the
guidelines issued by the NAEB. The FDAs have to submit their progress
reports to the NAEB through the Principal Chief Conservator of Forests to
the NAEB, for onward transmission to the Ministry of Tribal Affairs.
30
8/12/2019 Ser Sca0707
http://slidepdf.com/reader/full/ser-sca0707 31/137
CHAPTER-3: PROFILES
3.1 SCHEDULED CASTES
Scheduled Castes (SCs) constitute about 166.6 millions representing
16.23% of the total population of India (2001 Census). There are about
1,200 SC Communities and they are spread all over India with main
concentration in Uttar Pradesh (35.1 million), West Bengal (18.4 million),
Andhra Pradesh (12.3 million, Tamilnadu (11.8 million),) and Bihar (11.3million). Uttar Pradesh has the highest concentration of SCs (21.1%) in
terms of absolute number and Punjab with 28.9% SC population has the
highest percentage of SCs to the State population. In terms of the
number of the SC communities, Karnataka has large number of SC
communities (101) followed by Orissa (93). SCs are rural in their
habitation (78%) and majority of them are agricultural labourers (46%)
with only 20% of them as cultivators. The important developmentindicators of literacy (54.7%), IMR (83), rural poverty (36%), urban
poverty (38%) show large disparity with the general population.
Scheduled Castes (SCs), since long, have been the victims of socio-
economic exploitation and relegated to low income generating
occupations, inferior trades, unhygienic environment and menial
occupations. Although un-touchability has declined in many parts of the
country, caste rigidities continues to confine many SC workers in low
occupations.
3.2 SCHEDULED TRIBES
The population of Scheduled Tribes (STs) is 84.3 million (2001 Census)
constituting 8.2% of the total population of the country. There are about
650 ST communities across the States in India and 75 of them are most
backward and are termed as Primitive Tribal Groups. More than half of
31
8/12/2019 Ser Sca0707
http://slidepdf.com/reader/full/ser-sca0707 32/137
the ST population is concentrated in the five States of Madhya Pradesh
(14.51%), Maharashtra (10.2%), Orissa (9.7%), Gujarat (8.9%), and
Rajasthan (8.4%).
STs have their own distinctive culture and are geographically isolated
with low socio-economic conditions. 91.7% of STs live in rural areas
and only 8.3% live in urban areas. About 45% of STs are cultivators and
40% are engaged as agricultural labourers. The socio-economic
indicators of literacy (47%), IMR (84), rural poverty (46%), urban poverty
(35%) show the disparity and low level of development among them.
3.3 Profiles of Sample States
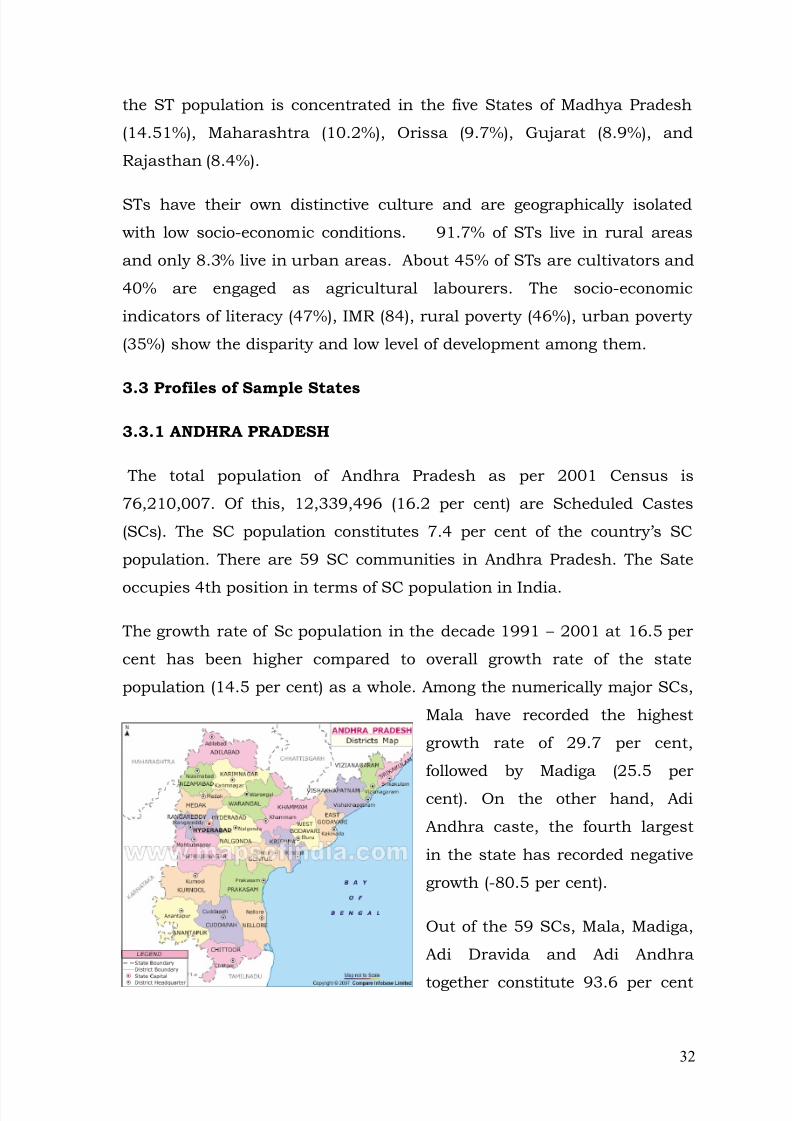
3.3.1 ANDHRA PRADESH
The total population of Andhra Pradesh as per 2001 Census is
76,210,007. Of this, 12,339,496 (16.2 per cent) are Scheduled Castes
(SCs). The SC population constitutes 7.4 per cent of the country’s SC
population. There are 59 SC communities in Andhra Pradesh. The Sate
occupies 4th position in terms of SC population in India.
The growth rate of Sc population in the decade 1991 – 2001 at 16.5 per
cent has been higher compared to overall growth rate of the state
population (14.5 per cent) as a whole. Among the numerically major SCs,
Mala have recorded the highest
growth rate of 29.7 per cent,
followed by Madiga (25.5 per
cent). On the other hand, Adi
Andhra caste, the fourth largest
in the state has recorded negative
growth (-80.5 per cent).
Out of the 59 SCs, Mala, Madiga,
Adi Dravida and Adi Andhra
together constitute 93.6 per cent
32
8/12/2019 Ser Sca0707
http://slidepdf.com/reader/full/ser-sca0707 33/137
of the SC population of the State. Madiga are numerically the largest SCs
with a population of 6,074,250, constituting 49.2 per cent of the State
SC population. They are followed by Mala having a population of
5,139,305 (41.6 per cent). As per 2001 Census, 82.5 per cent of SCs areliving in the rural areas of the State. Among the districts, Nellore has
returned the highest (22 per cent) SC population to its total population,
while Visakhapatnam has the lowest (7.6 per cent).
The overall sex ratio of the SC population of Andhra Pradesh is 981
females per 1000 males, which is higher than 978 for SC population of
the State in 2001. The sex ratio of SC population has registered an
increase over 969 reported at 1991 Census. Among the districts, the
highest sex ratio is recorded in Nizamabad [1046] and lowest in
Anantapur (956).
According to 2001 Census, percentage of SC literates, (who can read and
write with understanding) aged 7 years and above is 53.5 per cent, which
is lower than 60.5 per cent reported for the state population as a whole.
The literacy data show that the SC population of the state has made asignificant improvement during the decade 1991-2001. The literacy rate,
which was 31.6 per cent in 1991, has increased by 21.9 percentage
points in 2001. Among the major SCs, Adi Andhra have been reported
the highest literacy rate of 69.6 percent, followed by Adi Dravida (65.4
per cent) and Mala (60 per cent). More than half of Madigas are illiterate
with literacy rate of 47.5 per cent.
Out of total literates, 34.9 per cent are literates having attained
educational level below the Primary level. Literates with educational level
of Graduation and above are 3.7 percent. Individually Adi Andhra (6.3
per cent) has highest percentage of Graduation and above educational
levels. The data on educational level shows that the drop out rate is
conspicuous after the primary level and again after Matric/Secondary
levels. The female literacy rate of 43.3 per cent among SC population is
33
8/12/2019 Ser Sca0707
http://slidepdf.com/reader/full/ser-sca0707 34/137
lower compared to the total females of the state (50.4 per cent) as well as
their male counterparts (63.5 per cent).
There has been a decline in SC main workers from 95.6 per cent at 1991
Census to 79.2 per cent at 2001 Census. Out of total workers,
‘agricultural labourers’ constitute 68.3 per cent, which is higher than
22.7 percentage points when compared to 45.6 per cent registered for SC
population at the national level. ‘Other workers’ account for 20.1 per cent
and only 9.7 per cent has been returned as ‘cultivators’. Remaining 1.9
per cent are workers in the ‘household industry’.
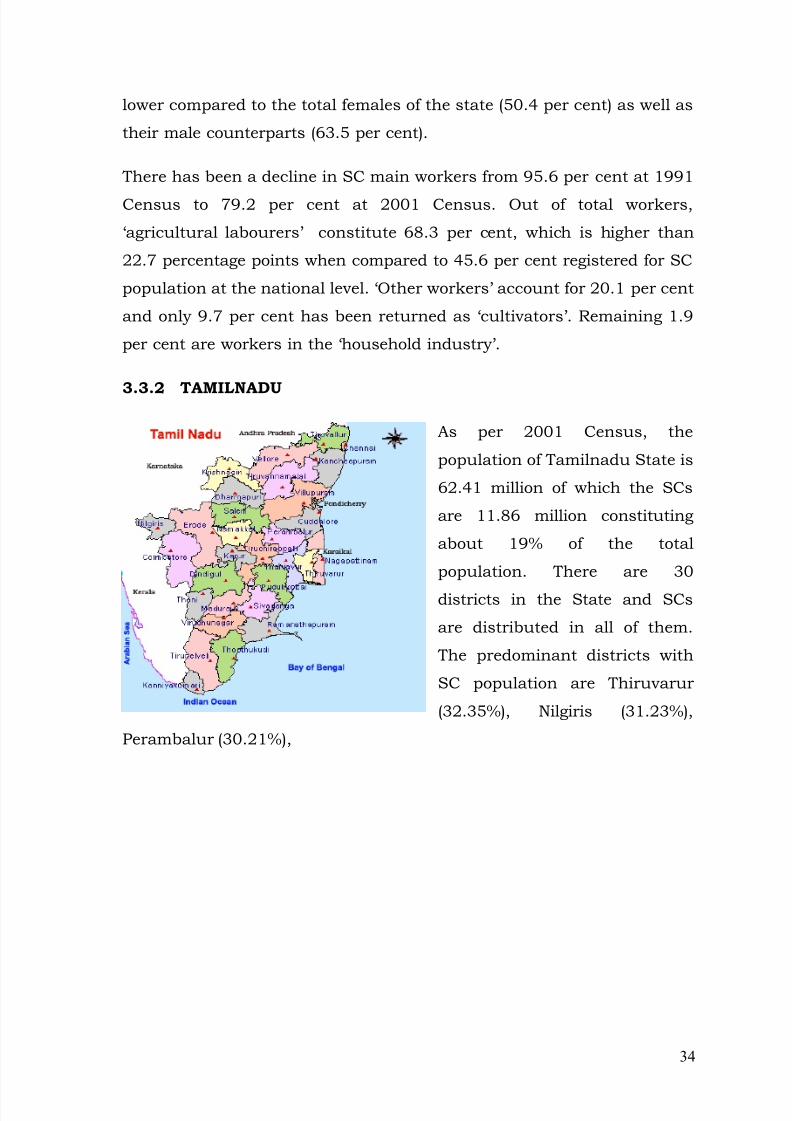
3.3.2 TAMILNADU
As per 2001 Census, the
population of Tamilnadu State is
62.41 million of which the SCs
are 11.86 million constituting
about 19% of the total
population. There are 30
districts in the State and SCs
are distributed in all of them.
The predominant districts with
SC population are Thiruvarur
(32.35%), Nilgiris (31.23%),
Perambalur (30.21%),
34
8/12/2019 Ser Sca0707
http://slidepdf.com/reader/full/ser-sca0707 35/137
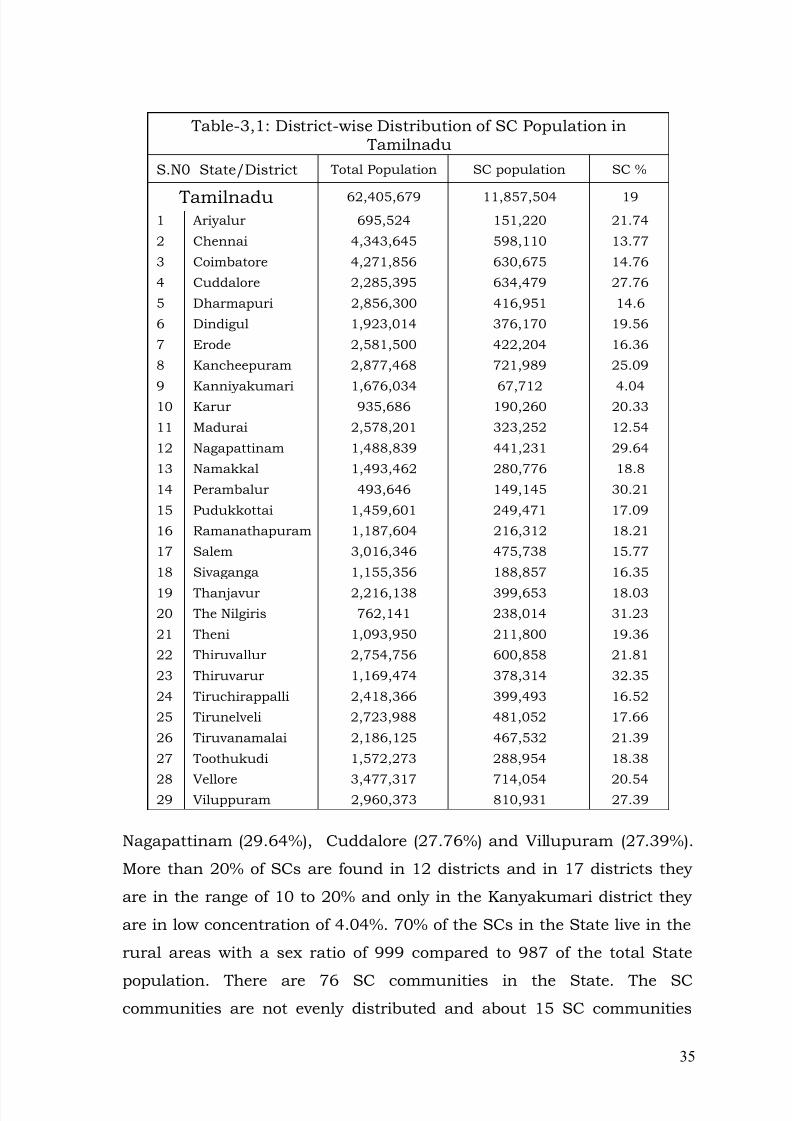
Table-3,1: District-wise Distribution of SC Population in
Tamilnadu
S.N0 State/District Total Population SC population SC %
Tamilnadu 62,405,679 11,857,504 191 Ariyalur 695,524 151,220 21.74
2 Chennai 4,343,645 598,110 13.77
3 Coimbatore 4,271,856 630,675 14.76
4 Cuddalore 2,285,395 634,479 27.76
5 Dharmapuri 2,856,300 416,951 14.6
6 Dindigul 1,923,014 376,170 19.56
7 Erode 2,581,500 422,204 16.36
8 Kancheepuram 2,877,468 721,989 25.09
9 Kanniyakumari 1,676,034 67,712 4.0410 Karur 935,686 190,260 20.33
11 Madurai 2,578,201 323,252 12.54
12 Nagapattinam 1,488,839 441,231 29.64
13 Namakkal 1,493,462 280,776 18.8
14 Perambalur 493,646 149,145 30.21
15 Pudukkottai 1,459,601 249,471 17.09
16 Ramanathapuram 1,187,604 216,312 18.21
17 Salem 3,016,346 475,738 15.77
18 Sivaganga 1,155,356 188,857 16.35
19 Thanjavur 2,216,138 399,653 18.0320 The Nilgiris 762,141 238,014 31.23
21 Theni 1,093,950 211,800 19.36
22 Thiruvallur 2,754,756 600,858 21.81
23 Thiruvarur 1,169,474 378,314 32.35
24 Tiruchirappalli 2,418,366 399,493 16.52
25 Tirunelveli 2,723,988 481,052 17.66
26 Tiruvanamalai 2,186,125 467,532 21.39
27 Toothukudi 1,572,273 288,954 18.38
28 Vellore 3,477,317 714,054 20.5429 Viluppuram 2,960,373 810,931 27.39
Nagapattinam (29.64%), Cuddalore (27.76%) and Villupuram (27.39%).
More than 20% of SCs are found in 12 districts and in 17 districts they
are in the range of 10 to 20% and only in the Kanyakumari district they
are in low concentration of 4.04%. 70% of the SCs in the State live in the
rural areas with a sex ratio of 999 compared to 987 of the total State
population. There are 76 SC communities in the State. The SCcommunities are not evenly distributed and about 15 SC communities
35
8/12/2019 Ser Sca0707
http://slidepdf.com/reader/full/ser-sca0707 36/137
have been notified in only two districts; Kanyakumari and Tirunelveli.
The major SC communities are Pallan, Paraiyan, Adi Dravida,
Chakkiliyan and Arunththiyar and together they constitute 93.5% of the
SC population in the State.
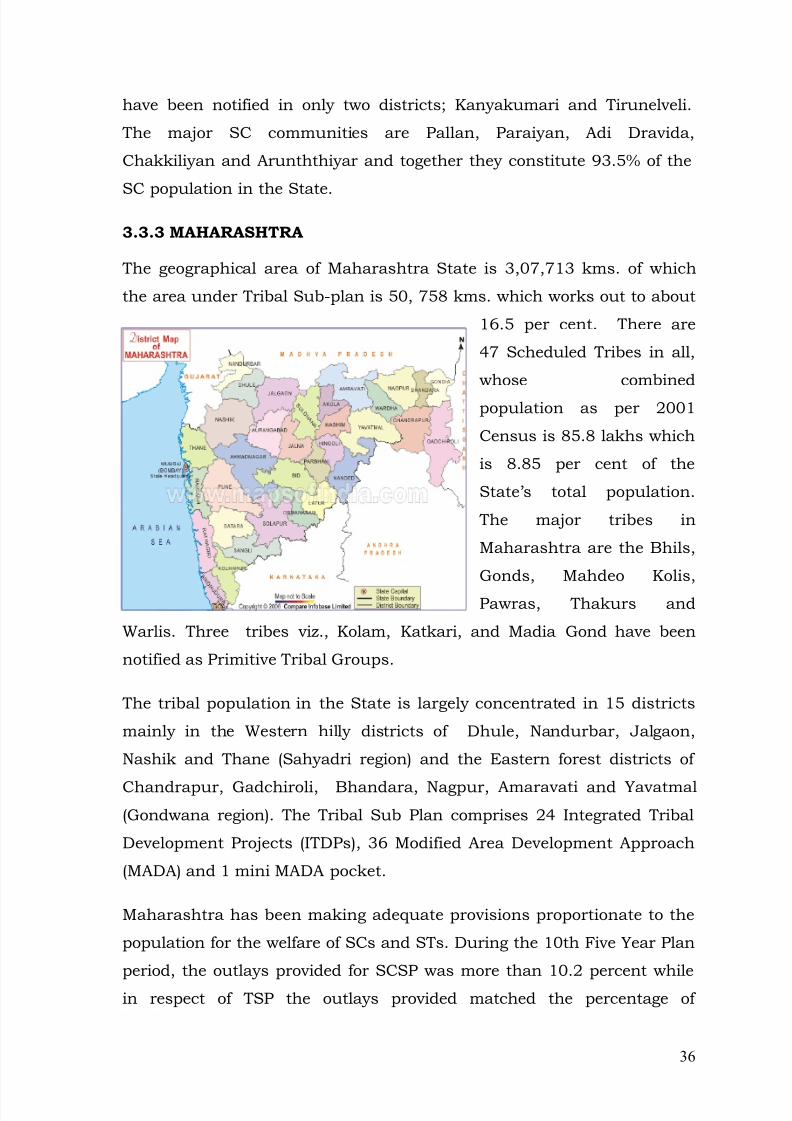
3.3.3 MAHARASHTRA
The geographical area of Maharashtra State is 3,07,713 kms. of which
the area under Tribal Sub-plan is 50, 758 kms. which works out to about
16.5 per cent. There are
47 Scheduled Tribes in all,
whose combined
population as per 2001
Census is 85.8 lakhs which
is 8.85 per cent of the
State’s total population.
The major tribes in
Maharashtra are the Bhils,
Gonds, Mahdeo Kolis,
Pawras, Thakurs and
Warlis. Three tribes viz., Kolam, Katkari, and Madia Gond have been
notified as Primitive Tribal Groups.
The tribal population in the State is largely concentrated in 15 districts
mainly in the Western hilly districts of Dhule, Nandurbar, Jalgaon,
Nashik and Thane (Sahyadri region) and the Eastern forest districts of
Chandrapur, Gadchiroli, Bhandara, Nagpur, Amaravati and Yavatmal(Gondwana region). The Tribal Sub Plan comprises 24 Integrated Tribal
Development Projects (ITDPs), 36 Modified Area Development Approach
(MADA) and 1 mini MADA pocket.
Maharashtra has been making adequate provisions proportionate to the
population for the welfare of SCs and STs. During the 10th Five Year Plan
period, the outlays provided for SCSP was more than 10.2 percent while
in respect of TSP the outlays provided matched the percentage of
36
8/12/2019 Ser Sca0707
http://slidepdf.com/reader/full/ser-sca0707 37/137
population i.e. 8.9 percent (except during 2004-05).The target growth
rate of GDP during the 11 th Five Year Plan is tentatively fixed at 10%.
Target growth rate in Agriculture, Industry and Services would be 3%,
10% and 12% respectively. It is proposed to bring down the percentage ofpopulation below the poverty line from estimated 16% in 2006-07 to 8%
by the end of 2012.
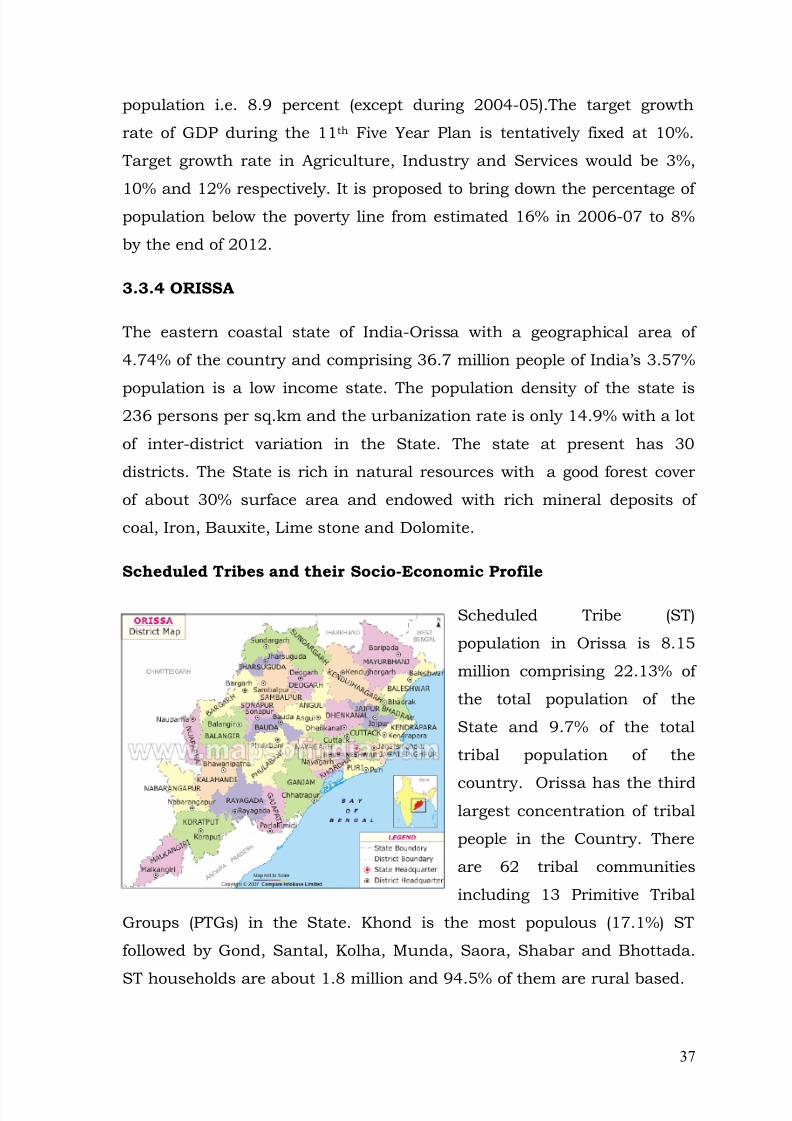
3.3.4 ORISSA
The eastern coastal state of India-Orissa with a geographical area of
4.74% of the country and comprising 36.7 million people of India’s 3.57%
population is a low income state. The population density of the state is236 persons per sq.km and the urbanization rate is only 14.9% with a lot
of inter-district variation in the State. The state at present has 30
districts. The State is rich in natural resources with a good forest cover
of about 30% surface area and endowed with rich mineral deposits of
coal, Iron, Bauxite, Lime stone and Dolomite.
Scheduled Tribes and their Socio-Economic Profile
Scheduled Tribe (ST)
population in Orissa is 8.15
million comprising 22.13% of
the total population of the
State and 9.7% of the total
tribal population of the
country. Orissa has the thirdlargest concentration of tribal
people in the Country. There
are 62 tribal communities
including 13 Primitive Tribal
Groups (PTGs) in the State. Khond is the most populous (17.1%) ST
followed by Gond, Santal, Kolha, Munda, Saora, Shabar and Bhottada.
ST households are about 1.8 million and 94.5% of them are rural based.
37
8/12/2019 Ser Sca0707
http://slidepdf.com/reader/full/ser-sca0707 38/137
Majority of STs live in hilly and forest areas, which re mostly inaccessible
and isolated. 62 STs in Orissa speak as many as 74 dialects and their
cultural heritage is rich and varied. Their economy is largely subsistence
oriented and non-specialized. At one end of the spectrum we findnomadic food gatherers and hunters and at the other end, agriculturists
and horticulturists. The literacy rate among the STs is 37.36% against
the overall literacy rate of 63.1% of the State (2001 Census). The ST
male and female literacy rates are 51.5% and 23.4% respectively. As per
2001 Census, 57.4% STs are main workers and the remaining 42.6% are
marginal workers. Cultivators account for 33.4% of total workers,
whereas agricultural labourers constitute 46.8% and workers engaged inhousehold industries constitute 4.8% of the total workers. Most of the
cultivators among the STs are small and marginal farmers. The following
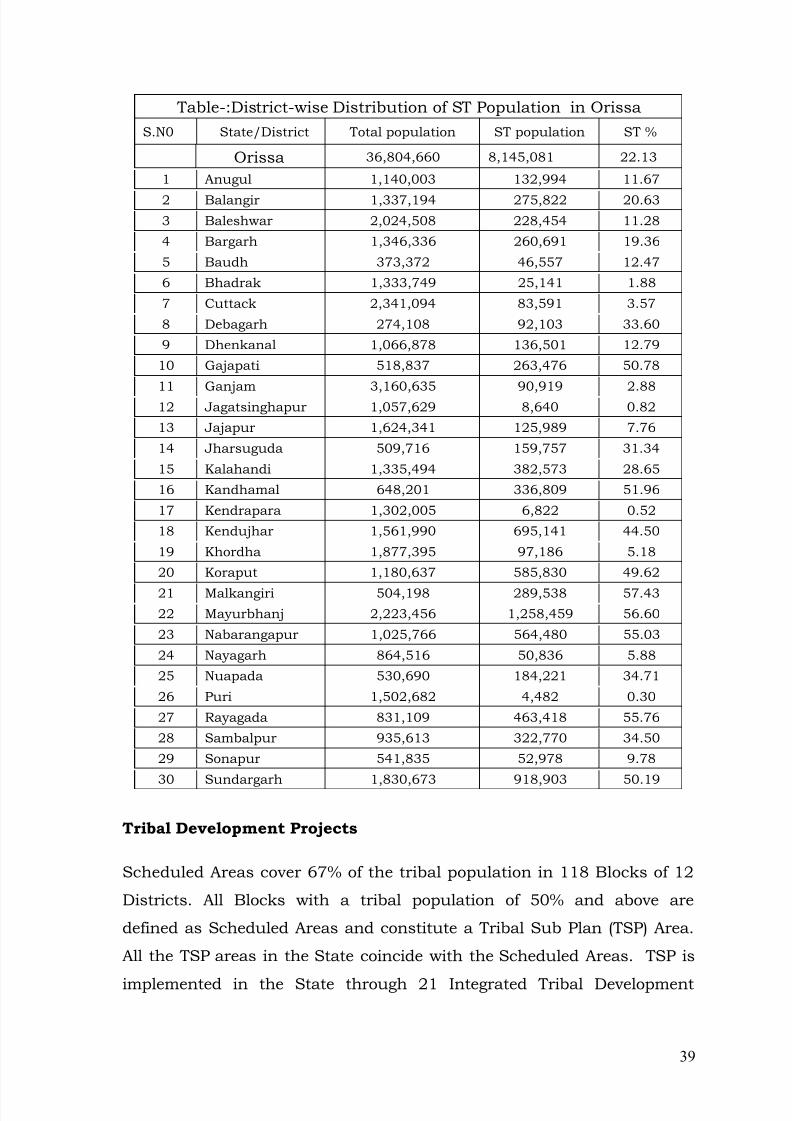
table shows district-wise distribution of ST population in Orissa.
About 44.7% of the State’s geographical area has been declared as
Scheduled Area covering 12 districts and inhabited by about 68.1% of the
STs in the State comprising the districts of Mayurbhanj, Koraput
(undivided) and Sundargarh, Kandhamals, Sambalpur, Kheonjhar,
Kalahandi and Balasore districts. The habitation of the rest of the tribal
population is designated into MADA, Cluster pockets and Dispersed
Tribal Areas. In 7 districts namely Malkangiri, Nabarangpur, Rayagada,
Sundargarh, Kalahandi, Koraput and Gajapati, STs are more than 50% of
the total population in the district.
38
8/12/2019 Ser Sca0707
http://slidepdf.com/reader/full/ser-sca0707 39/137
Table-:District-wise Distribution of ST Population in OrissaS.N0 State/District Total population ST population ST %
Orissa 36,804,660 8,145,081 22.13
1 Anugul 1,140,003 132,994 11.67
2 Balangir 1,337,194 275,822 20.633 Baleshwar 2,024,508 228,454 11.28
4 Bargarh 1,346,336 260,691 19.36
5 Baudh 373,372 46,557 12.47
6 Bhadrak 1,333,749 25,141 1.88
7 Cuttack 2,341,094 83,591 3.57
8 Debagarh 274,108 92,103 33.60
9 Dhenkanal 1,066,878 136,501 12.79
10 Gajapati 518,837 263,476 50.78
11 Ganjam 3,160,635 90,919 2.8812 Jagatsinghapur 1,057,629 8,640 0.82
13 Jajapur 1,624,341 125,989 7.76
14 Jharsuguda 509,716 159,757 31.34
15 Kalahandi 1,335,494 382,573 28.65
16 Kandhamal 648,201 336,809 51.96
17 Kendrapara 1,302,005 6,822 0.52
18 Kendujhar 1,561,990 695,141 44.50
19 Khordha 1,877,395 97,186 5.18
20 Koraput 1,180,637 585,830 49.62
21 Malkangiri 504,198 289,538 57.4322 Mayurbhanj 2,223,456 1,258,459 56.60
23 Nabarangapur 1,025,766 564,480 55.03
24 Nayagarh 864,516 50,836 5.88
25 Nuapada 530,690 184,221 34.71
26 Puri 1,502,682 4,482 0.30
27 Rayagada 831,109 463,418 55.76
28 Sambalpur 935,613 322,770 34.50
29 Sonapur 541,835 52,978 9.78
30 Sundargarh 1,830,673 918,903 50.19
Tribal Development Projects
Scheduled Areas cover 67% of the tribal population in 118 Blocks of 12
Districts. All Blocks with a tribal population of 50% and above are
defined as Scheduled Areas and constitute a Tribal Sub Plan (TSP) Area.
All the TSP areas in the State coincide with the Scheduled Areas. TSP is
implemented in the State through 21 Integrated Tribal Development
39
8/12/2019 Ser Sca0707
http://slidepdf.com/reader/full/ser-sca0707 40/137
Agencies (ITDAs), 46 Modified Area Development Approach (MADA) and
14 Cluster pockets and 17 Micro projects for 13 PTGs and Dispersed
Tribal Groups .
In general, a Revenue Sub Division equivalent to two or five Blocks is
taken as ITDA. There are 21 ITDAs in the State covering 118 Blocks in 12
Districts. Each ITDA is administered through an IAS/senior OAS cadre
Officer with assistance from Engineering wing headed by Assistant
Engineer. Each ITDA is having a Project Level Committee, a sub project
under the District Welfare Committee with the District Collector as
Chairman and the District Welfare Officer as Secretary. The District
Welfare Committee reviews the implementation of the tribal projects. At
the Block level, the Welfare Extension Officer and the Block Development
Officer (BDO) executes the various tribal projects with in the Block and is
responsible for residential schools for tribals. It is observed that, in many
of the ITDAs the Officers are not having effective role and functions and
lack motivation in the tribal development.
In Blocks outside the TSP, where the population in a contiguous area is10,000 or more with at least 50% tribal concentration has been identified
as MADA pockets to ensure the welfare and development of tribals. 46
such pockets in 47 Blocks having 5.67 lakh tribal populations are
functioning in the State. A MADA level Advisory committee has been
made mandatory for each pocket under the Chairmanship of Sub-
Collector and Officials and non-Officials as Members for the development
activities of the area. 14 Clusters of contiguous areas having a populationof 5,000 or more with at least 50% tribal concentration are identified as
Clusters with administrative mechanism similar to MADAs. 14 Clusters
covering about 13 Blocks in Orissa State with special emphasis on
individual and family oriented benefit programmes are in operation.
There is a Dispersed Tribal Development Project (DTDP) to cover the
tribals not covered by the ITDP/MADA/Cluster approach which is being
implemented through Orissa State Scheduled Castes and Scheduled Tribes Development Finance Cooperative Corporation. The DTDP is being
40
8/12/2019 Ser Sca0707
http://slidepdf.com/reader/full/ser-sca0707 41/137
implemented in 23 districts covering 197 Blocks. There are 13 Primitive
Tribal Groups (PTGs) in the State and 17 Micro projects are operating for
their all round development with individual Perspective Plan for each
PTG.
3.4 Profile of the Sample Households
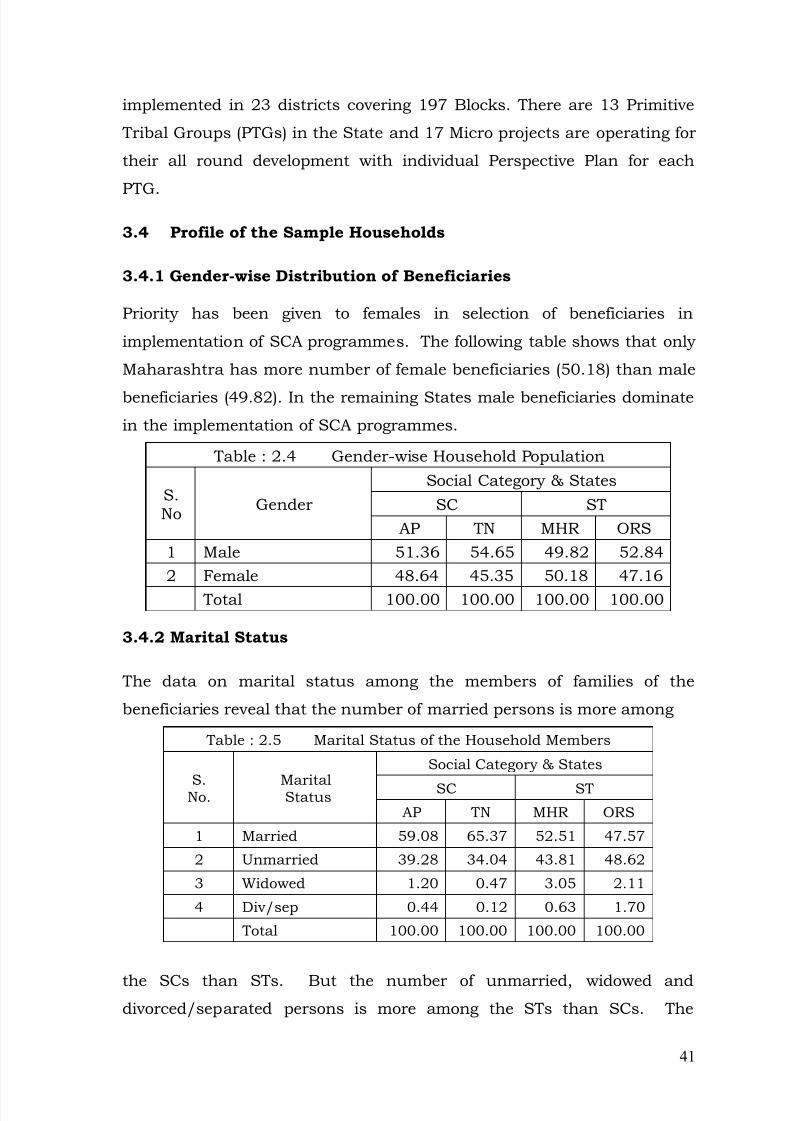
3.4.1 Gender-wise Distribution of Beneficiaries
Priority has been given to females in selection of beneficiaries in
implementation of SCA programmes. The following table shows that only
Maharashtra has more number of female beneficiaries (50.18) than male
beneficiaries (49.82). In the remaining States male beneficiaries dominate
in the implementation of SCA programmes.
Table : 2.4 Gender-wise Household Population
S.No Gender
Social Category & StatesSC ST
AP TN MHR ORS1 Male 51.36 54.65 49.82 52.842 Female 48.64 45.35 50.18 47.16
Total 100.00 100.00 100.00 100.00
3.4.2 Marital Status
The data on marital status among the members of families of the
beneficiaries reveal that the number of married persons is more among
Table : 2.5 Marital Status of the Household Members
S.No. MaritalStatus
Social Category & States
SC STAP TN MHR ORS
1 Married 59.08 65.37 52.51 47.57
2 Unmarried 39.28 34.04 43.81 48.62
3 Widowed 1.20 0.47 3.05 2.11
4 Div/sep 0.44 0.12 0.63 1.70
Total 100.00 100.00 100.00 100.00
the SCs than STs. But the number of unmarried, widowed anddivorced/separated persons is more among the STs than SCs. The
41
8/12/2019 Ser Sca0707
http://slidepdf.com/reader/full/ser-sca0707 42/137
percentage of widowed persons is more among the tribals in Maharashtra
and the percentage of divorced/ separated is high among the tribals in
Orissa.
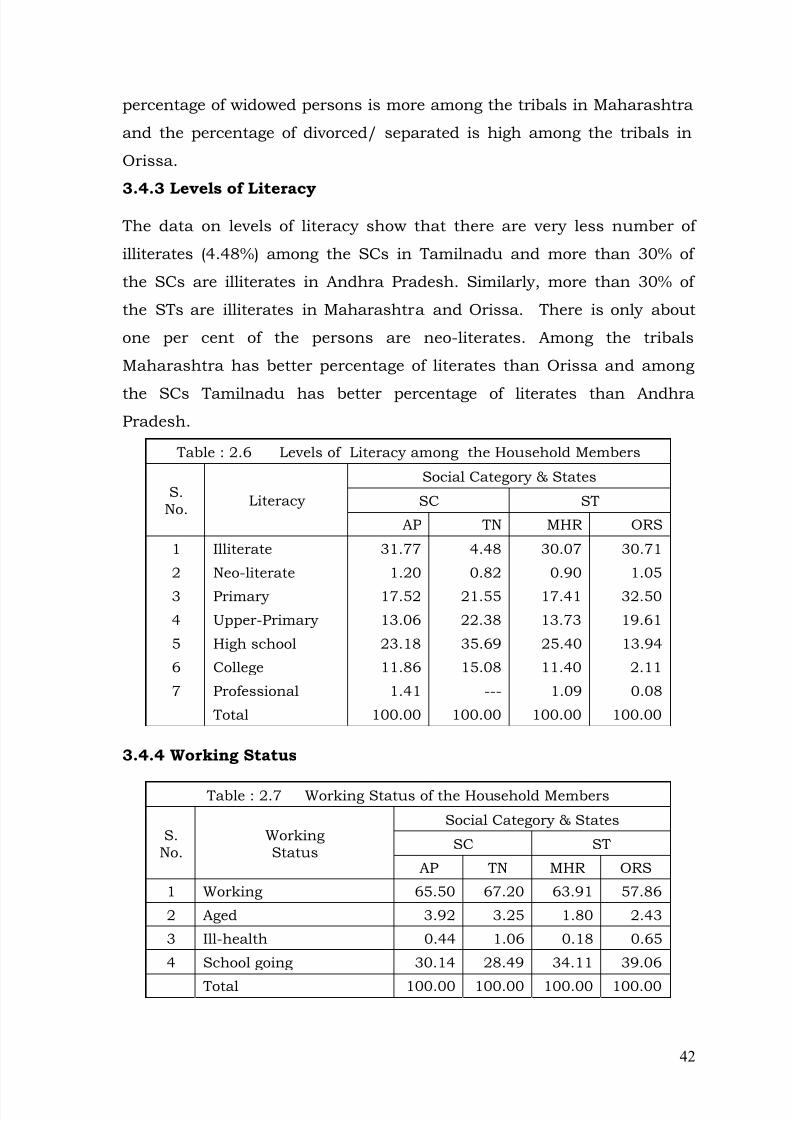
3.4.3 Levels of Literacy The data on levels of literacy show that there are very less number of
illiterates (4.48%) among the SCs in Tamilnadu and more than 30% of
the SCs are illiterates in Andhra Pradesh. Similarly, more than 30% of
the STs are illiterates in Maharashtra and Orissa. There is only about
one per cent of the persons are neo-literates. Among the tribals
Maharashtra has better percentage of literates than Orissa and among
the SCs Tamilnadu has better percentage of literates than AndhraPradesh.
Table : 2.6 Levels of Literacy among the Household Members
S.No. Literacy
Social Category & States
SC ST
AP TN MHR ORS
1 Illiterate 31.77 4.48 30.07 30.71
2 Neo-literate 1.20 0.82 0.90 1.05
3 Primary 17.52 21.55 17.41 32.50
4 Upper-Primary 13.06 22.38 13.73 19.61
5 High school 23.18 35.69 25.40 13.94
6 College 11.86 15.08 11.40 2.11
7 Professional 1.41 --- 1.09 0.08
Total 100.00 100.00 100.00 100.00
3.4.4 Working Status
Table : 2.7 Working Status of the Household Members
S.No.
WorkingStatus
Social Category & States
SC ST
AP TN MHR ORS
1 Working 65.50 67.20 63.91 57.86
2 Aged 3.92 3.25 1.80 2.43
3 Ill-health 0.44 1.06 0.18 0.65
4 School going 30.14 28.49 34.11 39.06
Total 100.00 100.00 100.00 100.00
42
8/12/2019 Ser Sca0707
http://slidepdf.com/reader/full/ser-sca0707 43/137
The data on working status reveal that more than 63.91 percent of the
beneficiaries in Andhra Pradesh, Tamilnadu and Maharashtra and the
remaining are non workers due to old age, ill health and school going.
Only 57.86 percent of the beneficiaries in Orissa are workers and theremaining are non-workers and they are school going, old age and ill
health persons.
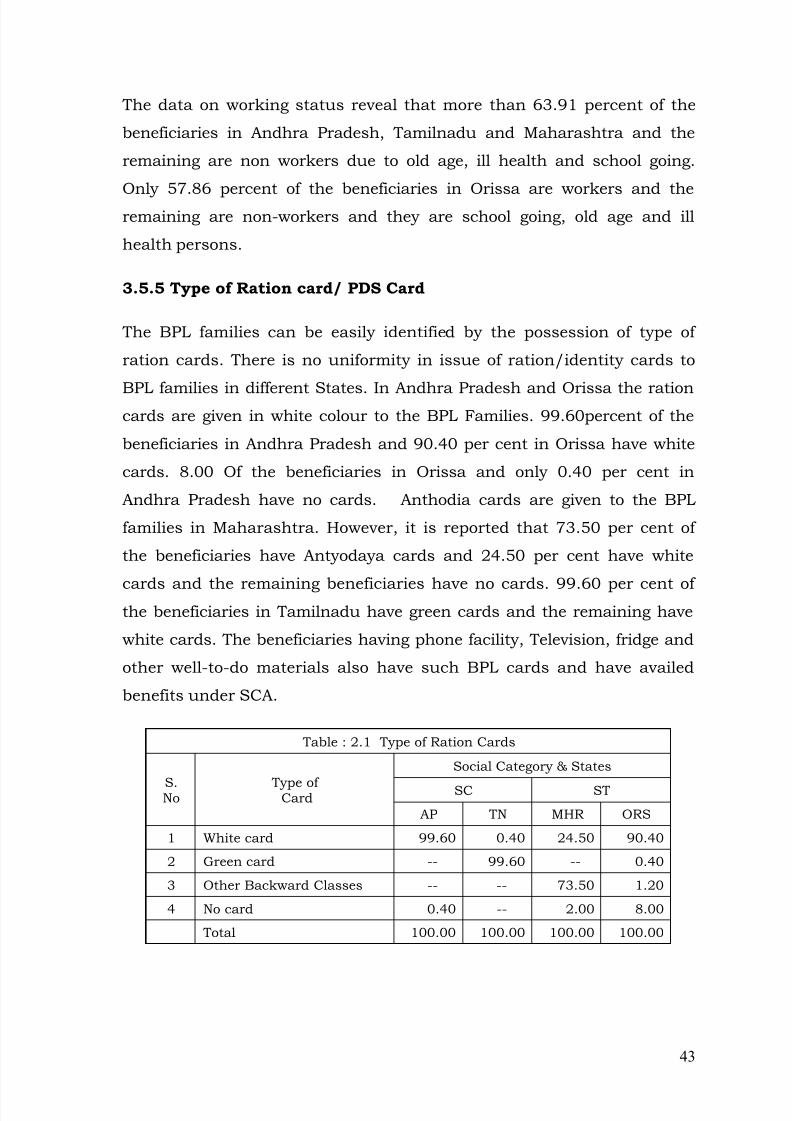
3.5.5 Type of Ration card/ PDS Card
The BPL families can be easily identified by the possession of type of
ration cards. There is no uniformity in issue of ration/identity cards to
BPL families in different States. In Andhra Pradesh and Orissa the rationcards are given in white colour to the BPL Families. 99.60percent of the
beneficiaries in Andhra Pradesh and 90.40 per cent in Orissa have white
cards. 8.00 Of the beneficiaries in Orissa and only 0.40 per cent in
Andhra Pradesh have no cards. Anthodia cards are given to the BPL
families in Maharashtra. However, it is reported that 73.50 per cent of
the beneficiaries have Antyodaya cards and 24.50 per cent have white
cards and the remaining beneficiaries have no cards. 99.60 per cent ofthe beneficiaries in Tamilnadu have green cards and the remaining have
white cards. The beneficiaries having phone facility, Television, fridge and
other well-to-do materials also have such BPL cards and have availed
benefits under SCA.
Table : 2.1 Type of Ration Cards
S.No Type ofCard
Social Category & States
SC ST
AP TN MHR ORS
1 White card 99.60 0.40 24.50 90.40
2 Green card -- 99.60 -- 0.40
3 Other Backward Classes -- -- 73.50 1.20
4 No card 0.40 -- 2.00 8.00
Total 100.00 100.00 100.00 100.00
43
8/12/2019 Ser Sca0707
http://slidepdf.com/reader/full/ser-sca0707 44/137
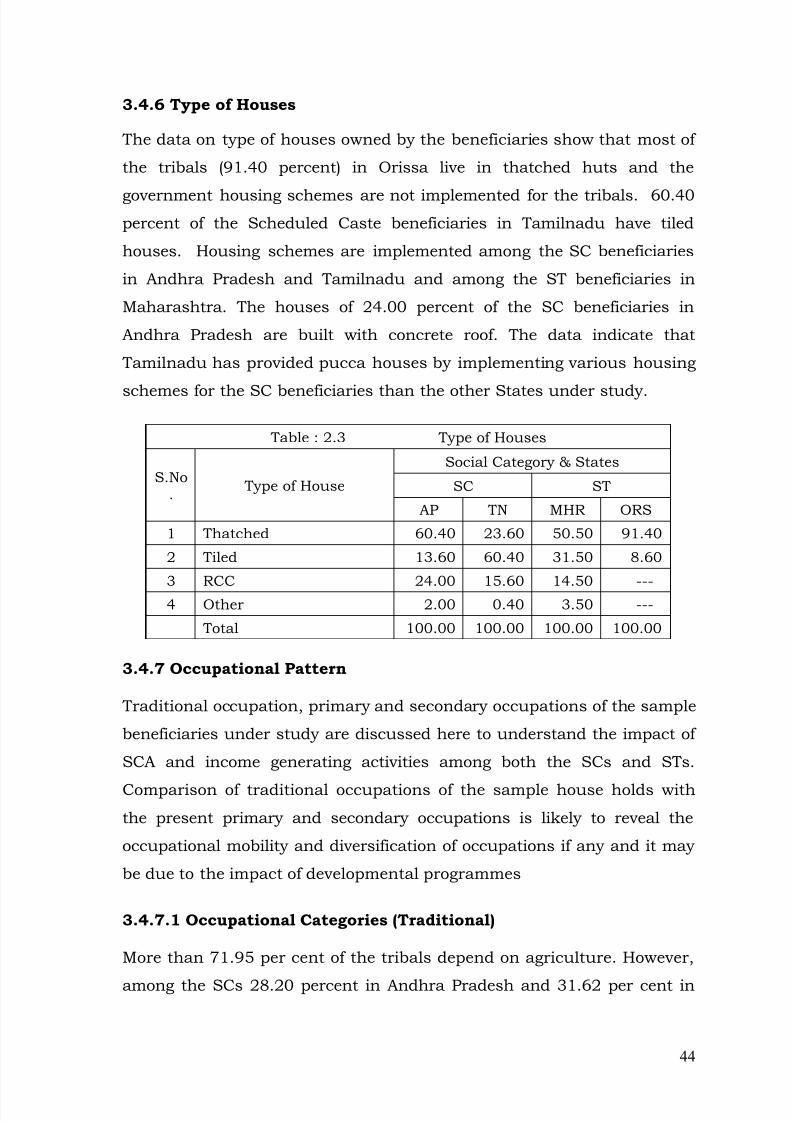
3.4.6 Type of Houses
The data on type of houses owned by the beneficiaries show that most of
the tribals (91.40 percent) in Orissa live in thatched huts and the
government housing schemes are not implemented for the tribals. 60.40percent of the Scheduled Caste beneficiaries in Tamilnadu have tiled
houses. Housing schemes are implemented among the SC beneficiaries
in Andhra Pradesh and Tamilnadu and among the ST beneficiaries in
Maharashtra. The houses of 24.00 percent of the SC beneficiaries in
Andhra Pradesh are built with concrete roof. The data indicate that
Tamilnadu has provided pucca houses by implementing various housing
schemes for the SC beneficiaries than the other States under study.
Table : 2.3 Type of Houses
S.No. Type of House
Social Category & States
SC ST
AP TN MHR ORS
1 Thatched 60.40 23.60 50.50 91.40
2 Tiled 13.60 60.40 31.50 8.60
3 RCC 24.00 15.60 14.50 ---
4 Other 2.00 0.40 3.50 ---
Total 100.00 100.00 100.00 100.00
3.4.7 Occupational Pattern
Traditional occupation, primary and secondary occupations of the sample
beneficiaries under study are discussed here to understand the impact of
SCA and income generating activities among both the SCs and STs.
Comparison of traditional occupations of the sample house holds with
the present primary and secondary occupations is likely to reveal the
occupational mobility and diversification of occupations if any and it may
be due to the impact of developmental programmes
3.4.7.1 Occupational Categories (Traditional)
More than 71.95 per cent of the tribals depend on agriculture. However,
among the SCs 28.20 percent in Andhra Pradesh and 31.62 per cent in
44
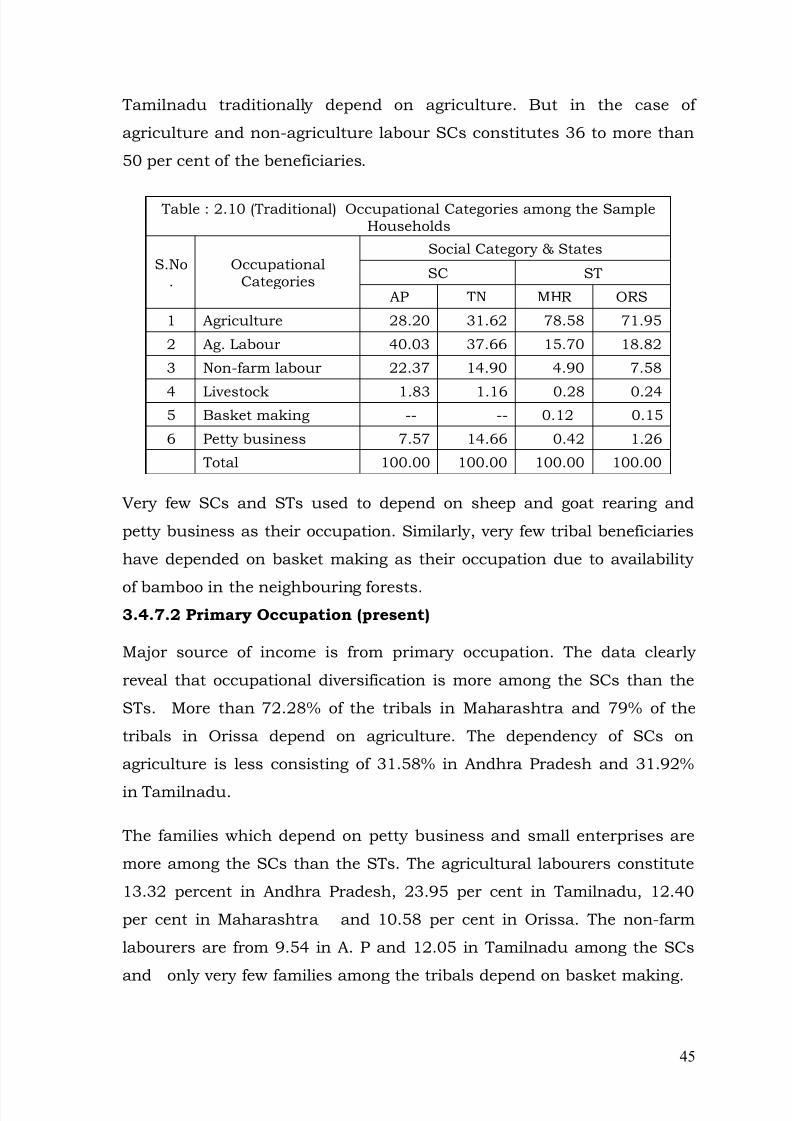
8/12/2019 Ser Sca0707
http://slidepdf.com/reader/full/ser-sca0707 45/137
Tamilnadu traditionally depend on agriculture. But in the case of
agriculture and non-agriculture labour SCs constitutes 36 to more than
50 per cent of the beneficiaries.
Table : 2.10 (Traditional) Occupational Categories among the SampleHouseholds
S.No.
OccupationalCategories
Social Category & States
SC ST
AP TN MHR ORS
1 Agriculture 28.20 31.62 78.58 71.95
2 Ag. Labour 40.03 37.66 15.70 18.82
3 Non-farm labour 22.37 14.90 4.90 7.58
4 Livestock 1.83 1.16 0.28 0.245 Basket making -- -- 0.12 0.15
6 Petty business 7.57 14.66 0.42 1.26
Total 100.00 100.00 100.00 100.00
Very few SCs and STs used to depend on sheep and goat rearing and
petty business as their occupation. Similarly, very few tribal beneficiaries
have depended on basket making as their occupation due to availability
of bamboo in the neighbouring forests.3.4.7.2 Primary Occupation (present)
Major source of income is from primary occupation. The data clearly
reveal that occupational diversification is more among the SCs than the
STs. More than 72.28% of the tribals in Maharashtra and 79% of the
tribals in Orissa depend on agriculture. The dependency of SCs on
agriculture is less consisting of 31.58% in Andhra Pradesh and 31.92%
in Tamilnadu.
The families which depend on petty business and small enterprises are
more among the SCs than the STs. The agricultural labourers constitute
13.32 percent in Andhra Pradesh, 23.95 per cent in Tamilnadu, 12.40
per cent in Maharashtra and 10.58 per cent in Orissa. The non-farm
labourers are from 9.54 in A. P and 12.05 in Tamilnadu among the SCs
and only very few families among the tribals depend on basket making.
45
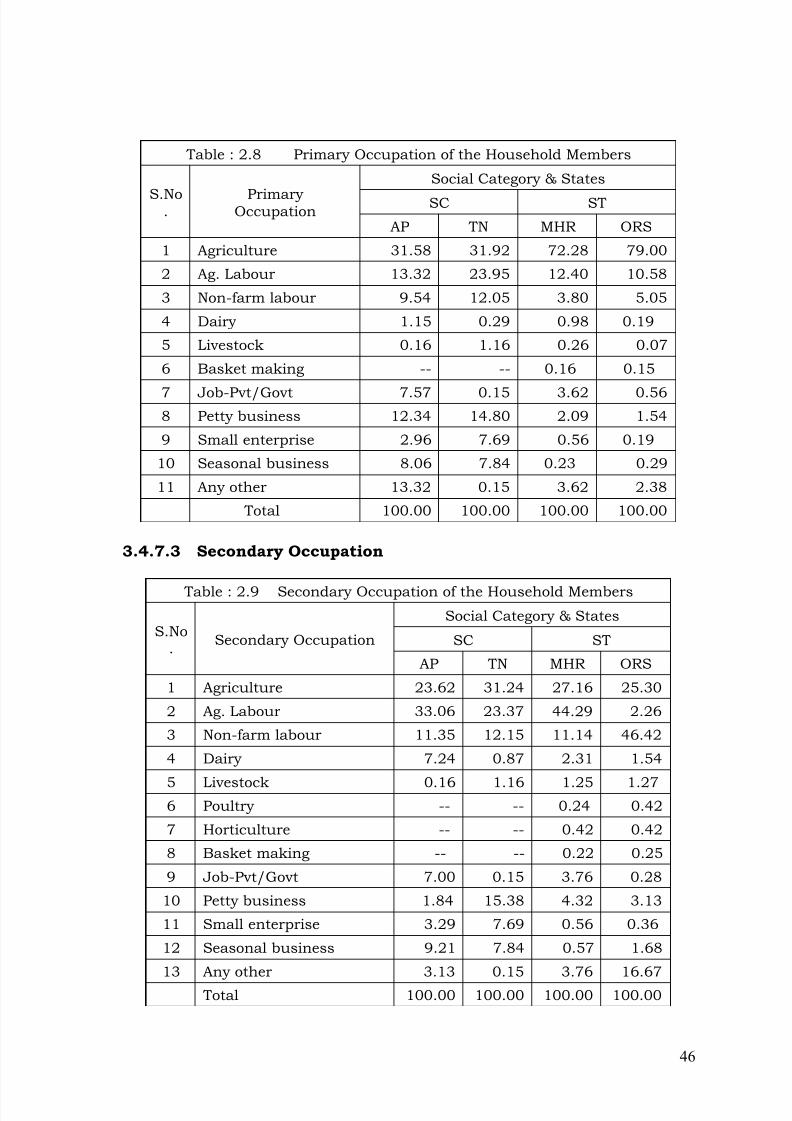
8/12/2019 Ser Sca0707
http://slidepdf.com/reader/full/ser-sca0707 46/137
Table : 2.8 Primary Occupation of the Household Members
S.No.
PrimaryOccupation
Social Category & States
SC ST
AP TN MHR ORS
1 Agriculture 31.58 31.92 72.28 79.00
2 Ag. Labour 13.32 23.95 12.40 10.58
3 Non-farm labour 9.54 12.05 3.80 5.05
4 Dairy 1.15 0.29 0.98 0.19
5 Livestock 0.16 1.16 0.26 0.07
6 Basket making -- -- 0.16 0.15
7 Job-Pvt/Govt 7.57 0.15 3.62 0.568 Petty business 12.34 14.80 2.09 1.54
9 Small enterprise 2.96 7.69 0.56 0.19
10 Seasonal business 8.06 7.84 0.23 0.29
11 Any other 13.32 0.15 3.62 2.38
Total 100.00 100.00 100.00 100.00
3.4.7.3 Secondary Occupation
Table : 2.9 Secondary Occupation of the Household Members
S.No. Secondary Occupation
Social Category & States
SC ST
AP TN MHR ORS
1 Agriculture 23.62 31.24 27.16 25.30
2 Ag. Labour 33.06 23.37 44.29 2.26
3 Non-farm labour 11.35 12.15 11.14 46.42
4 Dairy 7.24 0.87 2.31 1.54
5 Livestock 0.16 1.16 1.25 1.276 Poultry -- -- 0.24 0.42
7 Horticulture -- -- 0.42 0.42
8 Basket making -- -- 0.22 0.25
9 Job-Pvt/Govt 7.00 0.15 3.76 0.28
10 Petty business 1.84 15.38 4.32 3.13
11 Small enterprise 3.29 7.69 0.56 0.36
12 Seasonal business 9.21 7.84 0.57 1.68
13 Any other 3.13 0.15 3.76 16.67
Total 100.00 100.00 100.00 100.00
46
8/12/2019 Ser Sca0707
http://slidepdf.com/reader/full/ser-sca0707 47/137
Agriculture and agricultural labour are the major secondary sources of
income among both SCs and STs. Non-farm labour, petty business and
small enterprises also constitute major secondary sources of income for
both SCs and STs. These are followed by seasonal business, dairy,livestock like goats and sheep and employment in private and public
sectors. Poultry, horticulture and basket making provide supplementary
income to some of the tribals. The data clearly show that there is impact
of SCA in providing supplementary income through various income
generating activities to both SCs and STs. Further comparison of
traditional occupations of the sample house holds with primary and
secondary occupations indicate there is diversification of occupations inall the four states.
3.4.8 Size of Landholdings
It is interesting to note that among the SC beneficiaries 74.40 per cent
in Andhra Pradesh and 62.80 per cent in Tamilnadu are landless. But
among the tribal beneficiaries only 7.60 per cent in Orissa and 22.50 per
cent in Maharashtra are landless. Among the SC beneficiaries 21.60 per
cent in Andhra Pradesh and 36.40 per cent possess an extent of less
than 5 acres of land. The percentage of land holders with less than 5
acres of land among the ST beneficiaries is very high with 61.50 percent
in Maharashtra and 88.80 per cent in Orissa as the tribals are living in
forest areas. Only 2.50 percent of the ST beneficiaries in Maharashtra
and 0.40 per cent in Orissa possess more than 10 acres of land. The
remaining beneficiaries among the SCs and STs have landholdings
ranging between 5-10 acres.
47
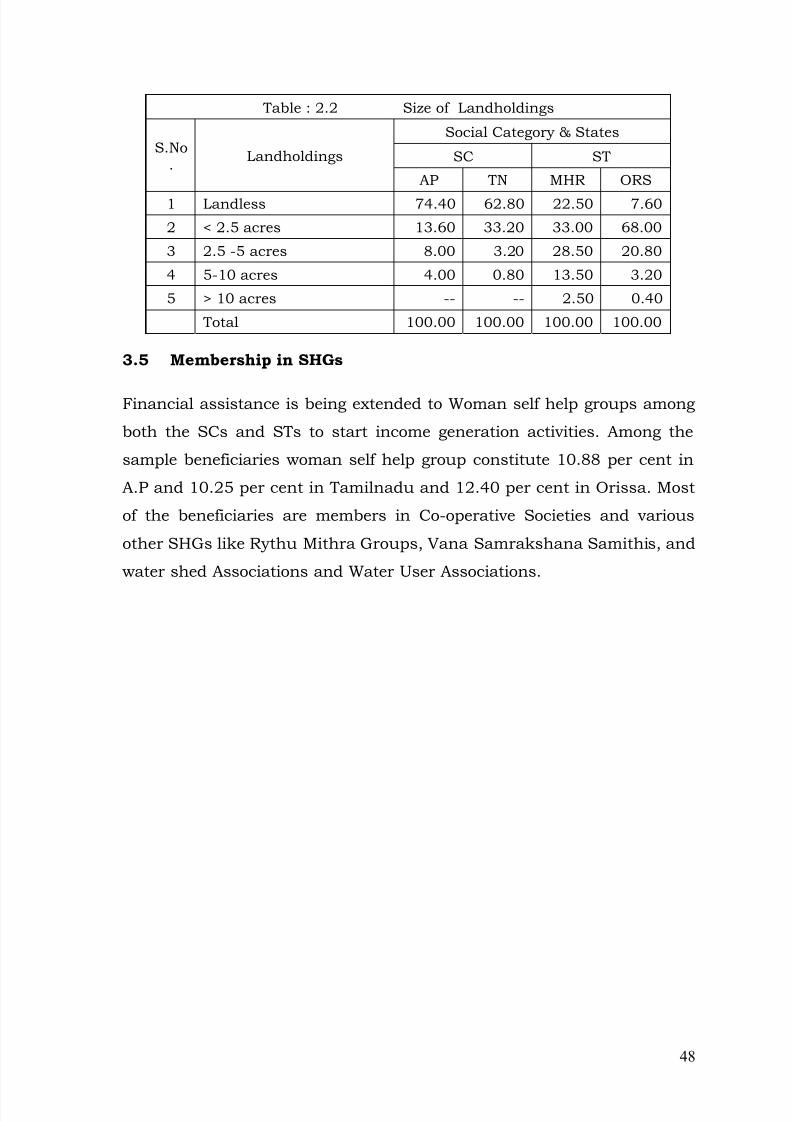
8/12/2019 Ser Sca0707
http://slidepdf.com/reader/full/ser-sca0707 48/137
Table : 2.2 Size of Landholdings
S.No. Landholdings
Social Category & States
SC ST
AP TN MHR ORS
1 Landless 74.40 62.80 22.50 7.60
2 < 2.5 acres 13.60 33.20 33.00 68.00
3 2.5 -5 acres 8.00 3.20 28.50 20.80
4 5-10 acres 4.00 0.80 13.50 3.20
5 > 10 acres -- -- 2.50 0.40
Total 100.00 100.00 100.00 100.00
3.5 Membership in SHGs
Financial assistance is being extended to Woman self help groups among
both the SCs and STs to start income generation activities. Among the
sample beneficiaries woman self help group constitute 10.88 per cent in
A.P and 10.25 per cent in Tamilnadu and 12.40 per cent in Orissa. Most
of the beneficiaries are members in Co-operative Societies and various
other SHGs like Rythu Mithra Groups, Vana Samrakshana Samithis, and
water shed Associations and Water User Associations.
48
8/12/2019 Ser Sca0707
http://slidepdf.com/reader/full/ser-sca0707 49/137
CHAPTER-4
AWARENESS & IDENTIFICATION OFBENEFICIARIES
4.1 PIAs and Awareness
The very first task of any PIA in the implementation of a development
scheme/program among human populations particularly weaker sections
and illiterate populations is to bring awareness by suitable means in
order to reach the program to the target group. There is budgetary
provision to spend on bringing awareness of any programme using
suitable means. Proper awareness leads to proper identification of
beneficiaries and program reach in the target group.
AP State SC Development Finance Corporation, Hyderabad and
Tamilnadu Adi Dravidar Housing and Development Corporation
(TAHDCO), Chennai are public sector Undertakings which implementSCA programmes for the welfare of Scheduled Castes in Andhra Pradesh
in Tamilnadu respectively. The prime objective of these Corporations is to
achieve and sustain increase in the income level of the Scheduled Castes
especially those living under below the poverty line, by enhancing their
productive capacities through the following twin strategies:
a) Assistance in acquiring and improving the income earning
capacities of their physical capital (Assets) through financialassistance schemes for income generating projects.
b) Assistance in improving the human capital (skill) and thereby
improving their income earning capacities through training
programmes.
Similarly, Department of Tribal Welfare and Tribal Development
Corporations implement SCA programmes in Maharashtra and Orissa. There are no specific awareness campaigns at grass root level to bring
49
8/12/2019 Ser Sca0707
http://slidepdf.com/reader/full/ser-sca0707 50/137
awareness of the programmes among the poor, illiterate and ignorant
population among the SCs. However, the awareness on the programmes
percolates to the grass root level population through political activists
and local caste/tribe leaders. Awareness of the schemes is spreadthrough advertisements in newspapers and ashram schools in tribal
areas. Every Tuesday, the Field Inspectors of the taluka meets the local
people at a designated area in the taluka to give information on various
schemes in Maharashtra.
4.2 Means of Information Flow
The means of information flow varies in different States. The majormeans of information consists of Mandal/Block Development Office,
Executive Officer, Rural Development, Print media, Village Sarpanch and
local leaders. Local leaders, Village Sarpanch, Mandal Development
Officer and Print media are the major sources of information that bring
awareness on the SCA schemes. The Executive Officer, Rural
Development and NGOs are the major sources of information in
Tamilnadu. The local leaders and political activists are major sources ofinformation in availing the schemes among the tribals in Maharashtra.
The Block Development Officer and local leaders are the major sources in
bringing awareness among the tribals in Orissa.
The major objective of SCA is to bring the families from below poverty line
to above poverty line by providing sustainable income generation
schemes. It is observed that more than 50 percent of the beneficiary
families are not in below poverty line. They possess household material
like refrigerator, television, telephone etc., However, they possess BPL
ration cards and are considered as families in below poverty line. The
identification of beneficiaries is the major problem in the implementation
of any development programme. The political leaders at grass root level
play an important role in the identification of beneficiaries. It is informed
that more than 50% of the beneficiaries are not genuine and it is
commented that the SCA makes rich more richer and poor more poorer
50
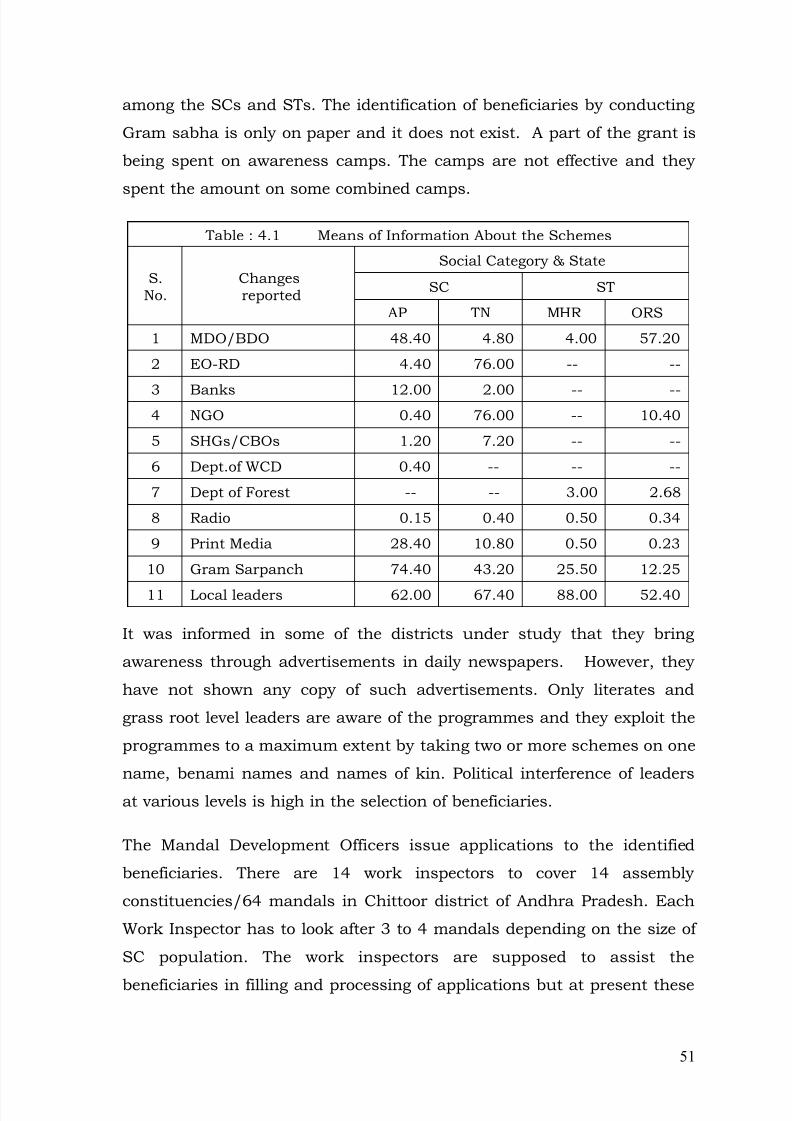
8/12/2019 Ser Sca0707
http://slidepdf.com/reader/full/ser-sca0707 51/137
among the SCs and STs. The identification of beneficiaries by conducting
Gram sabha is only on paper and it does not exist. A part of the grant is
being spent on awareness camps. The camps are not effective and they
spent the amount on some combined camps.
Table : 4.1 Means of Information About the Schemes
S.No.
Changesreported
Social Category & State
SC ST
AP TN MHR ORS
1 MDO/BDO 48.40 4.80 4.00 57.20
2 EO-RD 4.40 76.00 -- --
3 Banks 12.00 2.00 -- --4 NGO 0.40 76.00 -- 10.40
5 SHGs/CBOs 1.20 7.20 -- --
6 Dept.of WCD 0.40 -- -- --
7 Dept of Forest -- -- 3.00 2.68
8 Radio 0.15 0.40 0.50 0.34
9 Print Media 28.40 10.80 0.50 0.23
10 Gram Sarpanch 74.40 43.20 25.50 12.25
11 Local leaders 62.00 67.40 88.00 52.40
It was informed in some of the districts under study that they bring
awareness through advertisements in daily newspapers. However, they
have not shown any copy of such advertisements. Only literates and
grass root level leaders are aware of the programmes and they exploit the
programmes to a maximum extent by taking two or more schemes on one
name, benami names and names of kin. Political interference of leaders
at various levels is high in the selection of beneficiaries.
The Mandal Development Officers issue applications to the identified
beneficiaries. There are 14 work inspectors to cover 14 assembly
constituencies/64 mandals in Chittoor district of Andhra Pradesh. Each
Work Inspector has to look after 3 to 4 mandals depending on the size of
SC population. The work inspectors are supposed to assist the
beneficiaries in filling and processing of applications but at present these
51
8/12/2019 Ser Sca0707
http://slidepdf.com/reader/full/ser-sca0707 52/137
inspectors are kept in charge of recovery of margin money only since
there are huge arrears of margin money.
4.3 Process of Identification of Beneficiaries
District Scheduled Caste Corporation prepares an Action Plan and
budget and submits it to the State Government for approval and financial
sanction. The Executive Director places advertisement in the local news
papers calling applications for the sanction of loans for different schemes.
The District office sends empty applications to all the Mandal
Development Officers for distribution to the applicants.
Gram Sabhas are not being conducted for identification of beneficiaries
since it is a difficult process due to various structural implications and
local political scenario and lack of interest among the concerned officials.
The officials distribute the applications to the eligible candidates and
receive back the duly filled in applications for further processing at
official level. The local political activists maintain good rapport with the
concerned officials and play major role in the selection of beneficiaries.
Mostly, the list of beneficiaries does not include the genuine and poorest
among the poor. Even the preparation of list of families under BPL is not
genuine. Number of social and political factors influence the list of BPL
families. The concerned officials are interested to show high figures of
BPL to get more budget, schemes and programmes. They highlight the
BPL figures in the development proposals to seek more budget/grants.
The manipulative BPL lists, the interference of local political activists and
lack of sincerity and commitment among the officials are the major
constraints in the identification of genuine beneficiaries and development
schemes reaching the poorest of the poor.
The Block/Mandal Development Office scrutinizes the applications,
selects the eligible candidates and sends the list of selected applications
to the District SC Corporation for endorsement and onward transmission
to the Managing Director, State SC Corporation for sanction. In the case
52
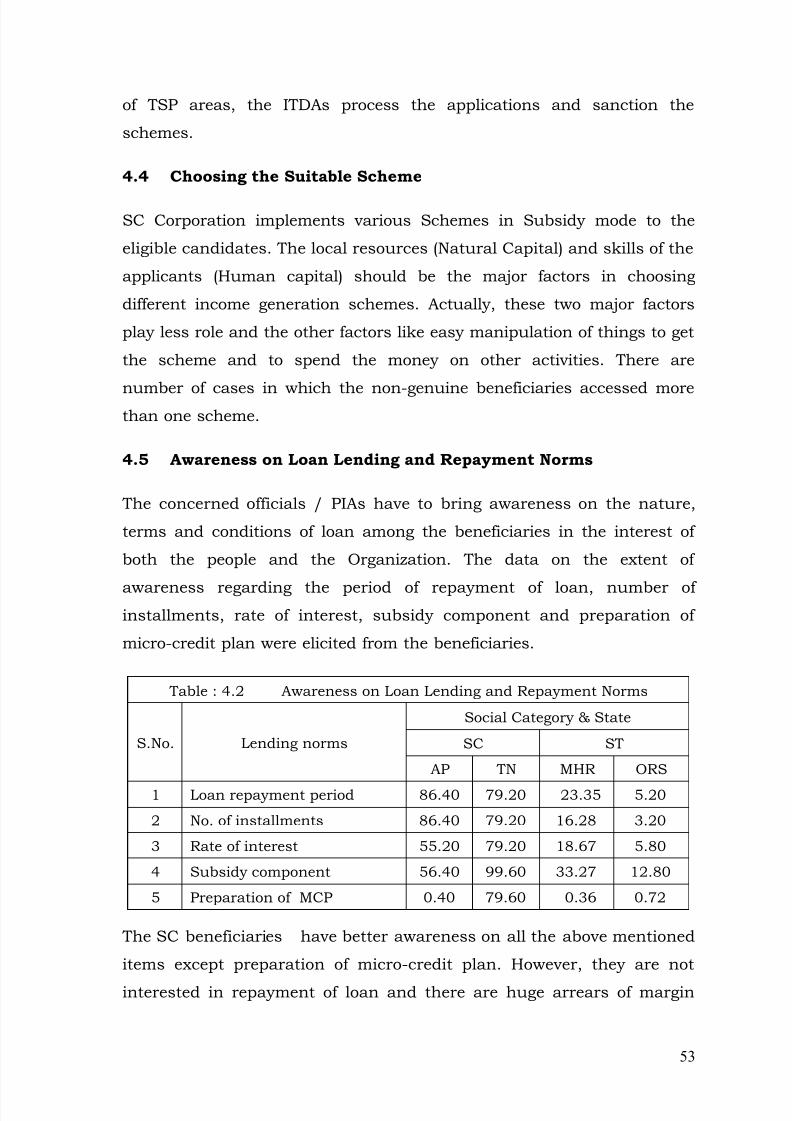
8/12/2019 Ser Sca0707
http://slidepdf.com/reader/full/ser-sca0707 53/137
of TSP areas, the ITDAs process the applications and sanction the
schemes.
4.4 Choosing the Suitable Scheme
SC Corporation implements various Schemes in Subsidy mode to the
eligible candidates. The local resources (Natural Capital) and skills of the
applicants (Human capital) should be the major factors in choosing
different income generation schemes. Actually, these two major factors
play less role and the other factors like easy manipulation of things to get
the scheme and to spend the money on other activities. There are
number of cases in which the non-genuine beneficiaries accessed morethan one scheme.
4.5 Awareness on Loan Lending and Repayment Norms
The concerned officials / PIAs have to bring awareness on the nature,
terms and conditions of loan among the beneficiaries in the interest of
both the people and the Organization. The data on the extent of
awareness regarding the period of repayment of loan, number ofinstallments, rate of interest, subsidy component and preparation of
micro-credit plan were elicited from the beneficiaries.
Table : 4.2 Awareness on Loan Lending and Repayment Norms
S.No. Lending norms
Social Category & State
SC ST
AP TN MHR ORS
1 Loan repayment period 86.40 79.20 23.35 5.20
2 No. of installments 86.40 79.20 16.28 3.20
3 Rate of interest 55.20 79.20 18.67 5.80
4 Subsidy component 56.40 99.60 33.27 12.80
5 Preparation of MCP 0.40 79.60 0.36 0.72
The SC beneficiaries have better awareness on all the above mentioned
items except preparation of micro-credit plan. However, they are not
interested in repayment of loan and there are huge arrears of margin
53
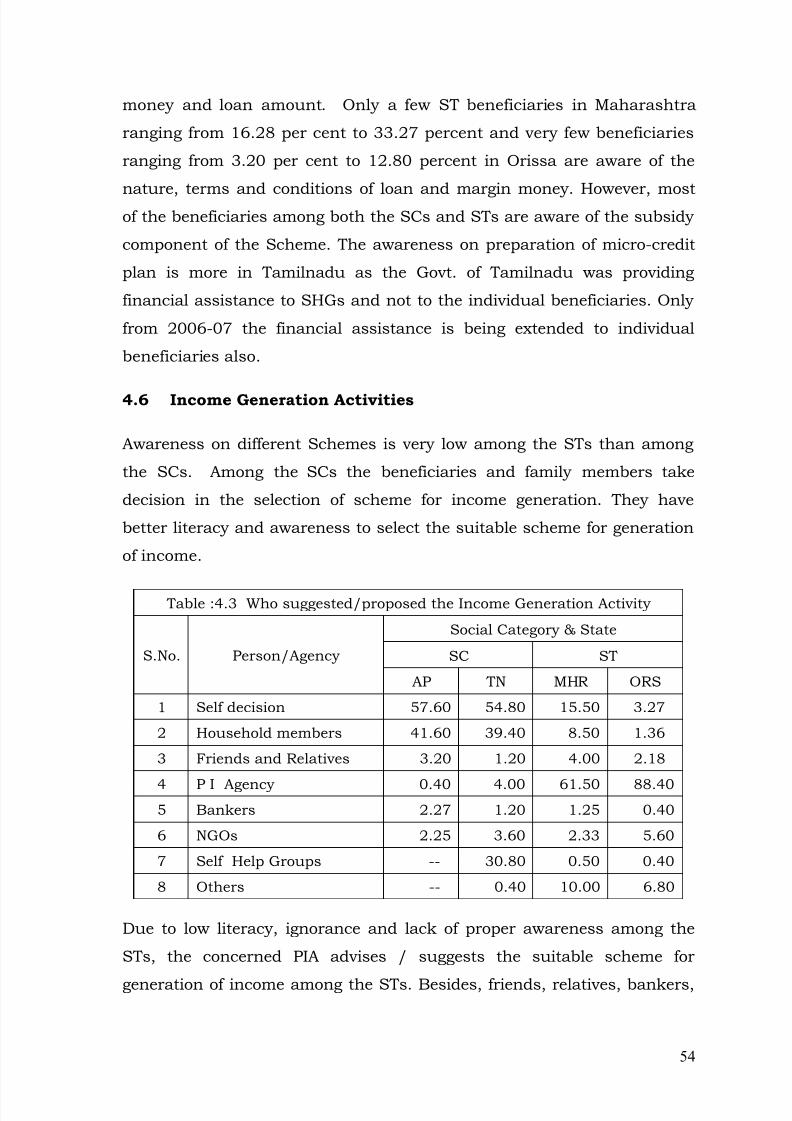
8/12/2019 Ser Sca0707
http://slidepdf.com/reader/full/ser-sca0707 54/137
money and loan amount. Only a few ST beneficiaries in Maharashtra
ranging from 16.28 per cent to 33.27 percent and very few beneficiaries
ranging from 3.20 per cent to 12.80 percent in Orissa are aware of the
nature, terms and conditions of loan and margin money. However, mostof the beneficiaries among both the SCs and STs are aware of the subsidy
component of the Scheme. The awareness on preparation of micro-credit
plan is more in Tamilnadu as the Govt. of Tamilnadu was providing
financial assistance to SHGs and not to the individual beneficiaries. Only
from 2006-07 the financial assistance is being extended to individual
beneficiaries also.
4.6 Income Generation Activities
Awareness on different Schemes is very low among the STs than among
the SCs. Among the SCs the beneficiaries and family members take
decision in the selection of scheme for income generation. They have
better literacy and awareness to select the suitable scheme for generation
of income.
Table :4.3 Who suggested/proposed the Income Generation Activity
S.No. Person/Agency
Social Category & State
SC ST
AP TN MHR ORS
1 Self decision 57.60 54.80 15.50 3.27
2 Household members 41.60 39.40 8.50 1.36
3 Friends and Relatives 3.20 1.20 4.00 2.18
4 P I Agency 0.40 4.00 61.50 88.405 Bankers 2.27 1.20 1.25 0.40
6 NGOs 2.25 3.60 2.33 5.60
7 Self Help Groups -- 30.80 0.50 0.40
8 Others -- 0.40 10.00 6.80
Due to low literacy, ignorance and lack of proper awareness among the
STs, the concerned PIA advises / suggests the suitable scheme for
generation of income among the STs. Besides, friends, relatives, bankers,
54
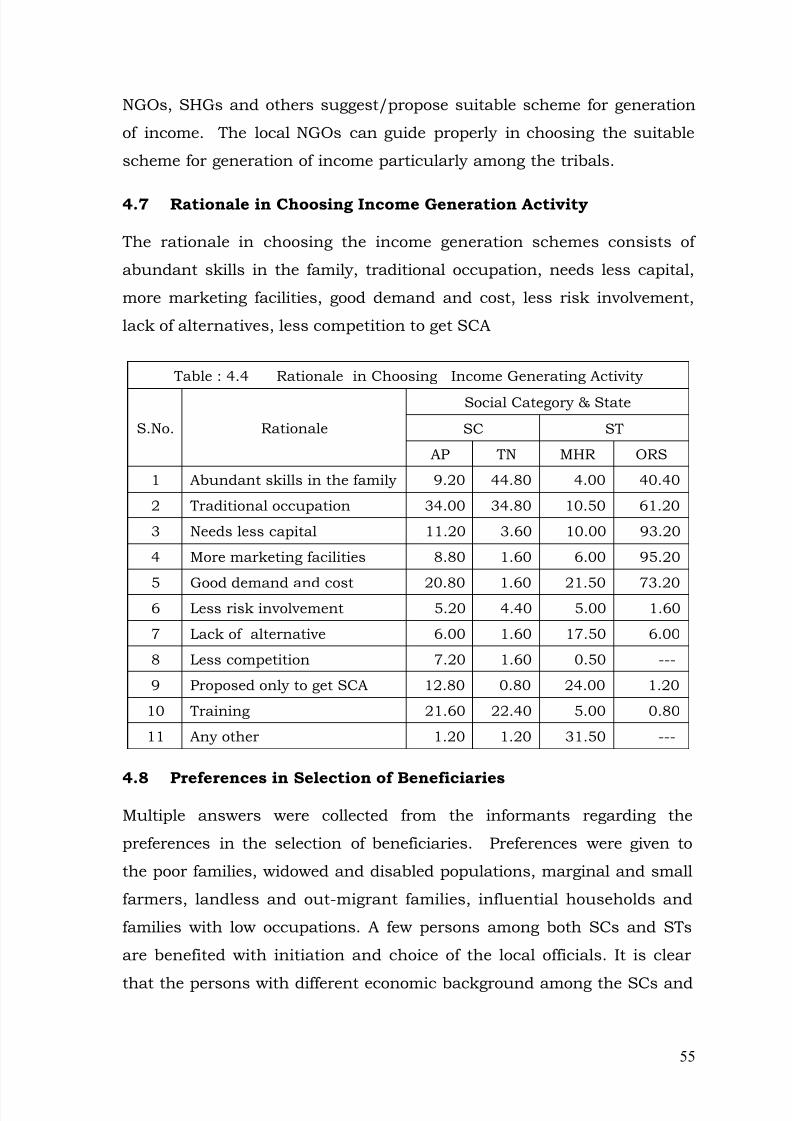
8/12/2019 Ser Sca0707
http://slidepdf.com/reader/full/ser-sca0707 55/137
NGOs, SHGs and others suggest/propose suitable scheme for generation
of income. The local NGOs can guide properly in choosing the suitable
scheme for generation of income particularly among the tribals.
4.7 Rationale in Choosing Income Generation Activity
The rationale in choosing the income generation schemes consists of
abundant skills in the family, traditional occupation, needs less capital,
more marketing facilities, good demand and cost, less risk involvement,
lack of alternatives, less competition to get SCA
Table : 4.4 Rationale in Choosing Income Generating Activity
S.No. Rationale
Social Category & State
SC ST
AP TN MHR ORS
1 Abundant skills in the family 9.20 44.80 4.00 40.40
2 Traditional occupation 34.00 34.80 10.50 61.20
3 Needs less capital 11.20 3.60 10.00 93.20
4 More marketing facilities 8.80 1.60 6.00 95.20
5 Good demand and cost 20.80 1.60 21.50 73.206 Less risk involvement 5.20 4.40 5.00 1.60
7 Lack of alternative 6.00 1.60 17.50 6.00
8 Less competition 7.20 1.60 0.50 ---
9 Proposed only to get SCA 12.80 0.80 24.00 1.20
10 Training 21.60 22.40 5.00 0.80
11 Any other 1.20 1.20 31.50 ---
4.8 Preferences in Selection of BeneficiariesMultiple answers were collected from the informants regarding the
preferences in the selection of beneficiaries. Preferences were given to
the poor families, widowed and disabled populations, marginal and small
farmers, landless and out-migrant families, influential households and
families with low occupations. A few persons among both SCs and STs
are benefited with initiation and choice of the local officials. It is clear
that the persons with different economic background among the SCs and
55
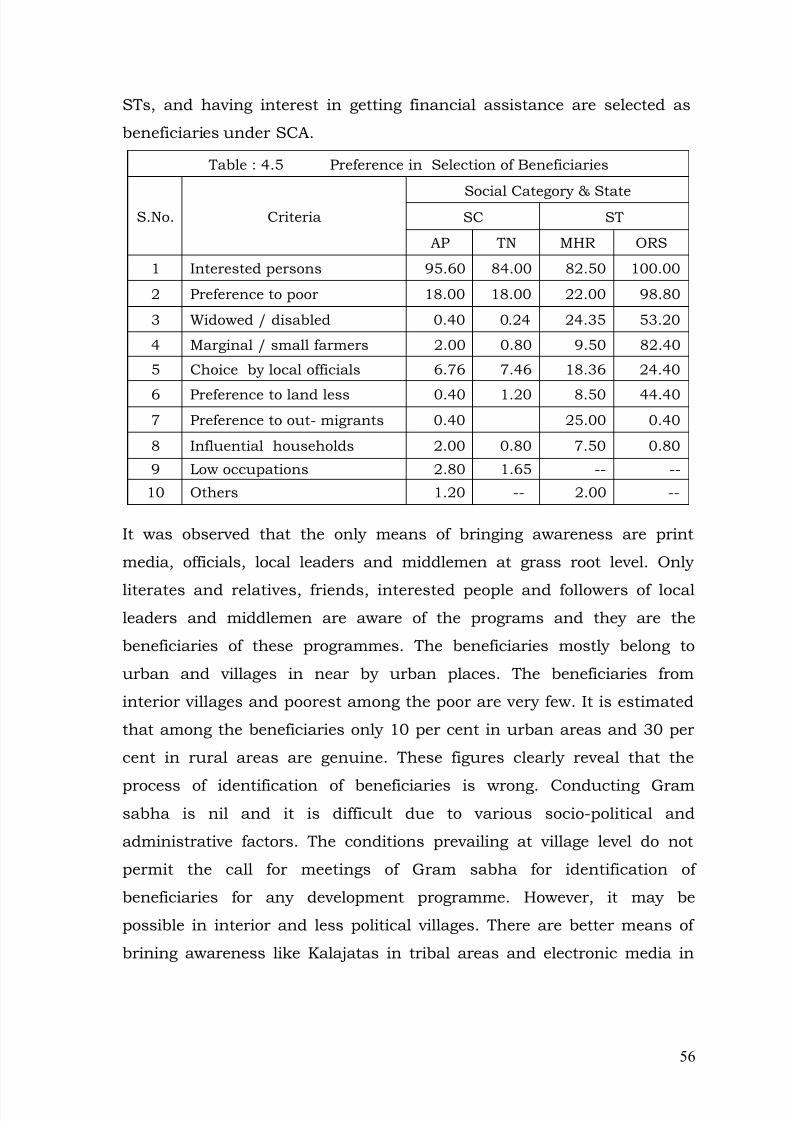
8/12/2019 Ser Sca0707
http://slidepdf.com/reader/full/ser-sca0707 56/137
STs, and having interest in getting financial assistance are selected as
beneficiaries under SCA.
Table : 4.5 Preference in Selection of Beneficiaries
S.No. CriteriaSocial Category & StateSC ST
AP TN MHR ORS
1 Interested persons 95.60 84.00 82.50 100.00
2 Preference to poor 18.00 18.00 22.00 98.80
3 Widowed / disabled 0.40 0.24 24.35 53.20
4 Marginal / small farmers 2.00 0.80 9.50 82.40
5 Choice by local officials 6.76 7.46 18.36 24.40
6 Preference to land less 0.40 1.20 8.50 44.407 Preference to out- migrants 0.40 25.00 0.40
8 Influential households 2.00 0.80 7.50 0.80
9 Low occupations 2.80 1.65 -- --
10 Others 1.20 -- 2.00 --
It was observed that the only means of bringing awareness are print
media, officials, local leaders and middlemen at grass root level. Only
literates and relatives, friends, interested people and followers of localleaders and middlemen are aware of the programs and they are the
beneficiaries of these programmes. The beneficiaries mostly belong to
urban and villages in near by urban places. The beneficiaries from
interior villages and poorest among the poor are very few. It is estimated
that among the beneficiaries only 10 per cent in urban areas and 30 per
cent in rural areas are genuine. These figures clearly reveal that the
process of identification of beneficiaries is wrong. Conducting Gramsabha is nil and it is difficult due to various socio-political and
administrative factors. The conditions prevailing at village level do not
permit the call for meetings of Gram sabha for identification of
beneficiaries for any development programme. However, it may be
possible in interior and less political villages. There are better means of
brining awareness like Kalajatas in tribal areas and electronic media in
56
8/12/2019 Ser Sca0707
http://slidepdf.com/reader/full/ser-sca0707 57/137
non-tribal areas and these should be used properly in bringing
awareness among the target groups.
57
8/12/2019 Ser Sca0707
http://slidepdf.com/reader/full/ser-sca0707 58/137
CHAPTER–5: PROCESS OF IMPLEMENTATION
THADCO in Tamilnadu and SC Development Corporation in Andhra
Pradesh prepare action plans for implementation of the programmes of
SCA. Similarly, the Integrated Tribal Development Agencies (ITDAs)
prepare action plans for implementation of the programmes under SCA in
Maharashtra and Orissa. Different schemes have been kept in the action
plans based on the reports from the field staff and the different line
departments.
5.1 SCHEDULED CASTES SUB-PLAN (SCSP)
The evaluation of Scheduled Castes Sub-Plan was studied in Andhra
Pradesh and Tamilnadu. The procedures of implementation are almost
similar in all the States under study. However, there are few differences
in implementation of the programmes. The duly filled in applications will
be submitted to the concerned Block Development Officer/Mandal
Development Officer for scrutiny and onward transmission to SC
Corporation/TAHDCO at District level. The beneficiaries are then
selected as per the guidelines prepared by the government.
5.2 ANDHRA PRADESH
Andhra Pradesh Scheduled Caste Finance Corporation was set up in the
year 1974 with a view to take up programs for the economic development
of the Scheduled caste families in the State. The prime objective of SC
Corporation is to achieve and sustain increase in income level of the
Scheduled caste population, especially those living in below poverty line.
Financial assistance is being given to the Scheduled castes through SC
Corporation to start Income Generating Activities.
58
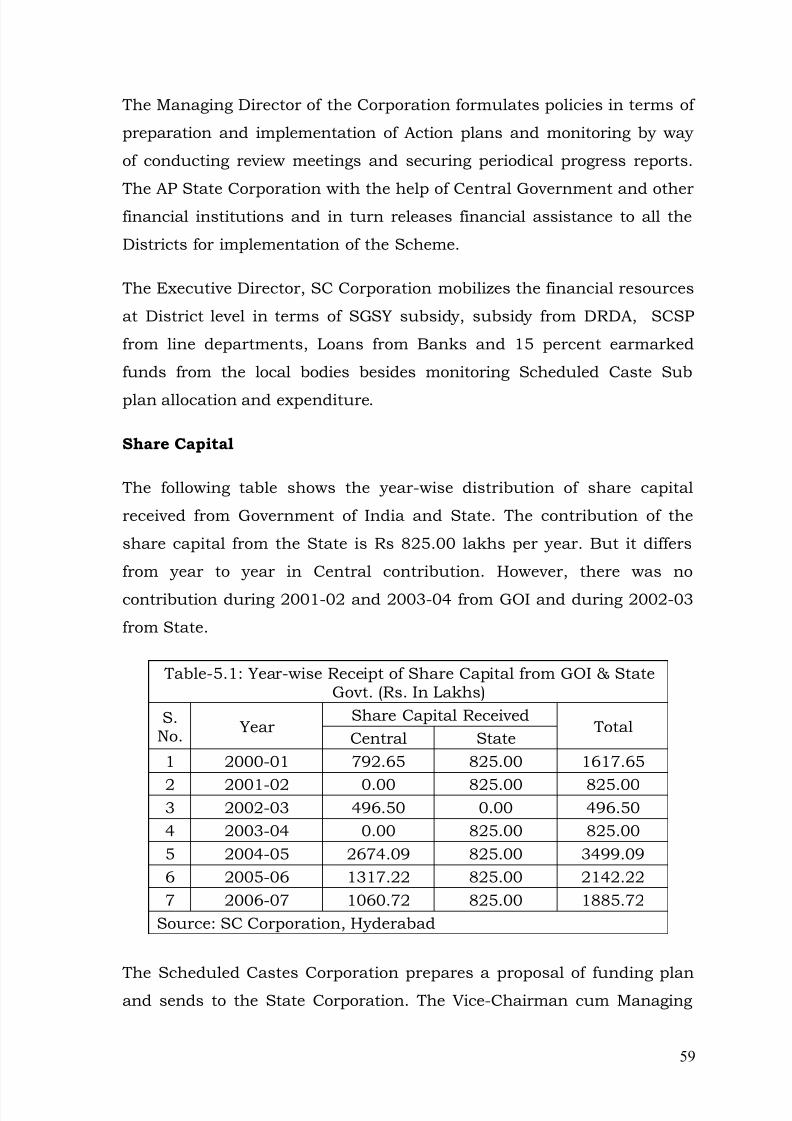
8/12/2019 Ser Sca0707
http://slidepdf.com/reader/full/ser-sca0707 59/137
The Managing Director of the Corporation formulates policies in terms of
preparation and implementation of Action plans and monitoring by way
of conducting review meetings and securing periodical progress reports.
The AP State Corporation with the help of Central Government and otherfinancial institutions and in turn releases financial assistance to all the
Districts for implementation of the Scheme.
The Executive Director, SC Corporation mobilizes the financial resources
at District level in terms of SGSY subsidy, subsidy from DRDA, SCSP
from line departments, Loans from Banks and 15 percent earmarked
funds from the local bodies besides monitoring Scheduled Caste Sub
plan allocation and expenditure.
Share Capital
The following table shows the year-wise distribution of share capital
received from Government of India and State. The contribution of the
share capital from the State is Rs 825.00 lakhs per year. But it differs
from year to year in Central contribution. However, there was no
contribution during 2001-02 and 2003-04 from GOI and during 2002-03
from State.
Table-5.1: Year-wise Receipt of Share Capital from GOI & StateGovt. (Rs. In Lakhs)
S.No. Year
Share Capital Received Total
Central State1 2000-01 792.65 825.00 1617.65
2 2001-02 0.00 825.00 825.003 2002-03 496.50 0.00 496.504 2003-04 0.00 825.00 825.005 2004-05 2674.09 825.00 3499.096 2005-06 1317.22 825.00 2142.227 2006-07 1060.72 825.00 1885.72
Source: SC Corporation, Hyderabad
The Scheduled Castes Corporation prepares a proposal of funding plan
and sends to the State Corporation. The Vice-Chairman cum Managing
59
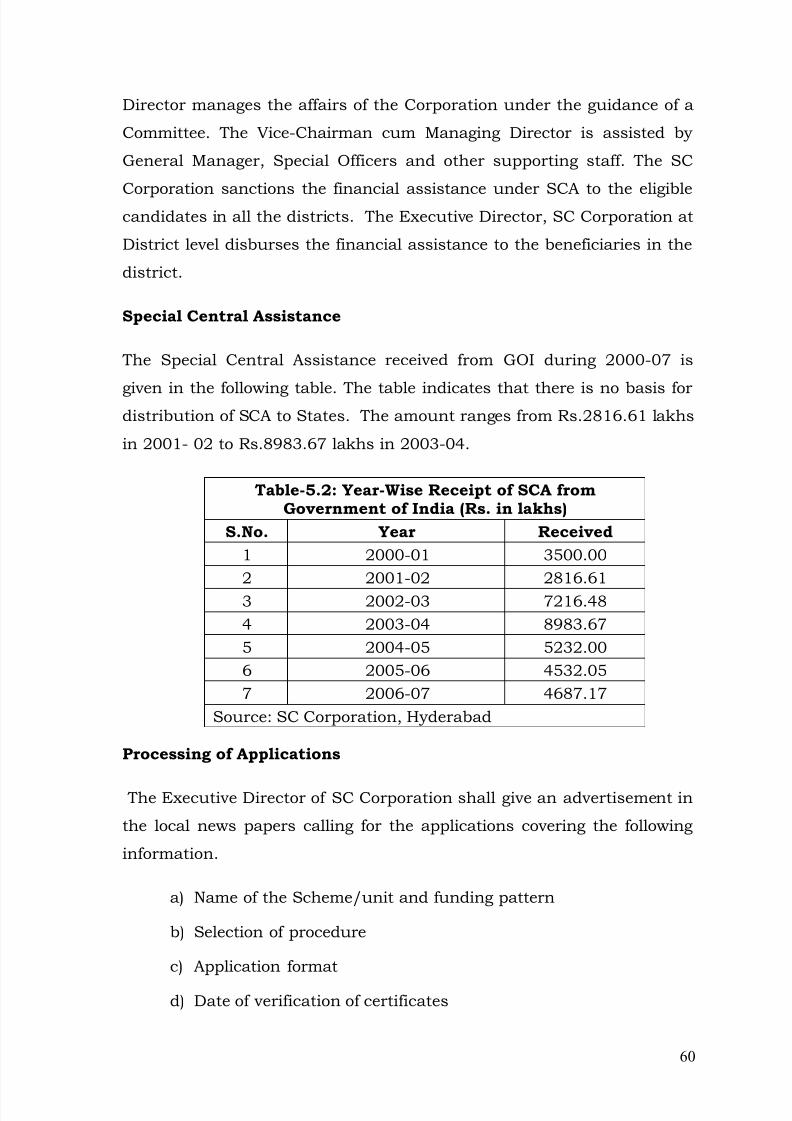
8/12/2019 Ser Sca0707
http://slidepdf.com/reader/full/ser-sca0707 60/137
Director manages the affairs of the Corporation under the guidance of a
Committee. The Vice-Chairman cum Managing Director is assisted by
General Manager, Special Officers and other supporting staff. The SC
Corporation sanctions the financial assistance under SCA to the eligiblecandidates in all the districts. The Executive Director, SC Corporation at
District level disburses the financial assistance to the beneficiaries in the
district.
Special Central Assistance
The Special Central Assistance received from GOI during 2000-07 is
given in the following table. The table indicates that there is no basis fordistribution of SCA to States. The amount ranges from Rs.2816.61 lakhs
in 2001- 02 to Rs.8983.67 lakhs in 2003-04.
Table-5.2: Year-Wise Receipt of SCA fromGovernment of India (Rs. in lakhs)
S.No. Year Received1 2000-01 3500.002 2001-02 2816.613 2002-03 7216.484 2003-04 8983.675 2004-05 5232.006 2005-06 4532.057 2006-07 4687.17
Source: SC Corporation, Hyderabad
Processing of Applications
The Executive Director of SC Corporation shall give an advertisement in
the local news papers calling for the applications covering the following
information.
a) Name of the Scheme/unit and funding pattern
b) Selection of procedure
c) Application format
d) Date of verification of certificates
60
8/12/2019 Ser Sca0707
http://slidepdf.com/reader/full/ser-sca0707 61/137
Fifteen days time shall be given to the candidates to submit their
applications to the District SC Cooperative Society Ltd. After receiving
the duly filled in applications from the educated unemployed youth
among the Scheduled Castes, the applications shall be scrutinized andplaced before the District Selection committee. The Committee consists of
the following members
a) District Collector Chairman
b) Executive Director Convener
c) Project Director (DRDA) Member
d) General Manager, DIC Member
e) Road Transport Officer Member(In case of transport sector)
There is no need to conduct interview. Only verification of certificates
shall be done. All the candidates who have applied shall be ranked as
per weightage of marks. Candidates who are working temporarily as
drivers on monthly basis having permanent driving license shall be given
preference for the schemes under transport sector. The marks list shall
be approved by the District Collector and shall be published in the notice
board of the Office of the Executive Director. The marks obtained by all
the applicants (selected or not selected) shall also be published and
informed to them in writing .
The selected candidates shall be called for counseling before a District
Level committee headed by the Joint Collector with other members like
General Manager, DIC, Executive Director etc,. The final projects may beapproved after counseling. The project shall be recommended only if
they are technically feasible and economically viable. Reservation of 33 %
women representation and 3 % physically handicapped shall be followed.
61
8/12/2019 Ser Sca0707
http://slidepdf.com/reader/full/ser-sca0707 62/137
5.3 Eligibility
1. The beneficiary should be from Scheduled Caste community.
2. Beneficiaries whose annual income is below double poverty
line (annual income shall not exceed Rs. 40,000/- p.a. for
rural and Rs. 55,000/- p.a. for urban)
3. Candidates should not have been assisted by the SC Society or
any other department previously.
4. The age of the candidates should be between 18-45 years.
5. Individual, partnership firm/ Co-operative Societies / any other
form of legal associations are eligible to undertake income
generation activities. However, proposals submitted by
partnership firms, Co-Operative Societies and any other forms of
legal associations shall be considered subject to
a) All the candidates should be SC community only.
b) Annual family income of each member / applicant should be
below double the poverty line income limit.
5.4 Procedure of Grounding the Schemes
Keeping in view the performance of the previous year and the likely
availability of funds and also to provide assistance to the beneficiaries at
enhanced scale, action plan for the proposed year has been approved.
The process of distribution and collection of applications from the eligible
candidates will take about one and half months.
Immediately after selection, documentation will be completed as per the
forms and certificates prescribed. After completion of the documentation
the candidate will be advised to open a bank account and deposit 5% as
promoter’s contribution. As per the choice of the beneficiaries a letter
specifying the brand of asset and the name of the supplier/manufacturer
with the quotation will be submitted by the beneficiary. Suitability of
62
8/12/2019 Ser Sca0707
http://slidepdf.com/reader/full/ser-sca0707 63/137
asset, quality and price etc., will be verified by a committee and negotiate
with the supplier about the price.
Where it is necessary to make payments to the supplier, a cheque will be
prepared from the bank account of the candidate and payment will be
made on the name of the beneficiary. After obtaining the verification
report from the officer of the District Society, the NSFDC loan amount
and subsidy will be released to the Bank account of the beneficiary by
way of cheque.
5.5 Self Help Groups (SHGs)
SC Corporation sanctions financial assistance to Self Help Groups and
individuals. Normally, the loans are given to SHGs belonging to SCs
under BPL for taking up income generation activities. The Corporation
strengthens the SHGs of Scheduled Caste women under the Scheme of
Micro-credit from the year 2000-2001 with assistance from NSFDC. It is
proposed to give priority for providing financial assistance to start income
generation activities.
5.6 Individual Schemes
Most of the Individual Schemes are based on the skills of the
beneficiaries under ISB sector. The Self Employment Schemes are most
beneficial to individual beneficiaries. Except the Micro-credit Schemes all
other individual Schemes have subsidy component.
5.7 Steps in Monitoring
The Corporation has developed a software package for monitoring its
program of implementation of Schemes on regular basis. The Corporation
scrutinizes the data related to sanction and status of the schemes with
reference to funds mobilized by the District Agencies, selection of
beneficiaries, disbursement of financial assistance, recovery of margin
money and other expenditure.
63
8/12/2019 Ser Sca0707
http://slidepdf.com/reader/full/ser-sca0707 64/137
The Corporation conducts periodical review meetings with Executive
Directors at frequent intervals on programs of action plan and guidelines
to be followed in implementation of the schemes.
Physical and Financial Achievements
Following table shows the physical and financial achievements during the
five years ie., 2000-05. This is only on paper but not ground level reality.
It is assumed that the number of BPL families should decrease year by
year because of the huge investments.
Table-5.3: Year Wise Physical & Financial Achievements(Rs. in lakhs)
S.No. Year No. of Beneficiaries Total1 2000-01 78965 9214.242 2001-02 100391 14905.723 2002-03 131554 18321.404 2003-04 147505 20288.215 2004-05 112725 17181.87
Source: SC Corporation, Hyderabad
One of the State level official argued that there is no relationship between
number of individual beneficiaries and number of families benefited since
the schemes are not sufficient to bring the BPL family to APL. Hence, this
can reduce poverty and BPL figures. This indicates that the officials
magnify/manipulate the total figures of BPL families in order to tap more
grants from both Central and State Governments. Large grants carry
more value and gives scope for more activities and more corruption. The
total number of physical achievements in each State during the last 10
years is more than the total number of BPL families.
The Planning Commission may propose sample studies at micro level at
random to study the realities to standardize the criteria used in
measuring BPL families and to standardize the figures of BPL families in
each State.
64
8/12/2019 Ser Sca0707
http://slidepdf.com/reader/full/ser-sca0707 65/137
5.8 TAMILNADU
The implementation of the SCP is being monitored by an apex
empowered committee under the Chairmanship of Member, State
Planning Commission dealing the subject with Secretary, Planning and
Development, Special Secretary, Finance Department as Members
besides all the Secretaries of the concerned Departments. Secretary, Adi-
Dravidar Welfare Department is the Member Secretary. The Committee’s
role is to ensure that benefits of the schemes under SCP reach the
deserving SCs, to finalize the quantum of fund allocated under each
scheme and to oversee the implementation, monitoring and evaluation of
the schemes, priorities, targets and achievement of output indicators set
by the State Government vis-a vis SCP. The State is releasing SCA to
SCP received from Central Government to TAHDCO for economic
oriented benefit schemes besides creation of infrastructure facilities.
5.8.1 Planning and Administration
Tamilnadu Adi Dravidar Housing and Development Corporation
(TAHDCO) was formed in 1974 and entrusted with the task of economic
development activities for both SCs and STs. The economic development
activities of SCs and STs covering sectors like Agriculture and Allied
activities, Mining and Quarrying, Manufacturing, Construction, Trade,
Transport etc. TAHDCO also has a mandate to help the Self Help
Groups, organizes Vocational Training Programmes, construction of
houses and basic infrastructure programmes. TAHDCO has
decentralized its activities and facilities at the District level with District
Collector as the Head of the implementing executives through District
Managers. The State has also the Adi Dravidar Extension Officers in
each Block of the State for the welfare and development of SCs.
The District level sectoral financial and physical targets, monitoring data
is the bench mark and District Collectors and District Managers in
charge of implementation of the schemes are consulted and the feed backfrom them forms a basis for the formulation of SCP schemes and
65
8/12/2019 Ser Sca0707
http://slidepdf.com/reader/full/ser-sca0707 66/137
programmes in the district and the State. Block level Officers and
Tahsildars are implementing officers in the field at the Block and Taluka
level and there are no specific SCP plans either at the block or village
level. The financial and physical targets accomplishment is the main taskof these field level Officers.
Since last year, the State Government has issued orders to involve the
Secretary, Adi Dravidar & Tribal Welfare Department in the Planning and
Monitoring of other sectoral schemes/programs which are catering
benefits to SCs and STs in the State. The State has created separate
budget head and sub heads for SCP and TSP schemes for making the
funds non-divertible.
5.8.2 Monitoring and Evaluation
At the State level, the Secretary, Adi Dravidar department is the
coordinating authority for SCs . He reviews the progress and
implementation of schemes with the Heads of the departments and
ensures effective and speedy implementation of the schemes by removing
bottlenecks with the help of Commissioner, Adi Dravidar Welfare and
Managing Director, TAHDCO. He reviews and monitors the State and
Central schemes under his charge with the District Managers
periodically to achieve the targets. District Collectors are responsible for
coordinating and implementing the schemes of SCs through District
Managers, Departmental heads and extension officers.
5.8.3 Major Schemes implemented
Under Divisible sectors of SCP there are about 111 schemes covering 12
broad sectors directly benefiting the SCs during 10th Plan. Financial
outlays allocated to the various sectors during 2006-07 are Rs.17.54
crore towards crop husbandry, Rs.40.27 crore towards co-operation, Rs.
26.72 crore towards Rural Development, Rs.104.40 crore towards Roads
and Bridges, Rs. 59.36 crore towards General Education, Rs. 137.0
crore towards Water Supply and Sanitation, Rs.45.89 crore towards
66
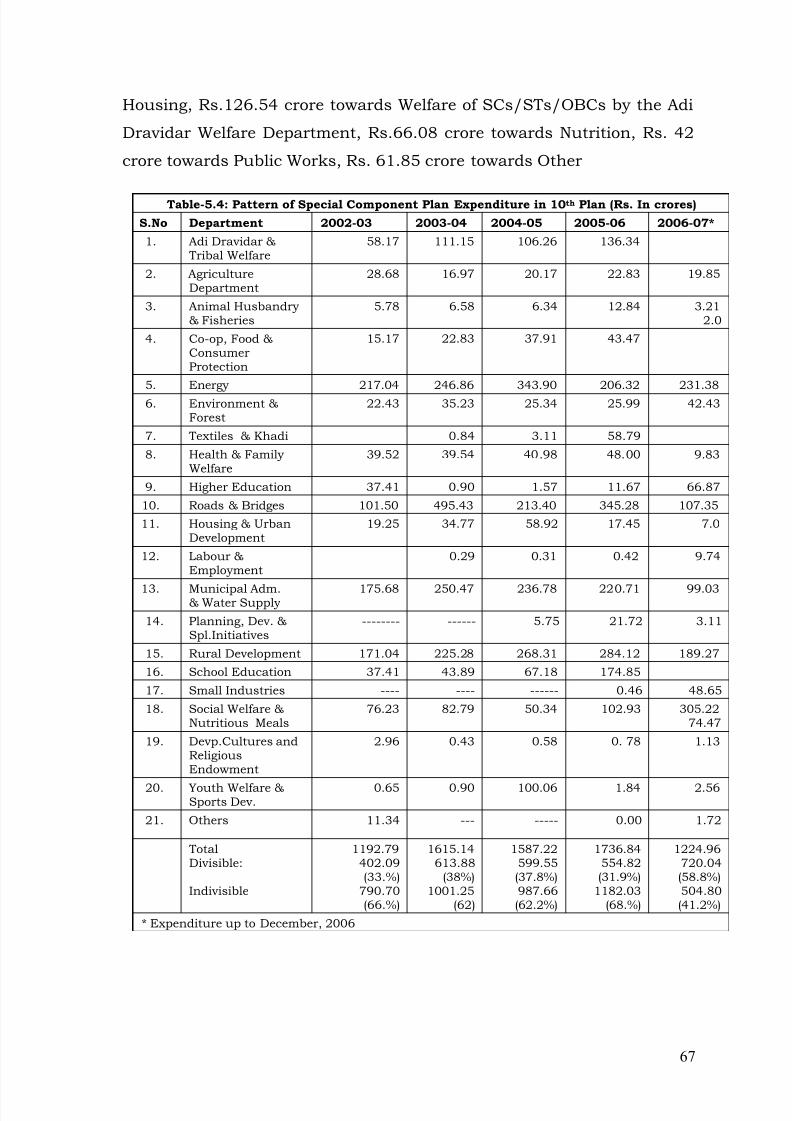
8/12/2019 Ser Sca0707
http://slidepdf.com/reader/full/ser-sca0707 67/137
Housing, Rs.126.54 crore towards Welfare of SCs/STs/OBCs by the Adi
Dravidar Welfare Department, Rs.66.08 crore towards Nutrition, Rs. 42
crore towards Public Works, Rs. 61.85 crore towards Other
Table-5.4: Pattern of Special Component Plan Expenditure in 10 th Plan (Rs. In crores)
S.No Department 2002-03 2003-04 2004-05 2005-06 2006-07*
1. Adi Dravidar & Tribal Welfare
58.17 111.15 106.26 136.34
2. AgricultureDepartment
28.68 16.97 20.17 22.83 19.85
3. Animal Husbandry& Fisheries
5.78 6.58 6.34 12.84 3.212.0
4. Co-op, Food &ConsumerProtection
15.17 22.83 37.91 43.47
5. Energy 217.04 246.86 343.90 206.32 231.38
6. Environment &Forest
22.43 35.23 25.34 25.99 42.43
7. Textiles & Khadi 0.84 3.11 58.79
8. Health & FamilyWelfare
39.52 39.54 40.98 48.00 9.83
9. Higher Education 37.41 0.90 1.57 11.67 66.87
10. Roads & Bridges 101.50 495.43 213.40 345.28 107.35
11. Housing & UrbanDevelopment
19.25 34.77 58.92 17.45 7.0
12. Labour &Employment
0.29 0.31 0.42 9.74
13. Municipal Adm.& Water Supply
175.68 250.47 236.78 220.71 99.03
14. Planning, Dev. &Spl.Initiatives
-------- ------ 5.75 21.72 3.11
15. Rural Development 171.04 225.28 268.31 284.12 189.27
16. School Education 37.41 43.89 67.18 174.85
17. Small Industries ---- ---- ------ 0.46 48.65
18. Social Welfare &Nutritious Meals
76.23 82.79 50.34 102.93 305.2274.47
19. Devp.Cultures andReligiousEndowment
2.96 0.43 0.58 0. 78 1.13
20. Youth Welfare &Sports Dev.
0.65 0.90 100.06 1.84 2.56
21. Others 11.34 --- ----- 0.00 1.72
TotalDivisible:
Indivisible
1192.79402.09(33.%)
790.70(66.%)
1615.14613.88
(38%)1001.25
(62)
1587.22599.55
(37.8%)987.66
(62.2%)
1736.84554.82
(31.9%)1182.03
(68.%)
1224.96720.04
(58.8%)504.80
(41.2%)
* Expenditure up to December, 2006
67
8/12/2019 Ser Sca0707
http://slidepdf.com/reader/full/ser-sca0707 68/137
schemes of Inter-sectoral in nature. Out of the 111 schemes being
implemented every year for the welfare of SCs, majority of the schemes
are towards education (41 schemes), health (15 schemes), housing (9
schemes) and the rest are agriculture, and infrastructure and welfarerelated ones.
5.8.4 TAHDCO schemes and programmes
Tamilnadu Adi Dravidar Housing and Development Corporation
(TAHDCO) is also the channelising agency for the National Scheduled
Caste Finance Development Corporation and National Scheduled Tribe
Finance Development Corporation for the SCs and STs respectivelyespecially those living below the poverty line. The schemes being
implemented by TAHDCO are
1. Land Purchase scheme with a maximum project cost of Rs. 2 lakhs
(50% subsidy and 50% bank loan) for purchase of 2.5 acres wet
land/5 acres dry land.
2. Economic assistance to Self Help Groups with a maximum project
cost of 5 lakhs (50% subsidy, 50% bank loan).
3. Self Help Groups- Revolving fund assistance with a project cost of
Rs.25,000/-.
4. Financial Assistance to Individual Beneficiaries up to Rs. 7.5
lakhs.
5. Collectors Discretionary Fund scheme up to Rs. 10,000/- per
person.
6. Self Employment Programme for Youth, and
7. Vocational Training Programme.
Besides, Entrepreneurship Development Programme for Self Help Groups
and National apex corporations of NSFDC, NSTFDC. NSLRS, NSKFDC
schemes are being extended to SCs and STs. During 2005-06, 1, 69, 284
beneficiaries were assisted in various schemes/programmes and
68
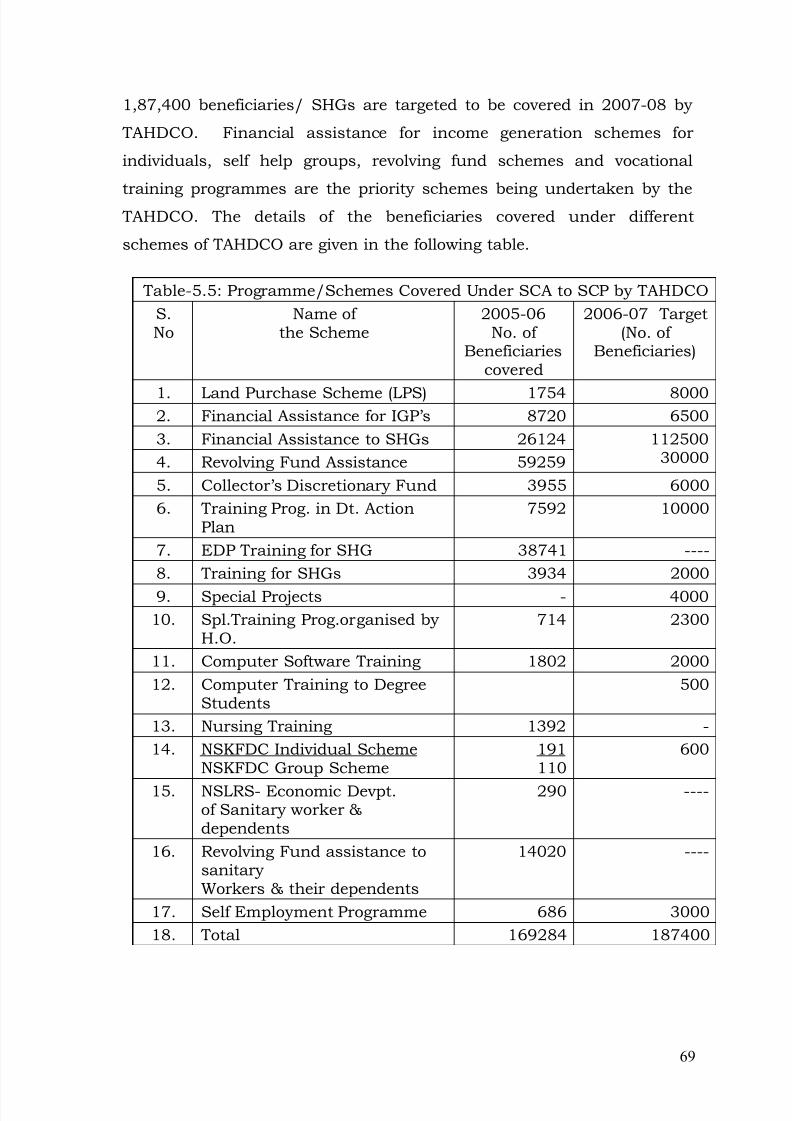
8/12/2019 Ser Sca0707
http://slidepdf.com/reader/full/ser-sca0707 69/137
1,87,400 beneficiaries/ SHGs are targeted to be covered in 2007-08 by
TAHDCO. Financial assistance for income generation schemes for
individuals, self help groups, revolving fund schemes and vocational
training programmes are the priority schemes being undertaken by the TAHDCO. The details of the beneficiaries covered under different
schemes of TAHDCO are given in the following table.
Table-5.5: Programme/Schemes Covered Under SCA to SCP by TAHDCOS.No
Name ofthe Scheme
2005-06No. of
Beneficiariescovered
2006-07 Target(No. of
Beneficiaries)
1. Land Purchase Scheme (LPS) 1754 80002. Financial Assistance for IGP’s 8720 65003. Financial Assistance to SHGs 26124 112500
300004. Revolving Fund Assistance 592595. Collector’s Discretionary Fund 3955 60006. Training Prog. in Dt. Action
Plan7592 10000
7. EDP Training for SHG 38741 ----8. Training for SHGs 3934 20009. Special Projects - 4000
10. Spl.Training Prog.organised byH.O.
714 2300
11. Computer Software Training 1802 200012. Computer Training to Degree
Students500
13. Nursing Training 1392 -14. NSKFDC Individual Scheme
NSKFDC Group Scheme191110
600
15. NSLRS- Economic Devpt.of Sanitary worker &dependents
290 ----
16. Revolving Fund assistance tosanitaryWorkers & their dependents
14020 ----
17. Self Employment Programme 686 300018. Total 169284 187400
69
8/12/2019 Ser Sca0707
http://slidepdf.com/reader/full/ser-sca0707 70/137
5.9 Twenty Point Programme
The 20 point programme is under implementation since 1975. It aims at
integrated approach for the welfare and development of SCs and STs.
Special focus is being given to programmes such as SGSY, distribution of
surplus land, programmes relating to drinking water, housing, slum
improvement, tree planting, and energization of pump-sets through
sectoral departments with District Collectors as monitors. During 8 th
Plan about 15,44, 814 SC families were assisted under this programme
whereas about 19,28,179 SC families in 9 th Plan were covered and about
23,94,299 SC families are targeted in the 10 th Plan period. SCA funded
schemes, IRDP programmes, Rural Development Programmes and forest
related programmes are the Core Sector programme benefiting SCs
under 20 Point Programme.
5.10 TRIBAL SUB-PLAN (TSP)
The evaluation of SCA to Tribal Sub-Plan was studied in Maharashtra
and Orissa.
5.10.1 MAHARASHTRA
The Integrated Tribal Development Agency implements the programmes
of ITDP, Micro, MADA, Clusters and DPSPs in Maharashtra. There is no
Project Level Committee or Monitoring Committee at the moment in
Maharashtra. The schemes under Special Central Assistance change
every year. The schemes are proposed by the POs, which are
subsequently approved or disapproved by the Asst Tribal Commissioner
(ATC). However, sometimes much needed schemes get disapproved. There
is also sometimes no proper interaction between the ATC and Project
Officer ITDP.
The Field Inspectors at ITDA identify the beneficiaries at grass root level
with the help of local leaders. Gram sabhas are not conducted due to
various structural and political factors. A few leaders have availed more
than one scheme. There is no bank linkages as the schemes are total
70
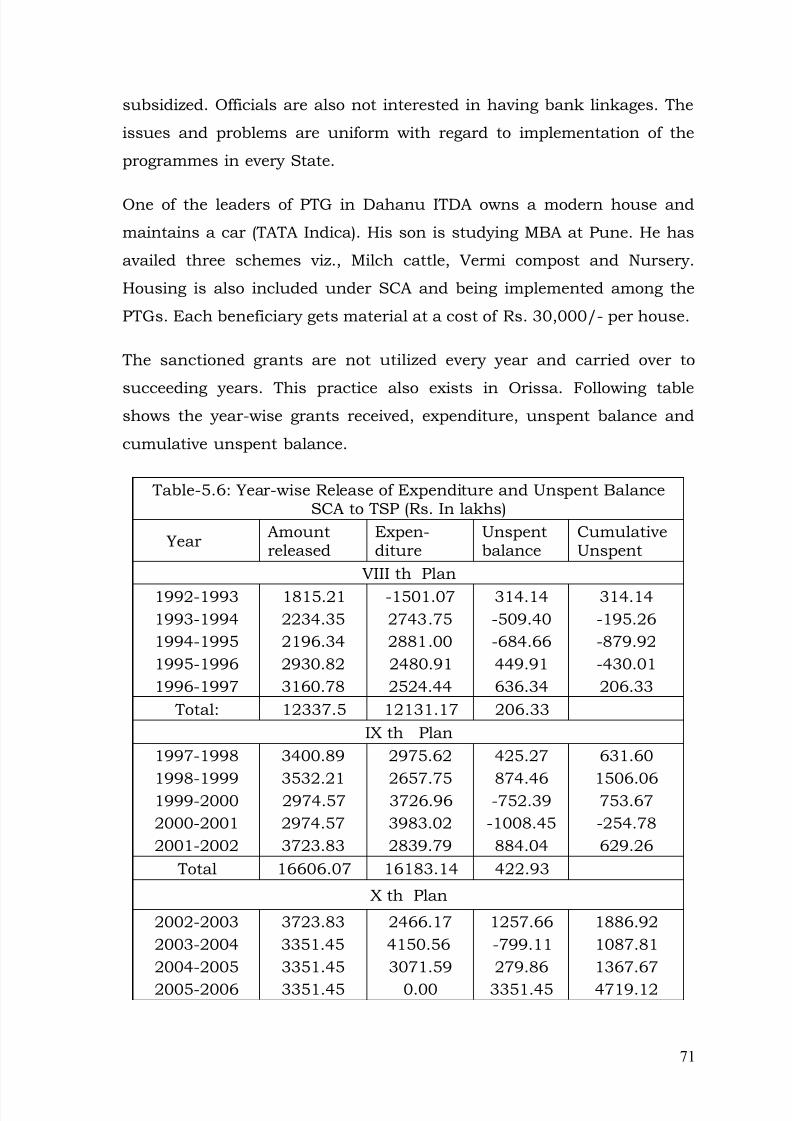
8/12/2019 Ser Sca0707
http://slidepdf.com/reader/full/ser-sca0707 71/137
subsidized. Officials are also not interested in having bank linkages. The
issues and problems are uniform with regard to implementation of the
programmes in every State.
One of the leaders of PTG in Dahanu ITDA owns a modern house and
maintains a car (TATA Indica). His son is studying MBA at Pune. He has
availed three schemes viz., Milch cattle, Vermi compost and Nursery.
Housing is also included under SCA and being implemented among the
PTGs. Each beneficiary gets material at a cost of Rs. 30,000/- per house.
The sanctioned grants are not utilized every year and carried over to
succeeding years. This practice also exists in Orissa. Following tableshows the year-wise grants received, expenditure, unspent balance and
cumulative unspent balance.
Table-5.6: Year-wise Release of Expenditure and Unspent BalanceSCA to TSP (Rs. In lakhs)
Year Amountreleased
Expen-diture
Unspentbalance
CumulativeUnspent
VIII th Plan1992-1993 1815.21 -1501.07 314.14 314.141993-1994 2234.35 2743.75 -509.40 -195.261994-1995 2196.34 2881.00 -684.66 -879.921995-1996 2930.82 2480.91 449.91 -430.011996-1997 3160.78 2524.44 636.34 206.33
Total: 12337.5 12131.17 206.33IX th Plan
1997-1998 3400.89 2975.62 425.27 631.60
1998-1999 3532.21 2657.75 874.46 1506.061999-2000 2974.57 3726.96 -752.39 753.672000-2001 2974.57 3983.02 -1008.45 -254.782001-2002 3723.83 2839.79 884.04 629.26
Total 16606.07 16183.14 422.93
X th Plan
2002-2003 3723.83 2466.17 1257.66 1886.922003-2004 3351.45 4150.56 -799.11 1087.812004-2005 3351.45 3071.59 279.86 1367.672005-2006 3351.45 0.00 3351.45 4719.12
71
8/12/2019 Ser Sca0707
http://slidepdf.com/reader/full/ser-sca0707 72/137
The Commissionarate prepares action plan specifying different schemes
with costs and grant required for different ITDPs in Maharashtra. The
schemes in agriculture sector like digging and deepening of wells and
provision of kerosene/ oil pump sets are showing positive impact. Tribals
are interested in agriculture and cultivating good crops like wheat, pulses
and vegetables. But some of the schemes in ISB sector like provision of
pop corn machines, mushroom cultivation are not successful in tribal
areas.
The vocational training being provided to the tribal youth produced good.
This will be extended to some more areas. The educated women may be
encouraged in medical technology and nursing. That they secure jobs in
hospitals and start their own clinical labs.
5.10.2 ORISSA
Tribal Development administration is headed by the Commissioner-cum-
Secretary of the Department under whom three Directors-cum-Additional
Secretaries are heading the wings of the department; STs, SCs and
OBCs. A Tribal Advisory Council (TAC) is in existence since 1950 which is
mandatory for the Fifth Schedule Areas. The Council has 20 members, of
whom three fourths are ST Members of the State Legislative Assembly.
The Chief Minster is the Chairman and the Minister of Tribal Welfare is
the Vice Chairman and the Secretary of the Dept. of Welfare is the
Secretary of the Council. The TAC advises the Govt. of Orissa in all
matters regarding tribal development and welfare. It was noticed that, the
TAC is not having meetings frequently and effectively functioning in the
State. As the State is having large Scheduled Area, the Governor of the
State is vested with special Constitutional powers and it is mandatory on
the part of the Governor to file report every year on the administration of
the Scheduled Areas of the State to the President of India. However, the
Governor’s reports are not being filed regularly in the State.
72
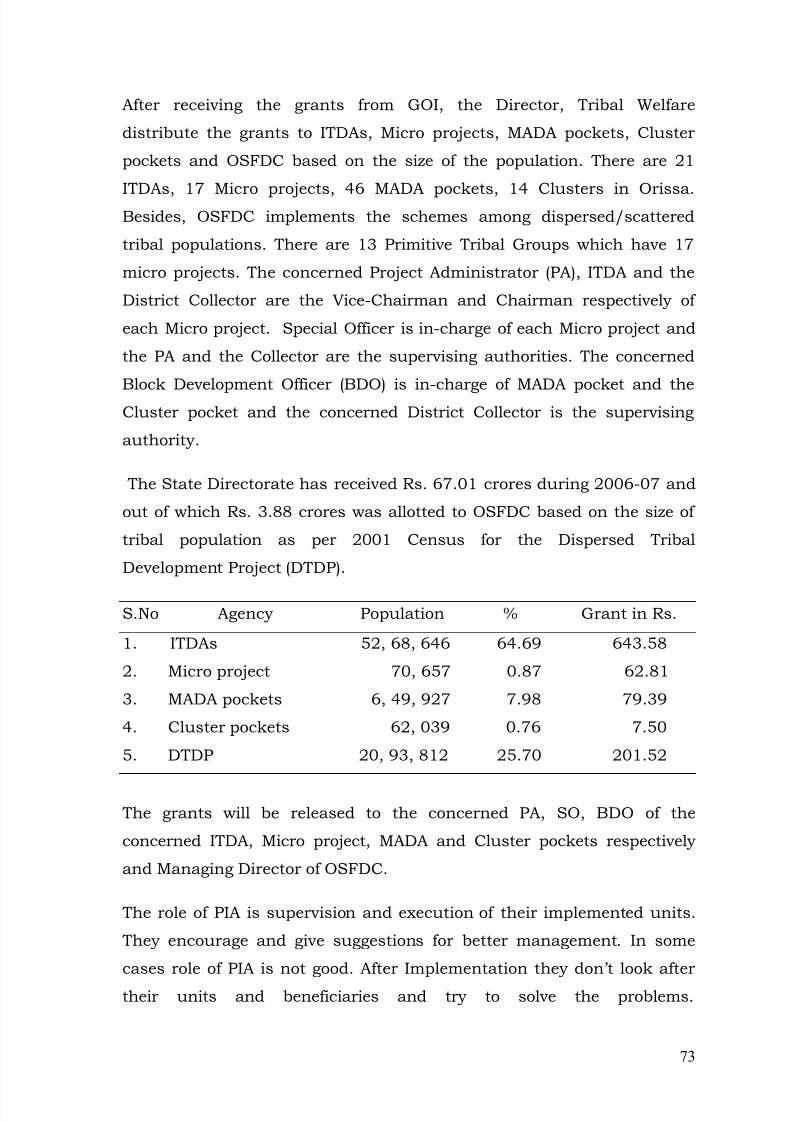
8/12/2019 Ser Sca0707
http://slidepdf.com/reader/full/ser-sca0707 73/137
After receiving the grants from GOI, the Director, Tribal Welfare
distribute the grants to ITDAs, Micro projects, MADA pockets, Cluster
pockets and OSFDC based on the size of the population. There are 21
ITDAs, 17 Micro projects, 46 MADA pockets, 14 Clusters in Orissa.Besides, OSFDC implements the schemes among dispersed/scattered
tribal populations. There are 13 Primitive Tribal Groups which have 17
micro projects. The concerned Project Administrator (PA), ITDA and the
District Collector are the Vice-Chairman and Chairman respectively of
each Micro project. Special Officer is in-charge of each Micro project and
the PA and the Collector are the supervising authorities. The concerned
Block Development Officer (BDO) is in-charge of MADA pocket and theCluster pocket and the concerned District Collector is the supervising
authority.
The State Directorate has received Rs. 67.01 crores during 2006-07 and
out of which Rs. 3.88 crores was allotted to OSFDC based on the size of
tribal population as per 2001 Census for the Dispersed Tribal
Development Project (DTDP).
S.No Agency Population % Grant in Rs.
1. ITDAs 52, 68, 646 64.69 643.58
2. Micro project 70, 657 0.87 62.81
3. MADA pockets 6, 49, 927 7.98 79.39
4. Cluster pockets 62, 039 0.76 7.50
5. DTDP 20, 93, 812 25.70 201.52
The grants will be released to the concerned PA, SO, BDO of the
concerned ITDA, Micro project, MADA and Cluster pockets respectively
and Managing Director of OSFDC.
The role of PIA is supervision and execution of their implemented units.
They encourage and give suggestions for better management. In some
cases role of PIA is not good. After Implementation they don’t look after
their units and beneficiaries and try to solve the problems.
73
8/12/2019 Ser Sca0707
http://slidepdf.com/reader/full/ser-sca0707 74/137
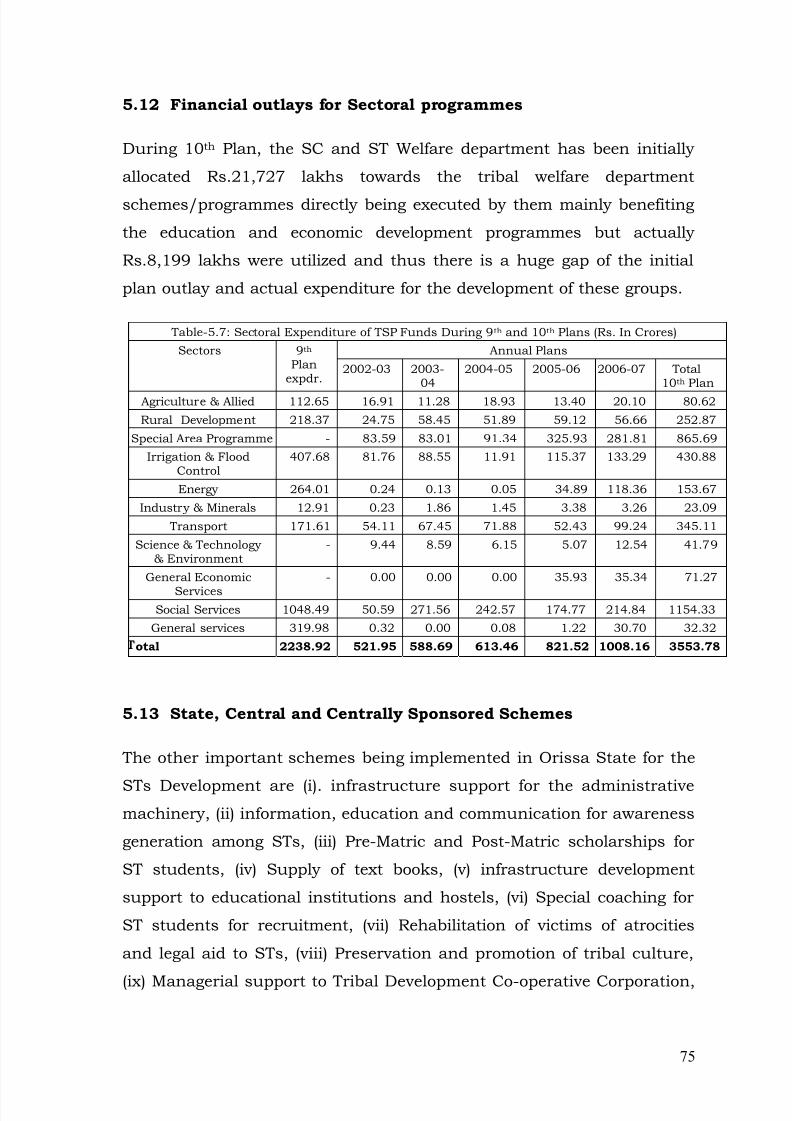
8/12/2019 Ser Sca0707
http://slidepdf.com/reader/full/ser-sca0707 75/137
5.12 Financial outlays for Sectoral programmes
During 10 th Plan, the SC and ST Welfare department has been initially
allocated Rs.21,727 lakhs towards the tribal welfare department
schemes/programmes directly being executed by them mainly benefiting
the education and economic development programmes but actually
Rs.8,199 lakhs were utilized and thus there is a huge gap of the initial
plan outlay and actual expenditure for the development of these groups.
Table-5.7: Sectoral Expenditure of TSP Funds During 9 th and 10 th Plans (Rs. In Crores)
Sectors 9 th Plan
expdr.
Annual Plans
2002-03 2003-04
2004-05 2005-06 2006-07 Total10 th Plan
Agriculture & Allied 112.65 16.91 11.28 18.93 13.40 20.10 80.62
Rural Development 218.37 24.75 58.45 51.89 59.12 56.66 252.87
Special Area Programme - 83.59 83.01 91.34 325.93 281.81 865.69
Irrigation & FloodControl
407.68 81.76 88.55 11.91 115.37 133.29 430.88
Energy 264.01 0.24 0.13 0.05 34.89 118.36 153.67
Industry & Minerals 12.91 0.23 1.86 1.45 3.38 3.26 23.09
Transport 171.61 54.11 67.45 71.88 52.43 99.24 345.11
Science & Technology& Environment
- 9.44 8.59 6.15 5.07 12.54 41.79
General EconomicServices
- 0.00 0.00 0.00 35.93 35.34 71.27
Social Services 1048.49 50.59 271.56 242.57 174.77 214.84 1154.33
General services 319.98 0.32 0.00 0.08 1.22 30.70 32.32
otal 2238.92 521.95 588.69 613.46 821.52 1008.16 3553.78
5.13 State, Central and Centrally Sponsored Schemes
The other important schemes being implemented in Orissa State for the
STs Development are (i). infrastructure support for the administrativemachinery, (ii) information, education and communication for awareness
generation among STs, (iii) Pre-Matric and Post-Matric scholarships for
ST students, (iv) Supply of text books, (v) infrastructure development
support to educational institutions and hostels, (vi) Special coaching for
ST students for recruitment, (vii) Rehabilitation of victims of atrocities
and legal aid to STs, (viii) Preservation and promotion of tribal culture,
(ix) Managerial support to Tribal Development Co-operative Corporation,
75
8/12/2019 Ser Sca0707
http://slidepdf.com/reader/full/ser-sca0707 76/137
(x) Share capital assistance to SC and ST Development Finance
Cooperative Corporation, (xi) State share for the Orissa Tribal
Empowerment and Livelihood Programme (EAP), a IFAD- DFID- WFP
partnership project, (xii) RLTAP plan for KBK districts for theircomprehensive targeted development, (xiii) Up gradation of secondary
schools. Under the Centrally Sponsored Schemes, (i), Construction of ST
boys and girls hostels, (ii) New Ashram Schools and Kanyashrams in TSP
areas, (iii) Pre- examination coaching for civil services (iv) Research and
Training activities of SCSTR &RI, Bhuwaneswar, (v) Transportation cost
of food grains under Central Grain Banks and (vi) Vocational Training
Institutes in Tribal Areas are being implemented.
5.14 Development of PTGs
13 PTGs total population in the State is 59, 710 as per 1991 Census and
as per the latest survey carried out in 2001 by the STSCRTI,
Bhuwaneswar for the micro projects it is about 69, 863. For all round
development of PTGs the State Government is implementing the Central
Sector Schemes through Voluntary Organizations 1998-99 with a thrusttowards education, health, non-conventional sources of energy,
incentives to parents for enrolling their children in schools, tribal dialects
in primary schools and infrastructure development.
The income generating schemes in Koraput ITDA are categorized in to i).
Irrigation structures, ii). Horticulture, iii). Bee keeping, iv). Pisiculture
and v). Vocational training through ITIs.
The process of implementation is almost similar among both SCs and STs
in different States. Issues and problems are also almost similar. They are
not following the procedures of implementation and this depends on
socio-economic, political and administrative implications of different
procedures. Identification of beneficiaries is the major problem in any
development programme being implemented among SCs and STs. No
doubt, Grama Sabha is the right place to identify beneficiaries for anydevelopment programme. But, as mentioned earlier conducting Gram is a
76
8/12/2019 Ser Sca0707
http://slidepdf.com/reader/full/ser-sca0707 77/137
difficult task due to structural and political implications at village level.
However, the situation is comparatively better among the STs. The PIAs
at grass root level are not interested to take risk to conduct Gram Sabha
even in tribal areas and prefer to choose beneficiaries with the help oflocal leaders for their personal benefits. Hence, an alternative strategy is
to be devised for selecting genuine beneficiaries.
The tribal youth of both the sexes should be trained in various vocational
courses and to prepare them to get jobs even in outside tribal areas
which would help them to join the main stream of Indian Society .
77
8/12/2019 Ser Sca0707
http://slidepdf.com/reader/full/ser-sca0707 78/137
CHAPTER-6: ACCESSING AND REPAYMENT
OF LOANS
Financial assistance being provided to the SCs and STs consists of four
components viz., individual contribution, subsidy, margin money and
bank loan. Out of these, the bank loan and the margin money have to be
repaid at lower rate of interest to the lending agencies. However, thebeneficiaries are not serious and not repaying the margin money and
bank loans properly. In the case of STs, the total financial assistance is
provided as subsidy and there is no need of repayment. This becomes
easy to the PIAs to implement the schemes among the tribals.
The processing of applications depends on the, nature of the scheme, role
of middle men, co-ordination between officials with in the same
department and between different departments.
6.1 Time Taken in Processing of Application
The data collected from the beneficiaries reveal that the PIAs have taken
1 to more than 6 months for processing their applications and sanction
of financial assistance to them. The SC Corporation has taken 1-4 weeks
to complete the process of sanction to 53.60 per cent of the beneficiaries
in Andhra Pradesh.
The ITDAs have completed with in a month to process and sanction of
financial assistance to 81.60 per cent of ST beneficiaries in Orissa.
THADCO has taken much time ie., 5 to 12 weeks (3 months) to complete
the process of applications of more than 70 per cent of the SC
beneficiaries in Tamilnadu. In Maharashtra, the ITDAs have sanctioned
78
8/12/2019 Ser Sca0707
http://slidepdf.com/reader/full/ser-sca0707 79/137
financial assistance to 43.50 per cent of ST beneficiaries between 1 to 4
weeks and the remaining have received sanction after 5 to 25 weeks.
Table-6.1: Time Taken to Get the Current Loan
S.No.
No. ofweeks
Social Category & State
SC STAP TN MHR ORS
1 1-4 53.60 23.60 43.50 81.602 5-8 18.80 36.80 11.50 11.603 9-12 18.40 36.00 13.50 6.004 13-16 7.60 1.60 5.50 --5 17-20 1.60 -- 3.00 --
6 21-24 -- 1.20 6.00 0.407 25 + -- 0.80 17.00 0.40
Total 100.00 100.00 100.00 100.00
6.2 Number of Visits made to get Financial Assistance
The beneficiaries have to visit number of times to the middle men and
concerned offices of the PIAs to get sanction of the scheme by loosing
their daily wages and spending expenditure towards travel and food. Hehas to loose at least one day for each trip.
Table-6.2: No. of Visits Made to Get the Current Loan
S.No.
No. ofvisits
Social Category & State
SC STAP TN MHR ORS
1 1-5 63.60 30.80 87.50 97.202 6-10 26.80 65.60 12.50 2.80
3 11-15 6.80 1.60 -- --4 16-20 2.80 2.00 -- --
Total 100.00 100.00 100.00 100.00
The data reveal that more than 87.50 per cent of the ST beneficiaries
have visited minimum number of days ie., less than 5 days. Among the
SC beneficiaries 63.50 per cent in A.P and 65.60 per cent in Tamilnadu
have visited 1 – 5 times and 6 – 10 times respectively. This reveals thatmost of the beneficiaries in Tamilnadu have visited more than 6 times.
79
8/12/2019 Ser Sca0707
http://slidepdf.com/reader/full/ser-sca0707 80/137
Very few SC beneficiaries have visited 11 – 20 times for processing and
getting sanction of their applications.
Most of the people have developed such a mind set to avoid repayment of
margin money and bank loans. Besides, the concerned officials dealing
with programme implementation feel that it is risky to recover the margin
money and other loans from the beneficiaries. In addition, the political
leaders and activists also encourage the beneficiaries not repay their
loans. The PIAs in tribal areas have expressed their feelings that the
implementation of programmes/schemes becomes easy with total
subsidized amount. They also expressed that the tribals are not coming
forward to take the schemes with out total subsidy unlike in SCs.
Due to non repayment of loans properly, most of the banks are not
showing interest to extend loans for the income generation schemes.
6.3 Subsidy Component
Among the tribals in Maharashtra and Orissa the schemes are
implemented with total subsidy. The ITDAs implement the schemesunder tribal sub-plan and DRDA. Subsidy is one of the components of
SCSP schemes with a minimum of 10 per cent of the unit cost depending
on the nature of the scheme.
Table-6.3: Agencies Provided Subsidy Part of Loan
S.No.
Name ofthe Agency
Social Category & StateSC ST
AP TN MHR ORS1 ITDA -- -- 89.50 99.602 S C Corporation 100.00 100.00 -- --3 DRDA/Panchayat 10.50 0.40
Total 100.00 100.00 100.00 100.00
Among the tribals only 0.4 percent in Orissa and 10.5 per cent in
Maharashtra availed schemes with subsidy from DRDAs and the
remaining tribal beneficiaries availed schemes with subsidy from ITDAs.
80
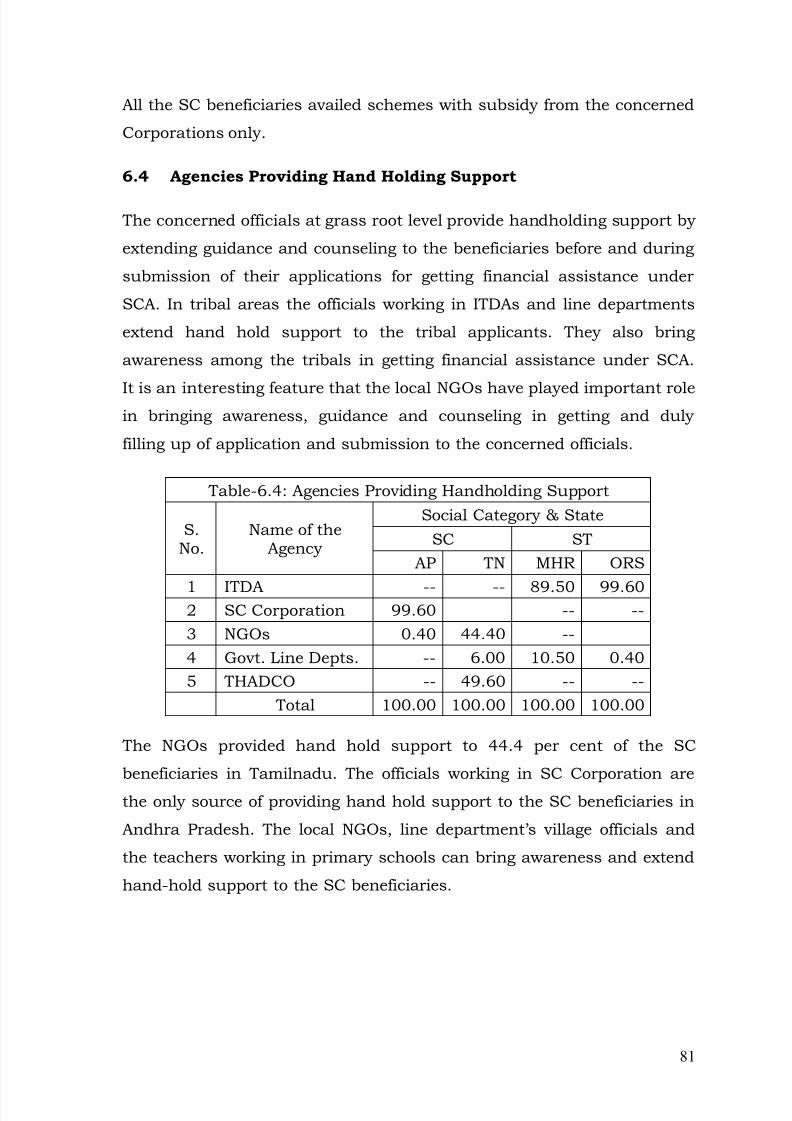
8/12/2019 Ser Sca0707
http://slidepdf.com/reader/full/ser-sca0707 81/137
All the SC beneficiaries availed schemes with subsidy from the concerned
Corporations only.
6.4 Agencies Providing Hand Holding Support
The concerned officials at grass root level provide handholding support by
extending guidance and counseling to the beneficiaries before and during
submission of their applications for getting financial assistance under
SCA. In tribal areas the officials working in ITDAs and line departments
extend hand hold support to the tribal applicants. They also bring
awareness among the tribals in getting financial assistance under SCA.
It is an interesting feature that the local NGOs have played important rolein bringing awareness, guidance and counseling in getting and duly
filling up of application and submission to the concerned officials.
Table-6.4: Agencies Providing Handholding Support
S.No.
Name of theAgency
Social Category & StateSC ST
AP TN MHR ORS
1 ITDA -- -- 89.50 99.602 SC Corporation 99.60 -- --3 NGOs 0.40 44.40 --4 Govt. Line Depts. -- 6.00 10.50 0.405 THADCO -- 49.60 -- --
Total 100.00 100.00 100.00 100.00
The NGOs provided hand hold support to 44.4 per cent of the SC
beneficiaries in Tamilnadu. The officials working in SC Corporation are
the only source of providing hand hold support to the SC beneficiaries in
Andhra Pradesh. The local NGOs, line department’s village officials and
the teachers working in primary schools can bring awareness and extend
hand-hold support to the SC beneficiaries.
81
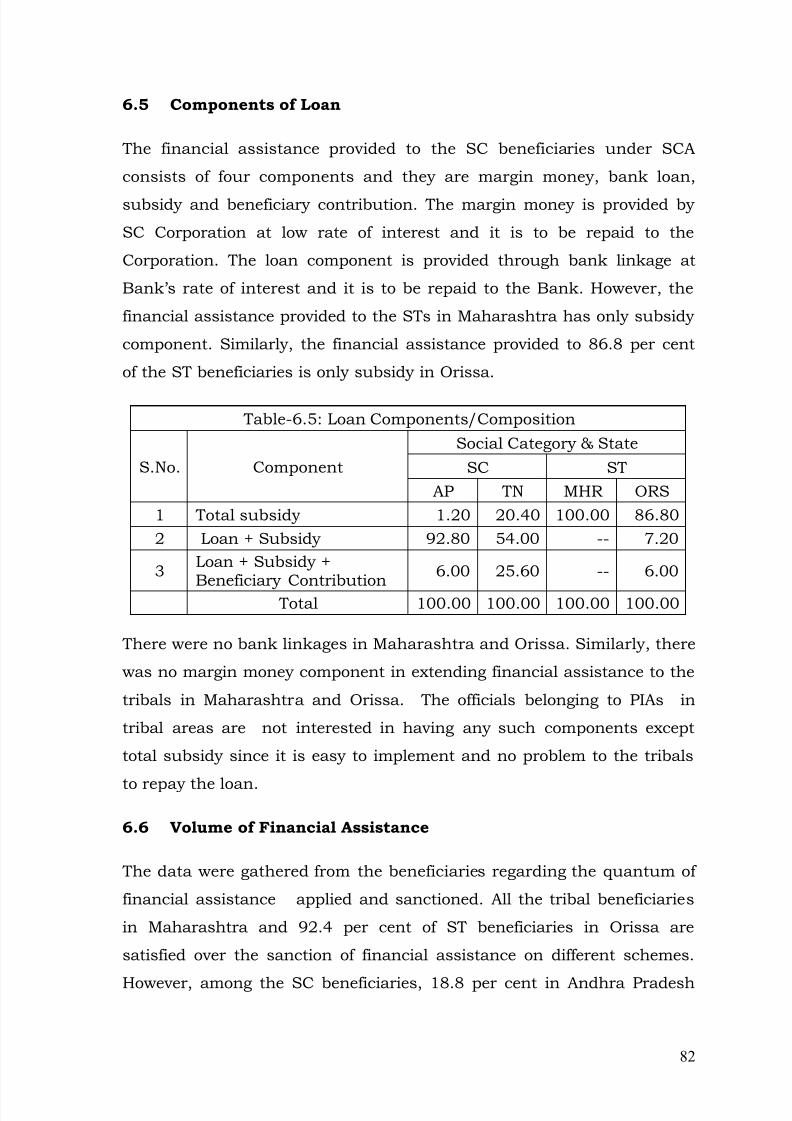
8/12/2019 Ser Sca0707
http://slidepdf.com/reader/full/ser-sca0707 82/137
6.5 Components of Loan
The financial assistance provided to the SC beneficiaries under SCA
consists of four components and they are margin money, bank loan,
subsidy and beneficiary contribution. The margin money is provided by
SC Corporation at low rate of interest and it is to be repaid to the
Corporation. The loan component is provided through bank linkage at
Bank’s rate of interest and it is to be repaid to the Bank. However, the
financial assistance provided to the STs in Maharashtra has only subsidy
component. Similarly, the financial assistance provided to 86.8 per cent
of the ST beneficiaries is only subsidy in Orissa.
Table-6.5: Loan Components/Composition
S.No. ComponentSocial Category & State
SC STAP TN MHR ORS
1 Total subsidy 1.20 20.40 100.00 86.802 Loan + Subsidy 92.80 54.00 -- 7.20
3 Loan + Subsidy +Beneficiary Contribution 6.00 25.60 -- 6.00
Total 100.00 100.00 100.00 100.00
There were no bank linkages in Maharashtra and Orissa. Similarly, there
was no margin money component in extending financial assistance to the
tribals in Maharashtra and Orissa. The officials belonging to PIAs in
tribal areas are not interested in having any such components except
total subsidy since it is easy to implement and no problem to the tribals
to repay the loan.
6.6 Volume of Financial Assistance
The data were gathered from the beneficiaries regarding the quantum of
financial assistance applied and sanctioned. All the tribal beneficiaries
in Maharashtra and 92.4 per cent of ST beneficiaries in Orissa are
satisfied over the sanction of financial assistance on different schemes.
However, among the SC beneficiaries, 18.8 per cent in Andhra Pradesh
82
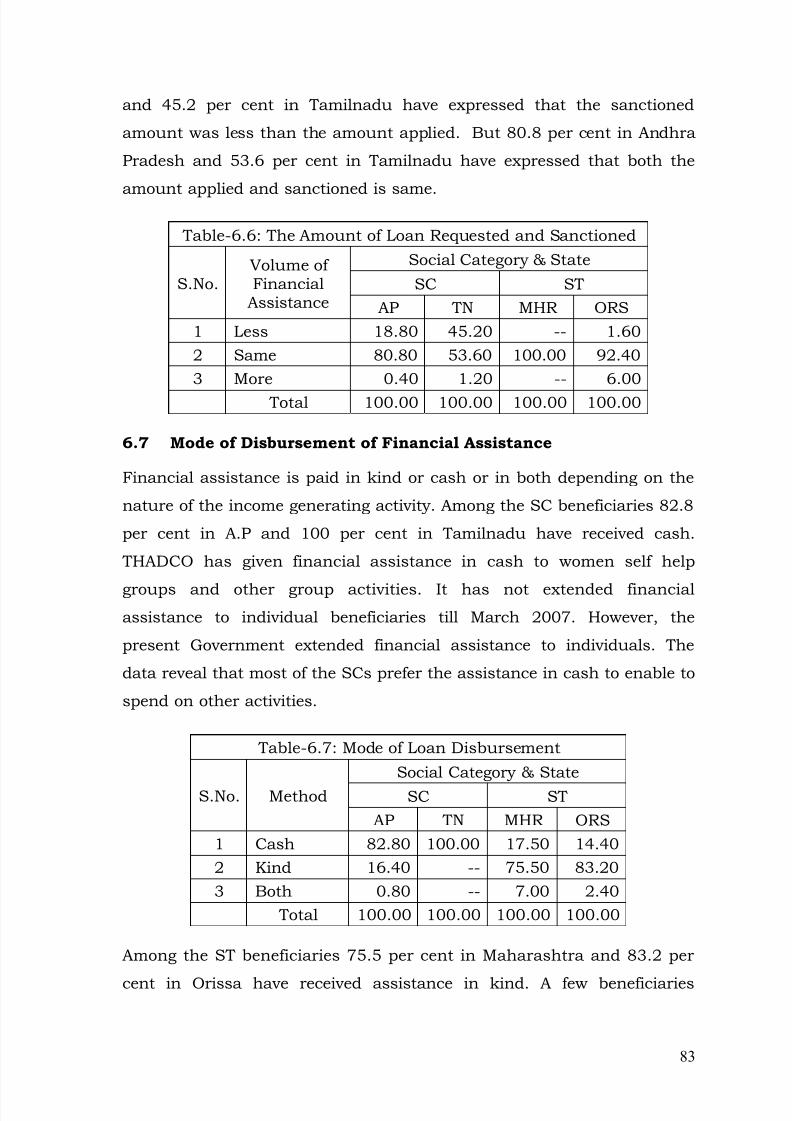
8/12/2019 Ser Sca0707
http://slidepdf.com/reader/full/ser-sca0707 83/137
and 45.2 per cent in Tamilnadu have expressed that the sanctioned
amount was less than the amount applied. But 80.8 per cent in Andhra
Pradesh and 53.6 per cent in Tamilnadu have expressed that both the
amount applied and sanctioned is same.
Table-6.6: The Amount of Loan Requested and Sanctioned
S.No.Volume ofFinancial
Assistance
Social Category & State
SC STAP TN MHR ORS
1 Less 18.80 45.20 -- 1.602 Same 80.80 53.60 100.00 92.403 More 0.40 1.20 -- 6.00
Total 100.00 100.00 100.00 100.00
6.7 Mode of Disbursement of Financial Assistance
Financial assistance is paid in kind or cash or in both depending on the
nature of the income generating activity. Among the SC beneficiaries 82.8
per cent in A.P and 100 per cent in Tamilnadu have received cash.
THADCO has given financial assistance in cash to women self help
groups and other group activities. It has not extended financialassistance to individual beneficiaries till March 2007. However, the
present Government extended financial assistance to individuals. The
data reveal that most of the SCs prefer the assistance in cash to enable to
spend on other activities.
Table-6.7: Mode of Loan Disbursement
S.No. MethodSocial Category & State
SC STAP TN MHR ORS
1 Cash 82.80 100.00 17.50 14.402 Kind 16.40 -- 75.50 83.203 Both 0.80 -- 7.00 2.40
Total 100.00 100.00 100.00 100.00
Among the ST beneficiaries 75.5 per cent in Maharashtra and 83.2 per
cent in Orissa have received assistance in kind. A few beneficiaries
83
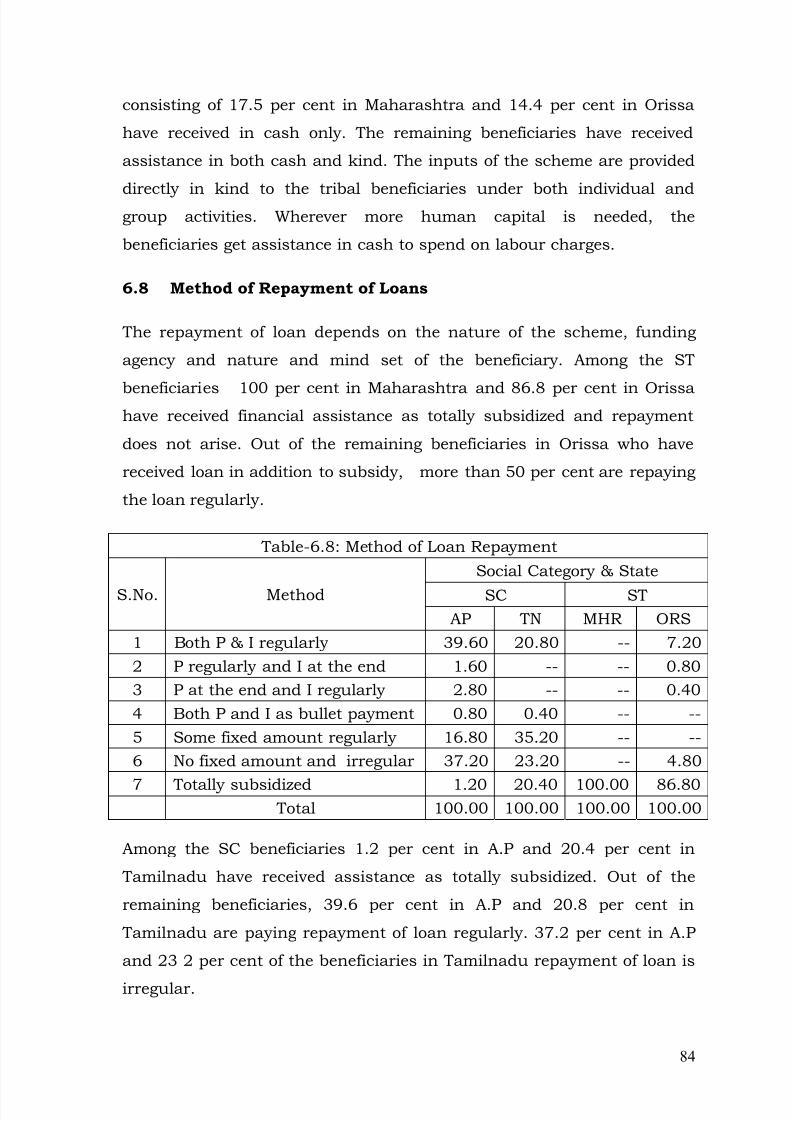
8/12/2019 Ser Sca0707
http://slidepdf.com/reader/full/ser-sca0707 84/137
consisting of 17.5 per cent in Maharashtra and 14.4 per cent in Orissa
have received in cash only. The remaining beneficiaries have received
assistance in both cash and kind. The inputs of the scheme are provided
directly in kind to the tribal beneficiaries under both individual andgroup activities. Wherever more human capital is needed, the
beneficiaries get assistance in cash to spend on labour charges.
6.8 Method of Repayment of Loans
The repayment of loan depends on the nature of the scheme, funding
agency and nature and mind set of the beneficiary. Among the ST
beneficiaries 100 per cent in Maharashtra and 86.8 per cent in Orissahave received financial assistance as totally subsidized and repayment
does not arise. Out of the remaining beneficiaries in Orissa who have
received loan in addition to subsidy, more than 50 per cent are repaying
the loan regularly.
Table-6.8: Method of Loan Repayment
S.No. Method
Social Category & State
SC STAP TN MHR ORS
1 Both P & I regularly 39.60 20.80 -- 7.202 P regularly and I at the end 1.60 -- -- 0.803 P at the end and I regularly 2.80 -- -- 0.404 Both P and I as bullet payment 0.80 0.40 -- --5 Some fixed amount regularly 16.80 35.20 -- --6 No fixed amount and irregular 37.20 23.20 -- 4.80
7 Totally subsidized 1.20 20.40 100.00 86.80 Total 100.00 100.00 100.00 100.00
Among the SC beneficiaries 1.2 per cent in A.P and 20.4 per cent in
Tamilnadu have received assistance as totally subsidized. Out of the
remaining beneficiaries, 39.6 per cent in A.P and 20.8 per cent in
Tamilnadu are paying repayment of loan regularly. 37.2 per cent in A.P
and 23 2 per cent of the beneficiaries in Tamilnadu repayment of loan is
irregular.
84
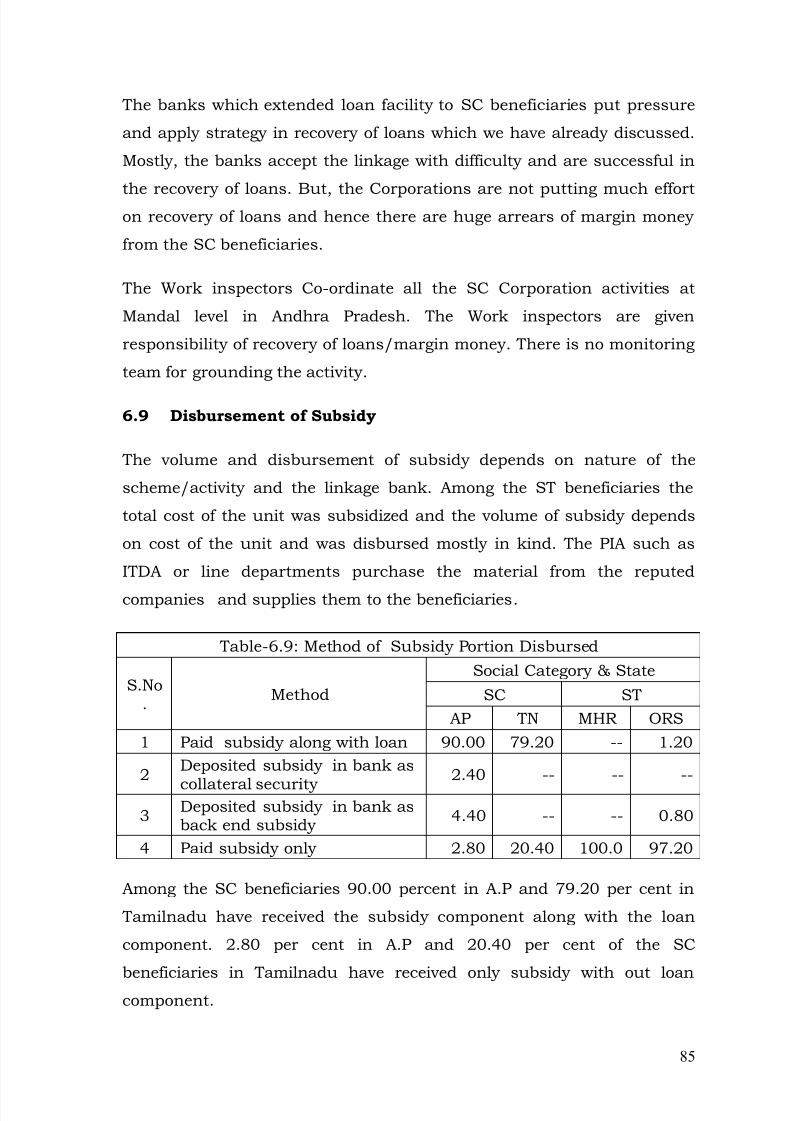
8/12/2019 Ser Sca0707
http://slidepdf.com/reader/full/ser-sca0707 85/137
The banks which extended loan facility to SC beneficiaries put pressure
and apply strategy in recovery of loans which we have already discussed.
Mostly, the banks accept the linkage with difficulty and are successful in
the recovery of loans. But, the Corporations are not putting much efforton recovery of loans and hence there are huge arrears of margin money
from the SC beneficiaries.
The Work inspectors Co-ordinate all the SC Corporation activities at
Mandal level in Andhra Pradesh. The Work inspectors are given
responsibility of recovery of loans/margin money. There is no monitoring
team for grounding the activity.
6.9 Disbursement of Subsidy
The volume and disbursement of subsidy depends on nature of the
scheme/activity and the linkage bank. Among the ST beneficiaries the
total cost of the unit was subsidized and the volume of subsidy depends
on cost of the unit and was disbursed mostly in kind. The PIA such as
ITDA or line departments purchase the material from the reputed
companies and supplies them to the beneficiaries.
Table-6.9: Method of Subsidy Portion Disbursed
S.No. Method
Social Category & State
SC STAP TN MHR ORS
1 Paid subsidy along with loan 90.00 79.20 -- 1.20
2 Deposited subsidy in bank as
collateral security2.40 -- -- --
3 Deposited subsidy in bank asback end subsidy 4.40 -- -- 0.80
4 Paid subsidy only 2.80 20.40 100.0 97.20
Among the SC beneficiaries 90.00 percent in A.P and 79.20 per cent in
Tamilnadu have received the subsidy component along with the loan
component. 2.80 per cent in A.P and 20.40 per cent of the SC
beneficiaries in Tamilnadu have received only subsidy with out loan
component.
85
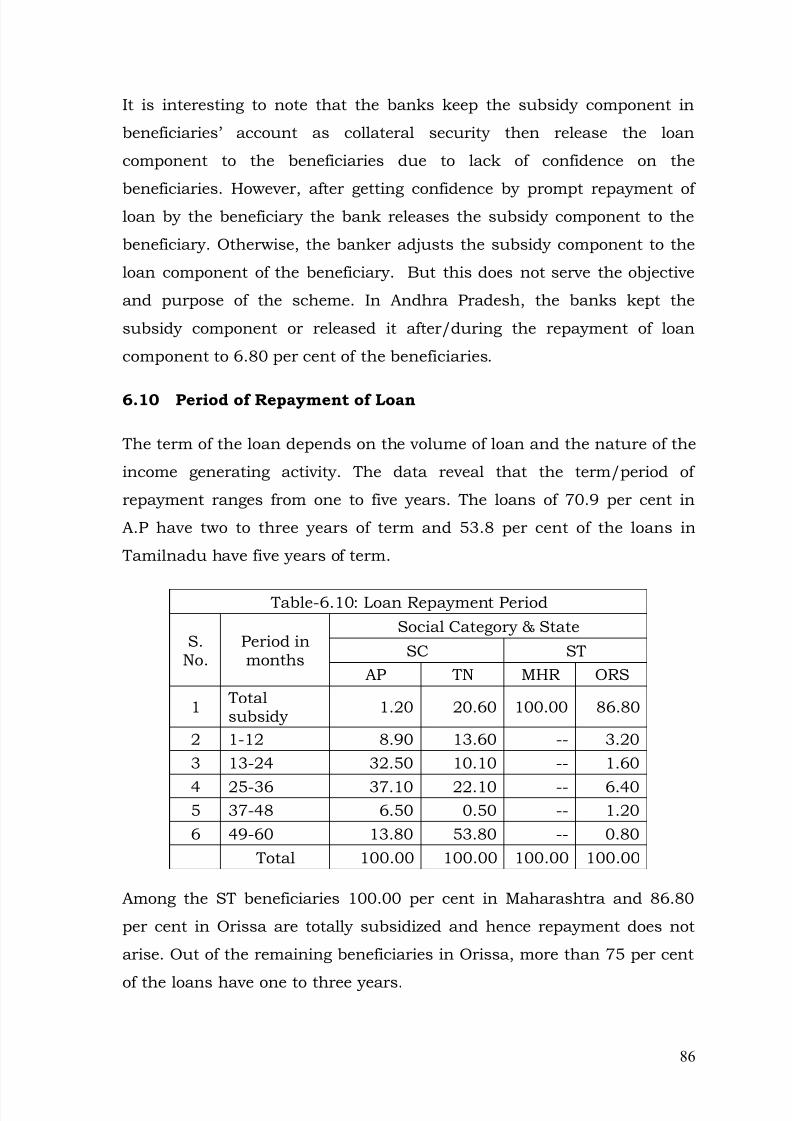
8/12/2019 Ser Sca0707
http://slidepdf.com/reader/full/ser-sca0707 86/137
It is interesting to note that the banks keep the subsidy component in
beneficiaries’ account as collateral security then release the loan
component to the beneficiaries due to lack of confidence on the
beneficiaries. However, after getting confidence by prompt repayment ofloan by the beneficiary the bank releases the subsidy component to the
beneficiary. Otherwise, the banker adjusts the subsidy component to the
loan component of the beneficiary. But this does not serve the objective
and purpose of the scheme. In Andhra Pradesh, the banks kept the
subsidy component or released it after/during the repayment of loan
component to 6.80 per cent of the beneficiaries.
6.10 Period of Repayment of Loan
The term of the loan depends on the volume of loan and the nature of the
income generating activity. The data reveal that the term/period of
repayment ranges from one to five years. The loans of 70.9 per cent in
A.P have two to three years of term and 53.8 per cent of the loans in
Tamilnadu have five years of term.
Table-6.10: Loan Repayment Period
S.No.
Period inmonths
Social Category & State
SC STAP TN MHR ORS
1 Totalsubsidy 1.20 20.60 100.00 86.80
2 1-12 8.90 13.60 -- 3.203 13-24 32.50 10.10 -- 1.60
4 25-36 37.10 22.10 -- 6.405 37-48 6.50 0.50 -- 1.206 49-60 13.80 53.80 -- 0.80
Total 100.00 100.00 100.00 100.00
Among the ST beneficiaries 100.00 per cent in Maharashtra and 86.80
per cent in Orissa are totally subsidized and hence repayment does not
arise. Out of the remaining beneficiaries in Orissa, more than 75 per cent
of the loans have one to three years.
86
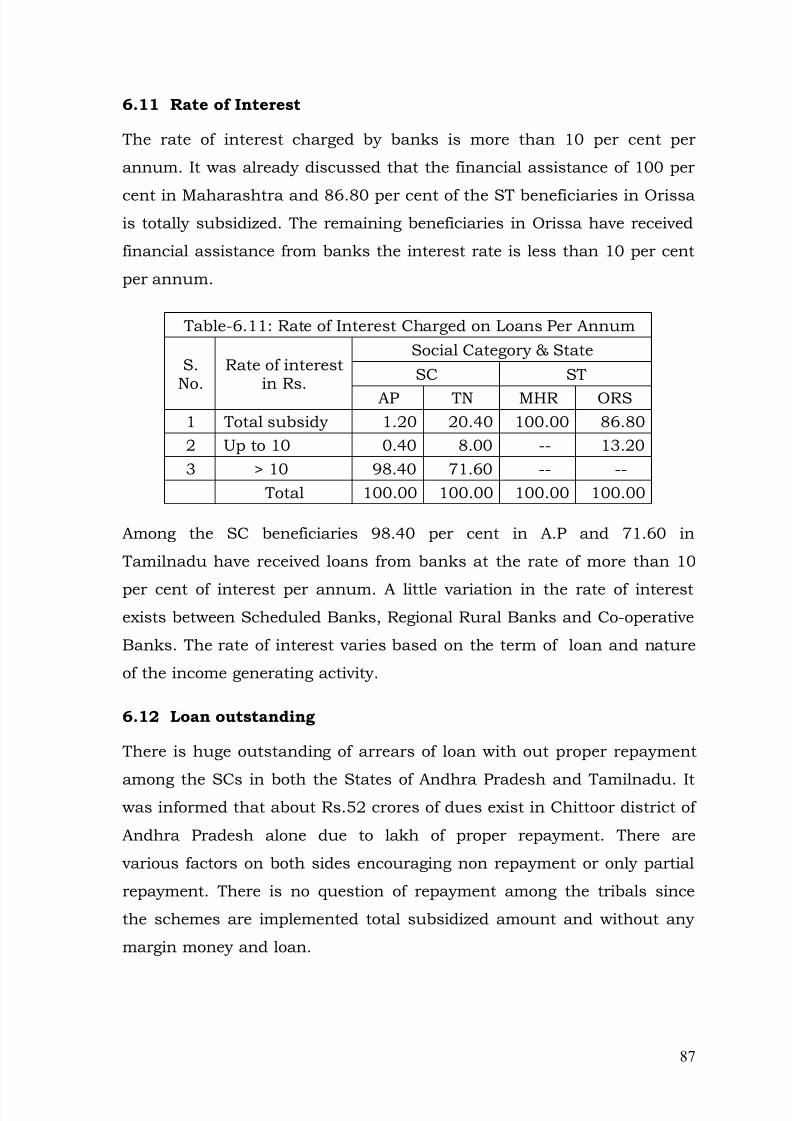
8/12/2019 Ser Sca0707
http://slidepdf.com/reader/full/ser-sca0707 87/137
6.11 Rate of Interest
The rate of interest charged by banks is more than 10 per cent per
annum. It was already discussed that the financial assistance of 100 per
cent in Maharashtra and 86.80 per cent of the ST beneficiaries in Orissais totally subsidized. The remaining beneficiaries in Orissa have received
financial assistance from banks the interest rate is less than 10 per cent
per annum.
Table-6.11: Rate of Interest Charged on Loans Per Annum
S.No.
Rate of interestin Rs.
Social Category & State
SC ST
AP TN MHR ORS1 Total subsidy 1.20 20.40 100.00 86.802 Up to 10 0.40 8.00 -- 13.203 > 10 98.40 71.60 -- --
Total 100.00 100.00 100.00 100.00
Among the SC beneficiaries 98.40 per cent in A.P and 71.60 in
Tamilnadu have received loans from banks at the rate of more than 10
per cent of interest per annum. A little variation in the rate of interestexists between Scheduled Banks, Regional Rural Banks and Co-operative
Banks. The rate of interest varies based on the term of loan and nature
of the income generating activity.
6.12 Loan outstanding
There is huge outstanding of arrears of loan with out proper repayment
among the SCs in both the States of Andhra Pradesh and Tamilnadu. Itwas informed that about Rs.52 crores of dues exist in Chittoor district of
Andhra Pradesh alone due to lakh of proper repayment. There are
various factors on both sides encouraging non repayment or only partial
repayment. There is no question of repayment among the tribals since
the schemes are implemented total subsidized amount and without any
margin money and loan.
87
8/12/2019 Ser Sca0707
http://slidepdf.com/reader/full/ser-sca0707 88/137
6.13 Defaulting
There are large numbers of defaulters among the SCs in both the States.
The system of lending always encourages defaulters. The beneficiaries are
not repaying any loan and margin money due to the waiving of loans bythe Government and the consequent mind set not to repay any Govt.
loans. The political leaders and some of the officials at grass root level
encourage the beneficiaries not to repay the loan amount. The Co-
operative banks are also suffering from huge arrears of loans due to non
repayment of loans properly. Similar tendency exists among the SCs also.
However, the recovery is better from the self help groups.
Among the beneficiaries those who have utilized the financial assistance
properly and started income generation activities can repay the loan and
margin money easily. But they want to imitate the defaulters in
repayment of loan amount. Though they have resources, they develop a
mind set not to repay the loans. Even the local leaders and middlemen
also encourage the beneficiaries not to repay the loans and margin
money. The banks issue loans very cautiously depending on repaying
capacity of the beneficiary and confidence of the banker. But, the other
financial institutions like Co-operative banks and Finance Corporations
do not bother about recovery and extend loans to any body on whom they
have interest.
6.14 Policy Change
With this background and grass root level realities, the Policy may be
changed to delete the subsidy and margin money components to reduce
the establishment costs and corruption. Further, the banks may be
encouraged to provide loans at subsidized rate of interest ie., less than 4
per cent instead of 10 percent and suitable infrastructure may be
provided to the banks.
88
8/12/2019 Ser Sca0707
http://slidepdf.com/reader/full/ser-sca0707 89/137
CHAPTER-7: IMPACT
Most of the beneficiaries among the SCs and STs have improved their
standard of living and economic conditions since they put interest on
their activities. However, the genuine families under BPL are not much
interested in availing these loans because they are not aware of the
Schemes and their inability to repay the loans properly. Only very few
people are aware that the Corporation extends financial assistance to
BPL families to start various income generating schemes.
7.1 People’s Participation and Response
Most of the beneficiaries are not aware of various components of the
financial assistance i.e., subsidy, beneficiary’s contribution, margin
money and bank loan. While taking the loans the beneficiaries are much
interested, but at the time of repayment of loans they even do not know
that in how many installments they have to repay the loans.
Some of the beneficiaries who have taken the loans are not utilizing it
properly. They are not aware how to utilize the loam amount and the
mechanism of proper repayment. 67.85 per cent of the beneficiaries
have utilized the loan amount for the proposed activities and the
remaining beneficiaries have utilized the amount for household and other
consumption and unproductive purposes. It is interesting to note that
77.45 per cent among the ST beneficiaries and 58.25 of the SC
beneficiaries have responded properly and grounded the schemes. 58.60
percent of the beneficiaries who have received the loans in ISB sector
have not utilized the loans properly. Wherever the skills are needed, the
SC Corporation provides training inputs to the beneficiaries.
89
8/12/2019 Ser Sca0707
http://slidepdf.com/reader/full/ser-sca0707 90/137
7.2 SELF HELP GROUPS
There are few members who have better loan absorption capacity and
loan repayment track record following the lending norm of ‘equal
distribution’ and ‘need based loans to all members’. Majority of thesample SHG members are middle aged, married, illiterate, landless whose
primary occupations are agriculture, labour, and traditional occupations.
The data reveal that the ratio of cumulative savings and the average loan
per member is computed as 1: 5.23.
The average volume of current loan is reasonably good, to take up any
activity proposed by the SHG members. Though all the SHG members get
access the credit from external funds, significant number of times
interestingly a substantial number of SHG members have not accessed
from the internal funds not even once. Despite the above fact, most of the
members, who proposed loan for some kind of income generating activity
and asset creation, a portion of loan was used for consumption, general
house-hold maintenance like health, education, life cycle rituals and
purchase of food materials. Majority of these members also invested
lion’s share of their borrowings on households’ lineal activities rather
than lateral or new activities due to acquainted conversant skills that
they possess and to avoid risk by taking to newer kind of activities.
By and large, there is less to moderate impact at household level and
more impact at SHG level in their social and well-being category. The
increase in average monthly income is to the tune of less than 5% of their
loan amount. Few SHG members have learnt to save and deposit theirsavings in banks, post offices, chit funds and so on. There is a moderate
increase on food expenditure of majority SHG members. Majority of SHG
members have purchased or created assets, either directly with the loan
or from the earnings out of the economic activity taken up. Majority of
the SHG members have purchased household articles and ornaments
which is less in its worth. There is some impact on the improvement of
children’s education, household members’ health and repayment of old
90
8/12/2019 Ser Sca0707
http://slidepdf.com/reader/full/ser-sca0707 91/137
debts (private loans). At the SHG level the impact is more compared to
household level. Most of the members get access to large credit through
formal financial institutions such as banks and SHG federations.
7.3 Andhra Pradesh
The Work Inspectors (WIs) of SC Corporation are responsible in each
Assembly Constituency in A.P to recover the margin money paid to
various beneficiaries for various schemes. Thus 14 WIs are working in
Chittoor district of A.P. An FGD was conducted among the work
inspectors to understand the impact and process of recovery among the
beneficiaries. The FGD reveals that only 10 to 15 per cent in urban and
semi urban areas and 25 to 30 per cent of the beneficiaries are genuine.
The remaining beneficiaries are not genuine and recommended by the
local leaders. The recovery from these beneficiaries is very difficult since
there are no effective guidelines for recovery. The rate of recovery from
woman self help groups is more than 75 per cent.
They also informed that there are duplication of schemes and some of the
local leaders accessed benefits from different schemes like Rajiv YuvaShakti (RYS), Chief Minister’s Empowerment of Youth (CMEY), Prime
Minister’s Rojgar Yojana (PMRY), Indira Kranti Pathakam (IKP) and SC
Corporation. Some of the local political leaders act as middle men and try
to exploit the beneficiaries by collecting Rs. 2,000/ to 5,000/- as
charges/expenses from each beneficiary. A leader in Ramachandrapuram
mandal of Chittoor district has collected money from more than 250
beneficiaries. He maintains workable relation with the PIAs at grass rootlevel.
They informed that the schemes like horticulture, drip irrigation and
milch cattle are most successful in agriculture sector. In ISB – transport
sector, provision of auto-rickshaws, tractors and other mini carriers are
most successful. It is also informed that 65 to 75 per cent of the banks
are not providing loan component due to lack of confidence on the
beneficiary and lack of interest to get loan among the beneficiaries.
91
8/12/2019 Ser Sca0707
http://slidepdf.com/reader/full/ser-sca0707 92/137
However, they pay subsidy and margin money sanctioned by the SC
Corporation to the beneficiary.
7.4 Tamilnadu
The secondary data indicate that SC beneficiaries of 10.62 lakhs
during the 7 th Plan, 4.7 lakhs during 1990-92 , 15.5 lakhs in 8 th Plan,
19.8 lakhs in 9 th Plan and about 28.7 lakhs in 10 th Plan period were
covered under various schemes and programmes of SCP by the Govt. of
Tamilnadu. In almost every plan period the achievement was more than
their target set by the Government. The schemes covered mostly relate to
education sector (like scholarships, uniforms, text books, schoolbuildings, hostels, bicycles) economic empowerment related activities
(individual loans, subsidies, grants, irrigated lands, house sites and
constructed houses milch animals, irrigation facilities, entrepreneurship
development etc.) skill development/vocational training) Medical
(hospitals/dispensaries), infrastructure development for community like
roads and bridges. This is being done mainly through the
schemes/programmes implemented by TAHDCO.
7.4.1 Impact on target population
Though Scheduled Castes continue to lag behind the general population
in terms of most of the indicators for social and economic development,
the gap between the Scheduled Castes and the general population is
getting reduced, as is evident from some of the indicators given below.
(a) . Increase in literacy
The literacy data available from the decennial Censuses indicate that the
gap between Scheduled Castes and general population in literacy levels
has decreased. During 1991-2001, the literacy among Scheduled Castes
increased by 17.28 percentage points compared to 12.79 percentage
points increase for the total population. The more remarkable increase
92
8/12/2019 Ser Sca0707
http://slidepdf.com/reader/full/ser-sca0707 93/137
has been in female literacy among Scheduled Castes. However, low levels
of female literacy among Scheduled Castes in rural areas in some of the
Districts remains a cause of concern.
(b) . Decrease in Poverty
The poverty ratio among Scheduled Castes has declined during 1993-94
to 1999-2000. However, pace of decline among Scheduled Castes has
been slower than the decline in the overall poverty. More than 1/3 rd of
the SC population, both in rural and urban areas still live in below the
poverty line. The gap between the Scheduled Castes and the total
population in poverty ratio, however, has decreased during 1993-94 to1999-2000.
(c). Occupational Diversification
There have been indications of occupational diversification taking place
among Scheduled Castes. As per the Censes 2001, the dependence of
Scheduled Caste on agriculture has declined from 74.50% in 1991 to
61.24% in 2001. More importantly, the share of agricultural labourersamong Scheduled Castes came down significantly from 49.06% to
39.16% during the same period. The Scheduled Castes are shifting more
and more to urban areas for livelihoods.
The decline in dependence on agriculture was accompanied by an almost
commensurate increase in other workers category, which is
predominantly in service sector.
7.5 Maharashtra
There are various schemes like digging and deepening of wells, provision
of electric and kerosene pump sets, provision of vegetable kits, vermi-
compost, nurseries, milch cattle and irrigation facilities are the major
schemes in agriculture sector. Those who have benefited with irrigation
schemes are cultivating wheat and commercial crops like chana, peas,
black gram, coriander, potato, tomato and other vegetables.
93
8/12/2019 Ser Sca0707
http://slidepdf.com/reader/full/ser-sca0707 94/137
In most of the cases, the units have been grounded and the overall
impact is satisfactory. But some of the schemes under ISB sector like
provision of pop corn machines, brick making, sewing machine,
mushroom cultivation, petty business are not properly grounded and theimpact is not satisfactory.
Supply of computers to ashram shalas and vocational training in ITIs are
satisfactory. The extension of financial assistance to woman self help
groups is very low and it may be encouraged. Housing is also provided
under the scheme particularly to the PTGs in Maharashtra. Maharashtra
Udyojagata Vikas Mahamandal issues certificates to the beneficiaries
who completed training in vocational institutes. A few trained
beneficiaries informed that they have not yet received sewing machines
even after six months.
The Post-basic Ashram Shala in Chikali village of Dharani ITDP has
been converted to Vocational Institute with Rs. 20 lakhs and providing
training in Dress making, Electrical winding and repair, General fitter
cum Mechanic and Driving cum Mechanic from August, 2005. Suchvocational institutes are established in different taluks.
Training in Bee keeping has been provided to 11 beneficiaries in
Samadoh village of Dharani ITDP and provided bee keeping boxes in
2005-06. But, the activity is not yet started due to lack of monitoring and
follow up action. The cost of each unit is Rs. 10,000/-. Milch cattle (two
cows) per unit at the cost of Rs.16 thousands provided to 11 beneficiaries
in Mangia village in 2004-05 are yielding income to the beneficiaries.
There are no monitoring committees in Maharashtra. Some of the
schemes sanctioned in 2004-05 were implemented in 2006-07. With out
completing the scheme how they submit UC to the concerned. Under
minor irrigation/lift irrigation the amount sanctioned for group
beneficiaries is still unspent. It seems the authorities carry forward the
unspent grants to the next year.
94
8/12/2019 Ser Sca0707
http://slidepdf.com/reader/full/ser-sca0707 95/137
7.6 Orissa
The impact of the TSP programmes/schemes undertaken over a period of
time have been assessed through the primary and secondary data
sources. The general scenario of the STs is comparatively very low in
Orissa. A specific enquiry has also been undertaken through primary
and secondary data to get an overview of the prevailing situation, the
success of the programmes, through the beneficiaries and available
secondary information.
In co-ordination with other agencies, monthly reports from the concerned
functionaries are being received by the ITDA. Again the monitoring isdisturbed due to lack of coordination between ITDA and PIA, monitoring
is carried out only on paper. Under supervision and monitoring of
different units/activities are being ensured. But due to lack of education
and awareness some beneficiaries have not maintained their activities. In
some case the agencies after implementing the project did not bother
about the problems in the units.
Participation of female beneficiaries is good. But in group activities, in
some cases, people fight among themselves due to their personal angles
and do not think about their individual responsibilities. As per the nature
of different schemes, the time taken for different schemes varies. In most
of the case the schemes are implemented at right time but in few cases
like irrigation project, the unit takes very long time to complete the
project and this is because of negligence of the agency.
In tribal areas there are many local resources which are perennial and
semi perennial streams, rivers and nallas. Soil type is very good for
cultivation. There are many local and near by weekly markets and no
problem for trading. Most of the tribals improved their standard of living
and economic conditions, since they evinced interest in their activity. But
in some cases due to lack of education, interest and awareness they did
not make use of the help from the developmental agencies.
95
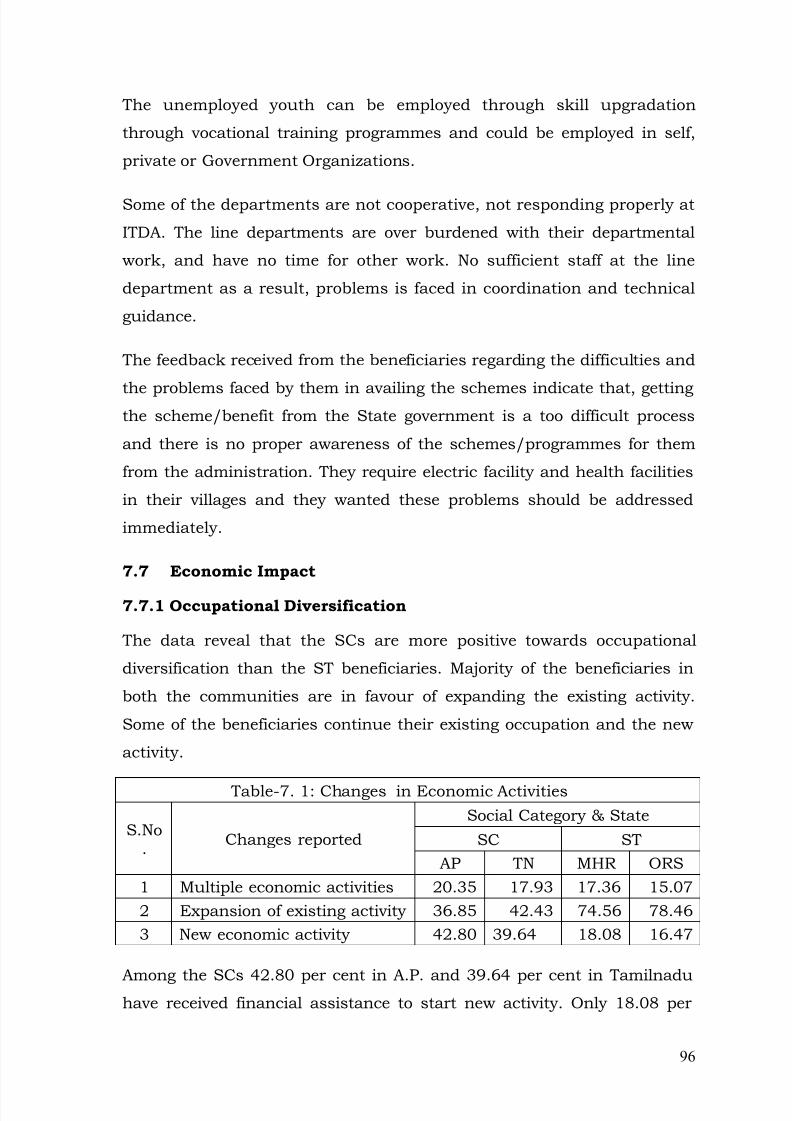
8/12/2019 Ser Sca0707
http://slidepdf.com/reader/full/ser-sca0707 96/137
The unemployed youth can be employed through skill upgradation
through vocational training programmes and could be employed in self,
private or Government Organizations.
Some of the departments are not cooperative, not responding properly at
ITDA. The line departments are over burdened with their departmental
work, and have no time for other work. No sufficient staff at the line
department as a result, problems is faced in coordination and technical
guidance.
The feedback received from the beneficiaries regarding the difficulties and
the problems faced by them in availing the schemes indicate that, gettingthe scheme/benefit from the State government is a too difficult process
and there is no proper awareness of the schemes/programmes for them
from the administration. They require electric facility and health facilities
in their villages and they wanted these problems should be addressed
immediately.
7.7 Economic Impact
7.7.1 Occupational Diversification
The data reveal that the SCs are more positive towards occupational
diversification than the ST beneficiaries. Majority of the beneficiaries in
both the communities are in favour of expanding the existing activity.
Some of the beneficiaries continue their existing occupation and the new
activity.
Table-7. 1: Changes in Economic Activities
S.No. Changes reported
Social Category & State
SC STAP TN MHR ORS
1 Multiple economic activities 20.35 17.93 17.36 15.072 Expansion of existing activity 36.85 42.43 74.56 78.463 New economic activity 42.80 39.64 18.08 16.47
Among the SCs 42.80 per cent in A.P. and 39.64 per cent in Tamilnaduhave received financial assistance to start new activity. Only 18.08 per
96
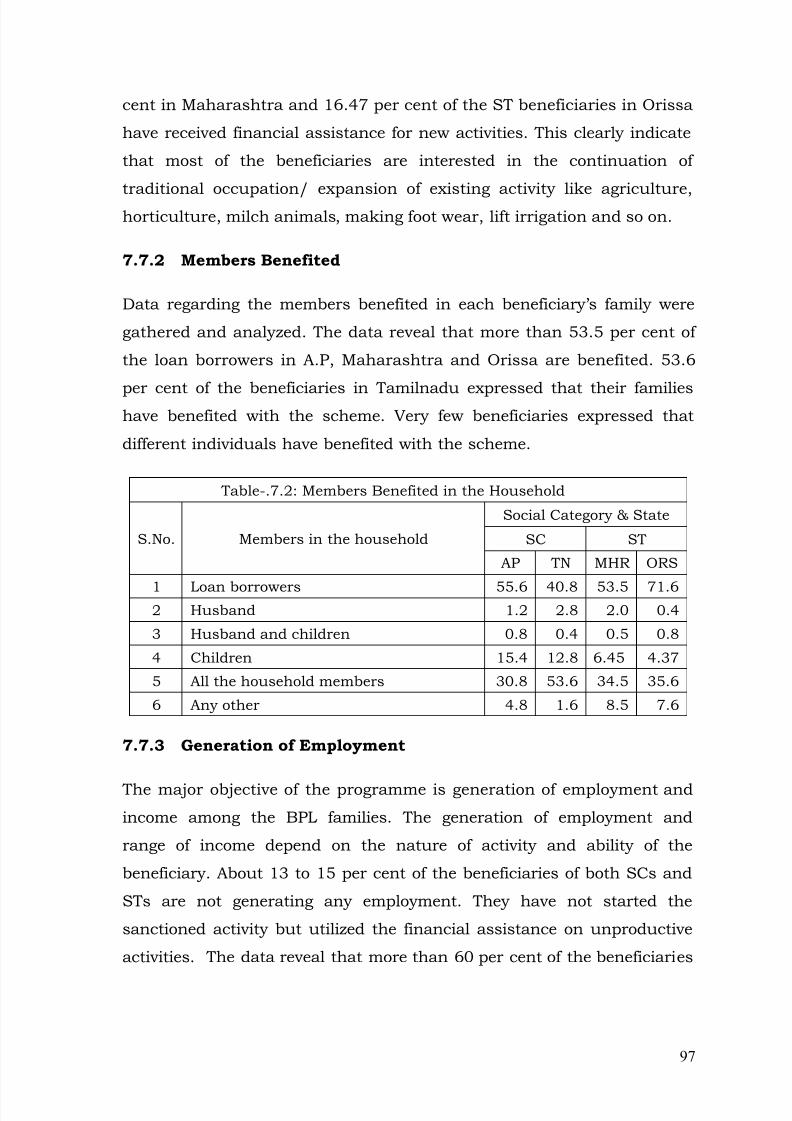
8/12/2019 Ser Sca0707
http://slidepdf.com/reader/full/ser-sca0707 97/137
cent in Maharashtra and 16.47 per cent of the ST beneficiaries in Orissa
have received financial assistance for new activities. This clearly indicate
that most of the beneficiaries are interested in the continuation of
traditional occupation/ expansion of existing activity like agriculture,horticulture, milch animals, making foot wear, lift irrigation and so on.
7.7.2 Members Benefited
Data regarding the members benefited in each beneficiary’s family were
gathered and analyzed. The data reveal that more than 53.5 per cent of
the loan borrowers in A.P, Maharashtra and Orissa are benefited. 53.6
per cent of the beneficiaries in Tamilnadu expressed that their familieshave benefited with the scheme. Very few beneficiaries expressed that
different individuals have benefited with the scheme.
Table-.7.2: Members Benefited in the Household
S.No. Members in the household
Social Category & State
SC ST
AP TN MHR ORS
1 Loan borrowers 55.6 40.8 53.5 71.62 Husband 1.2 2.8 2.0 0.4
3 Husband and children 0.8 0.4 0.5 0.8
4 Children 15.4 12.8 6.45 4.37
5 All the household members 30.8 53.6 34.5 35.6
6 Any other 4.8 1.6 8.5 7.6
7.7.3 Generation of Employment
The major objective of the programme is generation of employment and
income among the BPL families. The generation of employment and
range of income depend on the nature of activity and ability of the
beneficiary. About 13 to 15 per cent of the beneficiaries of both SCs and
STs are not generating any employment. They have not started the
sanctioned activity but utilized the financial assistance on unproductive
activities. The data reveal that more than 60 per cent of the beneficiaries
97
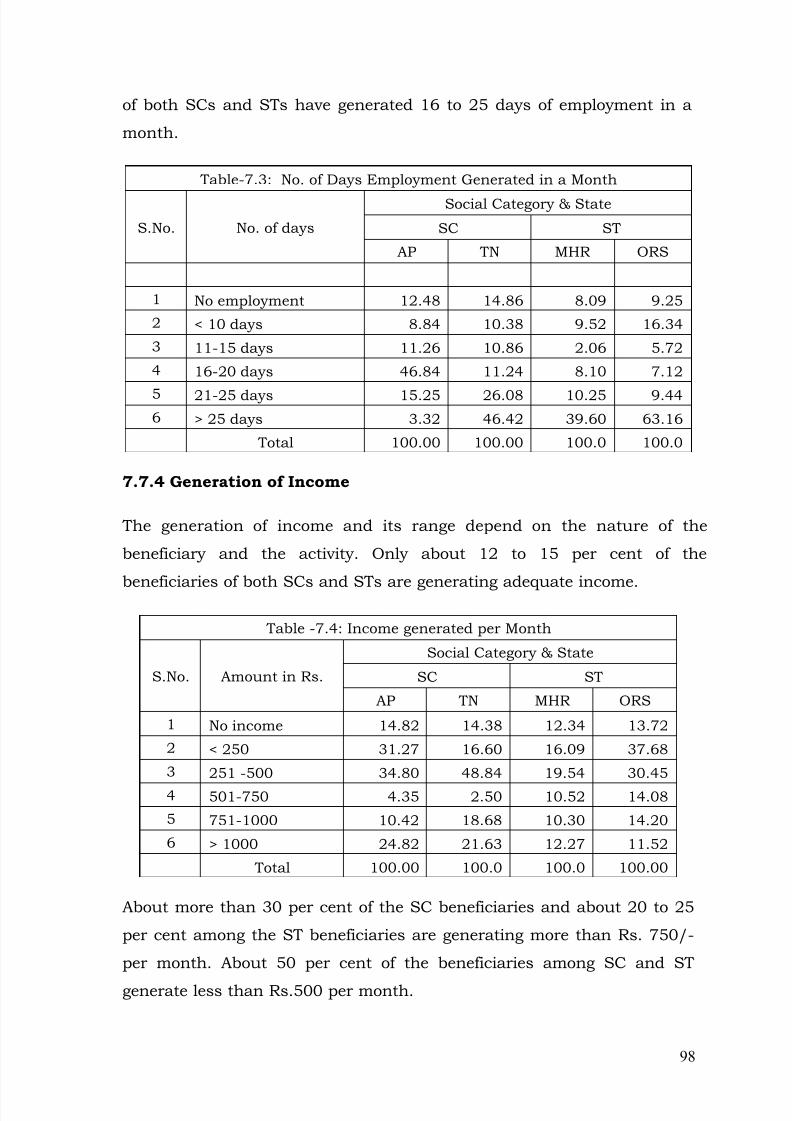
8/12/2019 Ser Sca0707
http://slidepdf.com/reader/full/ser-sca0707 98/137
of both SCs and STs have generated 16 to 25 days of employment in a
month.
Table-7.3: No. of Days Employment Generated in a Month
S.No. No. of days
Social Category & State
SC ST
AP TN MHR ORS
1 No employment 12.48 14.86 8.09 9.25
2 < 10 days 8.84 10.38 9.52 16.34
3 11-15 days 11.26 10.86 2.06 5.72
4 16-20 days 46.84 11.24 8.10 7.12
5 21-25 days 15.25 26.08 10.25 9.446 > 25 days 3.32 46.42 39.60 63.16
Total 100.00 100.00 100.0 100.0
7.7.4 Generation of Income
The generation of income and its range depend on the nature of the
beneficiary and the activity. Only about 12 to 15 per cent of the
beneficiaries of both SCs and STs are generating adequate income.
Table -7.4: Income generated per Month
S.No. Amount in Rs.
Social Category & State
SC ST
AP TN MHR ORS
1 No income 14.82 14.38 12.34 13.72
2 < 250 31.27 16.60 16.09 37.68
3 251 -500 34.80 48.84 19.54 30.45
4 501-750 4.35 2.50 10.52 14.08
5 751-1000 10.42 18.68 10.30 14.20
6 > 1000 24.82 21.63 12.27 11.52
Total 100.00 100.0 100.0 100.00
About more than 30 per cent of the SC beneficiaries and about 20 to 25
per cent among the ST beneficiaries are generating more than Rs. 750/-
per month. About 50 per cent of the beneficiaries among SC and ST
generate less than Rs.500 per month.
98
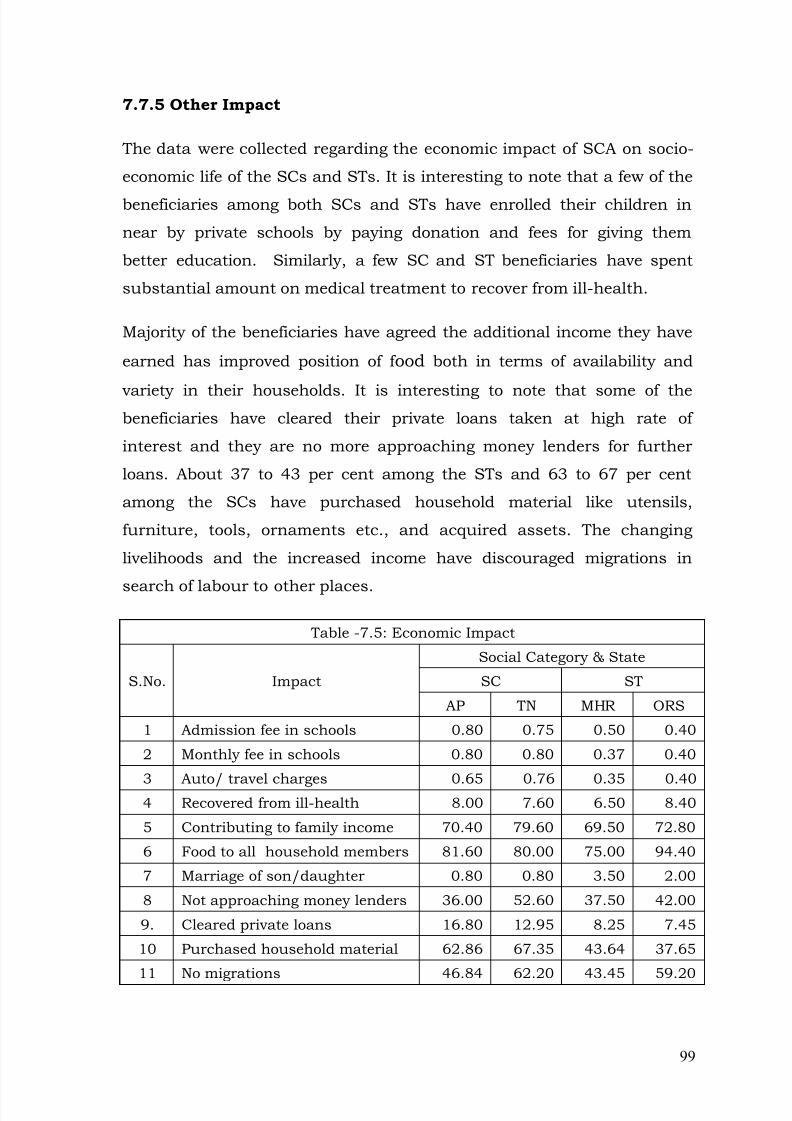
8/12/2019 Ser Sca0707
http://slidepdf.com/reader/full/ser-sca0707 99/137
7.7.5 Other Impact
The data were collected regarding the economic impact of SCA on socio-
economic life of the SCs and STs. It is interesting to note that a few of the
beneficiaries among both SCs and STs have enrolled their children in
near by private schools by paying donation and fees for giving them
better education. Similarly, a few SC and ST beneficiaries have spent
substantial amount on medical treatment to recover from ill-health.
Majority of the beneficiaries have agreed the additional income they have
earned has improved position of f ood both in terms of availability and
variety in their households. It is interesting to note that some of thebeneficiaries have cleared their private loans taken at high rate of
interest and they are no more approaching money lenders for further
loans. About 37 to 43 per cent among the STs and 63 to 67 per cent
among the SCs have purchased household material like utensils,
furniture, tools, ornaments etc., and acquired assets. The changing
livelihoods and the increased income have discouraged migrations in
search of labour to other places.
Table -7.5: Economic Impact
S.No. Impact
Social Category & State
SC ST
AP TN MHR ORS
1 Admission fee in schools 0.80 0.75 0.50 0.40
2 Monthly fee in schools 0.80 0.80 0.37 0.40
3 Auto/ travel charges 0.65 0.76 0.35 0.404 Recovered from ill-health 8.00 7.60 6.50 8.40
5 Contributing to family income 70.40 79.60 69.50 72.80
6 Food to all household members 81.60 80.00 75.00 94.40
7 Marriage of son/daughter 0.80 0.80 3.50 2.00
8 Not approaching money lenders 36.00 52.60 37.50 42.00
9. Cleared private loans 16.80 12.95 8.25 7.45
10 Purchased household material 62.86 67.35 43.64 37.65
11 No migrations 46.84 62.20 43.45 59.20
99
8/12/2019 Ser Sca0707
http://slidepdf.com/reader/full/ser-sca0707 100/137
7.8 Development of Assets
Multiple answers on development of assets were received from the
beneficiaries. Development of assets is the major impact of SCA
programme. Various assets acquired by the beneficiaries include live
stock, savings, and vehicles, items of recreation, housing, ornaments,
gadgets, occupational tools, and land and agriculture inputs. The live
stock consists of cows, sheep, goats and poultry. It is interesting to note
that 34.8 per cent of the SC beneficiaries in Tamilnadu and 16.00 per
cent of the ST beneficiaries in Maharashtra have acquired cows as milch
cattle. Giriraja chicks, sheep and goat units are provided to some of the
beneficiaries.
The vehicles acquired by the beneficiaries include Cycles, Motor bikes,
auto rickshaws, taxis and other mini carrier vehicles. Mostly, cycles and
motor bikes are provided to milk and vegetable vendors. ST beneficiaries
have not preferred to have auto rickshaws, taxis and other mini carrier
vehicles due to lack of skills in their operation. The concerned PIAs
should encourage the tribals in operating such vehicles for incomegeneration.
It is interesting to note that 18.96 per cent of the SC beneficiaries in A.P
and 79.6 per cent in Tamilnadu are aware of the importance of savings
and deposited their earnings in banks and post offices. Only 5.5 per cent
of the ST beneficiaries in Maharashtra and 16.4 per cent in Orissa
deposited their savings in banks, post offices and with relative and
friends. Out of the earnings, 6.4 per cent of SC beneficiaries in A.P and
14.8 per cent in Tamilnadu have purchased radio/tape recorder or
television for their recreation.
Only 2.5 per cent of the ST beneficiaries in Maharashtra and 4.4 per cent
in Orissa have purchased radio/tape recorder or television. Some of the
beneficiaries constituting 1.2 and 9.6 per cent in A.P and Tamilnadu and
8.0 and 3.6 per cent in Maharashtra and Orissa respectively havepurchased gold and silver ornaments. Similarly, a good number of SC
100
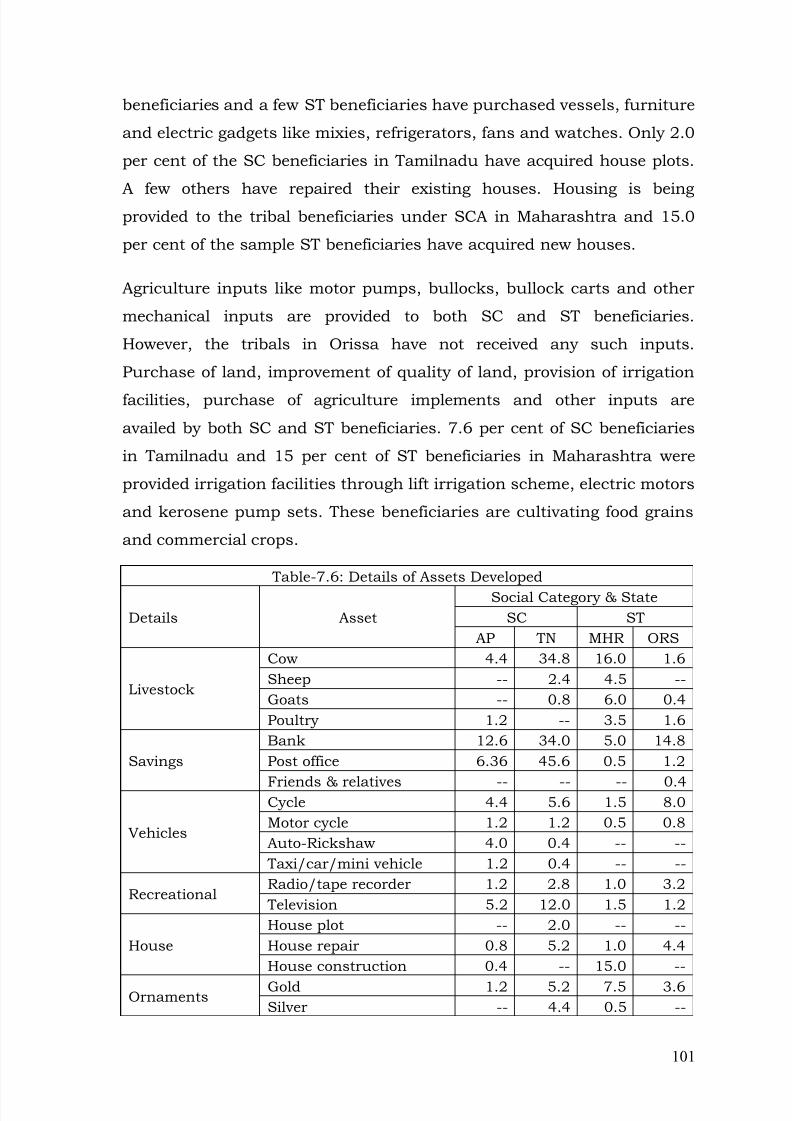
8/12/2019 Ser Sca0707
http://slidepdf.com/reader/full/ser-sca0707 101/137
beneficiaries and a few ST beneficiaries have purchased vessels, furniture
and electric gadgets like mixies, refrigerators, fans and watches. Only 2.0
per cent of the SC beneficiaries in Tamilnadu have acquired house plots.
A few others have repaired their existing houses. Housing is beingprovided to the tribal beneficiaries under SCA in Maharashtra and 15.0
per cent of the sample ST beneficiaries have acquired new houses.
Agriculture inputs like motor pumps, bullocks, bullock carts and other
mechanical inputs are provided to both SC and ST beneficiaries.
However, the tribals in Orissa have not received any such inputs.
Purchase of land, improvement of quality of land, provision of irrigation
facilities, purchase of agriculture implements and other inputs are
availed by both SC and ST beneficiaries. 7.6 per cent of SC beneficiaries
in Tamilnadu and 15 per cent of ST beneficiaries in Maharashtra were
provided irrigation facilities through lift irrigation scheme, electric motors
and kerosene pump sets. These beneficiaries are cultivating food grains
and commercial crops.
Table-7.6: Details of Assets Developed
Details AssetSocial Category & State
SC STAP TN MHR ORS
Livestock
Cow 4.4 34.8 16.0 1.6Sheep -- 2.4 4.5 --Goats -- 0.8 6.0 0.4Poultry 1.2 -- 3.5 1.6
SavingsBank 12.6 34.0 5.0 14.8Post office 6.36 45.6 0.5 1.2
Friends & relatives -- -- -- 0.4
Vehicles
Cycle 4.4 5.6 1.5 8.0Motor cycle 1.2 1.2 0.5 0.8Auto-Rickshaw 4.0 0.4 -- --
Taxi/car/mini vehicle 1.2 0.4 -- --
RecreationalRadio/tape recorder 1.2 2.8 1.0 3.2
Television 5.2 12.0 1.5 1.2
HouseHouse plot -- 2.0 -- --House repair 0.8 5.2 1.0 4.4House construction 0.4 -- 15.0 --
OrnamentsGold 1.2 5.2 7.5 3.6Silver -- 4.4 0.5 --
101
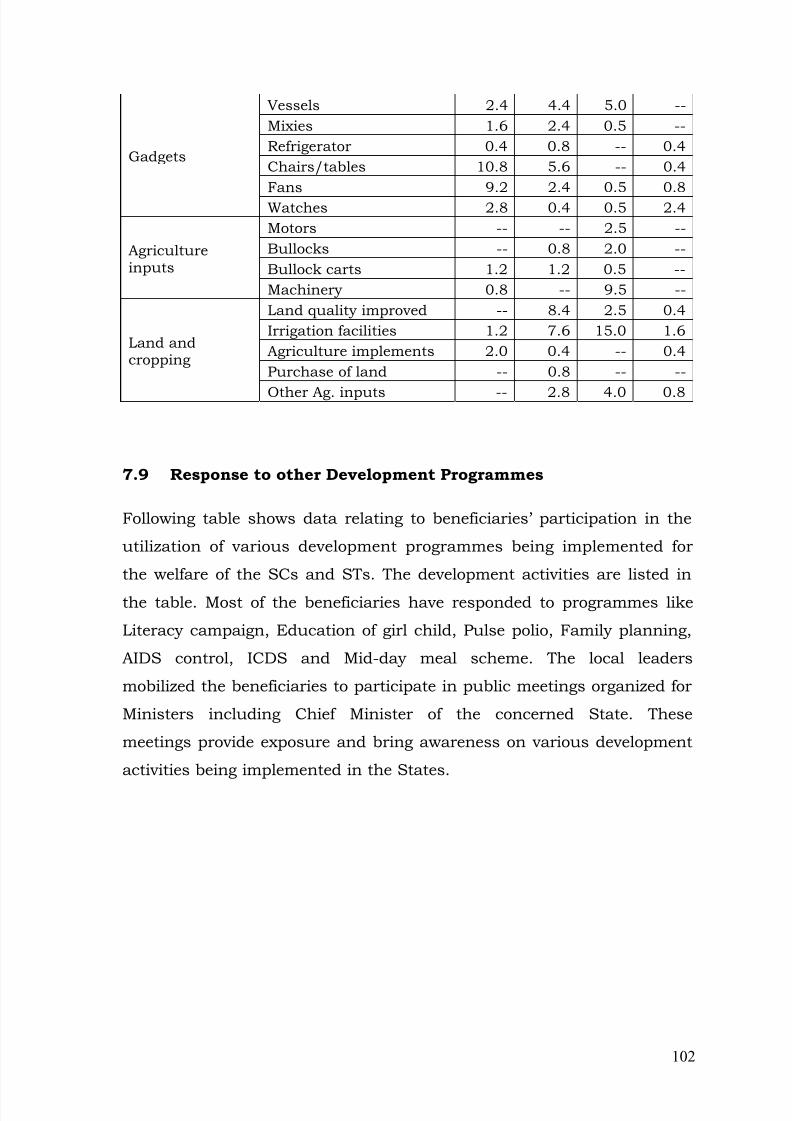
8/12/2019 Ser Sca0707
http://slidepdf.com/reader/full/ser-sca0707 102/137
Gadgets
Vessels 2.4 4.4 5.0 --Mixies 1.6 2.4 0.5 --Refrigerator 0.4 0.8 -- 0.4Chairs/tables 10.8 5.6 -- 0.4Fans 9.2 2.4 0.5 0.8Watches 2.8 0.4 0.5 2.4
Agricultureinputs
Motors -- -- 2.5 --Bullocks -- 0.8 2.0 --Bullock carts 1.2 1.2 0.5 --Machinery 0.8 -- 9.5 --
Land andcropping
Land quality improved -- 8.4 2.5 0.4Irrigation facilities 1.2 7.6 15.0 1.6Agriculture implements 2.0 0.4 -- 0.4Purchase of land -- 0.8 -- --
Other Ag. inputs -- 2.8 4.0 0.8
7.9 Response to other Development Programmes
Following table shows data relating to beneficiaries’ participation in the
utilization of various development programmes being implemented for
the welfare of the SCs and STs. The development activities are listed in
the table. Most of the beneficiaries have responded to programmes like
Literacy campaign, Education of girl child, Pulse polio, Family planning,
AIDS control, ICDS and Mid-day meal scheme. The local leaders
mobilized the beneficiaries to participate in public meetings organized for
Ministers including Chief Minister of the concerned State. These
meetings provide exposure and bring awareness on various development
activities being implemented in the States.
102
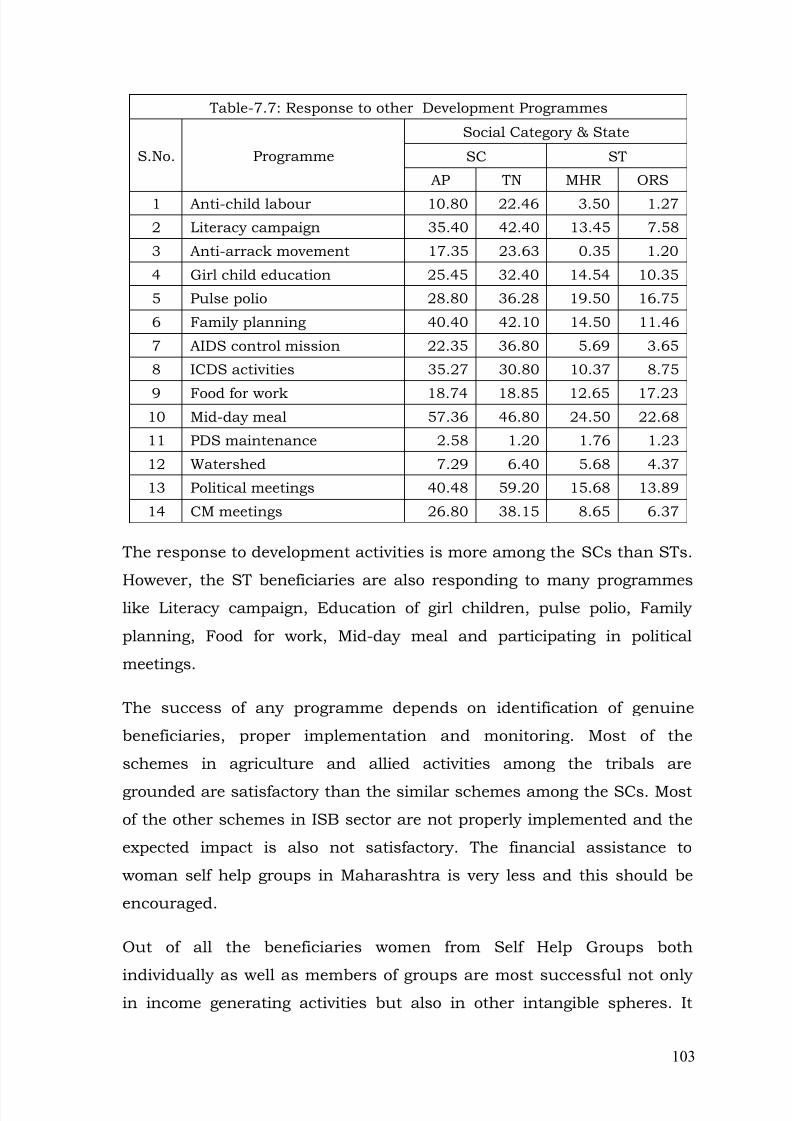
8/12/2019 Ser Sca0707
http://slidepdf.com/reader/full/ser-sca0707 103/137
Table-7.7: Response to other Development Programmes
S.No. Programme
Social Category & State
SC ST
AP TN MHR ORS
1 Anti-child labour 10.80 22.46 3.50 1.27
2 Literacy campaign 35.40 42.40 13.45 7.58
3 Anti-arrack movement 17.35 23.63 0.35 1.20
4 Girl child education 25.45 32.40 14.54 10.35
5 Pulse polio 28.80 36.28 19.50 16.75
6 Family planning 40.40 42.10 14.50 11.46
7 AIDS control mission 22.35 36.80 5.69 3.65
8 ICDS activities 35.27 30.80 10.37 8.75
9 Food for work 18.74 18.85 12.65 17.2310 Mid-day meal 57.36 46.80 24.50 22.68
11 PDS maintenance 2.58 1.20 1.76 1.23
12 Watershed 7.29 6.40 5.68 4.37
13 Political meetings 40.48 59.20 15.68 13.89
14 CM meetings 26.80 38.15 8.65 6.37
The response to development activities is more among the SCs than STs.
However, the ST beneficiaries are also responding to many programmes
like Literacy campaign, Education of girl children, pulse polio, Family
planning, Food for work, Mid-day meal and participating in political
meetings.
The success of any programme depends on identification of genuine
beneficiaries, proper implementation and monitoring. Most of the
schemes in agriculture and allied activities among the tribals are
grounded are satisfactory than the similar schemes among the SCs. Most
of the other schemes in ISB sector are not properly implemented and the
expected impact is also not satisfactory. The financial assistance to
woman self help groups in Maharashtra is very less and this should be
encouraged.
Out of all the beneficiaries women from Self Help Groups both
individually as well as members of groups are most successful not onlyin income generating activities but also in other intangible spheres. It
103
8/12/2019 Ser Sca0707
http://slidepdf.com/reader/full/ser-sca0707 104/137
may be said the economic assistance given to them and leadership
training programmes for their benefit have empowered them in various
ways . For example they have now a role to play in decision making in
their families as well as in their communities they are now adopt inundertaking Bank and Post Office transactions and also meeting the
officials not only seeking their help but also questioning them. They also
have a say in their children’s education more particularly with their girl
children.
104
8/12/2019 Ser Sca0707
http://slidepdf.com/reader/full/ser-sca0707 105/137
CHAPTER-8: ISSUES AND CONCERNS
There are several issues and concerns with regard to policy and
implementation of SCA programmes among the SCs and STs. Based on
the data and observations made during field work, the following issues
and concerns are discussed.
8.1 Awareness
At present the means of bringing awareness above the SCA and other
programmes consist of print media and personal messages. Only
literates, local leaders and political activists at different levels are aware
of the schemes and programmes being implemented for the development
of SCs and STs. Most of the genuine BPL populations are not aware of
these programmes.
Electronic media may be used to bring awareness to reach theprogramme to the eligible BPL persons. The role of Kalajathas should be
strengthened in bringing awareness in tribal areas. The local Sarpanch
and the revenue officials at village level may be kept made responsible in
bringing awareness among the eligible BPL persons.
8.2 Identification of Beneficiaries
The process of identification of beneficiaries is not being done as per the
prescribed procedures by conducting Gram Sabha at village level. But,
the PIAs show that they have identified the beneficiaries as per the
procedure and by conducting Gram Sabha. The local political
leaders/activists who visit the offices at Mandal/Block and District levels
play major role and manage things in their favour in selection of the
beneficiaries. These local leaders managed to avail the schemes for
themselves and for their relatives, friends and followers. The random field
level observation reveals that more than 65 percent of the beneficiaries
105
8/12/2019 Ser Sca0707
http://slidepdf.com/reader/full/ser-sca0707 106/137
own material like television, motorcycle, telephone, refrigerator etc. A few
of the beneficiaries who are influential at local level have availed more
than two schemes.
The BPL survey is not genuine and the local leaders manage to include
their names in BPL list to exploit various benefits being extended by the
Government. Besides, the officials are also not interested in the reduction
of BPL figures and try to show large BPL figures to get maximum
budgetary provisions in order to get their own benefits out of them. The
data collected through FGD reveal that among the beneficiaries only
about 10 per cent in urban and 30 per cent in rural areas are genuine
and belong to BPL category.
8.3 Identification of Schemes
The identification of schemes should be based on the locally available
resources including raw material and marketing, personal interest and
skills, availability of training inputs and confidence of the banker. The
field observation reveals that more than 40 per cent of the schemes were
just initiated or even not initiated and discontinued due to variousfactors. The concerned officials are not showing much interest in
choosing a right scheme to a right person. There is no follow up action by
the PIA after initiating the scheme by the beneficiary.
8.4 Infrastructural Facilities
The ITDAs are spending more than 30 per cent of the grant towards
provision of infrastructural facilities with their own technical staff intribal areas. Most of the amount was spent on laying of village roads and
construction of school buildings, ITIs, vocational training centers,
culverts and check dams. The field observation reveals that in some
cases the amount spent on works is more than they actually require.
The SC welfare department is transferring the grant meant for
infrastructural facilities to the construction of SC welfare hostels in A.P.
10 per cent of the total grant received under SCA is to be spent on
106
8/12/2019 Ser Sca0707
http://slidepdf.com/reader/full/ser-sca0707 107/137
infrastructure facilities. This 10% of the SCA is spent on repairs and
small construction works of Social Welfare hostel buildings.
Similarly, 10% of SCA fund allotted to Tamilnadu is spent towards
special construction works through TAHDCO as infrastructure activities
depending on the request of public. They spent on hostels for both girls
and boys in all categories like schools, colleges and PG students.
8.5 Income Generation
All the Schemes are meant for the generation of income to uplift the SC
families from BPL to APL. There is no doubt that wherever the
beneficiaries have utilized the grant properly, it generated income fortheir families. Where ever the beneficiaries have not utilized the grant
properly, there is no income generation and they are also not repaying
the loan/margin money.
8.6 Employment Generation
In addition to generation of income, the schemes creates assets and
generates employment. The ISB sector and Self Employment Schemes(NSFDC) create assets and employment generation. These schemes are
useful to youth and others who are educated and unemployed.
8.7 Constraints in Implementation of the Schemes
Major constraints in the implementation of the schemes are lack of
awareness, illiteracy, people’s attitude towards the programme,
involvement of local leaders and political activists, lack of identification of
genuine beneficiaries, lack of proper co-ordination among the line
departments, lack of proper utilization of loans and non-repayment of
loans. Most of the beneficiaries are not interested in repayment of loans.
The SC Corporation has to work and co-ordinate with several line
departments like Horticulture, Animal Husbandry, Soil conservation, Lift
irrigation, Housing, Employment and Training, Transport and the PIAs of
other programmes like Indira Kranti Patham (IKP), various Schemes of
107
8/12/2019 Ser Sca0707
http://slidepdf.com/reader/full/ser-sca0707 108/137
DRDA, and other local departments. Most of the line departments inform
that they have heavy work with their own schemes and programmes and
they feel that this is an alien and additional burden to them. They try to
avoid or co-operate with out commitment and interest.
8.8 Local Credit Agencies / Institutions
SC Corporation has to implement the schemes by linking several local
financial institutions. The Banks are very careful in providing loans
through SC Corporation due to poor recovery of loans. The SC
Corporation pays the subsidy component and margin money to the
Banks and in turn the Banks have to release the total sanctioned amount
consisting of subsidy, margin money and the loan component to the
beneficiaries. But most of the Banks open Savings Bank Account of the
beneficiaries and release only loan component and deposit the remaining
two components (subsidy and margin money) in SB account. The Banks
release the remaining amount depending on the performance of
repayment of loan and confidence building. Otherwise, the Banks adjust
the remaining amount towards the loan component. The Commercial
Banks are interested in safeguarding their money by providing loans only
to those who have the capacity of repayment.
In the mechanism of implementation of these schemes, the officials and
the other personnel starting from local leaders and local political activists
to the sanctioning authority involve lot of corruption as the schemes
include subsidy, margin money with low rate of interest and people’s
attitude in non-repayment of loans. In this context, it is better to deletethe two components such as subsidy and margin money from the
Scheme and provide the loans through Banks at subsidized rate of
interest i.e., 4% or less. It will save lot of money including establishment
costs. Special guidelines are to be prepared to instruct the Banks and to
implement the Schemes through Banks.
108
8/12/2019 Ser Sca0707
http://slidepdf.com/reader/full/ser-sca0707 109/137
8.9 Role of Local leaders/Political Activists
The local leaders/ political activists play an important role in
identification of beneficiaries. Mostly, they themselves try to exploit the
situation and avail the benefits or recommend their followers asbeneficiaries of the Schemes. Most of them do not actually belong to BPL
category. However, they managed to include themselves in BPL category
to exploit the Govt. benefits.
The local leaders try to enhance their influence in the village/local area
by actions as middle men between the people and the PIA. They also earn
money out of it and for many of them it is their livelihood. The officials at
grass root level also have some understanding with these leaders for the
benefit of both. Due to the involvement of the local leaders and easy
processing with out following the procedures in identification of
beneficiaries, most of beneficiaries are not genuine and this makes rich
more richer and the poor more poorer. The officials identify the
beneficiaries with the help of local leaders/political activists and not by
conducting Gram Sabhas in any village due to several structural and
political implications at village/local level.
8.10 Problems in Group Activities
Subsidy and micro-credit loans are given to the SHGs to take up different
income generation activities by its members. The skills and efforts in
income generation activities vary from person to person in the group.
Some members repay their loans regularly and some others delay in
repayment or do not repay the loans. However, the repayment of loans is
better among the SHGs than among the individual beneficiaries. Hence,
the Govt. of Tamilnadu has stopped sanctioning schemes to individual
beneficiaries and sanctioning to only SHGs. But since 2007-08 the
sanctioning of schemes to individual beneficiaries is restarted by
THADCO.
109
8/12/2019 Ser Sca0707
http://slidepdf.com/reader/full/ser-sca0707 110/137
8.11 Problems in individual activities
Most of the individual beneficiaries are not interested in grounding the
scheme. They just apply to get the benefit of subsidy and margin money
from the SC Corporation. They try to use the loan amount for differentpurposes instead of using it for the proposed activity. Later it becomes
difficult to repay the margin money.
8.12 Bank Linkage
Bank linkage and extending loans to SC/ST beneficiaries depend on
interest of the bank officials and the confidence on the prospective
beneficiaries in recovery of loans. The mind set of the people ie., not torepay any loan and expects waiving of loan/margin money. In this
context, most of the banks pay only subsidy component and margin
money component with out paying the loan component. Unless the
banker has confidence on the beneficiary, he shall not pay the loan
component. With out loan component, it is not possible to ground the
scheme. In such cases, the beneficiary is also not interested to claim the
loan component and misuse the subsidy and margin money on otherpurposes. There is no bank linkage in tribal areas because the total
scheme is subsidized and hence the PIA in tribal areas does not bother
about bank linkages.
It is better to change the banking policy to issue loans with nominal rate
of interest ie., less than 4 per cent and necessary personnel shall be
provided to the banks to identify the genuine beneficiaries and to follow
up the grounding of the scheme and recovery of loan. The subsidy and
margin money components shall be discontinued and compensate the
subsidized rate of interest to the banks. With this change, lot of
corruption establishment costs shall be reduced.
110
8/12/2019 Ser Sca0707
http://slidepdf.com/reader/full/ser-sca0707 111/137
8.12 Income Generation Schemes
8.12.1 Supply of goats
According to the scheme 10 female goats and 1 male goat are given to the
selected beneficiary. When the goats breed the beneficiary can sell the
goat and earn money. The goats breed twice a year. The approximate
price for a female goat is Rs. 600/- and for the male goat is Rs. 1,200/-.
Apart from this the goat-dung can be used as fertilizer.
The beneficiaries I met do seem happy with the scheme. However, many
of them complained that few of the goats had died some months after
they received them – goats cannot adjust to new surroundings easily.Many goats develop infection due to change in fodder and water and die.
The solution, according to the beneficiaries, is to select goats from the
local area, and not transport them from other places. In one case, the
beneficiary lost 9 of the 11 goats he received and also eight others he
already had due to the infection.
In some cases, however, the goats were too old to begin with. Also the
beneficiaries have to put a badge on the goats’ ears for insurance
purposes. This badge is troublesome to the goats. An alternative
arrangement needs to be put in place.
In the case of deaths the beneficiaries have to take a photograph of the
dead goat, and get a panchanama done. They are then compensated for
the loss, a difficult process.
8.12.2 Popcorn Machine
In this scheme the selected beneficiaries are given a popcorn making
machine. Before collecting it the beneficiaries are taught how to operate
and maintain the machine.
The major drawback of this scheme is that the popcorn making machine
runs on electricity. Therefore in villages, which already face severe power
shortage this machine can be used only for few hours.
111
8/12/2019 Ser Sca0707
http://slidepdf.com/reader/full/ser-sca0707 112/137
The second major drawback of this scheme is that there is not much
demand in the rural areas for the popcorn. Only those beneficiaries living
near urban areas are able to make at least some money out of it.
According to some beneficiaries the popcorn making machine could be
useful if it is mobile –and if it can run on gas instead of electricity. But
one beneficiary in Nasik City invested Rs. 15,000/- for a trolley, battery,
and inverter.
This scheme overall seems to be a complete failure in interior villages. It
is marginally successful in urban and semi-urban areas.
8.12.3 Supply of Cows
Under this scheme the beneficiary gets 2 cows. Usually the beneficiary
receives one cow in the beginning and the second one after 4-5 months.
The beneficiaries seemed quite happy with the scheme. Apart from
generating supplementary income the milk from the cow ensures
nutrition for the children. The cow-dung is used as fertilizer as well. Most
of this fertilizer is used in the fields. Almost every beneficiary was
satisfied with the scheme.
8.12.4 Lift Irrigation and Drip Irrigation
Though these schemes are not strictly for income generation, they do
increase the agricultural output and changes in the cropping pattern.
Under the Lift Irrigation and Drip Irrigation schemes, it is mandatory to
have 5 people in a group. The group gets an electric motor/oil pump and
several pipes. In the Lift Irrigation scheme the beneficiaries first get the
pipes and after some months they get the motor.
Two positive effects are seen due to Lift Irrigation:
- The farmer can sow seeds in the winter season
- Fallow land can sometimes be put to use
112
8/12/2019 Ser Sca0707
http://slidepdf.com/reader/full/ser-sca0707 113/137
8/12/2019 Ser Sca0707
http://slidepdf.com/reader/full/ser-sca0707 114/137
8.12.8 Herbal Nurseries
According to the scheme the farmers are to produce saplings which can
be sold in the market. They get plastic bags, seeds, and fertilizer. They
also get Rs. 5,000 for the labour. In one case the farmer planted 2000
saplings. He sold 500-550 to the Social Forestry Dept. Another 2,000 he
sold to an agent for 50 ps. per sapling. The rest he distributed for free.
The schemes, at the time of the survey, had shut down. This is because it
doesn’t lead to continual income generation. The beneficiaries have to
depend on grants every year from the government.
8.13 Financial Institutions/Agencies which extend Loan Facilities
The data indicate that there are 24 financial institutions/ agencies which
extend loan facilities to SCs and STs under SCA programme. The ITDAs
are the major source of financial assistance extending to the tribals.
Andhra Pradesh has maximum number of such institutions followed by
Tamilnadu extending loans to the SCs. Among the SC beneficiaries
22.40 percent have taken loans from Andhra Bank in Andhra Pradeshand 0.40 per cent of the Sc beneficiaries in Tamilnadu have taken loans
from THADCO. The SC. Corporation has extended loans to 13.20 per cent
of the SC beneficiaries in Andhra Pradesh.
114
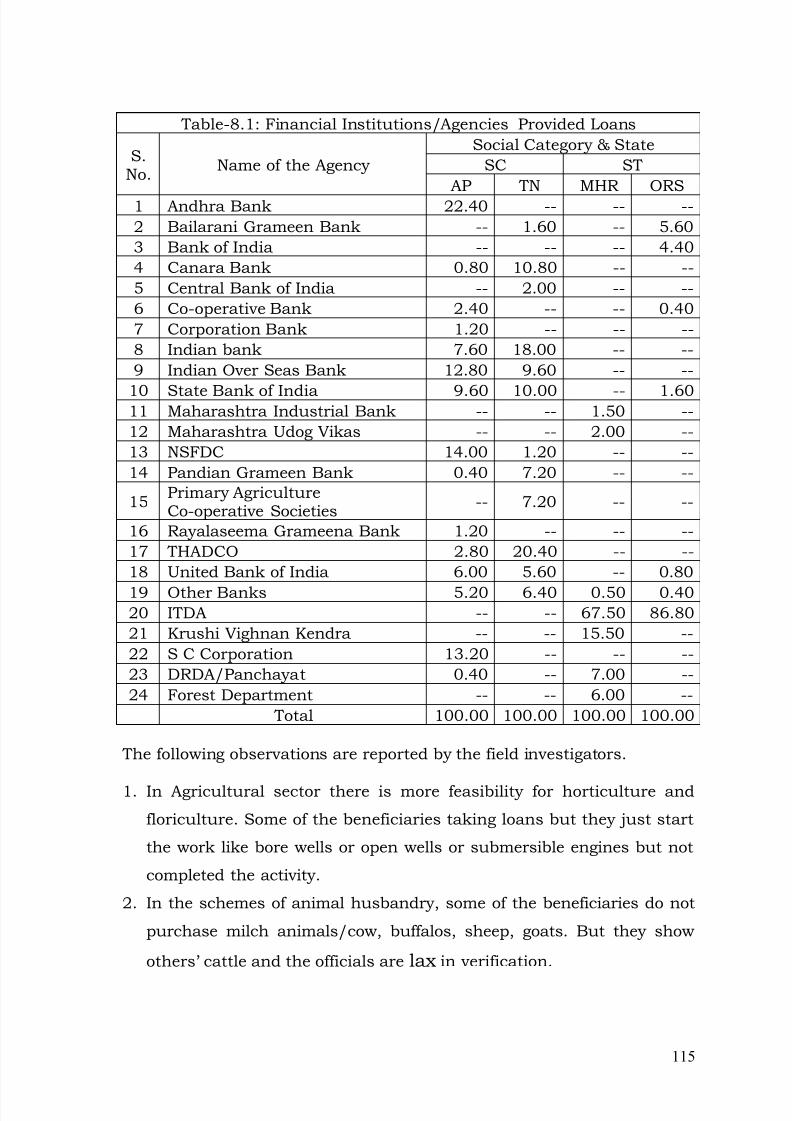
8/12/2019 Ser Sca0707
http://slidepdf.com/reader/full/ser-sca0707 115/137
Table-8.1: Financial Institutions/Agencies Provided Loans
S.No. Name of the Agency
Social Category & StateSC ST
AP TN MHR ORS1 Andhra Bank 22.40 -- -- --2 Bailarani Grameen Bank -- 1.60 -- 5.603 Bank of India -- -- -- 4.404 Canara Bank 0.80 10.80 -- --5 Central Bank of India -- 2.00 -- --6 Co-operative Bank 2.40 -- -- 0.407 Corporation Bank 1.20 -- -- --8 Indian bank 7.60 18.00 -- --9 Indian Over Seas Bank 12.80 9.60 -- --
10 State Bank of India 9.60 10.00 -- 1.6011 Maharashtra Industrial Bank -- -- 1.50 --12 Maharashtra Udog Vikas -- -- 2.00 --13 NSFDC 14.00 1.20 -- --14 Pandian Grameen Bank 0.40 7.20 -- --
15 Primary AgricultureCo-operative Societies -- 7.20 -- --
16 Rayalaseema Grameena Bank 1.20 -- -- --17 THADCO 2.80 20.40 -- --18 United Bank of India 6.00 5.60 -- 0.8019 Other Banks 5.20 6.40 0.50 0.4020 ITDA -- -- 67.50 86.8021 Krushi Vighnan Kendra -- -- 15.50 --22 S C Corporation 13.20 -- -- --23 DRDA/Panchayat 0.40 -- 7.00 --24 Forest Department -- -- 6.00 --
Total 100.00 100.00 100.00 100.00
The following observations are reported by the field investigators.
1. In Agricultural sector there is more feasibility for horticulture and
floriculture. Some of the beneficiaries taking loans but they just start
the work like bore wells or open wells or submersible engines but not
completed the activity.
2. In the schemes of animal husbandry, some of the beneficiaries do not
purchase milch animals/cow, buffalos, sheep, goats. But they show
others’ cattle and the officials are lax in verification.
115
8/12/2019 Ser Sca0707
http://slidepdf.com/reader/full/ser-sca0707 116/137
3. Some of the beneficiaries who proposed to start a petty shop, have
received financial assistance but not yet started shops. A few started
only for the sake of corporation officials and closed them after few
months.4. Even if the SC Corporation sanctions scheme in time, the financial
institutions like banks delay the payment of loan.
5. Vulnerable groups get the sanction easily but they do not to utilize the
loan properly.
6. Political influence plays main role in the sanction of financial assistance.
7. In some cases, SC Corporation has sanctioned loans to government
servants like School teachers and others on benami names. Theyutilized the loan amount to purchase assets like gold, land and other
purposes.
8. Schemes such as Distributing Sewing Machines should be made
available only to those tribals who have shown willingness to use
tailoring as a commercial activity. Such willingness is often seen in
women who enroll with their own money in institutes such as
Industrial Training Institutes.9. In some cases the agencies provided financial assistance to the
activities which do not require financial assistance For e.g. Making
bead necklaces – the trader supplies necessary raw material and
expects only labor from the bead necklace makers like beedi making.
******
116
8/12/2019 Ser Sca0707
http://slidepdf.com/reader/full/ser-sca0707 117/137
CHAPTER-9: SUMMARY AND CONCLUSIONS
Scheduled Castes (SCs) constitute about 166.6 million representing
16.23% of the total population of India (2001 Census). There are about
1200 SC communities and they are spread all over India with main
concentration in Uttar Pradesh (35.1 million), West Bengal (18.4 million),
Tamilnadu (11.8 million), Andhra Pradesh (12.3 million) and Bihar (11.3
million). In number SC communities, Karnataka has large number (101)
followed by Orissa (93). SCs are rural in their habitation (78%) and large
number of them are agricultural labourers (46%) and only 20% are
cultivators. Important development indicators of literacy (54.7%), IMR
(83), rural poverty (36%), urban poverty (38%) show large disparity with
the general population.
The population of Scheduled Tribes is 84.3 million (2001 Census)
constituting 8.2% of the total population of the country. STs have theirown distinctive culture and geographically isolated with low socio-
economic conditions. More than half of the ST population is concentrated
in the five States of Madhya Pradesh (14.51%), Maharashtra (10.2%),
Orissa (9.7%), Gujarat (8.9%), and Rajasthan (8.4%). There are about
650 ST communities across the States in India and 75 of them are most
backward and are termed as Primitive Tribal Groups. 91.7% of STs live
in rural areas and only 8.3% live in urban areas. About 45% of STs arecultivators and 40% are engaged in agricultural labour. Socio-Economic
Indicators of literacy (47%), IMR (84), rural poverty (46%), urban poverty
(35%) show the disparity and low level of development among them.
As the general development programmes could not specifically cater to
the needs of the SCs and STs and Other Backward Classes, there was a
need to provide added thrust to the general developmental programmes.
So, two special categories, Special Component Plan (SCP) for SCs and
117
8/12/2019 Ser Sca0707
http://slidepdf.com/reader/full/ser-sca0707 118/137
Tribal Sub-Plan (TSP), for STs were adopted during seventies by the
government as intervention/ special strategies adopted not only to ensure
that the developmental benefits from other developmental sectors do not
by-pass these special groups but also to guarantee adequate funds andbenefits in proportion to the size of their population flow from all the
related development sectors both at State and Centre level. Further, in
support of these strategies, the Government of India also extends Special
Central Assistance (SCA) to states and UTs as an additive to SCP and
TSP.
9.1.1 Scheduled Castes Sub plan (SCSP)
Sixth Five Year Plan (1980-85) is the first plan which put due emphasis
for the development of SCs in terms of Special Component Plan - a new
strategy for comprehensive development with a due share of benefits in
physical and financial terms from various programmes of every sector
through cluster and saturation approach. The nomenclature of Special
Component Plan for Scheduled Castes has been renamed as Scheduled
Castes Sub-Plan (SCSP) on the lines of Tribal Sub Plan to make thebeneficiaries aware of the programmes meant for them. The strategy of
Scheduled Castes Sub-Plan (SCSP) is one of the most important
interventions through the planning process for social, economic and
educational development of Scheduled Castes and also for improvement
in their working and living conditions.
Scheduled Castes Sub-Plan is an umbrella strategy to ensure flow of
targeted financial and physical benefits from all the general sectors of
development for the benefit of Scheduled Castes. Under the strategy,
States/UTs and Central Ministries are required to formulate and
implement Scheduled Castes Sub-Plan (SCSP) for Scheduled Castes as
part of their Annual Plans by earmarking resources in proportion to their
share in total population. At present, 27 States/UTs having sizeable SC
populations are implementing Scheduled Castes Sub-Plan.
118
8/12/2019 Ser Sca0707
http://slidepdf.com/reader/full/ser-sca0707 119/137
8/12/2019 Ser Sca0707
http://slidepdf.com/reader/full/ser-sca0707 120/137
State/UT. The TSP strategy is now being implemented through 196
Integrated Tribal Development Projects/Integrated Tribal Development
Agencies (ITDPs/ITDAs), 259 Modified Area Development approach
(MADA) Pockets, 82 Clusters and 75 Primitive Tribal Groups in 23 TSPStates/UTs. The Tribal Sub-Plan Programmes are to be financed by the
following sources: (a) Tribal Sub Plan funds form State /U.T Plans and
Central Ministries/Departments, (b) Special Central Assistance (SCA) to
Tribal Sub Plan (TSP), (c) Grants under Article 275 (1) of the Constitution
to the States/U.Ts, (d) Funds through Central Sector Schemes, (e) Funds
from Centrally Sponsored Schemes and (f) Institutional Finance.
The TSP expenditure though has increased from fifth five year plan
steadily but the allocations made by the States/U.Ts are mostly notional
in nature as the expenditure is not even half of the allocation and most of
the governments had not created separate budget heads and had not
made the tribal welfare departments nodal for earmarking of funds as per
the needs of the tribal groups in the States with proper monitoring
mechanism. Over the years it was observed that TSP strategy is not being
implemented properly and inter-sectoral allocation and prioritization is
not being done. Special Central Assistance (SCA) to Tribal Sub Plan (TSP)
is provided by the Ministry of Tribal Affairs to the States/U.Ts since 5 th
Five year Plan as an additive to State/U.T Plan to 21 States and 2 U.Ts
which are implementing TSP for supporting the tribal population below
the poverty line as per the guidelines issued by the Ministry of Tribal
Affairs.
There are about 3.57 crore SCs households in the country (Rural: 2.79
crore, Urban: 0.78 crore) and 1.8 crore ST households (Rural: 1.59 crore,
Urban: 0.23 crore) in the country as per 2001 Census. As 36% of SC
rural households and 46% of ST rural households are in below poverty
line and most of the socio-economic development programes of SCP and
TSP are meant for them only the actual entitlement will be roughly about
Rs. 1,04,700 per SC BPL household and Rs. 1,23,200 per ST BPLhousehold. This would have enabled them for more socio-economic
120
8/12/2019 Ser Sca0707
http://slidepdf.com/reader/full/ser-sca0707 121/137
empowerment to cross the poverty line and thus bridging the gap during
the last 10 years alone than what can be seen from the present scenario
of SCs and STs in the country.
The impact observed from the primary data obtained from the SC and ST
beneficiaries of the selected States indicate a great disparity in literacy,
education, occupation, housing, assets ownership and the availability of
basic amenities in terms of water, drainage, electricity in the rural areas
with the general population. The beneficiaries have expressed their
difficulties in availing of loans, accessing the benefits and the corruption
at various levels.
9.2 Objectives of the Study
The evaluation study of Special Central Assistance to Scheduled Castes
(SCs) in Andhra Pradesh and Tamilnadu and Scheduled Tribes (STs) in
the States of Maharashtra and Orissa has been sponsored by the
Planning Commission. The study has the objectives (i). to determine the
extent of success to which the projects under Special Component Plan,
Tribal Sub Plan, Central Special Assistance and National Scheduled
Castes Finance and Development Corporation and National Scheduled
Tribes Finance and Development Corporation are being implemented
through Government as well as non-government organizations for the
economic development of Scheduled Castes and Scheduled Tribes. (ii).to
examine the process of identification of beneficiaries and projects being
provided to Scheduled Castes and Scheduled Tribes, nature of facilities
and services being extended by the Government and non-governmentorganizations in promoting economic development of the SCs and STs,
(iii). to assess various important segments of the programmes being
implemented by the Government to provide an insight whether the
programmes are running on the desired lines, (iv). to investigate the steps
being taken by the Programme Implementing Agencies (PIAs) in
promoting entrepreneurship and productive skills among the SCs and
STs, (v). to assess the diachronic impact of SCA and extent of economic
121
8/12/2019 Ser Sca0707
http://slidepdf.com/reader/full/ser-sca0707 122/137
development among the SC and ST beneficiaries by identifying and
measuring clear indicators over a period of time, and (vi). to examine
problems of the beneficiaries and the initiatives taken for the economic
development and the inputs required for proper implementation of theprogrammes.
The study covers SC beneficiaries under the SCP in Andhra Pradesh and
Tamilnadu and ST beneficiaries under TSP in Maharashtra and Orissa.
The sample was selected based on multi-stage random method. Thus five
districts and 500 SC beneficiaries were selected for the study. Similarly,
four Integrated Tribal Development Projects (ITDPs) in Maharashtra and
five ITDPs in Orissa were selected for the study. Thus nine ITDPS and
450 ST beneficiaries were selected for the study. On the whole, 500 SC
and 450 ST beneficiaries were covered in the study.
9.3 Methodology adopted
Data for the present study were collected from both primary and
secondary sources. The secondary data were collected from the records of
the concerned officials at District and State levels and Non-governmentOrganizations if involved. The primary data were collected through
anthropological fieldwork including observation, interview schedule,
formal and informal discussions including focus group discussion (FGD)
and case study method.
9.4 Analysis and Results
The data were entered in to computer using SPSS software. The
relationships were identified between different variables to prepare tables
keeping in mind the objectives of the study. The report of the study
clearly explains the objectives of the study, the design, approaches and
methods used in the study, the procedure of data and information
collected, sampling design, and analysis of data and the conclusions of
the study together with recommendations.
122
8/12/2019 Ser Sca0707
http://slidepdf.com/reader/full/ser-sca0707 123/137
9.5 Identification of Beneficiaries
The identification of beneficiaries by conducting Gram sabha is only on
paper and it does not exist. A part of the grant is being spent on
awareness camps. The camps are not effective and they spent theamount on some combined camps.
The major objective of SCA is to bring the families from below poverty line
to above poverty line by providing sustainable income generation
schemes. The identification of beneficiaries is the major problem in the
implementation of any development programme. It was observed that
more than 50 percent of the beneficiary families are not in below poverty
line. They possess household material like refrigerator, television,
telephone etc., However, they possess BPL ration cards and are
considered as families in below poverty line The political leaders at
village/grass root level play major role in the preparation of list of BPL
families and identification of beneficiaries to avail benefits being extended
by the Government.
District Scheduled Caste Corporation prepares an Action Plan along withbudget and submits it to State Government for approval and financial
sanction. The Executive Director/District Manager/ Project Administrator
places an advertisement in the local news papers calling applications for
the sanction of loans for different schemes. The District office sends
empty applications to all the Block/Mandal Development Officers for
distribution to the applicants.
Gram Sabhas are not conducting for identification of beneficiaries since it
is a difficult process due to various structural implications and local
political scenario and lack of interest among the concerned officials to
conduct Gram Sabha. The officials distribute the applications to the
supposed to be eligible candidates and receive back the duly filled in
applications for further processing at official level. The local political
activists maintain good rapport with the concerned officials and play
major role in the selection of beneficiaries. Mostly, the list of beneficiaries
123
8/12/2019 Ser Sca0707
http://slidepdf.com/reader/full/ser-sca0707 124/137
does not include the genuine and poorest among the poor. Even the
preparation of list of families under BPL is not genuine.
Number of social and political factors influences the list of BPL families.
The concerned officials are interested to show high figures of BPL to get
more budget, schemes and programmes. The manipulated BPL lists, the
interference of local political activists and lack of sincerity and
commitment among the officials are the major constraints in
identification of genuine beneficiaries and development schemes reaching
the poorest among the poor. The present mechanism of implementing the
programmes makes ‘the rich more richer and the poor more poorer’.
The Block/Mandal Development Office scrutinizes the applications,
selects the eligible candidates and sends the list of selected applications
to the District/ITDA office for sanction of the Schemes.
9.6 Choosing Suitable Schemes
SC Corporation/ITDA implements various Schemes in Subsidy mode to
the eligible candidates. The local resources (Natural Capital) and skills ofthe applicants (Human capital) should be the major factors in choosing
different income generation schemes. Actually, these two major factors
play less role and the other factors like easy manipulation of things to get
the scheme and to spend the money on other considerations play a major
role. There are number of cases in which the non-genuine beneficiaries
got more than one scheme.
The educated and the local political activists access maximum benefits
from the Government. Due to lack of proper tools and mechanism in
identification of BPL families, most of the benefits being extended by
Government are not reaching the poorest among the poor among the
Scheduled Castes. This in turn creates inequalities among the Scheduled
Castes resulting in unhappiness among the Scheduled Castes.
124
8/12/2019 Ser Sca0707
http://slidepdf.com/reader/full/ser-sca0707 125/137
9.7 Self Help Groups (SHGs)
SC Corporation/ITDA sanctions financial assistance to Self Help Groups
and individuals. Normally, the loans are given to SHGs belonging to
SCs/STs under BPL for taking up income generation activities. TheCorporation/ITDA strengthened the SHGs of SC/ST women under the
Scheme of Micro-credit from the year 2000-2001.
The SC Corporations in Andhra Pradesh and Tamilnadu are encouraging
Women SHGs by giving priority in extending financial assistance for
income generating activities. But, the ITDAs in Orissa and Maharashtra
are not taking much interest in encouraging women SHGs and extending
financial assistance to them. The financial assistance extended to group
of tribal farmers by providing lift irrigation schemes etc., are mostly
useful and this needs follow up action and proper monitoring.
9.8 Individual Schemes
Most of the Individual Schemes are based on the skills of the
beneficiaries under ISB sector. The Self Employment Schemes are most
beneficial to individual beneficiaries. But they are not properlyimplemented.
9.9 Bank Linkages
SC Corporation has to implement the schemes by linking several local
financial institutions. The Banks are very careful in providing loans
through SC Corporation due to poor recovery. Most of the Banks open
Savings Bank Account of the beneficiaries and release only loancomponent and deposit the remaining two components (subsidy and
margin money) in SB account. The Banks release the remaining amount
depending on the performance of repayment of loan and confidence
building. Otherwise, the Banks adjust the remaining amount towards
the loan component. The Commercial Banks are interested in
safeguarding their money by providing loans to only those having
repaying capacity.
125
8/12/2019 Ser Sca0707
http://slidepdf.com/reader/full/ser-sca0707 126/137
In the mechanism of implementation of these schemes, the officials and
other personnel starting from local leaders and local political activists to
the sanctioning authority involve in lot of corruption as the schemes
include subsidy, margin money with low rate of interest, anticipatingwaiver of loans and the consequent people’s attitude/mind set in non-
repayment of loans.
9.10 Infrastructural Facilities
The ITDAs are spending more than 30 per cent of the grant towards
provision of infrastructural facilities with their own technical staff in
tribal areas. Most of the amount was spent on lying of village roads and
construction of school buildings, ITIs, culverts and check dams. The field
observation reveals that some of the works are over estimated and
spending amount on less important works.
Out of the total grant received under SCA is to be spent on infrastructure
activities. In Andhra Pradesh 10% of the SCA is spent on repairs and
small construction works like Social Welfare hostel buildings. Similarly,
10% of SCA fund allotted to Tamilnadu is spent towards special
construction works through TAHDCO as infrastructure activities
depending on the request of public. They spent on hostels for both girls
and boys in all categories like school, college and PG students.
9.11 Implementation and Utilization of Grants
The analysis of the implementation of the SCP and TSP in the States
under study dealt in detail in individual chapters indicate that, none ofthese States are following the stipulated guidelines of SCP, TSP in toto.
The allocation of funds towards SCP and TSP indicate that, except
Tamilnadu and Orissa (for both SCP and TSP) and other States have not
allocated SC and ST population proportionate funds during 10 th Plan. As
dealt in detail in the earlier chapters, even these States allocations are
only notional in nature like the other States. These States are allocating
funds towards SCP and TSP from the divisible and non-divisible
126
8/12/2019 Ser Sca0707
http://slidepdf.com/reader/full/ser-sca0707 127/137
sectors/departments and whatever shortage accrued to these sub-plan
outlays are being accounted mainly from the non-divisible sectors.
Tamilnadu State in their SCP documents shows clearly the sectoral
outlays from divisible departments and non-divisible departments
schemes/programmes which is in the ratio of 40:60. Even these less
allocated SCP outlays have also not been utilized fully in the States
except in Tamilnadu. The tribal dominant States like Maharashtra and
Orissa have utilized their TSP funds to the extent of 65 to 70% only for
tribal development. The sectoral allocation and utilization of funds, fixing
of targets and achievements are comparatively better in the States of
Tamilnadu followed by Andhra Pradesh. Some States like Tamilnadu and
Andhra Pradesh are setting realistic targets and showing achievements
against various schemes of the departments in their SCP documents by
compiling them regularly. During the terminal years of the 10 th Plan,
other States like Maharashtra and Orissa have started setting targets
against various schemes and depicting the achievements.
The funds being allocated as grants in the form of SCA to SCP, SCA to TSP and Article 275(1) of the Constitution have also not been fully
utilized in Tamilnadu and Orissa States. The States under study are not
utilizing the grants properly and the unspent grants carryover to
succeeding years due to late submission of utilization certificates, non-
completion of projects in time, non-preparation of viable projects, release
of funds in time to implementing agencies etc which indirectly show the
administrative bottlenecks, coordination problems between the Financeand nodal and line departments, and administrative in efficiency
particularly at the field level.
The utilization of funds by the States is also not being followed as per the
guidelines issued by the Central Ministries of Social Justice &
Empowerment and Tribal Affairs and only Tamilnadu is setting targets
and achieving the targets against the economic oriented programmes set
127
8/12/2019 Ser Sca0707
http://slidepdf.com/reader/full/ser-sca0707 128/137
8/12/2019 Ser Sca0707
http://slidepdf.com/reader/full/ser-sca0707 129/137
• Except in the state of Tamilnadu other States are not fixing realistic
physical targets for the SCP and TSP schemes/programmes. TheStates are not preparing bench mark surveys, perspective plans,
vision document for long term goals, outcomes of the
schemes/programmes.
• TSP approach is basically area based with ITDP/ITDA, MADA and
Cluster based but no proper planning and effective implementation
and monitoring at the field level is in place which is hindering the
completion of the infrastructure projects in time and deliverymechanism.
• ITDP, MADA, District, Block and village wise planning, single line
administration and implementation of programmes are not being
attempted sincerely with TSP centric approach in Maharashtra and
Orissa.
• The allocation of funds towards SCP and TSP are not as per the
population proportion of SCs and STs in the States.• The State governments are allocating SCP and TSP from the divisible
and indivisible sectors and major funds to the tune of 60 to 65%
funds are being allocated from the indivisible sectors like irrigation,
agriculture, industry, power and roads which have only 10 to 15%
coverage of SC and ST areas and even less percentage of actual
beneficiaries.
•
Tamilnadu State is adopting the ‘divisible’ ‘non-divisible’ sectoralfunds in their SCP and TSP outlays.
• SCP implementation is basically through Rural Development IRDP
department and there is no synergy of inter-sectoral or cluster
approach in the poverty alleviation programmes for the welfare and
development of SCs in the States.
• Individual departments are implementing their own schemes in the
States and SCs and STs are being covered as part of these schemes.
129
8/12/2019 Ser Sca0707
http://slidepdf.com/reader/full/ser-sca0707 130/137
• The data indicate that, the awareness about the schemes is not
available to all eligible SCs and STs and all the schemes have not
been availed by them.
• The direct benefits accruing to SCs and STs are through theeducational and economic oriented programmes being undertaken
by the social welfare and tribal welfare departments and State
SC/ST finance & development corporations of the States and the
physical coverage of SC and ST beneficiaries through other sectoral
programmes is very less.
• SCA to SCP and SCA to TSP grants under Article 275(1) of the
Constitution are not released in time by the Central Government atthe beginning of the financial year directly to the Social Welfare and
Tribal Welfare departments.
• SCA to SCP funds are being utilized mostly through the State
Scheduled Caste Finance Development Corporation in States like
Andhra Pradesh and Tamilnadu.
• Only States of Tamilnadu and Orissa are showing the Central Sector,
Centrally Sponsored Schemes separately in their SCP and TSPoutlays, expenditure and physical coverage.
• The selection of beneficiaries and the accessibility of the various
schemes of SCP and TSP indicate that, the schemes/programmes
being covered depends on the sectoral programmes.
Criteria/guidelines and the local bodies and Panchayats have little
role.
9.13 Suggestions:
The socio-economic conditions of the SCs and STs in the country show
that, though there is some improvement in literacy, drinking water
availability, road connectivity and agricultural practices, employment
opportunities and increase in income of SCs and STs still much needs t
be done. To achieve the comprehensive development of the SCs and STs,the following issues need to be addressed with determined efforts.
130
8/12/2019 Ser Sca0707
http://slidepdf.com/reader/full/ser-sca0707 131/137
Perspective Planning: Perspective Planning for the development of
SCs and STs by setting clear objectives, resources available/
requirement, outcomes and goals with periodic bench mark surveys
for the regions, Districts, ITDPs/ITDAs, MADAs, Clusters (areas,villages) by setting realistic targets.
Allocation of proper resources: States/U.Ts and Central
Ministries/ Depts. are not allocating funds proportionate to SC and
ST population towards Special Component Plan and Tribal Sub Plan
in their annual Plans.
Adherence to Guidelines: The nodal Ministries and Planning
Commission need to streamline the procedure for adherence to the
guidelines.
Decentralized functional autonomy: The guidelines for the
decentralized district level planning, allocation of resources of at
least 30% to district bodies by most of the States are yet to follow
this. More financial and executive powers need to be given to the
implementing agencies at the District/Project level functionaries
with infrastructure and supporting mechanism for timely execution
of projects.
Integrated Planning: Integrated planning of the sectoral
departments programmes and execution of common programmes at
the District and project level through pooling of resources and single
line administration advocated in tribal areas is not working
effectively though it is in place in some States like A.P and Orissa. Removal of Subsidy and margin money: It is better to delete
the two components such as subsidy and margin money from
the Scheme and provide the loans through Banks at subsidized
rate of interest i.e., 4% or less. It will save lot of money
including establishment costs. Special guidelines are to be
prepared to instruct the Banks to implement the Schemes at
131
8/12/2019 Ser Sca0707
http://slidepdf.com/reader/full/ser-sca0707 132/137
8/12/2019 Ser Sca0707
http://slidepdf.com/reader/full/ser-sca0707 133/137
which need to be implemented effectively through timely and proper
releases, monitoring by periodic field visits, calling of reports and
conducting evaluation.
The role of NGOs: The involvement of NGOs in developmentactivities of STs and SCs is to be strengthened. Their role in each
State need to be charted out by the State to supplement the efforts of
the state administration. Their involvement in the Social Audit and
effective monitoring of Government programmes also should be
encouraged. However, the credentials of VOs/NGOs and their
activities need to be ascertained before giving them responsibility.
MIS and maintenance of Assets: A separate SCP/TSP cell need to
be created at State level for proper MIS which should maintain all
the statistical information about the SCs and STs Data
schemes/programmes.
Identification of BPL families: Priority should be given to the
poorest among the poor for whom clear visible socio-economic
indicators should be prepared and publicized at village level and
kept in a separate website at district level. The list of BPL families
should be approved in Gram sabha/ Village Panchayat consisting of
all the ward members. The list of BPL families should be revised at
the beginning of every financial year (April).
Identification of beneficiaries: As most of the socio-economic
schemes under SCP and TSP are targeting BPL families, the listing
and identification of the beneficiaries need to be more transparent,which needs regular up-gradation for implementation and
monitoring. Regular surveys, identification of eligible beneficiaries
and involving the Pachayats/Gram Sabha and NGOs with wide
publicity/Media/Websites will ensure transparency.
State Finance Corporations need to be revitalized: Though they
are in existence for the last 30 years, they are yet to make a serious
dent in the entrepreneurship/skill/development economic
133
8/12/2019 Ser Sca0707
http://slidepdf.com/reader/full/ser-sca0707 134/137
development of the SC/ST beneficiaries which need to be geared up
in terms of its financial, human resource management and coverage
of beneficiaries.
9.14 Suggestions given by the respondents
The following suggestions are received from the beneficiaries and PIAs for
better implementation of the programmes/schemes.
• The Welfare Extension Officer (WEO) looks after the schemes at
Block and village levels. Besides, he has to work under BDO and
PO, ITDA. It is difficult to look after all the beneficiaries in a block.
So one more person may be appointed at Block level.
• The subsidy portion/assistance for I.G.S. may be increased.
• Demonstration programme for all the schemes may be provided.
• The line departments are over burdened. Sufficient staff may be
provided for smooth implementation of the programme.
• Education and awareness of programme at village level may be
strengthened to bring better awareness among the target group.
• The credit agencies should provide timely credit based on the
nature of activities and recovering capacity.
• In some cases the training period of the activity is not
sufficient (e.g. sericulture) it may be increased up to
10months.
• Sufficient manpower with suitable skills may be increasedand appointed on contract basis at each ITDA to look after
different schemes at village level to avoid the involvement of
line departments in implementation of Schemes.
134
8/12/2019 Ser Sca0707
http://slidepdf.com/reader/full/ser-sca0707 135/137
• Evaluation of the sanctioned schemes shall be conducted among
the beneficiaries district level offices once in six months by the
incharge.
• The thrust should be on ensuring information disbursal so thattribals make informed choices.
• Information about schemes should be made available in ration
shops, PHCs, Ashram Schools, and other such grass-root level
organizations which tribals use on a daily basis.
• While distributing fully-subsidized units, tribals should be given
exact details of the schemes in a clear cut manner – Total moneyallocated under the scheme and number of units allocated under
the scheme.
• Authorities should be careful while approving schemes that
distribute units running on electricity. The tribals that are really in
need of schemes often don’t have electricity connections. This also
encourages electricity theft. Only few schemes like Lift Irrigation,
Drip Irrigation, etc. that run on electricity make a real contributionto tribal incomes.
• Rain Water Harvesting schemes should be introduced which
combine indigenous methods with scientific knowledge. Water in
one more season means 4 months of labour for the farmer.
• While approving schemes, attention should be paid to marketing
linkages, especially for units that produce goods which are in
demand only in urban markets.
• Avoid middle men and local leaders in identification of
beneficiaries.
• Give freedom to the beneficiaries and guide them properly in
choosing the schemes.
• Monitoring and follow up action by PIA should be strengthened to
facilitate the recovery of loan/margin money.
135
8/12/2019 Ser Sca0707
http://slidepdf.com/reader/full/ser-sca0707 136/137
• The leading NGOs shall be involved in identification of
beneficiaries.
• Encourage woman beneficiaries in the programme.
• The financial institutions are interested only in recovery of loans
and not in the functioning of unit/activity.
• Lack of education and awareness are the main problems in the
implementation of any scheme.
• Some line departments are not cooperative and not responding
properly to the approaches of SC Corporation. The line
departments are over burdened with their departmental work andthere is no sufficient staff in the line departments.
• The banks are not paying the total loan amount which is being
sanctioned by the SC Corporation.
• In some areas, the local leaders who are aware of the schemes
very much and assist the beneficiaries, but in some areas
particularly the leaders in interior places don’t bother about the
people.
• The SC Corporation in some of the districts in AP has not given
correct/genuine addresses of the beneficiaries for collection of data
and it seems that the beneficiaries have given false addresses to
avoid repayment of margin money/loan amount.
136
8/12/2019 Ser Sca0707
http://slidepdf.com/reader/full/ser-sca0707 137/137
REFERENCES
• Annual Report (2006-07). “Ministry of Social Justice and
Empowerment, Government of India, New Delhi
• Annual Report (2006-07). “Ministry of Tribal Affairs Govt. of India,
New Delhi.
• Raja Reddy, K. (2008) “What the SHGs Members Doing with Large
Loans?”. Paper presented in a national seminar on “SHGs and Role
of Social Work Profession” organized by Dept of Social Work,
Andhra University, Visakhapatnam from 21 st & 22 nd February
2008
• Sirajuddin, S.M. (2007). “Evaluation Repot, SCSP & TSP, Planning
Commission, New Delhi