Embed Size (px)
Citation preview
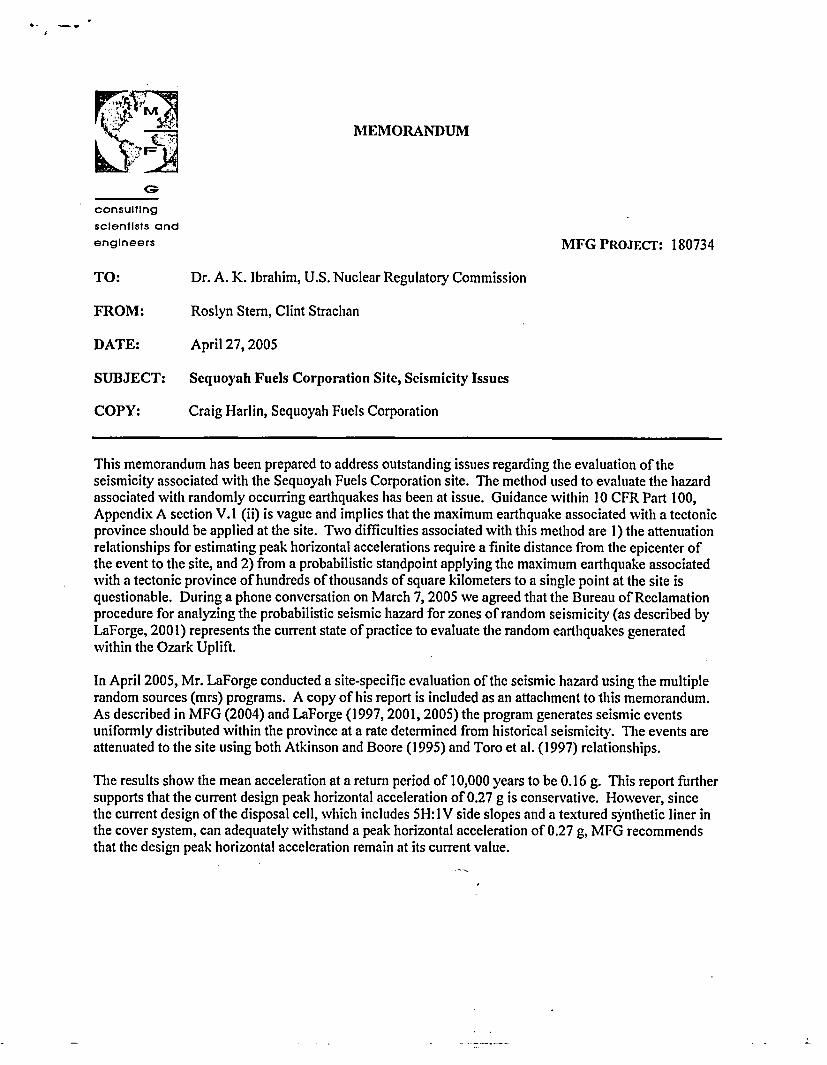
MEMORANDUM
consultingscientists andengineers MFG PROJECT: 180734
TO: Dr. A. K. Ibrahim, U.S. Nuclear Regulatory Commission
FROM: Roslyn Stem, Clint Strachan
DATE: April 27, 2005
SUBJECT: Sequoyah Fuels Corporation Site, Seismicity Issues
COPY: Craig Harlin, Sequoyah Fuels Corporation
This memorandum has been prepared to address outstanding issues regarding the evaluation of theseismicity associated with the Sequoyah Fuels Corporation site. The method used to evaluate the hazardassociated with randomly occurring earthquakes has been at issue. Guidance within 10 CFR Part 100,Appendix A section V.1 (ii) is vague and implies that the maximum earthquake associated with a tectonicprovince should be applied at the site. Two difficulties associated with this method are 1) the attenuationrelationships for estimating peak horizontal accelerations require a finite distance from the epicenter ofthe event to the site, and 2) from a probabilistic standpoint applying the maximum earthquake associatedwith a tectonic province of hundreds of thousands of square kilometers to a single point at the site isquestionable. During a phone conversation on March 7, 2005 we agreed that the Bureau of Reclamationprocedure for analyzing the probabilistic seismic hazard for zones of random seismicity (as described byLaForge, 2001) represents the current state of practice to evaluate the random earthquakes generatedwithin the Ozark Uplift.
In April 2005, Mr. LaForge conducted a site-specific evaluation of the seismic hazard using the multiplerandom sources (mrs) programs. A copy of his report is included as an attachment to this memorandum.As described in MFG (2004) and LaForge (1997, 2001, 2005) the program generates seismic eventsuniformly distributed within the province at a rate determined from historical seismicity. The events areattenuated to the site using both Atkinson and Boore (1995) and Toro et al. (1997) relationships.
The results show the mean acceleration at a return period of 10,000 years to be 0.16 g. This report furthersupports that the current design peak horizontal acceleration of 0.27 g is conservative. However, sincethe current design of the disposal cell, which includes 5H:IV side slopes and a textured synthetic liner inthe cover system, can adequately withstand a peak horizontal acceleration of 0.27 g, MFG recommendsthat the design peak horizontal acceleration remain at its current value.
@ - #
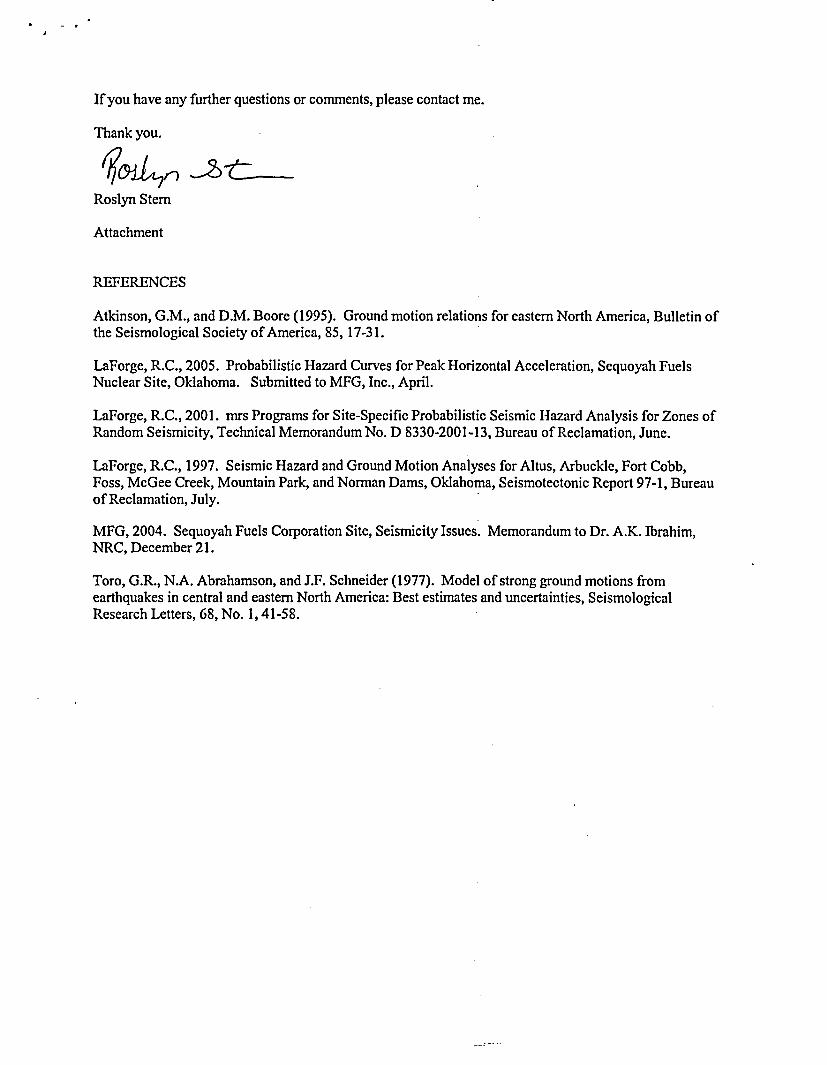
If you have any further questions or comments, please contact me.
Thank you.
Roslyn Stem
Attachment
REFERENCES
Atkinson, G.M., and D.M. Boore (1995). Ground motion relations for eastern North America, Bulletin ofthe Seismological Society of America, 85, 17-3 1.
LaForge, R.C., 2005. Probabilistic Hazard Curves for Peak Horizontal Acceleration, Sequoyah FuelsNuclear Site, Oklahoma. Submitted to MFG, Inc., April.
LaForge, R.C., 2001. mrs Programs for Site-Specific Probabilistic Seismic Hazard Analysis for Zones ofRandom Seismicity, Technical Memorandum No. D 8330-2001-13, Bureau of Reclamation, June.
LaForge, R.C., 1997. Seismic Hazard and Ground Motion Analyses for Altus, Arbuckle, Fort Cobb,Foss, McGee Creek, Mountain Park, and Norman Dams, Oklahoma, Seismotectonic Report 97-1, Bureauof Reclamation, July.
MFG, 2004. Sequoyah Fuels Corporation Site, Seismicity Issues. Memorandum to Dr. A.K. Ibrahim,NRC, December 21.
Toro, G.R., N.A. Abrahamson, and J.F. Schneider (1977). Model of strong ground motions fromearthquakes in central and eastern North America: Best estimates and uncertainties, SeismologicalResearch Letters, 68, No. 1, 41-58.
AP
Probabilistic' Hazard Curves for
- Peak Hor'izontal Acceleration
Sequoyah Fu'els' Nuclear- Site
OklahomatP)
i.submitted'to MFG, ~Inc.;
* 7w -~ -v . Roland C.- LaForge - ;
,.;'- ..- '. : .'Seismic Hazard Consulting f , ,
Apil 2005.
I .- -
III
II I4 1
Probabilistic Hazard Curves for
Peak Horizontal Acceleration
Sequoyah Fuels Nuclear Site
Oklahoma
submitted to MFG, Inc.
Roland C. LaForge,
Seismic Hazard Consulting
April, 2005
1.0 Introduction
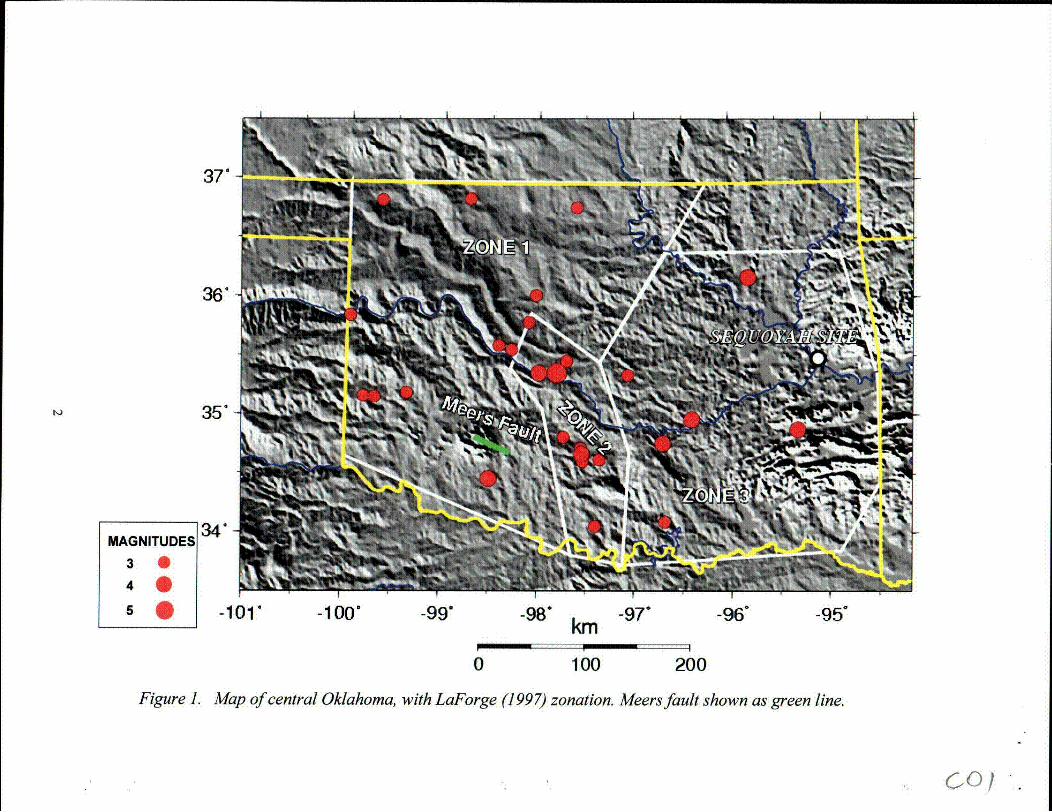
This report presents a mean hazard curve for peak horizontal acceleration, with associated fractilecurves, for the Sequoyah Nuclear Repository site. Based on extensive geologic investigations, ithas been found that no active faults exist within 100 km of the site. The nearest active faultappears to be the Meers fault, about 300 kmrto the southwest (e.g., Crone and Luza,.1 990; Swan etal., 1993)(Figure 1). The remaining seismic hazard comes from randomly occurring, or "back-ground" earthquakes. The hazard curves presented here assume this hazard consists of uniformlydistributed earthquakes occurring at a rate determined from historic seismicity. Two types of frac-tile curves are presented; one set showing variations in the mean hazard due to epistemic uncer-taintes, and thle other In addition to these including aleatory uncertalntles In the expected groundmotion as a function of magnitude and distance.
2.0 Historic Seismicity and Catalog Preparation
Because the Oklahoma Geological Survey has operated a microseismic network in the state sincethe 1970's, it is reasonable to examine state of Oklahoma (excluding the panhandle) as an arealsource zone. Although seismograph stations have not been densely deployed, favorable wavepropagation characteristics and many quiet sites have allowed for an estimated detection thresh-old of greater than or equal to magnitude 2.0 since 1977 (J. Lawson, personal comm., 1997).
The methodology presented here -extends-and modifies to some extent that -contained in LaForge(1997). That study presented hazard curves for seven Bureau of Reclamation dam sites within thestate. Based on geologic and seismological considerations, the state of Oklahoma was dividedinto three zones. Figure 1 shows the configuration of the zones, along with earthquakes of magni-tude 3 and larger that were used in the recurrence calculations. The zonation was based on thedensity of s-nall:magnitude seismiciiy,. and the apparent cqorrelation.of dense seismicity with theNemaha Uplift associated with Zone 2.
The Sequoyah site lies within Zone 3 (Figure 1). In LaForge (1997) the calculation of robustrecurrence statistics in Zone 3 was problematical, as there were, after filtering for the estimatedcompleteness periods, 114 earlftquakes In the magnitude 2 range, and only 7 Of mllagnltude 3 an1dabove. It has been suggested that the overabundance of magnitude 2 events in the state is relatedto oil and gas extraction activities (Luza, 1985). During a recent reexamination of the seismic haz-ard to McGee Creek Dam (approximately 100 km to the south of the Sequoyah site), it wasdecided to raise the minimum magnitude considered to 3.0, in order to eliminate the possibility ofinduced earthquakes and the clear bias introduced by the large number of these events, and to usea regional recurrence rate for the entire state. Thus the "new" zonation consists of the combinationof Zones 1, 2, and 3 on Figure 1.
For the current study the catalog developed in LaForge (1997) was updated through March, 2005.The primary sources of seismicity were the catalog of the Oklahoma Geological Survey Observa-tory, and the Decade of North American Geology (Engdahl and Rinehart, 1991). Table 1 showsthe completeness periods used, and the numbers of events in each magnitude range. These eventsare plotted in Figure 1. The assumption of spatial randomness does not appear to be grossly vio-lated in this Figure.
1
37.-
36-
35''|
34
5 * -101 -100' -990 -98- km -97- -96' -95
0 100 200
Figure 1. Map of central Oklahoma, with LaForge (1997) zonation. Meers fault shown as green line.
,,c°l
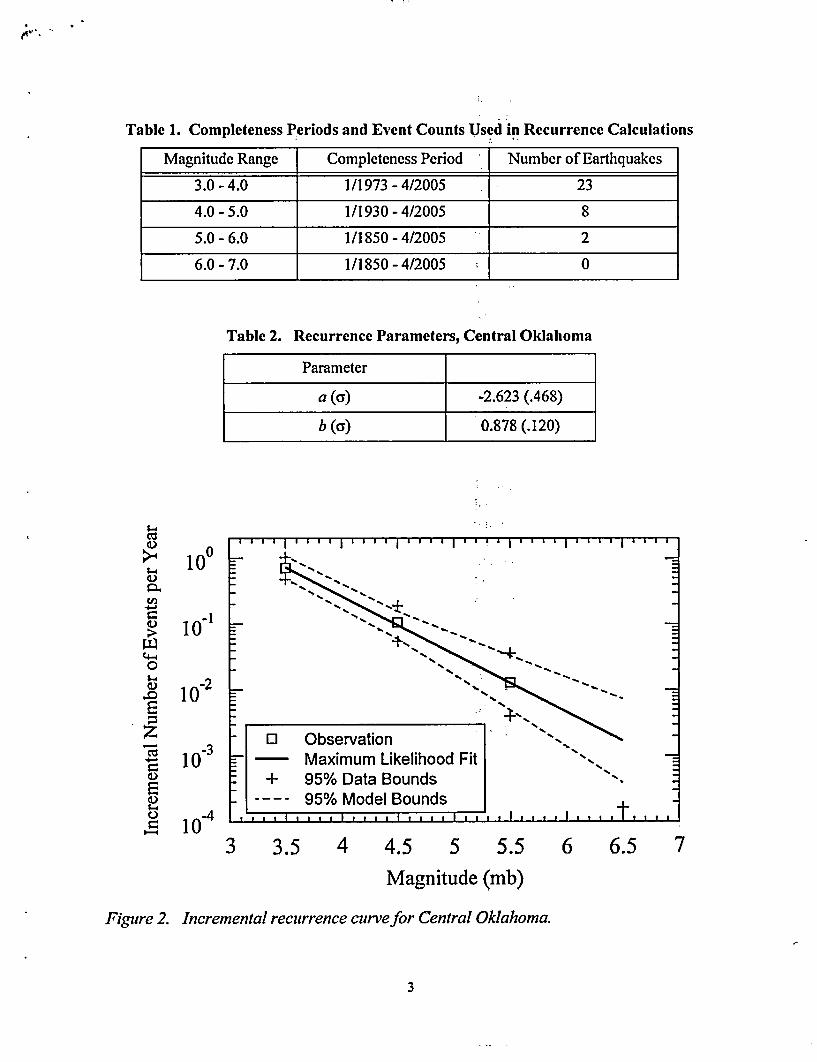
Table 1. Completeness Periods and Event Counts Used in Recurrence Calculations
Magnitude Range Completeness Period Number of Earthquakes
3.0 - 4.0 1/1973 - 4/2005 23
4.0 - 5.0 1/1930 - 4/2005 8
5.0 - 6.0 1/1850 - 4/2005 2
6.0 - 7.0 1/1850 - 4/2005 0
Table 2. Recurrence Parameters, Central Oklahoma
Parameter
a (a) -2.623 (.468)
b (ay) 0.878 (.120)
S.--
Ca
0.-1
S--zEn
S-i
CD
I I I I I I I I I I I I I 6 I A I I I I A 1-1 I I I I I I I I I I I I I
100
10-1
102
10-3
.
o1 Observation- Maximum Likelihood Fit
+ 95% Data Bounds95% Model Bounds
% -1
-
I: I I ., .. t.II .I I I I I I I i ~ II , i i
3 3.5 4 4.5 5 5.5Magnitude (mb)
6 6.5 7
Figure 2. Incremental recurrence curvefor Central Oklahoma.
3
An incremental recurrence curve was fit to the data, using the maximum likelihood method asoutlined in Weichert (1980). Rate uncertainties were computed as described in Bollinger et al.(1989). Parameter values in the Gutenberg-Richter relation, Log(N) = a - b (M) (where a is thenumber of events greater than or equal to magnitude M), and their uncertainties are shown inTable 2. The incremental curve is shown in Figure 2. The a values have been normalized to km2/yr. The areal zone encompasses 151,495 km.
3.0 Probabilistic Seismic Hazard Analysis
The probabilistic seismic hazard analysis (PSHA) conducted follows the basic precepts outlinedin Cornell (1968). The calculations were performed with the mrs (multiple random sources) pro-grams, developed by the U.S. Bureau of Reclamation (LaForge, 2001). Two attenuation functionswere used; Toro et al. (1997), and Boore and Atkinson (1995). Both were developed for easternNorth America crustal conditions. A third relation developed by Frankel (1996) gives results verysimilar to Toro et al. (1997).i Because there appears to be no basis for choosli~iinne relation overthe other, the Toro et al. (1997) relation was weighted .67; anid iEB6ore&e and Atkinson (1995)relation .33. At the site, shear wave velocites in the upper 10 m were m' asiiidic be greater than670 m/s, and greater than 133&h/s at deeper depths, placing the site conditions at NEHRP B andA, respectively (R. Stern, MFG, Inc., personal comm., 2005). The attenuation functions used areappropriate for these conditions.
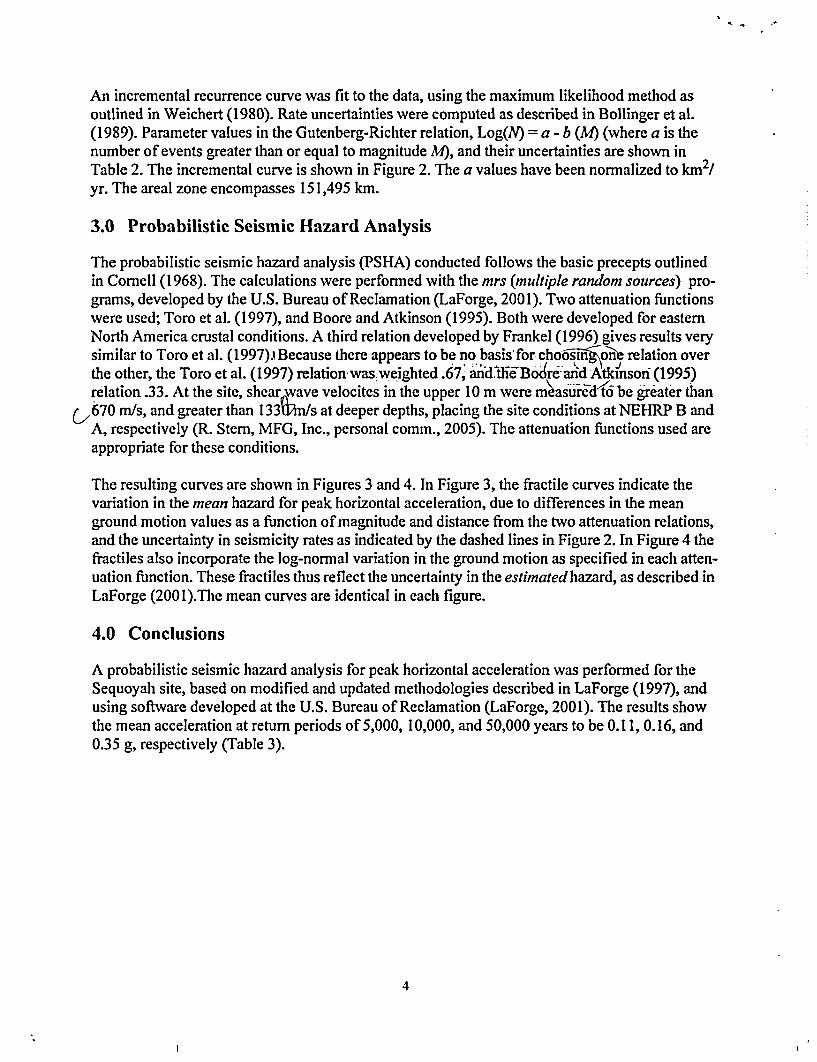
The resulting curves are shown in Figures 3 and 4. In Figure 3, the fractile curves indicate thevariation in the mean hazard for peak horizontal acceleration, due to differences in the meanground motion values as a function of magnitude and distance from the two attenuation relations,and the uncertainty in seismicity rates as indicated by the dashed lines in Figure 2. In Figure 4 thefractiles also incorporate the log-normal variation in the ground motion as specified in each atten-uation function. These fractiles thus reflect the uncertainty in the estimated hazard, as described inLaForge (2001).The mean curves are identical in each figure.
4.0 Conclusions
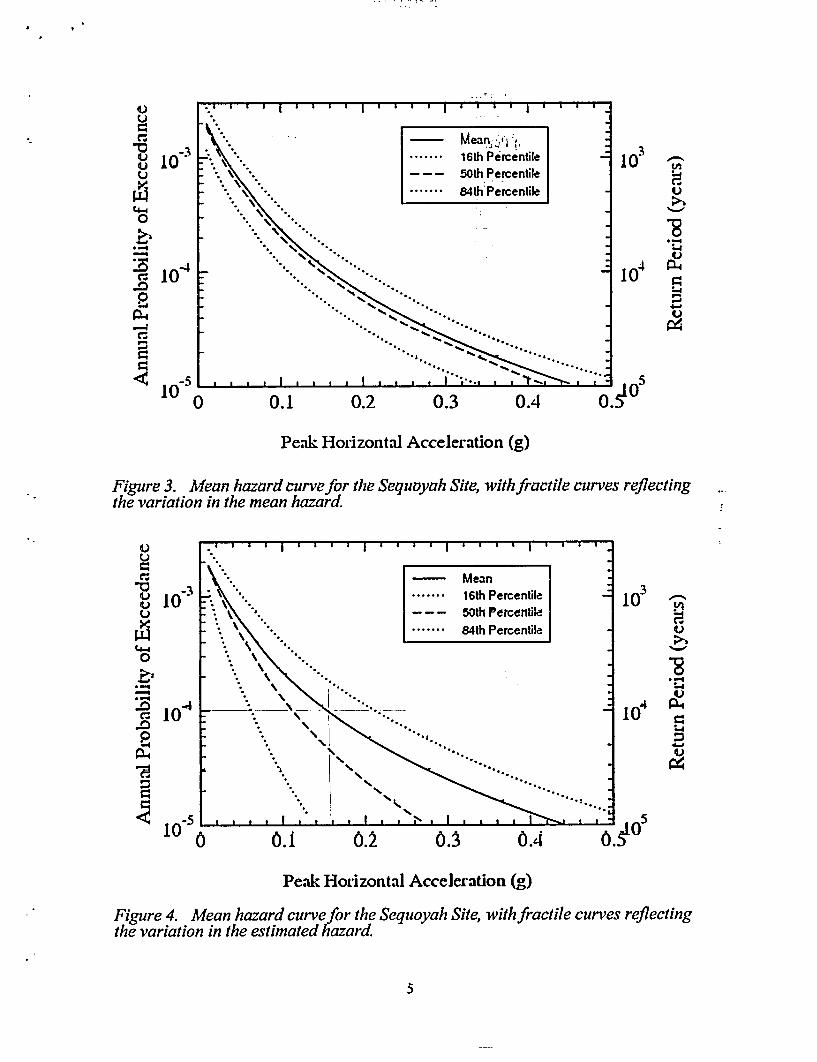
A probabilistic seismic hazard analysis for peak horizontal acceleration was performed for theSequoyah site, based on modified and updated methodologies described in LaForge (1997), andusing software developed at the U.S. Bureau of Reclamation (LaForge, 2001). The results showthe mean acceleration at return periods of 5,000, 10,000, and 50,000 years to be 0.11, 0.16, and0.35 g, respectively (Table 3).
4
. . .
UU
i-0
DP.I0
lo-3 10~ -i
I.-.
'8
-4
5A
O #05
0.1 0.2 0.3 0.4
Peak Horizontal Acceleration (g)
Figure 3. Mean hazard curvefor the Sequoyah Site, with fractile curves reflectingthe variation in the mean hazard.
UU
C.:
f 10U
414-40
---
c 10- D
48..
10- -
V._
10 m-4
78
O.1 0.2 0.3 0.4 .05
Peak Horizontal Acceleration (g)
Figure 4. Mean hazard curve for the Sequoyah Site, with fractile curves reflectingthe variation in the estimated hazard.
5
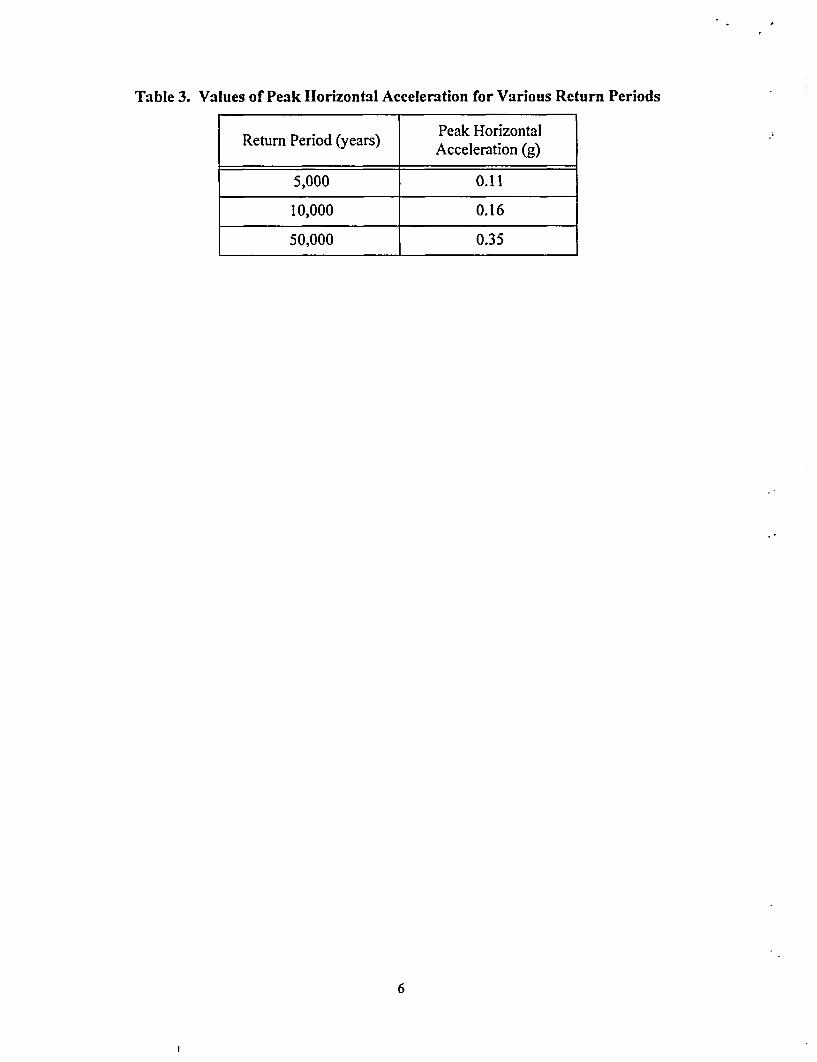
Table 3. Values of Peak Horizontal Acceleration for Various Return Periods
Peak HorizontalReturn Period (years) Acceleration (g)
5,000 0.11
10,000 0.16
50,000 0.35
6
5.0 References
Atkinson, G.M., and D.M. Boore (1995), Ground motion relations for eastern North America, Bulletin of the Seismo-logical Society of America, 85, 17-3 1.
Bollinger, G.A., F.C. Davison, M.S. Sibol, and J.B. Birch (1989), Magnitude recurrence relations for the southeasternUnited States and its subdivisions, Journal of Geophysical Research, 94, 2857-2873.
Cornell, C.A. (1968), Engineering seismic risk analysis, Bulletin of the Seismological Society of America, 58, 1583-1606.
Crone, A., and K.V. Luza (1990), Style and timing of Holocene surface faultingon the Meers fault, southwesternOklahoma, Geological Society of America Bulletin, 102, 1-17.
Engdahl, E.R. and W.A. Rinehart (1991), Seismicity Map of North America Project, in: Slemmons, D.B., Engdahl,E.R., Zoback, M.D., and Blackwell, D.D., eds., Neotectonics of North America: Geological Society of America,Boulder, Colorado, Decade map Volume 1.
Frankel, A., C. Mueller, T. Barnhard, D. Perkins, E. Leyendecker, N. Dickman, S. Hanson, and M. Hopper (1996),National seismic-hazard maps: documentation June 1966, U.S. Geological Survey Open-File Report 96-632.
LaForge, R (1997), Seismic hazard and ground motion analysis for Altus, Arbuckle, Fort Cobb, Foss, McGee Creek,Mountin Park, and Norman Dams, Oklahoma, Seismotectonic Report 97-1, U.S. Bureau of Reclamation, Den-ver, Colorado, 19 pp.
LaForge, R. (2001), mrs programs for site-specific probabilistic seismic hazard analysis for zones for random seis-micity, Technical Memorandum D8330-2001-13, U.S. Bureau of Reclamation, Denver, CO, 27 pp.
Luza, K.V. (1985), Oklahoma, in Seismicity and tectonic relationships of the the Nemaha Uplift and midcontinentgeophysical anomaly (Final Project summary), Oklahoma Geological Survey Special Publication 85-2, 14-20.
Swan, F.H., J.R. Wesling, K.A. Hanson, K.I. Kelson, and RC. Perman (1993), Investigation of the Quaternary struc-tural and tectonic character of the Meers fault, southwestern Oklahoma, Draft Report for U.S. Nuclear Regula-tory Commission, NRC-04-87-007, Geomatrix Consultants, 104 pp.
Toro, G.R., N.A. Abrahamson, and J.F. Schneider (1977), Model of of strong ground motions from earthquakes incentral and eastern North America: best estimates and uncertainties, Seismological Research Letters, 68, no. 1,41-58.
Weichert, D. (1980), Estimation of the earthquake recurrence parameters for unequal observation periods for differ-ent magnitudes, Bulletin of the Seismological Society of America, 70, 1337-1347.
7