Embed Size (px)
Citation preview

Sequential Vaccination for Containing Epidemics
Guy TennenholtzTechnion - Israel Institute of Technology
Constantine CaramanisThe University of Texas at Austin
Shie MannorTechnion - Israel Institute of Technology
The dynamics of infectious diseases spread is crucial in determining their risk and offering ways to contain
them. We study sequential vaccination of individuals in networks, where there is a limit on the number
of individuals that can be vaccinated every day. Effective allocation of vaccine will play a critical role in
preventing the spread and reducing the effects of a future pandemic. We derive methods for calculating upper
and lower bounds of the expected number of infected individuals, as well as provide estimates on the number
of vaccinations that is needed for containment. We calculate these explicitly on trees, d-dimensional grids,
and Erdos Renyi graphs. Finally, we construct a time-dependent budget allocation strategy and demonstrate
its superiority over constant budget allocation on real networks following first acquaintance vaccination. Our
results provide a principled approach to assess the needed vaccination rate given the social graph topology.
Keywords: Epidemics, Containment, COVID-19, coronavirus
1. Introduction
Consider an outbreak of a contagious disease such as the novel Corona virus or the seasonal flu.
Flu outbreaks happen every year and vary in severity, depending in part on what type of virus is
spreading. The influenza or flu pandemic of 1918 was the deadliest in modern history, infecting over
500 million people worldwide and killing 20-50 million victims. Between the years 2014-2016 West
Africa experienced the largest outbreak of Ebola in history, with multiple countries affected. A total
of 11,310 deaths were recorded in Guinea, Liberia, and Sierra Leone. Beginning in December 2019,
COVID-19, a new coronavirus, began appearing in China. COVID-19 was declared a pandemic in
March 2020, and by April 2020 over 1 million people around the globe had been infected by it.
With such pandemics, global connectedness may trigger a cascade of infections. The outbreaks of
Ebola and COVID-19 echo scenarios where long-range routes of transmission, most prominently
international air routes - can allow the deadliest viral strains to outrun their own extinction, and in
the process kill vastly more victims than they would have otherwise. The most dangerous pathogens
leave their hosts alive long enough to spread infection.
Although the overarching aim is to vaccinate all persons who choose to be vaccinated, prior to
the peak of disease, the vaccine supply to meet this goal may be insufficient early in a pandemic.
1
. CC-BY 4.0 International licenseIt is made available under a is the author/funder, who has granted medRxiv a license to display the preprint in perpetuity. (which was not certified by peer review)
The copyright holder for this preprint this version posted April 14, 2020. .https://doi.org/10.1101/2020.04.13.20060269doi: medRxiv preprint

Sequential Vaccination for Containing Epidemics2
Supplies for vaccinating the vast population may be scarce as opposed to the contagion speed.
For example, the vaccination may use antibodies that are extracted from recovered patients that
are scarce and expensive to produce, or the vaccination may hold potential risks for some of the
population. We consider immunization strategies that eliminate epidemic threats by vaccinating
parts of the population. Infections may propagate quickly and be discovered only at late stages of
propagation. Vaccination policies define rules for identifying individuals that should be made im-
mune to the spreading epidemic. Vaccinating such individuals may stop the spread of the epidemic
in what is sometimes referred to as “herd immunity”. In this paper we study sequential vaccination
policies that use full information on the infectious network’s state and topology, under vaccination
budget constraints.
The analysis of epidemic spreading in networks has produced results of practical importance,
but only recently the study of epidemic models under dynamic control has begun. The control of
epidemics has been extensively studied for the past two decades. The dynamic allocation of cure has
been studied in [1, 2, 3, 4, 5]. Studies of vaccine allocation in [6, 7, 8, 9, 10, 11, 12]. An optimization
strategy for optimal vaccine allocation is proposed in [7]. Their model assumes slightly modifiable
infection rates and a cost function based on a mean field approach. Information-driven vaccination
is studied in [9], showing the spread of the information will promote people to take preventive
measures and consequently suppress the epidemic spreading. It was also proposed to only vaccinate
those individuals with the most unvaccinated contacts [10]. An acquaintance immunization policy
was proposed in [6], where it was shown that such a policy is efficient in networks with broad-
degree distribution. A different approach [12], considers minimizing the social cost of an epidemic.
The above studies’ analysis is based on epidemic thresholds and mean-field approximations of the
evolution process. In contrast to these, this paper studies the transient, short-term behaviour of
the spreading epidemic.
Previous research on immunization policies modeled the problem either deterministically or
approximately, considering long-term effects alone. Defending against an attack of a virus must
take into account its transient behavior, fast propagation, as well as natural budget constraints
(e.g., limited rate in which vaccines can be allocated). It is thus vital to find on-line policies which
acknowledge short-term effects and the defender’s limited protection capabilities.
An assumption we make in the analysis is that the network structure is known. That is, it is
known when and how the nodes interact. For spreading pandemics such as the COVID-19, this
assumption is justified because of two reasons. First, interaction maps using cellular phones (either
through an app, or using information from the carrier) are available or can be made available in most
countries. Second, for the conclusions of this paper to hold, a simulated social interaction graph
that reflects the social interactions suffices to obtain credible results. Alleviating this assumption
. CC-BY 4.0 International licenseIt is made available under a is the author/funder, who has granted medRxiv a license to display the preprint in perpetuity. (which was not certified by peer review)
The copyright holder for this preprint this version posted April 14, 2020. .https://doi.org/10.1101/2020.04.13.20060269doi: medRxiv preprint

3
is possible, by, e.g., considering partial knowledge of the network structure, but we believe the
conclusions of this paper still hold even if this assumption is relieved.
We start by developing the mathematical machinery needed to characterize the spreading epi-
demic. We then consider criteria for containing an epidemic by constructing upper and lower
estimates on the vaccination budget needed to contain it. Finally we propose an algorithm for
state-dependent budget allocation, based on estimated local growth rate behavior of the network.
We show that this strategy achieves better containment on two real world networks, when com-
pared to a constant budget strategy which consumes an equal global budget. We conclude the
paper with insights on the COVID-19 pandemic.
2. Model
This section defines the model of our problem and the criteria we wish to optimize. We will dis-
tinguish between two different criteria. The first, and most natural criterion, considers minimizing
the number of infected individuals at the end of the infection process. As this criterion is hard to
optimize generally [13, 14], we consider an alternative criterion, which is ultimately easier to eval-
uate. The containment criterion asks the following question: What is the minimal budget needed
to ensure an infection won’t reach a certain size? This question can be answered immediately if
the first criterion is minimized, whereas knowing the latter does not give us the former. Strictly
speaking, this question may be more feasible to answer, and is thus the main focus of our work. In
regard to the optimality criterion, we provide upper and lower bounds on the number of infected
individuals.
We model the problem as a discrete SIR epidemic model, defined by parametersG (graph network
topology), p ∈ (0,1] (infection probability / speed), and b∈ {0,1,2,3, . . .} (vaccination budget per
stage). We consider a network, represented by an undirected graph G= (V,E), where V denotes
the set of nodes and E denotes the set of edges. Two nodes are said to be neighbors if (u, v) ∈E.
We use the notation u↔ v to denote neighboring nodes. We use n to denote the number of nodes
in G, and do not restrict ourselves to finite graphs.
Assume a spreading infection on G to be a discrete time contact process. An infected node infects
each of its healthy neighbors with probability p. The state of the infection at time t is defined by
the pair st = (It,Bt), where It and Bt denote the set of infected and vaccinated nodes at time t,
respectively. At all times, It ∩Bt = ∅ (i.e., a node can either be healthy, infected, or vaccinated).
The process st is initialized at some given state s0 = (I0,B0) with transitions occurring inde-
pendently according to the following dynamics. If a node i is infected, it remains infected forever.
This can be thought of as an epidemic in which all infected individuals eventually die. If a node
i is vaccinated, it remains vaccinated forever. If a node i is healthy at time t, then node i stays
. CC-BY 4.0 International licenseIt is made available under a is the author/funder, who has granted medRxiv a license to display the preprint in perpetuity. (which was not certified by peer review)
The copyright holder for this preprint this version posted April 14, 2020. .https://doi.org/10.1101/2020.04.13.20060269doi: medRxiv preprint
Sequential Vaccination for Containing Epidemics4
healthy at time t+ 1 with probability qi,t, where qi,t = (1− p)|{j:i↔j,j∈It}|. Informally, the first two
conditions mean that nodes remain in their infected or vaccinated states at all times. The last
condition means that at each iteration nodes infect each of their healthy neighbors independently
with probability p.
A stationary control policy π(s)∈ {0,1}V determines at each state s= (I,B) what set of healthy
nodes to vaccinate. Once a set of nodes is chosen to be vaccinated they are added to B. We impose
a budget constraint of the form
|π(s)| ≤ b.
2.1. Criterion for Containment
We define an optimal policy as one which minimizes the expected number of infected individuals.
Formally, for an initial state s0 = (I0,B0), the expected loss of a policy π given a budget b is defined
by
Lπb (s0) = limsupT→∞
Eπ(1
T
T∑t=0
|It| |s0),
where Eπ denotes the expected value induced by the vaccination policy. The optimal loss is then
given by
L∗b (s0) = infπLπb (s0) ,
When it exists, we define the optimal vaccination policy π∗ by
π∗ ∈ arg minπ
Lπb (s0) .
We are now ready to define our notion of containment. Given a maximal number of infected
individuals (i.e., a worst-case “acceptable” loss), we ask, is a budget b sufficient to ensure an infec-
tion does not grow to be larger than some given value? Specifically, given a threshold θ ∈N∪{∞},
we wish to find a minimal budget such that L∗b (I0)≤ θ when θ <∞, or L∗b (I0)<∞ when θ =∞.
We define containment formally below.
Definition 2.1. Let θ ∈N∪ {∞}. Let G= (V,E) be a graph on n nodes, and s0 = (I0,B0) be an
initial state. When θ <∞, we say that b contains I0 in θ if L∗b(I0)≤ θ. When θ =∞, we say that
b contains I0 if L∗b(I0)<∞.
Definition 2.2. We say that bθ is a weak upper bound if for any b > bθ, b contains
I0 in θ. We say that bθ is a weak lower bound if for any b < bθ, b does not con-
tain I0 in θ. We say bθ is a tight bound if bθ is both a weak upper and lower bound.
We define equivalently for the case of θ=∞ and denote the containment bound by b∞.
. CC-BY 4.0 International licenseIt is made available under a is the author/funder, who has granted medRxiv a license to display the preprint in perpetuity. (which was not certified by peer review)
The copyright holder for this preprint this version posted April 14, 2020. .https://doi.org/10.1101/2020.04.13.20060269doi: medRxiv preprint

5
3. Preliminaries
We use the notation [ z ]+ for any z ∈R to denote the positive part of z. We denote the set of edges
in a graph by E and use the notation u↔ v to denote (u, v) ∈ E. We denote by ∆ the maximal
node degree in a given graph. The number of neighbors of a set of nodes is defined to be the number
of connected nodes to that set, and is denoted by N(A) for some A⊂ V . In a similar way, for a
state s= (I,B), its neighborhood is defined as the set of nodes N(s) =N(I)\B.
Another important measure for sets is their cuts. A cut of a set of nodes in a graph is defined
to be the number of edges exiting the set. For any two sets A,B and a node v, the cut from
A to v is defined by cut (A,v) = |{(u, v)∈E : u∈A}| . The cut from A to B is then defined by
cut (A,B) =∑
v∈B cut (A,v) . We can then define the cut of A as the cut from A to N(A), that is,
cut (A) = cut (A,N(A)) . Equivalently, for a state s= (I,B) and node v ∈N(s), the cut from s to
v is defined by
cut (s, v) = |{(u, v)∈E : u∈ I}| ,
and the cut of s by cut (s) = cut (I,N(s)) =∑
v∈N(s) cut (s, v) .
4. Growth Rate
This section develops the required machinery for developing upper and lower bounds on the optimal
loss. These bounds enable us to answer questions regarding containment objective. We define the
notion of the growth rate. Informally, the growth rate of an infection at time t is the expected
cardinality growth of It between time t and t+ 1. That is, if we denote by GRt the growth rate at
time t, then
E(|It+1| |st) = |It|+GRt.
The growth rate thus changes at each time step t. Intuitively, a good policy would (1) maintain
a small growth rate throughout the propagation of the infection and (2) bring the growth rate to
zero as quickly as possible. We define the notion of the growth rate formally below.
Definition 4.1. The growth rate of a set A to a set B for infection speed p is defined by
GRp (A,B) =∑v∈B
(1− (1− p)cut(A,v)
). (1)
The growth rate of a set A is defined using equation (1) as GRp (A) =GRp (A,N(A)). Equivalently,
we define the growth rate of a state s= (I,B) to be GRp (s) =GRp (I,N(s)).
The growth rate of a state s= (I,B), GRp (s), takes into account the vaccinated set of nodes B.
It can be useful to write it using the growth rate for sets in the following way:
GRp (s) =∑
v∈N(s)
(1− (1− p)cut(I,v)
)=
∑v∈N(I)\B
(1− (1− p)cut(I,v)
)=∑
v∈N(I)
(1− (1− p)cut(I,v)
)−∑v∈B
(1− (1− p)cut(I,v)
)=GRp (I)−GRp (I,B) .
. CC-BY 4.0 International licenseIt is made available under a is the author/funder, who has granted medRxiv a license to display the preprint in perpetuity. (which was not certified by peer review)
The copyright holder for this preprint this version posted April 14, 2020. .https://doi.org/10.1101/2020.04.13.20060269doi: medRxiv preprint
Sequential Vaccination for Containing Epidemics6
(a) (b) (c) (d)
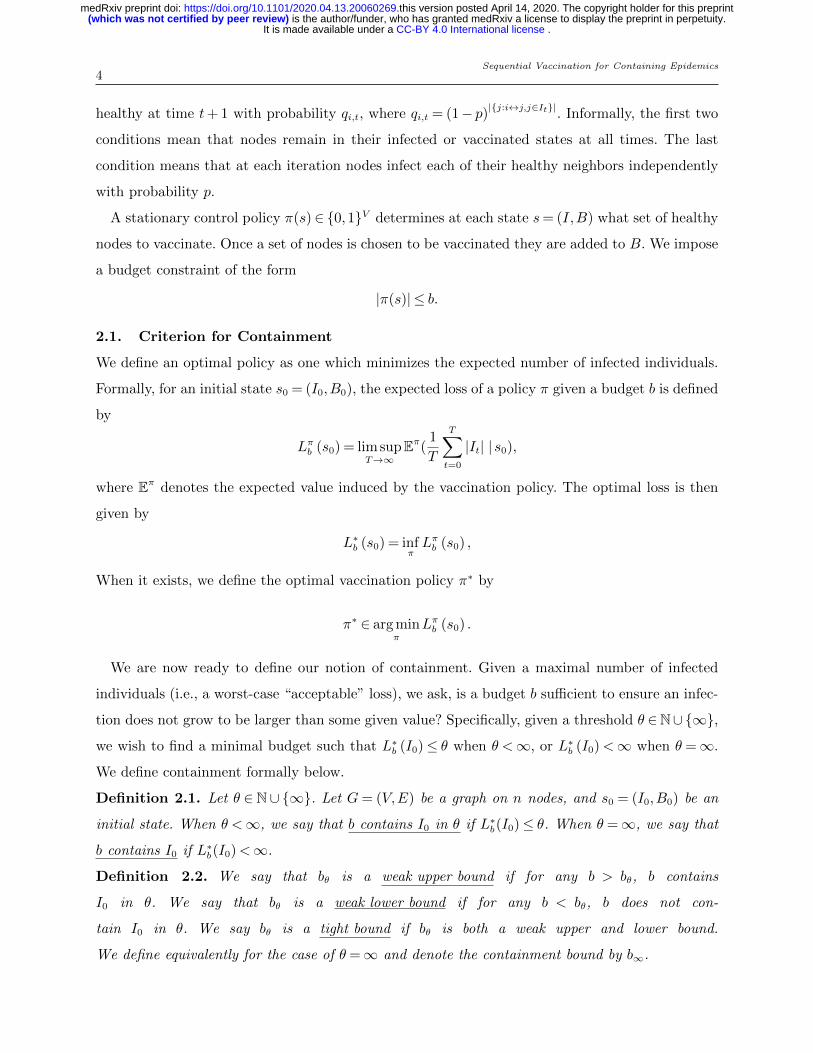
(e) (f) (g) (h)Figure 1 (a-d) An example of an upward crusade u ∈ U∅
3 , where I0 = {4,5}. The sequence depicted
is u= (({4,5} ,∅) , ({4,5,6} ,∅) , ({3,4,5,6,8} ,∅) , ({3,4,5,6,7,8} ,∅)). Throughout the whole sequence,
b = 0 and Bt = ∅. (e-h) An example of an upward crusade u ∈ Uπ,s3 of some policy πΠ
under a budget of b = 1, and s = (I,∅), where I = {4,5}. The sequence depicted is u =
(({4,5} ,{∅}) , ({3,4,5,6} ,{7}) , ({3,4,5,6} ,{2,7}) , ({3,4,5,6} ,{2,7,8})). Note that between states s2
and s3, the infected set does not change.
The notion of growth rates takes into account both the topological structure as well as the ever
changing set of vaccinated individuals. It is thus a key characteristic of a spreading epidemic. Due
to its complex nature, we look for ways to approximate it, as discussed next.
4.1. Maximal and Minimal Growth Rates over Upward Crusades
Growth rates give us a tool for measuring the expected growth of an infection at a time t. We
consider the full propagation of the epidemic using the notion of maximal and minimal growth
rates. These tell us how large or how small the growth rate can be under a specific policy in a given
time window. This is done by considering all possible future scenarios of infection and vaccination
under a given policy. We then find representative worst, best, and average case scenarios. Formally,
we start by defining upward crusades as sequences of possible states under a given policy. We then
define the maximal and minimal growth rates as the worst and best case growth rates over all
possible sequences.
An upward crusade is a sequence of infection states which follow all possible realizations of
infections starting at some initial state s0 under some policy π.
Definition 4.2. For a state s= (I,B) and policy π, an upward crusade of length k is a sequence
u= (s0, . . . , sk) of k+ 1 pairs (states), si = (Ii,Bi), with the following properties:
1. s0 = s
2. Ii\Ii−1 ⊆N(Ii−1)\Bi, for i= 1 . . . k
3. Bi\Bi−1 = π(si−1), for i= 1 . . . k
. CC-BY 4.0 International licenseIt is made available under a is the author/funder, who has granted medRxiv a license to display the preprint in perpetuity. (which was not certified by peer review)
The copyright holder for this preprint this version posted April 14, 2020. .https://doi.org/10.1101/2020.04.13.20060269doi: medRxiv preprint
7
(a) (b)
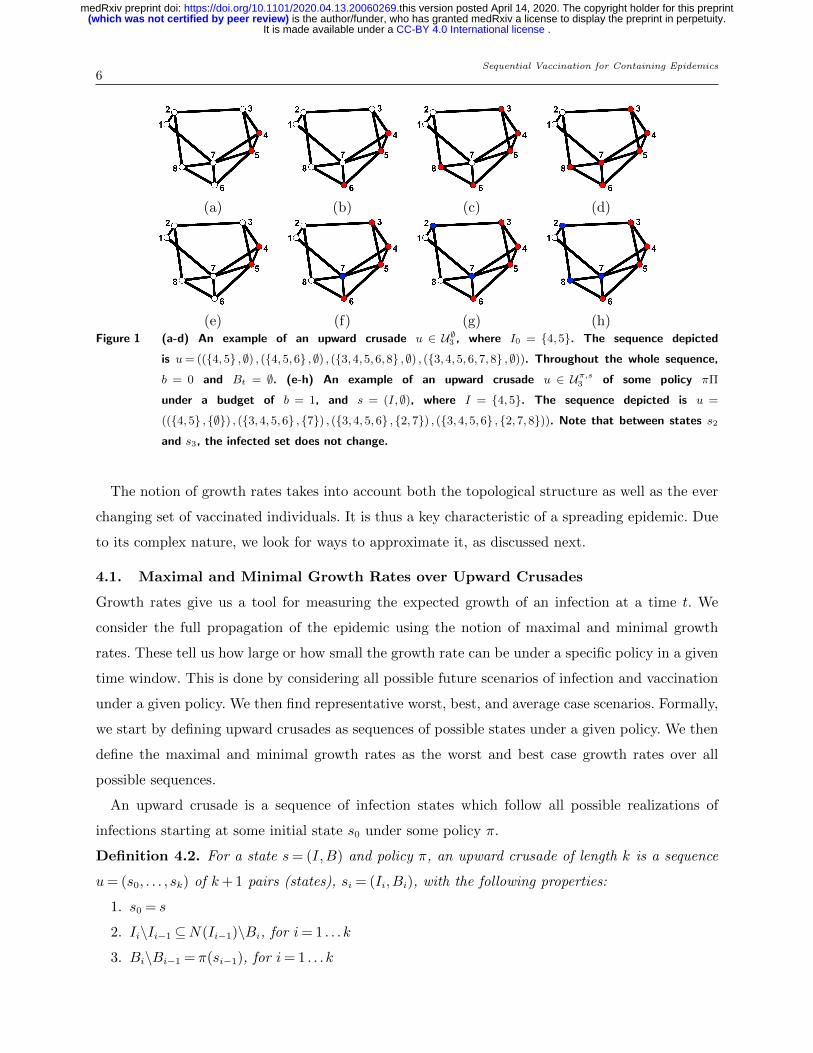
Figure 2 (a) A sample graph of an Erdos-Renyi model G(n, s), with parameters n= 100, s= 0.1 with diameter 3.
(b) Plots of MGR 12
(z,UI0100
)(in blue), mgr 1
2
(z,UI0100
)(in red), and EGR 1
2
(z,UI0100
)(in green) as
functions of z, with I0 = {1}. Estimates were made using Monte Carlo simulations (see Section 6 for
details).
We denote the final state of the sequence by uk. We also denote the set of all upward crusades of
length k initiating at a state s by Uπ,sk . Figure 1 depicts examples of upward crusades on a simple
graph.
Indeed, upward crusades consider all possible futures of a spreading epidemic given a vaccination
policy π. Following the definition of upward crusades, the maximal growth rate looks k steps into
the future, until the point when an infection of cardinality c is reached under some policy π. It
then returns the worst case growth rate over all corresponding upward crusades. A similar idea
follows for the minimal and expected growth rates, as defined formally bellow.
Definition 4.3 (Maximal and Minimal Growth Rates). Given a policy π, a state s, and the
set of upward crusades of length k, Uπ,sk , the maximal and minimal growth rates are functions
MGR,mgr : {1, . . . , |V |}×UΠ,sk →R+, defined by
MGRp (c,Uπ,sk ) = maxu∈Uπ,s
kuk∈Sc
GRp (uk) , mgrp (c,Uπ,sk ) = minu∈Uπ,s
kuk∈Sc
GRp (uk) ,
where Sc = {s= (I,B) : |I|= c}, and recall that uk denotes the final state in an upward crusade u.
In other words, the maximum / minimum growth rates maximize the growth rate over all states
that end upward crusades in Uπ,sk and have infection cardinality c.
Definition 4.4 (Expected Growth Rate). Given a policy πΠ, a state s, and the set of upward
crusades of length k, Uπ,sk , the expected growth rate is a function EGR : UΠ,sk →R+, defined by
EGRp (c,Uπ,sk ) =Eπ(GRp (sk) | |Ik|= c, s0 = s) =
∫|Ik|=c
GRp (uk)dFuk ,
where uk = (Ik,Bk) is the random variable of the final state in upward crusades of Uπ,sk , such that
the integral is taken over final states with cardinality |Ik|= c.
. CC-BY 4.0 International licenseIt is made available under a is the author/funder, who has granted medRxiv a license to display the preprint in perpetuity. (which was not certified by peer review)
The copyright holder for this preprint this version posted April 14, 2020. .https://doi.org/10.1101/2020.04.13.20060269doi: medRxiv preprint
Sequential Vaccination for Containing Epidemics8
It is helpful to consider maximal, minimal, and expected growth rates of an empty policy which
does not vaccinate any nodes. We will denote these using upward crusades U∅k in place of Uπ,sk
to emphasize the fact the maximum/minimum/expectation is taken over crusades which do not
vaccinate any nodes (i.e., b= 0).
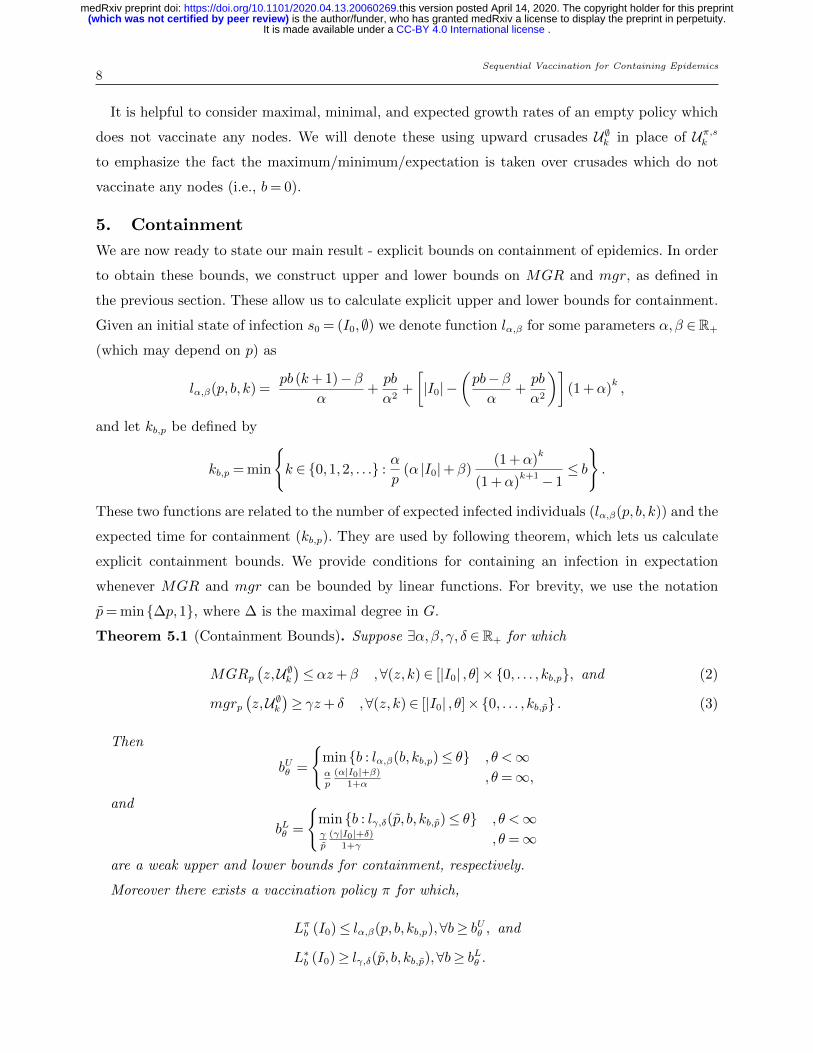
5. Containment
We are now ready to state our main result - explicit bounds on containment of epidemics. In order
to obtain these bounds, we construct upper and lower bounds on MGR and mgr, as defined in
the previous section. These allow us to calculate explicit upper and lower bounds for containment.
Given an initial state of infection s0 = (I0,∅) we denote function lα,β for some parameters α,β ∈R+
(which may depend on p) as
lα,β(p, b, k) =pb (k+ 1)−β
α+pb
α2+
[|I0| −
(pb−βα
+pb
α2
)](1 +α)
k,
and let kb,p be defined by
kb,p = min
{k ∈ {0,1,2, . . .} :
α
p(α |I0|+β)
(1 +α)k
(1 +α)k+1− 1
≤ b
}.
These two functions are related to the number of expected infected individuals (lα,β(p, b, k)) and the
expected time for containment (kb,p). They are used by following theorem, which lets us calculate
explicit containment bounds. We provide conditions for containing an infection in expectation
whenever MGR and mgr can be bounded by linear functions. For brevity, we use the notation
p= min{∆p,1}, where ∆ is the maximal degree in G.
Theorem 5.1 (Containment Bounds). Suppose ∃α,β, γ, δ ∈R+ for which
MGRp(z,U∅k
)≤ αz+β ,∀(z, k)∈ [|I0| , θ]×{0, . . . , kb,p}, and (2)
mgrp(z,U∅k
)≥ γz+ δ ,∀(z, k)∈ [|I0| , θ]×{0, . . . , kb,p} . (3)
Then
bUθ =
{min{b : lα,β(b, kb,p)≤ θ} , θ <∞αp
(α|I0|+β)
1+α, θ=∞,
and
bLθ =
{min{b : lγ,δ(p, b, kb,p)≤ θ} , θ <∞γp
(γ|I0|+δ)1+γ
, θ=∞
are a weak upper and lower bounds for containment, respectively.
Moreover there exists a vaccination policy π for which,
Lπb (I0)≤ lα,β(p, b, kb,p),∀b≥ bUθ , and
L∗b (I0)≥ lγ,δ(p, b, kb,p),∀b≥ bLθ .
. CC-BY 4.0 International licenseIt is made available under a is the author/funder, who has granted medRxiv a license to display the preprint in perpetuity. (which was not certified by peer review)
The copyright holder for this preprint this version posted April 14, 2020. .https://doi.org/10.1101/2020.04.13.20060269doi: medRxiv preprint

9
Corollary 5.1. Suppose ∃α,β ∈R+ for which
EGRp(z,U∅k
)≤ αz+β ,∀(z, k)∈ [|I0| , θ]×{0, . . . , kb,p}, and (4)
EGRp(z,U∅k
)≥ γz+ δ ,∀(z, k)∈ [|I0| , θ]×{0, . . . , kb,p} . (5)
Then all of the results of Theorem 5.1 hold.
Note that the above theorem determines explicit upper and lower bounds for the budget needed
to contain an infection. The gap between bUθ and bLθ implies the error induced by the need to
approximate the growth rate statistics through affine upper and lower bounds. The lower this
gap, the more strict these bounds are, making the budget a necessary and sufficient condition for
containing an epidemic.
5.1. Obtaining Explicit Bounds
We look for explicit bounds in three regimes, including d-regular trees, d-dimensional grids, and
Erdos-Renyi random graphs graphs. While grids provide local connectivity, they lack long-range
connections. Grids characterize slow spreading epidemics with small neighborhood growth, through
contact networks that are very correlated with geography. Erdos-Renyi random graphs, on the
other hand, model the opposite extreme, in which all nodes are uniformly connected, modeling
large neighborhood contact networks. Finally, trees model exponential neighborhood growth. While
tree contact networks are rare, spreading epidemics are often locally tree-like.
We turn to find explicit bounds on these topologies. To achieve these bounds, we apply Theorem
5.1 on linear upper bounds for MGRp(z,U∅k
)and linear lower bounds for mgrp
(z,U∅k
). Exceptional
is the case of regular trees, where the maximal and minimal growth rates coincide with a linear
function, giving us tight bounds for containment.
5.1.1. D-Regular Trees The following tree gives a tight bound on mgr,MGR on regular
trees.
Theorem 5.2. Let T be a regular tree of degree d. Suppose I0 is a connected set such that root∈ I0.
Then
mgrp(z,U∅k
)=MGRp
(z,U∅k
)= p (z (d− 1) + 1)
Theorem 5.2 states that whenever root ∈ I0, the growth rate is equal to the maximal and min-
imal growth rates. Applying Theorem 5.1 for the case of root ∈ I0, we obtain a tight bound for
containment. Specifically, letting α= p(d− 1) and β = p, then
bθ =
{min
{b : lp(d−1),p(b, kb,p)≤ θ
}, θ <∞
p(d− 1) (d−1)|I0|+1
1+p(d−1), θ=∞
. CC-BY 4.0 International licenseIt is made available under a is the author/funder, who has granted medRxiv a license to display the preprint in perpetuity. (which was not certified by peer review)
The copyright holder for this preprint this version posted April 14, 2020. .https://doi.org/10.1101/2020.04.13.20060269doi: medRxiv preprint

Sequential Vaccination for Containing Epidemics10
is a tight containment bound. Moreover, we can obtain the exact number of expected infected indi-
viduals under such (optimal) vaccination strategy. Specifically, the number of expected individuals
is given by
L∗b (s0) = lα,β(p, b, kb,p),∀b≥ bθ.
Notice the special case of I0 = root and θ=∞ where the tight containment bound becomes
b∞ =d
1 + 1p(d−1)
.
This result is non-trivial in the sense that as p decreases, a budget lower than d (the degree of the
tree) is necessary in order to contain an infection initiated at the root. That is, when p 6= 1, even
if an infection cannot be stopped at its initial state, it can still be contained at a future state.
5.1.2. D-Dimensional Grid In a conjecture made in [15], a minimal budget b = 2d− 1 is
needed to contain a deterministic contact process starting at a single node on the d-dimensional
grid. This conjecture was later proven in [16]. In this section we prove a more general result.
Specifically, we obtain the minimal budget needed to contain an epidemic on the d-dimensional
grid, as provided by the following theorem.
Theorem 5.3. Let I0 be a connected set of initially infected nodes on the d-dimensional grid. We
have that
b∞ =4p(d− 1) ((d− 1) |I0|+ 1)
1 + 2p(d− 1), (6)
is a weak upper bound for containment.
Notice the special case of |I0|= 1 and p= 1. In this case we get that
b∞ =4d(d− 1)
2d− 1
is a weak upper bound for containment, which equivalently means an infection can be contained
for any b which satisfies
b≥⌈
4d(d− 1)
2d− 1
⌉=
⌈2d− 2 +
2d− 2
2d− 1
⌉= 2d− 1.
That is, Equation (6) proves the bound proven in [16] for a more general case of p < 1.
Next, we look for weak lower bounds for containment. In order to use Theorem 5.1, we must lower
bound mgr by a linear function. Unfortunately, on the d-dimensional grid, mgr is a concave, non-
monotonic function. One method to overcome this problem is to lower-bound mgr by a piecewise
linear function, enabling us to apply Theorem 5.1 recursively on finite intervals. Lemma 5.1 provides
such an affine, monotonically non-decreasing lower bound for mgr on the d-dimensional grid on a
finite interval.
. CC-BY 4.0 International licenseIt is made available under a is the author/funder, who has granted medRxiv a license to display the preprint in perpetuity. (which was not certified by peer review)
The copyright holder for this preprint this version posted April 14, 2020. .https://doi.org/10.1101/2020.04.13.20060269doi: medRxiv preprint

11
Lemma 5.1. Let G= (V,E) be a d-dimensional grid, and let a, θ ∈N with a< θ. Then
mgrp(c,U∅k
)≥ p (ma,θ(c− a) + νd(ra)) , c∈ {a, . . . , θ} ,
where
ν2(r) = 4r
νd(r) = νd−1(r) + 2
(1 +
r−1∑i=0
νd−1(i)
), d≥ 3.
ma,θ =νd(rθ)− νd(ra)∑rθ−1
i=ra−1 νd(i)and rz = min
{r : z ≤ 1 +
r−1∑i=0
νd(i)
}.
One can thus utilize Lemma 5.1 to estimate a weak lower bounds for containment on the d-
dimensional grid.
5.1.3. Erdos-Renyi We finally consider Erdos-Renyi random graphs. Let Gn,s be an Erdos-
Renyi model, where n denotes the number of nodes, and s the edge sampling probability. We have
the following result.
Theorem 5.4. Given an Erdos-Renyi model Gn,s with s= cn
for some constant c > 1,
b∞ =c2p
1 + cp|I0| .
is a weak upper bound for containment.
This containment bound is mainly due to the expected cut under an expected initialization of the
graph. We can view this result at two extreme cases. When cp� 1 the bound becomes b∞ = c |I0|.
This models very clustered networks with very quickly spreading epidemics. This condition can be
thought of as a worst case spreading epidemic. On the contrary, when cp� 1 the bound becomes
b∞ = c2p |I0|. This condition models a slowly spreading epidemic on a sparse contact network. This
can be thought of as a best-case scenario of a spreading epidemic. Indeed, a small vaccination
budget is needed to ensure containment.
Similar to the d-dimensional grid, the expected growth rate of an Erdos-Renyi graph is concave.
We therefore lower bound the expected growth rate by a piece wise linear function, as stated below.
Proposition 5.1. Let Gn,s be an Erdos-Renyi model. Then
EGRp(z,U Ik
)≥ gn(θmaxn )
θmaxn
pz,∀z ∈ {1, . . . , θmaxn } ,
where gn :N→R+ is defined by gn(z) = (n− z)(1−
(1− c
n
)z)and θmaxn = arg maxz∈N gn(z)
Proposition 5.1 gives us a method to compute a lower bound on EGR for Erdos-Renyi random
graphs. Applying Corollary 5.1 would thus provide us with lower bounds for containment.
. CC-BY 4.0 International licenseIt is made available under a is the author/funder, who has granted medRxiv a license to display the preprint in perpetuity. (which was not certified by peer review)
The copyright holder for this preprint this version posted April 14, 2020. .https://doi.org/10.1101/2020.04.13.20060269doi: medRxiv preprint
Sequential Vaccination for Containing Epidemics12
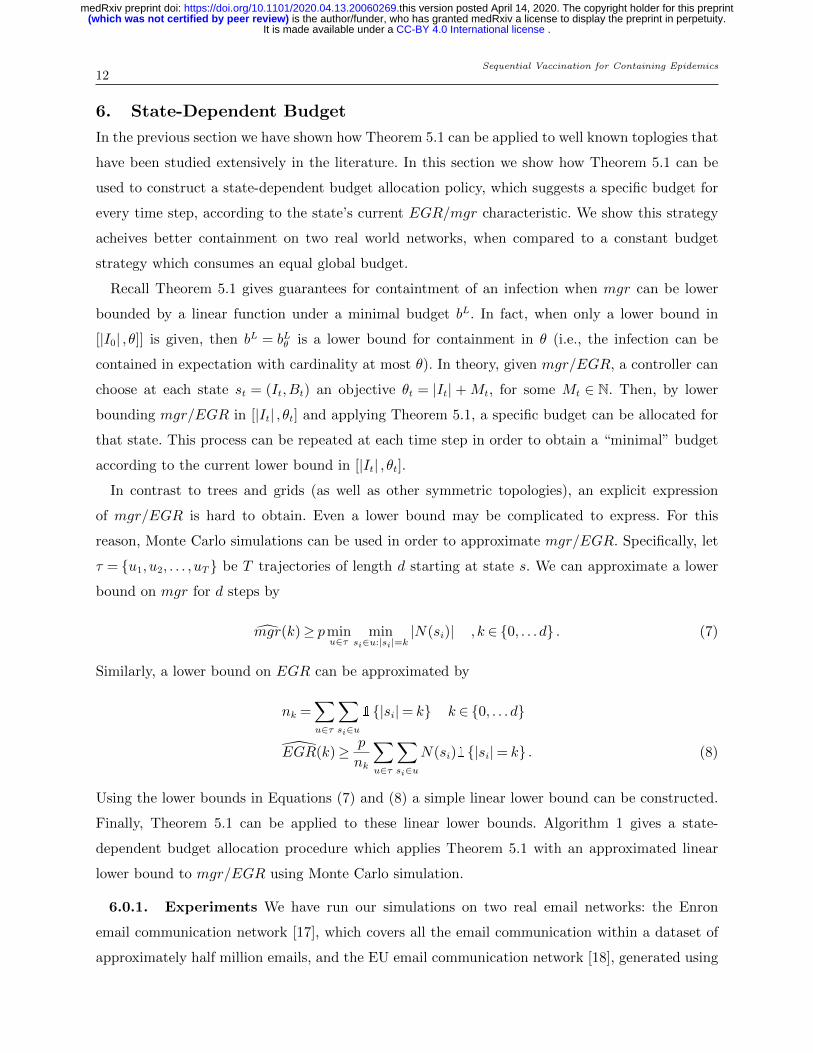
6. State-Dependent Budget
In the previous section we have shown how Theorem 5.1 can be applied to well known toplogies that
have been studied extensively in the literature. In this section we show how Theorem 5.1 can be
used to construct a state-dependent budget allocation policy, which suggests a specific budget for
every time step, according to the state’s current EGR/mgr characteristic. We show this strategy
acheives better containment on two real world networks, when compared to a constant budget
strategy which consumes an equal global budget.
Recall Theorem 5.1 gives guarantees for containtment of an infection when mgr can be lower
bounded by a linear function under a minimal budget bL. In fact, when only a lower bound in
[|I0| , θ]] is given, then bL = bLθ is a lower bound for containment in θ (i.e., the infection can be
contained in expectation with cardinality at most θ). In theory, given mgr/EGR, a controller can
choose at each state st = (It,Bt) an objective θt = |It| + Mt, for some Mt ∈ N. Then, by lower
bounding mgr/EGR in [|It| , θt] and applying Theorem 5.1, a specific budget can be allocated for
that state. This process can be repeated at each time step in order to obtain a “minimal” budget
according to the current lower bound in [|It| , θt].
In contrast to trees and grids (as well as other symmetric topologies), an explicit expression
of mgr/EGR is hard to obtain. Even a lower bound may be complicated to express. For this
reason, Monte Carlo simulations can be used in order to approximate mgr/EGR. Specifically, let
τ = {u1, u2, . . . , uT} be T trajectories of length d starting at state s. We can approximate a lower
bound on mgr for d steps by
mgr(k)≥ pminu∈τ
minsi∈u:|si|=k
|N(si)| , k ∈ {0, . . . d} . (7)
Similarly, a lower bound on EGR can be approximated by
nk =∑u∈τ
∑si∈u
1{|si|= k} k ∈ {0, . . . d}
EGR(k)≥ p
nk
∑u∈τ
∑si∈u
N(si)1{|si|= k} . (8)
Using the lower bounds in Equations (7) and (8) a simple linear lower bound can be constructed.
Finally, Theorem 5.1 can be applied to these linear lower bounds. Algorithm 1 gives a state-
dependent budget allocation procedure which applies Theorem 5.1 with an approximated linear
lower bound to mgr/EGR using Monte Carlo simulation.
6.0.1. Experiments We have run our simulations on two real email networks: the Enron
email communication network [17], which covers all the email communication within a dataset of
approximately half million emails, and the EU email communication network [18], generated using
. CC-BY 4.0 International licenseIt is made available under a is the author/funder, who has granted medRxiv a license to display the preprint in perpetuity. (which was not certified by peer review)
The copyright holder for this preprint this version posted April 14, 2020. .https://doi.org/10.1101/2020.04.13.20060269doi: medRxiv preprint
13
Algorithm 1: State Dependent Budget Allocation
Input: state s= (I,B), infection rate p, lower bound type type.
Output: Budget b(s)
τ ← Sample T trajectories of d iterations each starting at state s with zero budget.;
∆← MaxDegree(τ);
p←min{1, ∆p};
for k ∈ {|I| , . . . |V |} doif type=”mgr” then
LB(k, τ)← pminu∈τ
minsi∈u:|si|=k
|N(si)| ;
else if type=”EGR” thennk←
∑u∈τ∑
si∈u1{|si|= k} ;
LB(k, τ)← pnk
∑u∈τ∑
si∈uN(si)1{|si|= k} ;
end
θ← arg maxk>|I| LB(k, τ);
α← LB(θ,τ)−LB(|I|,τ)
θ−|I| ;
β← LB(|I| , τ);
Solve for b: min b : lα,β(p, b, kb,p)≤ θ;
return b
Nodes EdgesNodes inlargestWWC
Nodes inlargestSSC
Averageclusteringcoefficient
Number oftriangles
Diameter
Enron 36692 183831 33696 33696 0.4970 727044 11EU 265214 420045 224832 34203 0.0671 267313 14
Table 1 Dataset statistics of the Enron and EU email networks.
email data from a large European research institution for a period of 18 months. In part, using
email networks is motivated by the fact that many computer viruses spread by email attachments.
We have chosen to test our algorithm on these networks due to their broad degree distributions.
In our simulations we have used the a first-acquaintance policy which attempts to minimize the
growth rate by minimizing the cut of the current infection, i.e., πCUT (s)∈ arg min{cut (s)} .
Results of our simulations are plotted in Figure 3. Statistical data on the two networks in provided
in Table 1. In all of our experiments we picked starting nodes uniformly at random 1. We averaged
the results over 100 uniform samples of initial states. We used initial cardinalities of 2000 for the
Enron network and 5000 for the EU network. Each sample was run 30 times. We’ve tested lower
1 Choosing sources in a realistic way is an open problem - the data that could offer a solution to this problem seemsto be extremely scarce at this time.
. CC-BY 4.0 International licenseIt is made available under a is the author/funder, who has granted medRxiv a license to display the preprint in perpetuity. (which was not certified by peer review)
The copyright holder for this preprint this version posted April 14, 2020. .https://doi.org/10.1101/2020.04.13.20060269doi: medRxiv preprint
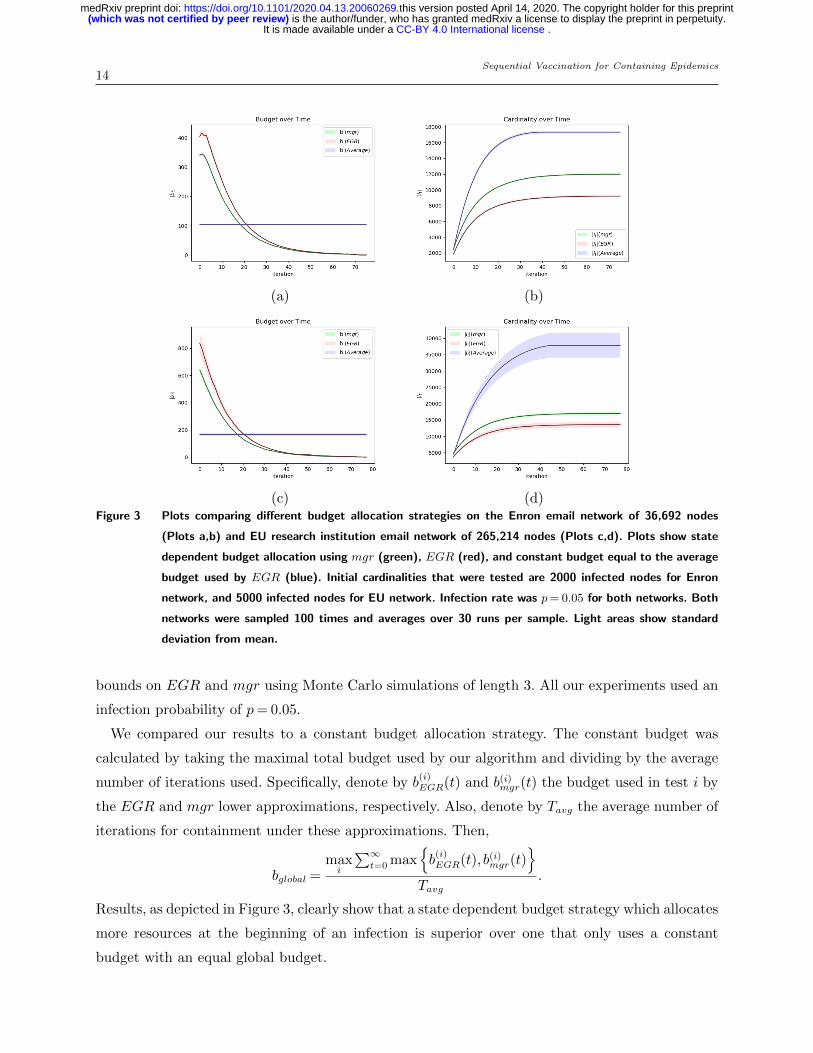
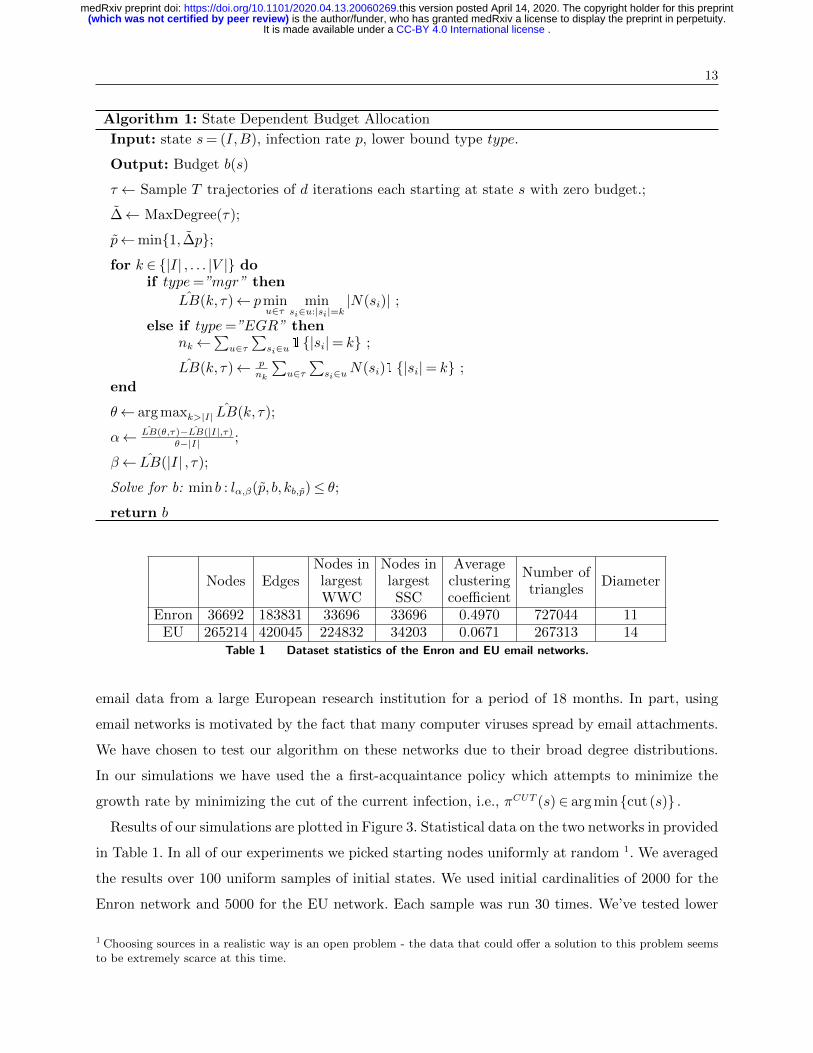
Sequential Vaccination for Containing Epidemics14
(a) (b)
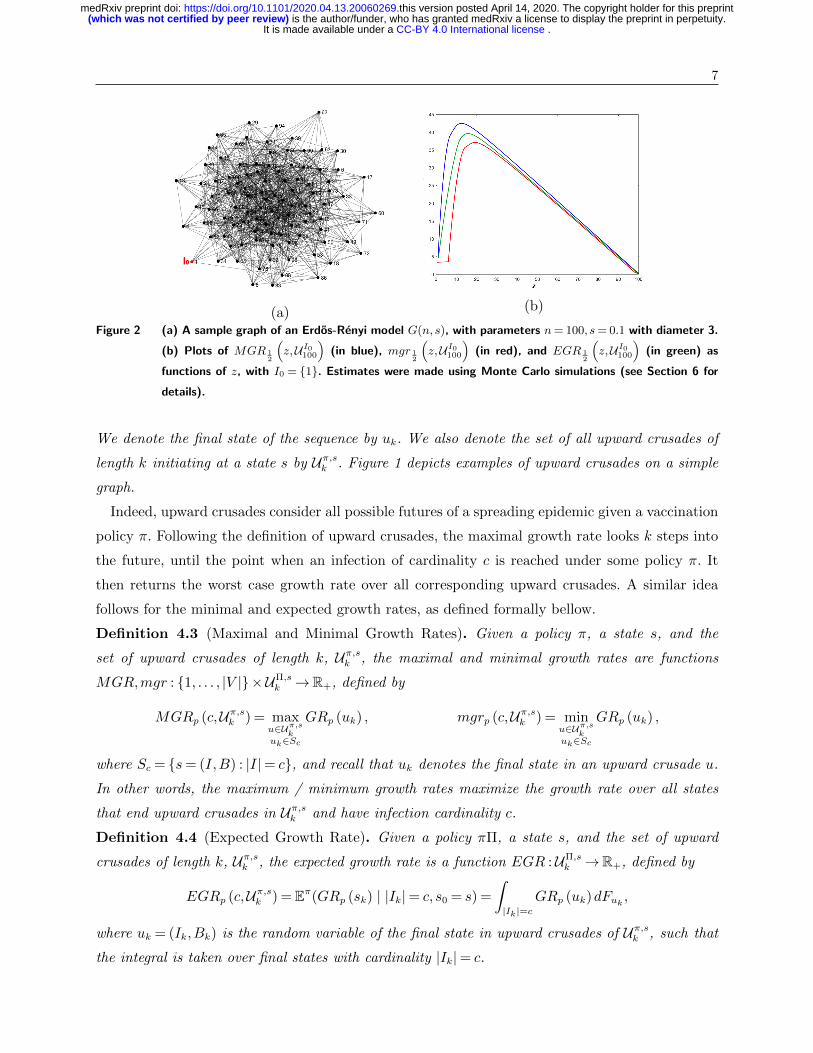
(c) (d)Figure 3 Plots comparing different budget allocation strategies on the Enron email network of 36,692 nodes
(Plots a,b) and EU research institution email network of 265,214 nodes (Plots c,d). Plots show state
dependent budget allocation using mgr (green), EGR (red), and constant budget equal to the average
budget used by EGR (blue). Initial cardinalities that were tested are 2000 infected nodes for Enron
network, and 5000 infected nodes for EU network. Infection rate was p= 0.05 for both networks. Both
networks were sampled 100 times and averages over 30 runs per sample. Light areas show standard
deviation from mean.
bounds on EGR and mgr using Monte Carlo simulations of length 3. All our experiments used an
infection probability of p= 0.05.
We compared our results to a constant budget allocation strategy. The constant budget was
calculated by taking the maximal total budget used by our algorithm and dividing by the average
number of iterations used. Specifically, denote by b(i)EGR(t) and b(i)
mgr(t) the budget used in test i by
the EGR and mgr lower approximations, respectively. Also, denote by Tavg the average number of
iterations for containment under these approximations. Then,
bglobal =maxi
∑∞t=0 max
{b
(i)EGR(t), b(i)
mgr(t)}
Tavg.
Results, as depicted in Figure 3, clearly show that a state dependent budget strategy which allocates
more resources at the beginning of an infection is superior over one that only uses a constant
budget with an equal global budget.
. CC-BY 4.0 International licenseIt is made available under a is the author/funder, who has granted medRxiv a license to display the preprint in perpetuity. (which was not certified by peer review)
The copyright holder for this preprint this version posted April 14, 2020. .https://doi.org/10.1101/2020.04.13.20060269doi: medRxiv preprint

15
7. Conclusion and Implications for the COVID-19 Outbreak
During the pandemic outbreak of COVID-19 in 2020, governments all over the world announced
movement restrictions which included remaining at home, reducing public transport, closure of
places of worship, schools, commercial/dining establishments, heritage sites, and parks/beaches.
Such restrictions altered the population connectivity graph’s topology, reducing connectivity, and
allowed for better control of the spreading epidemic. Nevertheless, such extreme measures threaten
to devastate economies and ramp up inequality. These losses would reverberate across societies,
impacting education, human rights and, in the most severe cases, basic food security and nutrition.
This work is focused on the question: Can containment be guaranteed in expectation with a
given vaccination budget? And conversely, when is the spread of an epidemic inevitable? We ob-
tained bounds for containment. These bounds tell us the minimal vaccination budget needed to
ensure containment of an epidemic, as well as the minimal budget under which an outbreak would
occur. In Section 6 we constructed an algorithm that uses lower bounds on mgr/EGR for state
dependent budget allocation. We tested this algorithm using a first acquaintance vaccination policy
suggesting such budget allocation strategy outperforms constant budget allocation with an equal
global budget.
It is clear from our results that the graph’s topology has a tremendous effect on the number of
infected nodes as well as our ability to contain it. D-dimensional grids represents contact graphs
in which an infection can spread by spatial proximity. They model infection spreads such as a
Bluetooth virus or human sickness. On the other hand, Erdos-Renyi random graphs form networks
with low diameter. This topology models an infection spreading over long distance, such as the
Internet or over most “normal” social networks. We provide a method for relating the topology of
the graph to the minimal budget needed for containment. We can assess the average degree needed
to manage an epidemic under limited vaccination resources using an Erdos-Renyi model or a grid
model. This insight may allow governments to mitigate Draconian closure laws that could have
calamitous effects on society.
Our results suggest that the concept of “herd immunity”, advocated by some, depends critically
on the degree of the connectedness of the society. If the ties of the society are weak enough, then
immunity by a relatively small fraction of society would suffice for the epidemic to die out. Our
containment bounds are also beneficial for preserving resources including the number of needed
vaccines, the rate in which they must be administered, as well as required personnel for administer-
ing vaccines. Assuming governments have a certain capacity of controlling infected individuals, our
upper bounds for containment may give the needed insight for saving resources, while preventing
hospital overloads, ventilator shortage, etc.
. CC-BY 4.0 International licenseIt is made available under a is the author/funder, who has granted medRxiv a license to display the preprint in perpetuity. (which was not certified by peer review)
The copyright holder for this preprint this version posted April 14, 2020. .https://doi.org/10.1101/2020.04.13.20060269doi: medRxiv preprint

Sequential Vaccination for Containing Epidemics16
References[1] Eric Gourdin, Jasmina Omic, and Piet Van Mieghem. Optimization of network protection against virus spread.
In Design of Reliable Communication Networks (DRCN), 2011 8th International Workshop on the, pages 86–93.IEEE, 2011.
[2] Fan Chung, Paul Horn, and Alexander Tsiatas. Distributing antidote using pagerank vectors. Internet Mathe-matics, 6(2):237–254, 2009.
[3] Christian Borgs, Jennifer Chayes, Ayalvadi Ganesh, and Amin Saberi. How to distribute antidote to controlepidemics. Random Structures & Algorithms, 37(2):204–222, 2010.
[4] Kimon Drakopoulos, Asuman Ozdaglar, and John N Tsitsiklis. An efficient curing policy for epidemics on graphs.Network Science and Engineering, IEEE Transactions on, 1(2):67–75, 2014.
[5] Kimon Drakopoulos, Asuman Ozdaglar, and John N Tsitsiklis. When is a network epidemic hard to eliminate?arXiv preprint arXiv:1510.06054, 2015.
[6] Reuven Cohen, Shlomo Havlin, and Daniel Ben-Avraham. Efficient immunization strategies for computer net-works and populations. Physical review letters, 91(24):247901, 2003.
[7] Victor M Preciado, Michael Zargham, Chinwendu Enyioha, Ali Jadbabaie, and George Pappas. Optimal vaccineallocation to control epidemic outbreaks in arbitrary networks. In Decision and Control (CDC), 2013 IEEE 52ndAnnual Conference on, pages 7486–7491. IEEE, 2013.
[8] Xiao-Long Peng, Xin-Jian Xu, Xinchu Fu, and Tao Zhou. Vaccination intervention on epidemic dynamics innetworks. Physical Review E, 87(2):022813, 2013.
[9] Zhongyuan Ruan, Ming Tang, and Zonghua Liu. Epidemic spreading with information-driven vaccination. Phys-ical Review E, 86(3):036117, 2012.
[10] Joel C Miller and James M Hyman. Effective vaccination strategies for realistic social networks. Physica A:Statistical Mechanics and its Applications, 386(2):780–785, 2007.
[11] Chengbin Peng, Xiaogang Jin, and Meixia Shi. Epidemic threshold and immunization on generalized networks.Physica A: Statistical Mechanics and its Applications, 389(3):549–560, 2010.
[12] Elizabeth Bodine-Baron, Subhonmesh Bose, Babak Hassibi, and Adam Wierman. Minimizing the social cost ofan epidemic. In Game Theory for Networks, pages 594–607. Springer, 2011.
[13] Bert Hartnell. Firefighter! an application of domination. In 25th Manitoba Conference on Combinatorial Math-ematics and Computing, University of Manitoba in Winnipeg, Canada, 1995.
[14] Gary MacGillivray and Ping Wang. On the firefighter problem. Journal of Combinatorial Mathematics andCombinatorial Computing, 47:83–96, 2003.
[15] Ping Wang and Stephanie A Moeller. Fire control on graphs. Journal of Combinatorial Mathematics and Com-binatorial Computing, 41:19–34, 2002.
[16] Weifan Wang, Stephen Finbow, and Ping Wang. The surviving rate of an infected network. Theoretical ComputerScience, 411(40):3651–3660, 2010.
[17] Bryan Klimt and Yiming Yang. Introducing the enron corpus. In CEAS, 2004.
[18] Jure Leskovec, Jon Kleinberg, and Christos Faloutsos. Graph evolution: Densification and shrinking diameters.ACM Transactions on Knowledge Discovery from Data (TKDD), 1(1):2, 2007.
. CC-BY 4.0 International licenseIt is made available under a is the author/funder, who has granted medRxiv a license to display the preprint in perpetuity. (which was not certified by peer review)
The copyright holder for this preprint this version posted April 14, 2020. .https://doi.org/10.1101/2020.04.13.20060269doi: medRxiv preprint