Embed Size (px)
Citation preview

479
Sequential Sales as a Test of Adverse
Selection in the Market for Slaves
JONATHAN PRITCHETT AND MALLORIE SMITH When imported slaves were first sold in New Orleans, buyers were unaware of the slaves’ unobservable characteristics. In time, the new owners learned more about their slaves and may have resold the “lemons.” Previous research suggests that buyers anticipated such adverse selection and reduced their bids for these slaves. Consequently, we should observe lower prices for resold slaves. We test this proposition by linking the sequential sales records of 568 slaves. Through a comparison of initial and resale prices, we find little evidence to support the hypothesis that adverse selection lowered the price of resold slaves.
he value of a slave to his owner depended on unobservable traits such as skill, demeanor, or work ethic. These hidden characteristics
only reveal themselves with time and interaction between the owner and the slave. Because sellers were better informed than potential buyers of the unobservable characteristics of their slaves, sellers may have adversely selected lower quality slaves for sale. Previous research suggests that buyers anticipated such adverse selection and reduced their bids for resold slaves. Consequently, adversely selected slaves should have sold for less than randomly selected slaves. This article tests for adverse selection by linking the sequential sales records of 568 slaves sold in New Orleans. This approach differs from previous research because we difference sequential sale prices for individual slaves, allowing us to eliminate time-invariant and unobserved individual effects. In addition, the difference-in-differences approach allows us to identify the treatment effect of adverse selection. Our empirical results suggest that adverse selection had relatively little effect on slave prices in New Orleans.
The Journal of Economic History, Vol. 73, No. 2 (June 2013). © The Economic History
Association. All rights reserved. Jonathan Pritchett is Associate Professor and Mallorie Smith is Research Assistant,
Department of Economics, Tulane University, New Orleans, Louisiana 70118. E-mails: [email protected] and [email protected].
The authors acknowledge the support of the National Science Foundation award SMA-1004569 entitled, “Research Experience for Undergraduates.” Jessica Hayes and the staff of the Notarial Archives Division Research Center provided able research assistance. We benefit from the helpful comments and suggestions of James Alm, Alan Barreca, Joe Ferrie, Paul Rhode, Judy Schafer, and two anonymous referees. An earlier version of this article was presented at the meetings of the Cliometrics Society, January 7, 2011.
T

480 Pritchett and Smith
The potential for adverse selection affects our understanding of the slave market and, more generally, the economics of slavery. If it played a large role in the market, adverse selection would affect the accuracy of previous studies on the rate of return to slavery. In its simplest form, the rate of return is approximated by the quotient of the annual rental rate and the market price of slaves (see, for example, Evans 1962). If the slaves offered for sale were adversely selected whereas those offered for rent were not, then the calculated rate of return to slavery has been biased and overestimated. Previous research finds that slave owners earned the market rate of return on their investment in slaves (Conrad and Meyer 1958; Evans 1962; Fogel and Engerman 1974). Consequently, the presence of adverse selection suggests that slave owners earned a below-market rate of return on their investment, indicating that they were not profit maximizers at the margin or had alternative reasons for owning a slave. Furthermore, adverse selection may have reduced the efficiency of the interregional slave market. If buyers had anticipated that traders were selling lower quality slaves, they might have been reluctant to purchase them. As an impediment to the efficient transfer of enslaved labor from regions of lower productivity to those with higher productivity, adverse selection would have hindered southern economic growth. Inefficiency, however, can also promote social welfare. Owners, for example, may have preferred to move labor in entire plantations rather than deal with interregional slave traders. Consequently, if adverse selection reduced the probability that slaves were bought and sold, it also improved social welfare by increasing the stability of slave families. The extent of adverse selection may also reveal something about the creation of economic, political, and legal institutions to counteract it. The economic institutions are evident in the nature of the transactions themselves. For example, if adverse selection prevailed in the market, buyers may have relied on the business reputation of traders to avoid the purchase of lower quality slaves.1 In addition, buyers could seek additional market information through the hire of buying agents. Furthermore, conditional or trial purchases provided buyers the opportunity to return a slave within a certain period of time. Legal institutions also protected buyers through implied warranties and a court system which enforced contract law (Pritchett and Smith 2011). As discussed later, an 1829 Louisiana law required the certification of the slave’s good moral character as an attempt to
1 On the reputation and social status of traders, see Tadman (1989, pp. 179‒210; and 2007); and Gudmestad (2003, pp. 148‒68).

Sequential Sales as a Test of Adverse Selection 481
prevent the importation of criminal slaves into the state (Freudenberger and Pritchett 1991). Therefore, buyers may have been wary of a seller’s ability to adversely select lower quality or even criminal slaves for sale. Finally, the political system demonstrated the endogenous character of slave law—many legislators owned slaves and enacted laws to protect themselves and their investments in slavery (Fede 1987). Although previous research suggests that adverse selection should have lowered the price of resold slaves, its actual impact remains an empirical issue.2 Bruce Greenwald and Robert Glasspiegel (1983) test for adverse selection in the New Orleans slave market by comparing the prices of slaves originating from different regions of the South. They argue that slaves originating from low productivity areas were more likely to be sold and less likely to be adversely selected than slaves from the local area. New Orleans buyers offered higher prices for imported slaves because they anticipated that these slaves were of higher quality than local slaves. Jonathan Pritchett and Richard Chamberlain (1993) test for adverse selection in the New Orleans slave market by comparing the prices of slaves sold at estate sales with those of slaves sold voluntarily. They argue that slaves sold voluntarily may have been culled from the seller’s holdings whereas slaves sold at estate sales were less subject to adverse selection. They find no significant difference between the prices of these slaves from which they conclude that adverse selection was limited. More recently, Georges Dionne, Pascal St-Amour, and Désiré Vencatachellum (2009) find that slaves sold at estate sales in Mauritius commanded a significant 45 percent premium when compared to the prices of slaves sold voluntarily. The authors argue that the presence of informed buyers at public estate sales bid up slave prices whereas their absence signaled to other buyers that the slaves were of lower quality resulting in lower bids for them. The dissemination of private information to uninformed buyers, as proposed by Dionne, St-Amour, and Vencatachellum (2009), did not apply to participants in the New Orleans market. Contrary to the slave market in Mauritius, many New Orleans slaves were sold privately rather than at public auction. Traders in particular displayed their slaves in jails or pens where potential buyers could inspect them prior to purchase. Because other bidders were not present during
2 Recent work on the economics of slavery is predicated on the presence of adverse selection
in the market for slaves. For example, Lee Craig and Robert Hammond (2011) argue that slaveholders signaled the higher quality of their slaves by improving their diets and increasing their stature. In addition, see Pritchett and Freudenberger (1992), Komlos and Alecke (1996), and Pritchett (1997).
482 Pritchett and Smith
private negotiations, they were not privy to private information indicated by the presence or absence of an informed buyer. In addition, informed buyers in Mauritius paid a penalty in the form of higher prices for their slaves, creating a strong incentive for them to conceal their participation in the market. Dionne, St-Amour, and Vencatachellum (2009, p. 1285) imply that the employment of buying agents was illegal in Mauritius whereas buying agents were frequently used in New Orleans.3 Perhaps institutional differences between New Orleans and Mauritius accounts for the different empirical estimates of adverse selection, as estimated by Pritchett and Chamberlain (1993) and Dionne, St-Amour, and Vencatachellum (2009). In the following, a difference-in-differences methodology tests for adverse selection in the market for slaves. Differencing the sequential sales prices of individual slaves controls for unobserved heterogeneity and time-invariant fixed effects. Next, we identify a group of market participants—professional traders—who we believe did not adversely select their slaves for resale because they resold all of them. Consequently, we identify the slaves sold by traders as the control group for the difference-in-differences calculation. The treatment effect of adverse selection compares the resale price change for other slaves with that for slaves sold by traders (who comprise the control group). We find the prices for the treated group increased faster than the prices for the control group from which we conclude that the effect of adverse selection was negligible relative to other sources of market volatility.
NOTARIAL SALES RECORDS This article uses an improved data set on the resale prices of slaves, a data set that offers several distinct improvements over the Robert Fogel and Stanley Engerman (1976) sample.4 Better information regarding the import status of slaves and the trading status of sellers
3 Buyers also hired agents to help them gather market information and to bargain with slave
traders. As indicated by the following newspaper advertisement, some traders resented the presence of buying agents and encouraged planters to visit their pens without them. “Persons desirous of purchasing would do well to call and examine for themselves without being accompanied with a broker, unless they themselves feel disposed to pay the Brokerage, as they can always purchase a Slave for TWENTY-FIVE DOLLARS less without a Broker, than with one. And as far as regards the subscriber, he, (believing himself capable of transacting his own business) is determined, from this day forward, not to pay any broker a commission on Sale of SLAVES, unless specially employed by him to make such sale.” See New Orleans Daily Picayune (27 May 1838), p. 3.
4 In addition to Fogel and Engerman (1974), their data set has been used by Kotlikoff (1979), Fogel (1989), Johnson (2000), Levendis (2007, 2009), Choo and Eid (2008), and others. For a comparison of our sample with the Fogel and Engerman sample, see the Appendix.

Sequential Sales as a Test of Adverse Selection 483
allows the identification of those slaves most likely to have been adversely selected for market. More importantly, these data allow us to perform title searches for more than 500 slaves. By estimating the price difference for sequential sales, we control for unobserved heterogeneity, a problem which affects previous work on this topic. We derive the sample of sales records from the New Orleans Notarial Archives. Unlike the Fogel and Engerman sample for the years 1804 through 1862, we concentrate our efforts on the collection of all extant sales records for a single year—the 1830 calendar year. These data complement the earlier Fogel and Engerman sample by providing a census of all market participants including buyers, sellers, and slaves. Not only are we able to collect more information on each transaction (especially the names of the buyers and sellers by which we link the sales records), but we also have better information because of an unusual Louisiana law in effect during 1830. The fear of slave insurrections led the Louisiana legislature to pass a law which required a so-called certificate of good moral character for each out-of-state slave. This peculiar Louisiana law was in effect from April 1, 1829 through March 24, 1831. As described in the legislative acts of 1829, the certificate had to be signed by two or more freeholders (other than the vendor) from the county of origin. The freeholders were to declare under oath that they had known the slave for several years and that the said slave was not guilty of any crimes, “but that he or she has a good moral character and is not in the habit of running away.” The certificate was deposited with the notary when the imported slave was first sold in New Orleans.5 For a local slave, the notary recorded information on the slave’s prior sale within the state, including the names of the previous notary, seller, and date. In the following, we use this information to search the title of these Louisiana slaves. To facilitate the matching of sequential sales records, the sample includes the records of all New Orleans slave sales for 1830. Title transfers which did not represent market transactions were omitted from the sample. For example, we did not collect information on the release of mortgages on slaves, uncompensated manumissions,
5 Louisiana, Acts, 9th Leg., 1 sess., p. 38. The motivation of the law was to prevent the
importation of “criminal” slaves, which in and of itself, would seem to indicate that Louisiana buyers were wary of adverse selection in the market. Under certain circumstances, the law did not require the presence of a certificate. For example, certificates were not required for children aged twelve years or less. Also, sellers could waive the requirement if the slave had been previously sold within the state, or had been imported prior to April 1, 1829. See Freudenberger and Pritchett, 1991.

484 Pritchett and Smith
or marriage contracts involving slaves as property.6 In addition, we did not collect information on the sales of entire plantations, the sales of partial ownership of slaves, and rental agreements for plantations and slaves.7 Records which do not represent market transactions are excluded from the sample. Some sales, for example were annulled or voided prior to their completion—as indicated by margin notes on the sales records and the absence of the required signatures at the bottom of the contract. Typically, the voiding of a sale occurred when one of the parties to the transaction failed to meet the initially agreed on stipulations, or because circumstances changed between the time of sale and the recording of the deed. For instance, a sale was annulled when a “boy got drunk and the purchaser refused to take him” (NONA, Boswell, vol. 11, p. 528). To meet the letter of the law, owners who imported slaves from outside Louisiana were required to provide certificates of good character even if they did not intend to sell them. Because such deposits did not represent market transactions, these records were excluded from the sample. After removing the records of voids, annuls, rental agreements, and deposits, there are 6,174 observations in the working sample. The presence of a certificate interleaved with the notarial sales invoice effectively identifies the import status of a slave. We classify 3,078 slaves as imported from outside of the state of Louisiana—
their records comprise 49.9 percent of the working sample. Local slaves are identified by evidence of prior residence within the state. This definition is relatively inclusive because an imported slave, if subsequently resold in New Orleans, would be reclassified as a local slave. Using information on prior residence, we infer that the records of 2,710 local slaves are included in the sample.8 The origins of 386 slaves, or 6.2 percent of the sample, could not be inferred for a number of reasons. Some sellers simply declared that they had owned their slaves for a number of years without indicating their length of residence
6 For examples of the release of mortgages, see New Orleans Notarial Archives [hereafter NONA], Christy, vol. 5, pp. 508, 509. For an example of a manumission, see NONA, Pollock, vol. 33, p. 482. For a marriage contract involving the disposition of slaves, see NONA, Pollock, vol. 32, p. 289.
7 For examples of sales of entire plantations, including slaves, see NONA, Pollock, vol. 32, pp. 117, 179; Pollock, vol. 33, p. 83; and Christy, vol. 5, p. 447. For sales of partial ownership of slaves, see NONA, Pollock, vol. 32, p. 270; Pollock vol. 33, p. 83; and Christy, vol. 5, p. 447. For the rental agreement for an entire plantation and slaves, see Pollock, vol. 33, p. 144.
8 Many local slaves had been previously sold in New Orleans. Of the 2,710 local slaves, we know the previous purchase date for 2,407 of them (or 89 percent of the locals). Instead of reporting the prior sale date, the owners of 182 slaves declared that their slaves were imported prior to April 1, 1829, the effective enforcement date for the Louisiana law. Finally, a prior sale date for 118 local slaves (most of whom were children and presumably born within the state) was not recorded or could not be inferred by the authors.
Sequential Sales as a Test of Adverse Selection 485
within the state. Also, the law of 1829 did not require a proof of origin for slaves aged 12 years or less. Because the Louisiana Black Code required young children to be sold with their living mothers, we are able to infer their regions of origin from those of their mothers (Louisiana, Acts, 1st Leg., p. 101). For most of the children aged 10 to 12 years, however, the region of origin cannot be determined. These children represent a large proportion of the slaves with missing information. Children of these ages comprise only 7.5 percent of our sample yet account for 46 percent of the slaves with missing information for their regions of origin. Sequential Sales We construct the sample of sequential sales by matching the records of previously sold slaves to their subsequent sales records. The invoices of 2,407 slaves indicate the date of previous sale within the state of Louisiana. Of these local slaves, 1,244 were previously sold during the calendar year 1830, and consequently this number represents the maximum number of possible matches within the sample. Because of data limitations, however, we are not able to match all of these records. Office fires and records with incomplete information rule out 173 possible matches. Also, an unknown number of sales records were recorded by the public notary Carlilie Pollock and lost due to a missing volume in the Notarial Archives. After these adjustments, we estimate a maximum of 1,071 matches are possible for the slaves sold in 1830. We match sales records using (1) the date of the previous transaction, (2) notary’s name, (3) buyer’s and seller’s names, (4) the slave’s name, (5) gender, (6) skin color, and (7) age (plus or minus one year). The initial procedure results in 951 matches—however, some of these matches represent duplicates. Some large transactions listed more than one slave with the same name, age, and skin color, resulting in nonunique matches. After removing these duplicates, the sample includes the records of 833 paired sales. Compared with the maximum number of possible matches, the match rate is 77.8 percent. Buybacks We exclude from the sample the records of buybacks, or sequential sales where the buyer resells or returns the slave to the original owner. Such buybacks were common in New Orleans.9
9 Because they required a title transfer, buybacks had to be notarized. Consequently, the notarial records provide evidence of the number of slaves returned by buyers.
486 Pritchett and Smith
Of the 833 paired transactions in the sample, we find that 52 pairs (or more than 6 percent) represent transactions where buyers returned slaves to the original owners. The buyer, as the previous owner of the slave, would have been fully informed of the slave’s unobservable characteristics and consequently, there is no asymmetry of information. Including buybacks in the sample would reduce the probability of finding adverse selection because the prices of returned slaves would fully reflect their known characteristics.10 Buybacks have broader implications regarding the presence of adverse selection in the market for slaves. In many cases, the buyer’s motive for returning the slave (or selling him back) to the original owner was due to a possible violation of the implied warranty. Under Louisiana law, a seller was required to disclose any vices or maladies suffered by the slave at the time of sale. If a dissatisfied buyer could prove that the slave’s undisclosed condition preexisted the sale date, he could sue to rescind the sale or demand compensation (Schafer 1987, pp. 307‒08; Pritchett and Smith 2011). A desire to avoid litigation is quite evident from some of the records of returned slaves. For example, the slave trader John Woolfolk sold thirty-five slaves to Isaac Brown, several of whom “proved to be defective in body and character” which the purchaser “alleges to have existed at and previous to the period of said sale.” The buyer and seller agreed to exchange several of the slaves, “in order to prevent litigation.” Victor and Cesaire Oliver returned the slave Westy to Isaac Franklin “in order to avoid difficulty between each other.” Roswell Beebee returned his purchase to the original owner when the slave proved “to be subject to one of the said redhibitory diseases” (NONA, Pollock, vol. 33, act 92; Janin, vol. 5, act 254; and Felix Pedesclaux, vol. 1, act 186).11 By protecting the buyer from false claims by the seller, an effective warranty tends to mitigate the effect of adverse selection. Under such circumstances, sellers would not make false claims for fear of being sued and prices would reflect the unobserved characteristics of the slaves. Buybacks may be a sign of an effective warranty,
10 Buybacks can also reduce the incidence of adverse selection in the used car market.
According to Justin Johnson and Michael Waldman (2003, p. 247), leasing arrangements are similar to buybacks because they suppress the dissemination of private information and increase the efficiency of the resale market. Because the seller of a returned car has no better information about its quality than the buyer, there is no asymmetry of information and no possibility of adverse selection.
11 The Louisiana Civil Code defines redhibition as the annulment of “a sale on account of some vice or defect in the thing sold, which renders it absolutely useless, or its use so inconvenient and imperfect, that it must be supposed that the buyer would not have purchased it, had he known of the vice.” See Louisiana, Civil Code, art. 2496.

Sequential Sales as a Test of Adverse Selection 487
reducing the incidence of adverse selection among all slaves sold in New Orleans (Pritchett and Smith 2011).12 Accurate prices are needed to estimate price changes for sequential sales. Unfortunately, many of the more unusual (and interesting) transactions fail to provide useful price data and are excluded from the sample. For example, we exclude the records of donations or gifts of slaves, some of which occurred between family members. Sometimes prices were omitted from these records, and because many were not “arm’s length transactions,” the prices may not be accurate. The joint sale of slaves and other property or sales with special covenants are also excluded.13 Because prices are often missing in barter transactions, these records are also removed.14 As discussed previously, the records of buybacks are excluded because the information is not asymmetric. Finally, the records of slaves sold in groups without individual price information are removed from the sample. After making these exclusions, the working sample includes 568 paired transactions.
PRICE CHANGES FOR SEQUENTIAL SALES All prices are adjusted to reflect their real present value equivalents. Because they include the opportunity cost of the borrowed funds, the prices for credit sales may be inflated. Instead of the prices quoted for these sales, we substitute the present value of the payment stream discounted at the prevailing market interest rate of 10 percent per annum.15 We also deflate nominal prices for changes in the general
12 Buybacks may also reflect a poor match between the slave, the owner, or the situation. For example, James Bentley sold Hannah and Louise (her daughter) for $700 on 9 January 1830. On 24 December 1830 Bentley repurchased Louisa (then 8 years old) for $200 and the invoice notes that Hannah, her mother, had died. After the mother’s death, the buyer may have lacked an ability to care for the child and decided to sell her back to the original owner. In addition, some sales were conditional on the buyer’s approval within a specified period of time. For example, Paul Dardennes Poincy sold the slave Dick to Jonathan Davis conditional on the buyer’s satisfaction with the slave. The slave’s return to the original seller simply reflected the buyer’s dissatisfaction with his purchase rather than an out-of-court settlement of an alleged warranty violation. See NONA, Boswell, vol. 12, act 33; Pollock, vol. 33, act 672; and Caire, vol. 12, act 882.
13 When James Augustin Lee sold Bill, Hezekiah, and George, he included three horses, three carts, four mules, and their harnesses in the purchase price. George Baumgard, in an example of a sale with special covenant, sold his bakery, including 15 slaves, to Paul Dardennes Poincy, with the restriction that Baumgard not compete against the new owner (by baking bread) for the next five years. See NONA, Seghers, vol. 3, p. 163; and Pollock, vol. 33, p. 387.
14 Examples of slaves exchanged for property include the slave trader Joseph Meek, Jr., who traded one of his slaves for an American piano. In exchange for his slave, Pierre Marnett was promised 26 “bulks” of buffalo meat, to be delivered via flatboat. See NONA, O. de Armas, vol. 6, p. 209; and Caire, vol. 12, p. 329.
15 Most invoices do not quote an explicit market interest rate for credit sales. Among those with a quoted rate, 76 percent specify an annual rate of 10 percent.

488 Pritchett and Smith
FIGURE 1 AVERAGE PRICE OF UNSKILLED MALES, AGED 18 TO 30 YEARS, SOLD WITH A
GUARANTEE IN NEW ORLEANS DURING 1830 Sources: New Orleans Notarial Archives.
level of slave prices. Consequently, prices changes for sequential sales are measured relative to the general trend in slave prices. Using a classification proposed by Engerman, we construct a monthly index using the average price for males without skills, aged 18 to 30 years, fully guaranteed as without physical or other infirmity (Ransom and Sutch 1988, p. 156). As seen in Figure 1, there is a slight upward trend in prices during the calendar year 1830—prices are approximately 5 percent higher in December than in January. Seasonality is also evident as prices decrease during the summer months when health conditions worsened and business activity declined in the city (Pritchett and Tunalı 1995). We divide each price by the monthly index, express it as a natural logarithm, and difference the secondary and initial sale prices of the slave.16
16 A weekly (or biweekly) index cannot be used because some cells (especially for the
summer months) are too small for reliable estimates. Overall, the month-to-month variation in prices is relatively small, and most likely, our index provides a good approximation of the actual price change. (In absolute values, the average monthly price change was only 3.2 percent. See Figure 1.)
0
100
200
300
400
500
600
700
Jan Feb Mar Apr May Jun Jul Aug Sep Oct Nov DecMonth
Ave
rage
Pri
ce (
$)
Sequential Sales as a Test of Adverse Selection 489
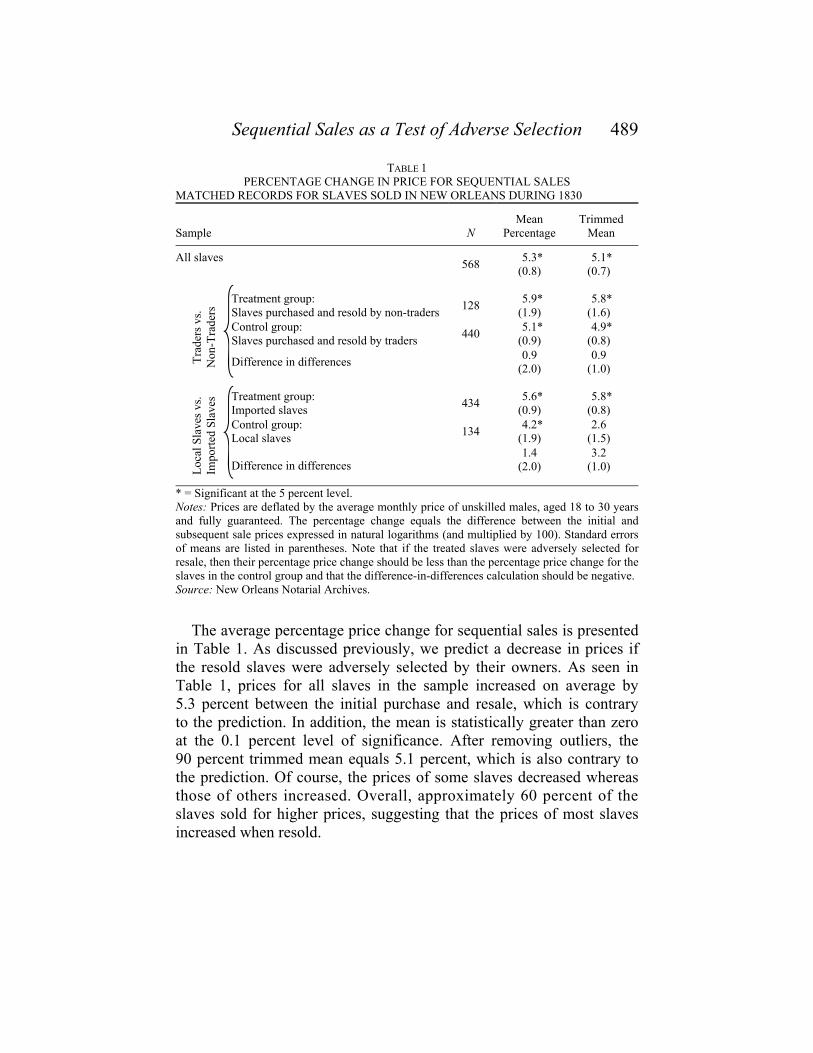
TABLE 1 PERCENTAGE CHANGE IN PRICE FOR SEQUENTIAL SALES
MATCHED RECORDS FOR SLAVES SOLD IN NEW ORLEANS DURING 1830
Sample N Mean
Percentage Trimmed
Mean
All slaves 568
5.3* (0.8)
5.1* (0.7)
Tra
ders
vs.
N
on-T
rade
rs Treatment group:
Slaves purchased and resold by non-traders 128
5.9* (1.9)
5.8* (1.6)
Control group: Slaves purchased and resold by traders
440 5.1*
(0.9) 4.9*
(0.8)
Difference in differences 0.9
(2.0) 0.9
(1.0)
Loc
al S
lave
s vs
. Im
port
ed S
lave
s Treatment group: Imported slaves
434 5.6*
(0.9) 5.8*
(0.8) Control group: Local slaves
134 4.2*
(1.9) 2.6
(1.5)
Difference in differences 1.4
(2.0) 3.2
(1.0)
* = Significant at the 5 percent level. Notes: Prices are deflated by the average monthly price of unskilled males, aged 18 to 30 years and fully guaranteed. The percentage change equals the difference between the initial and subsequent sale prices expressed in natural logarithms (and multiplied by 100). Standard errors of means are listed in parentheses. Note that if the treated slaves were adversely selected for resale, then their percentage price change should be less than the percentage price change for the slaves in the control group and that the difference-in-differences calculation should be negative. Source: New Orleans Notarial Archives.
The average percentage price change for sequential sales is presented in Table 1. As discussed previously, we predict a decrease in prices if the resold slaves were adversely selected by their owners. As seen in
Table 1, prices for all slaves in the sample increased on average by 5.3 percent between the initial purchase and resale, which is contrary to the prediction. In addition, the mean is statistically greater than zero at the 0.1 percent level of significance. After removing outliers, the 90 percent trimmed mean equals 5.1 percent, which is also contrary to the prediction. Of course, the prices of some slaves decreased whereas those of others increased. Overall, approximately 60 percent of the slaves sold for higher prices, suggesting that the prices of most slaves increased when resold.

490 Pritchett and Smith
Slave Traders Slave traders played a major role in the New Orleans market as both sellers and buyers of slaves. In 1830 a majority of slaves sold in New Orleans were imported from outside of the state, and interregional slave traders imported most of them.17 The local traders functioned as intermediaries between sellers and buyers and speculated on price changes. Traders turned over their inventory relatively quickly which limited their knowledge of the slaves’ unobservable characteristics. Experts in the buying and selling of slaves, traders are differentiated from other market participants in order to identify those transactions with the most potential for adverse selection. Professional traders made their living from buying and selling slaves. Identifying which of the market participants were traders, however, is problematic at best. Searching the secondary literature on the slave trade for the names of traders is unsatisfactory for the simple reason that many traders are not identified.18 In the following, we use the frequency of market participation to identify professional slave traders. Specifically, we define a trader as anyone who sells ten or more slaves in a single transaction or makes ten or more slave sales during 1830. Using this definition, 66 sellers are identified as slave traders. Using different definitions of slave traders, we check the sensitivity of the empirical results and find no significant difference.19 Professional slave traders sold many more slaves than other sellers in New Orleans. Although only 6 percent of the sellers are identified as traders, they sold 61 percent of the slaves. What accounts for the large number of slaves sold by traders? On average, traders sold more than twice as many slaves per transaction than other sellers (3 slaves per transaction for traders versus 1.4 slaves per transaction for other sellers). More significantly, traders were much more active in the market than other sellers. Traders averaged more than 19 transactions during the 1830 calendar year compared to an average of only 1.7 transactions for other sellers. Although slave traders were relatively few in number, they supplied the majority of slaves sold in New Orleans.
17 A comparison on the number of sellers of imported slaves with the number of different previous owners of the imported slaves, as listed on the certificates of good character, indicates approximately nine different owners (in the exporting areas) for every seller of imported slaves in New Orleans. This evidence suggests that interregional traders were purchasing slaves in the exporting areas and reselling them in New Orleans. For information regarding the number of slaves originating from the exporting areas, see Freudenberger and Pritchett (1991).
18 For example, James Barnes Diggs, one of the largest traders in New Orleans, is not identified in the secondary literature. Indeed, his descendents and genealogists were unaware of Diggs’s occupation until recently.
19 See Appendix Table 1 for empirical results using different classifications for trading status.
Sequential Sales as a Test of Adverse Selection 491
In addition to selling, traders purchased a large number of slaves sold in New Orleans. The traders were much more likely to resell their slaves than other buyers. In New Orleans during 1830, traders bought 1,157 slaves and resold 609 of them, or approximately 53 percent of their total purchases.20 In contrast, non-traders retained more than 95 percent of the slaves that they purchased. Most sequential sales in the sample can be characterized by slave traders purchasing and reselling slaves within the city. Of 833 sequential sales, slave traders account for 73 percent of them. Because slave traders account for most sequential sales in the sample, it is important to understand their market behavior. If we restrict attention to those buyers who resold slaves during 1830, we find that slave traders resold their slaves much faster than other buyers. For traders, the median length of time between purchase and resale was only 7 days whereas for other buyers the median length of time was 43 days. In addition, most slaves purchased by traders were imported. Almost 90 percent of the slaves purchased by traders were imported whereas only 33 percent of the slaves purchased by other buyers were imported. Finally, traders purchased most of their slaves from other traders (rather than local sellers). Almost 80 percent of the slaves purchased by traders were sold by other traders whereas local buyers purchased only 26 percent of their slaves from traders. In summary, these descriptive statistics suggest the following: many of the slaves purchased and resold by slave traders represent intermediate or wholesale rather than final transactions. Instead of residing in New Orleans during the selling season, some interregional traders sold their slaves to other traders, who in turn retailed them to local buyers. If all of these slaves were eventually resold, then traders did not adversely select their slaves for resale. Difference in Differences Slave traders behaved differently than other market participants, purchasing slaves with the intent of reselling them. Because most slaves in our sample of sequential sales were purchased by traders, the sample mean might mask the adverse selection practiced by other market participants. Because we believe that traders were less likely to have adversely selected slaves for resale than other buyers, we designate the slaves resold by traders as the control group and the slaves resold by
20 Why did slave traders not resell all of the slaves that they purchased? Indeed, some slaves
may have been sold after 31 December 1830, the last day in our sample period. Alternatively, some traders transported their slaves outside of New Orleans for resale. In both cases, such sales would be censored and not included in our matched sample.

492 Pritchett and Smith
others as the treatment group. The difference-in-differences calculation equals the difference in price changes for the treatment and control groups. As seen in Table 1, the prices of slaves sold by non-traders increased 5.9 percent whereas the prices for slaves sold by traders increased on average by 5.1 percent. The difference-in-differences calculation is positive and not statistically different from zero, which is contrary to the predicted effects for adverse selection. The slave’s origin might be correlated with the information available to buyers at the time of initial purchase in New Orleans. Buyers, in particular, might have known slaves from the local area, whereas they had no prior knowledge of recently imported slaves.21 Because buyers were uninformed about imported slaves, the probability of finding adverse selection should be greatest for these resold slaves. Consequently, we designate imported slaves as the treatment group and local slaves as the control group for our second difference-in-differences calculation. As seen in Table 1, the prices for the treated group increased by 5.6 percent and the prices for the control group increased by 4.2 percent. The difference-in-differences calculation is positive (rather than negative) and not statistically different from zero, which again is contrary to the predicted effect of adverse selection. In summary, these simple descriptive statistics suggest that adverse selection, if present in the New Orleans market, had a relatively small effect on the prices of slaves.
REGRESSION ANALYSIS The matched sample enables the estimation of a fixed-effects model for the change in slave prices. Because we observe sequential sales for the same slave, his unobserved characteristics are the same for both transactions. We need, however, to allow for the possibility that the slave’s characteristics may have changed between the date of initial purchase and secondary sale. We control for these changes using regression analysis. Formally, the slave’s price is (1) where Pit is the price of slave i at time t, Xit is the time-variant covariate, Zi is the time-invariant covariate, αi is the unobserved individual effect, δS is the change in the perceived value of the slave for secondary sales, and uit is the error term. If we difference the initial
21 To be sure, buyers should have been aware of a slave’s import status or whether he or she
had been previously sold within the state. Notaries were legally required to list this information on the sales invoice and the contract was not binding until both buyer and seller had signed it.

Sequential Sales as a Test of Adverse Selection 493
and secondary prices, the time-invariant and the unobserved individual effects are eliminated. In addition, if prices are expressed in logarithms, then the difference equals the percentage change in prices (2) where I indicates the slave’s initial sale and S indicates the secondary sale. Absent time-variant covariates, the percentage price change equals the change in the perceived value of the slave (as presented in Table 1). The percentage price change is estimated using OLS and the regression results are presented in Table 2. In addition to the intercept, regression 1 includes a time-varying covariate indicating resale more than 30 days after initial purchase. Buyers who resold slaves within 30 days of initial purchase might have been price speculators. In contrast, buyers owning slaves for more than 30 days had more time to discover any undisclosed defects and might have adversely selected their slaves for resale. The estimated regression coefficient for this indicator variable is positive and not statistically significant suggesting that knowledgeable owners were no more likely than other owners to adverse select their slaves for resale. Consistent with previous research, we find that interregional slave traders preferred to ship prime-aged males to the New Orleans market (Tadman 1989; Pritchett and Chamberlain 1993).22 Following Engerman, we classify slaves aged 18 to 30 years as prime aged (Ransom and Sutch 1988, p. 156). For our sample of sequential sales, we find that prime-aged males comprised 50 percent of the slaves sold by traders but only 22 percent of slaves sold by non-traders. Because traders sold different types of slaves than non-traders, the composition of their sales might have produced different price changes even in the absence of any adverse selection. Regression 1 includes a covariate indicating if the slave is a prime-aged male in order to control for such price changes created by compositional effects. As seen in Table 2, the estimate coefficient for this variable is positive but not statistically significant. As we will show, these compositional effects did not account to the observed price changes for slaves sold by traders.
22 Recent research by Eugene Choo and Jean Eid (2008, p. 500) questions this empirical
result. Contrary to the predictions of Alchian and Allen’s theory, they find that traders shipped relatively more females from more distant regions of the South. Unfortunately, they made an error by reversing the sign for their one-sided test, thus rejecting the null hypothesis when it should have been accepted.

494 Pritchett and Smith
TABLE 2 OLS REGRESSION ANALYSIS: PERCENTAGE CHANGE IN PRICE FOR SEQUENTIAL SALES MATCHED RECORDS FOR SLAVES SOLD IN NEW ORLEANS DURING 1830
Covariate Regression
(1) Regression
(2) Mean and Std. Dev.
Intercept 0.041*
(0.013) ‒0.006 (0.032)
1
Imported slaves, purchased and resold by non-traders (1 = yes, 0 = no)
0.058 (0.046)
0.062 (0.241)
Imported slaves, purchased and resold by traders (1 = yes, 0 = no)
0.049 (0.033)
0.702 (0.458)
Local slaves, purchased and resold by non-traders (1 = yes, 0 = no)
0.059 (0.038)
0.164 (0.370)
More than 30 days elapsed between purchase and resale (1 = yes, 0 = no)
0.006 (0.019)
0.003 (0.022)
0.250 (0.433)
Male slave, aged 18 to 30 years (1 = yes, 0 = no)
0.023 (0.017)
0.024 (0.017)
0.438 (0.497)
Number of paired sales 568 568 568 R2 0.003 0.008
* = Significant at the 5 percent level. Notes: Prices are deflated by the average monthly price of unskilled males, aged 18 to 30 years, who were fully guaranteed. The dependent variable is the percentage price change, equal to the difference between the initial and secondary prices, expressed in natural logarithms. For regression 1, the intercept refers to the predicted price change for females, aged less than 18 years or more than 30 years, who were purchased and resold within 30 days. For regression 2, the intercept refers to the predicted price change for local females, aged less than 18 years or more than 30 years, who were purchased and resold within 30 days by slave traders. Standard deviations are reported in parentheses. Source: New Orleans Notarial Archives.
The intercept for the regression indicates the percentage price change conditional on the time-varying covariates. As argued previously, if New Orleans sellers culled slaves from their holdings, then buyers would have anticipated such adverse selection and lowered their bids for these resold slaves. The estimated intercept is positive and statistically significant, which indicates that prices increased for resold slaves. The underlying causes for prices changes are many and, in most cases, unobserved. The difference-in-differences methodology allows us to identify the price change caused by adverse selection. In regression 2, we include indicator variables for trading and import status, where the omitted category refers to local slaves purchased and resold by slave traders. We previously argued that traders were less likely to adversely select local slaves for resale. Consequently, we designate this category as the control group. Because imported slaves purchased and resold by non-traders were more likely to have been adversely selected for resale, we designate this category the treatment group. The estimated

Sequential Sales as a Test of Adverse Selection 495
TABLE 3 OLS REGRESSION ANALYSIS: PERCENTAGE CHANGE IN PRICE FOR SEQUENTIAL SALES MATCHED RECORDS FOR SLAVES SOLD IN NEW ORLEANS DURING 1830
Slaves Purchased and Resold by:
Origin of Slave is:
Covariate Non-Traders(treatment)
Traders (control)
Imported (treatment)
Local (control)
Intercept
0.063 (0.033)
0.034* (0.014)
0.049* (0.014)
0.005 (0.029)
More than 30 days elapsed between purchase and resale (1 = yes, 0 = no)
‒0.004 (0.040)
0.002 (0.026)
‒0.025 (0.025)
0.073 (0.037)
Male slave, aged 18 to 30 years (1 = yes, 0 = no)
‒0.006 (0.047)
0.032 (0.018)
0.023 (0.018)
0.005 (0.043)
Number of paired sales 128 440 434 134 R2 0.000 0.007 0.007 0.029
* = Significant at the 5 percent level. Notes: Prices are deflated by the average monthly price of unskilled males, aged 18 to 30 years, who were fully guaranteed. The dependent variable is the percentage price change, equal to the difference between the initial and secondary prices, expressed in natural logarithms. Standard deviations are reported in parentheses. Source: New Orleans Notarial Archives.
regression coefficient for this latter variable is positive (and not statistically different from zero), which is contrary to our earlier prediction that adverse selection would have decreased the average resale price for slaves sold in New Orleans. Separate regressions for slaves purchased and resold by traders and non-traders and for imported and local slaves are presented in Table 3. The regressions include a variable indicating purchase and resale after more than 30 days and a variable indicating a male slave, aged 18 to 30 years. None of these estimated regression coefficients are statistically significant. The intercept may be interpreted as the predicted percentage price change conditional on the time-varying covariates. For both sets of regressions, we find that the prices of slaves in the treatment groups rose faster than the prices of slaves in the control group, which is contrary to the predictions for adverse selection.
DISCUSSION AND CONCLUSION This article exploits perceived differences in the knowledge of buyers to test the hypothesis that adverse selection affected the prices of resold slaves. In this regard, the article has much in common with the recent article by Dionne, St-Amour, and Vencatachellum (2009), where

496 Pritchett and Smith
higher slave prices are attributed to the presence of informed buyers at auctions. In our article, New Orleans buyers did not observe all relevant characteristics of imported slaves. In time, the new owners would have discovered any defects which were not disclosed at the time of sale. Owners practiced adverse selection when they resold slaves with hidden defects while retaining those without them.23 If buyers anticipated that the slaves were adversely selected for resale (and subject to hidden defects), they would have reduced their bids for them. Consequently, if owners adversely selected slaves for sale (and buyers recognized this), we should observe lower prices for resold slaves. Our predictions regarding imported slave prices are similar to those made by Greenwald and Glasspiegel (1983), although the mechanism by which sellers adversely selected their slaves is somewhat different. According to Greenwald and Glasspiegel, local planters retained all but their lowest-quality slaves because of the region’s high labor productivity, whereas planters from the Old South were willing to sell nearly all of their slaves. If New Orleans buyers anticipated that the local slaves were adversely selected for sale, they would have lowered their bids for them. Consequently, Greenwald and Glasspiegel test for adverse selection by comparing the prices of local and imported slaves. In this article, we improve their original test in two ways. First, the Fogel and Engerman sample (1976) used by Greenwald and Glasspiegel is subject to measurement error with respect to the slaves’ origins. For most years, notaries were not required to record the origins of the slaves sold in New Orleans and in fact, most did not do so. As a consequence, nearly two-thirds of the observations in Fogel and Engerman’s sample have missing values for the slave’s region of origin. Because of the 1829 Louisiana law that required imported slaves be accompanied by a so-called certificate of “good moral character,” our sample includes accurate information regarding the origin of slaves sold in New Orleans. Consequently, our estimates are not biased by potential measurement error. Secondly, the imported slaves sold in New Orleans may be subject to other forms of selection bias. According to Armen A. Alchian and William R. Allen’s theory, a fixed transport cost applied to two goods of differing quality lowers the relative price of the higher-quality good in the destination market (Alchian and Allen 1969; Borcherding and Silberberg 1978, p. 113).
23 Resale was quite common in this market. Recall that over half (54 percent) of the local
slaves sold in New Orleans had been previously sold within eight months. In addition, among those slaves who were sold more than once during 1830, 76 percent were imported during that year.

Sequential Sales as a Test of Adverse Selection 497
Pritchett and Chamberlain (1993) use this theory to account for the higher prices of imported slaves sold in New Orleans. For our sample of sequential sales, we observe the prices of the same slave twice: once when he was initially introduced into the state and a second time when his status changed to that of a local slave. Other than this change in status, the characteristics of the slave remained unchanged.24 Consequently, by comparing the initial and resale prices, we control for unobserved heterogeneity resulting from other forms of selection bias (such as transportation costs). Once we control for such unobserved heterogeneity, we find that imported slaves and local slaves sold for similar prices. In this article, we perform a relatively simple test. We compare the prices of slaves for whom all buyers were uninformed with their subsequent resale prices. We propose that if the slaves were adversely selected for resale, the subsequent resale price should be less than the original price. Using sequential price data from the New Orleans slave market, we find the opposite—the resale price of slaves actually increased. Because prices may have changed for reasons other than adverse selection, we perform a difference-in-differences calculation by comparing slave traders with other market participants. Our results suggest that adverse selection, if present in the New Orleans market, had a relatively small effect on the prices of slaves.
24 Using regression analysis, we control for possible changes in the slave’s characteristics resulting from his tenure in New Orleans.
REFERENCES
Akerlof, George A. “The Market for ‘Lemons’: Quality Uncertainty and the Market
Mechanism.” Quarterly Journal of Economics 84, no. 3 (1970): 488–500. Alchian, Armen A., and William R. Allen. Exchange and Production: Theory in Use.
Belmont, CA: Wadsworth Publishing, 1969. Borcherding, Thomas, and Eugene Silberberg. “Shipping the Good Apple Out: The
Alchian and Allen Theorem Reconsidered.” Journal of Political Economy 86, no. 1 (1978): 131‒38.
Choo, Eugene, and Jean Eid. “Interregional Price Difference in the New Orleans Auctions Market for Slaves.” Journal of Business and Economic Statistics 26, no. 4 (2008): 486‒509.
Conrad, Alfred, and John Meyer. “The Economics of Slavery in the Ante Bellum South.” Journal of Political Economy 66, no. 2 (1958): 95‒130.
Craig, Lee, and Robert Hammond. “The Market for Slaves and Lemons: A (Partial) Solution to the Antebellum Puzzle.” North Carolina State University Economics Working Paper, Raleigh, NC, March 2011.
498 Pritchett and Smith
Dionne, Georges, Pascal St-Amour, and Désiré Vencatachellum. “Asymmetric Information and Adverse Selection in Mauritian Slave Auctions.” Review of Economic Studies 76, no. 4 (2009): 1269‒95.
Evans, Robert, Jr. “The Economics of American Negro Slavery, 1830‒1860.” In NBER Aspects of Labor Economics, edited by Universities-National Bureau, 185‒243. Princeton, NJ: Princeton University Press, 1962.
Fede, Andrew. “Legal Protection for Slave Buyers in the U.S. South: A Caveat Concerning Caveat Emptor.” The American Journal of Legal History 31, no. 4 (1987): 322‒58.
Fogel, Robert W. Without Consent or Contract: The Rise and Fall of American Slavery. New York: Norton, 1989.
Fogel, Robert W., and Stanley Engerman. Time on the Cross: The Economics of American Negro Slavery. Boston: Little, Brown and Company, 1974.
______. “The New Orleans Slave Sale Sample, 1804‒1862 [Computer File].” ICPSR Study No. 7423. Ann Arbor, MI: Inter-University Consortium for Political and Social Research [distributor], 1976.
Freudenberger, Herman, and Jonathan Pritchett. “The Domestic United States Slave Trade: New Evidence.” Journal of Interdisciplinary History 21, no. 3 (1991): 447‒77.
Greenwald, Bruce C., and Robert R. Glasspiegel. “Adverse Selection in the Market for Slaves: New Orleans, 1830‒1860.” Quarterly Journal of Economics 98, no. 3 (1983): 479‒99.
Gudmestad, Robert H. A Troublesome Commerce: The Transformation of the Interstate Slave Trade. Baton Rouge: Louisiana State University Press, 2003.
Johnson, Justin P., and Michael Waldman. “Leasing, Lemons, and Buybacks.” Rand Journal of Economics 34, no. 2 (2003): 247‒65.
Johnson, Walter. “The Slave Trader, the White Slave, and the Politics of Racial Determination in the 1850s.” The Journal of American History 87, no. 1 (2000): 13‒38.
Komlos, John, and Bjorn Alecke. “The Economics of Antebellum Slave Heights Reconsidered.” Journal of Interdisciplinary History 26, no. 3 (1996): 437‒57.
Kotlikoff, Laurence J. “The Structure of Slave Prices in New Orleans, 1804 to 1862.” Economic Inquiry 17, no. 4 (1979): 496‒517.
Levendis, John. “The Movement of Quality Adjusted Slave Prices and Quantities.” Southwestern Economic Review 34, no. 1 (2007): 161‒77.
______. “How Efficient Were the New Orleans Slave Auctions? A Structural Econometric Approach.” Southwestern Economic Review 36, no. 1 (2009): 95–104.
Louisiana. Acts, 1st Leg., New Orleans, 1806. ______. Civil Code of the State of Louisiana: Preceded by the Treaty of Cession with
France, the Constitution of the United States of America and of the State. New Orleans: Impr. De E. Duverger, 1825.
______. Acts, 9th Leg., 1 sess., New Orleans, 1829. New Orleans Daily Picayune, 27 May 1838. New Orleans Notarial Archives (NONA). New Orleans, LA. Pritchett, Jonathan B. “The Interregional Slave Trade and the Selection of Slaves for
the New Orleans Market.” Journal of Interdisciplinary History 28, no. 1 (1997): 57‒85.

Sequential Sales as a Test of Adverse Selection 499
Pritchett, Jonathan B., and Richard Chamberlain. “Selection in the Market for Slaves: New Orleans, 1830‒1860.” Quarterly Journal of Economics 108, no. 2 (1993): 461‒73.
Pritchett, Jonathan B., and Herman Freudenberger. “A Peculiar Sample: The Selection of Slaves for the New Orleans Market.” The Journal of Economic History 52, no. 1 (1992): 109‒27.
Pritchett, Jonathan B., and Mallorie Smith. “An Economic Analysis of Slave Warranties: The 1830 New Orleans Slave Market.” Working Paper, Tulane University, Department of Economics, November 2011.
Pritchett, Jonathan B., and İnsan Tunalı. “Strangers’ Disease: Determinants of Yellow Fever Mortality During the New Orleans Epidemic of 1853.” Explorations in Economic History 32, no. 4 (1995): 517‒39.
Ransom, Roger, and Richard Sutch. “Capitalists Without Capital: The Burden of Slavery and the Impact of Emancipation.” Agricultural History 62, no. 3 (1988): 133‒60.
Schafer, Judith Kelleher. “‘Guaranteed Against the Vices and Maladies Prescribed by Law’: Consumer Protection, the Law of Slave Sales, and the Supreme Court in Antebellum Louisiana.” The American Journal of Legal History 31, no. 4 (1987): 306‒21.
Tadman, Michael. Speculators and Slaves: Masters, Trades, and Slaves in the Old South. Madison: University of Wisconsin Press, 1989.
______. “The Reputation of the Slave Trader in Southern History and the Social Memory of the South.” American Nineteenth Century History 8, no. 3 (2007): 247‒71.