Embed Size (px)
Citation preview
1
DISCOMARK: Nuclear marker discovery from orthologous 1
sequences using low coverage genome data 2
Harald Detering*1,2,3, Sereina Rutschmann*1,2,3, Sabrina Simon4,5, Jakob Fredslund6, Michael 3
T. Monaghan1,2 4
Addresses: 51Leibniz-Institute of Freshwater Ecology and Inland Fisheries (IGB), Müggelseedamm 301, 6
12587 Berlin, Germany 72Berlin Center for Genomics in Biodiversity Research, Königin-Luise-Straße 6-8, 14195 8
Berlin, Germany 93Department of Biochemistry, Genetics and Immunology, University of Vigo, 36310 Vigo, 10
Spain 114Sackler Institute for Comparative Genomics, American Museum of Natural History, Central 12
Park West and 79th St., New York, NY 10024, USA 135Biosystematics Group, Wageningen University, Droevendaalsesteeg 1, 6708 PB 14
Wageningen, The Netherlands 156Alexandra Institute, Åbogade 34, 8200 Aarhus, Denmark 16
Keywords: 17
marker discovery, mayfly, non-model organism, primer design, phylogenetics 18
Correspondence: 19
Sereina Rutschmann, Phylogenomics Lab, Department of Biochemistry, Genetics and 20
Immunology, University of Vigo, 36310 Vigo, Spain. E-Mail: 21
* these authors contributed equally 23
Running title: 24
DISCOMARK - Phylogenetic marker development 25
.CC-BY 4.0 International licenseIt is made available under a (which was not peer-reviewed) is the author/funder, who has granted bioRxiv a license to display the preprint in perpetuity.
The copyright holder for this preprint. http://dx.doi.org/10.1101/047282doi: bioRxiv preprint first posted online Apr. 7, 2016;
2
Abstract 26
High-throughput sequencing has laid the foundation for fast and cost-effective development 27
of phylogenetic markers. Here we present the program DISCOMARK, which streamlines the 28
development of nuclear DNA (nDNA) markers from whole-genome (or whole-transcriptome) 29
sequencing data, combining local alignment, alignment trimming, reference mapping and 30
primer design based on multiple sequence alignments in order to design primer pairs from 31
input orthologous sequences. In order to demonstrate the suitability of DISCOMARK we 32
designed markers for two groups of species, one consisting of closely related species and one 33
group of distantly related species. For the closely related members of the species complex of 34
Cloeon dipterum s.l. (Insecta, Ephemeroptera), the program discovered a total of 77 markers. 35
Among these, we randomly selected eight markers for amplification and Sanger sequencing. 36
The exon sequence alignments (2,526 base pairs (bp)) were used to reconstruct a well 37
supported phylogeny and to infer clearly structured haplotype networks. For the distantly 38
related species we designed primers for several families in the insect order Ephemeroptera, 39
using available genomic data from four sequenced species. We developed primer pairs for 23 40
markers that are designed to amplify across several families. The DISCOMARK program will 41
enhance the development of new nDNA markers by providing a streamlined, automated 42
approach to perform genome-scale scans for phylogenetic markers. The program is written in 43
Python, released under a public license (GNU GPL v2), and together with a manual and 44
example data set available at: https://github.com/hdetering/discomark. 45
.CC-BY 4.0 International licenseIt is made available under a (which was not peer-reviewed) is the author/funder, who has granted bioRxiv a license to display the preprint in perpetuity.
The copyright holder for this preprint. http://dx.doi.org/10.1101/047282doi: bioRxiv preprint first posted online Apr. 7, 2016;
3
Introduction 46
The inference of phylogenetic relationships has benefited profoundly from the availability of 47
nuclear DNA (nDNA) sequences for an increasing number of organism groups. The 48
development of new phylogenetic markers has provided unprecedented insight into the 49
evolutionary relationships of non-model organisms in particular (Ellegren 2014). Large sets of 50
nDNA markers (single copy genes) have recently been designed for taxonomic groups for 51
which genomic resources were available, e.g. cichlid fish (Meyer et al. 2015), ray-finned fish 52
(Near et al. 2012), reptiles (Ruane et al. 2014), birds (Kerr et al. 2014) and flowering plants 53
(Zeng et al. 2014). However, for many taxonomic groups there are only a handful of nDNA 54
markers available that are suitable for phylogenetic reconstruction. Other approaches, such as 55
ultra-conserved element (UCE) sequencing (Faircloth et al. 2012), anchored hybrid 56
enrichment (Lemmon and Lemmon 2012), restriction site-associated DNA (RAD) sequencing 57
(Baird et al. 2008) or genotyping by sequencing (GBS, Elshire et al. 2011) have become 58
popular for addressing specific questions in systematics or population genetics; however, 59
these methods are still cost-intensive, require a comparatively high amount of starting DNA 60
material and can depend on the availability of reference genomes (e.g. anchored hybrid 61
enrichment). Consequently, standard Sanger sequencing approaches are still in high demand 62
for various research questions. 63
Identification of novel phylogenetic markers has been a predominantly manual process, 64
which impedes their large-scale development, and comprehensive primer design based on 65
large sets of multiple sequence alignments remains challenging. Recently, tools have been 66
developed for (1) specific primer design such as for automated primer design from 67
transcriptome data (SCRIMER, Morkovsky et al. 2015), for individual degenerate primers 68
(GEMI, Sobhy et al. 2012; PRIMER3, Untergasser et al. 2012; CEMASUITE, Lane et al. 2015), 69
.CC-BY 4.0 International licenseIt is made available under a (which was not peer-reviewed) is the author/funder, who has granted bioRxiv a license to display the preprint in perpetuity.
The copyright holder for this preprint. http://dx.doi.org/10.1101/047282doi: bioRxiv preprint first posted online Apr. 7, 2016;
4
for highly variable DNA targets (PRIMERDESIGN, Brodin et al. 2013; PRIMERDESIGN-M, 70
Yoon and Leitner 2015), viral genomes (PRISM, Yu et al. 2015), multiple primer design 71
(BATCHPRIMER3, You et al. 2008; PRIMERVIEW, O’Halloran 2015) and (2) the discovery of 72
specific markers, including single nucleotide polymorphism (SNP) markers (POLYMARKER, 73
Ramirez-Gonzalez et al. 2015), and putative single copy nuclear loci (MARKERMINER, 74
Chamala et al. 2015). In addition, the challenge of developing new markers lies both in the 75
discovery of conserved regions, the design of primer pairs and an estimation of their 76
suitability as phylogenetic markers. 77
Our aim was to develop a flexible, user-friendly program that works with FASTA-78
formatted files of putative orthologous sequences from whole-genome or whole-transcriptome 79
data, identified conserved regions and and designs primers based on these multiple sequence 80
alignments. Here we present DISCOMARK (=Discovery of Markers), a program for the 81
discovery of phylogenetically suitable nDNA markers and design of primer pairs. The 82
program can be used to easily screen for nDNA markers and design primers that can be used 83
for Sanger sequencing as well as high-throughput sequencing. The program is structured into 84
several steps that can be individually optimized by the user and run independently. In terms of 85
input the program can be applied on large and small sets of taxa, including both closely and 86
distantly related species. Ideally, orthologous sequences in combination with a whole-genome 87
reference sequence are used. Thus, exon/intron boundaries can be inferred using the reference 88
for each marker. Under the default settings, the program will design several primer pairs that 89
anneal in conserved regions. The visualization of the alignments with potential primers allows 90
the user to choose between primers targeting exons or introns (e.g. exon-primed intron-91
crossing (EPIC) markers). Additionally, information about the suitability as phylogenetic 92
markers is provided by an estimate of the number of SNPs per marker and the applicability 93
.CC-BY 4.0 International licenseIt is made available under a (which was not peer-reviewed) is the author/funder, who has granted bioRxiv a license to display the preprint in perpetuity.
The copyright holder for this preprint. http://dx.doi.org/10.1101/047282doi: bioRxiv preprint first posted online Apr. 7, 2016;
5
across species. Finally, we demonstrate the utility of DISCOMARK for (1) closely related 94
species (i.e. Cloeon dipterum s.l. species complex) using whole-genome data, and (2) 95
distantly related species (i.e. insect order Ephemeroptera) using whole-genome data derived 96
from genome sequencing projects. 97
Materials and Methods 98
DISCOMARK implementation 99
The program DISCOMARK is written in Python and is developed to design primer pairs in 100
conserved regions of predicted orthologous genes. Orthologs are most suited for phylogenetic 101
studies. The ortholog identification step is not part of the DISCOMARK workflow but 102
DISCOMARK is designed to directly work with the output of several ortholog prediction 103
programs, e.g. HAMSTR (Ebersberger et al. 2009), or Orthograph 104
(https://github.com/mptrsen/Orthograph, last accessed March 25, 2016). Orthologous groups 105
may be derived from genomic or transcriptomic sequencing data. In addition to the 106
orthologous genes, genomic data such as whole-genome sequencing data can be provided to 107
DISCOMARK as a guide to detect exon/intron boundaries. DISCOMARK performs seven steps, 108
combining Python scripts with widely used bioinformatics programs (Fig. 1). The steps: (1) 109
combine orthologous groups of sequences, (2) align sequences of each orthologous group 110
using MAFFT v.7.205 (Katoh and Standley 2013), (3) trim sequence alignments with TRIMAL 111
v.1.4 (Capella-Gutierrez et al. 2009), (4) align sequences against a reference (e.g. whole-112
genome dataset from the same or closely related taxa) with BLASTN v.2.2.29 (Altschul et al. 113
1997; Camacho et al. 2009) and re-alignment using MAFFT, (5) design primer pairs on 114
single-gene alignments using a modified version of PRIFI (Fredslund et al. 2005), adapted by 115
us into a Python package that uses BioPython v.1.65 and Python v.3.4.3, (6) check primer 116
.CC-BY 4.0 International licenseIt is made available under a (which was not peer-reviewed) is the author/funder, who has granted bioRxiv a license to display the preprint in perpetuity.
The copyright holder for this preprint. http://dx.doi.org/10.1101/047282doi: bioRxiv preprint first posted online Apr. 7, 2016;
6
specificity with BLASTN, and (7) generate output in several formats (visual HTML report, 117
tabular data and FASTA files of the primers). The results of each step can be inspected in the 118
respective output folders. 119
1 Combine sequences. In the first step, the putative orthologous sequences of different taxa 120
are combined according to the orthologous groups. The input files are expected to be 121
nucleotide sequences in FASTA format. We recommend using putative orthologous exon 122
sequences (e.g. CDS) in combination with whole-genome data (e.g. a draft genome 123
assembly). Each input file is expected to contain the sequences of one orthologous group; 124
orthologs of each input taxon are to be organized into a taxon folder. Importantly, file names 125
represent the ortholog identifiers used to combine orthologous sequences of the various input 126
taxa; by default, ortholog prediction tools follow that convention. 127
2 Align sequences. Orthologous sequences combined according to the orthologous groups are 128
separately aligned with the multiple sequence alignment (MSA) program MAFFT. Alignment 129
parameters can be specified by the user via a configuration file (discomark.conf, located in the 130
program folder). Default parameters are the following: ‘--localpair --maxiterate 16 --131
inputorder --preservecase --quiet’ (L-INS-i alignment method). We chose MAFFT as multiple 132
alignment tool because it combines accuracy and efficiency and has been adopted widely in 133
the scientific community (Pais et al. 2014; Szitenberg et al. 2015). 134
3 Trim alignments. In order to remove poorly aligned regions, sequence alignments are 135
trimmed using TRIMAL. The program TRIMAL analyzes the distribution of gaps and 136
mismatches in the alignment and discard alignment positions and sequences of low quality. 137
By default, DISCOMARK calls TRIMAL with the ‘-strictplus’ method. The preset is used by 138
TRIMAL to derive the specific thresholds for alignment trimming (minimum gap score, 139
.CC-BY 4.0 International licenseIt is made available under a (which was not peer-reviewed) is the author/funder, who has granted bioRxiv a license to display the preprint in perpetuity.
The copyright holder for this preprint. http://dx.doi.org/10.1101/047282doi: bioRxiv preprint first posted online Apr. 7, 2016;
7
minimum residue similarity score, conserved block size). Since alignment trimming largely 140
depends on the input data and influences the downstream results, TRIMAL can also be run with 141
different settings (e.g. ‘-gappyout’, ‘-strict’, ‘-automated1’; but see Capella-Gutierrez et al. 142
(2009). Alternatively, there is also the option to deactivate the alignment trimming with the 143
DISCOMARK option ‘--no-trim’ or use alternative trimming programs such as GBLOCKS 144
(Castresana 2000; Talavera and Castresana 2007) or GUIDANCE2 (Landan and Graur 2008; 145
Sela et al. 2015). 146
4 Blast and alignment to reference. In this step a genomic reference sequence for each input 147
ortholog is identified and added to the trimmed alignment. This step is particularly important 148
when working with coding sequences which do not contain intron sequences; thus, a genomic 149
sequence is needed to infer intron/exon boundaries. Working with coding sequences is 150
advisable for more distantly related taxa which may include intron length polymorphisms, or 151
to target EPIC markers. Any whole-genome data set (from one of the included taxa or a 152
closely related taxa) can be used as reference for mapping the ortholog sequences. Here, 153
mapping means that the input sequences are compared to the reference sequences, which are 154
defined by the user using the local alignment program BLASTN. The best locally aligning 155
reference sequence (the one that yields the longest alignment among all input sequences) for 156
each orthologous group is added to the corresponding sequence alignment. Reference 157
sequences are cut to 100 base pairs (bp) upstream and downstream of the first, respectively 158
last, BLAST hit to avoid alignment length inflation. Then, the extended alignments are re-159
aligned with MAFFT. The reference alignment step is optional; however, the inclusion of 160
whole-genome data is essential for estimating intron/exon boundaries. Given that information, 161
the focus of target sequences to be amplified can be on entire exon markers, EPIC markers, or 162
a combination. 163
.CC-BY 4.0 International licenseIt is made available under a (which was not peer-reviewed) is the author/funder, who has granted bioRxiv a license to display the preprint in perpetuity.
The copyright holder for this preprint. http://dx.doi.org/10.1101/047282doi: bioRxiv preprint first posted online Apr. 7, 2016;
8
5 Design primers. The single-gene alignments, after trimming, mapping and re-aligning to a 164
reference, are used as input to design primer pairs. We integrated the webtool PRIFI 165
(http://cgi-www.daimi.au.dk/cgi-chili/PriFi/main, last accessed December 20, 2015) as a 166
Python package that provides a comprehensive set of parameters. As default settings for 167
DISCOMARK we chose the following: estimated product length between 200-1,000 bp 168
(‘OptimalProductLength = [400, 600, 800, 1000], MinProductLength = 200, 169
MaxProductLength = 1000’), maximum number of ambiguity positions within the primer 170
sequences (‘MaxMismatches = 2’), primer length between 20-30 bp (‘MinPrimerLength = 20, 171
MaxPrimerLength = 30, OptimalPrimerLength = [20, 25]’), melting temperature of the primer 172
pairs between 50-60°C (‘MinTm = 50.0, MinTmWithMismatchesAllowed = 58.0, 173
SuggestedMaxTm = 60.0’), and we set the maximum number of primer pairs per alignment to 174
six (note: only settings different from the PRIFI default are mentioned above). The program 175
PRIFI was originally developed to design intron-spanning markers (but see Fredslund et al. 176
2005). Here we use it because it enables primer design based on MSA input. Parameters for 177
PRIFI can be specified in the DISCOMARK configuration file (‘discomark.conf’). 178
6 Check marker specificity. To ensure the specificity of the designed primer pairs, we 179
compare their sequences against the NCBI database (‘refseq_mrna’). Primer sequences are 180
searched in the NCBI database (‘refseq_mrna’) using the online BLASTN interface. The 181
default search settings are restricted to human and bacterial targets using the Entrez query 182
‘txid2[ORGN] OR txid9606[ORGN]’ because these are most likely to be present as 183
contaminants in sequencing libraries. The result hits of the BLAST search are indicated to the 184
user in the HTML output. 185
7 Visualize results. As final step, the program produces a HTML report containing the list of 186
.CC-BY 4.0 International licenseIt is made available under a (which was not peer-reviewed) is the author/funder, who has granted bioRxiv a license to display the preprint in perpetuity.
The copyright holder for this preprint. http://dx.doi.org/10.1101/047282doi: bioRxiv preprint first posted online Apr. 7, 2016;
9
designed primers, an alignment viewer and plots visualizing the discovered set of markers. 187
Besides the primer sequences the report lists several features such as the melting 188
temperatures, predicted sequence length, and the number of taxa amplified by each primer set. 189
Selected primer pairs and primer lists can be downloaded as FASTA or CSV files, 190
respectively. In order to provide a measure of the suitability of the markers for phylogenetic 191
reconstruction the program calculates the number of SNPs between a primer pair by 192
comparing the aligned input sequences against each other. The number of SNPs between each 193
primer pair is visualized in relation to the estimated product length (see Fig. 2 for an example) 194
and reported in the tabular output. Furthermore, the report highlights the species coverage 195
achieved by the discovered markers, i.e. how many species’ sequences each primer set is 196
expected to amplify, as an estimate of how universal each primer set can be applied. 197
Additionally, functional annotations are reported, if available, to guide the user in the 198
selection of markers of interest. Annotations can be supplied in form of a tab-delimited file 199
with the ‘-a’ option. In principle, any kind of annotations can be used depending on the 200
desired research objective. In our usage scenarios, we used gene ontology (GO) terms which 201
were retrieved by mapping the gene IDs contained in the HAMSTR core ortholog set via the 202
UniProt website (http://www.uniprot.org/, last accessed December 20, 2015). 203
Usage cases 204
Closely related species - Cloeon dipterum s.l. species complex. To test the suitability of 205
DISCOMARK for closely related species, we designed primer pairs for the species complex of 206
Cloeon dipterum s.l. (Ephemeroptera: Baetidae). The species complex consists of several 207
closely related species, including Cloeon peregrinator GATTOLLIAT & SARTORI, 2008 from 208
Madeira (Gattolliat et al. 2008; Rutschmann et al. 2014; Table 1). As input to design the 209
.CC-BY 4.0 International licenseIt is made available under a (which was not peer-reviewed) is the author/funder, who has granted bioRxiv a license to display the preprint in perpetuity.
The copyright holder for this preprint. http://dx.doi.org/10.1101/047282doi: bioRxiv preprint first posted online Apr. 7, 2016;
10
primer pairs data we used whole-genome sequencing data of Cloeon dipterum L. 1761 210
(Baetidae; Sequence Read Archive SRP050093) and expressed sequence tags (EST) of Baetis 211
sp. (Baetidae; FN198828-FN203024). The sequence reads of C. dipterum were trimmed and 212
de novo assembled using NEWBLER v.2.5.3 (454 Life Science Corporation) under the default 213
settings for large datasets. Ortholog sequences prediction of both data sets was performed 214
with HAMSTR v.9 using the insecta_hmmer3-2 core reference taxa set (http://www.deep-215
phylogeny.org/hamstr/download/datasets/hmmer3/insecta_hmmer3-2.tar.gz, last accessed 216
December 20, 2015), including 1,579 orthologous genes. We ran the program DISCOMARK 217
with default settings (‘python run_project.py -i input/Cloeon -i input/Baetis -r 218
input/reference/Cloeon.fa -a input/co2go.ixosc.csv -d output/cloeon_baetis’), using the 219
predicted orthologs from HAMSTR and the whole-genome Cloeon-data as reference (step 4). 220
The Pearson correlation between the number of SNPs between primer pairs and 221
corresponding estimated product length was calculated using the function cor within the stats 222
package for R (R Development Core Team, 2016). A t-test for significance was performed 223
using the function cor.test. 224
From the total of designed primer pairs (77 markers, 338 primer pairs, see results) we 225
selected eight and amplified them for four species of the C. dipterum species complex (Table 226
1) in the laboratory. We used standardized polymerase chain reactions (PCR; 35-40 PCR 227
cycles with annealing temperature of 55°C), followed by Sanger sequencing. Forward and 228
reverse sequences were assembled and edited with GENEIOUS R7 v.7.1.3 (Biomatters Ltd.), 229
indicating ambiguous positions following the IUPAC nucleotide codes. Heterozygous 230
sequences were decoded with CODONCODEALIGNER v.3.5.6 (CodonCode Corporation) using 231
the find and split heterozygous function. Multiple sequence alignments were created for all 232
.CC-BY 4.0 International licenseIt is made available under a (which was not peer-reviewed) is the author/funder, who has granted bioRxiv a license to display the preprint in perpetuity.
The copyright holder for this preprint. http://dx.doi.org/10.1101/047282doi: bioRxiv preprint first posted online Apr. 7, 2016;
11
sequences per marker. The predicted orthologous sequences of Baetis sp. were used as 233
reference to infer the exon-intron splicing boundaries (canonical and non-canonical splice site 234
pairs). The final sequence alignments were checked for the occurrence of stop codons and 235
indels, and split into exon and intron parts using a custom Python script 236
(https://github.com/srutschmann/python_scripts, last accessed March 28, 2016). Sequence 237
alignments were phased using the program PHASE v.2.1.1 (Stephens et al. 2001; Stephens 238
and Donnelly 2003) with a cutoff value of 0.6 (Harrigan et al. 2008; Garrick et al. 2010), 239
whereby input and output files were formatted using the Perl scripts included in SEQPHASE 240
(Flot 2010). Heterozygous sites that could not be resolved were coded as ambiguity codes for 241
subsequent analyses. After phasing, all alignments were re-aligned with MAFFT. The number 242
of variable and informative sites, and the nucleotide diversity per exon alignment was 243
calculated with a custom script. 244
To investigate the heterogeneity of each marker´s DNA sequences, we reconstructed 245
haplotype networks, using FITCHI (Matschiner 2015). As input for each marker we inferred a 246
gene tree using the program RAXML v.8 (Stamatakis 2014) with the GTRCAT model and 247
1,000 bootstrap replicates under the rapid bootstrap algorithm. The phylogenetic relationships 248
were calculated with Bayesian inference, using MRBAYES v.3.2.3 (Ronquist et al. 2012) 249
based on a concatenated nDNA matrix that consisted of the exon sequences from all 15 250
nDNA markers. The best-fitting model of molecular evolution for each sequence alignment 251
was selected via a BIC criterion in JMODELTEST v.2.1 (Guindon and Gascuel 2003; Darriba et 252
al. 2012). We calculated 106 generations with random seed, a burn-in of 25% and four 253
MCMC chains. As an outgroup we used the predicted orthologous sequences of Baetis sp.. 254
.CC-BY 4.0 International licenseIt is made available under a (which was not peer-reviewed) is the author/funder, who has granted bioRxiv a license to display the preprint in perpetuity.
The copyright holder for this preprint. http://dx.doi.org/10.1101/047282doi: bioRxiv preprint first posted online Apr. 7, 2016;
12
Distantly related species - insect order Ephemeroptera. In this test case, we used contigs 255
derived from whole-genome sequencing projects of the species Baetis sp. (Baetidae; 256
BioProject PRJNA219528), Ephemera danica MÜLLER 1764 (Ephemeridae; BioProject 257
PRJNA219552), Eurylophella sp. (Ephemerellidae; BioProject PRJNA219556), and 258
Isonychia bicolor WALKER 1853 (Isonychiidae; BioProject PRJNA219568). The contigs from 259
each species were used for ortholog predicting with HAMSTR v.13.2.4 260
(http://sourceforge.net/projects/hamstr/files/hamstr.v13.2.4.tar.gz, last accessed December 20, 261
2015). We ran DISCOMARK with the default settings, using the Baetis sp. data as reference 262
(‘python run_project.py -i input/Baetis -i input/Ephemera -i input/Eurylophella -i 263
input/Isonychia -r input/references/Baetis.fa -a input/co2go.ixosc.csv -d output/mayflies’). 264
Results 265
Closely related species - species complex of Cloeon dipterum s.l. 266
DISCOMARK identified a total of 804 nDNA markers and 77 alignments with 338 primer pairs 267
for orthologous sequences of both species (Baetis sp. and C. dipterum s.l.). Ortholog 268
prediction yielded 403 orthologous sequences for the Baetis sp. EST-data and 1,211 for C. 269
dipterum. For the individual species, DISCOMARK identified 790 markers for C. dipterum and 270
123 for Baetis sp. The lengths of the markers including both species were between 201 and 271
925 bp with median length of 451.5 bp. The number of SNPs per marker ranged from zero to 272
37 (median: 5) with an average of one SNP per 68 bp. Marker length and number of SNPs 273
were correlated with a Pearson's correlation coefficient of 0.35 (Pearson's product-moment 274
correlation P < 0.001). The total run time for this data set on a local Linux machine (quad-275
core Intel i5, 8 GB RAM) was 24 min. 276
.CC-BY 4.0 International licenseIt is made available under a (which was not peer-reviewed) is the author/funder, who has granted bioRxiv a license to display the preprint in perpetuity.
The copyright holder for this preprint. http://dx.doi.org/10.1101/047282doi: bioRxiv preprint first posted online Apr. 7, 2016;
13
The haplotype networks based on the eight selected markers showed a clear structure for 277
all markers, including two markers with shared haplotypes for the two species from the U.S. 278
and Madeira (Fig. 3 and Fig. S1, Supporting information). The length of the concatenated 279
sequence alignment of the eight markers was 3,530 bp (2,526 bp exon sequence, Table S1, 280
Supporting information). The exon sequence matrix contained 78 variable sites, 27 281
informative sites, and was 92.6% complete. The nucleotide diversity ranged between 0.009 282
and 0.028 (median: 0.013). Phylogenetic tree reconstruction based on these eight markers 283
resulted in a phylogeny with fully resolved nodes (Bayesian posterior probability (PP) ≥ 95%; 284
Fig. 3). The species C. dipterum sp1 was found as outgroup to a clade containing the species 285
C. dipterum sp2 from Switzerland and the two species from the U.S and Madeira. The latter 286
two species formed a monophyletic clade. 287
Distantly related species - insect order Ephemeroptera 288
In total, we found 22 orthologs with a total of 48 primer pairs for all four species (Table S2, 289
Supporting information). The input files per species (i.e. putative orthologous sequences) 290
ranged from 1,445 to 1,523. We detected 41 markers that covered three of the species (99 291
primer pairs), 81 markers covering two species (210 primer pairs), and 117 markers that 292
covered any single species (478 primer pairs). For the individual species, Baetis sp. had the 293
most markers available (214) of the single- and multi-species markers. There were 138 294
markers for Eurylophella sp., 107 markers for I. bicolor, and 88 markers for E. danica. The 295
lengths for all markers covering all four species varied between 216 and 997 bp with median 296
of 398.5 bp, containing between 39 and 298 SNPs per marker (Fig. 2,) with a SNP every 4.1 297
bp on average. Marker length and number of SNPs were correlated with a Pearson's 298
correlation coefficient of 0.97 (Pearson's product-moment correlation P < 0.001). Run time 299
.CC-BY 4.0 International licenseIt is made available under a (which was not peer-reviewed) is the author/funder, who has granted bioRxiv a license to display the preprint in perpetuity.
The copyright holder for this preprint. http://dx.doi.org/10.1101/047282doi: bioRxiv preprint first posted online Apr. 7, 2016;
14
for this data set on a Linux client (quad-core Intel i5, 8 GB RAM) was 46 min. 300
Discussion 301
To our knowledge, the program DISCOMARK is the first stand-alone program with the aim of 302
designing primer pairs based on multiple sequence alignments on a genome-wide scale. The 303
visual output gives guidance on the suitability of each marker (i.e. variability within and 304
between species measured as number of SNPs, and information about the included species of 305
each marker. Using this approach, primers can be specifically chosen to match the 306
‘phylogenetic scale’ (i.e. for closely related species many markers with intermediate number 307
of SNPs and for distantly related species fewer markers with generally higher number of 308
SNPs can be selected. The automatic processing, including combining, aligning, trimming 309
and blasting sequences of any nucleotide FASTA sequences together with the produced 310
graphical output significantly facilitate the design of primer pairs for a large number of nDNA 311
markers. Nevertheless, users retain a high degree of flexibility by the stepwise nature of the 312
workflow. DISCOMARK is free, open-source software to assist the development of markers for 313
non-model species on the genome scale. We demonstrated the efficacy of our approach for 314
closely related species as well as for members of divergent families within an order of insects. 315
Using a reference genome enabled resolution of intron-exon boundaries but is not a strict 316
requirement for marker design. 317
Markers development within the order Ephemeroptera 318
The usage of DISCOMARK adds an extensive set of new potential nDNA markers to the ones 319
that have been used to date for mayfly phylogenies based on individual genes (histone 3, 320
elongation factor 1 alpha, phosphenolpyruvate carboxykinase (Vuataz et al. 2011; Pereira-da-321
.CC-BY 4.0 International licenseIt is made available under a (which was not peer-reviewed) is the author/funder, who has granted bioRxiv a license to display the preprint in perpetuity.
The copyright holder for this preprint. http://dx.doi.org/10.1101/047282doi: bioRxiv preprint first posted online Apr. 7, 2016;
15
Conceicoa et al. 2012; Vuataz et al. 2013). Most recent phylogenetic reconstructions are still 322
mostly based on the information of mitochondrial DNA markers (e.g. Rutschmann et al. 323
2014; Macher et al. 2016). The availability of more genome data will be very valuable in 324
order to increase the number of markers suitable for phylogenetic studies. The use of the 325
larger marker set for C. dipterum developed here resulted in a fully resolved phylogenetic tree 326
in contrast to Rutschmann et al. (2014). The availability of more markers promote fine-scaled 327
phylogenetic studies, which are needed to resolve the phylogenetic relationships of so-called 328
morphologically cryptic species that can not be resolved with standard markers (Dijkstra et al. 329
2014). 330
Acknowledgements 331
We are thankful to our research groups, in particular the Phylogenomics Lab at the University 332
of Vigo for constructive discussion that improved this project. Research was partially 333
supported by the Leibniz Association (PAKT für Forschung und Innovation “FREDIE” 334
project) and the Swiss National Science Foundation (Early PostDoc.Mobility grant 335
P2SKP3_15869 to S.R.). This is publication number ### of the Berlin Center for Genomics in 336
Biodiversity Research. 337
References 338
Altschul SF, Madden TL, Schaffer AA et al. (1997) Gapped BLAST and PSI-BLAST: a new 339generation of protein database search programs. Nucleic Acids Research, 25, 3389-3402. 340
Baird NA, Etter PD, Atwood TS et al. (2008) Rapid SNP Discovery and Genetic Mapping 341Using Sequenced RAD Markers. PLoS ONE, 3, e3376. 342
Brodin J, Krishnamoorthy M, Athreya G et al. (2013) A multiple-alignment based primer 343design algorithm for genetically highly variable DNA targets. BMC Bioinformatics, 14, 344255. 345
Camacho C, Coulouris G, Avagyan V et al. (2009) BLAST+: architecture and applications. 346BMC Bioinformatics, 10, 421. 347
Capella-Gutierrez S, Silla-Martinez JM, Gabaldon T (2009) trimAl: a tool for automated 348alignment trimming in large-scale phylogenetic analyses. Bioinformatics, 25, 1972-1973. 349
.CC-BY 4.0 International licenseIt is made available under a (which was not peer-reviewed) is the author/funder, who has granted bioRxiv a license to display the preprint in perpetuity.
The copyright holder for this preprint. http://dx.doi.org/10.1101/047282doi: bioRxiv preprint first posted online Apr. 7, 2016;
16
Castresana J (2000) Selection of conserved blocks from multiple alignments for their use in 350phylogenetic analysis. Molecular Biology and Evolution, 17, 540-552. 351
Chamala S, García N, Godden GT et al. (2015) MarkerMiner 1.0: new application for 352phylogenetic marker development using angiosperm transcriptomes. Applications in Plant 353Sciences, 4, 1400115. 354
Dijkstra KD, Monaghan MT, Pauls SU (2014) Freshwater biodiversity and aquatic insect 355diversification. Annual Review of Entomology, 59, 143-163. 356
Darriba D, Taboada GL, Doallo R, Posada D (2012) jModelTest 2: more models, new 357heuristics and parallel computing. Nature Methods, 9, 772. 358
Ebersberger I, Strauss S, von Haeseler A (2009) HaMStR: profile hidden markov model 359based search for orthologs in ESTs. BMC Evolutionary Biology, 9, 157. 360
Ellegren H (2014) Genome sequencing and population genomics in non-model organisms. 361Trends in Ecology & Evolution, 29, 51-63. 362
Elshire RJ, Glaubitz JC, Sun Q et al. (2011) A robust, simple genotyping-by-sequencing 363(GBS) approach for high diversity species. PLoS ONE, 6, e19379. 364
Faircloth BC, McCormack JE, Crawford NG et al. (2012) Ultraconserved elements anchor 365thousands of genetic markers spanning multiple evolutionary timescales. Systematic 366Biology, 61, 717-726. 367
Flot J-F (2010) seqphase: a web tool for interconverting phase input/output files and fasta 368sequence alignments. Molecular Ecology Resources, 10, 162-166. 369
Fredslund J, Schauser L, Madsen LH, Sandal N, Stougaard J (2005) PriFi: using a multiple 370alignment of related sequences to find primers for amplification of homologs. Nucleic 371Acids Research, 33, W516-520. 372
Garrick RC, Sunnucks P, Dyer RJ (2010) Nuclear gene phylogeography using PHASE: 373dealing with unresolved genotypes, lost alleles, and systematic bias in parameter 374estimation. BMC Evolutionary Biology, 10, 118. 375
Gattolliat J-L, Hugher SJ, Monaghan MT, Sartori M (2008) Revision of Mdeiran mayflies 376(Insecta, Ephemeroptera). Zootaxa, 1957, 69-80. 377
Guindon S, Gascuel O (2003) A simple, fast, and accurate algorithm to estimate large 378phylogenies by maximum likelihood. Systematic Biology, 52, 696-704. 379
Harrigan RJ, Mazza ME, Sorenson MD (2008) Computation vs. cloning: evaluation of two 380methods for haplotype determination. Molecular Ecology Resources, 8, 1239-1248. 381
Katoh K, Standley DM (2013) MAFFT multiple sequence alignment software version 7: 382improvements in performance and usability. Molecular Biology and Evolution, 30, 772-383780. 384
Kerr KCR, Cloutier A, Baker AJ (2014) One hundred new universal exonic markers for birds 385developed from a genomic pipeline. Journal of Ornithology, 155, 561-569. 386
Landan G, Graur D (2008) Local reliability measures from sets of co-optimal multiple 387sequence alignments. Pacific Symposium on Biocomputing, 15-24. 388
Lane CE, Hulgan D, O'Quinn K, Benton MG (2015) CEMAsuite: open source degenerate 389PCR primer design. Bioinformatics, 31, 3688-3690. 390
Lemmon AR, Lemmon EM (2012) High-throughput identification of informative nuclear loci 391for shallow-scale phylogenetics and phylogeography. Systematic Biology, 61, 745-761. 392
Macher JN, Salis RK, Blakemore KS, Tollrian R, Matthaei CD et al. (2016) Multiple- stressor 393effects on stream invertebrates: DNA barcoding reveals contrasting responses of cryptic 394mayfly species. Ecological Indicators, 61, 159-169. 395
.CC-BY 4.0 International licenseIt is made available under a (which was not peer-reviewed) is the author/funder, who has granted bioRxiv a license to display the preprint in perpetuity.
The copyright holder for this preprint. http://dx.doi.org/10.1101/047282doi: bioRxiv preprint first posted online Apr. 7, 2016;
17
Matschiner M (2015) Fitchi: haplotype genealogy graphs based on the Fitch algorithm. 396Bioinformatics, doi:10.1093/biooinformatics/btv717. 397
Meyer BS, Matschiner M, Salzburger W (2015) A tribal level phylogeny of Lake Tanganyika 398cichlid fishes based on a genomic multi-marker approach. Molecular Phylogenetics and 399Evolution, 83, 56-71. 400
Morkovsky L, Paces J, Ridl J, Reifova R (2015) Scrimer: designing primers from 401transcriptome data. Molecular Ecology Resources, 15, 1415-1420. 402
Near TJ, Eytan RI, Dornburg A, Kuhn KL, Moore JA et al. (2012) Resolution of ray-finned 403fish phylogeny and timing of diversification. Proceedings of the National Academy of 404Sciences, 109, 13698-13703. 405
O’Halloran DM (2015) PrimerView: high-throughput primer design and visualization. Source 406Code for Biology and Medicine, 10, 8. 407
Pais FS, Ruy Pde C, Oliveira G, Coimbra RS (2014) Assessing the efficiency of multiple 408sequence alignment programs. Algorithms for Molecular Biology, 9, 4. 409
Pereira-da-Conceicoa LL, Price BW, Barber-James HM, Barker NP, de Moor FC et al. (2012) 410Cryptic variation in an ecological indicator organism: mitochondrial and nuclear DNA 411sequence data confirm distinct lineages of Baetis harrisoni Barnard (Ephemeroptera: 412Baetidae) in southern Africa. BMC Evolutionary Biology, 12, 26. 413
R Core Team (2016) R: A Language and Environment for Statistical Computing. R 414Foundation for Statistical Computing, Vienna, Austria. ISBN 3-900051-07-0, available at: 415https://www.R-project.org (last acessed 26 March 2016). 416
Ramirez-Gonzalez RH, Uauy C, Caccamo M (2015) PolyMarker: A fast polyploid primer 417design pipeline. Bioinformatics, 31, 2038-2039. 418
Ronquist F, Teslenko M, van der Mark P, Ayres DL, Darling A et al. (2012) MrBayes 3.2: 419efficient Bayesian phylogenetic inference and model choice across a large model space. 420Systematic Biology, 61, 539-542. 421
Ruane S, Bryson RW, Jr., Pyron RA, Burbrink FT (2014) Coalescent species delimitation in 422milksnakes (genus Lampropeltis) and impacts on phylogenetic comparative analyses. 423Systematic Biology, 63, 231-250. 424
Rutschmann S, Gattolliat JL, Hughes SJ, Báez M, Sartori M et al. (2014) Evolution and 425island endemism of morphologically cryptic Baetis and Cloeon species (Ephemeroptera, 426Baetidae) on the Canary Islands and Madeira. Freshwater Biology, 59, 2516-2527. 427
Sela I, Ashkenazy H, Katoh K, Pupko T (2015) GUIDANCE2: accurate detection of 428unreliable alignment regions accounting for the uncertainty of multiple parameters. Nucleic 429Acids Research, 43, W7-14. 430
Sobhy H, Haitham S, Philippe C (2012) Gemi: PCR primers prediction from multiple 431alignments. Comparative and Functional Genomics, 2012, 1-5. 432
Stamatakis A (2014) RAxML version 8: a tool for phylogenetic analysis and post-analysis of 433large phylogenies. Bioinformatics, 30, 1312-1313. 434
Stephens M, Donnelly P (2003) A comparison of bayesian methods for haplotype 435reconstruction from population genotype data. The American Journal of Human Genetics, 43673, 1162-1169. 437
Stephens M, Smith NJ, Donnelly P (2001) A new statistical method for haplotype 438reconstruction from population data. The American Journal of Human Genetics, 68, 978-439989. 440
Szitenberg A, John M, Blaxter ML, Lunt DH (2015) ReproPhylo: An Environment for 441Reproducible Phylogenomics. PLoS Computational Biology, 11, e1004447. 442
.CC-BY 4.0 International licenseIt is made available under a (which was not peer-reviewed) is the author/funder, who has granted bioRxiv a license to display the preprint in perpetuity.
The copyright holder for this preprint. http://dx.doi.org/10.1101/047282doi: bioRxiv preprint first posted online Apr. 7, 2016;
18
Talavera G, Castresana J (2007) Improvement of phylogenies after removing divergent and 443ambiguously aligned blocks from protein sequence alignments. Systematic Biology, 56, 444564-577. 445
Untergasser A, Cutcutache I, Koressaar T et al. (2012) Primer3—new capabilities and 446interfaces. Nucleic Acids Research, 40, e115. 447
Vuataz L, Sartori M, Gattolliat JL, Monaghan MT (2013) Endemism and diversification in 448freshwater insects of Madagascar revealed by coalescent and phylogenetic analysis of 449museum and field collections. Molecular Phylogenetics and Evolution, 66, 979-991. 450
Vuataz L, Sartori M, Wagner A, Monaghan MT (2011) Toward a DNA taxonomy of Alpine 451Rhithrogena (Ephemeroptera: Heptageniidae) using a mixed Yule-coalescent analysis of 452mitochondrial and nuclear DNA. PLoS ONE, 6, e19728. 453
Yoon H, Leitner T (2015) PrimerDesign-M: a multiple-alignment based multiple-primer 454design tool for walking across variable genomes. Bioinformatics, 31, 1472-1474. 455
You FM, Huo N, Gu YQ, Luo MC, Ma Y et al. (2008) BatchPrimer3: a high throughput web 456application for PCR and sequencing primer design. BMC Bioinformatics, 9, 253. 457
Yu L, Barakat E, Di Francesco J, Herzig HP (2015) Two-dimensional polymer grating and 458prism on Bloch surface waves platform. Optics Express, 23, 31640-31647. 459
Zeng L, Zhang Q, Sun R, Kong H, Zhang N et al. (2014) Resolution of deep angiosperm 460phylogeny using conserved nuclear genes and estimates of early divergence times. Nature 461Communications, 5, 4956. 462
.CC-BY 4.0 International licenseIt is made available under a (which was not peer-reviewed) is the author/funder, who has granted bioRxiv a license to display the preprint in perpetuity.
The copyright holder for this preprint. http://dx.doi.org/10.1101/047282doi: bioRxiv preprint first posted online Apr. 7, 2016;
19
Data Accessibility 463
The program, user manual and example data sets are freely available at: 464https://github.com/hdetering/discomark (last accessed March 28, 2016). Scripts used for the 465analyses are available at: https://github.com/srutschmann/python_scripts (last accessed March 46628, 2016). All DNA sequences from this study are available under GenBank accessions: 467KU987258-KU987260, KU987265- KU987268, KU987273- KU987276, KU987285- 468KU987288. GenBank accession numbers for sequences included in previous studies are the 469following: KU971838-KU971840, KU971851, KU972090-KU972092, KU972104, 470KU972490-KU972492, KU972503, KU973060-KU973061, KU973074. 471
Author Contributions 472
S.R., H.D., S.S., and M.T.M. conceived the study. S.R. coordinated the project and performed 473the empirical analyses. H.D. implemented the program in Python. S.R. and H.D. drafted the 474manuscript. S.S. gave guidance for the ortholog prediction. J.F. provided the code of the PriFi 475web tool. All authors gave helpful comments to the manuscript and approved the final 476version. 477
.CC-BY 4.0 International licenseIt is made available under a (which was not peer-reviewed) is the author/funder, who has granted bioRxiv a license to display the preprint in perpetuity.
The copyright holder for this preprint. http://dx.doi.org/10.1101/047282doi: bioRxiv preprint first posted online Apr. 7, 2016;

20
Tables 478
Table 1 List of species used for the usage examples of the closely related species; Cloeon 479dipterum s.l. species complex. 480
481
Species Voucher Acc. no. cox1 Geographical origin Cloeon dipterum sp1 SR21B07 KJ631626 Switzerland Cloeon dipterum sp2 SR21B06 KJ631625 Switzerland Cloeon dipterum sp3 US KU757184 U.S. Cloeon peregrinator SR23A10 KU757122 Madeira
482
.CC-BY 4.0 International licenseIt is made available under a (which was not peer-reviewed) is the author/funder, who has granted bioRxiv a license to display the preprint in perpetuity.
The copyright holder for this preprint. http://dx.doi.org/10.1101/047282doi: bioRxiv preprint first posted online Apr. 7, 2016;
21
Figures 483
484
485
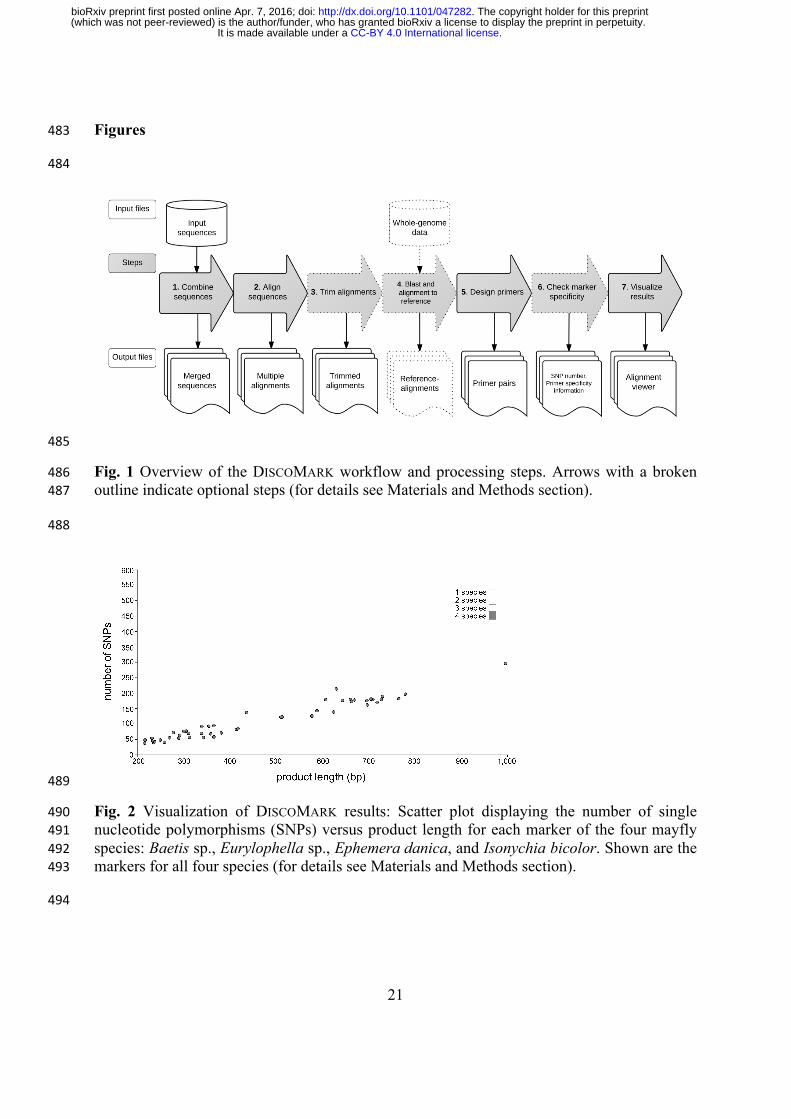
Fig. 1 Overview of the DISCOMARK workflow and processing steps. Arrows with a broken 486outline indicate optional steps (for details see Materials and Methods section). 487
488
489
Fig. 2 Visualization of DISCOMARK results: Scatter plot displaying the number of single 490nucleotide polymorphisms (SNPs) versus product length for each marker of the four mayfly 491species: Baetis sp., Eurylophella sp., Ephemera danica, and Isonychia bicolor. Shown are the 492markers for all four species (for details see Materials and Methods section). 493
494
.CC-BY 4.0 International licenseIt is made available under a (which was not peer-reviewed) is the author/funder, who has granted bioRxiv a license to display the preprint in perpetuity.
The copyright holder for this preprint. http://dx.doi.org/10.1101/047282doi: bioRxiv preprint first posted online Apr. 7, 2016;
22
495
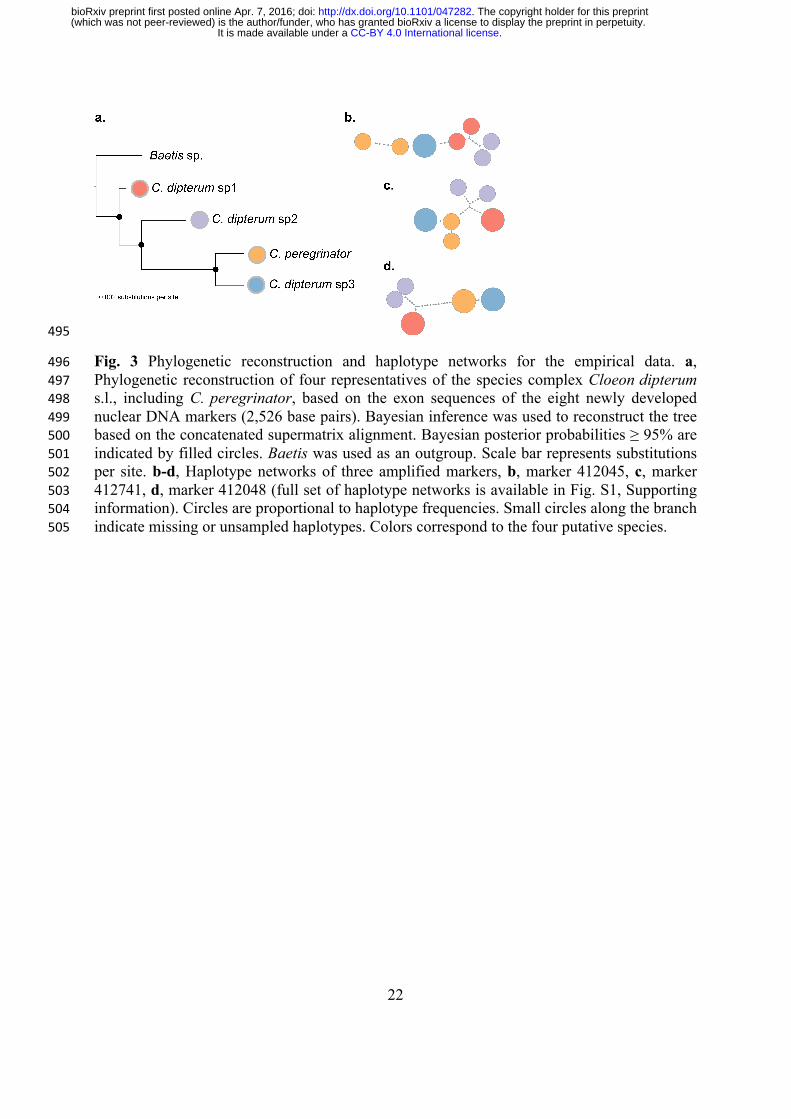
Fig. 3 Phylogenetic reconstruction and haplotype networks for the empirical data. a, 496Phylogenetic reconstruction of four representatives of the species complex Cloeon dipterum 497s.l., including C. peregrinator, based on the exon sequences of the eight newly developed 498nuclear DNA markers (2,526 base pairs). Bayesian inference was used to reconstruct the tree 499based on the concatenated supermatrix alignment. Bayesian posterior probabilities ≥ 95% are 500indicated by filled circles. Baetis was used as an outgroup. Scale bar represents substitutions 501per site. b-d, Haplotype networks of three amplified markers, b, marker 412045, c, marker 502412741, d, marker 412048 (full set of haplotype networks is available in Fig. S1, Supporting 503information). Circles are proportional to haplotype frequencies. Small circles along the branch 504indicate missing or unsampled haplotypes. Colors correspond to the four putative species. 505
.CC-BY 4.0 International licenseIt is made available under a (which was not peer-reviewed) is the author/funder, who has granted bioRxiv a license to display the preprint in perpetuity.
The copyright holder for this preprint. http://dx.doi.org/10.1101/047282doi: bioRxiv preprint first posted online Apr. 7, 2016;