Embed Size (px)
Citation preview

University of North DakotaUND Scholarly Commons
Theses and Dissertations Theses, Dissertations, and Senior Projects
January 2017
Sequence Stratigraphy Of The Tyler Formation(Mississippian-Pennsylvanian) In Dickinson Field,Stark County, North DakotaMichael Christopher Farzaneh
Follow this and additional works at: https://commons.und.edu/theses
This Thesis is brought to you for free and open access by the Theses, Dissertations, and Senior Projects at UND Scholarly Commons. It has beenaccepted for inclusion in Theses and Dissertations by an authorized administrator of UND Scholarly Commons. For more information, please [email protected].
Recommended CitationFarzaneh, Michael Christopher, "Sequence Stratigraphy Of The Tyler Formation (Mississippian-Pennsylvanian) In Dickinson Field,Stark County, North Dakota" (2017). Theses and Dissertations. 2207.https://commons.und.edu/theses/2207

Sequence Stratigraphy of the Tyler Formation (Mississippian-Pennsylvanian) in Dickinson Field, Stark County, North Dakota
by
Michael Christopher Farzaneh
Bachelor of Science, Rutgers University-New Brunswick, 2015
A Thesis
Submitted to the Graduate Faculty
of the
University of North Dakota
in partial fulfillment of the requirements
for the degree of
Master of Science
Grand Forks, North Dakota
Dec 2017

ii
Copyright 2017 Michael Farzaneh


iv
Permission
Title Sequence Stratigraphy of the Tyler Formation (Mississippian-Pennsylvanian) in Dickinson Field, Stark County, North Dakota
Department Harold Hamm School of Geology and Geological Engineering
Degree Master of Science
In presenting this thesis in partial fulfillment of the requirements for a graduate degree from the University of North Dakota, I agree that the library of this University shall make it freely available for inspection. I further agree that permission for extensive copying for scholarly purposes may be granted by the professor who supervised my thesis work, or in his absence by the Chairperson of the department or the dean of the School Graduate Studies. It is understood that any copying or publication or other use of this thesis or part thereof for financial gain shall not be allowed without my written permission. It is also understood that due recognition shall be given to me and to the University of North Dakota in any scholarly use which may be made of any material in my thesis.
Michael Christopher Farzaneh
11/28/17

v
Table of Contents
LIST OF FIGURES.………………………………………………………...………...……vi
ACKNOWLEDGEMENTS……………………......……………………………...…...…...vii
ABSTRACT………………………......……………………………………………...….......viii
CHAPTER I
I. INTRODUCTION……………………………………………………...……1
a. Hypothesis
b. Area of Study
c. Literature Review
d. Methodology
e. Statement of Problem
II. RESULTS……………………………………………………………………10
a. Facies
b. Thin Sections
c. Cross Sections
III. DISCUSSION………………………………………………………………...30
IV. CONCLUSIONS…………………………………………………………..…46
APPENDICES
REFERENCES

vi
2
3
4
11
12
13
15
16
20
22
24
LIST OF FIGURES
Figure 1. Map of study area and surrounding area.
Figure 2. Structure contour map of study area.
Figure 3. Stratigraphic column from previous research and publication.
Figure 4. An idealized stratigraphic column for Upper Tyler.
Figure 5. An idealized stratigraphic column for Lower Tyler.
Figure 6. A stratigraphic column based upon observed data.
Figure 7. Sandstone composite image showing varying sandstone lithology.
Figure 8. Paleosol composite image showing varying paleosol lithology.
Figure 9. Limestone composite image showing varying limestone lithology.
Figure 10. Thin section composite image and the data they provided.
Figure 11. Log analysis picture showing log signals for various lithologies.
Figure 12. Map of cross section trend lines. 25
Figure 13. Cross section A to A’. 26
Figure 14. Cross section B to B’. 27
Figure 15. Cross section C to C’. 28
Figure 16. Summary of facies, sea level and paleoenvironment. 39
Figure 17. Modified Sturm paleogeography maps of Tyler deposition. 45

vii
ACKNOWLEGEMENTS
I wish to thank my advisory committee for guidance, support and knowledge during my time in
the master’s program at the University of North Dakota. I would like to thank North Dakota
Geological Survey, and the Wilson Laird Core and Sample Library for allowing me to use their
core for my research. I would like to thank the staff that worked there as well for providing
valuable insight into Tyler geological knowledge.
I would like to thank my mother and father who never once gave up on me and always pushed
me to reach my potential.

DEDICATION
To Gian Lorenzo Bernini, who inspires me to capturethe beauty of the universe.

viii
Abstract
Applying sequence stratigraphy methods to the Tyler Formation (Mississippian-
Pennsylvanian) can yield valuable data about Tyler geological history. The Tyler Formation has
14 facies across that are consistent across the Dickinson Field, Stark County, North Dakota. The
Upper Tyler is a marine dominated environment with large limestone and black shale deposits
with an overlying smaller terrestrial deposit capped by a paleosol. The Upper Tyler records a
single sea level rise and fall cycle. The Lower Tyler is a deltaic environment with several
sandstone deposits. The Lower Tyler has 3 paleosols overlying a coarsening upward pattern of
marine shales to nearshore and channel sands. The Lower Tyler records at least two sequence
boundaries. Sequence boundaries are consistent across the field and are a possible surface to
correlate across the basin.
1
CHAPTER I
INTRODUCTION
Area of study
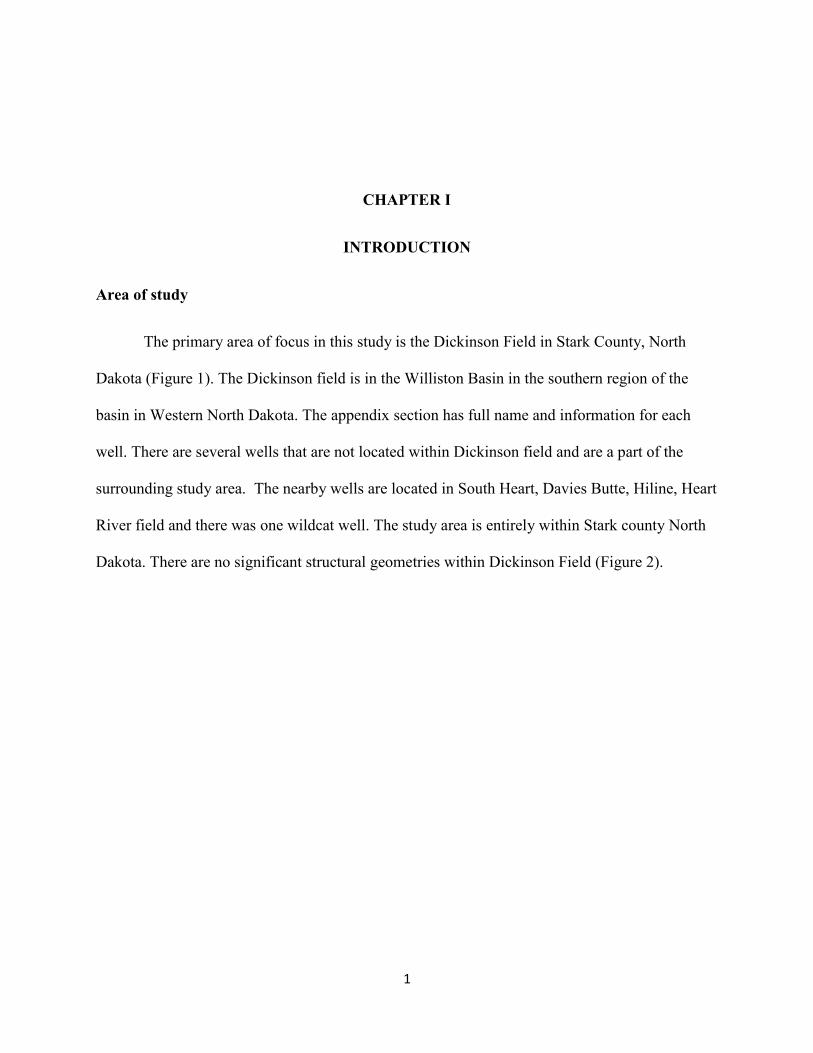
The primary area of focus in this study is the Dickinson Field in Stark County, North
Dakota (Figure 1). The Dickinson field is in the Williston Basin in the southern region of the
basin in Western North Dakota. The appendix section has full name and information for each
well. There are several wells that are not located within Dickinson field and are a part of the
surrounding study area. The nearby wells are located in South Heart, Davies Butte, Hiline, Heart
River field and there was one wildcat well. The study area is entirely within Stark county North
Dakota. There are no significant structural geometries within Dickinson Field (Figure 2).

ValleyGolden
Billings
Stark
Dunn
Dunn
Slope
Hettinger
Bowman
Morton
Oliver
Adams Sioux
Mercer
McKenzie
WardMountrail
Williams
Divide Burk
eRenville
Bottineau
McHenry
Sheridan
Burleigh
Grant
Study Area Emmons
South Dakota
ManitobaSaskatchewan
McLean
North Dakota
United States
Canada
Mile0 1
StarkDunn
Dickinson Field
Temporarily Abandoned
Dry
Active
Plugged and Abandoned
10664
5461
5820
4690
5041
43004842
46535500
6944
4250
4353
41504337
5434 42374227
5599 4293
4770
4287
5371
4261
4225
4332 70784217
3700
443743455600
42994284
42435606
4326
4672
4831
5525
5291
4906
4907
11637
13896
Figure 1. Map of study area. Primary focus of study is on Dickinson Field. Dickinson Field, and surronding fields are WIthin Stark County, North Dakota.

-545
0
- 5350
-52 50
- 5150
-50 50
-5,274
-5,399
-5,234-5,233-5,327-5,314
-5,301
-5,310
-5,282
-5,267
-5,282
-5,326
-5,273
-5,304 -5,284
-5,231
-5,312
-5,265
-5,312
-5,269-5,320
-5,309
-5,327
-5,274
-5,294
-5,337
-5,280
-5,321
-5,287
-5,291
-5,315
-5,324
-5,380
-5,394
-5,300
-5,308
-5,274
-5,294
-5,322
-5,266
-5,232
-5,494
-5,202
-5,251
Figure 2. Structure contour map of Dickinson Field and surrong study area. Map was produced in Petra with minimum curvature plotting. The central band is heavily distorted, that much distortion suggests an error instead of actual structural variation. All data was checked for errors and none were found. Possibile issues may arise from contour interval or plotting method.
Structure Contour Map
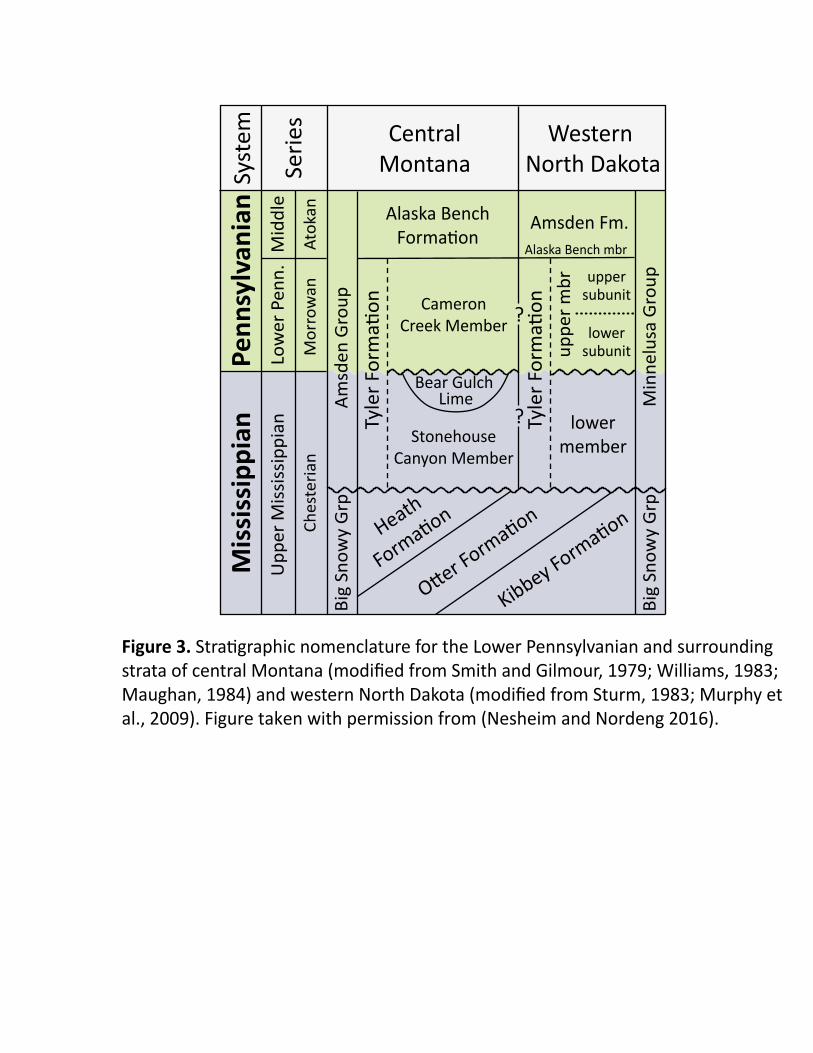
Figure 3. strata of central Montana (modified from Smith and Gilmour, 1979; Williams, 1983; Maughan, 1984) and western North Dakota (modified from Sturm, 1983; Murphy et al., 2009). Figure taken with permission from (Nesheim and Nordeng 2016).
Heath
Penn
sylv
ania
nSy
stem
Serie
s
Mis
siss
ippi
anU
pper
Mis
siss
ippi
anLo
wer
Pen
n.M
iddl
e
Atok
an
Amsd
en G
roup
uppe
r mbr
lowermember
Big
Snow
y G
rp
Min
nelu
sa G
roup
Big
Snow
y G
rp
Mor
row
anCh
este
rian
CentralMontana
Western North Dakota
Bear Gulch
StonehouseCanyon Member
CameronCreek Member
Lime
uppersubunit
lowersubunit
Alaska Bench Amsden Fm.Alaska Bench mbr
?
?

5
Literature review
The Tyler Formation is part of the Minnelusa Group in North Dakota that also includes
the Amsden Formation and Broom Creek Formation. Figure 3 is a stratigraphic column showing
the Tyler Fm. and its relative stratigraphic location within the column. Underlying the Tyler Fm.
is the angular unconformity of the Big Snowy Group. Rocks within the Tyler Fm. across the
basin record a single long term retreat and advance of seal level (Gerhard and Anderson, 1988).
Barwis (1990) observed at least 10 transgressive events within this longer term sea level change
which were driven by high frequency oscillations in sea level. During at least three of the major
transgressive phases anoxic bottom water conditions were formed enabling the preservation of
organic matter.
The Tyler Formation in the Williston Basin was deposited during the Mississippian to
Early Pennsylvanian in an intracratonic basin (Ziebarth 1962). In a second study Ziebarth (1964)
studied the Fryberg, Rocky Ridge and Dickinson Field and surrounding area and identified oil
bearing sandstones. Lignite and plant fossils were found in some beds. He attempted to find a
provenance for the sandstones by using heavy mineral studies of the Kibbey sandstone and
provided evidence of some component of the Kibbey sandstone as a partial source for the Tyler
sand.
Grenda (1977) did a major fauna study of the Tyler and found that the fauna suggested an
environment of fluctuations in water depth and salinity. A swamp region was also noticed by
plant fossils. Grenda found forty four species of invertebrates, eleven forms of conodonts, and at
least three fish and four plants. Warm weather and warm waters is suggested, and variable water
energy is also evident, but preservation of delicate fauna was still possible.
6
Sturm (1982) arrived at several conclusions about the Tyler Fm. within the
Pennsylvanian. He divided the Tyler into upper and lower divisions. The lower unit was a deltaic
environment with marsh, streams and overbank deposits of a delta plain. The upper unit was
controlled by the development of a barrier island system throughout the Dickinson and Medora
fields. In the south was an estuarine-lagoon environment and to the north was a shallow anoxic
sea. The Tyler Fm. ended as the shallow sea retreated northward leaving tidal flats with
anhydrite formation. The sandstones were identified as three types of deposits; stream, delta
front and barrier island. As sequence stratigraphy was not formally established at Sturm’s
publication time there was no sequence stratigraphic work performed. However, Sturm does
identify facies that could be considered system tracts and/or parasequences in the context of later
publications. Sturm’s basal sandstone was interpreted as a channel sandstone which can be
considered the lowstand system tracts and several shales found could represent highstand system
tracts. Sturm (1987) found that the shifting of basement blocks may have influenced Tyler
deposition and was also controlled primarily by eustatic sea change from glacial advance and
retreat. The base sand of the upper unit is the major pay zone in the Tyler and is interpreted as
barrier island sandstone.
Maughan (1984) found the Tyler Formation deposition occurred following the
epeirogenic uplift of the region and was mostly comprised of deltaic and fluviolacustrine
sediments. Sediment provenances were mostly earlier Mississippian rocks and other rocks below
the Mississippian exposed in eastern North Dakota and parts of Montana and Wyoming.
Time temperature index analysis by Nordeng and Neshiem (2012) indicate that two and
potentially three portions of the Tyler are currently within the oil window and showed that there
was a range of kerogen qualities. Combined with overpressure formation fluids, the organic rich
7
source units and thermal maturity suggest that the Tyler Formation may contain a basin-centered
petroleum system. Unlike the more successful Bakken play, the Tyler does not have a thick and
laterally consistent reservoir unit that would allow for consistent lateral wells and effective
fracking.
As the basin filled, subsidence could not keep pace with the broader sea level fall from
the Absaroka retreat (Nordeng and Nesheim 2012). As accommodation space decreased so did
organic matter accumulation and preservation within the deeper parts of the basin. However,
peripheral accumulation of organic matter did occur but the organic matter was not transgressive
shales but instead was shallow water limestone, coal beds and anhydrite terrestrial facies.
Nesheim (2014) divided the Tyler into an Upper and Lower section as well as two
separate petroleum systems. A northern organic rich offshore shale within the Lower Tyler and a
southern organic rich limestone in the Upper Tyler. The southern production centers in a
Dickinson-Fryburg trend of bar-type sandstones. Nordeng and Nesheim (2014) took a closer
look at the upper Tyler limestone beds finding four distinct limestone beds. Geochemical data
gathered showed that three of these limestone beds are excellent organic rich source rocks with
hydrogen index showing Type I/II oil prone kerogen.
Heckel (1994, 1995) and Feldman et al. (2005) did significant work on providing
evidence that glacial cycles were a cause of sea level variation within continental North America
during the Late Pennsylvanian. Heckel (1994) found transgressive and regressive limestones, and
paleosol development associated with large scale marine cyclothems. These marine cyclothems
were tied to Milankovitch cycles. Heckel (1995) was able to extend this data to the Appalachians
and identified systems tracts of the Late Pennsylvanian. Feldman et al. (2005) found

8
Pennsylvanian glacio-eustatic events can affect facies and lithologies and that sediments can be
used to yield data about climate.
Statement of problem
Since the introduction of sequence stratigraphy and sea level correlation, geological
knowledge has vastly expanded in understanding nearshore processes. The Tyler Formation has
had previous sedimentological and paleontological studies but sequence stratigraphy techniques
have not been attempted. This study attempts to add to the process of applying new geological
techniques to previously studied formations to generate data on sea level facies within the Tyler
Fm. in Dickinson Field by:
1. Using core data to determine if sea level variation and associated facies can be
observed
2. Assess viability of, and apply, sequence stratigraphy methods in understanding
the depositional process in the Tyler Formation
3. Identify possible sequence boundaries and unconformities to determine
depositional history and sequence stratigraphy of the Tyler Formation in a local
setting
Methodology
This study used 36 cores and 40 logs from the North Dakota Geological Survey Wilson
M. Laird Core and Sample Library located in Grand Forks, North Dakota. Several packages of
lithologies were compiled both from published literature and what was observed from the cores.
Core descriptions were taken with attention paid to sedimentary structures, grain size, grain
shape, composition, and fossils. The facies models were developed to clarify the sequence

9
history of the Tyler Formation within Dickinson Field and surrounding area. Four thin sections
were used to detail sandstone lithologies and establish differences between the sandstone units.
Sequence Stratigraphy Methods
Sequence stratigraphy was performed using Posamentier and Allen’s model of sequence
development (1999) their Siliciclastic Sequence Stratigraphy: Concepts and Applications, SEPM
Concepts in Sedimentology and Paleontology No. 7. Their definitions, terms and techniques
were used throughout this study.

10
CHAPTER II
RESULTS
Facies
Stratigraphic Column
No single core had all facies present but from correlation and core descriptions an
idealized stratigraphic column can be developed. Figures 4 and 5 are idealized stratigraphic
columns for the Tyler Formation. Each column was made by correlating facies and not directly
observed continuously, as such it should be considered as an idealized guide to compare to core
and to further clarify the Tyler Formation. The observed stratigraphic column (Figure 6) does
have many of the facies between cores #4150 and #4326 and does provide much of the data that
generates the idealized stratigraphic column.

Red Clay and sand
Limestone and Shale
Sandstone A
Sandstone B
Upper Tyler
Sea level
SB
Figure 4. Idealized stratigraphic column based upon observed lithologies across multiple core. Sandstone B is the oil sand and can often be split into two sections with a small limestone and/or grey shale section in the middle. The divider was not always observed and due to the sandstone B’s similar lithologies and composition it was not split into two di�erent facies. The author did split it into B1 and B2 subunits just for clari�cation when discussing the portion above or below the small divider.
Paleosol 1
Shale 1
Paleosol 2
Sandstone C
Shale 2
Paleosol 3a
Sandstone D1
Shale 3
Paleosol 3b
Sandstone D2
Low High

Siltstone 1. Red clay/silt with root marks.
Shale 1. Grey to dark grey �ssile shale.
Sandstone C. Fine grained yellow and tan sand. Sedimentary structures and bed-ding.
Siltstone 2. Red clay/silt with root marks.
Shale 2. Grey to dark grey �ssile shale. Can be a dark brown mudstone.
Siltstone 3a. Red clay/silt with root marks.
Sandstone D1. Red coarse grained sandstone. Sedimentary structures and bedding.
Shale 3. Grey to dark grey to black �ssile shale. Pyrite nodules.
Siltstone 3b. Red clay/silt with roots and plant marks.
Sandstone D2. Red coarse grained sandstone with pebble size clasts.
Sea level
SB
SB
SB
SB
Figure 5. Idealized stratigraphic column based upon all lithologies observed for the Lower Tyler. This entire column was not directly observed in one particular core but was made by correlating observed litholo-gies together. The siltstones are all inter-preted as paleosols. The sandstone D and siltstone 3 split is due to several core having the pebble size sandstone D2 and sandstone D1 as seperated by a shale and a siltstone. In other core the shale 3 is not present and siltstone 3a and 3b collapse into just siltstone 3, and sandstone D variation is continous. In future work it may be necessary to split the sandstone permanently into two units.
Lower TylerSea levelLow High

DICKINSON-HEATH-SAND UNIT 1033089000550000
DICKINSON
PN-T [NDIC]78
0078
5079
0079
50
Rel
Depth(ft)-50
0
50
100
Tyler Formation Stratigraphic Column
GR (GAPI)
0 120
4326
FaciesLimestone
Shale
Paleosol
Sandstone A
Sandstone B
Sandstone C
Sandstone D
Shale
Upper Tyler
Lower Tyler
DICKINSON-HEATH-SAND UNIT 4033089000230000
DICKINSON
7850
7900
7950
8000
4150
U
L
Neutron-PorosityGR
0 1200 2667
30 -10
Porosity %
Limestone andShale
Red Clay
Sandstone A
Sandstone B
Sandstone C
Sandstone DPaleosol 2
Paleosol 3
Sandstone D
Shale
Thin Paleosol
Figure 6. Observed stratigraphic column built with a correlation of two core, #4150 and #4326. This was done to show a basic model of how the facies align. Used with �gures 5 and 6 of the idealized stratigraphic column, this column will help any readers understand the distribution and placement of facies within the Tyler.
14
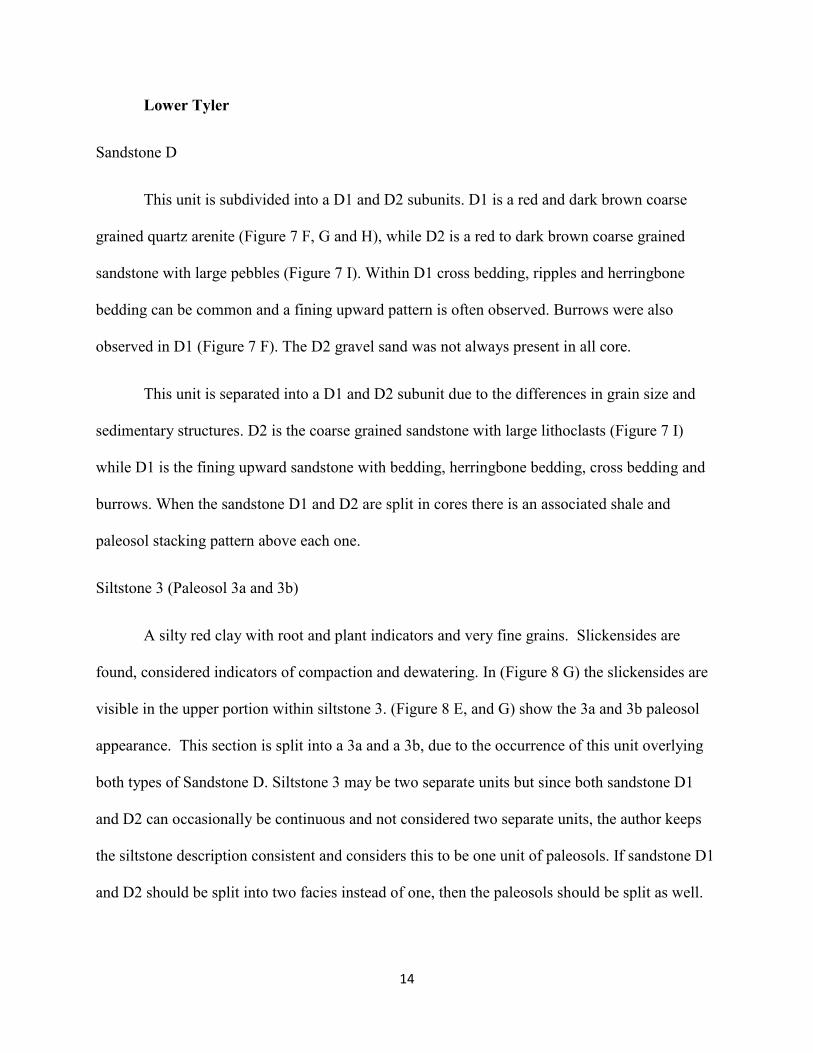
Lower Tyler
Sandstone D
This unit is subdivided into a D1 and D2 subunits. D1 is a red and dark brown coarse
grained quartz arenite (Figure 7 F, G and H), while D2 is a red to dark brown coarse grained
sandstone with large pebbles (Figure 7 I). Within D1 cross bedding, ripples and herringbone
bedding can be common and a fining upward pattern is often observed. Burrows were also
observed in D1 (Figure 7 F). The D2 gravel sand was not always present in all core.
This unit is separated into a D1 and D2 subunit due to the differences in grain size and
sedimentary structures. D2 is the coarse grained sandstone with large lithoclasts (Figure 7 I)
while D1 is the fining upward sandstone with bedding, herringbone bedding, cross bedding and
burrows. When the sandstone D1 and D2 are split in cores there is an associated shale and
paleosol stacking pattern above each one.
Siltstone 3 (Paleosol 3a and 3b)
A silty red clay with root and plant indicators and very fine grains. Slickensides are
found, considered indicators of compaction and dewatering. In (Figure 8 G) the slickensides are
visible in the upper portion within siltstone 3. (Figure 8 E, and G) show the 3a and 3b paleosol
appearance. This section is split into a 3a and a 3b, due to the occurrence of this unit overlying
both types of Sandstone D. Siltstone 3 may be two separate units but since both sandstone D1
and D2 can occasionally be continuous and not considered two separate units, the author keeps
the siltstone description consistent and considers this to be one unit of paleosols. If sandstone D1
and D2 should be split into two facies instead of one, then the paleosols should be split as well.

Figure 7. A) Sandstone A, mottled sand and clay mix. #4150-7914 ft. B) Oil sand (Sandstone B), �ne grained tan or brown sandstone. This section has a lighter amount of oil staining to highlight the sandstone lithology. #4150-7929.1 ft. C) Sandstone B again, but much darker oil staining. #4150-7934 ft. D) Sandstone C, �ne grained yellow to white sandstone. #4150-7969 ft. E) Sandstone C with cross bedding and a sharp contact with Sandstone D near the lower portion. This contact was not usually observed. #4150-7972.4 ft. F) Sandstone D, �ne grained upper portion of this unit. It appears similar to Sandstone C but is a di�erent unit. #4237-7870.1 ft. G) Sandstone D, coarse red sandstone unit. Usually has sedimentary structures such as herringbone bedding. #5041-7941 ft. H) Sandstone D ripples. #5041-7942. I) Sandstone D, 5606-7911. Notice that Sandstone D is representative of two paleoenviron-ments. The lower portion is a large grained channel sandstone while the upper portions are a coarse (but relatively �ner) sandstone with sedimentary features. This may be a re�ection of sea level change from an incised valley to a nearshore environment with a sea level rise.
B
HE
I
DC
GF
A

Figure 8. A) #4150-7872 ft. Upper Tyler Paleosol. B) #4293-7972 ft. Lower Tyler Paleosol. It wasnt possible to determine which paleosol this is. It was below sandstone D1 so probably Paleosol 3a but this core did not have sandstone C making exact placement di�cult. C) #5599-7980 ft. This is paleosol 1 as it was directly underlying the sandstone B . D) #4326-7920 ft. Paleosol 2 as it was overlying sandstone C. E) #4345-7877ft. Paleosol 2. F) #4345-7885 ft. Paleosol 3a. G) #4326-7927 ft. Paleosol 3b as it was overlying sandstone D2. Letters in lower right of each photo.
A B C D
E
F
G

17
Shale 2/Shale 3
A fissile shale unit. The color of this unit can vary within an entire core, and from core to
core. The colors vary from grey, to dark grey, to black. Occasionally small pyrite nodules can be
found. Shale 3 is only found within when sandstone D is split into D1 and D2, otherwise there is
only one shale unit above the sandstone D section. When shale 3 is present it has the same
characteristics as shale 2. Refer to idealized stratigraphic column for additional explaining. This
unit is not always formed as a shale, but is occasionally present as a dark brown mudstone. Both
variants have a high gamma signal.
Sandstone C
White to yellow fine grained sandstone and elsewhere is found with portions containing
lithoclastic grains with red oxidation stains (Figure 7 D and E). Portions of the sandstone are
unconsolidated and have a “sugary sand” texture. The sandstone portion is ortho quartzite
mineralogy. Cross bedding is occasionally observed and there are indications of laminations and
bedding.
Siltstone 2 (Paleosol 2)
A silty red clay with root and plant indicators (Figure 8 F). The composition of this
siltstone is similar to siltstone 3, except slickensides are not as prominent.
Shale 1
A fissile shale unit. The color of this unit can vary within an entire core, and from core to
core. The colors vary from grey, to dark grey, to black. Pyrite is not as common as Shale 2 but is
still present.
Siltstone 1 (Paleosol 1)

18
A red clay with root indicators (Figure 8 C). This unit was only clearly observed in core
#4672 and #5599. No slickensides were present.
Upper Tyler
Sandstone B (Oil sand)
Fine grained, yellow to tan color sandstone (Figures 7 B and C). No indication of bedding
or structures. Slight oxidation at top of the sand unit. There is oil staining throughout this
sandstone unit but it can vary in intensity. In some core a small shale unit or small limestone unit
would split the oil stained sands into two sections, in this case there was no difference between
the sandstone lithologies. The division is usually not larger than 1 foot in thickness. This division
is not in every core but occurs enough that the author considered Nesheim and Nordeng (2014)
which also subdivided this sand unit into two sandstone subunits. Both Sandstone B1 and
Sandstone B2 have consistent lithology and properties, the distinction is only important to
stratigraphy and distribution of this facies.
Sandstone A
A mottled and mixed tan to yellow fine sandstone dominated unit with amounts of grey
clay mixed within (Figure 7 A). This sandstone was not observed as a pure sandstone but was
always mixed with a dispersed grey clay in varying amounts.
Limestone and Shale
Alternating beds of limestone of and shales. The limestone can come in two
forms: a micritic limestone (Figure 9 A), or a fossilerous wackestone limestone with fossils
(Figure 9 B, C and D). All limestone facies can come in several colors: light grey, grey, dark

19
grey and black. The wackestone can contain varying fossils of different morphologies and
different abundances. Grenda (1977) found open marine and shallow marine fossils within this
unit, ostracods, mollusks and brachiopods were observed in this unit by this author (Figure 9 B,
C, and D). Despite the black shales and black limestones the fossil presence indicate an
environment with oxygenation and nutrient delivery with possible variation between fresh water
to brackish waters. Some wells have several of these limestone beds with heavy oil staining
(Figure 9 D and E). The oil staining is not limited to any variant of the limestone. The limestone
can also be observed as a dissolved oil stained limestone (Figure 9 E). Evaporite nodules and
fossil replacement were also observed (Figure 9 F and H).
The shales can come in several colors: grey, light grey, dark grey and black (Figure 9 G).
The majority of the shales observed are fissile but some were not. The shale can be calcareous as
well. The similarity of the black micritic limestone and black non-fissile shale and reaction both
can have to acid can make identification difficult. Contacts were sharp between shale and
limestone surfaces.
Red Clay
This clay is a paleosol section, with a small bed of coarse grained sandstone. This
paleosol found at the top of the Tyler Fm. is a good marker bed for the top of the Tyler
Formation. It is red clay with yellow to dark tan clay mix within. (Figure 8 A) is a good example
of a well preserved paleosol from well #4150. Medium to large lithoclasts are common within
the red clay. There are some indication of roots. In some cores there is a small red sandstone
unit underneath the paleosol. This sandstone unit is coarse grained and moderately to well sorted.
The sandstone section is 3-4 inches thick.

A
Figure 9. A) micritic black limestone, #4150-7891.6 ft. B) Fossilerous wackestone, #4237-7836 ft. C) Example of faunal distribution. Mollusk, ostrcods, and shell debris. #4237-7840 ft. D) Oil stained fossils within the limestone unit. Previous work by Nordeng and Nesheim (2012) suggest a possible oil source bed within the limestones. #4326-7892 ft. E) Dissolved limestone with vuggy porosity. #4345-7848 ft. F) Anhydrite nodules within the micritic limestone, note color of limestone is now a light grey and a light brown. #5371-7950 ft. G) Black limestone and black shale, both were calcareous. In this case the �ssile nature of the shale is obvious but other times the shale was not as easily deter-mined. #5600-7852 ft. H) Anhydrite replacement of fossils suggests the limestone environment may have been subject to periods of evaporate develop-ment. #5606-7888 ft.
A B
C
G
F
H
ED

21
Thin Sections
Thin section from core #4150 shows the B unit (Figure 10a). Within the thin section the
oil staining is visible. In cross-polarization view the quartz grains become clear to see. The grain
size is variable within the sandstone B across the field. (Figure 10c) are thin sections from
sandstone B as well and show slightly different grain morphology. There is a significant amount
of rounded grains in this thin section unlike the more angular grains of (Figure 10a).This
suggests a possible different provenance source or method of transport for this sandstone. In
addition Figure 10c has an ostracod visible which suggests an environment where fauna activity
is possible.
Figure 10b is a thin section from #4150 again but now it is the fine grained sandstone C
unit. There is slight oil staining visible in the thin section but this was not evident from hand
samples of the core.
Figure 10d is a thin section from #4345 well and is from the red sandstone D which is the
deepest sandstone within the Lower Tyler Formation. In core samples the grains are coarse and
from the thin section the coarse grains are clear but there are also significant amounts of finer
grained sediments. No fossils were observed in core but the thin section shows ostracods, shell
debris and possible burrows. The rounded grains show energy transport which is consistent with
an interpreted channel environment.

Figure 10a. #4150-7950 ft.
Figure 10b. #4150-7969 ft.
Figure 10c. #4217-7854 ft.
Figure 10d. #4345-7888 ft.

23
Log analysis and facies signals
Several of the facies described have log signatures that are easy to observe and can be
used as an indicator of location within the well. The Tyler top surface can usually be observed
clearly on gamma logs. The overlying Amsden Formation has up to three obvious and clear
gamma signals that help stratigraphic location. Figure 11 shows two highlighted sections from
wells #4150 and #4261. In well #4150 there are three highlighted sections, showing the three
gamma ray signatures (Figure 11a). The stratigraphic highest one is a small anhydrite unit,
underneath that is a second much larger anhydrite, and finally at the bottom is a “tight” dolomite.
All three are part of the Amsden Formation and the top of the Tyler Fm. is placed directly
beneath the “tight” dolomite. The second anhydrite is a particularly good surface to search for
because of its very high resistivity while the gamma curve is at a low and neutron porosity is
high. The “tight” dolomite has a similar low gamma and high resistivity and high neutron but the
resistivity is not as high as it is for the second anhydrite and usually has a slight dip within the
curve. In addition, despite a high neutron porosity, the dolomite does not have a peak as high as
the anhydrite does.
The Sandstone B unit also has a clear gamma signal that is easy to observe. Figure 11b
shows the low gamma signal of the oil sandstone. The sandstone B signal will often be a low
gamma, with a small peak in the middle. The small peak is a thin shale and/or limestone unit
between the two portions of the oil sandstone. The small peak is not always there, and instead the
gamma is a continuous low “valley”. The neutron and resistivity for the oil sandstone is usually a
double peak separated by a small “valley”, reflecting a reservoir sand separated by a small shale
or limestone unit.

DICKINSON-HEATH-SAND UNIT 4033089000230000
DICKINSON
7850
7900
7950
8000
4150
PN-T [NDIC]
7850
7900
4261DICKINSON-HEATH-SAND UNIT 24
33089000390000DICKINSON
Figure 11a. The top of the Tyler Forma-tion can be determined using a “triple peak” indicators from the gamma log. A) is a small anhydrite unit that has a high neutron, high resistivity and low gamma signal. B) is a second anhydrite that is larger and has more obvious signals such as maxed out resistivity and a high neutron in addition to a low gamma. This anhydrite neutron curve can be high enough that the curve will wrap around. C) A “tight” dolomite that has a high gamma, high neutron and high resistivity. At the bottom of this dolomite is a good location to consider the top of the Tyler Formation.
AB
C

7900
7950
8000
Figure 11b. The sandstone B signal will often be a low gamma, with a small peak in the middle. The small peak is a thin shale and/or limestone unit be-tween the two portions of the oil sand-stone. The small peak is not always there, and instead the gamma is a con-tinuous low “valley”. The neutron and resistivity for the oil sandstone is usu-ally a double peak separated by a small “trough”, re�ecting a reservoir sand separated by a small shale or limestone unit.
DICKINSON-HEATH-SAND UNIT 4033089000230000
DICKINSON
4150

ValleyGolden
Billings
Stark
Dunn
Dunn
Slope Hettinger
BowmanAdams
Grant
Morton
Oliver
Sioux
McLean
Mercer
McKenzie
WardMountrail
Williams
DivideBurke Renville Bottineau
McHenry
Sheridan
Burleigh
Emmons
South Dakota
ManitobaSaskatchewan
North Dakota
United States
Canada
Study Area
Mile
0 1
Stark
Dunn
Dickinson Field
Temporarily Abandoned
Dry
Active
Plugged and Abandoned
C
C’
A’
A
B
B’
Cross Section Map of Study Area
4150
42254261
5371
4842
44374345
4831
46904906
Figure 12. Cross section map.

DIC
KIN
SO
N-H
EA
TH
-SA
ND
UN
IT
4
03
30
89
00
02
30
00
0D
ICK
INS
ON
DIC
KIN
SO
N-H
EA
TH-S
AN
D U
NIT
1
733
0890
0060
0000
DIC
KIN
SO
N
DIC
KIN
SO
N-H
EA
TH
-SA
ND
UN
IT
01
3308
9001
0100
00
DIC
KIN
SON
7850 7900 7950 8000
7800 7850 7900 7950
7800 7850 7900 7950 8000
41
50
4345
4906
AA
’SW
NE
PN-T
[NDI
C]
7850 7900 7950 8000
42
61DI
CKIN
SON-
HEAT
H-SA
ND U
NIT
24
3308
9000
3900
00DI
CKIN
SON
48
31D
ICK
INS
ON
-HE
ATH
-SA
ND
UN
IT
06
3308
9000
9000
00D
ICK
INS
ON
7850 7900 7950 8000
DIC
KIN
SO
N
Oil S
and
Paleo
sol 2
Sand
C
Figu
re 1
3. C
ross
sec
tion
for A
to A
’ tre
nd. C
ross
sec
tion
is a
long
str
ike.
Pal
eoso
ls w
ere
obse
rved
in m
ore
num
erou
s w
ells
her
e th
an in
the
perp
endi
cula
r to
strik
e cr
oss
sect
ions
.
Red C
lay
Sand
D2
Shale
Limes
tone a
nd Sh
ale
Sand
D1
Sand
A

4842
DIC
KIN
SON
-HEA
TH-S
AND
UN
IT
12
3308
9000
9200
00D
ICKI
NSO
N
7950 8000 8050 8100B
B’
NW
SE
5371
DIC
KIN
SO
N-H
EA
TH
-SA
ND
UN
IT
46
3308
9001
4100
00D
ICK
INS
ON
7900 7950 8000 8050
4225
DIC
KIN
SO
N-H
EA
TH
-SA
ND
UN
IT 3
133089000310000
DIC
KIN
SO
N
7750 7800 7850 7900 7950 8000
PN
-T [
ND
IC]
Oil
Sand
7850 7900 7950 8000
4261
DICK
INSO
N-HE
ATH-
SAND
UNI
T
24
3308
9000
3900
00DI
CKIN
SON
Figu
re 1
4. C
ross
sec
tion
for B
to B
’ tre
nd. C
ross
sec
tion
is p
erpe
ndic
ular
to s
trik
e. P
aleo
-so
ls a
re e
asily
sup
ress
ed o
n lo
g si
gnal
s. Th
ey c
an o
ften
be
abso
rbed
into
the
shal
e si
gnal
m
akin
g id
enti�
catio
n fr
om lo
gs d
i�cu
lt.
Red
Cla
y
Sand
C
Lim
esto
ne a
nd S
hale
Shal
e
Red
Clay

4690DICKINSON-HEATH-SAND UNIT 47
330890007400004437
DICKINSON-HEATH-SAND UNIT 1833089000630000
78
00
78
50
79
00
79
50
80
00
78
00
78
50
79
00
79
50
C’C
NW SE
4831DICKINSON-HEATH-SAND UNIT 06
33089000900000DICKINSON
7850
7900
7950
8000
Sand B
PN-T (NDIC)
Sand C
Sand D
Shale
Limestone and Shale
Red Clay
Figure 15. Cross section for C to C’ trend. Cross section is perpendicular to strike.

30
CHAPTER III
DISCUSSION
Facies Interpretation
Lower Tyler
Sandstone D
The sandstone D2 unit is likely a channel-fill sandstone due to the fining upward pattern,
immature grains, and cross bedding. Sturm (1982) also called this unit a channel-fill deposit for
these reasons in addition to the presence of lenticular clasts in horizontal orientation. The portion
near the top of this unit represents a finer sandstone unit (Figure 4) which Sturm (1982) excluded
and called a delta front deposit. The author considers this sandstone D unit to be composed of
two sub members but does agree with Sturm’s interpretation. The D1 member is the delta front
sand and the D2 member is the channel sand. D2 represent a lowstand systems tract due to the
stream downcutting while D1 represents a sea level rise and formation of the delta front over the
lowstand channel.
The author’s decision to keep D1 and D2 as part of the same sandstone is based upon
several observations. The sandstone D1 and D2 can be found in a continuous deposit in some of
the core. When this occurs, shale 3 and paleosol 3b either pinch out or were not preserved in
those locations. The paleosol 3a still caps the sandstone D1 and D2 merged unit. Both D1 and

31
D2 are coarse grained, red sandstone with sedimentary structures indicating higher energy
environments further supporting a similar facies unit.
Siltstone 3 (Paleosol 3a and 3b)
This red siltstone is interpreted as a paleosol and represents the zone of aeration that caps
the Sandstone D unit and is an eroded unconformity of the lowstand system. Sea level is at its
lowest point in this sequence. This paleosol may have formed on top of the delta front sand of
the sandstone D. Sturm (1982) Includes the paleosol along with the shale 2 unit as near deltaic
channel deposits. The paleosol development would occur in the previous channel’s episodic
paths Sturm (1982). This study agrees that that is a viable environment, but due to the multiple
core occurrences of paleosols and often absence of channel sands it seems more likely that the
channel did not migrant significantly and that paleosol development is a feature of sea level
change not channel migration. The paleosol likely formed ontop of the delta front sand as sea
level fell and/or the delta front prograded deeper into the basin.
Shale 2 and Shale 3
The shale unit is the highstand systems tract. This shale varies in color from grey to dark
grey and black which may reflect oxygen levels and depth of that particular location. Sturm
(1982) includes this with the paleosol as a feature of near channel migration and deposition in
environments such as a marsh. The author agrees that is a possibility but due to the widespread
deposition of shale, a sea level rise may be a simpler explanation. Sea level may have risen and
caused a shallow marine to deeper marine environment to form on top of the previous lowstand
paleosol.

32
Alternatively, instead of a sea level rise alone as an explanation for this shale unit, it may
be that the Lower Tyler delta flood plain prograded into the basin and the shale deposited in a
region behind the the delta front unit of sandstone D, such as a floodplain or swamp. If the delta
reactivated it could also involve a sea level rise in conjunction as the shale sediments suggest that
either the delta front sands are now offshore or the delta sands are upslope. In that case this shale
is a shallow marine lagoonal environment that was flooded by a sea level rise. If the sea level did
not rise at all, this shale may be representative of a shallow marine bay or back bar of a delta that
is prograding into a basin.
Sandstone C
The coarse grained size of this sand and sedimentary structures such as cross bedding
suggests a higher energy environment such as a beach front. This sandstone represents the
lowstand system tracts. If the sea level fell from the previous shallow marine environment of
shale 2 this could represent the reconfiguration into a coastal shoreline or the deposition of the
mouth bar of a delta. Few occurrence of fossils and occasional sedimentary structures such as
cross bedding would be consistent with a nearshore or mouth bar environment.
Paleosol 2
This siltstone is interpreted as a paleosol is the lowstand system tracts and an erosion
unconformity. It is similar in composition to the Paleosol 3 unit. This unit likely formed on top
of the beach sand or mouth bar of sandstone C as sea level continued to fall.
Shale 1
This shale unit is similar to shale 3 in environment and may represent a deltaic floodplain
and progradation. It might be a highstand systems tract and sea level has risen flooding the

33
paleosol 2 unit. Since the overlying paleosol 1 is only found in core # 4672 and #5599 it is
possible that this shale is a function of a sea level rise, and anticipates the transgressive system
tracts of sandstone B in the Upper Tyler. Alternatively like shale 2, this may be a local sea level
rise event that floods portions of the delta processes near the shoreline.
Paleosol 1
This siltstone is interpreted as a paleosol located directly underneath sandstone B. This
paleosol may represent a ravinement surface for the sandstone B to transgress onto. If considered
the ravinement surface then this would represent a sea level drop across the field and move the
deltaic processes further offshore and move the location of the study area further inland.
Upper Tyler
Sandstone B (Oil Sand)
This sandstone is a barrier island as described by Sturm (1982) and Nesheim (2014) and
the author is in agreement. The thickness of the deposit suggests either a stable long term
environment or rapid sedimentation. The fine grained quartz arenite also suggests coastal
processes further supporting the barrier island paleoenvironment. The occasional fossils found in
this unit suggest possible faunal activity on or nearby the environment, a possible nearshore
barrier island is also supported by this. This facies is a transgressive systems tract. Sea level is
beginning to rise and onlap onto the coastline.
Sandstone A
The mixed lithology of clay and sand may be a transition zone between the lower oil
sandstone moving into the overlying shallow marine shales and limestones. Due to the “chewed”
34
up appearance of sand, clay and smaller lithoclasts, this unit may represent the surface that
waves dominated and mixed up all lithological components. This sandstone is possibly the wave
ravinement surface.
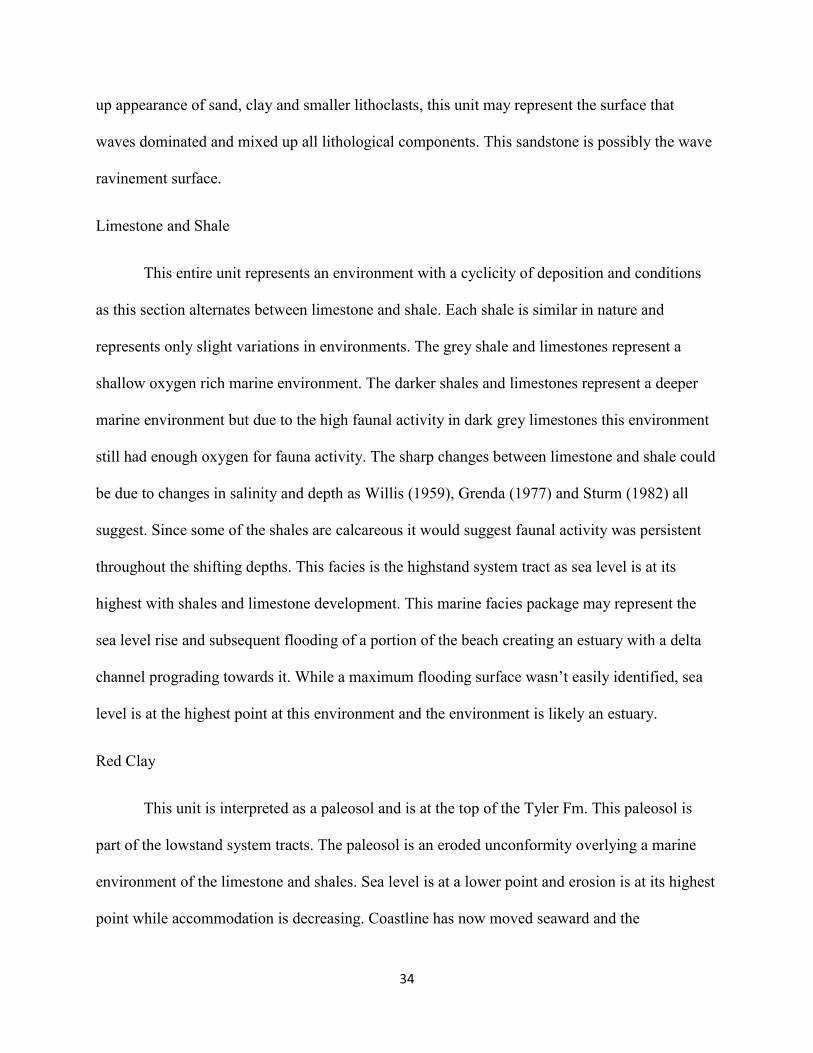
Limestone and Shale
This entire unit represents an environment with a cyclicity of deposition and conditions
as this section alternates between limestone and shale. Each shale is similar in nature and
represents only slight variations in environments. The grey shale and limestones represent a
shallow oxygen rich marine environment. The darker shales and limestones represent a deeper
marine environment but due to the high faunal activity in dark grey limestones this environment
still had enough oxygen for fauna activity. The sharp changes between limestone and shale could
be due to changes in salinity and depth as Willis (1959), Grenda (1977) and Sturm (1982) all
suggest. Since some of the shales are calcareous it would suggest faunal activity was persistent
throughout the shifting depths. This facies is the highstand system tract as sea level is at its
highest with shales and limestone development. This marine facies package may represent the
sea level rise and subsequent flooding of a portion of the beach creating an estuary with a delta
channel prograding towards it. While a maximum flooding surface wasn’t easily identified, sea
level is at the highest point at this environment and the environment is likely an estuary.
Red Clay
This unit is interpreted as a paleosol and is at the top of the Tyler Fm. This paleosol is
part of the lowstand system tracts. The paleosol is an eroded unconformity overlying a marine
environment of the limestone and shales. Sea level is at a lower point and erosion is at its highest
point while accommodation is decreasing. Coastline has now moved seaward and the

35
environment is now a stable terrestrial region with sea level at its lowest point with formation of
paleosols. This environment may represent the infilling of the previous marine facies
accommodation space.
Sequence Stratigraphy
Paleosols
An unconformity is a surface where there is evidence of subaerial exposure (Wagoner et
al. 1988). The Lower Tyler has at least two unconformities and the Upper Tyler has one
unconformity represented as paleosol horizons that are found in core across the field. In the
Lower Tyler these paleosol cap a shoaling upward progression from grey and dark grey shales to
sandstones. In the Upper Tyler the paleosol caps a coarsening upward pattern as well but has
some variation to this pattern compared to the Lower Tyler. These unconformities can represent
sequence boundaries or parasequences in the Lower Tyler. The paleosol distribution is not
uniform across the field, some wells have significant paleosol accumulation such as #4345 which
has Paleosol 2 and Paleosol 3 preserved in the Lower Tyler while #5371, #4150 and #5500 have
a well-preserved Upper Tyler paleosol. Some cores have none of the paleosols observed in either
the Upper or Lower Tyler and may represent offshore environments. This distribution may
reflect the erosional surface of these paleosols.
The Upper Tyler paleosol has variation amongst the cores observed. In #4150 the soil
caps a grey shale unit which in turn was overlying a dark grey to black micritic limestone
section. The underlying shale and limestone section represents the marine facies unit and is
alternating limestones and shales both with color and composition variation. In #5371 the
paleosol is overlying a small red coarse grained sandstone. Beneath the red sandstone unit is a

36
section of mud and then moves into the grey shale and limestone estuary facies unit. This red
sandstone is not present in #4150 but is present in #5500 but is underneath a lithoclastic
mudstone. The red sandstone unit is small and may not have been deposited in the location of
#4150 but there is a small section of core missing from #4150 as well which may be this red
sandstone unit.
In addition to #4150 and #5500, #5371 also has this Upper Tyler paleosol that is
preserved. All three of these wells are on the western side of Dickinson Field, while #5500 is
actually outside of Dickinson Field in South Heart Field to the west of Dickinson Field. This
Upper Tyler paleosol is also a possible marker bed to pick the top of the Tyler Formation. It is
distinct in appearance and is a sequence boundary that can be used as a possible boundary to the
Upper Tyler Formation.
In the Lower Tyler there are at least 2 paleosol horizons capping sandstone units. In
#4345 Paleosol 2 is capping Sandstone C unit. In #4345 Paleosol 3 is capping a coarse grained
sandstone unit and in #4326 and #13896 Paleosol 3 is also capping a second red coarse sandstone
unit. Both paleosols cap a coarsening upwards sequence but appear at different points in the core.
This reflects the complexity of the exact distribution of sandstone D1 and D2 subunits. When D1
and D2 are split in the core, there is a paleosol 3b overlying D2 and then a second paleosol 3a
overlying D1. When D1 and D2 are not split but are continuous there is only one paleosol
capping the continuous sandstone D unit with one sequence bounding unit missing. This makes
sequence stratigraphy complicated at the lower portions of the Tyler cores. The sequence
boundary associated with paleosol 3a is obvious and observed, but what has not be determined is
if paleosol 3b is part of that sequence boundary and merely changed due to local geometry, or if
it is a distinctly different sequence boundary.

37
Both #4299 and #4672 have paleosols in the Lower Tyler but differ in two major ways
from #4326 and #4345. First, #4299 and #4672 only have one paleosol in the Lower Tyler, and
second, they don’t have any sandstone units in the Lower Tyler. Both Sandstone C and D are
represented in both #4326 and #4345. Their placement in relation to the paleosols does vary.
The distribution of the paleosols is not consistent across the field. The Upper Tyler
paleosols of #4150, #5371 and #5500 were preserved only in the western portion of the field as
well as the nearby South Heart field. Towards the center of the field the Lower Tyler paleosols of
#4326, #4345, #4299 and #4672 would appear but now the Upper Tyler paleosol would be gone.
No single core observed had both Upper and Lower paleosols but this may be due to data
collection concern. The Lower Tyler Paleosols continue over towards the eastern portion of the
field.
In #4672 and #5599 the paleosol is directly underlying the sandstone unit B which may
be representative of a ravinement surface and subsequent sea level rise. This may make for a
correlative surface to trace across the basin. Paleosol development can occur in two possible
ways in the Lower Tyler. It may be channel migration as Sturm (1982) suggests with paleosols
developing on previous channel locations. Alternatively it may be a function of sea level change.
If the Lower Tyler is an entire deltaic process combined with sea level variation it is possible that
paleosol development occurs as the delta continues prograding offshore with a falling sea level.
The paleosols do correlate across the field both in the Upper and Lower Tyler. Figure 13
shows the along strike cross section and shows the Lower Tyler paleosols correlating in the north
eastern direction. They do pinch out as it moves south west along the strike trend. The Upper
Tyler is correlatable through all cross sections both across strike and along strike (Figure 14, and
38
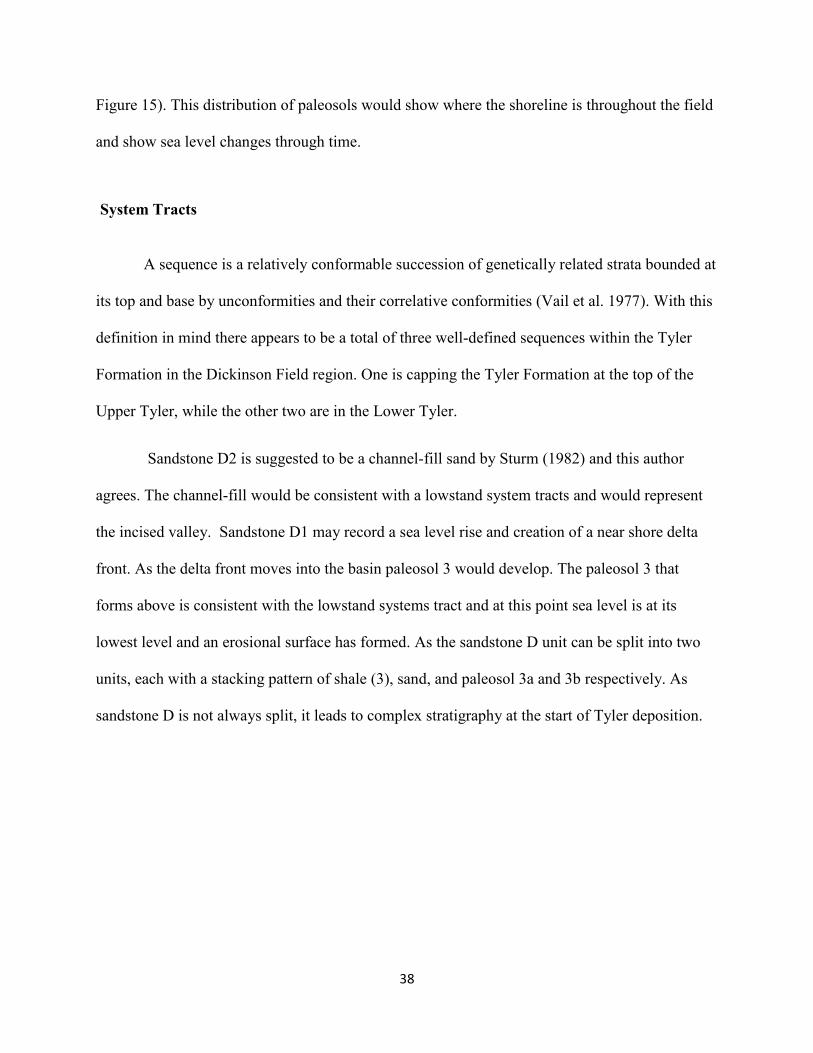
Figure 15). This distribution of paleosols would show where the shoreline is throughout the field
and show sea level changes through time.
System Tracts
A sequence is a relatively conformable succession of genetically related strata bounded at
its top and base by unconformities and their correlative conformities (Vail et al. 1977). With this
definition in mind there appears to be a total of three well-defined sequences within the Tyler
Formation in the Dickinson Field region. One is capping the Tyler Formation at the top of the
Upper Tyler, while the other two are in the Lower Tyler.
Sandstone D2 is suggested to be a channel-fill sand by Sturm (1982) and this author
agrees. The channel-fill would be consistent with a lowstand system tracts and would represent
the incised valley. Sandstone D1 may record a sea level rise and creation of a near shore delta
front. As the delta front moves into the basin paleosol 3 would develop. The paleosol 3 that
forms above is consistent with the lowstand systems tract and at this point sea level is at its
lowest level and an erosional surface has formed. As the sandstone D unit can be split into two
units, each with a stacking pattern of shale (3), sand, and paleosol 3a and 3b respectively. As
sandstone D is not always split, it leads to complex stratigraphy at the start of Tyler deposition.

Relative Sea Level
LST
LST
HST
HST
TST
LST
HST
LSTPaleosol, clay and sandstone.
Facies Paleoenvironment
Limestone and shale.
Sandstone B
Paleosol 1
Shale 1
Sandstone C
Shale 2
Sandstone D1
Erosional unconformity.
Shallow marine, �oodplain.
Nearshore, mouth bar.
Shallow marine, �oodplain.
Ravinement surface. Erosional surface.
Barrier island.
Estuary fed by open marine and prograding deltaic front. Fossils indicate brackish water.
Nearshore
Shale 3
Paleosol 3a
Paleosol 3b
Sandstone D2
Nearshore delta front.
Shallow marine, �oodplain.
Erosional unconformity.
Channel. Incised valley.
SB
WRS
SB
SB
HST
SB
Sandstone A Wave dominated shoreline. Nearshore.
Paleosol 1 Erosional unconformity. SB
Figure 16. Summary of facies and interpreted paleoenvironment and sea level change associated with each facies.
HighLow

40
The shale 2 unit is from a shallow marine environment and may be a lake behind the
delta front that has shifted into the basin. Alternatively this shale might be part of a small sea
level rise and subsequent flooding of a delta front environment. It is possible this is the
highstand systems tract but as there were no obvious marine flooding surfaces and as the shale is
usually a light grey it is possible that the maximum flooding surface isn’t recorded in Dickinson
field. If this unit is part of a lake behind a delta front it would represent an environment upslope
from the coastline. Some core such as #4150 had extensive shale units in the Lower Tyler and
had some darker grey shales which may be the marine flooding surface or a lateral marine
environment to the delta front. As a sandstone is overlying this unit, it seems more likely that this
unit is not behind the delta front but is lateral to delta front deposition.
Sandstone C may represent the mouth bar or a nearshore beach which would suggest a
possible sea level fall. This would explain the terrestrial deposits found as well as cross bedding
sedimentary structures. Overlying the shale 3 unit this may be the delta front or mouth bar
shifting to the previous location. If shale unit 3 is a lateral lake or estuary environment to the
delta channels this shift to sandstone C would represent the infilling of that accommodation
space, if shale unit is a sea level event then sea level would fall as the mouth bar formed. Above
the sandstone C is the paleosol 2 unit of the lowstand systems tract. Sea level is at its lowest
point now and an erosional surface has formed on top of the mouth bar of sandstone C. As sea
level fell, the delta front either continued prograding into the basin or shifted channels allowing
for paleosol development. Over the paleosol 2 unit is the shale 1 unit which again can be either
lateral shifting environments of a delta or a sea level change. Above the shale 2 unit is a small
paleosol 1 unit. This paleosol may represent a sea level drop that terminated the delta and
allowed for a possible ravinement surface. Overlying paleosol 1 is sandstone B which represents

41
the transgressing systems tract overlying a ravinement surface. Overlying this sandstone B is the
sandstone A unit. This unit is interpreted as the shifting environment of continual sea level rise
from the transgressive systems tract or may reflect local geometry change of the delta deposition.
Alternatively the reworked appearance of sandstone A suggests that it may be the wave
ravinement surface. However, sandstone A is usually 1-3 feet in vertical thickness, which may be
a rather large surface for a wave ravinement surface. In this case perhaps the sandstone A is a
small beach sand becoming flooded by the highstand systems tract of the limestone and shale
units. Wave reworking may have still taken place, but the entirety of this unit would not be the
ravinement surface but rather a sandstone unit with portions reworked by waves.
Above sandstone A unit is the marine facies section which is the highstand systems tract.
Sea level is at its highest point here and carbonate production is significant during this phase. As
these shales and limestones are often the thickest section within the Tyler it is either a long
lasting sea level rise and/or a region of significant limestone production. Considering the
abundant faunal activity the accommodation space must have been significant. This
accommodation space was filled in by shale deposition and limestone production. The red clay
unit overlying the limestones and shales represents the possible infilling and termination of the
delta process of the Tyler within Dickinson Field. At this point the estuary has been infilled by
limestones and shales and paleosol development can occur atop now. This estuary environment
is discussed further below.
Taken all together the Lower Tyler would represent a nearshore environment with sea
level variation and deltaic processes. The lower channel sandstone would represent the start of
the channel formation and delta activation. The subsequent sandstone D1 would represent the
delta front prograding into the basin as a sea level falls. With the sea level fall, the previous delta

42
front is now at a higher slope and paleosol development will occur as will an erosional surface.
The shale units may represent sea level rise that flooded the nearshore delta environments.
Sandstone C is the formation of a coastline or mouth bar of the delta. In either case a continuous
sea level fall would allow for paleosol development to occur ontop of this unit. Shale 1 is either a
continuation of the delta processes or may represent the beginning of sea level rise events of the
subsequent transgressive system tracts of sandstone B. It is likely that the deltaic processes of the
Lower Tyler are a function of deltaic progradation and shifting channels as well as sea level
cycles.
Estuary
The estuary of the Upper Tyler may have been formed from the deposition of the
sandstone unit B from a sea level rise creating a back barrier bar. The estuary section is
represented by the limestone and shale facies unit. Sandstone unit B cut off open marine
environments and helped to form the estuary environment that is eventually infilled by the
marine facies unit with continual sea level rise. Further support for an estuarine environment is
given by Grenda (1977) where his thesis studied the faunal distribution of the Tyler. He found a
mix of open marine and non-marine fauna suggesting a wide range of water temperature and
salinity levels. The fauna found according to Grenda (1977) include Lingula which would
suggest a warm and shallow environment. Grenda (1977) identified non marine bivalves such as
Anthraconaia, Anthraconauta, and Curvirimula were found suggesting wide ranges of salinity.
Epifaunal marine bivalves such as Posidoniella variabilis, Leptodesma sociale, Aviculopecten
eaglensis, A. mazonensis, A. phosphaticus, Limipecten otterensis, and Euchondria pellucide
suggest shallow sublittoral environments near continental shelves (Grenda 1977). Brachipods
such as Cyzicus (Lioestheria) harveyi and Leaia normalis in addition to Candona Carbonita and

43
Gutschickia ostracods suggest fresh to brackish waters (Grenda 1977). A brackish water
environment would be consistent with an estuary with some exposure to open marine salinity
levels while also having freshwater input from the deltaic inflow. There is a possibility that the
freshwater and saltwater mixed to form brackish waters that allowed for multiple faunal
communities to thrive next to one another.
The delta front supplied the shale deposition while local faunal activity deposited
limestone sediments. Since much of the shale is calcareous it would suggest that limestone
deposition is continuous throughout this limestone and shale facies group and that the shale
deposition is cyclic, possibly based upon glacial variation. If the delta retreated upslope with a
sea level rise, the barrier island is flooded, limestone production begins and shale deposition can
occur as the delta channel shifts back and forth across the beach front. This would allow for
continuous production of limestone with occasional interruptions of significant shale deposition
until accommodation space is filled and/or the channel delta shifts to a new location.
Alternatively instead of shifting delta shale deposition, it may be simpler to call consider
this environment part of a brackish lake behind the delta front. Considering this the delta front
sands have moved further into the basin and Dickinson field is now behind the delta front.
Above the marine facies is the terrestrial facies which represents the transition back to
the lowstand systems tract. The paleosol formation indicates that sea level is now at its lowest
point. Considering how there was not much transition between the marine facies and terrestrial
facies, it is a strong possibility that this sea level fall was rapid. Alternatively the change in sea
level only marginally affected the estuary accommodation space as limestone and shale
deposition may have infilled the majority of accommodation space available. As the sea level
dropped, more terrestrial sediments began to infill along with possible variation in deltaic

44
sediment source. The paleosol development at the top of the Tyler Formation may signal the
termination of the deltaic and estuary environment.
Stacking Patterns
The facies within the Tyler Formation do exhibit a vertical stacking pattern particularly in
the Lower Tyler. A paleosol overlying a sandstone which in turn is overlying a shale. This
pattern of shoaling upward was observed in several core. The shale had some variation in
coloration, occasionally black in color but overwhelmingly grey in color.
Sturm (1982) suggests that the paleosol and shale deposition are from near channel
environments (Figure 17). However, the absence of channel deposits in multiple wells suggest that
channel migration was not significant enough to create widespread shales and paleosols across
the field. If a model of vertical succession is considered in relation to sea level instead of a solely
lateral movement of sediments it can explain the sediment stacking patterns. The sandstone D1
deposits can be considered a nearshore environment and the subsequent shale and paleosol
development are not result of lateral migration of the channel but a result of the change in sea
level. Since the shale and paleosol is widespread a locally significant event would need to be
utilized to provide an explanation to sediment accumulation. The delta may have been stable and
sea level changes along the coastline could affect the stacking patterns of sediments found.
Further Interest
When looking at core the author found unique properties of interest in the limestones in
wells #4345 and #5606. No other wells studied in Dickinson Field and surrounding areas
exhibited these characteristics. (Figure 9 E) show the wackestone limestone from the marine
facies units in the Upper Tyler. The major difference from other limestones observed is the

Figure 17a. Modi�ed from Sturm (1982) interpretation of paleogeography of beginning of Tyler lower unit deposition.
Figure 17b. Modi�ed from Sturm (1982) interpretation of paleogeography of �rst regression event. Prodelta environment is exposed and transformed into tidal-�at environment. Tidal �at environment would allow for shale deposition to occur.
Grey Shale
Channel Sand
Sand D1/C
Channel Sand

45
apparent dissolution of fossils from the limestone forming large porous vuggy facies. Both of
these facies observed had significant oil staining. Previous studies indicate that the only reservoir
in the Tyler is the Sandstone B unit but if this limestone vuggy facies is more widespread across
the basin it may be a potential second reservoir pool.
46
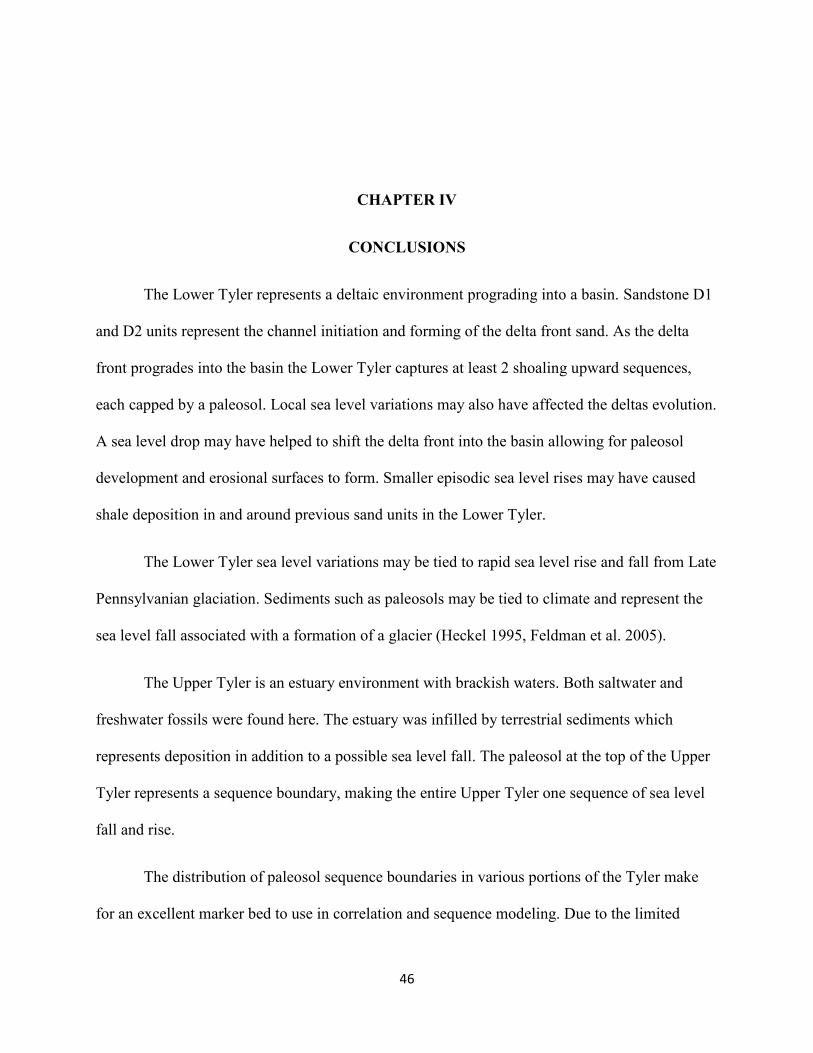
CHAPTER IV
CONCLUSIONS
The Lower Tyler represents a deltaic environment prograding into a basin. Sandstone D1
and D2 units represent the channel initiation and forming of the delta front sand. As the delta
front progrades into the basin the Lower Tyler captures at least 2 shoaling upward sequences,
each capped by a paleosol. Local sea level variations may also have affected the deltas evolution.
A sea level drop may have helped to shift the delta front into the basin allowing for paleosol
development and erosional surfaces to form. Smaller episodic sea level rises may have caused
shale deposition in and around previous sand units in the Lower Tyler.
The Lower Tyler sea level variations may be tied to rapid sea level rise and fall from Late
Pennsylvanian glaciation. Sediments such as paleosols may be tied to climate and represent the
sea level fall associated with a formation of a glacier (Heckel 1995, Feldman et al. 2005).
The Upper Tyler is an estuary environment with brackish waters. Both saltwater and
freshwater fossils were found here. The estuary was infilled by terrestrial sediments which
represents deposition in addition to a possible sea level fall. The paleosol at the top of the Upper
Tyler represents a sequence boundary, making the entire Upper Tyler one sequence of sea level
fall and rise.
The distribution of paleosol sequence boundaries in various portions of the Tyler make
for an excellent marker bed to use in correlation and sequence modeling. Due to the limited

47
preservation of paleosols within the study area, any conclusions about the basin sequence
framework would be premature. However, it does make for an excellent marker bed to search
other portions of the basin to continue the applications of sequence stratigraphic techniques
across the basin. Since paleosol distribution are not of high importance to drillers and producers
many core had portions of the Upper Tyler and Lower Tyler cut off with attention paid to the oil
sand distribution only. If entire Tyler section core could be obtained from across the field, as
well as across the basin, a clearer picture could emerge as to the distribution of paleosols and a
larger sequence framework across the basin could be understood.
Several conclusions about the Tyler Formation within Dickinson Field and surrounding
area can be made from this study:
1. The Upper Tyler has one well defined unconformity that is prominent in the western
portion of the field and thins towards the east
2. The Upper Tyler represents a complete sea level rise and fall cycle
3. The Upper Tyler is interpreted as an estuary paleoenvironment
4. The Lower Tyler has two well defined unconformities across the field that is laterally
consistent across the eastward direction of the field
5. The Lower Tyler paleosols, sandstone and shale stacking pattern represents a variable
environment with sea level variation
6. The Lower Tyler represents a nearshore deltaic environment
7. Sequence stratigraphy methods can be utilized in the Tyler Formation and can be applied
to previous work to yield new and meaningful data
8. The Tyler Formation does have evidence for sea level changes

48

49
Appendix

50
Dickinson Heath Sand Unit 40
#4150
7830-7832.7
White mud with anhydrite nodules
7833-7838.2
Red and purple clay with slight anhydrite
7838.2-7841.7
Red clay to grey clay
7841.7-7845
Anhydrite
7845-7850
Blackish to dark grey clay
7850-7857.5
Black clay with anhydrite
7857.5-7859.9
Grey shale.
7859-7865.1
Grey micritic limestone with grey clay portions
7865.1-7870
Grey shale chips
7870-7876
Paleosol
7876-7881
Red clay with anhydrite, mottled red clay,
7881-7884
Missing
7884-7886
Grey clay with red oxidation
7886-7888
Grey shale

51
7888-7891.6
Grey calcareous shale with pyrite nodules
7891.6-7894
Black and dark grey micritic limestone.
7894-7895.7
Grey shale. Fissile.
7895.7-7896.3
Black micritic limestone
7896.3-7969.9
Dark grey shale. Fissile.
7969.9-7902.1
Grey micritic limestone.
7902.1-7904.4
Grey shale. Fissile.
7904.4-7906.4
Fossilerous wackestone limestone. Dark grey.
7906.4-7914
Alternating dark grey micritic limestone and black fissile shale.
7914-7916.1
Mottled sand and clay. Sand is fine grained. Yellow, grey, and tan sand, and grey clay.
7916.1-7919.7
Alternating dark grey micritic limestone and black fissile shale.
7919.7-7922
Mottled mudstone. Grey color.
7922-7930
Tan, brown and yellow fine grained sandstone. Oil stained.
7930-7931
Grey limestone and grey shale.
7931-7953.7

52
Tan, brown, and yellow fine grained sandstone. Oil stained.
7953.7-7967.5
Dark grey to light grey fissile shale. Some portions are heavily oxidized.
7967.5-7976.3
Medium grained yellow sandstone. Oxidized grains. Cross bedding.
7976.3-7984
Grey to light grey fissile shale. Fissile.

53

54
Dickinson Heath Sand Unit 34
#4217
7841-7841.9
Mix of grey, green and yellow clay.
7841.9-7842.3
Yellow fine grained sandstone with slight oil staining.
7842.3-7842.7
Grey and yellow clay with a slight dark grey shale at bottom.
7842.7-7843
Heavily oil stained wackestone limestone. Ostracods, shell fragments and fossil debris.
7843-7845.4
Grey shale.
7845.4-7848.9
Yellow and rust red mottled clay mix.
7848.9-7854.5
Yellow coarse grained sandstone. Oil stained.
7854.5-7855.4
Red coarse sandstone. Some lamination and bedding.
7855.4-7874.5
Mixed grey and red clay.
7874.5-7879.7
Mottled red and dark brown sand and clay mix. Predominately sand. Lamination.
7879.7-7884
Grey shale.

55

56
Dickinson Heath Sand Unit 31
#4225
7814-7814.5
Grey shale. Fissile.
7814.5-7815.6
Micritic limestone. Rust brown color.
7815.6-7816.3
Grey shale. Fissile.
7816.3-7816.8
Black micritc limestone.
7816.8-7823.7
Dark brown fine grained oil stained sandstone. Lamination. Quartz arenite with black
laminations.
7823.7-7824
Dark grey micritic limestone.
7824-7825
Grey sandy clay.
7825-7826.3
Black wackestone limestone with grey shale interbed.
7826.3-7828.2
Grey shale.
7828.2-7829.3
Yellow fine grained sandstone with black clay compaction marks.
7829.3-7830.2
Grey shale.
7830.2-7832.8
Mottled grey clay with coarse yellow sand.
7832.8-7836
Yellow, red and brown coarse sandstone. Lamination and bedding.

57
7836-7837.6
Yellow sandy clay. Lamination or remnant of bedding.
7837.6-7841
Red and dark brown mudstone. Small lithoclasts.
7841-7846.4
Red and grey clay compaction zone. Tan clay at bottom with black compaction scars.
7846.4-7848
Rust red coarse sandstone.

58

59
Dickinson Heath Sand Unit 29
#4227
7896-7899.8
Mottled sandy clay.
7899.8-7902
Red iron stained sandstone. Fine grained.
7902-7907.3
Fine grained yellow and tan sandstone. Oil stained.
7907.3-7907.7
Grey shale.
7907.7-7909.3
Redish dark brown coarse sandstone. Pebble and gravel sized grains at bottom.
7909.3-7911
Grey and dark grey mudstone with lithoclasts.
7911-7915.6
Red paleosol. Bioturbation.
7915.6-7921.3
Grey, dark grey, shales and mudstones with lithoclasts.
7921.3-7923
Yellow and brown mudstone.
7923-7929.3
Red paleosol.
7929.3-7935.2
Grey and dark grey shale.

60

61
Dickinson Heath Sand Unit 28
#4237
7829-7830.1
Black micritic limestone.
7830.1-7830.7
Grey fissile shale.
7830.7-7832
Grey micritic limestone.
7832-7832.4
Black calcareous shale on top of a dark grey wackestone limestone.
7832.4-7832.9
Grey shale.
7832.9-7834
Brown wackestone limestone.
7834-7834.7
Grey fissile shale.
7834.7-7835.1
Black wackestone limestone.
7835.1-7835.8
Grey shale.
7835.8-7841
Black wackestone limestone. Ostracods, shell fragments and skeletal debris. The fossils are
predominately white in color except for a portion at 7840 where they are black. This may be
possible oil staining. The 7840.5-7841 portion has no fossils and reverts to a micritic limestone.
7841-7843.2
Grey fissile shale.
7843.2-7846.4
Mottled red and brown sandy clay mix.
7846.4-7849.2
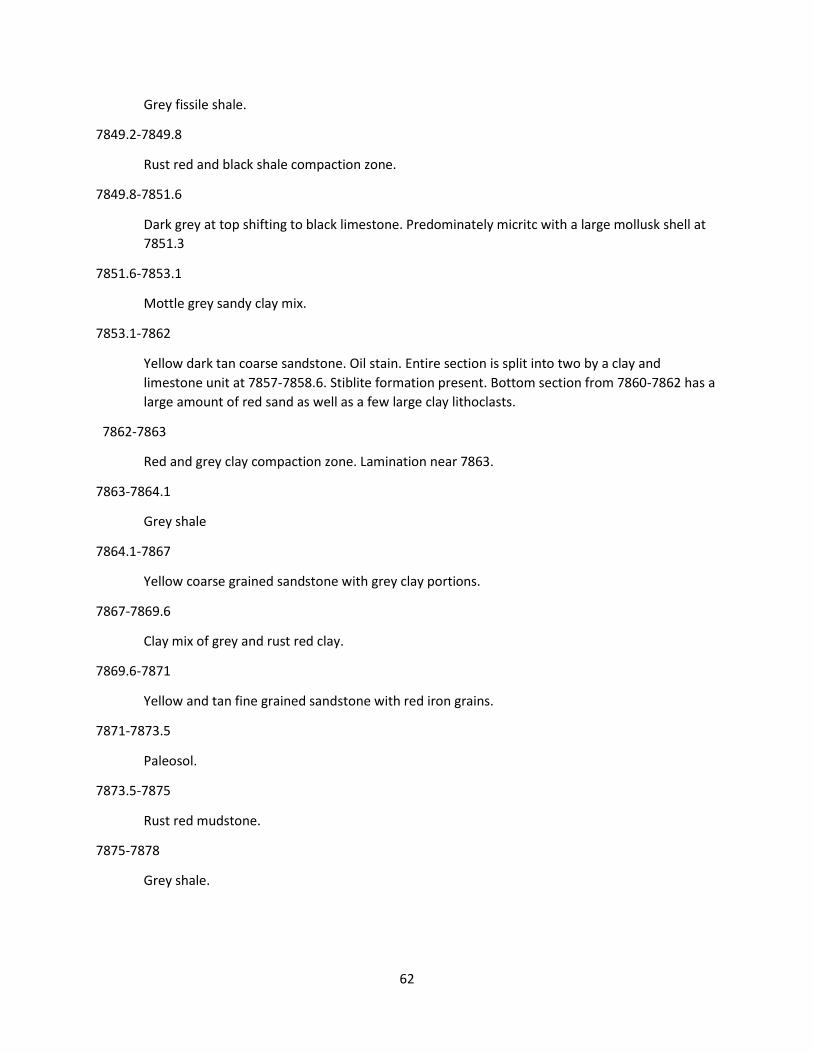
62
Grey fissile shale.
7849.2-7849.8
Rust red and black shale compaction zone.
7849.8-7851.6
Dark grey at top shifting to black limestone. Predominately micritc with a large mollusk shell at
7851.3
7851.6-7853.1
Mottle grey sandy clay mix.
7853.1-7862
Yellow dark tan coarse sandstone. Oil stain. Entire section is split into two by a clay and
limestone unit at 7857-7858.6. Stiblite formation present. Bottom section from 7860-7862 has a
large amount of red sand as well as a few large clay lithoclasts.
7862-7863
Red and grey clay compaction zone. Lamination near 7863.
7863-7864.1
Grey shale
7864.1-7867
Yellow coarse grained sandstone with grey clay portions.
7867-7869.6
Clay mix of grey and rust red clay.
7869.6-7871
Yellow and tan fine grained sandstone with red iron grains.
7871-7873.5
Paleosol.
7873.5-7875
Rust red mudstone.
7875-7878
Grey shale.
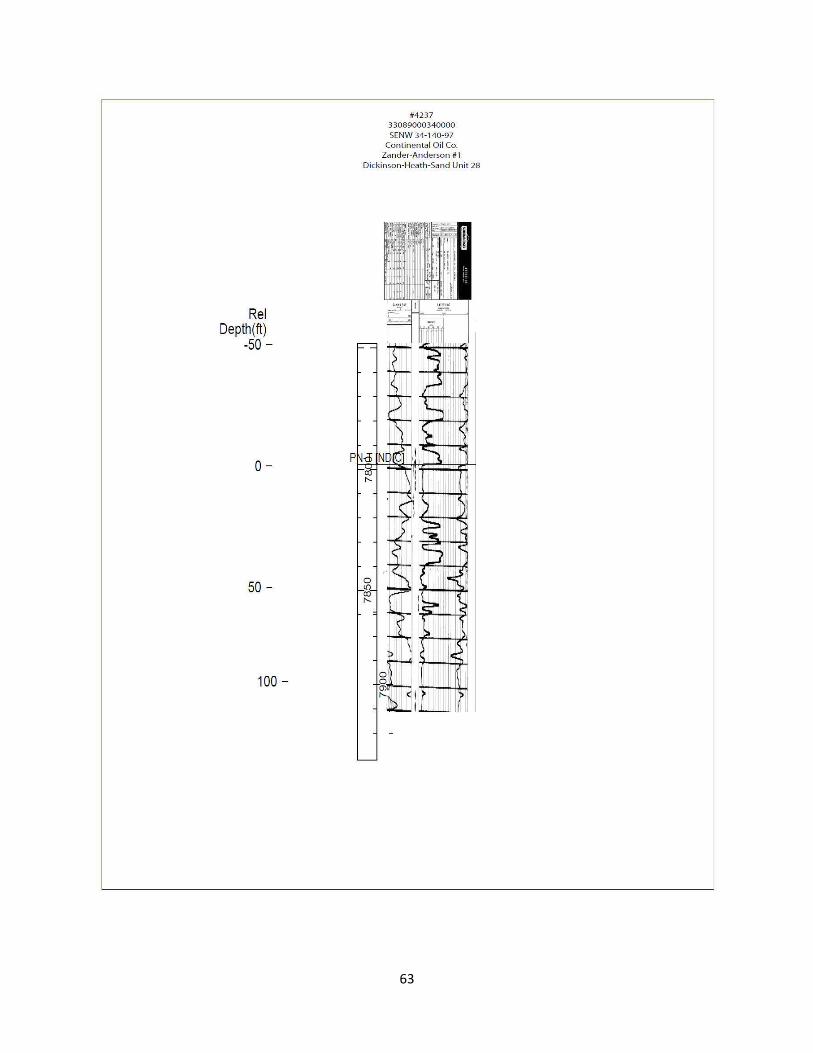
63

64
Dvorak State of North Dakota #1
#4250
7851-7854
Red and dark grey clay.
7854-7856
Lithoclastic mudstone.
7856-7858
Fine grained sandstone. Light tan and white color.
7858-7863
Mudstone. Light grey and grey color.
7863-7866
Black and dark grey shale. Fissile. Bioturbation. Small bed of coal at 7863.1
7866-7870
Light grey mudstone.
Dickinson Heath Sand Unit
#4261
7891-7894.3
Varied limestone unit. Components include micritic limestone and wackestone limestone..
Lamination is present. Oil staining. Large fossils.
7894.3-7895
Black and dark grey calcareous shale.
7895-7895.5
Micritic limestone. Black color.
7895.5-7897.6
Wackestone limestone. Ostracod, shell fragment and skeletal debris heavy limestone. Light grey.
Fossils are white but near 7897.6 there are black fossils.
7897.6-7898.5
Black and dark grey micritic limestone with black shale interbedding.

65
7898.5-7899
Light grey and white wackestone limestone. Large mollusk fossil and smaller ostracods.
7899-7900
Wackestone limestone. Ostracods, shell fragments and skeletal debris.
7900-7901
Black and dark grey miciritc limestone.
7901-7902
Black shale with single grey wackestone limestone bed.
7902-7911.2
Tan, yellow and brown sandstone. Fine grained. Few potential fossils at top at 7902. Oil staining.
7911.2-7914
Black limestone. Portions are wackestone but predominately micritic. Occasional black shale
bed.
7914-7921
Light grey and tan sandstone. Fine grained. Small clay bed at 7921 with red staining.
7921-7933.4
Continuous but varying sandstone. Fine grained, tan and yellow at top. Oil stained. Moving
down core the sandstone becomes red and brown color in addition to the tan, and yellow.
Crossbedding, and possible herringbone bedding. Coarse grain at bottom.
7933.4-7939
Red, purple, brown mudstone mix.

66

67
Dickinson Heath Sand Unit 16
#4284
7845-7848
Tan dark yellow fine grained quartz arenite. Oil stained.
7848-7852
Clay and limestone mix. Ostracod wackestone dark grey limestone is at top near 7848. Rust
brown clay.
7852-7858
Dark tan and brown clay with lithoclasts. Some grey clay portions. Oxidized zone.
7858-7859.5
Fossilerous wackestone limestone. Ostracods and small shell fragments. May be oil stained.
7859.5-7865
Thin layer of black shale at top (possible coal bed). Tan, grey and dark yellow coarse sandstone
and mottled clay.
7865-7867.5
Dark red clay with bioturbation. Grey clay and yellow sand mix near 7867.5. the yellow sand
contains red lithoclasts throughout. Paleosol? Sharp contain with sandstone unit underneath.
7867.5-7872
Oil stained sandstone. Coarse grained quartz arenite sandstone, but with dark rust red clay
ripups.
7872-7886
Red and grey clay compaction zone. Possible paleosol at 7873, or a poorly preserved one.
Definite paleosol at 7880.
7886-7888.5
Red coarse sandstone
7888.5-7894
Red grey compaction zone. At top near 7888.5 some grey clay lamination.
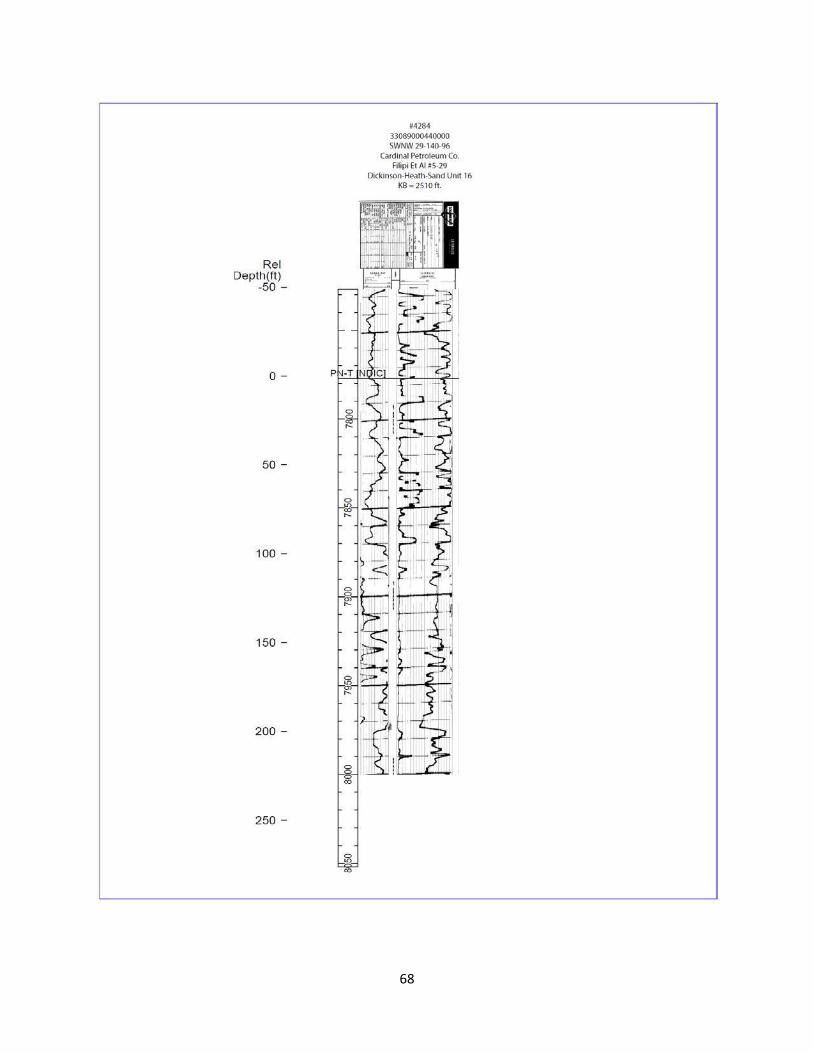
68

69
Dickinson Heath Sand Unit 30
#4287
7906-7908
Light grey, dark grey, and black micritic limestone.
7908-7909
Black and dark grey shale. Fissile and calcareous.
7909-7909.3
Light grey micritic limestone.
7909.3-7918
Tan, and brown fine grained sandstone. Oil stained.
7918-7921
Black shale and dark grey limestone.
7921-7931
Tan, brown and grey fine grained sandstone. Slight oil stain.
7931-7932.5
Light grey shale. Some fissile nature, but trends towards grey mudstone.
7932.5-7934.5
Red coarse grained sandstone. Gravel sized pebbles and cross bedding.
7934.5-7936
Grey shale. Some fissile portions but trends towards massive grey mudstone.
7936-7941
Dark brown, rust red, grey mudstone.
7941-7943
Light grey shale. Fissile.
7943-7946
Dark brown, rust red mudstone.
7946-7947
Red clay. Paleosol.
7947-7948

70
Dark grey shale. Low fissile.
7948-7952
Dark brown, rust red, grey mudstone. Mottled texture. Small lithoclasts.
7952-7953
Red clay with bioturbation. Paleosol.
7953-7955
Dark brown, rust red. Mottled texture.
7955-7960
Red clay. Paleosol.
Dickinson Heath Sand unit 25
#4293
7828-7829
Micritic black limestone alternating with a light grey wackestone. Fossils present in both, but
higher concentration in light grey zone.
7829-7830.9
Black shale transitioning with depth to a black limestone. Limestone is micritic.
7830.9-7837
Top .1 is light grey sand with lithoclasts. The rest is oil stained tan and yellow coarse quartz
arenite.
7837-7840.1
Black shale and black micritc limestone. Pyrite nodules and pyrite layers.
7840.1-7847
Mottled coarse sandy clay mix. Grey clay, some fossils present.
7847-7856
Oil stained sandstone. Coarse grained. Quartz arenite. Yellow light grey and tan.
7856-7857
Grey and red mud compaction zone.
7857-7859

71
Grey laminated limestone. Lamination present.
7859-7863.5
Red, grey, dark yellow and brown clay compaction zone.
7863.5-7864
Red coarse sandstone.
7864-7872
Grey mud and grey shale.
7872-7873
Paleosol.
Dickinson Heath Sand Unit 15
#4299
7876-7879
Black shale and black limestone thin beds. Ocassional red tint shale and brown limestone.
Possible oil stain on limestone.
7879-7882
Oil stained ostracod wackestone limestone with few black shale beds interbedded. Oil stain
color and intensity is not consistent across section.
7882-7883.5
Black shale. Pyrite nodules.
7883.5-7885
White, to tan to grey limestone. Single section is white and is a wackestone. Ostracods, shell
fragments and skeletal debris. Oil staining.
7885-7885.5
Black micritic limestone. Anhydrite nodules.
7885.5-7886.5
Ostracod wackestone limestone. Light grey to dark grey.
7886.5-7887
Black shale at top with black micritic limestone undearneath. Ostracod wackestone with large
anhydrite nodules. Anhydrite and ostracod limestone are heavily oil stained.

72
7887-7888.5
Black shale. Fissile.
7888.5-7890
Oil stained sand. Coarse grained. Tan to dark brown. Small white grains
(ostracods?) throughout sand. Small black and dark brown shale bed at 7889.4.
7890-7893.5
Small black shale bed then dark brown mudstone with lithoclasts. Bottom is black shale with
lithoclasts.
7893.5-7895
Grey mudstone and clay with large lithoclasts.
7895-7900
Brown, grey and green clay and lithoclast mottled mix.
7900-7902
Black shale with brown clay interbed. Some indication of lamination. Grey clay near 7902 with
brown lithoclasts.
7902-7903
Grey mottled sand with some clay. Coarse grained. No structures or bedding.
7903-7913
Tan and yellow coarse grained sandstone. Oil staining.
7913-7915
Red and grey mudstones. Not compaction zone.
7915-7916
Dark grey mudstone with small red grains.
7916-7917
Red mudstone with grey clay.
7917-7919
Red, dark brown, yellow mudstone.
7920-7924
Paleosol.
7924-7925.5

73
Yellow, brown and black mudstone and shales.
7925.5-7928
Red mudstone with lithoclasts.
7928-7933
Red, purple, grey mudstones and clays.

74

75
Dickinson Heath Sand Unit 11
#4300
7890-7891
Calcareous dark grey shale.
7891-7895.3
Fossilerous wackestone limestone. Oil stained. Anhydrite nodule.
7895.3-7895.3
Dark grey, black and grey shale.
7895.3-7895.5
Dark grey micritic limestone.
7895.5-7901
Dark brown and dark grey mudstone.
7901-7903
Grey shale.
7903-7905
Mottled dark tan, dark brown and rust red mudstones.
7905-7906
Dark brown mudstone.
7906-7911
Coarse grained yellow and dark brown sandstone with clay mixed in.
7911-7913
Yellow and iron stained sandstone with grey clay mixed in.
7913-7923
Lithoclastic mudstones. Red, dark brown, and rust red colors.
7923-7924
Red coarse grained sandstone.
7924-7929
Lithoclastic mudstones. Red, dark brown, and rust red colors.
7929-7931

76
Dark yellow, reddish mudstone.
7931-7933
Red, dark brown, and rust red mudstone and clay mix.
7933-7935
Paleosol.
7935-7938
Dark brown and grey shale.
7938-7940
Coarse grained dark red and rust iron mudstone. Lithoclasts.
7940-7941
Grey and red clay.

77

78
Dickinson Heath Sand unit 10
#4326
7880-7882.3
Light grey limestone. Micritic.
7882.3-7883.8
Dark grey and grey shale.
7883.8-7884
Fossilerous wackestone limestone. Light grey, almost white.
7884-7885.3
Micritic limestone and dark grey shale.
7885.3-7888
Light grey micritic limestone.
7888-7889.3
Light grey shale.
7889.3-7893
Wackestone limestone. Dark grey to grey. Oil stained at one portion. Ostracods, shell fragments
and skeletal debris.
7893-7896
Dark grey to grey shale. Some lithoclasts.
7896-7899
Brown, dark brown mudstone with lithoclats.
7899-7899.5
Light grey calcareous fossilerous shale.
7899.5-7900.5
Light grey and tan coarse sandstone. Large lithoclasts mixed in.
7900.5-7905
Dark red, yellow and brown mottled coarse sandy clay.
7905-7906.7
Red clay. Possible paleosol but not clearly preserved.

79
7906.7-7910
Fine grained, yellow and tan sandstone. Slight oil stain.
7910-7911
Light grey shale. Calcareous.
7911-7915
Light yellow and dark red coarse sandstone.
7915-7917
Grey clay.
7917-7919
Paleosol.
7919-7920
Red coarse grained sandstone. Cross bedding.
7920-7920.8
Dark brown and red clay.
7920.8-7920.6
Paleosol.
7920.6-7921.9
Small red coarse sandstone unit.
7921.9-7926.6
Grey clay and red clay mix.
7926.6-7928.2
Paleosol.
7928.2-7929
Grey coarse grained sandstone.
7929-7934
Coarse grained red sandstone.

80

81
Dickinson Heath Sand Unit 41
#4337
7884-7885
Black shale with pyrite. Potential ripples
7885-7887
Light grey limestone. Wackestone with ostracods, shell fragments and skeletal debris. At 7887
the limestone becomes black.
7887-7887.5
Grey mudstones with small limestone and small shale bed.
7887.5-7888
Black micritic limestone.
7888-7891
Tan to dark grey limestone. Ostracods and shell fragments in sections. Limestone is divided by a
black micritic limestone at 7889 with a grey limestone eye shaped lens within.
7891-7893
Black shale with small white fossils in various parts.
7893-7895
Tan mudstone with some clay compaction.
7895-7898.5
Black, dark brown, red shale and clay mottled mix. Pyrite nodules.
7898.5-7899.5
Black limestone. Parts are micritc while other parts are wackestone.
7899.5-7901.
Brown and dark grey sandy mudstone with large lithoclasts.
7901-7902
Rust red mudstone.
7902-7905
Dark yellow and brown mudstone with large lithoclasts and fossils.
82
7905-7907
Yellow and dark yellow clay with iron staining.
7907-7909
Fine grain sandstone. Iron stained in portions.
7909-7910.5
Red clay with iron staining. Parts are yellow clay.
7910.5-7914
Iron stained yellow fine grained sandstone.
7914-7920
Red and grey compaction zone. Possible paleosol at 7919.
7920-7924
Red and brown mudstone. Lithoclasts.

83

84
Dickinson Heath Sand Unit 17
#4345
7840-7840.8
Micritic dark grey limestone.
7840.8-7841
Light grey shale. Fissile.
7841-7841.4
Dark grey shale. Less fissile.
7841.4-7843.9
Light grey to grey limestone. Varies in composition from micritic to wackestone.
7843.9-7844.4
Light grey shale. Fissile.
7844.4-7845.5
Grey micritic limestone.
7845.5-7846
Wacketone grey to dark grey limestone. Ostracods, shell fragments and skeletal debris.
7846-7846.4
Dark grey micritic limestone. Partial layer of anhydrite.
7846.4-7847
Light grey wackestone limestone. Ostracods, shell fragments and skeletal debris.
7847-7848
Dark grey wackestone limestone transitioning with depth to light grey ostracod and fossil heavy
limestone. Some suggestion of oil staining.
7848-7848.4
Dark grey fossilerous limestone. Ostracods and shell fragments prominent. Some fossils have
been dissolved out. Heavy oil staining.
7848.4-7848.8
Light grey to tan banded micritic limestone.
7848.8-7849.4

85
Light grey shale. Fissile.
7849.4-7851 (7850-51 missing)
Oil stained sandstone. Fine grained, yellow and tan.
7851-7854
Micritic limestone with occasional fossils and portions of clay and mud. Dark grey.
7854-7856
Brown and tan mudstone with lithoclasts.
7856-7858.5
Light grey shale. Fissile.
7858.5-7860.9
Light grey and brown sandy mudstone. Sand portions are fine. Some shell fragments.
7860.9-7861
Light grey wackestone imestone. Otracods and shell fragments.
7861-7861.3
Light grey shale. Fissile.
7861.3-7864.8
Mottled grey, brown, yellow and tan sandy mudstone. Sand is coarse.
7864.8-7870
Brown and tan fine grained sandstone. Oil stained.
7870-7871.2
Mottled light grey sandy clay. Sand is coarse.
7871.2-7873.4
Rust red sandstone or brown rust red mudstone with lithoclasts.
7873.4-7874
Red and grey compaction zone.
7874-7876.6
Rust red and brown mudstone with small lithoclasts.
7876.6-7878.1
Paleosol.

86
7878.1-7881.3
Red mudstone.
7881.3-7883.5
Light yellow to light grey sandstone. Coarse grained.
7883.5-7884.1
Paleosol.
7884.1-7885
Grey clay.
7885-7885.9
Paleosol. Bioturbation.
7885.9-7889
Light grey sandstone shifting to a rust red sandstone with depth. Coarse grained. Minor
suggestion of bedding or lamination.

87

88
Dickinson Heath Sand Unit 42
#4353
7879-7882.5
Grey mudstone and brown coarse sandstone. Sand is fine grained. Ostracods present.
7882.5-7886.5
Light grey, light tan sandstone. Fine grained. Oil staining. Ostracods.
7886.5-7887.5
Fine grained brown sandstone with red iron staining.
7887.5-7888
Alternating beds of grey shale and light tan fine grained sandstone.
7888-7888.5
Fine grained light tan sandstone.
7888.5-7889.5
Light tan sandstone with iron staining mixed with grey shale.
7889.5-7890.3
Black wackestone limestone. Potential coal bed.
7890.3-7901.3
Light tan, light brown fine grained sandstone. Oil stained. Two small beds of grey shale near
7901.
7901.3-7904
Grey and dark grey shale. Fissile.

89

90
Dickinson Heath Sand Unit 18
#4437
7850-7851.9
Brown and tan fine grained sandstone. Heavy oil staining.
7851.9-7852
Light grey shale. Fissile.
7852-7855.8
Light grey mudstone. Some lithoclats in portions.
7855.8-7865
Brown, rust red, yellow, dark yellow and dark grey mudstone. Some portions are sandy. Large
lithoclasts. Anhydrite nodules. Large root fossil.
7865-7866.5
Light tan fine grained sandstone. Red grains throughout.
7866.5-7869
Mottled red, dark brown clay. Small units of sand, and lithoclasts.
7869-7871.5
Red mudstone. Some grey compaction portions. Several roots or plant stems.
7871.5-7872
Light yellow and light tan sandstone with small red grains.
7872-7878
Red and grey compaction zone.
7878-7886
Dark yellow, red and grey mottled clay mix.
7886-7891.2
Rust red coarse grained sandstone. Top of the sandstone near 7886 has larger lithoclasts. Some
lamination and slight suggestion of bedding.
7891.2-7893
Grey and red shale. Not fissile but some lamination.

91

92
Dickinson Heath Sand Unit 13
#4653
7970-7974.1
Alternating bands of dark grey and light grey limestones. Ostracods, shell fragments and skeletal
debris found in several of the bands. Some bands are wackestone, others micritic.
7974.1-7975.5
Dark grey calcareous shale. Fissility is low.
7975.5-7978
Dark grey mudstone. Black lithoclasts.
7978-7979
Light tan and yellow sandstone. Fine grained. Large black lithoclasts.
7979-7983
Light tan, light brown, and yellow sandstone. Fine grain. Some remnant bedding. Oil staining.
7983-7985.5
Alternating bands of dark grey shale with light tan and light yellow fine grain sandstone. No oil
staining.
7985.5-7987
Alternating bands of dark grey shale and dark grey micritic limestone.
7987-7990
Grey and dark grey mudstone. One small unit of sandy clay.
7990-7991.5
Light tan, light brown and yellow sandstone. Fine grained. Oil stained.
7991.5-7995
Dark grey, dark grey, and light yellow mudstone mottled mix.

93

94
Dickinson Heath Sand Unit 47
#4690
7874-7876
Brown mudstone with lithoclasts.
7876-7878
Tan and yellow sandstone. Fine grained sandstone. Oil stained.
7878-7880
Tan and white clay with green clay compaction zone.
7880-7880.5
Tan and red sandstone. Fine grained.
7880.5-7881.2
Black and brown clay. Anhydrite nodules.
7881.2-7885
Tan and yellow sandstone. Fine grained sandstone. Oil stained.
7885-7890
Red sandstone. Coarse grained. Cross bedding.
7890-7892.5
Brown and red mudstone.
7892.5-7898.5
Red and brown mudstone. Compaction zone portions.

95

96
Dickinson Heath Sand Unit 38
#4770
7864-7865.2
Light grey micritic limestone.
7865.2-7866
Light grey shale. Fissile.
7866-7866.3
Dark tan and light grey coarse sandy clay.
7866.3-7866.8
Light grey limestone with lithoclasts.
7866.8-7869.2
Yellow, and tan sandstone. Fine grained. Transitions with depth to light grey fine grained
sandstone.
7869.2-7870.8
Light tan and yellow coarse sandstone alternating bands with dark grey clay. Fully mottled mix
at 7970-7970.8.
7870.8-7872.9
Light grey to dark grey micritic limestone.
7872.9-7874
Light grey shale.
7874-7875
Tan sandstone. Fine grained.
7875-7877.4
Grey and light grey mudstone. Few lithoclasts.
7877.4-7879.3
Brown and red iron stained sandstone. Fine grained.
7879.3-7882
Tan, brown light tan and yellow sandstone. Fine grained. Oilstaining. Lamination.
7882-7882.4

97
Sandy grey clay.
7882.4-7883
Red and grey mudstone.
7883-7884.8
Grey mudstone.
7884.8-7885.6
Grey, yellow and purple sandstone. Fine grained. Bottom near 7885.6 has large lithoclasts.
7885.6-7890
Red and grey mudstone.

98

99
Dickinson Heath Sand Unit 12
#4842
8021-8025
Wackestone limestone. Ostracods, shell fragments and skeletal debris. Light grey. Small portion
of black shale at 8022.5.
8025-8027
Yellow and light tan sandstone. Fine grained. Oil stained.
8027-8031.5
Yellow and grey mudstone.

100

101
Dickinson Heath Sand Unit 01
#4906
7882-7884
Dark grey wackestone limestone. Ostracods, shell fragments, skeletal debris. Oil staining.
7884-7886.4
Red and brown sandstone. Ripples.
7886.4-7887.6
Fine grained yellow dark yellow and brown sandstone. Lithoclasts. Bioturbation.
7887.6-7889.2
Red mudstone with lithoclasts. Bioturbation.
7889.2-7896
Dark yellow, red, brown mudstone. With dark red lithoclasts.
7896-7902.6
Purple, dark red, rust red mudstone with large lithoclasts and mottled texture.
7902.6-7905
Tan, brown and light brown fine grained sandstone. Oil stained.

102

103
Dickinson Heath Sand Unit 03
#5041
7915-7916
Red and brown mudstone.
7916-7919
Grey to brown wackestone limestone. Ostracods, shell fragments and skeletal debris. Oil
staining. Portions are brown mudstone.
7919-7919.2
Black shale ontop of a fine grained sandstone.
7919.2-7921
Missing
7921-7931
Yellow and brown mudstone. Lithoclast fragments, and bioturbation.
7931-7934
Yellow fine grained sandstone.
7934-7937
Yellow and tan fine grained sandstone. Oil staining.
7937-7940
Brown and red mudstone.
7940-7944
Coarse grained red sandstone. Bedding and lamination. Cross bedding and ripples.
7944-7945
Rust red mudstone.
Dickinson Heath Sand Unit 46
#5371
7923-7923.5
Grey clay
7923.5-7928.6

104
Paleosol. Red clay.
7928.6-7930.4
Red sandstone. Coarse grained. Some lithoclasts and clay chunks.
7930.4-7933.6
Red clay. Possible second soil horizon.
7933.6-7936.2
Yellow, brown, purple mudstone with large lithoclasts.
7936.2-7937.9
Red and grey clay mix.
7937.9-7943.7
Grey shale. Fissile.
7943.7-7946.1
Micritic limestone varying to wackestone limestone. Dark grey to light grey to black. Ostracods,
shell fragments and skeletal debris. Red lithoclasts.
7946.1-7947
Grey shale. Fissile.
7947-7950
Missing.
7950-7952.7
Dark grey micritic limestone. Anhydrite nodules at 7950.
7952.7-7953.3
Light grey shale. Fissile.
7953.3-7954.5
Dark grey micritic limestone.
7954.5-7955.9
Light grey and grey wackestone limestone. Ostracods, shell fragments and skeletal debris.
7955.9-7959
Black micritic limestone with anhydrite nodules ontop of light grey and grey wackestone
limestone. Ostracods, shell fragments and skeletal debris. Small grey shale unit.

105
7959-7959.9
Grey shale. Fissile.
7959.9-7960.3
Grey mudstone.
7960.3-7967.3
Light yellow, tan and grey sandstone. Fine grained. Oil staining.
7967.3-7970.6
Grey shale. Fissile.
7970.6-7971.6
Black wackestone limestone. Small skeletal fragments and small tan clay unit with bioturbation.
7971.6-7977.6
A light grey sandstone. Fine grained. Occasional clay lithoclasts. Bioturbation. One small grey
shale unit.
7977.6-7984.9
Tan, yellow, light brown sandstone coarse grained. Oil staining.
7984.9-7988
Interbedding of grey fissile shale and black micritic limestone.
7988-7989.8
Missing.
7989.8-7991
Light yellow and tan sandstone.
7991-7994
Red mudstone.
7994-7996
Red sandstone with occasional red mudstone interbeds. Sand is coarse grained.

106

107
Dickinson Heath Sand Unit 48
#5434
7908-7902
Black micritic limestone.
7902-7913.1
Alternating beds of brown and rust red mudstones with brown and grey micritic to wackestone
limestones.
7913.1-7915
Black and dark grey shale. Fissile.
7915-7915.8
Dark grey micritic limestone.
7915.8-7917.8
Dark grey to black wackestone limestone. Ostracods, shell fragments and skeletal debris.
7917.8-7918.5
Black micritic banded limestone.
7918.5-7918.8
Grey wackestone limestone. Ostracods, shell fragments and skeletal debris.
7918.8-7919.2
Black micritic limestone.
7919.2-7920
Dark grey wackestone limestone. Ostracods, shell fragments and skeletal debris.
7920-7923
Alternating beds of black calcareous shale and black micritic limestone. Occasional lithoclasts.
7923-7926.1
Light grey, light tan, light brown fine grained sandstone. Lamination.
7926.1-7927
Alternating beds of black calcareous shale and black micritic limestone.
7927-7927.5
Alternating beds of light brown sandstone and black shale.

108
7927.5-7929.5
Black shale. Pyrite. Fissile.
7929.5-7931
Mix of light tan sandstone with black micritic limestone and mix of light grey micritic limestone
with dark grey miciritc limestone.
7931-7932
Black micritic limestone.
7932-7934
Light brown, dark tan coarse grained sandstone with large lithoclasts and grey clay.
7934-7935
Fine grained light tan, brown sandstone. Oil stained.
7935-7936
Light yellow and light tan fine grained sandstone mixed with grey clay.
7936-7939
Fine grained light tan, brown sandstone. Oil stained.
7939-7943
Yellow and dark yellow coarse lithoclastic sandstone.
7943-7944.8
Yellow mudstone with grey clay and lithoclasts.
7944.8-7945
Yellow fine grained sandstone.
7945-7946
Sandy clay with iron stained lithoclasts. Iron stained beds.
7946-7947.5
Sandy and lithoclastic dark grey shale.
7947.5-7950.1
Coarse grained sandstone. Heavy iron staining. Yellow, brown, red, dark grey. Large lithoclasts of
clay.

109

110
Albert A. Ficek 1
#5461
7918-7919
. Micritic, grey.
7919-7920
Black fissile shale. Calcareous.
7920-7920.1
Coarse grained yellow sandstone.
7920.1-7922
Fine grained sandstone. Tan, and grey color. Large fossils, ostracods and shells.
7922-7923
Limestone. Micritic. Grey and tan color.
7923-7927
Fine grained sandstone. Tan and yellow color.
7927-7927.5
Light gray shale. Fissile.
7927.5-7931
Fine grained sandstone. Yellow and tan color.
7931-7938
Coarse sandstone. Red color. Ripples.
7938-7940
Brown sandy mudstone.
7940-7949
White, purple, brown and red clay.
7949-7953.5
Brown and white mudstone.
7953.5-7954.5
Grey micritic limestone.
7954.5-7959

111
Brown dark grey fissile shale.
George 1-29
#5500
7937.5-7938
Light grey shale with red staining. Fissile.
7938-7940.4
Paleosol. Red mudstone with grey root casts.
7940.4-7941
Brown and light grey clay with small lithoclasts.
7941-7942.2
Red and brown mudstone with large angular lithoclasts.
7942.2-7942.9
Red mudstone with fauna. Ostracods, shell fragments.
7942.9-7943.3
Purple mudstone with heavy fauna. Ostracods, shell fragments and limestone deposition.
7943.3-7946.4
Red and grey clay compaction zone.
7946.4-7950.3
Black shale with occasional red shale bed and light grey limestone bed. Pyrite nodules.
7950.3-7952
Wackestone limestone. Light grey. Ostracods and shell fragments. Two separate wacektone
beds are separated by a red mudstone.
7952-7954
Alternating beds of black shale with black micritic limestone.
7954-7955
Alternating beds of black shale with light grey wackestone limestone.
7955-7965.8
Missing.

112
7965.8-7967.8
Alternating beds of black shale with black micritic limestone.
7967.8-7969.5
Light grey and light tan sandstone. Fine grained with large lithoclasts. Bioturbation.
7969.5-7972.9
Alternating beds of light tan and light yellow fine grained sandstone with black and dark grey
shale. Small portions of the black shales had light grey limestone.
7972.9-7980.8
Tan, light brown sandstone. Fine grained. Oilstained.
7980.8-7981.7
Sandy black clay.
7981.7-7986.3
Tan, brown and iron stained sandstone. Fine grained. Oil staining.
Dickinson Heath Sand Unit 51
#5599
7941-7943
Dark grey wackestone limestone. Ostracods, skeletal fragments, shells. Oil staining near 7943.
7943-7943.5
Light grey and black micritic limestone.
7943.5-7945.4
Dark grey wackestone limestone. Ostracods, skeletal fragments, shells. Oil stain near 7944.
7945.4-7946.3
Alternating bands of light grey to dark grey micritic limestone with dark brown clay.
7946.3-7947.6
Light grey shale. Fissile.
7947.6-7959.1
Tan to light brown fine sandstone. Oil stained.
7959.1-7961
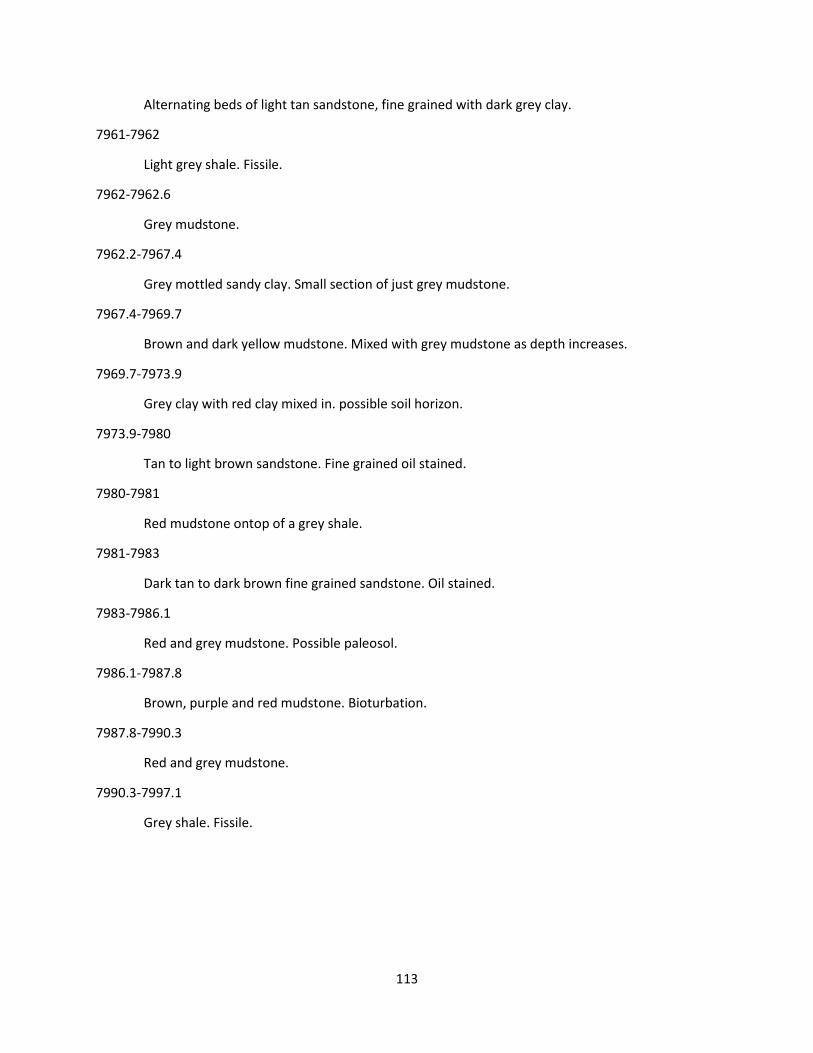
113
Alternating beds of light tan sandstone, fine grained with dark grey clay.
7961-7962
Light grey shale. Fissile.
7962-7962.6
Grey mudstone.
7962.2-7967.4
Grey mottled sandy clay. Small section of just grey mudstone.
7967.4-7969.7
Brown and dark yellow mudstone. Mixed with grey mudstone as depth increases.
7969.7-7973.9
Grey clay with red clay mixed in. possible soil horizon.
7973.9-7980
Tan to light brown sandstone. Fine grained oil stained.
7980-7981
Red mudstone ontop of a grey shale.
7981-7983
Dark tan to dark brown fine grained sandstone. Oil stained.
7983-7986.1
Red and grey mudstone. Possible paleosol.
7986.1-7987.8
Brown, purple and red mudstone. Bioturbation.
7987.8-7990.3
Red and grey mudstone.
7990.3-7997.1
Grey shale. Fissile.

114

115
Dickinson Heath Sand Unit 53
#5606
7875.3-7876.7
Grey, brown, purple and yellow shale. Fissile.
7876.7-7877
Light grey shale. Fissile.
7877-7877.3
Light grey micritic limestone.
7877.3-7877.6
Light grey shale. Fissile.
7877.6-7877.9
Light grey micritic limestone.
7877.9-7879.1
Alternating black and red mudstones. Bioturbation.
7879.1-7880.4
Light grey shale with yellow and brown oxidized staining. Fissile.
788.4-7881.6
Red and purple mudstone.
7881.6-7882
Light grey shale. Fissile.
7882-7884
Red and purple mudstone. Ostracods and small lithoclasts.
7884-7885.2
Light grey shale. Fissile.
7885.2-7886.4
Red mudstone. Bioturbated.
7886.4-7887.4
Red and purple stained grey limestone. Shell fragments, ostracods and skeletal debris.
7887.4-7889

116
Small shale bed then grey to dark grey wackestone limestone. Ostracods, shell fragments,
skeletal debris, and mollusk shells. Some of the fossils have anhydrite recrystallization of the
shells.
7889-7889.4
Boundstone limestone. Heavy oil staining. Ostracods, shell fragments, skeletal debris, and
mollusk shells. Some of the fossils have been dissolved out. Fractured limestone? Picture here.
7889.4-7890.1
Wackestone limestone. Grey. Ostracods, shell fragments, and skeletal debris.
78890.1-7890.8
Light grey shale. Fissile.
7890.8-7891
Dark tan and grey fine grained sandstone.
7891-7892.2
Dark grey shale. Fissile.
7892.2-7895.3
Brown and dark grey mudstone. Black small lithoclasts.
7895.3-7896.7
Light tan sandstone with large black lithoclasts.
7896.7-7904
Brown, rust red and purple iron stained mudstone.
7904-7909.1
Tan, yellow, and brown fine grained sandstone. Oil staining. Iron staining as well.
7909.1-7913.9
Red and purple coarse grained sandstone. Conglomeratic grain dominated. Subrounded to
rounded pebbles. Picture here.
7913.9-7914.3
Red coarse grained sandstone.
7914.3-7915.5
Red mudstone.
7915.5-7918

117
Red and grey compaction zone.
7918-7919.8
Red and grey mudstone. Possible soil horizon.
7919.8-7926
Red, purple, grey and brown mudstone mottled mix.
7926-7931
Red coarse grained sandstone. Cross bedding.

118

119
Mary Rebensdorf 1
#5820
7808-7811
White sandstone. Coarse grained, small lithoclasts, mottled clay portions
7811-7816.5
Sandstone coarse grain, some bedding, reddish, tan, grey and pinkish color.
7816.5-7817.5
Lithoclastic mudstone. Red color.
7817.5-7818
Fine grained sandstone. Pink color.
7818-7820
Claystone. Yellow, brown and white color.
7820-7822
Paleosol. Red color.
7822-7825.5
Mudstone. Reddish, white color. Bioturbation sections.
7825.5-7827.5
Slightly sandy lithoclastic mudstone.
7827.5-7828.5
Coarse grained sandstone. Red and brown color. Large fossils.
7828.5-7829
Coarse grained sandstone. White color.
7829-7834
Tan mudstone.
7834-7837
Brown mudstone.
7837-7840
Coarse grained sandstone. Red color.
7840-7842

120
Mudstone. Red color.
7842-7844.5
Coarse grained sandstone with portions of clay mixed in.
7844.5-7846.5
Coarse grained sandstone. Red color. Bedding is present.
7846.5-7851
Red clay. Possible paleosol.
7851-7853
Brown clay with small lithoclats.
7853-7855
Paleosol. Red clay.
7855-7859
Red and grey clay.
Kostelecky A-1
#6944
7886-7886.5
Black calcareous shale. Fissile.
7886.5-7887.5
Grey limestone.
7887.5-7888
Black and dark grey shale. Fissile.
7888-7889
Grey micritic limestone and grey mud banding.
7889-7894
Wackestone limestone. Ostracods, shell fragments and skeletal debris. Portions are light grey
but black limestone predominates. Limestone is micritic past 7890. Heavy oil staining in parts.
7894-7895
Grey micritic limestone to dark black wackestone mix with grey clay.

121
7895-7899
Light grey to dark tan sandstone. Fine grained. Possible bioturbation. Slight oil stain.
7899-7903
Black shale and clay mix.
7903-7905
Grey clay and grey limestone banding. Fossil bed at 7904.
7905-7906
Light tan and grey sandstone. Fine grained.
7906-7908
Dark grey and light grey mudstone and clay with large lithoclasts.
7908-7910
Light tan and light yellow sandstone. Fine grained, some bioturbation.
7910-7917
Grey clay with occasional red stained mud section. Red and grey clay mix in compaction zone
near 7915.
7917-7920
Dark tan sandstone. Fine grained. Top portion is oil stained while bottom portion is iron stained.
7920-7921.5
Red, black purple and brown mudstone.
7921.5-7923
Brown, red and grey clay compaction zone. Large lithoclasts.

122

123
Kubas 12-31
#10664
8130-8132
Black fissile shale.
8132-8133
Grey micritic limestone.
8133-8133.5
Black fissile shale.
8133.5-8134
Grey clay.
8134-8135
Grey micritic limestone.
8135-8136
Wackestone limestone. Grey.
8136-8139.5
Coarse grained sandstone. Tan and grey color. Calcareous and fossilerous.
8139.5-8141
Black and dark grey sandy mudstone.
8141-8146
Mottled clay and sand mix.
8146-8148
Grey, white and grey clay mix. Anhydrite nodule. Small sand bed at 8147.8.
8148-8149
Dark red clay.
8149-8150
Coarse grained sandstone. Red color. Cross bedding.
Decker 2-30

124
#11637
7807-7810.5
Black and dark grey fissile shale.
7810.5-7814
Grey wackestone limestone.
7814-7814.5
Dark grey fissile shale.
7814.5-7815
Grey wackestone limestone.
7815-7819
Wackestone limestone. Grey and dark grey color. Ostracods and shells.
7819-7822
Black and dark grey shale. Slightly fissile.
7822-7825
Grey mudstone.
7825-7829
Fine grained sandstone. Yellow and tan color. Oil stained.
7829-7830
Light tan fine grained sandstone.
7830-7855
Slightly sandy grey mudstone.
RG 1-10
#13896
7670-7677
Grey, dark grey limestone varying in micritic and wackestone composition.
7677-7681
Clay mix of grey and black clay, with black micritic limestone.
7681-7685
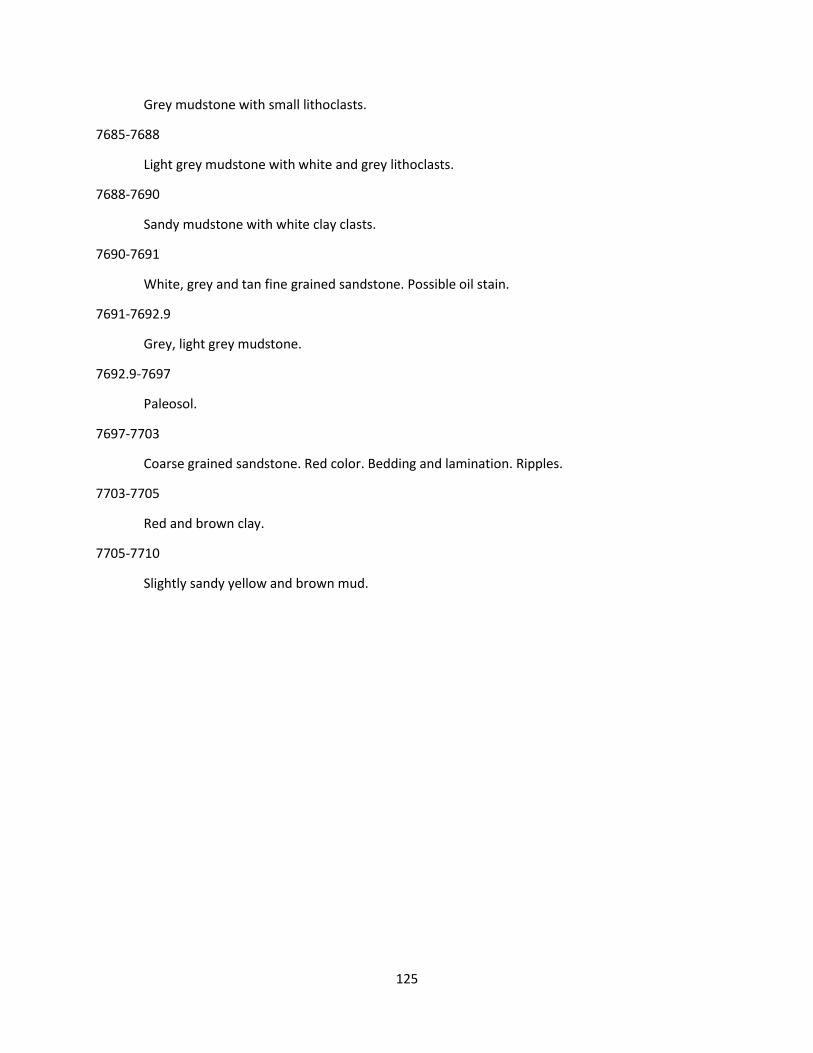
125
Grey mudstone with small lithoclasts.
7685-7688
Light grey mudstone with white and grey lithoclasts.
7688-7690
Sandy mudstone with white clay clasts.
7690-7691
White, grey and tan fine grained sandstone. Possible oil stain.
7691-7692.9
Grey, light grey mudstone.
7692.9-7697
Paleosol.
7697-7703
Coarse grained sandstone. Red color. Bedding and lamination. Ripples.
7703-7705
Red and brown clay.
7705-7710
Slightly sandy yellow and brown mud.

126
REFERENCES
Barwis, J.H., 1990, Flood-Tidal Delta Reservoirs, Medora-Dickinson Trend, North Dakota, in Barwis, J.H., and others, eds., Sandstone Petroleum Reservoirs: New York, Springer-Verlag, p. 389-412
Feldman, H., Franseen, E., Joeckel, R., Heckel, P., 2005, Impact of Longer-Term Modest Climate Shifts on Architecture of High Frequency Sequences (Cyclothems), Pennsylvanian of Midcontinent USA. Journal of Sedimentary Research, Vol. 75, No 3.
Gerhard, L. C., Anderson, S. B., 1988, Geology of the Williston Basin (United States portion): in Sloss, L. L., ed., Sedimentary Cover-North America Craton: U.S., Geology of North America, Geological Society of America, v. D-2, p. 221-242
Grenda, J., 1977, Paleozoology of Cores from the Tyler Formation, Master of Science
Heckel, P., 1994, Evaluation of Evidence for Glacio-Eustatic Control over Marine Pennsylvanian Cyclothems in North America and Consideration of Possible Tectonic Effects. Tectonic and Eustatic Controls on Sedimentary Cyces, SEPM Concepts in Sedimentology and Paleontology #4.
Heckel, P., 1995, Glacial-Eustatic Base Level-Climatic Model for Late Middle to Late Pennsylvanian Coal Bed Formation in the Appalachian Basin. Journal of Sedimentary Research, Vol B65, No. 3.
Maughan, E., 1984, Paleogeographic setting of Pennsylvanian Tyler Formation and Relation to Underlying Mississippian Rocks in Montana and North Dakota, AAPG Bulletin V. 68, No. 2
Nesheim, T., Nordeng, S., 2014 Examination of the Depositional Setting and Geochemistry of Upper Tyler Formation (Pennsylvanian) Source Rocks Within Southwestern North Dakota, Unconventional Resources Technology Conference, Denver Colorado
Nesheim, T., Nordeng, S., 2014, Examination of the Tyler Formation’s (Pennsylvanian) Exploration and Development History using Current Source Rock and Reservoir Maps, adapted from oral presentation at AAPG Rocky Mountain Section Meeting, Denver CO 2014
to t in t
Nesheim, T., 2017, Applying Stratigraphy in the Search for Unconventional Reservoir Upper Tyler Formation (Lower Pennsylvanian), Southern Williston Basin, AAPG Rocky Mountain Section Annual Meeting, Billings, Montana
Nesheim, T.O., Nordeng, S.H., 2016, Stratigraphy and Depositional Origin of Tyler Formation (Pennsylvanian) Source Beds in the Williston Basin, Western North Dakota: in Hydrocarbon Source Rocks in Unconventional Plays, Rocky Mountain Region, published by the Rocky Mountain Association of Geologists, p. 212-235.

127
Nordeng, S., Nesheim, T., 2012, An Evaluation of the Resource Potential of the Tyler Formation (Pennsylvanian) using a Basin Center Petroleum Accumulation Model, Report of Investigations No. 111, North Dakota Geological Survey
Posamentier, H., Jervey, M., Vail., 1988, Eustatic Controls on Clastic Deposition I-Conceptual Framework, Sea-Level Changes, An Integrated Approach, SEPM Special Publication No. 42
Posamentier, H., Allen, 1999, Siliciclastic Sequence Stratigraphy: Concepts and Applications, SEPM Concepts in Sedimentology and Paleontology No. 7
Sturm, S., 1982, Depositional Environments and Sandstone Diagenesis in the Tyler Formation (Pennsylvanian), Southwestern North Dakota, MS thesis, University of North Dakota
Sturm, S., 1987, Depositional History and Cyclity in the Tyler Formation (Pennsylvanian), Southwestern North Dakota,
Ziebarth, H., 1962, The Micropaleontology and Stratigraphy of the Subsufrace “Heath” Formation (Mississippian-Pennsylvanian) of Western North Dakota, MS thesis, University of North Dakota
Ziebarth, H., 1964, The Tyler Formation of Southwestern North Dakota, Williston Basin Symposium
Wagoner, J., Posamentier, H., Mitchum, R., 1988, An Overview of the Fundamentals of Sequence Stratigraphy and Key Definitions, Sea-Level Changes, An Integrated Approach, SEPM Special Publication No. 42
Willis, R., 1959, Upper Mississippian-Lower Pennyslvanian Stratigraphy of Central Montana and Williston Basin, Bulletin of the American Association of Petroleum Geologists, Vol 43, No. 8, pp 1940-1966
Vail, P. R., Mitchum, R. M., Thompson, S., III, 1977, Seismic stratigraphy and global changes of sea level, Part 3: Relative changes of sea level from coastal onlap, in Payton, C. W., ed., Seismic Stratigraphy, Applications to Hydrocarbon Exploration: American Association of Petroleum Geologists Memoir 26, p83-97.