Embed Size (px)
Citation preview

Prepared for Governor Matthew G. Bevin Legislative Research Commission
June 1, 2017
KENTUCKY STROKE ENCOUNTER QUALITY
IMPROVEMENT PROJECT (SEQIP)
Kentucky Heart Disease and Stroke Prevention Program
SEQIP Stroke Registry 2015 Data Summary
2017 Annual Report

2 | P a g e
ACKNOWLEDGMENTS Adam J. Berrones, PhD Epidemiologist Heart Disease and Stroke Prevention Program Kentucky Department for Public Health 275 East Main Street, HS2W-E Frankfort, KY 40621 502-564-7996 [email protected] Starr Block, MS, BSN, RN Senior Director Quality and Systems Improvement Get With The Guidelines Great Rivers Affiliate (Serving DE, KY, OH, PA, WV) 240 Whittington Parkway | Louisville, KY 40222 502-371-6017 [email protected] | www.heart.org Bonita A. Bobo, RN, HHS Program Manager Heart Disease and Stroke Prevention Program Kentucky Department for Public Health 275 E. Main St., HS2W-E Frankfort, KY 40621 502-564-7996 [email protected] Kari D. Moore, MSN, AGACNP-BC Director of Outreach Department of Neurology University of Louisville SEQIP Chair 502-852-6317 [email protected] A special acknowledgment to the members of the SEQIP Steering Committee, including: Lisa Bellamy, RN, BHS, CPHQ (UK HealthCare/Norton Healthcare - Stroke Care Network) Todd Early, NREMT-P, BS, RN (Baptist Health LaGrange, Oldham County EMS) Lynn Hundley, MSN, RN, APRN, CNRN, CCNS, ANVP (Norton Healthcare, Inc.) Polly Hunt, RN (King’s Daughters Medical Center) Dolores Luke RN, BSN, NHA, CPHQ (Morgan County ARH) Bill Singletary RN, BA, BSN, MBM (The Medical Center at Bowling Green) Suggested Citation Kentucky Cabinet for Health and Family Services. The SEQIP Stroke Registry 2017 Annual Report. Frankfort, KY: KY Cabinet for Health and Family Services, Department for Public Health Heart Disease and Stroke Prevention Program, Stroke Encounter Quality Improvement Project, 2017.

3 | P a g e
TABLE OF CONTENTS ACKNOWLEDGMENTS ....................................................................................................................... 2 BURDEN OF CARDIOVASCULAR DISEASE IN KENTUCKY ............................................................ 5
Heart Disease and Stroke .......................................................................................................... 5 For All Kentuckians ...............................................................................................................…...5 STROKE ENCOUNTER QUALITY IMPROVEMENT PROJECT ......................................................... 6
SEQIP Mission/Background ....................................................................................................... 6 Engaging Stakeholders .............................................................................................................. 6 Reporting Purpose ..................................................................................................................... 6
EXECUTIVE SUMMARY ...................................................................................................................... 7 Cardiovascular Disease in the Commonwealth .......................................................................... 7 SEQIP ........................................................................................................................................ 7 Demographics of SEQIP Patients .............................................................................................. 7 Stroke Types of SEQIP Patients ................................................................................................ 7 Descriptives of SEQIP Patients .................................................................................................. 7 Arrival Modes of SEQIP Patients ............................................................................................... 8 Initial Exam Findings .................................................................................................................. 8 Performance Measure Results ................................................................................................... 8 Recommendations ..................................................................................................................... 9
DEMOGRAPHICS OF SEQIP PATIENTS FOR 2015 ........................................................................ 10 Who is Affected? ...................................................................................................................... 10
STROKE TYPES OF SEQIP PATIENTS FOR 2015 .......................................................................... 11 Stroke Types ............................................................................................................................ 11
DESCRIPTIVES OF SEQIP PATIENTS FOR 2015 ............................................................................ 12 Modifiable Risk Factors ............................................................................................................ 12
ARRIVAL MODES OF SEQIP PATIENTS FOR 2015 ........................................................................ 13 Pre-Hospital Mode of Transport ............................................................................................... 13 Kentucky Board of Emergency Medical Services (KBEMS) ..................................................... 13
PATIENT SYMPTOMS ON ARRIVAL FOR 2015 .............................................................................. 14 Common Stroke Symptoms ..................................................................................................... 14
PERFORMANCE MEASURES DEFINITIONS ................................................................................... 15 PERFORMANCE MEASURES RESULTS FOR 2015 ....................................................................... 16
Overview of Performance Measures ........................................................................................ 16 Optimal Treatment of Ischemic Strokes and Rationale ............................................................ 16
IV RECOMBINANT TISSUE PLASMINOGEN ACTIVATOR RESULTS FOR 2015 .......................... 17 EARLY ANTITHROMBOTICS RESULTS FOR 2015 ......................................................................... 18 VENOUS THROMBOEMBOLISM PROPHYLAXIS RESULTS FOR 2015 ........................................ 19 ANTITHROMBOTICS AT DISCHARGE RESULTS FOR 2015 .......................................................... 20 ANTICOAGULATION THERAPY RESULTS FOR 2015 .................................................................... 21 SMOKING CESSATION RESULTS FOR 2015 .................................................................................. 22 LDL RESULTS FOR 2015 .................................................................................................................. 23 DYSPHAGIA RESULTS FOR 2015 ................................................................................................... 24 STROKE EDUCATION RESULTS FOR 2015 .................................................................................... 25 REHABILITATION RESULTS FOR 2015 ........................................................................................... 26

4 | P a g e
RECOMMENDATIONS ...................................................................................................................... 27 Identify and Improve Current Cerebrovascular Systems of Care ............................................. 27 Continue Stroke Encounter Quality Improvement Project through FY 2019 ............................. 27 Continue to Engage Hospitals to Become Stroke Certified ...................................................... 27 Develop Collaboration Among Healthcare Systems and Public Health in the State to Standardize Messaging ............................................................................................................ 28
APPENDIX A ...................................................................................................................................... 29 211.575 Statewide system for stroke response and treatment. ................................................ 29
APPENDIX B ...................................................................................................................................... 30 216B.0425 Certification designations for stroke care for acute care hospitals. ........................ 30
APPENDIX C ...................................................................................................................................... 31 311A.180 Medical control documents -- Review -- Approval -- Appeal – Schedule for submission and review. ............................................................................................................ 31
APPENDIX D ...................................................................................................................................... 32 Listings of SEQIP Hospitals ..................................................................................................... 32
5 | P a g e
BURDEN OF CARDIOVASCULAR DISEASE IN KENTUCKY Heart Disease and Stroke Data from the KY Behavioral Risk Factor Survey for 2015
• 5.4% of adults have been told by a health care professional they have angina or heart disease • 3.8% of adults have been told by a health care professional they had a stroke • 5.9% of adults have been told by a health care professional they had a heart attack • 34.6% of adults have had their blood cholesterol checked and told it was high • 41% of men have been told by a health care professional they have high blood pressure
o Of these, 80% reported taking blood pressure medicine to control hypertension • 37% of women have been told by a health care professional they have high blood pressure
o Of these, 84% reported taking blood pressure medicine to control hypertension
For All Kentuckians
• Your risk for cardiovascular disease can be greatly reduced by 1) managing blood pressure, 2) engaging in regular physical activity, 3) following a heart-healthy diet, and 4) reducing stress
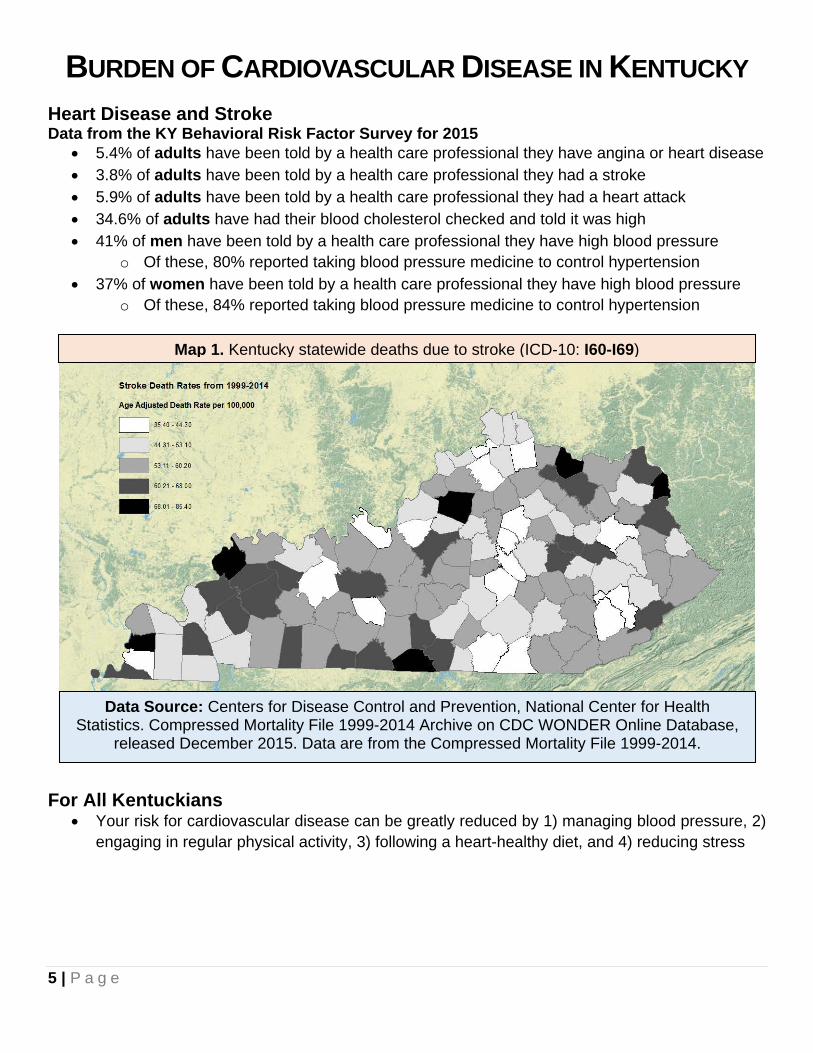
Map 1. Kentucky statewide deaths due to stroke (ICD-10: I60-I69)
Data Source: Centers for Disease Control and Prevention, National Center for Health Statistics. Compressed Mortality File 1999-2014 Archive on CDC WONDER Online Database,
released December 2015. Data are from the Compressed Mortality File 1999-2014.

6 | P a g e
STROKE ENCOUNTER QUALITY IMPROVEMENT PROJECT SEQIP Mission/Background The Mission of SEQIP is to advance acute stroke care management and reduce stroke disparities in Kentucky by:
• Establishing a network of professionals that will encourage and support collaboration among stroke care providers in Kentucky.
• Providing opportunities to share information and resources related to stroke program development and proficiency across the continuum of care in Kentucky.
• Promoting quality, improving outcomes and standardization of acute stroke care through collegiality and use of evidence-based practice guidelines.
• Collaborating on stroke related research throughout Kentucky. SEQIP was created in 2009 as a statewide voluntary stroke quality improvement initiative of the Kentucky Heart Disease and Stroke Prevention Task Force - Cardiovascular Health (CVH) Delivery Systems Subcommittee and the American Heart Association/American Stroke Association (AHA/ASA). SEQIP initiated a voluntary participation in a stroke registry for hospitals, the first in Kentucky.
Since its inception, SEQIP has grown to include hospitals that are stroke certified as Comprehensive, Primary, and Acute Stroke Ready, as well as hospitals seeking to advance stroke care in the community in which they serve. Participation in SEQIP is voluntary and open to all hospitals and stakeholders in Kentucky and surrounding areas. Membership does not require registry participation. Engaging Stakeholders SEQIP was designed to encourage collaboration between hospitals and stakeholders in Kentucky in order to improve the quality of care given to stroke patients. At inception, 16 hospitals were geographically chosen and invited to participate to represent the state as a whole. Quality and process improvement reports were generated and reviewed by SEQIP member hospitals, and action plans were created and implemented by members. As the initiative has grown, additional hospitals have joined the effort. The data presented in this report are based on 23 certified stroke centers that provided mandatory data for calendar year 2015. There are currently 35 participating hospitals engaged in SEQIP. Data from these additional centers will be reflected in future reports. Reporting Purpose This data summary report is compiled pursuant to KRS 211.575, which requires the Kentucky Department for Public Health (KDPH) to establish and implement a plan to address continuous quality improvement for stroke care. KDPH is required to provide an annual report to the Governor and the Legislative Research Commission that includes data, related findings, and recommendations to improve the delivery of stroke care efforts in Kentucky.

7 | P a g e
EXECUTIVE SUMMARY Cardiovascular Disease in the Commonwealth Citizens of the Commonwealth have high rates of heart disease, heart attack, stroke, and common medical problems, such as high blood pressure and high cholesterol that increase the risk of developing these cardiovascular diseases. As a result, Kentucky ranks 8th in the nation for deaths caused by cardiovascular diseases with the highest death rates in Eastern and Western Kentucky. Stroke Encounter Quality Improvement Project (SEQIP) SEQIP is a statewide quality improvement initiative and registry to advance stroke care management and reduce disparities in Kentucky. Membership is voluntary and includes hospital representatives from all certified stroke centers in the state, as well as hospitals seeking certification and other individuals and organizations with an interest in improving stroke care. The project was designed to share best practice strategies and encourage collaboration. SEQIP has grown from 16 hospitals in 2009 to 35 hospital in 2017. Demographics of SEQIP Patients In 2015, 60% of stroke patients in Kentucky’s stroke registry were over the age of 65, comprising the largest age group by frequency; 34% were between 46 and 65 years. Gender consisted of 51% female and 49% male; race was predominantly White at 88%, followed by Black 10%, and then Latino with 1%. Stroke Types of SEQIP Patients Stroke is caused by a loss of blood flow to the brain due to blockage or breaking of the blood vessel. An ischemic stroke (the most common in the US, 87%) occurs when there is a loss of blood flow to the brain from a blood clot or plaque build-up in the brain arteries or arteries leading to the brain. A temporary loss of blood flow to the brain that does not cause permanent damage is known as a Transient Ischemic Attack. Hemorrhagic stroke (13% of all strokes) is due to rupture of a blood vessel causing bleeding into the brain tissue or space around the brain. In 2015, the major types of stroke in Kentucky’s registry were as follows: Ischemic Stroke: 68% Hemorrhagic Stroke: 9% Transient Ischemic Attack: 9% Descriptives of SEQIP Patients Some of the most common modifiable risk factors leading to a stroke are: high blood pressure, high cholesterol, diabetes, cigarette smoking, atrial fibrillation or flutter (an irregular heart rhythm increasing the risk for blood clot formation), drug and alcohol abuse, and obesity. In the Kentucky registry, those patients suffering a stroke or TIA had the following top risk factors: high blood pressure – 75%, high cholesterol – 36%, diabetes – 34%, cigarette smoking – 23%, obesity 17%, atrial fibrillation/flutter – 16%. These risk factors are controllable and therefore all public health stakeholders should be invested in population health approaches that will reduce the risk factors and prevent future strokes.

8 | P a g e
Arrival Modes of SEQIP Patients Activation of the 911 response system is recommended by the Centers for Disease Control and Prevention and the American Heart/Stroke Association when stroke is suspected. SEQIP hospitals throughout the state engage in community education to increase awareness on the symptoms of stroke and activation of 911. Data for 2015 show that 39% of stroke patients utilized Emergency Medical Services (EMS), 29% were transferred from another hospital, 28% utilized private vehicle, and 4% the transportation mode was unknown. These numbers reflect the ongoing need for continued education. In 2015, SEQIP identified through a survey that stroke response protocols, orientation, and education for EMS dispatchers throughout the Commonwealth is inconsistent and lacks standardization. Therefore, SEQIP hospitals continue to partner with EMS agencies to provide education and assist with continued development of stroke systems of care. Initial Exam Findings The most common stroke symptoms present on arrival to SEQIP hospitals were: muscle weakness, trouble with speech, and altered level of consciousness. The National Institute of Health Stroke Scale (NIHSS) Score is used to document the severity of symptoms on arrival to the hospital. Scores range from 0-42. Zero reflects no deficits and a score of 42 would indicate the most severe disability. On arrival to SEQIP hospitals, 94% of patients had an initial NIHSS performed. The majority of stroke patient’s (6,088) presented with an NIHSS score of 1-15 indicating a mild to moderate stroke while 1,030 patients presented with an NIHSS of 16-42 indicating a more severe stroke on arrival. Performance Measure Results SEQIP hospitals monitor 10 evidence based performance measures endorsed by the American Heart/Stroke Association and Stroke Center certification bodies for the treatment and management of stroke patients from hospital to discharge. The 10 measures monitored are:
1. Alteplase (IV t-PA) administration - administering the only FDA approved clot busting drug to eligible patients.
2. Early Antithrombotics – administering medications by the end of hospital day two that help prevent strokes from reoccurring by keeping products in the blood from sticking together.
3. Venous Thromboembolism (VTE) Prophylaxis – administering medications or applying pulsating sleeves to the legs that assist with pumping blood flow back to the heart and decrease the risk of blood clot formation in the legs.
4. Antithrombotics at Discharge – prescribing medications at discharge that help prevent strokes from reoccurring by keeping products in the blood from sticking together.
5. Anticoagulation for Atrial Fibrillation/Flutter – administering medications at discharge that thin the blood and prevent blood clots from forming for those patients with the abnormal heart rhythm of atrial fibrillation or flutter.
6. Smoking Cessation – All stroke patients who smoke should receive counseling and be notified of resources available to assist them in their efforts to stop smoking.
7. Low Density Lipoprotein (LDL) - All patients with an LDL (bad cholesterol that contributes to plaque build-up in the arteries) should be prescribed a statin (medication that prevents cholesterol and plaque build-up) at discharge unless contraindicated.
8. Dysphagia Screen – All stroke patients safe swallowing ability should be assessed before giving pills, food, or liquids by mouth to ensure they are not going into the lungs.

9 | P a g e
9. Stroke Education – All stroke patients should be educated on the signs and symptoms of stroke, their personal risk factors for stroke, medications prescribed for stroke prevention, activation of 911 for stroke symptoms, and follow up appointments.
10. Rehabilitation Considered – physical therapists, occupational therapist, and speech language pathologists should evaluate patients and assist in the decision making for most appropriate discharge location and plan.
The nationally recognized goal for the above performance measures by the American Heart Association/Stroke Association and Stroke Center certifying bodies is > 85% achievement for each measure. SEQIP hospitals met this goal for all 10 measures during calendar year 2015. Recommendations The Kentucky Heart Disease and Stroke Prevention Task Force along with the Kentucky Department for Public Health Heart Disease and Stroke Prevention Program developed the Kentucky Heart Disease and Stroke Prevention Strategic Map and Plan for 2017-2019. SEQIP members were active participants in the development and creation of the map and are committed to furthering the initiatives outlined in the plan for continued improvement in stroke systems of care in the Commonwealth. Recommendations are to:
• Continue to recruit hospitals and stakeholders to become involved in SEQIP • Increase the number of certified stroke centers in the state • Administer the only FDA approved clot busting drug to appropriate stroke patients • Continued partnership with the Kentucky Hospital Association’s (KHA) Rural Hospital Flexibility
Program to disseminate updated stroke education for health care providers and EMS personnel • Partner with the Kentucky Board of EMS (KBEMS) to further define opportunities for shared
data collection, EMS personnel education, and dissemination of approved stroke protocols • Continue to educate the public on how stroke can be prevented, the signs and symptoms of
stroke, and the importance of calling 911 when a stroke is suspected. Finally, SEQIP is positioned to achieve these goals by maximizing our current resources; sustaining and creating new partnerships; and maintaining collaboration amongst stakeholders. SEQIP Steering Committee June 1, 2017

10 | P a g e
DEMOGRAPHICS OF SEQIP PATIENTS FOR 2015
Who is Affected? Deaths due to stroke are a major threat to public health. According to 2016 National Vital Statistics Reports, stroke deaths are the fifth leading killer for all Americans. While there are a number of modifiable risk factors that can be targeted to reduce the likelihood for experiencing a stroke, certain predictors of stroke are non-modifiable. For example, age, race, gender, and family medical history are independent predictors of stroke that cannot be modified. However, public health stakeholders can focus efforts on reducing the prevalence and burden of stroke by addressing the modifiable risk factors that are listed further in this report.
Figure A. Percent of patients by age
6%
34%
48%
12%
18 - 45 46 - 65 66 - 85 >85
Figure B. Percent of patients by gender
49%51%
Figure C. Percent of patients by race
88%
10%
1%1%
White Black Unknown Latino
Figure D. Patient groupings by insurance type
54%
30%
14%
3%
0% 20% 40% 60% 80%100%
Medicare
Private/VA/Champus/Other
Medicaid
No insurance

11 | P a g e
STROKE TYPES OF SEQIP PATIENTS FOR 2015 Stroke Types: A clinical syndrome caused by disruption of blood supply to the brain resulting in brain cell death, characterized by rapidly developing signs of cerebral dysfunction. Ischemic Stroke (IS): occurs when an artery to the brain is blocked resulting in inadequate blood supply and oxygen causing brain tissue to die. Transient Ischemic Attack (TIA): occurs when part of the brain does not get the blood flow it needs. The symptoms occur rapidly and usually last for a short time before resolving completely and leaving no permanent damage. Intracerebral Hemorrhage (ICH): occurs when a blood vessel within the brain ruptures, allowing blood to leak inside the brain tissue. Subarachnoid Hemorrhage (SAH): occurs when a blood vessel just outside the brain ruptures. The area between the skull and the brain (the subarachnoid space) rapidly fills with blood. Other: includes stroke not otherwise specified, no stroke-related diagnosis, and missing diagnosis. Elective Carotid Intervention Only: elective definitive interventions include elective carotid endarterectomy, angioplasty, and carotid stenting.
Figure E. Percent of patients by stroke type
68%
9%
3%9%
7% 4%
Ischemic Stroke Transient Ischemic Attack (<24 hours)Subarachnoid Hemorrhage Intracerebral HemorrhageElective Carotid Intervention only Other

12 | P a g e
DESCRIPTIVES OF SEQIP PATIENTS FOR 2015
Modifiable Risk Factors While one cannot alter age, race, gender, or family medical history, there are a number of behavioral risk factors that can be targeted to reduce the chances for having a future stroke. For example:
High Blood Pressure Cigarette Smoking
Diabetes
Dyslipidemia
Atrial Fibrillation
Alcohol/Drug Abuse
Diet/Nutrition Physical Activity
Body Mass
Sleep Apnea
High Stress Levels
Sodium Reduction
are key risk factors that have been linked to premature mortality and serious morbidity. To reduce the likelihood for experiencing a stroke, discuss your individual health status with your health care providers and learn about how you can manage controllable risk factors.
Figure F. A histogram of patients’ previously known medical history
16%
26%
3%
12%
34%
6%
36%
8%
10%
1%
75%
2%
17%
24%
10%
1%
4%
6%
10%
4%
23%
0% 20% 40% 60% 80% 100%
Atrial Fib/FlutterCoronary Artery Disease
Carotid StenosisDepression
Diabetes MellitusDrugs/Alcohol Abuse
DyslipidemiaFamily HistoryHeart Failure
Hormone Replacement TherapyHypertension
MigraineObesity/Overweight
Previous StrokePrevious TIA
Prosthetic Heart ValvePeripheral Vascular Disease
Renal InsufficiencySickle Cell
Sleep ApneaSmoker

13 | P a g e
ARRIVAL MODES OF SEQIP PATIENTS FOR 2015 Pre-Hospital Mode of Transport The notification and response of Emergency Medical Services (EMS) for a stroke involves a complex interaction between the public, the applicable EMS agencies, and the relevant hospital emergency departments. The CDC recommends hospitals develop partnerships with local EMS providers, as well as educate communities about how to recognize the symptoms of stroke and the importance of dialing 911 when someone is experiencing these symptoms. These recommendations promote timely life-saving treatment. It is also important for EMS and emergency dispatch operators to be trained in stroke symptom recognition and be able to assist patients in quickly getting to the nearest appropriate hospital that is able to provide the “clot-busting” drug IV rt-PA. Kentucky Board of Emergency Medical Services (KBEMS) KRS 311A.180 requires emergency medical services directors to establish pre-hospital care protocols for the assessment, treatment, and transport of stroke patients. Specific objectives include:
• Identify and convene experts and partners to guide the statewide approach to definitive treatment of Cardiac and Stroke cases and recommend project interventions.
• Implement and evaluate a comprehensive AMI and Stroke access assessment targeting 120 counties in the Commonwealth.
• Collaborate with system engineers to analyze EMS system capabilities and the capabilities of regional healthcare facilities and specialty care centers.
• Begin implementation of quality improvement initiatives prioritized by expert groups. • Identify policy initiatives based on the findings of the assessment and the expert group
recommendations. • Promote and advocate for educational programs, protocol updates and regionalized EMS
system of care. • Establish a minimum set for Cardiac and Stroke care that can be reported by EMS Systems and
healthcare facilities for ongoing research. • Implement a reassessment to evaluate progress, remaining challenges, clarify questions on the
initial assessment, and develop a gap analysis for ongoing evaluation.
Figure G. Patient groupings of how they arrived to the hospital
39%
28%
29%
1%
3%
EMS Private transportTransfer from other hospital UnknownMissing

14 | P a g e
PATIENT SYMPTOMS ON ARRIVAL FOR 2015
Common Stroke Symptoms • Altered level of consciousness: sudden confusion, disorientation, agitation, and altered level of
responsiveness • Aphasia/language disturbance: loss of the ability to understand or express speech • Hemiparesis/weakness: sudden onset of one-sided weakness and/or loss of movement, usually
beginning in the face and the same side of the body • Other symptoms: include facial drooping, difficulty swallowing (dysphagia), headaches
Figure H. Initial exam findings (more than one symptom permitted per patient)
39%
11%
20%
15%
3%
12%
0% 20% 40% 60% 80% 100%
Weakness/Paresis
Altered Level of Consciousness
Aphasia/Language Disturbance
Other Neurological Symptoms
No Neurological Signs/Symptoms
Unable to Determine/NA
Figure I. Dysphagia screening results
65%
35%
Pass Fail
Figure J. NIHSS reported
94% = YES
6% = NO
0%
10%
20%
30%
40%
50%
60%
70%
80%
90%
100%
Percent
Figure K. NIHSS scores (indicating stroke severity)
19%
39%27%
6% 9%
0%10%20%30%40%50%60%70%80%90%
100%
No
sym
ptom
s
Min
or
Mod
erat
e
Mod
erat
e to
sev
ere
Seve
re
0 1 to 4 5 to15
16 to20
21 to42
15 | P a g e
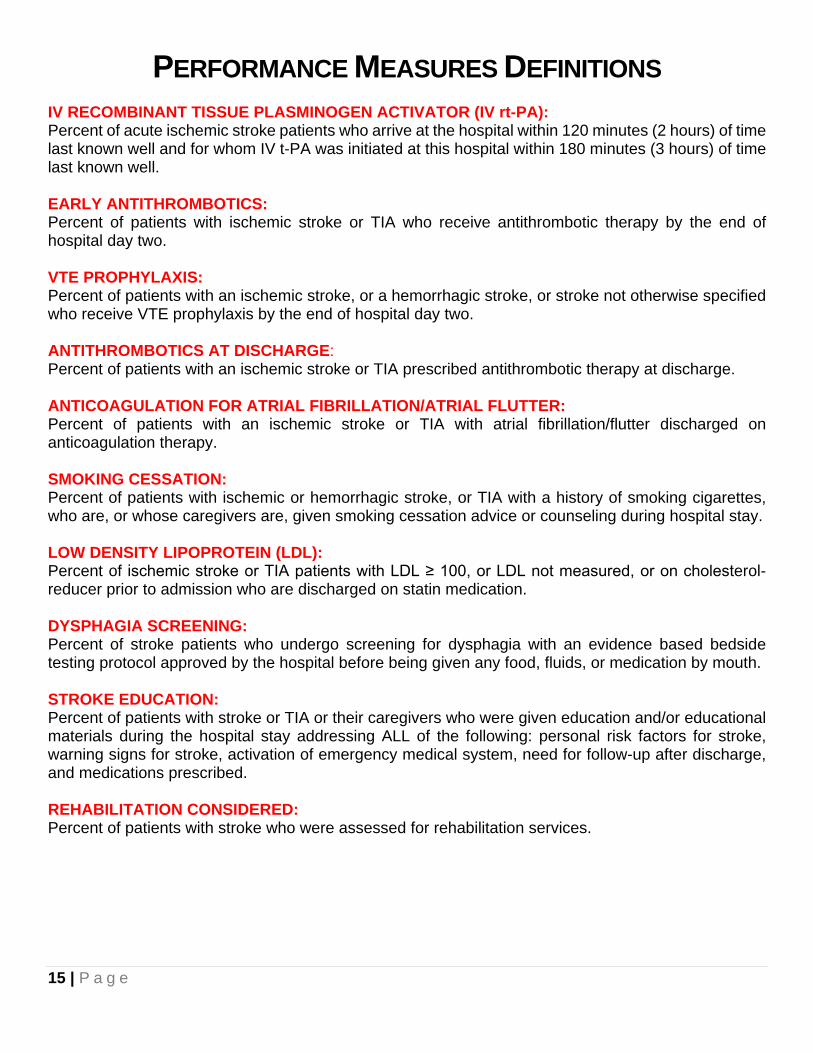
PERFORMANCE MEASURES DEFINITIONS IV RECOMBINANT TISSUE PLASMINOGEN ACTIVATOR (IV rt-PA): Percent of acute ischemic stroke patients who arrive at the hospital within 120 minutes (2 hours) of time last known well and for whom IV t-PA was initiated at this hospital within 180 minutes (3 hours) of time last known well. EARLY ANTITHROMBOTICS: Percent of patients with ischemic stroke or TIA who receive antithrombotic therapy by the end of hospital day two. VTE PROPHYLAXIS: Percent of patients with an ischemic stroke, or a hemorrhagic stroke, or stroke not otherwise specified who receive VTE prophylaxis by the end of hospital day two. ANTITHROMBOTICS AT DISCHARGE: Percent of patients with an ischemic stroke or TIA prescribed antithrombotic therapy at discharge. ANTICOAGULATION FOR ATRIAL FIBRILLATION/ATRIAL FLUTTER: Percent of patients with an ischemic stroke or TIA with atrial fibrillation/flutter discharged on anticoagulation therapy. SMOKING CESSATION: Percent of patients with ischemic or hemorrhagic stroke, or TIA with a history of smoking cigarettes, who are, or whose caregivers are, given smoking cessation advice or counseling during hospital stay. LOW DENSITY LIPOPROTEIN (LDL): Percent of ischemic stroke or TIA patients with LDL ≥ 100, or LDL not measured, or on cholesterol-reducer prior to admission who are discharged on statin medication. DYSPHAGIA SCREENING: Percent of stroke patients who undergo screening for dysphagia with an evidence based bedside testing protocol approved by the hospital before being given any food, fluids, or medication by mouth. STROKE EDUCATION: Percent of patients with stroke or TIA or their caregivers who were given education and/or educational materials during the hospital stay addressing ALL of the following: personal risk factors for stroke, warning signs for stroke, activation of emergency medical system, need for follow-up after discharge, and medications prescribed. REHABILITATION CONSIDERED: Percent of patients with stroke who were assessed for rehabilitation services.
16 | P a g e
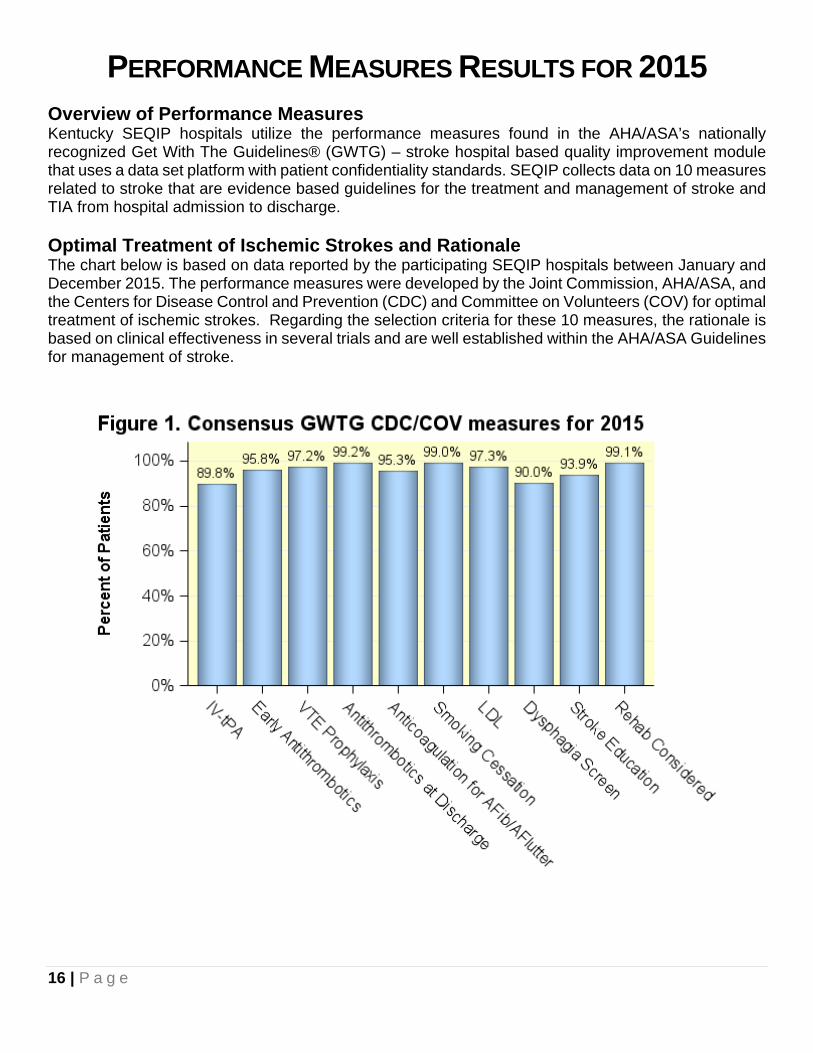
PERFORMANCE MEASURES RESULTS FOR 2015 Overview of Performance Measures Kentucky SEQIP hospitals utilize the performance measures found in the AHA/ASA’s nationally recognized Get With The Guidelines® (GWTG) – stroke hospital based quality improvement module that uses a data set platform with patient confidentiality standards. SEQIP collects data on 10 measures related to stroke that are evidence based guidelines for the treatment and management of stroke and TIA from hospital admission to discharge. Optimal Treatment of Ischemic Strokes and Rationale The chart below is based on data reported by the participating SEQIP hospitals between January and December 2015. The performance measures were developed by the Joint Commission, AHA/ASA, and the Centers for Disease Control and Prevention (CDC) and Committee on Volunteers (COV) for optimal treatment of ischemic strokes. Regarding the selection criteria for these 10 measures, the rationale is based on clinical effectiveness in several trials and are well established within the AHA/ASA Guidelines for management of stroke.

17 | P a g e
IV RT-PA RESULTS FOR 2015
Year
Proportion of
Patients
95% CI.
Lower
95% CI.
Upper
Numerator
Denominator
Sites
Baseline 0.404 0.264 0.558 19 47 16 2009 0.596 0.528 0.663 127 213 16 2010 0.527 0.462 0.592 126 239 16 2011 0.504 0.441 0.567 129 256 16 2012 0.776 0.720 0.827 191 246 17 2013 0.837 0.789 0.879 236 282 18 2014 0.837 0.791 0.876 261 312 18 2015 0.898 0.865 0.926 361 402 23
From Baseline to 2015: There was a 122% increase in the percentage of eligible patients who
received IV rt-PA within three hours of time last known well The number of sites reporting on this measure increased by seven
Table 1. Data table used to calculate measure results for IV rt-PA. It includes the years, proportion of patients, 95% confidence intervals, numerators and denominators, as well as the number of sites reporting on this measure.

18 | P a g e
EARLY ANTITHROMBOTICS RESULTS FOR 2015
Year
Proportion of
Patients
95% CI.
Lower
95% CI.
Upper
Numerator
Denominator
Sites
Baseline 0.933 0.901 0.958 308 330 16 2009 0.948 0.941 0.956 3092 3261 16 2010 0.950 0.943 0.957 3656 3848 16 2011 0.960 0.954 0.966 3751 3907 17 2012 0.965 0.959 0.970 4329 4487 17 2013 0.977 0.973 0.982 4362 4465 18 2014 0.976 0.972 0.981 4682 4795 19 2015 0.958 0.952 0.964 4643 4847 23
From Baseline to 2015: There was a 3% increase in the percentage of eligible patients who
received antithrombotic therapy by end of hospital day two The number of sites reporting on this measure increased by seven
Table 2. Data table used to calculate measure results for Early Antithrombotics. It includes the years, proportion of patients, 95% confidence intervals, numerators and denominators, as well as the number of sites reporting on this measure.

19 | P a g e
VTE PROPHYLAXIS RESULTS FOR 2015
Year
Proportion of
Patients
95% CI.
Lower
95% CI.
Upper
Numerator
Denominator
Sites
Baseline 0.131 0.101 0.168 55 419 16 2009 0.094 0.085 0.105 317 3383 16 2010 0.469 0.453 0.485 1803 3848 16 2011 0.607 0.592 0.623 2347 3868 17 2012 0.912 0.904 0.920 4407 4832 17 2013 0.956 0.950 0.962 4845 5070 18 2014 0.964 0.959 0.969 5400 5601 19 2015 0.972 0.968 0.977 5556 5715 23
From Baseline to 2015: There was a 642% increase in the percentage of eligible patients who
received VTE prophylaxis by end of hospital day two The number of sites reporting on this measure increased by seven
Table 3. Data table used to calculate measure results for VTE Prophylaxis. It includes the years, proportion of patients, 95% confidence intervals, numerators and denominators, as well as the number of sites reporting on this measure.

20 | P a g e
ANTITHROMBOTICS AT DISCHARGE RESULTS FOR 2015
Year
Proportion of
Patients
95% CI.
Lower
95% CI.
Upper
Numerator
Denominator
Sites
Baseline 0.946 0.92 0.966 385 407 16 2009 0.985 0.981 0.989 3561 3616 16 2010 0.982 0.978 0.986 4204 4282 16 2011 0.985 0.981 0.989 4239 4304 17 2012 0.985 0.981 0.988 5034 5113 17 2013 0.990 0.987 0.993 5083 5134 18 2014 0.990 0.988 0.993 5478 5532 19 2015 0.992 0.990 0.995 5679 5723 22
From Baseline to 2015: There was a 5% increase in the percentage of eligible patients who were
prescribed antithrombotic therapy at discharge The number of sites reporting on this measure increased by six
Table 4. Data table used to calculate measure results for Antithrombotics at Discharge. It includes the years, proportion of patients, 95% confidence intervals, numerators and denominators, as well as the number of sites reporting on this measure.

21 | P a g e
ANTICOAGULATION THERAPY RESULTS FOR 2015
Year
Proportion of
Patients
95% CI.
Lower
95% CI.
Upper
Numerator
Denominator
Sites
Baseline 0.760 0.619 0.870 38 50 16 2009 0.920 0.895 0.942 519 564 16 2010 0.889 0.862 0.913 544 612 16 2011 0.923 0.900 0.943 587 636 17 2012 0.926 0.905 0.944 709 766 17 2013 0.937 0.918 0.953 757 808 18 2014 0.933 0.915 0.949 831 891 19 2015 0.953 0.938 0.965 966 1014 22
From Baseline to 2015: There was a 25% increase in the percentage of eligible patients who were
discharged on anticoagulation therapy The number of sites reporting on this measure increased by six
Table 5. Data table used to calculate measure results for Anticoagulation Therapy. It includes the years, proportion of patients, 95% confidence intervals, numerators and denominators, as well as the number of sites reporting on this measure.

22 | P a g e
SMOKING CESSATION RESULTS FOR 2015
Year
Proportion of
Patients
95% CI.
Lower
95% CI.
Upper
Numerator
Denominator
Sites
Baseline 0.768 0.671 0.849 73 95 16 2009 0.985 0.975 0.992 960 975 16 2010 0.995 0.989 0.999 1111 1117 13 2011 0.993 0.987 0.998 1177 1185 17 2012 0.990 0.985 0.995 1549 1564 17 2013 0.993 0.987 0.997 1384 1394 18 2014 0.996 0.993 0.999 1651 1657 19 2015 0.990 0.984 0.994 1633 1650 23
From Baseline to 2015: There was a 29% increase in the percentage of eligible patients who were
given smoking cessation advice/counseling The number of sites reporting on this measure increased by seven
Table 6. Data table used to calculate measure results for Smoking Cessation. It includes the years, proportion of patients, 95% confidence intervals, numerators and denominators, as well as the number of sites reporting on this measure.

23 | P a g e
LDL RESULTS FOR 2015
Year
Proportion of
Patients
95% CI.
Lower
95% CI.
Upper
Numerator
Denominator
Sites
Baseline 0.505 0.450 0.561 165 327 16 2009 0.846 0.826 0.865 1188 1405 16 2010 0.876 0.863 0.888 2381 2719 16 2011 0.910 0.900 0.920 3053 3356 17 2012 0.942 0.935 0.949 3709 3938 17 2013 0.929 0.921 0.937 3695 3978 18 2014 0.963 0.958 0.969 4083 4238 19 2015 0.973 0.968 0.978 4273 4391 22
From Baseline to 2015: There was a 93% increase in the percentage of eligible patients who were
discharged on statin medication The number of sites reporting on this measure increased by six
Table 7. Data table used to calculate measure results for elevated LDL with statin treatment. It includes the years, proportion of patients, 95% confidence intervals, numerators and denominators, as well as the number of sites reporting on this measure.

24 | P a g e
DYSPHAGIA RESULTS FOR 2015
Year
Proportion of
Patients
95% CI.
Lower
95% CI.
Upper
Numerator
Denominator
Sites
Baseline 0.385 0.339 0.434 163 423 16 2009 0.723 0.708 0.738 2456 3398 16 2010 0.783 0.770 0.796 3063 3914 16 2011 0.820 0.808 0.833 3146 3836 17 2012 0.876 0.867 0.886 4242 4841 17 2013 0.869 0.860 0.879 4520 5199 18 2014 0.898 0.891 0.907 5172 5757 19 2015 0.90 0.893 0.908 5477 6085 23
From Baseline to 2015: There was a 134% increase in the percentage of eligible patients who were
screened for dysphagia The number of sites reporting on this measure increased by seven
Table 8. Data table used to calculate measure results for Dysphagia. It includes the years, proportion of patients, 95% confidence intervals, numerators and denominators, as well as the number of sites reporting on this measure.

25 | P a g e
STROKE EDUCATION RESULTS FOR 2015
Year
Proportion of
Patients
95% CI.
Lower
95% CI.
Upper
Numerator
Denominator
Sites
Baseline 0.114 0.078 0.16 29 254 16 2009 0.650 0.632 0.669 1649 2536 16 2010 0.779 0.764 0.794 2355 3025 16 2011 0.878 0.867 0.890 2721 3098 17 2012 0.909 0.899 0.919 3200 3521 17 2013 0.907 0.898 0.917 3245 3576 18 2014 0.927 0.919 0.936 3437 3706 19 2015 0.939 0.932 0.947 3615 3848 23
From Baseline to 2015: There was a 724% increase in the percentage of eligible patients who given
education, or educational materials, during hospital stay The number of sites reporting on this measure increased by seven
Table 9. Data table used to calculate measure results for Stroke Education. It includes the years, proportion of patients, 95% confidence intervals, numerators and denominators, as well as the number of sites reporting on this measure.

26 | P a g e
REHABILITATION RESULTS FOR 2015
Year
Proportion of
Patients
95% CI.
Lower
95% CI.
Upper
Numerator
Denominator
Sites
Baseline 0.513 0.463 0.563 204 398 16 2009 0.935 0.927 0.944 3086 3300 16 2010 0.953 0.946 0.960 3606 3783 16 2011 0.967 0.961 0.973 3629 3754 17 2012 0.980 0.976 0.984 4787 4886 17 2013 0.986 0.983 0.989 5020 5093 18 2014 0.992 0.989 0.994 5589 5636 19 2015 0.991 0.989 0.994 5739 5792 23
From Baseline to 2015: There was a 93% increase in the percentage of eligible patients who
assessed for rehabilitation services The number of sites reporting on this measure increased by seven
Table 10. Data table used to calculate measure results for Rehabilitation. It includes the years, proportion of patients, 95% confidence intervals, numerators and denominators, as well as the number of sites reporting on this measure.
27 | P a g e
RECOMMENDATIONS The Kentucky Heart Disease and Stroke Prevention Task Force along with the Kentucky Department for Public Health developed the Kentucky Heart Disease and Stroke Prevention Strategic Map and Plan for 2017-2019. SEQIP members were active participants in the development and creation of the map and are committed to furthering the initiatives outlined in the plan for continued improvement in stroke systems of care in the Commonwealth. The following objectives and action items are outlined in the plan and recommended for ongoing development and growth of stroke systems of care in the Commonwealth: Identify and Improve Current Cerebrovascular Systems of Care
• To continue the collaboration with SEQIP and the American Heart Association/Stroke Association to identify and map certified stroke centers by certification levels as defined in KRS 216B.0425 (Comprehensive, Primary, and Acute Stroke Ready) and disseminate to KBEMS
• To continue the collaboration with SEQIP and the KHA’s Rural Hospital Flexibility Program • To educate and partner with Kentucky hospitals to increase appropriate utilization of
intravenous therapy (IV) tissue plasminogen activator (t-PA) • To disseminate KBEMS statewide inter-facility stroke transfer protocol during or after IV rt-PA
protocol • To identify EMS agencies which have a field transport protocol for stroke • To partner with KBEMS to determine specific data points available for capture • To explore pilot project for EMS feedback utilizing proposed data elements • To continue collaboration with KBEMS Cardiac and Stroke Care subcommittee • To enhance EMS interaction and support of dispatch centers • To partner with KBEMS for continued development of inter-facility transport protocols for all
stroke subtypes Continue Stroke Encounter Quality Improvement Project through FY 2019
• Recruit at least one hospital pursuing acute stroke ready certification by March 2017 • Utilize registry to develop and implement an action plan around quality metrics and education • Develop and disseminate Stroke Registry Data Summary in accordance with KRS 211. 575
Continue to Engage Hospitals to Become Stroke Certified
• Disseminate the Kentucky State Plan for Stroke Systems of Care and statewide map to target hospitals
• Monitor and provide support for development of effective stroke program development in target hospitals
• Update and disseminate KHA stroke resources

28 | P a g e
Develop Collaboration Among Healthcare Systems and Public Health in the State to Standardize Messaging
• Provide patient and family education regarding signs and symptoms of stroke • Provide patient and family education regarding the importance of calling 911 • Provide patient and family education regarding primary and secondary prevention of stroke
In conclusion, SEQIP is positioned to achieve these goals by maximizing our current resources; sustaining and creating new partnerships; and maintaining collaboration amongst stakeholders. SEQIP Steering Committee June 1, 2017

29 | P a g e
APPENDIX A 211.575 Statewide system for stroke response and treatment. (1) As used in this section, "department" means the Department for Public Health. (2) The Department for Public Health shall establish and implement a plan for achieving continuous quality improvement in the quality of care provided under a statewide system for stroke response and treatment. In implementing the plan, the department shall:
(a) Maintain a statewide stroke database to compile information and statistics on stroke care as follows:
1. The database shall align with the stroke consensus metrics developed and approved by the American Heart Association, the American Stroke Association, the Centers for Disease Control and Prevention, and the Joint Commission; 2. The department shall utilize the "Get With The Guidelines-Stroke" quality improvement program maintained by the American Heart Association and the American Stroke Association or another nationally recognized program that utilizes a data set platform with patient confidentiality standards no less secure than the statewide stroke database established in this paragraph; and 3. Require primary stroke centers as established in KRS 216B.0425 to report to the database each case of stroke seen at the facility. The data shall be reported in a format consistent with nationally recognized guidelines on the treatment of individuals within the state with confirmed cases of stroke;
(b) To the extent possible, coordinate with national voluntary health organizations involved in stroke quality improvement to avoid duplication and redundancy; (c) Encourage the sharing of information and data among health care providers on methods to improve the quality of care of stroke patients in the state; (d) Facilitate communication about data trends and treatment developments among health care professionals involved in the care of individuals with stroke; (e) Require the application of evidence-based treatment guidelines for the transition of stroke patients upon discharge from a hospital following acute treatment to community-based care provided in a hospital outpatient, physician office, or ambulatory clinic setting; and (f) Establish a data oversight process and a plan for achieving continuous quality improvement in the quality of care provided under the statewide system for stroke response and treatment, which shall include:
1. Analysis of the data included in the stroke database; 2. Identification of potential interventions to improve stroke care in specific geographic regions of the state; and 3. Recommendations to the department and the Kentucky General Assembly for improvement in the delivery of stroke care in the state.
(3) All data reported under subsection (2)(a) of this section shall be made available to the department and all government agencies or contractors of government agencies which are responsible for the management and administration of emergency medical services throughout the state. (4) On June 1, 2013, and annually on June 1 thereafter, the department shall provide a report of its data and any related findings and recommendations to the Governor and to the Legislative Research Commission. The report also shall be made available on the department's Web site. (5) Nothing in this section shall be construed to require the disclosure of confidential information or data in violation of the federal Health Insurance Portability and Accountability Act of 1996. Effective: July 12, 2012 History: Created 2012 Ky. Acts ch. 106, sec. 1, effective July 12, 2012.
30 | P a g e
APPENDIX B 216B.0425 Certification designations for stroke care for acute care hospitals. (1) Except as otherwise provided, for purposes of this section:
(a) "Acute care hospital" means a licensed facility providing inpatient and outpatient medical or surgical services to an individual that seeks care and treatment, regardless of the individual's ability to pay for services, on an immediate and emergent basis through an established emergency department and a continuous treatment basis on its premises for more than twenty-four (24) hours; and (b) "Primary stroke center certification," "acute stroke ready hospital certification," and "comprehensive stroke center certification" mean certification for acute care hospitals issued by the Joint Commission, the American Heart Association, or another cabinet-approved nationally recognized organization that provides disease-specific certification for stroke care, that:
1. Complies with census-based national standards and safety goals; 2. Effectively uses evidence-based clinical practice guidelines to manage and optimize care; and 3. Uses an organized approach to measure performance.
(2) The secretary of the Cabinet for Health and Family Services shall designate as a primary stroke center any acute care hospital which has received an acute stroke ready hospital certification, a comprehensive stroke center certification, or a primary stroke center certification. (3) The secretary shall suspend or revoke an acute care hospital's designation as an acute stroke ready hospital, a comprehensive stroke center, or a primary stroke center if certification is withdrawn by the Joint Commission, the American Heart Association, or another cabinet-approved certifying organization. (4) (a) The cabinet shall maintain a list of certified acute stroke ready hospitals, comprehensive
stroke centers, and primary stroke centers and post the list on its Web site. The cabinet shall provide the list and periodic updates to the Kentucky Board of Emergency Medical Services. (b) The Kentucky Board of Emergency Medical Services shall share the list with each local emergency medical services provider at least annually, and as new centers and hospitals are designated and certified.
Effective: June 24, 2015 History: Amended 2015 Ky. Acts ch. 9, sec. 1, effective June 24, 2015. -- Created 2010 Ky. Acts ch. 67, sec. 1, effective July 15, 2010.

31 | P a g e
APPENDIX C 311A.180 Medical control documents -- Review -- Approval -- Appeal – Schedule for submission and review. (1) Each emergency medical services medical director for an ambulance service, or other
emergency medical services provider, shall submit: (a) His or her protocols, including the pre-hospital care protocols related to the
assessment, treatment, and transport of stroke patients; (b) His or her standing orders; and (c) Similar medical control documents to the board for approval prior to placing the
document in use. (2) The medical advisor for the board shall review each document submitted to ascertain if it is
in accordance with accepted standards of medical care and in accordance with the provisions of this chapter and administrative regulations promulgated thereunder. If the protocol, standing order, or other medical control document clearly violates the accepted standards of medical care, this chapter, or an administrative regulation, the medical advisor shall notify the emergency medical services medical director of the exact violation and recommend a correction thereof.
(3) Following review of protocol, standing order, and medical control documents and giving the emergency medical services medical director who submitted the documents an opportunity to review the medical advisor's comments, the medical advisor shall submit the documents together with his or her comments to the board for approval or disapproval.
(4) The board shall approve, disapprove, or approve with modifications protocol, standing order, and medical control documents submitted by the emergency medical services medical director at its next regular or special meeting following the submission of the documents.
(5) If a protocol, standing order, or other medical control document is disapproved by the board, the emergency medical services medical director who submitted it may appeal the decision to the Franklin Circuit Court. If the decision of the board is appealed to the Franklin Circuit Court, the board shall bear the burden of proving that the protocol, standing order, or other medical control document violates the accepted standards of medical care, or an administrative regulation.
(6) The board shall, by administrative regulation, specify a schedule for submission and prompt review and decision making with regard to protocols, standing orders, and medical control documents submitted to the board.
Effective: June 24, 2015 History: Amended 2015 Ky. Acts ch. 9, sec. 2, effective June 24, 2015. -- Created 2002
Ky. Acts ch. 211, sec. 33, effective July 15, 2002.

32 | P a g e
APPENDIX D Listings of SEQIP Hospitals
Hospitals whose data are included in this report Baptist Health Louisville Baptist Health LaGrange Baptist Health Lexington Baptist Health Paducah Hardin Memorial Health Jackson Purchase Medical Center Jewish Hospital King’s Daughter’s Medical Center Lake Cumberland Regional Hospital Norton Audubon Hospital Norton Brownsboro Hospital Norton Hospital Norton Women’s and Children’s Hospital Owensboro Health Regional Hospital Pikeville Medical Center Saint Joseph Hospital St Elizabeth Edgewood St Elizabeth Florence St Elizabeth Ft Thomas Sts. Mary and Elizabeth Hospital The Medical Center at Bowling Green University of Kentucky Hospital University of Louisville Hospital
All SEQIP hospitals Baptist Health Floyd Baptist Health Louisville Baptist Health LaGrange Baptist Health Lexington Baptist Health Paducah Cardinal Hill Rehab Hospital Ephraim McDowell Regional Medical Center Fleming County Hospital Georgetown Community Hospital Greenview Regional Hospital Hardin Memorial Health Harlan ARH Highlands Regional Medical Center Jackson Purchase Medical Center Jewish Hospital King’s Daughter’s Medical Center Lake Cumberland Regional Hospital Morgan County ARH Norton Audubon Hospital Norton Brownsboro Hospital Norton Hospital Norton Women’s and Children’s Hospital Our Lady Of Bellefonte Hospital Owensboro Health Regional Hospital Pikeville Medical Center Saint Joseph Hospital St Elizabeth Edgewood St Elizabeth Florence St Elizabeth Ft Thomas Sts. Mary and Elizabeth Hospital The Medical Center at Bowling Green Three Rivers Medical Center University of Kentucky Hospital University of Louisville Hospital