Embed Size (px)
Citation preview

AUSTRALIAN TECHNICAL ANALYSTS ASSOCIATION
JOURNALSeptember/October 20024 John A. Bollinger CFA, CMT -
Market Master
6 Introduction to Indicators - Part 1
11 Trends and Calendar Effectsin Stock Returns
19 Confusing Volume with Liquidity
21 Time Tested Classic Trading Rulesfor the Modern Trader to Live By
23 Interview withDr Bernard Chapman
See inside for more…

2 DISCLAIMER: Your attention is directedto the disclaimer on page 2 of the Journal
The Australian Technical Analysts Association Journalwww.ataa.com.au • September/October 2002
Contributions to the JournalThe Australian Technical Analysts Association Journalis published by the Australian Technical AnalystsAssociation (ATAA) ABN 53 071 513 203. It is a vehicle forthe interchange of ideas and information about technicalanalysis of markets. This forum is available at the discretionof the editor for the views of members, guest speakers andguest writers. Contributions to the ATAA journal areencouraged and will repay your efforts by expanding andsharpening your analytical ability. The emphasis of thejournal is on original articles, although consideration maybe given to material of interest previously published inother publications. Journals are published each January/February, March/April, May/June, July/August,September/October and November/December. Thedeadline for copy is the last day of the previous month:i.e. December, February, April, June, August and October.
The Australian Technical Analysts Association (ATAA)is a member of the International Federation of TechnicalAnalysts and exchanges newsletters and journals with othermember organisations. Under a reciprocal agreementATAA has given a general permission to these memberorganisations to reproduce any article which appears in ournewsletter and journals. Articles may be reproduced in full,summarised or translated into another language. It is acondition of the agreement that the article be attributed tothe source and author. ATAA acknowledges that copyright(if any) in material submitted for publication may belong tothe author. By submitting material for publication with thisknowledge of the foregoing you are waiving your claim tocopyright to the extent necessary to permit reproduction asdisclosed. Material accepted for publication is onlyaccepted on this basis. If you do not agree to waive yourclaim to copyright to the extent required or if for legalreasons you are unable to do so please bring this to ourattention when you submit your material.
DisclaimerThis publication is issued on the understanding that (1) theATAA is not responsible for the results of any action takenon the basis of information in this publication, nor for anyerrors or omissions, and (2) the ATAA and the editorexpressly disclaim all and any liability to any personin respect of anything done or omitted to be done by anyperson in reliance, whether whole or partial, upon thewhole or any part of the contents of this publication; and(3) if legal advice or expert assistance is required, theservices of the competent professional person shouldbe sought; and (4) the views expressed in this publicationare those of the contributor and not necessarily those of theATAA. Any sponsorship of this journal does not implyany endorsement of the sponsors product or servicesby this Association.
GPO Box 2774, Sydney NSW 2001
If you would like to discuss your contribution, please emailin the first instance [email protected]. Our mediapreference is for submitted articles to be emailed or sent bypost on IBM floppy disc or CD-ROM. Text and graphicsshould be supplied as seperate files; Text as ASCII.txt files,Rich Text format (RTF) or plain (without embeddedgraphics), MS Word.doc files; Graphics as either .bmp or.jpeg files seperate from the Text file. Reference any graphsin the text as “*** Insert figure 1 here***”. By all meanssend a .pdf file as well to indicate your preferredformatting.
Your Board of DirectorsPresident Ken Henderson 0403 817 188
Vice President Tony Reeves 02 9299 6780Vice President Larry Lovrencic 02 9299 6785
Secretary Paul Hatfield 02 9667 0983Treasurer Greg Tolpigin 0413 861 858Director Susanne Fraser 02 9651 4703
Director and Colin Nicholson 02 9436 1610IFTA Liaison
Assisting the BoardCD-ROM Phil Alt 02 9874 3266
Financial Manager Ken Connolly 02 9953 7092Journal Editor Colin Nicholson 02 9436 1610
Newsletter Editor Ken Henderson 0403 817 188Webmaster Susanne Fraser 02 9651 4703
Sydney Meeting Logistics Paul Hatfield 02 9667 0983Conference Chairman Larry Lovrencic 02 9299 6785
Education & Data Colin Nicholson 02 9436 1610Print Manager John Stanley 02 9337 5673
Secretary Assistant Anna Vozzo 02 9667 0983Video Librarian Greg Manning
State CouncilsACT
President Llois Cutts 02 6295 6851Past President Garnett Znidaric 02 6254 5023
Council Clyde Morton 02 6215 2082Lee Taylor 02 6252 6377Andrew Warnes 02 6281 4124Robert Gardner 02 6263 4460
NSWNewcastle Sub-Committee
Chairman Paul Polychroniadis 02 4962 3835Committee Stuart Wrightson 02 4959 3368
Tom Williams 02 4963 1086Queensland
President Jason Sidney 0409 051 047Vice President Shane Langham 07 5538 6922Past President Clive Roydhouse 07 3711 9112
Council Pam Stokes 07 3348 6561Steven Dotto 07 3406 6730
Toowoomba Sub-CommitteeCommittee Hugh Robinson 07 4638 5348
Jeff Rollinson 0407 110 930Quentin Lewis 07 4696 5203John Williams 07 4635 0743
South AustraliaPresident Charles Browne 08 8353 6669Council Peter Balawejder 08 8234 5039
Peter Kentish 08 8337 2416Neil Videon 08 8344 7733
VictoriaPresident Paul Ash 03 9629 4233Council David Finn 03 9877 5192
Mary Kane 03 9328 8238Sonia Lonsdale 03 9390 1932Michael McCullough 03 9580 9935Arthur Ranken 03 9787 5605
Western AustraliaPresident Jeff Clark 08 9330 3541
Vice President Glen van Ooran 08 9486 4888Council Dianne Godson 08 9204 2041
Lesley Hewett 0407 776 099Neil Husband 08 9402 4347Benzie Pikoos 08 9375 1178

3DISCLAIMER: Your attention is directedto the disclaimer on page 2 of the Journal
The Australian Technical Analysts Association Journalwww.ataa.com.au • September/October 2002
4 John A. Bollinger CFA, CMT - Market Master Neil Costa
6 Introduction to Indicators - Part 1 Colin Nicholson
11 Trends and Calendar Effects in Stock Returns Thomas Hellström
19 Confusing Volume with Liquidity Glen Van Ooran
21 Time Tested Classic Trading Rules for the Modern Traderto Live By Linda Bradford Raschke
23 Interview with Dr Bernard Chapman Bill Fitzgerald & Colin Nicholson
In this Issue
Welcome to New MembersACTPhilip Brown
NSWBudi CahyadiRegine DukeCorey GibsonDrew KeenanMatthew LeesonRobert LondaleRobert MacIverDamian MillerEva NagyEdward OversJoyce PetrieTerry SkinnerColin Slupik
QLDMichael AjaoKenneth AylettPeter BensonDavid ChampionVanessa ChampionDon ClarkeJohn FarrellKym IrvingPaul KerrHamish MoodyJonathan MoorePeter NoordinkTim SaddingtonStephen SwanFrank Tomasich
On behalf of the ATAA Board, the Editor apologises for any names which have inadvertently been omitted.Please let the Editor know of any omissions
VICLes BrainBenjamin CarmichaelPaul ChowPeter KingTerry LawleyJohn NankervisEric Josef RudzynEdmund Wong
WARoss GardinerAnne Tollefsen
INDONESIARob Erskine-Smith
SINGAPOREChin Wei Lam
Apologies for Late Journals
The board apologises for the lateness of this Journal. All efforts are being made to get theNovember/December Journal to you in January and the January/February Journal to youin February, after which Journals should be published on time.

4 DISCLAIMER: Your attention is directedto the disclaimer on page 2 of the Journal
The Australian Technical Analysts Association Journalwww.ataa.com.au • September/October 2002
John Bollinger is a modern-day marketmaster. Unlike many traders who startedtheir working life studying economicsor engineering, John graduated with a degreein visual arts, majoring in cinematography.He later moved into the field of marketanalysis and was one of the pioneers oftechnical analysis using a computer, afterbuying his first microcomputer in 1977.
John Bollinger is today one of the world’s mostrespected technicians. He is President of BollingerCapital Management and is a Chartered FinancialAnalyst and a Chartered Market Technician.
The Birth of Bollinger BandsContrary to what many people believe, the BollingerBands technical indicator was not named after thechampagne drunk by an ecstatic trader while closingout a big winning trade. In fact, it was named after itsdeveloper, John Bollinger.
The Bollinger Bands indicator was created in the early1980s. It was created in an attempt to overcome theproblems associated with trading envelopes whichwere very popular at that time; particularly theproblems associated with determining the mostappropriate bandwidth to use with these fixed-widthbands.
Bollinger noted that the most appropriate bandwidthfor a particular market would change with time.He therefore explored ways in which the bandwidthcould be determined automatically.
John Bollinger combined the measurementof volatility (standard deviation) with a movingaverage. The result was a set of two variable-widthtrading bands that would automatically adapt to thevolatility of the market.
What Are Bollinger Bands?There are literally hundreds of technical indicatorsthat are used by technical traders to help themto analyse and trade markets. Many are of little use,many give similar indications to other indicators, anda few are of great value. Bollinger Bands is one such‘great value’ indicator.
Whereas trading envelopes surround the marketaction with two bands which are drawn a fixedpercentage above and below a moving average of themarket’s closing price, Bollinger Bands expand andcontract as the market volatility increases anddecreases.
For intermediate-term trends, Bollinger Bands consistof a series of three bands:
• The middle band is a 20-day simple movingaverage of a market’s closing price.
• The upper band is drawn by adding two standarddeviations to the middle band.
• The lower band is drawn by taking two standarddeviations away from the middle band.
For short-term trends, a 10-day moving average anda standard deviation of 1.5 is more appropriate.For long-term trends, a 50-day moving average and2.5 standard deviations are usually used.
The Market Analyst chart on page 5 shows BollingerBands on BHP Billiton Limited. We interpret themarket’s action relative to the bands as follows:
• When the market action moves above the topband or below the bottom band, it suggests thatthe present trend shall continue.
• If a market moves from one band towards themoving average, it is likely to continue to the otherband.
• Powerful moves often commence after the market’svolatility has become very low and the bands havetightened around the market action (as happenedin early February).
John A. Bollinger CFA, CMT - Market MasterBy Neil A Costa

5DISCLAIMER: Your attention is directedto the disclaimer on page 2 of the Journal
The Australian Technical Analysts Association Journalwww.ataa.com.au • September/October 2002
What Do the Bands Tell Us?Bollinger Bands allow us to see, at a glance, if pricesare high or low in relative terms. Because the bandstrack market volatility, prices are relatively high whenprices are at the upper band and relatively low whenthey are at the lower band.
John Bollinger has also derived two indicators fromBollinger Bands:
The first one is %b, and tells us where we are within theband - at 1.00, we are at the upper band, and at zero,we are at the lower band. At 0.5, we’re dead in the middle.The second indicator is bandwidth. It is the upper band,minus the lower band, divided by the middle band.
(Gapalakrishnan, J., John Bollinger of Bollinger BandsFame, ‘Technical Analysis of Stocks and CommoditiesMagazine’, May 2002, p. 58.)
Trading With Bollinger BandsBollinger Bands give us valuable information aboutwhether or not prices are relatively low, or high.They can, however, be used in conjunction with priceaction and reaction, and other technical indicators,to give traders high probability trading signals.The powerful signals that usually follow Bollingerband squeezes make Bollinger Bands an importanttool for all traders, but option traders in particular.
BHP Billiton Limited - 1 Day - Candlestick Chart
ConclusionJohn Bollinger is a modern-day market master.His ongoing contribution to technical analysis hasassisted many traders to gain a more realistic viewof the market they are trading. In particular,his Bollinger Bands indicator has been a technical toolthat continues to be of immense value to manytraders.
Neil Costa has been a trader for more than30 years. He has trained, or overseen thetraining of more than 10,000 traders. Neilis Managing Director of Market Masters PtyLtd. He can be contacted [email protected] orwww.marketmasters.com.au.

6 DISCLAIMER: Your attention is directedto the disclaimer on page 2 of the Journal
The Australian Technical Analysts Association Journalwww.ataa.com.au • September/October 2002
The Difference Between UsingIndicators and PriceWhen we look at classical charting, we areconcerned directly with the analysis of priceand, to a lesser extent, volume and openinterest. When we move into the areaof indicators, we cease to look at pricedirectly, but look at using mathematicalconstructs which are derivatives of price.This difference leads some technical analystsinto error.
The error is to regard indicators as a superior toolcompared to direct analysis of price. In other words,that classical charting is somehow onlyan introduction to the more advanced tools calledindicators. Such an extreme view is unwise. In mostways, indicators only serve to clarify what shouldbe already obvious on the price chart. Where ananalyst takes this view to the extreme that theindicator is relied upon in the face of conflictinginformation in the raw price chart, it is plain stupid.
The intelligent analyst uses indicators as a secondarytool to add value to the basic chart analysis. Wherethis is most important is that any signal given by theindicator should not be acted upon unless thereis a confirming signal on the price chart. In otherwords, the price chart has priority over the indicatoruntil such time as the price confirms the indicator.
In saying this, it should be recognised that someindicators give late signals, coming after the pricesignal, while other indicators give leading signals,coming before the price signal. It is these leadingindicators where care must be taken not to anticipateprice action.
Types of IndicatorsA great number of mathematically based indicatorshave been developed in the last few decades. Somehave broken new ground, while many are simplyvariations on a theme. It is impossible to considerthem all in this series of articles. It is also unnecessary,since many of the variations do essentially the same
thing. What we will endeavour to do is to look at thetwo basic types of indicators and some of the moreuseful of the indicators in each category.
Classical charting, using line and bar charts, are oftencriticised as being subjective. This elementof subjectivity is seen as an evil. However, as we havealready seen, subjectivity has both negative andpositive aspects.
The availability of personal computers has allowed theevolution of a series of mathematical and statisticalindicators. The objectives in developing theseindicators are:
• To make a precise definition of some conceptsin mathematical terms.
• To formulate unambiguous rules for trading withthese indicators.
• To define new ways of analysing price action -especially for short-term trading.
In large part, indicator analysis is a wayof approaching the problem of the interaction of thepsychology of the analyst with the processesof analysis. There is always a very real risk thatanalysts will find what they are looking for when theyexamine a chart or an indicator. However, becauseindicators are created to give signals based on thecrossing of two lines or when a line turns up or down,the signals can be identified without the applicationof judgement and some of this problem is removed.
However, it does not solve it completely. Thereremains an arbitrary element in the mathematicalapproach, because choices still have to be made aboutparameters such as the number of time periods overwhich to calculate an indicator and the levels foroverbought and oversold etc. Analysts tryto overcome this by optimising these levels throughback-testing numerous alternatives using past data.However, this is at best a partial solution, becauseover-optimising parameters means the indicatoris fitted to the past data, a disadvantage becausemarkets are constantly changing.
Introduction to Indicators - Part 1By Colin Nicholson
7DISCLAIMER: Your attention is directedto the disclaimer on page 2 of the Journal
The Australian Technical Analysts Association Journalwww.ataa.com.au • September/October 2002
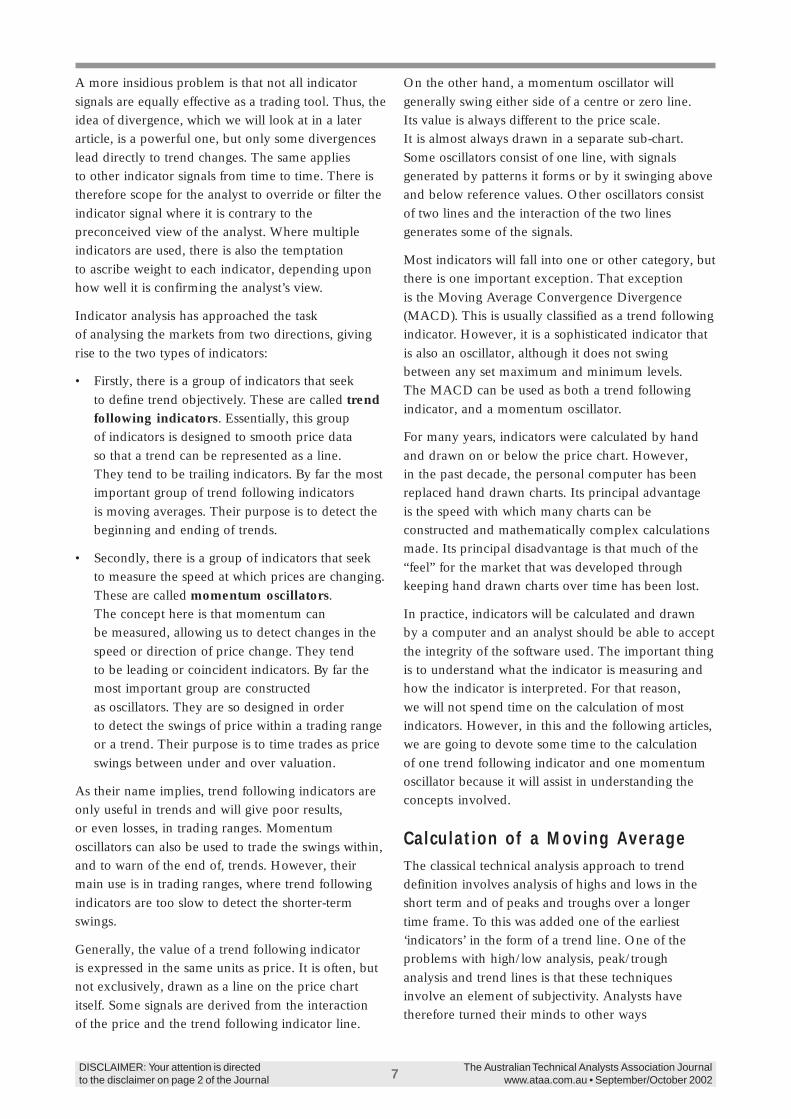
A more insidious problem is that not all indicatorsignals are equally effective as a trading tool. Thus, theidea of divergence, which we will look at in a laterarticle, is a powerful one, but only some divergenceslead directly to trend changes. The same appliesto other indicator signals from time to time. There istherefore scope for the analyst to override or filter theindicator signal where it is contrary to thepreconceived view of the analyst. Where multipleindicators are used, there is also the temptationto ascribe weight to each indicator, depending uponhow well it is confirming the analyst’s view.
Indicator analysis has approached the taskof analysing the markets from two directions, givingrise to the two types of indicators:
• Firstly, there is a group of indicators that seekto define trend objectively. These are called trendfollowing indicators. Essentially, this groupof indicators is designed to smooth price dataso that a trend can be represented as a line.They tend to be trailing indicators. By far the mostimportant group of trend following indicatorsis moving averages. Their purpose is to detect thebeginning and ending of trends.
• Secondly, there is a group of indicators that seekto measure the speed at which prices are changing.These are called momentum oscillators.The concept here is that momentum canbe measured, allowing us to detect changes in thespeed or direction of price change. They tendto be leading or coincident indicators. By far themost important group are constructedas oscillators. They are so designed in orderto detect the swings of price within a trading rangeor a trend. Their purpose is to time trades as priceswings between under and over valuation.
As their name implies, trend following indicators areonly useful in trends and will give poor results,or even losses, in trading ranges. Momentumoscillators can also be used to trade the swings within,and to warn of the end of, trends. However, theirmain use is in trading ranges, where trend followingindicators are too slow to detect the shorter-termswings.
Generally, the value of a trend following indicatoris expressed in the same units as price. It is often, butnot exclusively, drawn as a line on the price chartitself. Some signals are derived from the interactionof the price and the trend following indicator line.
On the other hand, a momentum oscillator willgenerally swing either side of a centre or zero line.Its value is always different to the price scale.It is almost always drawn in a separate sub-chart.Some oscillators consist of one line, with signalsgenerated by patterns it forms or by it swinging aboveand below reference values. Other oscillators consistof two lines and the interaction of the two linesgenerates some of the signals.
Most indicators will fall into one or other category, butthere is one important exception. That exceptionis the Moving Average Convergence Divergence(MACD). This is usually classified as a trend followingindicator. However, it is a sophisticated indicator thatis also an oscillator, although it does not swingbetween any set maximum and minimum levels.The MACD can be used as both a trend followingindicator, and a momentum oscillator.
For many years, indicators were calculated by handand drawn on or below the price chart. However,in the past decade, the personal computer has beenreplaced hand drawn charts. Its principal advantageis the speed with which many charts can beconstructed and mathematically complex calculationsmade. Its principal disadvantage is that much of the“feel” for the market that was developed throughkeeping hand drawn charts over time has been lost.
In practice, indicators will be calculated and drawnby a computer and an analyst should be able to acceptthe integrity of the software used. The important thingis to understand what the indicator is measuring andhow the indicator is interpreted. For that reason,we will not spend time on the calculation of mostindicators. However, in this and the following articles,we are going to devote some time to the calculationof one trend following indicator and one momentumoscillator because it will assist in understanding theconcepts involved.
Calculation of a Moving AverageThe classical technical analysis approach to trenddefinition involves analysis of highs and lows in theshort term and of peaks and troughs over a longertime frame. To this was added one of the earliest‘indicators’ in the form of a trend line. One of theproblems with high/low analysis, peak/troughanalysis and trend lines is that these techniquesinvolve an element of subjectivity. Analysts havetherefore turned their minds to other ways

8 DISCLAIMER: Your attention is directedto the disclaimer on page 2 of the Journal
The Australian Technical Analysts Association Journalwww.ataa.com.au • September/October 2002
of determining trend mathematically. The mostimportant of these approaches is the moving averagein its many forms. We will use a simple movingaverage to demonstrate the idea of a trend followingindicator.
The concept behind a moving average is thesmoothing of the closing price to form a line thatrepresents the trend of prices. Instead of charting theprice directly, the average closing price for a numberof periods is charted. The moving average may becalculated as a simple moving average, an exponentialmoving average, or as a weighted moving average.In this article, we will confine our discussion of itscalculation to simple moving averages.
In calculating the moving average the closing priceis usually used. However, there are numerousvariations such as using the average of the range (high+ low ÷ 2) or charting a moving average of both thehigh and the low separately, to give a moving averageband or envelope. For this article we will confineourselves to moving averages of the closing price.
To construct a five period moving average, we firstneed price data for a minimum of five periods. Whenwe have the data for the fifth period, we can calculatethe first plot. This is a simple average as follows:
Period Closing Total Last Average LastPrice Five Periods Five Periods
1 100 N/A N/A
2 102 N/A N/A
3 106 N/A N/A
4 104 N/A N/A
5 102 514 102.8
To calculate the moving average for the sixth period,we can either add the closing prices for periods 2 to 6or we can subtract the closing price for period onefrom our five period total and add to it the closingprice for the sixth period. This is then divided by five:
Period Closing Total Last Average LastPrice Five Periods Five Periods
6 108 522 104.4
OR
6 108 (514 - 100 + 108) 104.4
This average for the last five periods is our movingaverage. For subsequent periods, we continue in thesame way to either add the closing prices for the lastfive periods and divide by five or, take the total for thelast five periods, subtract the oldest closing price in it,add the latest closing price and divide by 5.The calculations for the ensuing periods in ourexample would be as follows:
Period Closing Total Last 5 PeriodPrice 5 Periods Moving Average
1 100 N/A N/A
2 102 N/A N/A
3 106 N/A N/A
4 104 N/A N/A
5 102 514 102.8
6 108 522 104.4
7 110 530 106
8 113 537 107.4
9 119 552 110.4
10 114 564 112.8
11 112 568 113.6
12 111 569 113.8
13 116 572 114.4
14 118 571 114.2
15 122 579 115.8
The usual way to draw a moving average is to plotit on a bar chart as a line, as shown in Figure 1.
However, to see how the moving averageis ‘smoothing’ the closing price, look at the samemoving average line against a line chart of the closingprice, as shown in Figure 2.

9DISCLAIMER: Your attention is directedto the disclaimer on page 2 of the Journal
The Australian Technical Analysts Association Journalwww.ataa.com.au • September/October 2002
Figure 1: Five Period Simple Moving Average Drawn on a Bar Chart
Figure 2: Five Period Simple Moving Average Drawn on a Line Chart of the Closing Price
22 29JUN
6 13 20 27JUL
3 10 17 24 31AUG
7 14 21 28SEP
5 12OCT 98
210
220
230
240
250
260
270
280
290
300
310MOV AVS 5(0)
D @ D 220698-161098 TAB - TAB LTD
22 29JUN
6 13 20 27JUL
3 10 17 24 31AUG
7 14 21 28SEP
5 12OCT 98
220
230
240
250
260
270
280
290
300
310MOV AVS 5(0)
D @ D 220698-161098 TAB - TAB LTD
Line chart of the closing price
Five period simple moving average

10 DISCLAIMER: Your attention is directedto the disclaimer on page 2 of the Journal
The Australian Technical Analysts Association Journalwww.ataa.com.au • September/October 2002
Notice how the closing price line jumps around andhow the moving average line traces out a smoothercurve, flattening out most of the short-termfluctuations in the price.
The number of periods used in a moving average canbe varied to suit the purpose of the analysis. Figure 3shows the same chart with a 10 period simple movingaverage:
Notice how the longer the period used to construct themoving average, the smoother the line, but the moreit lags actual price movement.
Colin Nicholson BEc FSIA is an honorary lifemember of the ATAA, principal lecturerin technical analysis at the SIA, writer andcolumnist for Shares magazine and the SharesWeekly online newsletter, teacher of technicalanalysis, trading and investment and a privateshare trader and investor.
Web site: www.bwts.com.auEmail: [email protected]
Copyright Colin Nicholson.Do not reproduce without permission.
Figure 3: Ten Period Simple Moving Average Drawn on a Bar Chart
22 29
JUN
6 13 20 27
JUL
3 10 17 24 31
AUG
7 14 21 28
SEP
5 12
OCT 98
210
220
230
240
250
260
270
280
290
300
310MOV AVS 10(0)
D @ D 220698-161098 TAB - TAB LTD
Price turns down here
Moving average turns down here

11DISCLAIMER: Your attention is directedto the disclaimer on page 2 of the Journal
The Australian Technical Analysts Association Journalwww.ataa.com.au • September/October 2002
AbstractThis paper presents statistical investigationsregarding the value of the trend concept andcalendar effects for prediction of stockreturns. The examined data covers 207 stockson the Swedish stock market for the timeperiod 1987-1996. The results show a veryweak trend behaviour. The massive betterpart of returns falls into a region, whereit is very difficult to claim any correlationbetween past and future price trends.It is also shown that seasonal variables, suchas the month of the year, affect the stockreturns more than the average daily returns.This is consequential for all methods, wherethe seasonal variables are not taken intoaccount in predicting daily stock returns.
1. IntroductionThis paper presents results from a statistical analysisof stocks of 207 major stocks from the Swedish stockmarket for the period 1987-1996. The purpose of theanalysis is to examine the concepts of trend andcalendar effects, since they are often claimed to existand are often used in technical analysis.
2. DefinitionsIn the presentation of statistics we will use a few termsthat will be defined in this section. The k-step returnRk(t) is defined as the relative increase in price for theprevious k days:
Rk(t) = 100 ·y(t) - y(t - k)
y(t - k)(1)
The basic statistical properties of Rk(t) for 207 stocksfrom the Swedish stock market for the period1987-1996 are listed in Table 1.
The values in the table are mean values for all stocks.Each column shows data for one particular value of k.The last six lines in the tables show the distributionof signs for the returns. “Return = 0” is the fractionof returns equal to zero. “Return > 0” is the fractionof returns greater than zero and “Return < 0” is thefraction of returns less than zero. “Up fraction”is defined as:
100 ·“Return > 0”
“Return > 0” + “Return < 0”(2)
which is the positive fraction of all non-zero moves.“Up fraction” is a relevant measure, when it comesto evaluating the hit rate of prediction algorithms.Looking at one-step returns in the tables, the“Up fraction” for the for the 207 stocks is 50.6%.The “Mean Up” and “Mean Down” columns show themean value of the positive and negative returnsrespectively. The fractions of zero returns in the datamaterial are somewhat surprisingly high 23.4%.The zero returns must be dealt with in a proper waywhen evaluating hit rates for prediction algorithms.The “Up fraction” circumvents the zero returns bysimply removing them before calculating the hit rate.In this way, the zero returns are counted as bothincreases and decreases, in equal proportions.We suggest the following definition for the k-trendTk(t):
Tk(t) = 100 y(t) - y(t - k)
k y(t - k) (3)It is convenient to divide by k in order to get the dailyincrease in price. Trend values for different valuesof k can then be analyzed on an equal basis. To seeif Tk(t) is connected to future changes, define the profitPh(t) computed h days ahead as:
Ph(t) = 100 ·y(t + h) - y(t)
y(t)(4)
Ph(t) is obviously equal to Rh(t+h) (i.e. it is achievedby shifting the returns h days backwards). Ph(t) canbe interpreted as the profit gained, if buying a stockat day t and selling it at day t+h.
Trends and Calendar Effects in StockReturnsBy Thomas Hellström
.
,
..
.

12 DISCLAIMER: Your attention is directedto the disclaimer on page 2 of the Journal
The Australian Technical Analysts Association Journalwww.ataa.com.au • September/October 2002
Table 1: Mean k-step returns for 207 Swedish stocksk
1 2 5 10 20 50 100
Mean 0.143 0.274 0.585 1.058 2.007 4.584 8.651
Median 0.000 0.007 0.060 0.248 0.946 2.895 5.148
Std. dev 3.02 4.15 6.15 8.42 11.80 18.82 27.80
Skewness 0.79 1.06 1.02 0.93 0.83 0.78 0.82
Kurtosis 15.78 16.49 11.55 9.27 7.58 5.99 5.59
No of points 1367 1363 1356 1347 1333 1306 1259
Returns=0 (%) 23.4 17.0 10.8 7.5 4.9 2.7 1.9
Returns>0 (%) 38.7 42.0 45.6 48.5 52.1 56.1 57.6
Returns<0 (%) 37.9 41.1 43.6 44.1 43.0 41.2 40.5
Up fraction (%) 50.6 50.6 51.1 52.3 54.7 57.6 58.7
Mean Up 2.7 3.5 5.2 7.1 10.1 16.8 26.5
Mean Down -2.3 -2.9 -4.0 -5.3 -7.3 -11.3 -15.5
3. Following the TrendA trend-following trading strategy means buyingstocks that have shown a positive trend for the lastdays, weeks or months. It also suggests selling stocksthat have shown a negative trend. In this section therelevance for such a strategy is tested statistically.
In Table 2, the mean profit P1(t) (Eq. 4) is tabulatedas a function of the trend Tk(t) (Eq. 3),i.e. 1-day-forward profit versus k-step-backwardtrends. Results are presented for the 207 stocks for theyears 1987-1996. Table 3 shows the “Up fraction”(Eq. 2). Table 4 shows the number of observationsin each table entry.
The label for each column is the mid-valueof a symmetrical interval. For example, the columnlabeled 0.00 includes data with the k-day trend in theinterval [-0.25 0.25[. The intervals for the outermostcolumns are open ended on one side.
To ensure that found patterns reflect fundamentalproperties of the process generating the data, and notonly idiosyncrasies in the data, the relations betweentrends and future returns are also presented in graphs,in which one curve represents one year. The leftdiagram in Figure 1 shows 1-step profits P1(t) versus1-step trends T1(t). The right diagram shows 5-stepprofit P5(t) versus 5-step trends T5(t).
Figure 1: Profits versus returns for 207 Swedish stocks. Each curve represents one yearbetween 1987 and 1996.

13DISCLAIMER: Your attention is directedto the disclaimer on page 2 of the Journal
The Australian Technical Analysts Association Journalwww.ataa.com.au • September/October 2002
Table 2: Mean 1-day returnsk-day trend (%/day)
k -5.00 -4.00 -3.00 -2.00 -1.00 -0.50 0.00 0.50 1.00 2.00 3.00 4.00 5.00
1 1.42 0.40 0.30 0.09 -0.02 -0.07 0.02 0.09 0.11 0.14 0.15 0.16 0.06
2 2.35 0.75 0.44 0.22 0.06 -0.00 0.02 0.06 0.09 0.13 0.06 0.10 0.05
3 3.38 0.95 0.62 0.35 0.12 0.01 0.02 0.07 0.11 0.11 -0.00 -0.12 -0.12
4 4.47 1.36 0.65 0.45 0.14 0.04 0.02 0.07 0.12 0.04 -0.00 0.07 -0.03
5 5.06 2.21 0.87 0.40 0.20 0.04 0.04 0.10 0.10 0.05 -0.07 -0.03 -0.01
10 8.28 5.02 1.88 0.57 0.24 0.08 0.06 0.10 0.11 0.13 0.18 0.58 -0.89
20 40.22 11.58 2.43 1.84 0.26 0.05 0.08 0.11 0.16 0.15 -0.10 -0.02 -1.07
30 8.07 3.41 0.38 0.09 0.08 0.10 0.19 0.21 -0.12 0.59 -1.37
50 7.55 0.81 0.08 0.10 0.14 0.11 0.01 0.37 -0.71 -1.05
100 2.51 0.22 0.08 0.15 0.31 -0.15 -0.53 -2.10 -0.30
Table 3: Up fraction (%)k-day trend (%/day)
k -5.00 -4.00 -3.00 -2.00 -1.00 -0.50 0.00 0.50 1.00 2.00 3.00 4.00 5.00
1 61.2 56.9 55.0 52.1 49.6 48.0 48.9 50.2 50.0 49.8 49.8 50.0 46.7
2 62.8 57.6 56.9 53.7 51.1 49.5 49.2 49.3 49.8 50.1 48.3 47.5 45.7
3 65.0 58.4 56.5 55.7 51.9 49.4 49.2 49.7 50.1 49.4 47.3 44.6 43.8
4 64.6 58.9 55.5 55.2 52.5 50.1 49.0 49.9 51.0 48.3 46.1 45.8 44.7
5 65.4 60.8 55.7 54.5 52.8 50.0 49.5 50.5 50.2 47.8 44.9 45.5 44.1
10 65.0 65.1 56.0 53.0 51.9 50.6 50.3 50.7 48.9 47.8 46.2 47.9 38.4
20 66.7 65.4 54.8 56.9 50.2 49.5 50.8 50.7 49.1 47.8 43.7 44.0 40.6
30 55.2 57.5 49.4 49.3 51.0 50.4 49.3 47.3 39.8 53.6 37.7
50 57.7 50.5 48.4 50.7 51.0 48.2 46.9 47.9 37.5 41.7
100 52.4 49.1 50.3 50.7 49.3 46.9 47.7 31.6 50.0
Table 4: Number of pointsk-day trend (%/day)
k -5.00 -4.00 -3.00 -2.00 -1.00 -0.50 0.00 0.50 1.00 2.00 3.00 4.00 5.00
1 10256 6255 12158 23991 29276 19134 60845 18447 28262 23213 13091 7077 13141
2 4071 3206 7475 19783 34386 35228 53625 33001 32519 20794 9214 4335 6703
3 2121 2101 5000 15661 33500 42333 58688 39244 32600 18332 6854 2994 4244
4 1187 1426 3640 12431 31945 46192 64660 42539 32581 15915 5432 2264 2982
5 744 990 2852 10142 29791 49017 69243 45101 32426 13989 4384 1698 2344
10 116 255 1047 4837 19894 52570 89411 53333 27421 8062 2238 807 890
20 3 28 168 1941 11475 47613 112230 59258 19290 4344 1029 338 320
30 0 0 32 708 8339 42626 127005 58767 14641 3021 625 209 179
50 0 0 0 59 4033 34769 147072 54372 10147 1655 311 115 83
100 0 0 0 0 364 23997 167490 44255 5972 1094 129 20 53

14 DISCLAIMER: Your attention is directedto the disclaimer on page 2 of the Journal
The Australian Technical Analysts Association Journalwww.ataa.com.au • September/October 2002
Let us draw some conclusions from these statisticalexaminations of trends.
• The massive better part of returns falls intoa region, where it is very difficult to claim anycorrelation between past and future price changes.The regions, where any correlation may besignificant, are the sparsely populated extremeones.
• However, one interesting e.ect can be observed.Looking at Table 3, we observe that a 5% decreasein price (or more precisely: a return < -4.5%) sincethe previous day, stands a 61.2% probabilityof showing an increase by the following day.This effect justifies the notion of a mean revertingeffect commonly used in technical analysis.The effect is confirmed in the yearly analysispresented in Figure 1. The mean reverting effectafter a large drawdown is present both at 1-dayand at 5-days prediction horizon. It is also clearthat no corresponding conclusion regarding theeffects of large increases can be drawn. For thesecases, future returns are randomly distributedaround zero, both at 1-day and at 5-days horizon.
4. Day-of-the-Week EffectIn this section we investigate how the day of the weekaffect the stock price returns. The results confirm andcomplement similar investigations on other stockmarkets world-wide. The day-of-the-week effect hasbeen studied in a number of research papers.Hawawini and Keim [2] present a summary, whichdemonstrates significant differences in average dailyreturns across days of the week. In our investigationof the Swedish stock market, the daily returns arepresented in a somewhat different fashion thanis normally done. The stock returns are computed forall twenty-five combinations of buy and sell days.The returns are presented as “daily returns”, i.e. theyare divided by the number of calendar days betweenbuy and sell. For example, the return from buying onFriday and selling on Monday is divided by threebefore it is put in the table. A second table with thesame layout presents the “Up Fraction” (Eq. 2) for thesame combinations of buy and sell days. In this way,all combinations of buy and sell days canbe compared on an equal basis.
As before, results are presented for the 207 stocksfrom the Swedish stock market for the period1987-1996. This provides statistically more stablegrounds than using one single index (e.g. [2]).The daily returns R are shown in Table 5 and the“Up Fraction” in Table 6. We can extract severalinteresting “anomalies” from these tables:
• The day-of-the-week affects the returnssignificantly. The returns span between 0.003%(buy Friday/sell Tuesday) and 0.243% (buyThursday/sell Friday).
• The one-day returns increase monotonically fromMonday to Thursday: 0.004, 0.114, 0.167, 0.243(buying on a Friday never yields a one-day return).
• The right most column describes the mean returnsachieved when selling between one and seven daysfrom the buying day. Friday and Monday appearto be the worst days to buy in this 1-dayperspective.
• Looking at “Up Fraction”, it is still clear that the realtrading odds are almost as bad as before. Evenif we pick the best choice and buy on Thursdayand sell on Friday, we loose money in 47.96%of the cases. It would take great patience anda stable financial backup to utilise the shownday-of-the-week effect.
A question that should be posed always when lookingfor and finding structures in huge data sets, is whetherthe found structure reflects some general propertyof the data generating process, or is simply an effectof data snooping. In this particular case, we havecalculated the same statistics for yearly data over1987-1996. In this way, the results are tested forstability in time. The reported effects are present evenin these cases, and thus provide additional support forthe results. However, the risk for data snooping is,as always in the case with stock data, huge.

15DISCLAIMER: Your attention is directedto the disclaimer on page 2 of the Journal
The Australian Technical Analysts Association Journalwww.ataa.com.au • September/October 2002
Table 5: Daily returns (%) for combinations of Buy and Sell daysSell Day
Buy Day Mon Tue Wed Thu Fri Mean
Mon 0.069 0.004 0.050 0.078 0.105 0.061
Tue 0.081 0.066 0.114 0.136 0.152 0.110
Wed 0.076 0.060 0.066 0.167 0.186 0.111
Thu 0.061 0.044 0.051 0.058 0.243 0.091
Fri 0.014 0.003 0.018 0.033 0.062 0.026
Mean 0.060 0.035 0.060 0.095 0.150 0.080
Table 6: Up fraction (%) for combinations of Buy and Sell daysSell Day
Buy Day Mon Tue Wed Thu Fri Mean
Mon 50.21 48.42 49.07 49.89 50.66 49.65
Tue 50.85 50.68 50.39 51.24 52.04 51.04
Wed 50.79 50.27 51.16 51.63 52.40 51.25
Thu 49.80 49.38 49.86 50.41 52.05 50.30
Fri 48.70 47.51 48.18 49.02 50.30 48.74
Mean 50.07 49.25 49.73 50.44 51.49 50.20
Table 7: Number of observations for combinations of Buy and Sell daysSell Day
Buy Day Mon Tue Wed Thu Fri Mean
Mon 50605 54476 53933 52653 51495 52632
Tue 54044 56810 57756 56206 54845 55932
Wed 53794 57100 56546 56235 54826 55700
Thu 52634 55865 55880 54341 54260 54596
Fri 52898 54781 54790 53798 52454 53744
Mean 52795 55806 55781 54647 53576 54521

16 DISCLAIMER: Your attention is directedto the disclaimer on page 2 of the Journal
The Australian Technical Analysts Association Journalwww.ataa.com.au • September/October 2002
5. Month EffectsThe month effect on stock returns is investigatedby computing daily returns for each month.The returns are computed for the years 1987-1996.The mean results for the 207 stocks are shownin Table 8. These results for the Swedish stock marketfit well with investigations on other markets.Hawawini and Keim [2] present a summaryof a research on a number of stock marketsworldwide. The high returns for January and lowreturns for September are significant for most of themarkets, including the Swedish stock market.The Up Fraction varies between 47.24% (August) and53.20% ( January). The mean Up Fraction is 49.94%,which is close to the 50%, proposed by therandom-walk hypothesis. Note, that a predictionaccuracy of about 54% hit rate for the sign is oftenreported for elaborate prediction algorithms. Mostalgorithms do not use any calendar data as inputvariables, see example. [4] or [1], and claim to showpredictive capability in the algorithms. Be thatas it may, if we can achieve a similar hit rate by justlooking at what month we are trading in, it seemsreasonable to incorporate in some way themonth-of-the-year in the algorithm. And thevalidation process really should be reconsidered foralgorithms that do not do that.
5.1 Monthly Returns for Combinations of Buyand Sell Months
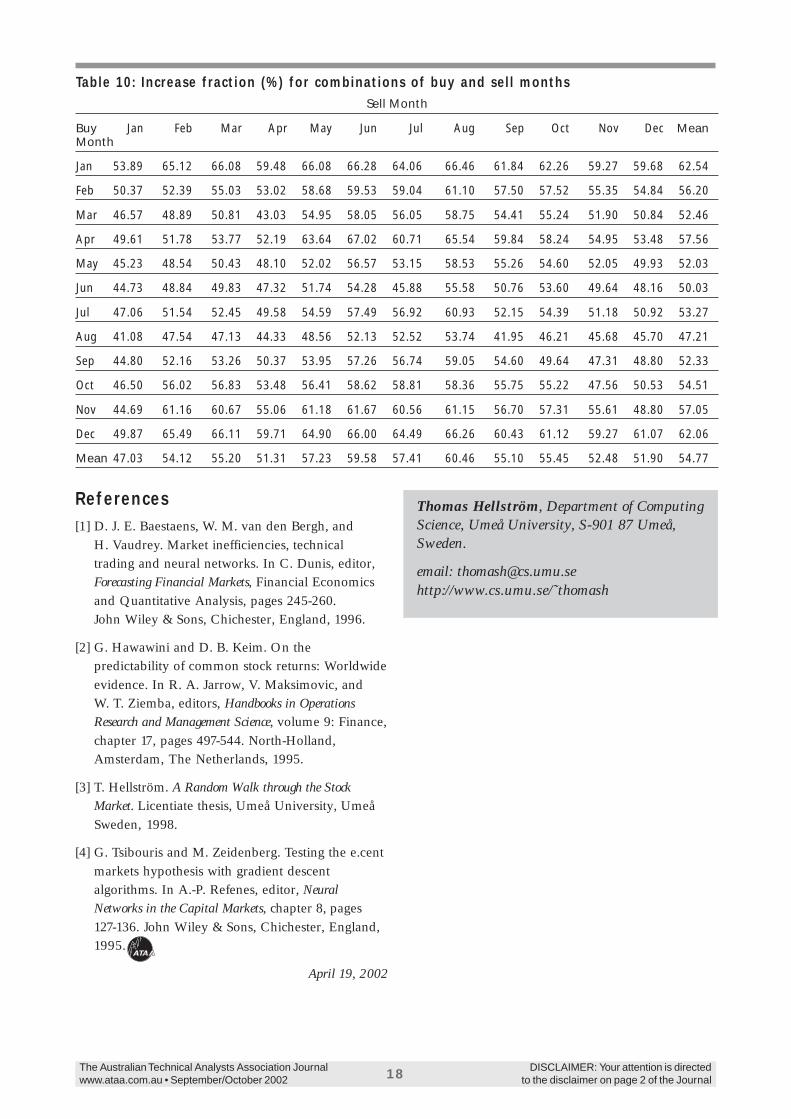
We conclude the investigations of seasonal effects witha trading-oriented statistical test, where both buyingand selling are considered. The first trading dayin each month is always selected for both buying andselling. After buying in the beginning of a month, thereturns from selling in the beginning of each of thesuccessive twelve months are computed and storedin a twelve-by-twelve table. The shown figuresin Table 9 are daily returns times 30, to obtaincomparable monthly returns for all months, regardlessof the number of days they contain. Table 10 showsthe Up Fraction (Eq. 2) for the same combinationsof buy and sell months. The right-most column showsaverage values for each month. We can conclude thatDecember, January and February are good monthsto buy stocks, whereas August and Septemberproduce the lowest profits in average over theinvestigated period. It is important to realise that the
presented figures are average values that are verysensitive to the market’s behaviour during individualyears. A more detailed yearly analysis [3] shows thatthe spread between years is considerable.
6. SummaryWe sum up the results with some of the mostinteresting observations.
• The analysis of trends show very weak support fora general trend concept for the stock market.The massive better part of returns falls intoregions, where it is very difficult to claim anysimple correlation between past and future pricechanges. A possible effect is the mean revertingbehaviour: a 5% decrease in price since theprevious day, stands a 61.2% probabilityof showing an increase by the following day.The cases with large increase since the previous dayexhibit no similar effect.
• The presented statistics show significantday-of-the-week and month-of-the-year effectson the stock returns. The daily returns varybetween 0.004% (buy Monday/sell Tuesday) and0.243% (buy Thursday/sell Friday).
The Up Fraction was shown to depend on themonth of the year and to vary between 47.24%(August) and 53.20% ( January). Even if the effectsare too small to be utilized in actual trading, theyare definitely big enough to influence otherprediction algorithms, such as ordinary time seriesanalysis or neural network models of daily returns.If not taken into account in such algorithms,the seasonal effects appear as a high noise levelsin the data. It was shown, that the month-of-the-year effects are of the same size as the accuracyof many published prediction algorithms thatdo not make use of any date information.
There are several ways to deal with the calendareffects when constructing prediction algorithms:
• Include the time dimension in the modeling,i.e. include a trainable parameter describing howthe return depends on the day of the week,or on the month.
• Aggregate data. For example, instead of modelingthe return time series for all the days in a giventime period, we can restrict the model to predictfrom one Monday to the next.

17DISCLAIMER: Your attention is directedto the disclaimer on page 2 of the Journal
The Australian Technical Analysts Association Journalwww.ataa.com.au • September/October 2002
Table 8: Average daily returns for eachmonth
Mean Std.dev. Incr.fraction No. of obs.
Jan 0.357 3.90 53.20 24058
Feb 0.208 4.03 50.76 23590
Mar -0.025 3.43 47.35 26661
Apr 0.202 3.28 52.67 23408
May 0.152 3.47 51.62 24406
Jun -0.026 3.23 48.10 24914
Jul 0.220 3.09 52.99 26042
Aug -0.096 3.45 47.24 27941
Sep -0.042 3.78 48.49 27338
Oct 0.036 4.57 48.77 28515
Nov 0.082 4.04 48.91 27764
Dec 0.111 4.56 50.33 26447
Mean 0.092 3.78 49.94 25924
Table 9: Monthly returns (%) for combinations of buy and sell monthsSell Month
Buy Jan Feb Mar Apr May Jun Jul Aug Sep Oct Nov Dec MeanMonth
Jan 1.47 6.36 4.79 2.70 2.91 2.92 2.35 2.70 2.18 1.91 1.87 1.76 2.83
Feb 1.14 1.91 3.91 1.34 1.95 2.27 1.76 2.40 1.82 1.65 1.61 1.49 1.94
Mar 0.52 1.27 1.33 -0.58 1.12 1.60 1.10 1.77 1.22 1.01 1.00 0.94 1.03
Apr 0.73 1.52 1.51 1.12 3.31 2.80 1.70 2.46 1.59 1.27 1.23 1.13 1.70
May 0.35 1.25 1.27 0.87 1.18 2.56 0.90 2.07 1.09 0.78 0.82 0.73 1.16
Jun -0.06 0.89 0.99 0.64 0.97 1.08 -0.65 1.49 0.51 0.27 0.26 0.29 0.56
Jul 0.16 1.20 1.32 0.85 1.19 1.28 1.13 4.01 1.11 0.62 0.57 0.54 1.16
Aug -0.82 0.43 0.63 0.28 0.66 0.85 0.72 1.01 -1.53 -1.07 -0.68 -0.32 0.01
Sep -0.49 1.06 1.24 0.76 1.13 1.31 1.15 1.54 1.28 -1.04 -0.45 0.08 0.63
Oct -0.05 1.82 2.00 1.29 1.61 1.81 1.57 2.06 1.67 1.45 0.15 0.74 1.34
Nov 0.07 2.32 2.43 1.58 1.86 2.10 1.80 2.26 1.85 1.60 1.82 1.25 1.75
Dec 0.35 3.68 3.38 2.10 2.34 2.51 2.09 2.48 1.97 1.70 1.90 1.85 2.20
Mean 0.28 1.98 2.07 1.08 1.69 1.92 1.30 2.19 1.23 0.85 0.84 0.87 1.36
18 DISCLAIMER: Your attention is directedto the disclaimer on page 2 of the Journal
The Australian Technical Analysts Association Journalwww.ataa.com.au • September/October 2002
Table 10: Increase fraction (%) for combinations of buy and sell monthsSell Month
Buy Jan Feb Mar Apr May Jun Jul Aug Sep Oct Nov Dec MeanMonth
Jan 53.89 65.12 66.08 59.48 66.08 66.28 64.06 66.46 61.84 62.26 59.27 59.68 62.54
Feb 50.37 52.39 55.03 53.02 58.68 59.53 59.04 61.10 57.50 57.52 55.35 54.84 56.20
Mar 46.57 48.89 50.81 43.03 54.95 58.05 56.05 58.75 54.41 55.24 51.90 50.84 52.46
Apr 49.61 51.78 53.77 52.19 63.64 67.02 60.71 65.54 59.84 58.24 54.95 53.48 57.56
May 45.23 48.54 50.43 48.10 52.02 56.57 53.15 58.53 55.26 54.60 52.05 49.93 52.03
Jun 44.73 48.84 49.83 47.32 51.74 54.28 45.88 55.58 50.76 53.60 49.64 48.16 50.03
Jul 47.06 51.54 52.45 49.58 54.59 57.49 56.92 60.93 52.15 54.39 51.18 50.92 53.27
Aug 41.08 47.54 47.13 44.33 48.56 52.13 52.52 53.74 41.95 46.21 45.68 45.70 47.21
Sep 44.80 52.16 53.26 50.37 53.95 57.26 56.74 59.05 54.60 49.64 47.31 48.80 52.33
Oct 46.50 56.02 56.83 53.48 56.41 58.62 58.81 58.36 55.75 55.22 47.56 50.53 54.51
Nov 44.69 61.16 60.67 55.06 61.18 61.67 60.56 61.15 56.70 57.31 55.61 48.80 57.05
Dec 49.87 65.49 66.11 59.71 64.90 66.00 64.49 66.26 60.43 61.12 59.27 61.07 62.06
Mean 47.03 54.12 55.20 51.31 57.23 59.58 57.41 60.46 55.10 55.45 52.48 51.90 54.77
References[1] D. J. E. Baestaens, W. M. van den Bergh, and
H. Vaudrey. Market inefficiencies, technicaltrading and neural networks. In C. Dunis, editor,Forecasting Financial Markets, Financial Economicsand Quantitative Analysis, pages 245-260.John Wiley & Sons, Chichester, England, 1996.
[2] G. Hawawini and D. B. Keim. On thepredictability of common stock returns: Worldwideevidence. In R. A. Jarrow, V. Maksimovic, andW. T. Ziemba, editors, Handbooks in OperationsResearch and Management Science, volume 9: Finance,chapter 17, pages 497-544. North-Holland,Amsterdam, The Netherlands, 1995.
[3] T. Hellström. A Random Walk through the StockMarket. Licentiate thesis, Umeå University, UmeåSweden, 1998.
[4] G. Tsibouris and M. Zeidenberg. Testing the e.centmarkets hypothesis with gradient descentalgorithms. In A.-P. Refenes, editor, NeuralNetworks in the Capital Markets, chapter 8, pages127-136. John Wiley & Sons, Chichester, England,1995.
April 19, 2002
Thomas Hellström, Department of ComputingScience, Umeå University, S-901 87 Umeå,Sweden.
email: [email protected]://www.cs.umu.se/˜thomash

19DISCLAIMER: Your attention is directedto the disclaimer on page 2 of the Journal
The Australian Technical Analysts Association Journalwww.ataa.com.au • September/October 2002
A lot of people look at the volumein a particular market and thinkto themselves, “why would anyone wantto trade that market when the volume is solow?’ The truth of the matter is that they areconfusing the number of trades that didoccur that day with how many trades couldhave occurred that day. The importantquestion to ask is ‘can the market handleyour trades at the price you want, with thevolume you want?’
The place to start looking is the bid/ask price spreadon the particular market that you wish to trade. If youare looking at a derivative market spread, you areprobably looking at a ‘Market Makers’ spread.A Market Maker will apply to the exchangeto become an official Market Maker in the particularmarkets that interest the Market Maker. An officialMarket Maker in a particular market will needto abide by the rules set down by the particularexchange that governs that market. These rulesgovern the width of the spreads, the times that themarket is required to be made, and the time permittedto make a market once a quote is requested.
Market Makers usually hedge themselves in a relatedmarket to manage risk.
They usually make their income by buying at oneprice in a market, and selling at a higher price in thesame market. This is where the width of the bid askspread comes into play.
VolatilityAs volatility increases, so does the width of the bid askspread. In times of high volatility Market Makers areusually exempt from making a market due to thedifficulties of being able to hedge their positions.As volatility increases, so does the risk to theMarket Makers.
Usually the size of the number of contracts that appearon each side of the spread is a token amount to allowthe market to trade. If you are trading a market, themost important thing is being able to enter and exitthe trades at the prices you want.
Quite often a Market Maker is only too happyto accommodate the buyer or seller with the volumethat they wish to trade.
SlippageThin, illiquid markets mean slippage. Slippage occurswhen the price at which the trader requiresto be entered or exited from a trade is greater or lessthan what the trade actually transacts at. Slippageoccurs mostly as a result of volatility, especiallyovernight volatility which causes opening price gapsto occur in a market. This can play havoc upon stoploss orders.
Several markets now host several Market Makers percontract. This improves liquidity and tightens thebid/ask spread dramatically. The SFE has respondedto liquidity criticism by introducing three MarketMakers in their Individual Share Futures contractsand four Market Makers in their SPI 200 Optionscontracts.
A good Broker should be able to help you decidewhich markets are liquid enough to trade. The Brokeris also able to call the various Market Makers on yourbehalf to arrange the volume and the best pricepossible for your trades. The Market Maker willusually respond with a bid/ask spread. The tradermay decide to trade at the quoted price or take theirchance by placing their order in the middle of thespread.
Confusing Volume with Liquidityby Glen Van Ooran

20 DISCLAIMER: Your attention is directedto the disclaimer on page 2 of the Journal
The Australian Technical Analysts Association Journalwww.ataa.com.au • September/October 2002
Open InterestOpen Interest in the derivatives markets allows youto gauge the number and size of participantsin a market at a given time. A high level of OpenInterest means that a lot of positions are currentlyopen in that market. As it takes two parties to forma contract, an Open Interest of 1 equates to twoparties, a buyer and a seller.
As the price moves in that market, one party willmake money at the other party’s expense. One partywill then look to take profit whilst the other party willlook to limit their losses. As a result, a high levelof Open Interest will mean that there is the potentialfor volume to increase should there be a pricemovement in the underlying market.
As a rule of thumb, a derivatives contract with a highlevel of open interest will have tighter bid/ask spreadsand higher liquidity than a contract with a lower levelof Open Interest.
Glen Van Ooran is a Technical Analyst andDerivatives Advisor with C.K. Locke andPartners (formerly Australian Futures& Options Brokers).
Glen is also the West Australian Vice-Presidentof the ATAA and Lecturer for TechnicalAnalysis at the Securities Institute of Australiain Perth.
Order Form: ATAA Journals on CD-ROM(available for Windows only)
Please send me a copy of the ATAA Journals1990-2000 (available February 2001) on CD-ROM
Name:
Postal Address:
State: Postcode:
Please tick one:
New Order $45.00 or
Upgrade from old CD-ROM $30.00
Please charge my (circle one):
Credit Cards Accepted ✔ Please Tick
Bankcard Visa Mastercard
Amex Diners
Expiry:
Name on Card:
Signature (of Cardholder):
Cheques or money orders should be madepayable to ATAA. Prices include GST.
Fax your credit card order to: 02 9667 0983
or mail to:ATAA GPO Box 2774, Sydney NSW 2001

21DISCLAIMER: Your attention is directedto the disclaimer on page 2 of the Journal
The Australian Technical Analysts Association Journalwww.ataa.com.au • September/October 2002
This is a list of classic trading rules that wasgiven to me while on the trading floorin 1984. A senior trader collected these rulesfrom classic trading literature throughout thetwentieth century. They obviously withstandthe age-old test of time.
I’m sure most everybody knows these truisms in theirhearts, but this list is nicely edited and makes a goodread.
1. Plan your trades. Trade your plan.
2. Keep records of your trading results.
3. Keep a positive attitude, no matter how muchyou lose.
4. Don’t take the market home.
5. Continually set higher trading goals.
6. Successful traders buy into bad news and sellinto good news.
7. Successful traders are not afraid to buy highand sell low.
8. Successful traders have a well-scheduledplanned time for studying the markets.
9. Successful traders isolate themselves from theopinions of others.
10. Continually strive for patience, perseverance,determination, and rational action.
11. Limit your losses - use stops!
12. Never cancel a stop loss order after you haveplaced it!
13. Place the stop at the time you make your trade.
14. Never get into the market because you areanxious because of waiting.
15. Avoid getting in or out of the market too often.
16. Losses make the trader studious - not profits.Take advantage of every loss to improve yourknowledge of market action.
17. The most difficult task in speculation is notprediction but self-control. Successful tradingis difficult and frustrating. You are the mostimportant element in the equation for success.
18. Always discipline yourself by followinga pre-determined set of rules.
19. Remember that a bear market will give backin one month what a bull market has takenthree months to build.
20. Don’t ever allow a big winning trade to turninto a loser. Stop yourself out if the marketmoves against you 20% from your peak profitpoint.
21. You must have a program, you must know yourprogram, and you must follow your program.
22. Expect and accept losses gracefully. Those whobrood over losses always miss the nextopportunity, which more than likely willbe profitable.
23. Split your profits right down the middle andnever risk more than 50% of them again in themarket.
24. The key to successful trading is knowingyourself and your stress point.
25. The difference between winners and losers isn’tso much native ability as it is disciplineexercised in avoiding mistakes.
Time Tested Classic Trading Rules for theModern Trader to Live ByBy Linda Bradford Raschke

22 DISCLAIMER: Your attention is directedto the disclaimer on page 2 of the Journal
The Australian Technical Analysts Association Journalwww.ataa.com.au • September/October 2002
26. In trading as in fencing there are the quick andthe dead.
27. Speech may be silver but silence is golden.Traders with the golden touch do not talk abouttheir success.
28. Dream big dreams and think tall. Very fewpeople set goals too high. A man becomes whathe thinks about all day long.
29. Accept failure as a step towards victory.
30. Have you taken a loss? Forget it quickly.Have you taken a profit? Forget it even quicker!Don’t let ego and greed inhibit clear thinkingand hard work.
31. One cannot do anything about yesterday.When one door closes, another door opens.The greater opportunity always lies through theopen door.
32. The deepest secret for the trader is tosubordinate his will to the will of the market.The market is truth as it reflects all forces thatbear upon it. As long as he recognizes thishe is safe. When he ignores this, he is lostand doomed.
33. It’s much easier to put on a trade than to takeit off.
34. If a market doesn’t do what you think it shoulddo, get out.
35. Beware of large positions that can control youremotions. Don’t be overly aggressive with themarket. Treat it gently by allowing your equityto grow steadily rather than in bursts.
36. Never add to a losing position.
37. Beware of trying to pick tops or bottoms.
38. You must believe in yourself and yourjudgement if you expect to make a livingat this game.
39. In a narrow market there is no sense in tryingto anticipate what the next big movementis going to be - up or down.
40. A loss never bothers me after I take it. I forgetit overnight. But being wrong and not takingthe loss - that is what does the damage to thepocket book and to the soul.
41. Never volunteer advice and never brag of yourwinnings.
42. Of all speculative blunders, there are fewgreater than selling what shows a profit andkeeping what shows a loss.
43. Standing aside is a position.
44. It is better to be more interested in the market’sreaction to new information than in the pieceof news itself.
45. If you don’t know who you are, the markets arean expensive place to find out.
46. In the world of money, which is a world shapedby human behavior, nobody has the foggiestnotion of what will happen in the future. Markthat word - Nobody! Thus the successful traderdoes not base moves on what supposedly willhappen but reacts instead to what does happen.
47. Except in unusual circumstances, get in thehabit of taking your profit too soon. Don’ttorment yourself if a trade continues winningwithout you. Chances are it won’t continuelong. If it does, console yourself by thinkingof all the times when liquidating early reservedgains that you would have otherwise lost.
48. When the ship starts to sink, don’t pray - jump!
49. Lose your opinion - not your money.
50. Assimilate into your very bones a set of tradingrules that works for you.
Editor Note: Reprinted by permission.

23DISCLAIMER: Your attention is directedto the disclaimer on page 2 of the Journal
The Australian Technical Analysts Association Journalwww.ataa.com.au • September/October 2002
InterviewThis interview was conducted by an ATAA memberwith Dr Bernard Chapman, developer of Insight Tradercharting software.
Q: Of all the books you’ve seen which would yourecommend to people?
A: For someone new to trading I will recommendStan Weinstein’s Secrets for Profiting in Bull and BearMarkets. It’s a good simple approach.
The problem for people coming into this gameis that they have got a number of ideas andexpectations which are unrealistic, particularlyabout the amount of money they are goingto make in a particular time. I try to dispel someof these, if I can, particularly if the people aregoing off like a bull at a gate. It’s obvious that theyare going to come to some sort of disaster,particularly people who have been fired up withthe idea of leverage in futures markets. They comein and they have mentally taken their capital,multiplied it by the appropriate factors andin doing so they calculate the number of monthsuntil they will be able to count their first millionfrom their $10,000 account.
They are the sorts of things I try to dispel, but youhave got to be very careful about how you do it.I just give them a few anecdotal statistics like 95%of futures traders lose, 70% of futures traderstrading today will not be trading in a year’s time,85% of options expire worthless, and generallyspeaking these people who have been firedup by the marketers are unaware of these statisticsand even if they are aware of them they’re notreally aware of them in a real sense. They don’treally understand what they mean and how thesestatistics will apply to them. So you’ve got to hosethat down.
So, yes I suggest they look at Weinstein, and thatthey buy Weinstein. It’s about $40 it’s a good wayto start off. I try to get people to some extenteducated. Also, I emphasise spending as littlemoney as they can on charting software and data.This is because many people get caughtup in a number of systems, which will remainnameless, where they’re spending $10 to $15thousand dollars, when they might have only$20,000 to their name.
They have been led to believe that only verycomplex methods of analysis will yield results.So, they’ll get into some of the more esoteric formsof analysis, because they’ve been told that youmust understand all of them. The time and moneythat’s involved, and the complication, usually leadsto inefficiency. It’s like asking them to drive a verycomplicated car or aircraft without virtually anytraining at all. Again, you’ve got to be very carefulabout what you say and what you don’t say.
Then I will recommend them to go to the ATAAsite www.ataa.com.au and also Colin Nicholson’sweb site (www.bwts.com.au) because he freelyanswers a lot of questions there that are the sortsof things that new traders always want to know.He can then steer them into directions that willbe fruitful and steer them away from directionsthat can be disastrous.
Then I try to find out from the person whatit is that they are really looking for in termsof education. I tell them that there are a numberof things that they have to differentiate. They haveto differentiate between analysis education,technical and fundamental, trading education andalso education in using a software package.
Interview with Dr Bernard ChapmanBy Bill Fitzgerald & Colin Nicholson

24 DISCLAIMER: Your attention is directedto the disclaimer on page 2 of the Journal
The Australian Technical Analysts Association Journalwww.ataa.com.au • September/October 2002
The technical analysis education I usuallyrecommend is the Securities Institute of Australiasubjects E114 Technical Analysis and E171 SpecialisedTechniques in Technical Analysis. I also recommenda number of technical analysis books that youwould give to someone new to the area
The education I usually recommend for generaltrading education is Colin Nicholson’s videotapes,because Colin outlines a fairly simple straightforward approach which new people can relateto very quickly. Colin teaches the importantprerequisites of trading so that beginners can getup and running fairly quickly with a minimumof trading risk, but also in terms of not wastinga lot of money on unnecessary courses or booksor software or whatever.
As far as education on how to use a softwarepackage, well that’s software package specific.I just give them an idea of what’s available withInsight Trader charting software - the set of videosthat’s been produced by Dial & Chart that explainhow to use Insight Trader. From time to time,we also run weekend workshops wherewe go through the software from beginning to end.
Q: It’s fairly unique, isn’t it, where the persongiving the course is the developer?
A: That’s right.
Q: How did Insight Trader start?
A: Well, I was a share trader. I also had a friend whois a futures trader, by the name of Bob Chapman.You may have met him at the Sydney ATAAmeetings. He is no relation but we’ve been friendsnow since we were about 17. We have a lotof interests in common including trading.
I was working for CSIRO and I was writingcomputer programs to simulate the chemicalreaction and dispersion of pollutants in rivers,which is a fairly complex topic. And so theprograms I was writing were pretty hairy.
Q: This is 1980 what?
A: Yes, early 1980’s
Q: So this would have been on cyber computers?Mainframes?
A: Well, PC’s had only just arrived. I decided thatif I was doing all this software development forcomplex systems like polluted rivers, then I shouldwrite myself a program to assist my trading andthat of my friend - share and futures trading. Andso I started writing this program on the CSIROmainframe.
Q: In Fortran?
A: In Fortran, yes. I used to operate it from homethrough the telephone with one of these acousticcouplers 300 baud. It was a big thing. It usedto clatter away.
So, what was to become Insight Trader had it’s birthon the CSIRO mainframe which I think wasa Cyber 76 in those days. That went fine fora while, but in 1985 personal computers startedto become more common and more user friendly.So I shifted it from the CSIRO mainframeto a personal computer that I bought and starteddeveloping it from there.
Q: Still in Fortran?
A: No, it wasn’t Fortran. It was Basic. Everythinginterpreted Basic. It wasn’t too bad actually.
Then I started to introduce some strength into theuser interface, because whenever a scientist writesa program for himself nobody else can use it. I hadto have my mate use it, so it had to be userfriendly. If it hadn’t been for him it would just havebeen a mess. So it all started to come together.

25DISCLAIMER: Your attention is directedto the disclaimer on page 2 of the Journal
The Australian Technical Analysts Association Journalwww.ataa.com.au • September/October 2002
In 1990 it had reached the stage where I thoughtI might commercialise. CSIRO came to the rescuethere, because I had done a lot of managementcourses in CSIRO. We were very strongon commercialisation and we were actuallylooking around for things to commercialise in thework that we had done in CSIRO. The only thingthat I decided was worth commercialising was notthe work I had done for CSIRO, but the tradingprogram which was really a private thing.I thought that as an exercise, I’ll attemptto commercialise this. So I submitted it and theyloved it. They thought it was fantastic. Probablybecause it was something they knew would takeoff, whereas a lot of CSIRO things are so niche.The potential market for most CSIRO thingsis so small.
They took it to a certain stage, but in the end, I gotcold feet. I thought we might get questions askedin Parliament about why CSIRO was gettinginvolved in activities which are really not withinits charter. I thought that perhaps I should risk myown venture capital in this rather than CSIROhaving to answer questions. So I did and it took offfrom there.
So it’s been on the market since 1990. It started offas a DOS program and then it was converted intoWindows 3.1 and finally into a Windows 95 32bitprogram.
Q: And it’s written in what now?
A: It’s written in a language called PVDLL, whichproduces extremely small fast executables. Becauseit is written in a low level language, you are notcarrying a lot of baggage around. You can fit thedemonstration version onto a single floppy disk,because we don’t use a rapid applicationdevelopment platform. All the windows APIfunctions are called individually. Everythingis done longhand, but you’ve got incredibleflexibility that way and it’s fast. Also the resultingcode is very small.
Q: And where did the unique idea of the floating toolbar come from?
A: There were two reasons for that. One of themis I got a request from a long-term client. When heheard that I was going to write a Windows versionof Insight Trader, he said that “whatever you do,have a floating toolbar”.
Also, I wanted to get as many buttons off thescreen as I could. I wanted to get menus off too,to give the maximum number of pixels to thechart. That is why when you go to the chart editscreen it’s pretty well bare all the way around.I think that you thought that was a DOS screen.It’s not - it’s a Windows screen. It’s all 32 bitWindows calls, but it’s not cluttered up withbuttons, which means that it doesn’t have all theWindows paraphernalia around the edges.
So that was really a request from a client. Andthere were so many of my clients who wereso in love with the DOS version that it took a longtime for them to change. Some of them haven’tchanged yet.
I got a lot of requests to do things in a certain way,so I took those into account, as one must do withone’s client base. In fact Insight Trader developedlargely on the basis of requests from clients.
There are three reasons why I’ll introducea particular feature into Insight Trader. The firstreason is if I think it’s in the client’s interest. That’sthe first reason I’ll put a new feature into theprogram.
The second is that if enough people ask for it, evenif in my opinion I don’t think that it is goingto be terribly helpful. I can’t stand in judgementof how people use the program. People useit in different ways, in ways that I would neverhave thought of. And I’ll say to someone, you can’tdo that and they say yes, I do it all the time.

26 DISCLAIMER: Your attention is directedto the disclaimer on page 2 of the Journal
The Australian Technical Analysts Association Journalwww.ataa.com.au • September/October 2002
Finally I’ll put something into the programif I want it for my own trading.
I get a constant flow of requests from users.They tend to be fiercely loyal and also they are notbackward in coming forward if there is somethingthey’d like to see in the program.
Q: And the speed keys, they are another uniquefeature. How did they evolve?
A: Doing things with keys is always faster than doingsomething with a mouse, particularly if you aregiving a talk in low light levels trying to fiddlearound with a mouse. It is much easier to hit a bigfat key with a big fat finger than trying to delicatelymanoeuvre a mouse cursor around.
But that’s not the reason they were introduced.It’s a useful by-product. Speed keys wereintroduced for speed. They were a feature of theDOS program. I got so many requests from peoplewho were addicted to the DOS program, wantingme to retain all the speed keys. So I was ableto retain them all and put more in.
You would think that a mouse operation wouldbe faster but it’s not. If you can keep your fingerson the keyboard without having to go to themouse, or if you can keep your hand on the mousewithout having to go the keyboard, then it’s muchmore efficient than jumping between the two.
Q: Insight Trader has a fundamental data bias aswell. How did that evolve?
A: I realised early in the piece that the two waringcamps of fundamental and technical analysis eachhad something valuable to offer. Not beingone-eyed, I introduced fundamental analysis intoInsight Trader before it was really availableelsewhere, so that people could use a combinationof both technical and fundamental analysis.I wanted to use a combination of the best of both.
Q: So that meant building your data base?
A: That’s right, yes.
Q: So that must be a reasonably large datamanagement exercise?
A: It is.
There are two things I did initially. Data BaseManager was specifically for issues, reconstructionsand so on. With the charting software on themarket at the time, you had to do all the issues,reconstructions and name changes yourselfmanually.
So we were able to build up a database, which hadall the adjustments in it going back to the year dot.Even now, there are really only two databases thatare properly adjusted. One of them is Insight Traderthe other one is ShareFinder.
Q: Data quality is paramount. Are saying it iscompromised because of the heritage of thosedatabases?
A: Most of the other databases I’ve seen that areavailable to the private trader market, appearto all come from the one source. The reason is thatthese databases were built up by private clientsover a long period of time. They adjusted somestocks, particularly the ones they held.They adjusted some others and not all of themwere done correctly. Most of them weren’t done.Most of the merging wasn’t done. Whena company changes it’s name, you need to mergethe file with the old code, the file with the newcode and the deferred delivery security thatis traded in between, otherwise you get gaps.
The average clients didn’t know anything aboutthis. So they built up this faulty data baseto a certain point, which is the basis of what isthere today. You’ve got this long period in whichthe files were not properly adjusted. That is rightthroughout the private trader community andpeople don’t know any different.

27DISCLAIMER: Your attention is directedto the disclaimer on page 2 of the Journal
The Australian Technical Analysts Association Journalwww.ataa.com.au • September/October 2002
The result is that many people are doing veryprecise analysis on grossly inaccurate data.One even wonders whether there’s much pointto it.
These days, a number of the data vendors aredoing adjustments for issues, reconstructions,name changes and so on. They started maybethree years or so ago. Maybe it’s more now.So what you find is that the data bases for threeor four years are probably OK, although I haven’tchecked them totally. However, I have noticed thatwhen some other vendors do adjust, they don’talways adjust them correctly. A good exampleof this is Telstra.
Q: Do you think that’s part of a structural problem?
A: If you are going to spend a lot of time back testingthen there’s no point in doing it on incorrecthistorical data.
Most of the data vendors are basing theiradjustments on the ASX dilution factors and so on.However, that is not a complete solution. A goodexample of an incorrect recent adjustment, usingexchange dilution factors, has been Telstra. It wentfrom a contributing share to a fully paid share,which should have been an additive adjustment.What they’ve done, by blindly using the exchangedilution factor, is a multiplicative adjustment. Andit makes a huge difference.
I remember getting an email from a client aboutit. He came across these two charts of Telstra -a Telstra chart from someone else and his own outof Insight Trader. The trend lines were differentbecause the adjusted historical price levels weredifferent. This was because they had done amultiplicative adjustment rather than additive.So, even now there are still incorrect adjustmentsbeing done by some vendors.
Q: Moving on to charting software itself.How do you see the current evolutionin charting software?
A: Much is going to depend on the evolutionof computing in general. It’s interesting, havingbeen writing charting software commercially for12 years, to see how it has evolved over that time.Of course, there have been changes in operatingsystems going from DOS to Windows. There havealso been the various fads and fashions that havecome and gone.
Q: Such as?
A: Candlesticks. Everyone has been looking for theHoly Grail.
At one time it was candlesticks. At another timeit was indicators. Indicators were seen as God’s giftto mankind that would solve everything foreverybody once and for all. But we very quicklycame to the realisation that there’s no magic bullet,no Holy Grail, and that each of these techniqueshas its limitations. Another one was NeuralNetworks.
Q: You don’t have neural networks in InsightTrader, do you?
A: No, but I did work together with a guy who wasclosely aligned with CSIRO looking at NeuralNetworks for trading. He did a lot of work andI did a lot of work for him. His conclusion was thatthere wasn’t anything to be gained.
More recently there have been what I callgimmicks which have been proposed as techniquesthat people can use, but I think are much in thesame mould as fashions to stimulate people to buythe latest product or attend the latest courseof lectures. Although there might be some valuein these techniques, generally speaking the value

28 DISCLAIMER: Your attention is directedto the disclaimer on page 2 of the Journal
The Australian Technical Analysts Association Journalwww.ataa.com.au • September/October 2002
that they can add is really quite smallin comparison to the hype that has been generatedin order to use them as a marketing tool.So I am very reluctant to incorporate those into thesoftware just because they are the flavour of themonth. In fact I prefer to wait until they areno longer flavour of the month. Then, after all thefuss has died down, make a decision as to whetherit is in the interest of the client to put them into thepackage or not.
Q: I noticed when I was reviewing software recentlyInsight Trader was the one that evolved mostin the last 18 months. It went from version 9to version 11. Three of them hadn’t evolvedat all and still had the same version. To whatextent has the tech wreck has had somethingto do with that?
A: Oh I think it has. Sales are not like they were.The first half of 2000 was just frantic. I rarely gotto bed before 2AM every night of the week.This was a function of two things. There was thetech bubble. Then it burst, but even after that therewas the GST phenomenon. People wanted to getin before the end of the financial year, so that evenafter the tech wreck there were a still a lot of franticsoftware purchases. In July it tailed off a bit, butthen picked up again and sales are still solid nowand they’ve been solid over the Christmas 2001period but it’s a fickle market. It varies from weekto week of course. It has statistical variation likeanything does. I am expecting to see a downturnin the software market particularly, if the sharemarket takes a dive.
Q: Will it knock a few participants out?
A: Yes, and people lose interest in markets if they’renot moving up. It’s the same as the propertymarket, in that it goes through cycles. If we havea good bear market then interest will disappear.There’ll still be a base flow of sales, but it won’tbe as frantic as it has been in the last three years.The last three years have really been incredible.I’ve seen nothing like it before. I think to a largeextent it has been due to the fact that there’scompetition out there. Having a numberof charting packages stimulates interest.What I think has happened is that Insight Traderis getting a larger slice of an ever increasing pie,because people’s awareness has been raisedby more advertising about markets, aboutpackages that are available and so on.
Q: The other thing I noticed is that some of thecharting packages are starting to modularisethemselves. You can buy, for even a hundreddollars, a base charting package. It just drawsvery simple charts and as you want various toolsyou can pay a little bit extra and just get bits andpieces. Is Insight Trader thinking of doing that?
A: Insight Trader is already modularised to someextent. The base charting package is $495.Then you can add the three modules, being theportfolio manager, the systems tester and thelive module.
Q: But this is modularising it down to individualindicators.
A: We were actually asked to do this by a live datavendor. We did it, but we haven’t marketedit as such. They wanted a low cost packageas a front end to their data stream. We didn’t putit out on the market. I don’t know whetherit is a good marketing tool or not.

29DISCLAIMER: Your attention is directedto the disclaimer on page 2 of the Journal
The Australian Technical Analysts Association Journalwww.ataa.com.au • September/October 2002
Q: Unless you can automate it substantially, it sounds like a very cumbersome and expensiveway to have to manage a package?
A: We do it with a system of registration numbers,so we just switch on the various facilities.That’s what we were doing with the cut downversion. I know they have had a version, whichthey’ll say is XYZ Lite, but really we haven’t gonethat way. Whether we mean to in the futureI don’t know.
Q: What about Web charting? How do you see thatevolving in relationship to stand alone packageslike yours?
A: I think that it will get more popular as thebandwidth increases and the ability to drag datadown the line more quickly improves.The difficulty at the moment is it can be fairlyslow.
Q: Well the pluses are you don’t have to maintaina database. You don’t have to maintain software.It’s just there when you want it.
A: I think there is a lot to be said for that. I’ve actuallybeen asked by a number of data vendorsto provide the front end for that. I haven’t doneso for various reasons. The main reasonis it requires a total rewrite in something likeJAVA.
You tend not to be able at this stage to do asflexible analysis as you can with a stand alonecharting package, but I believe that this willchange fairly quickly over the coming years.
Q: So the JAVA language is really the major limitingfactor?
A: To what you can do? No.
Q: Well is it just translating it?
A: Maybe it’s partly that, but I think possiblyit’s a combination of that and the bandwidthproblem. I’m not sufficiently familiar with JAVAas a language to know how easy it is to do someof the things that I do in the Windowsenvironment. So really my answer to that is onlya guess.
That’s going to change. With a cable modem,I think there’s sufficient bandwidth there, but mostpeople aren’t on cable.
I don’t think it will kill the stand-alone chartingpackages, but I think it will be a question of marketshare again. It will cut into a certain amount of themarket. Then again, it will popularise it even moreand so you’re getting this ever increasing pie.So long as you’ve got your slice of the action,you’re pretty well set up.
Q: From your years of trading, seeing the mistakesthat other people make, what are the three mostimportant pieces of advice that you would pass onto traders? .
A: The three things that I consider importantin trading are analysis, money management, anddeveloping an understanding of your own personalpsychology such that you can undertake the actionsthat are necessary to implement your trading plan.Specifically, this involves activating stop losseswhen they should be activated.
Of these three, I consider the third one to be themost important. Most traders who fail will failbecause they don’t understand themselvespsychologically to the degree that they must.They refuse to activate their stop losses when theyare triggered. They will rationalise why theyshouldn’t cut and run with a small loss. Tomorrowit might go up or it’s just gone a bit down below thestop. They will wait till it comes back up again.

30 DISCLAIMER: Your attention is directedto the disclaimer on page 2 of the Journal
The Australian Technical Analysts Association Journalwww.ataa.com.au • September/October 2002
Order Form: ATAA Journals on CD-ROM(available for Windows only)
Please send me a copy of the ATAA Journals1990-2000 (available February 2001) on CD-ROM
Name:
Postal Address:
State: Postcode:
Please tick one:
New Order $45.00 or
Upgrade from old CD-ROM $30.00
Please charge my (circle one):
Credit Cards Accepted ✔ Please Tick
Bankcard Visa Mastercard
Amex Diners
Expiry:
Name on Card:
Signature (of Cardholder):
Cheques or money orders should be madepayable to ATAA. Prices include GST.
Fax your credit card order to: 02 9667 0983
or mail to:ATAA GPO Box 2774, Sydney NSW 2001
Most people think of analysis as being mostimportant but it’s not. Money managementis extremely important and most people don’t evenhave a clue about it, but It is the whole psychologything that I think is the key to trading.
Analysis doesn’t have to be technical analysis,it can be fundamental or any other formof analysis you might like to employ. Moneymanagement and understanding of your ownpsychology, because I find that trading is mostvaluable, not so much in the money thatit generates, but in the understanding that it givesyou of your own self.
The views expressed in this interview are thoseof Dr Chapman and do not necessarily reflect theviews, if any, of the ATAA or its directors.
Dr Bernard Chapman can be contactedon 02 4751 2932 or visitwww.insighttrading.com.au

31DISCLAIMER: Your attention is directedto the disclaimer on page 2 of the Journal
The Australian Technical Analysts Association Journalwww.ataa.com.au • September/October 2002
In order that the maximum number of members maytake advantage of the library, you are asked to vieweach tape and return it within one week. Memberstaking too long to return videotapes may bedropped from the waiting list for furtherborrowing.
We lend these videotapes on a type of first come firstserved basis and maintain a waiting list. While we willplace you on the list for more than one tape you willbe sent only one at a time.
Members who have not received a videotape beforeare placed at the top of the list and will receive thenext tape that is returned to the library and wasordered by them. That member will then drop to theend of the list and will not receive another tape untiltheir name works its way to the top of the list again.
This system ensures that all members experiencea similar waiting period between videos, dependingon the demand. However, it also means that theorder in which members receive their selectionswill be random, depending upon which video nextcomes back when their name is at the top of the list.
Videotape Library
Mail: ATAA Video Librarian
3307 Channel Highway Woodbridge TAS 7162
However, members ordering Elder “TechnicalAnalysis in 52 Minutes” or Pring “Principlesof Technical Analysis” will be sent those tapes first,if they so request. This may delay receipt of thefirst tape, however.
If you would like to borrow any of these videotapesyou may:
• mail the order form appearing on pagesin this Journal.
• order through the ATAA website(www.ataa.com.au) video tape order web pages.
Members are asked to rewind tapes, place themcorrectly into their protective covers or boxes andpay the return postage. Videotapes should bereturned promptly within one week of receipt.Please ensure that the post boxes are securely taped.
The ATAA has established a collection of videotapes that members mayborrow. The videotapes are in VHS format and are available for loan to ATAAmembers in Australia & New Zealand free of charge. Members are only asked
to return them promptly when they have finished watching them.

32 DISCLAIMER: Your attention is directedto the disclaimer on page 2 of the Journal
The Australian Technical Analysts Association Journalwww.ataa.com.au • September/October 2002
VariousAppel: Day Trading with Gerald Appel A1
Arnold: Pattern Probability Strategy A3
Bolton-Smith: The Tried & True Indicators in theMarket A2
Briese: The Inside Track to Winning A4
Ehlers: Trading With Cycles Seminar A5
Michaelsen: Roadmap To Riches A6
Najarian: The Super Trader’s Essential Foundation& Key Strategies For Successful Options Trading A7
Plummer: Forecasting Financial Markets A8
Pontikis: Asset Allocation & Intermarket TechnicalAnalysis (Sydney Meeting 17.5.95) A9
Schwager: What It Takes To Be A Great Trader A11
Trester: How To Buy Stock & Commodity Options A12
Tharp: Peak Performance Trading(Sydney Meeting 24.4.95) A13
Pring: Momentum
Tape 1 - Basic Principles of Momentum Interpretation B1
Tape 2 - Selected Indicators 1 B2
Tape 3 - Selected Indicators 2 B3
Pring: Various
Basic Principles of Tech. Analysis C1
Price Patterns C2
Support, Resistance, trendlines & Moving Average C3
Momentum, Relative Strength and Volume C4
Mechanical Trading Systems & Correct InvestmentAttitudes C5
Bierovic: Various
How to Increase Your Trading Profits with Synergy D1
How to Synergise Oscillators with Trend Indicators D2
How to Manage Your Account, Your Trades & Yourself D3
Elder: Various
Technical Analysis in 52 Minutes E1
Directional System E2
Elder Ray E3
MACD and MACD-Histogram E4
Psychology of Trading E5
Relative Strength Index (RSI) E6
Stochastic E7
Trading for a Living E8
Triple Screen Trading E9
Williams %R E10
Alexander Elder: Trader’s Camp
Tape 1: Trader’s Camp E11
Tape 2: Trader’s Camp E12
Tape 3: Trader’s Camp E13
Tape 4: Trader’s Camp E14
Ring: Low-Risk, High Reward TechnicalTrading Strategies
Tape 1: Personal Trading Management F1
Tape 2: Japanese Candlesticks & Volume& Open Interest F2
Tape 3: Time Based Trading F3
Tape 4: Stochastics & DMI as Entry/Exit Signals F4
Tape 5: Directional Studies and Moving Averages F5
Video Library Order FormTo: Greg Manning
ATAA Videotape Librarian3307 Channel HighwayWoodbridge TAS 7162
From: Name:
Address:
Suburb: State: Post Code:
Phone: Email:
This Order ( ✔ Please tick) …is my first Replaces my previous Add to my previous
Videotape Listing✔ Please tick against the tapes requested below and forward copy to the ATAA Videotape Librarian, by mail.
✁

33DISCLAIMER: Your attention is directedto the disclaimer on page 2 of the Journal
The Australian Technical Analysts Association Journalwww.ataa.com.au • September/October 2002
✁
Video Library Order FormTo: Greg Manning
ATAA Videotape Librarian3307 Channel HighwayWoodbridge TAS 7162
From: Name:
Address:
Suburb: State: Post Code:
Phone: Email:
This Order ( ✔ Please tick) …is my first Replaces my previous Add to my previous
Videotape Listing
✔ Please tick against the tapes requested below and forward copy to the ATAA Videotape Librarian, by mail.
Ring: Profitable Trading With Gann & DirectionalIndicators
(Tape 1 is not available)
Tape 2: Basic Gann Techniques G2
Tape 3: Using RSI & HLMA G8
Tape 4: Using Stochastics G4
Tape 5: How to Apply the DMI G5
“The Best Video Tape Ever Made On TechnicalAnalysis”
Tape 1: The Basics: Price & Volume H1
Tape 2: Pattern Recognition, Moving Averagesand Sentiments H2
Tape 3: Cycles and Waves H3
Tape 4: Momentum & Putting It All Together H4
Koppel & Adell: High Performance Trading -The Mental Advantage
(Tapes 1-3 are not available)
Tape 4: Winning States of Mind I4
Krutsinger: Trading System Development
Tape 1: The Building Blocks of a Successful TradingSystem J1
Tape 2: Tailoring A System To Fit Your Personalityand Temperament J2
Tape 3: Systems Trading J3
Ring: How To Profit From Trends In Futures
Tape 1: Understanding Trend Spotting Tools K1
Tape 2: Trends In Action K2
Tape 3: How to be a Winner in the Markets K3
Tape 4: Rules For Creating Winning Trades K4
Sheehusen: How To Profit From Chart Patterns& Technical Studies
Tape 1: Chart Patterns You Can Use To Time YourEntry & Exit L1
Tape 2: Key Technical Indicators You Can Use In BothTrending and Range Bound Markets L2
Tape 3: How To Build A Winning Trading Systemby Combining Technical Indicators and Chart Patterns L3
ATAA Conference 1996 - Elder
Classical Technical analysis (Trading For A Living) M1
Money Management M2
Psychology of Trading M3
Pontikis: Money Management - Use & Abuse ofStop-Loss Orders M4
Curtis Arnold: Pattern Probability Strategy M5
Colin Nicholson: Anatomy of a Trade M6
Neil Costa: It is About Time M7
Dawn Bolton-Smith: My View of the Markets M8
The Elliott Wave Educational Video Series
Tape 1: Introducing the Elliott Wave Principle N1
Tape 2: Counting the Waves Correctly N2
Tape 3: Characteristics of Impulse Waves N3
Tape 4: Characteristics of Corrective Waves N4
Tape 5: Rules, Guidelines and Wave Personalities N5
Tape 6: Understanding the Fibonacci Ratioin Financial Markets N6
Tape 7: Calculating Fibonacci Relationships withthe Precision Ratio Compass N7
Tape 8: Real Time Trading Using the Elliott WavePrinciple N8
Tape 9: Trading Options Using the Elliott WavePrinciple N9
Tape 10: Questions and Answers with Prechter,Allman and Ascani N10

34 DISCLAIMER: Your attention is directedto the disclaimer on page 2 of the Journal
The Australian Technical Analysts Association Journalwww.ataa.com.au • September/October 2002
Video Library Order FormTo: Greg Manning
ATAA Videotape Librarian3307 Channel HighwayWoodbridge TAS 7162
From: Name:
Address:
Suburb: State: Post Code:
Phone: Email:
This Order ( ✔ Please tick) …is my first Replaces my previous Add to my previous
Videotape Listing✔ Please tick against the tapes requested below and forward copy to the ATAA Videotape Librarian, by mail.
✁
Williams: The Future Millionaires TrainingCourse
Tape 1 O1
Tape 2 O2
Tape 3 O3
Tape 4 O4
Secrets of Short Term Trading Q1
Glen Ring: Building A Better Trader
Tape 1: Laying The Foundation P1
Tape 2: Building the Structure P2
Tape 3: Using The Right Tool For The Job P3
Tape 4: Adding The Finishing Touches P4
Miscellaneous
Halloran: Option Essentials R1
Gramza: What Makes a Great Trader R2
Gramza: Becoming a Trader R3
Smith: Effective Short Selling R4
Van Tharp: Disciplined Trading R5
Clayburg: Pinpointing Entry & Exits R6
Nassar: Daytrading Myths & Reality R7
Seleznov: Tech Analysis, Vol, Moving Average,Relative Strength R8
Murphy: High Probability Chart Reading R9
Stendahl: The Systematic Trader: MaximisingTrading Systems and Money Management R10
Cook: Staying Alive: Trading Defensively forMaximum Profit R11
Pring: Practical Asset Allocation and theBusiness Cycle R12
Griffen: Direct Access Day Trading, Getting Started R13
Deel: Discipline, Tools, Techniques R14
Farley: Targeting Profitable Entry and Exit Points R15
Oz: Day Trading Wizard Using High ProbabilitySupport and Resistance Levels R16
Price Headley: High Impact Options Trading OptionProfits Through Superior Stock Selection R17
Colin Nicholson: How to Design a Trading PlanPart 1 of 2 R18a
Colin Nicholson: How to Design a Trading PlanPart 2 of 2 R18a
Tom Demark: Trading Indicators For The 21stCentury
Tape 1: Trading Exaggerated Market Moves S1
Tape 2: Identifying Market Moves Before The Crowd S2
Tape 3: Anticipating Trend Changes For Big Profits S3
Tape 4: Projecting Tops & Bottoms S4
Tape 5: Identifying Real Trendline Breakouts S5
Tape 6: Determining The Duration Of Market Moves S6
Caplan: The Options Advantage
Tape 1: How To Find Options Trading Opportunities T1
NOTE: You can mail these orderforms or else order through the website at www.ataa.com.au.
REMEMBER: Rewind tape afterviewing and post back to thelibrarian promptly.

35DISCLAIMER: Your attention is directedto the disclaimer on page 2 of the Journal
The Australian Technical Analysts Association Journalwww.ataa.com.au • September/October 2002
✁
Personal Details
First Name:
Family Name:
Company (If membership paid by a company):
Address:
State: Post Code:
Country:
Telephone (Business):
(Evening):
Mobile:
Facsimile:
Email:
The ATAA Newsletters (where ever possible) willbe sent via Email. Please be sure to provide yourcurrent Email address.
Do you use Technical Analysis for yourtrading/investing decisions? ................ Yes No
Are you employed in theSecurities Industry? ............................ Yes No
If no, is at least 75% of your incomederived from trading or investingin financial markets? ........................... Yes No
For our records, how did you first hear of the ATAA?
Application Details
New members should pay the joining fee and annualsubscription as follows:
• Joining fee: $88.00 (GST included)
• Annual subscription: $192.00 (GST included),or if joining part way through a year (our yearends June 30), a sum equal to $16.00 per monthstarting from next month through to June.
Incorrect payments will be referred back to you forcorrection before processing, so if in doubt contactthe Secretary before completing this form.
A tax invoice receipt will be posted to you.
The annual subscription may change from yearto year. If you wish to pay in advance for 2003/04,please contact the Secretary.
Please make my membership effective from :/ /
Amount enclosed or authorised below :$
Signature:
Date:
Please enclose cheque or money order payable to:Australian Technical Analysts Association or debit mycredit card as follows:
Credit Cards Accepted ✔ Please Tick
Bankcard Visa Mastercard
Amex Diners
Card No.:
Expiry: Name on Card:
Signature (of Cardholder):
Australian Technical Analysts AssociationABN 53 071 513 203
Application for Membership
Please mail the Application Form to:The SecretaryAustralian Technical Analysts AssociationGPO Box 2774Sydney NSW 2001
Applications with Credit Card Authorisationmay be faxed directly to:The Secretary (02) 9667 0983
For informationvisit the ATAA Websiteat www.ataa.com.au
or call the Assistant to the Secretary,Anna Vozzo on (02) 9667 0983,
or in other States, any of theState Councils listed inside the
front cover of any Journal.

36 DISCLAIMER: Your attention is directedto the disclaimer on page 2 of the Journal
The Australian Technical Analysts Association Journalwww.ataa.com.au • September/October 2002
Australian Technical Analysts Association(A.B.N. 53 071 513 203)
The Australian Technical AnalystsAssociation (ATAA) is an association of bothprofessional technical analysts and anyonewho uses technical analysis for privateinvesting, trading or advising.
The aims of the ATAA are:
• To establish personal contacts between analystsboth inside and outside Australia with a viewto promoting the theory and practice of technicalanalysis.
• To help raise the level of community awarenessand respect for technical analysis.
• To provide meetings and encourage theinterchange of materials, ideas and informationin order to add to the knowledge of members.
• To encourage the highest professional ethics andcompetence among technical analysts.
The ATAA is affiliated with the InternationalFederation of Technical Analysts (IFTA) which helpsmembers keep abreast of international markets andtechniques.
Founded by a small group of technical analysts whomet on a regular basis, the association was officiallylaunched on 26 April 1990. By June 2001 themembership had grown to 2182.
Membership is varied in employment, geography,market interest and approach to the markets. Currentmembers include corporate treasurers, fundmanagers, bank analysts and traders, stockbrokers,financial planners, private and local traders, investorsand students.
The ATAA monthly meetings in eight cities and theannual conference provide ongoing networking andlearning opportunities.
The ATAA Journal is published bimonthly andcontains articles on technical analysis and trading.
Members have access to an extensive videotapelibrary, and are offered discounts on books andon various technical, psychology and trading courses.
The ATAA offers a Diploma in Technical Analysisto members who pass the required courses, which arerun in association with the Securities Instituteof Australia.
The ATAA web site (www.ataa.com.au) publishesinformation for members and other matters of generalinterest to technical analysts, including articles anda comprehensive list of links to other web sites.Meeting details are updated each month.
Members are mailed a monthly Newsletter, whichcontains detailed information about ATAA meetingsand other news.
Meetings are held monthly in the evening in Adelaide,Brisbane, Canberra, Melbourne, Perth, Sydney andToowoomba and on Saturdays in Newcastle. Somecities do not hold a meeting in December. Meetingsare held regularly each month in or near the thirdweek, depending upon availability of speakers.
Entry to meetings is free to members who may attendmeetings in any city. Visitors may attend one meetingfree and after that they are charged $20 per meetingin Brisbane, Melbourne and Sydney and $15 in theother cities. A visitor who joins within a monthof paying for a meeting may deduct that paymentfrom their initial subscription.
Membership is open to anyone using technicalanalysis for their trading decisions or learning howto do so. To join, complete the application form on theprevious page, and mail it to The Secretary, AustralianTechnical Analysts Association, GPO Box 2774,Sydney NSW 2001.
For information call or fax the Assistant to theSecretary, Anna Vozzo on (02) 9667 0983, or, in othercities, any of the local committee members listedinside the front cover of this Journal.
Correspondence may be addressed to:
The Secretary, ATAA, GPO Box 2774,Sydney NSW 2001
or email [email protected]