Embed Size (px)
Citation preview

Market UpdateSeptember Quarter
14 November 2016
Mission:
To be a leading
player in the
global online
classifieds
industry
For
per
sona
l use
onl
y

Page 1
This presentation includes “forward-looking statements.” These can be identified by words such as “may”, “should”, “anticipate”, “believe”, “intend”,“estimate” and “expect”. Statements which are not based on historic or current facts may be forward-looking statements.
Forward-looking statements are based on assumptions regarding Mitula Group’s financial position, business strategies, plans and objectives of
management for future operations and development and the environment in which Mitula Group will operate.
Forward-looking statements are based on current views, expectations and beliefs as at the date they are expressed and which are subject to
various risks and uncertainties. Actual results, performance or achievements of Mitula Group could be materially different from those expressed in,
or implied by, these forward-looking statements. The forward-looking statements contained in this presentation are not guarantees or assurances offuture performance and involve known and unknown risks, uncertainties and other factors, many of which are beyond the control of Mitula Group,
which may cause the actual results, performance or achievements of Mitula Group to differ materially from those expressed or implied by the
forward-looking statements. For example, the factors that are likely to affect the results of Mitula Group include general economic conditions in
Australia; exchange rates; competition in the markets in which Mitula Group does and will operate and the inherent regulatory risks in the
businesses of Mitula Group. The forward-looking statements contained in this presentation should not be taken as implying that the assumptions on
which the projections have been prepared are correct or exhaustive.
Mitula Group disclaims any responsibility for the accuracy or completeness of any forward-looking statement. Mitula Group disclaims anyresponsibility to update or revise any forward-looking statement to reflect any change in Mitula Group’s financial condition, status or affairs or any
change in the events, conditions or circumstances on which a statement is based, except as required by law.
The projections or forecasts included in this presentation have not been audited, examined or otherwise reviewed by the independent auditors of
Mitula Group. Unless otherwise stated, all amounts are based on A-IFRS and are in Australian Dollars. Certain figures may be subject to rounding
differences. Any market share information in this presentation is based on management estimates based on internally available information unless
otherwise indicated.
You must not place undue reliance on these forward-looking statements.
This presentation is not an offer or invitation for subscription or purchase of, or a recommendation of securities. The securities referred to in these
materials have not been and will not be registered under the United States Securities Act of 1933 (as amended) and may not be offered or sold in
the United States absent registration or an exemption from registration.
This presentation is unaudited.
Important Notice and Disclaimer
November 2016 Analyst Presentation
For
per
sona
l use
onl
y

Page 2
High Growth Global Online Classifieds CompanyIntroducing Mitula Group
November 2016 Analyst Presentation
Note: Prepared on a statutory basis. Lokku Limited acquired 8 May 2015, Nuroa acquired 28 February 2016, and DotProperty acquired 2 September 2016. Revenue projection does not include any M&A outcomes and EBITDA includes costs any associated with IPO, share based payments and M&A work.
Source: Internal Management Reports.
0.0
5.0
10.0
15.0
20.0
25.0
30.0
35.0
40.0
45.0
CY 2012 CY 2013 CY 2014 CY 2015 CY 2016
(fcst)
CY 2017
(fcst)
AU
D M
illio
ns $38.0m -
$41.0m
$28.0m -$29.0m
$3.8m
$5.3m
$10.7m
$20.6m
• Leading online classifieds
company operating in 49 countries
• Diversified across four verticals:
property, employment, motoring,
fashion; generating more than 70
million monthly visits
• High calibre management and
board with decades of online
classifieds experience
• Consistent revenue growth, high-
margin, generating strong positive
cash flow (>A$1m/month)
• Significant opportunity for strong
growth through launch of new
products and synergistic M&A to
increase yield per visit
25.3% 35.2% 50.8% 46.8% 41.0% -
45.0%
42.0% -
46.0%
EBITDA
For
per
sona
l use
onl
y
Page 3
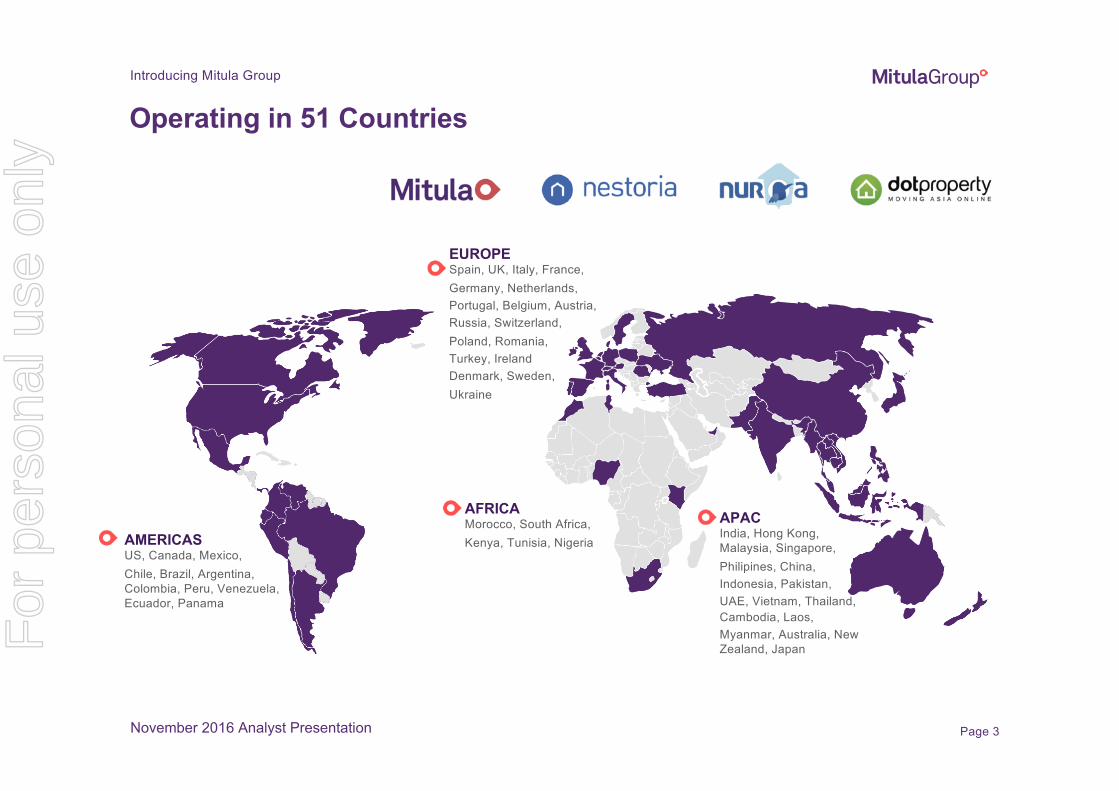
Operating in 51 Countries
EUROPESpain, UK, Italy, France,
Germany, Netherlands,
Portugal, Belgium, Austria,
Russia, Switzerland,
Poland, Romania,
Turkey, Ireland
Denmark, Sweden,
Ukraine
AMERICASUS, Canada, Mexico,
Chile, Brazil, Argentina,
Colombia, Peru, Venezuela,
Ecuador, Panama
AFRICAMorocco, South Africa,
Kenya, Tunisia, Nigeria
APACIndia, Hong Kong,
Malaysia, Singapore,
Philipines, China,
Indonesia, Pakistan,
UAE, Vietnam, Thailand,
Cambodia, Laos,
Myanmar, Australia, New
Zealand, Japan
Introducing Mitula Group
November 2016 Analyst Presentation
For
per
sona
l use
onl
y

mitulagroup.com
Business Overview
Mission:
To be a leading
player in the global online classifieds
industry
For
per
sona
l use
onl
y

Page 5
Multiple Intermediaries in the Classifieds Transaction
Vertical
Search
Po
rtal +
Ge
ne
ral C
lassifie
ds
Site
s
(Site
s w
ith lis
ting
s)
Re
cru
iter / A
ge
nt / D
ea
ler
/
Pro
ject M
ark
ete
r Site
s
~20,000 agents /
developers
~100 portals / general
classifieds / specialist
sites
<5 main vertical
search sites
Se
llers
of C
ars
/ Jo
bs /
Ho
me
s / F
ash
ion
Bu
ye
rs
November 2016 Analyst Presentation
Business Overview
General
Search
Italian Real Estate
Example
Traditional Focus of Mitula Group in Red
For
per
sona
l use
onl
y

Page 6
Revenue Generation in the Classifieds Transaction
Trans-
action
(Commission)
Listings
Display
Advertising
Software
ClicksCPC / AdSense
Display
Advertising
November 2016 Analyst Presentation
Business Overview
Revenue Streams
Revenue Potential within a Given Market
x1 x10+ x100+ ILLUSTRATIVE
Traditional Focus of Mitula Group in Red
Vertical
Search
Po
rtal +
Ge
ne
ral C
lassifie
ds
Site
s
(Site
s w
ith lis
ting
s)
Re
cru
iter / A
ge
nt / D
ea
ler
/
Pro
ject M
ark
ete
r
Se
llers
of C
ars
/ Jo
bs /
Ho
me
s / F
ash
ion
Bu
ye
rs
General
Search
For
per
sona
l use
onl
y

Page 7
Business Overview
How Vertical Search WorksListings from
advertiser sent to
Mitula
1
2
3
4
5
User makes
a search
request
User reviews search
results and clicks
AdSense or listing
User clicks on AdSense
User clicks on listing and
redirected to source details
November 2016 Analyst Presentation
For
per
sona
l use
onl
y
Page 8Page 8
Business Overview
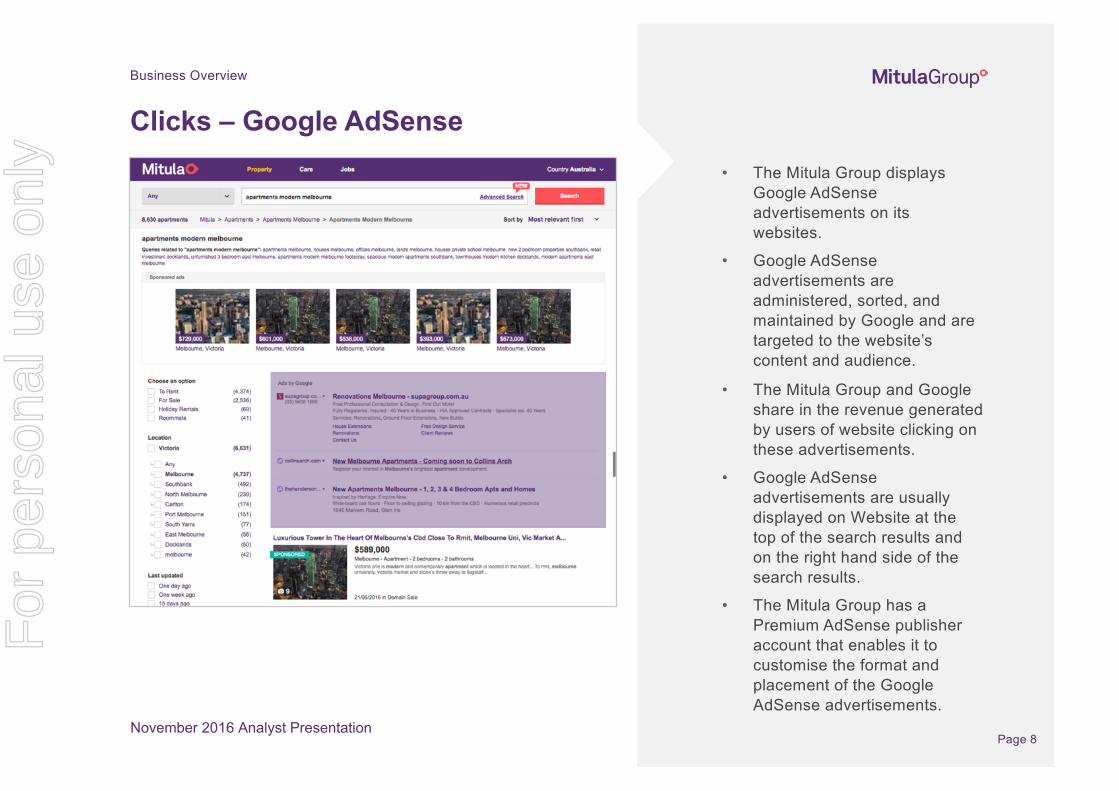
Clicks – Google AdSense• The Mitula Group displays
Google AdSense
advertisements on its
websites.
• Google AdSense
advertisements are
administered, sorted, and
maintained by Google and are
targeted to the website’s
content and audience.
• The Mitula Group and Google
share in the revenue generated
by users of website clicking on
these advertisements.
• Google AdSense
advertisements are usually
displayed on Website at the
top of the search results and
on the right hand side of the
search results.
• The Mitula Group has a
Premium AdSense publisher
account that enables it to
customise the format and
placement of the Google
AdSense advertisements.
November 2016 Analyst Presentation
For
per
sona
l use
onl
y

Page 9Page 9
Business Overview
Clicks – Cost per Click (CPC)• The Mitula Group displays
advertisers’ listings on its websites,
initially free of charge. Those
listings may only receive a limited
number of click outs.
• If an advertiser would like to receive
more click outs than the limited
number provided free of charge, the
advertiser must pay the Mitula
Group, on a ‘cost-per-click’ basis, to
receive those additional click outs.
This is referred to as Direct CPC
Revenue, contributed by a paying
advertiser.
• The amount paid per click out by a
paying advertiser varies by vertical
(real estate, employment, motoring)
and by country.
November 2016 Analyst Presentation
For
per
sona
l use
onl
y

Page 10
Segmentation of Mitula Group Markets
Yield per Visit for Mitula Group
Visits to Mitula Group Sites in the Country
Tier 1 – Established Markets
• Mature countries with clear online classifieds structure (portals and general classified sites)
• Major and minor players invest in marketing (brand building and traffic generation)
• Vertical search seen as a legitimate source of traffic
• Mitula monetising well with clear growth potential
• Example: UK, AU, UAE, DE, FR
Tier 3 – Early Stage Markets
• No clear online classifieds structure
• Rapid growth but off a low base
• Long term potential
• Mitula not monetising beyond AdSense
• Example: PK, NG, KE
Tier 2 – Emerging Markets
• Strong growth countries
• Online classifieds structure not settled
• Vertical search material source of traffic
• Mitula slow to monetise
• Example: MX, PH, CO, BR, ID
November 2016 Analyst Presentation
Business Overview
For
per
sona
l use
onl
y

Page 11
Value Creation by Segment (September Quarter)
Visits (m)
Clicks (m)
% Tier Clicks Sold
Revenue (AUD 000’s)
Yield/ Visit
(c)Strategic Implications
Tier 1
Established
Markets
56.1 78.7 65.7% 3,386 6.0
• Stable driver of revenues
• Focus on growing visitation as
able to sell majority of clicks
• Roll out of additional products
and services to existing
customers
• Find ways of selling more
clicks (up to around 80%)
Tier 2Emerging Markets
133.3 185.6 33.4% 3,529 2.6
• Value being “left of the table”
• Low yield per visit driven by low number of clicks sold & lower CPC rate
• Look for new ways to monetise visitation and increase yield per visit
Tier 3
Early Stage12.2 14.8 27.0% 310 2.5
• No real short term value for
Mitula Group
• Allow to grow naturally and
revisit if / when scale achieved
Source: Internal Management Reports (Sep Quarter 2016)
November 2016 Analyst Presentation
Focus on driving
new methods of
increasing yield per visit –
primarily around
greater sale of
direct to end
customer products
Business Overview
For
per
sona
l use
onl
y

Page 12
Strategic Approach for Mitula Group
November 2016 Analyst Presentation
Business Overview
Listings
Display
Advertising
Software
ClicksCPC/AdSense
Display
Advertising
Revenue Streams
Tier 1Tier 2 Markets
New Focus of Mitula Group in
Red
Vertical
Search
Po
rtal +
Ge
ne
ral C
lassifie
ds
Site
s
(Site
s w
ith lis
ting
s)
Re
cru
iter / A
ge
nt / D
ea
ler
/
Pro
ject M
ark
ete
r
Se
llers
of C
ars
/ Jo
bs /
Ho
me
s / F
ash
ion
Bu
ye
rs
General
Search
Trans-
action
(Commission)
For
per
sona
l use
onl
y
Page 13
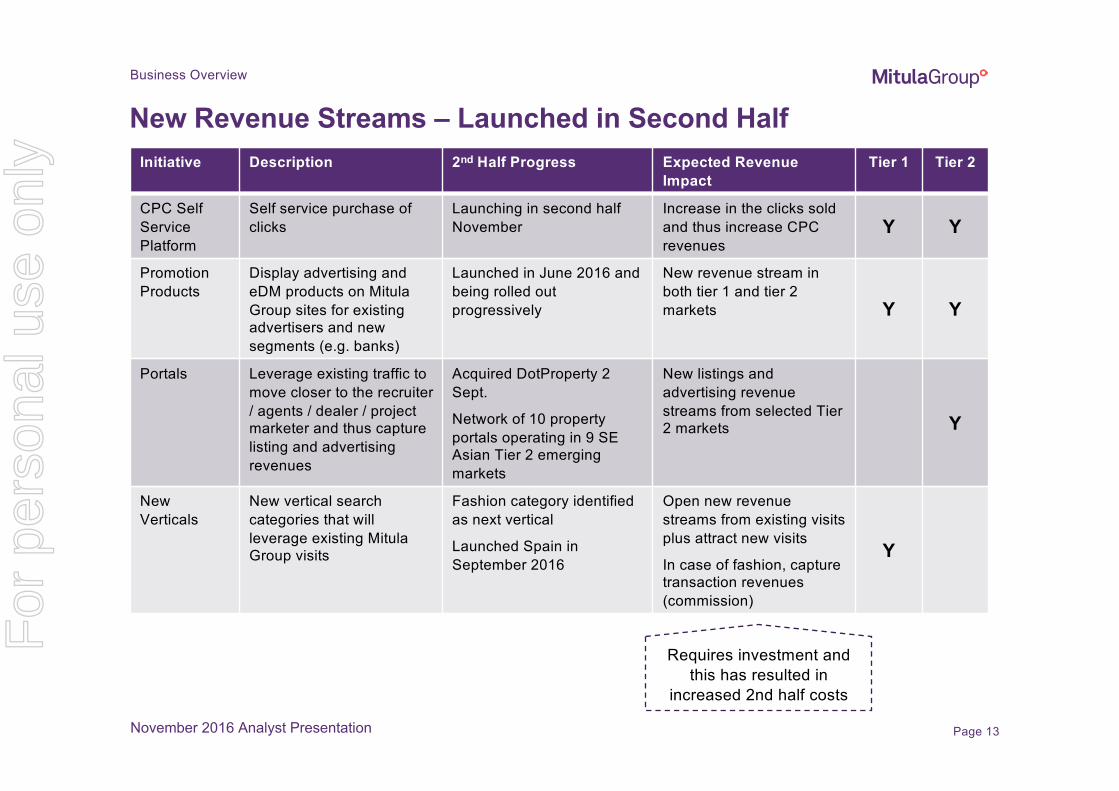
New Revenue Streams – Launched in Second Half
November 2016 Analyst Presentation
Initiative Description 2nd Half Progress Expected Revenue Impact
Tier 1 Tier 2
CPC Self
Service
Platform
Self service purchase of
clicks
Launching in second half
November
Increase in the clicks sold
and thus increase CPC
revenues
Y Y
Promotion
Products
Display advertising and
eDM products on Mitula
Group sites for existing
advertisers and new
segments (e.g. banks)
Launched in June 2016 and
being rolled out
progressively
New revenue stream in
both tier 1 and tier 2
markets Y Y
Portals Leverage existing traffic to
move closer to the recruiter
/ agents / dealer / project
marketer and thus capture
listing and advertising
revenues
Acquired DotProperty 2
Sept.
Network of 10 property
portals operating in 9 SE
Asian Tier 2 emerging
markets
New listings and
advertising revenue
streams from selected Tier
2 markets Y
New
Verticals
New vertical search
categories that will
leverage existing Mitula
Group visits
Fashion category identified
as next vertical
Launched Spain in
September 2016
Open new revenue
streams from existing visits
plus attract new visits
In case of fashion, capture
transaction revenues
(commission)
Y
Business Overview
Requires investment and
this has resulted in
increased 2nd half costs
For
per
sona
l use
onl
y
mitulagroup.com
September QuarterPerformance
Mission:
To be a leading
player in the global online classifieds
industry
For
per
sona
l use
onl
y

Page 15
Note: Prepared on a statutory basis. Lokku Limited acquired on 8 May 2015, Nuroa on 28 February 2016 and DotProperty acquired 2 September 2016.
Source: Internal Management Reports.
0.0
1.0
2.0
3.0
4.0
5.0
6.0
7.0
8.0
Mar-14 Jun-14 Sep-14 Dec-14 Mar-15 Jun-15 Sep-15 Dec-15 Mar-16 Jun-16 Sep-16
AU
D M
illio
ns
CPC AdSense New Products
Quarterly Revenue Growth20.5% Year on Year
Revenue Growth
$7.2 m$6.0 m
September Quarter Performance
November 2016 Analyst Presentation
For
per
sona
l use
onl
y

Page 16
Quarterly Revenue by Product
AUD 000’s Sep 2016 Quarter
Sep 2015 Quarter Growth
AdSense 2,643 1,992 32.7%
Cost-per-Click 4,165 4,004 4.0%
New Products(1) 417 0 n/a
Totals 7,225 5,996 20.5%
Tier 1 CPC revenues grew
at 15.8% year on year
Tier 2 CPC revenues
decreased by 8.0% year
on year due to a tightening
of marketing spend by
customers
In addition, currency
movements had a negative
impact (see appendix p32)
(1) New products commenced launch in June 2016. These include promotion products on Mitula Group sites, listings and promotion products on DotProperty sites, transaction revenue on the fashion vertical, and data products across the Group.
Note: Prepared on a statutory basis. Lokku Limited acquired on 8 May 2015, Nuroa on 28 February 2016 and DotProperty on 2 September 2016.
Source: Internal Management Reports.
November 2016 Analyst Presentation
September Quarter Performance
For
per
sona
l use
onl
y
Page 17
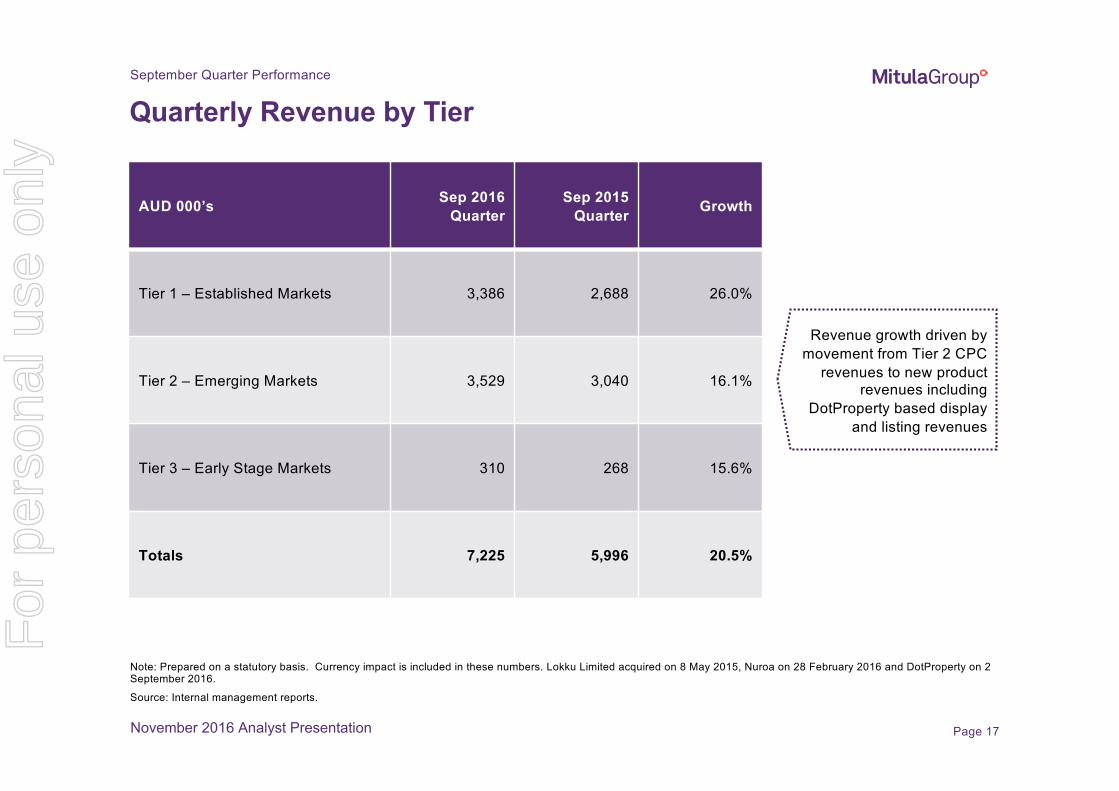
Quarterly Revenue by Tier
AUD 000’s Sep 2016 Quarter
Sep 2015 Quarter Growth
Tier 1 – Established Markets 3,386 2,688 26.0%
Tier 2 – Emerging Markets 3,529 3,040 16.1%
Tier 3 – Early Stage Markets 310 268 15.6%
Totals 7,225 5,996 20.5%
Revenue growth driven by
movement from Tier 2 CPC
revenues to new product
revenues including
DotProperty based display
and listing revenues
Note: Prepared on a statutory basis. Currency impact is included in these numbers. Lokku Limited acquired on 8 May 2015, Nuroa on 28 February 2016 and DotProperty on 2 September 2016.
Source: Internal management reports.
September Quarter Performance
November 2016 Analyst Presentation
For
per
sona
l use
onl
y
Page 18
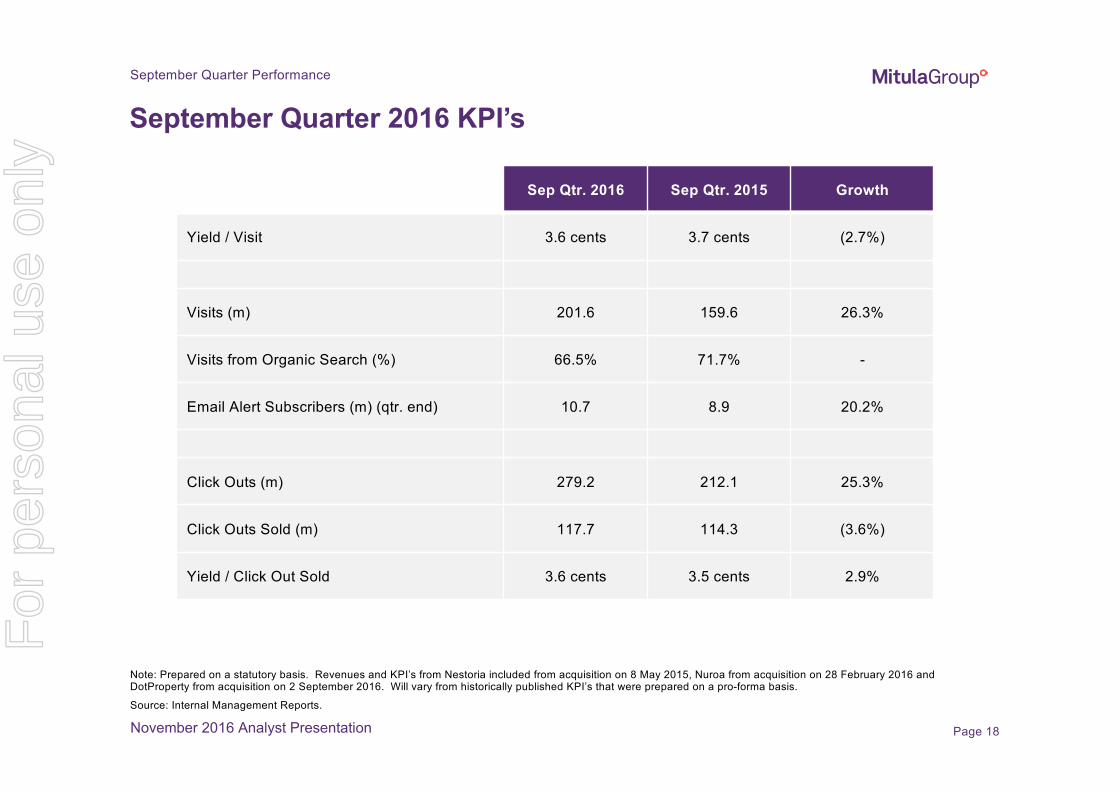
Note: Prepared on a statutory basis. Revenues and KPI’s from Nestoria included from acquisition on 8 May 2015, Nuroa from acquisition on 28 February 2016 and DotProperty from acquisition on 2 September 2016. Will vary from historically published KPI’s that were prepared on a pro-forma basis.
Source: Internal Management Reports.
September Quarter 2016 KPI’s
Sep Qtr. 2016 Sep Qtr. 2015 Growth
Yield / Visit 3.6 cents 3.7 cents (2.7%)
Visits (m) 201.6 159.6 26.3%
Visits from Organic Search (%) 66.5% 71.7% -
Email Alert Subscribers (m) (qtr. end) 10.7 8.9 20.2%
Click Outs (m) 279.2 212.1 25.3%
Click Outs Sold (m) 117.7 114.3 (3.6%)
Yield / Click Out Sold 3.6 cents 3.5 cents 2.9%
September Quarter Performance
November 2016 Analyst Presentation
For
per
sona
l use
onl
y

Page 19
Yield per Visit (Quarterly)
0.000
0.005
0.010
0.015
0.020
0.025
0.030
0.035
0.040
0.045
AU
D c
en
ts
Note: Prepared on a statutory basis. Revenues and visits from Nestoria included from acquisition on 8 May 2015, Nuroa from acquisition on 28 February 2016 and DotProperty from acquisition on 2 September 2016.
Source: Internal Management Reports.
0.0
1.0
2.0
3.0
4.0
5.0
6.0
7.0
8.0
AU
D M
illio
ns
0.0
20.0
40.0
60.0
80.0
100.0
120.0
140.0
160.0
180.0
200.0
millio
ns
Revenue
Visits
Yield per visit
September Quarter Performance
November 2016 Analyst Presentation
For
per
sona
l use
onl
y
Page 20
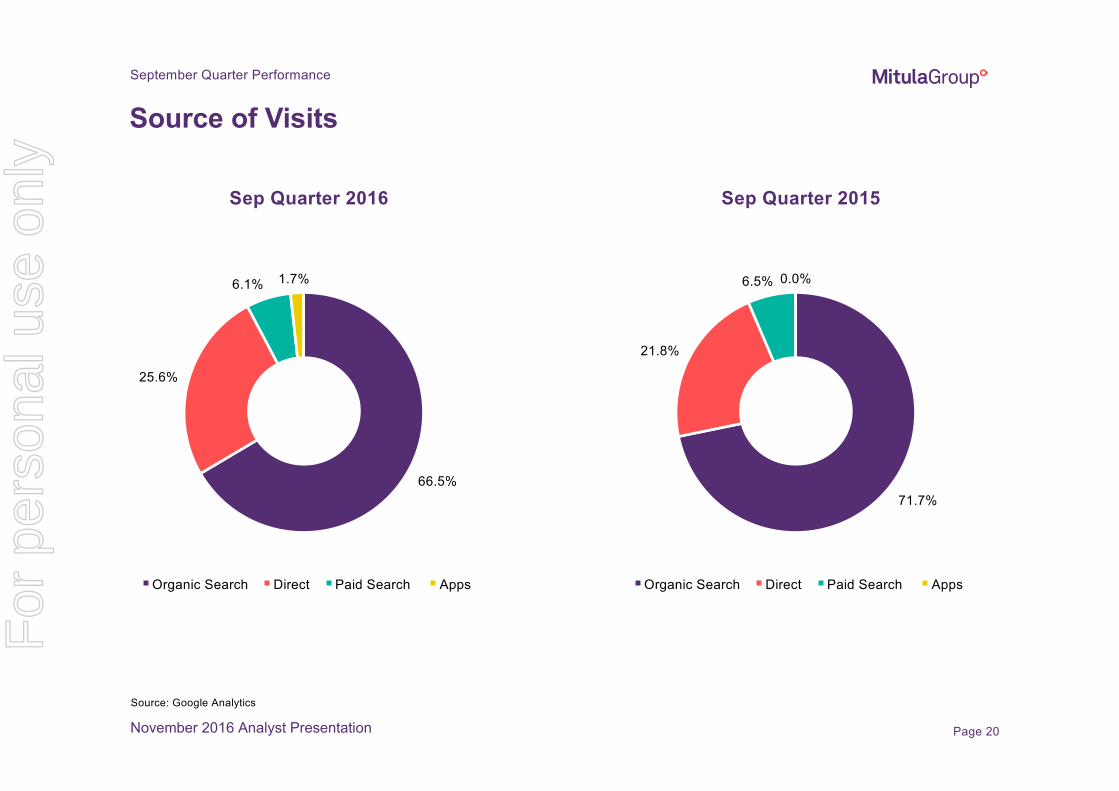
Source: Google Analytics
Source of Visits
Sep Quarter 2016
71.7%
21.8%
6.5% 0.0%
Organic Search Direct Paid Search Apps
Sep Quarter 2015
66.5%
25.6%
6.1% 1.7%
Organic Search Direct Paid Search Apps
September Quarter Performance
November 2016 Analyst Presentation
For
per
sona
l use
onl
y
Page 21
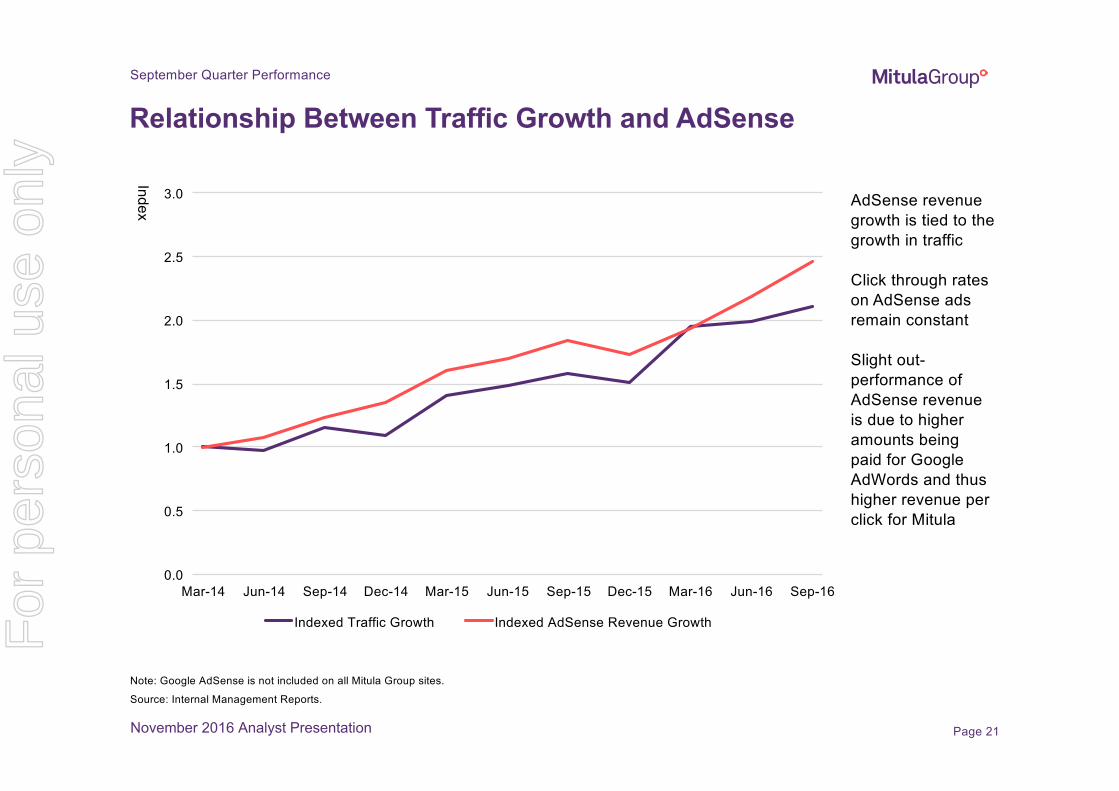
Relationship Between Traffic Growth and AdSense
Note: Google AdSense is not included on all Mitula Group sites.
Source: Internal Management Reports.
September Quarter Performance
November 2016 Analyst Presentation
0.0
0.5
1.0
1.5
2.0
2.5
3.0
Mar-14 Jun-14 Sep-14 Dec-14 Mar-15 Jun-15 Sep-15 Dec-15 Mar-16 Jun-16 Sep-16
Indexed Traffic Growth Indexed AdSense Revenue Growth
AdSense revenue
growth is tied to the
growth in traffic
Click through rates
on AdSense ads
remain constant
Slight out-
performance of
AdSense revenue
is due to higher
amounts being
paid for Google
AdWords and thus
higher revenue per
click for Mitula
Ind
ex
For
per
sona
l use
onl
y

Page 22
0.0
50.0
100.0
150.0
200.0
250.0
300.0
millio
ns
Click Outs Generated and Sold (Quarterly)31.6% vs
PCP
Growth
Note: All numbers prepared on a statutory basis. Clicks generated and sold from Nestoria included from acquisition on 8 May 2015 and Nuroa from acquisition on 28 February 2016.
Source: Internal Management Reports.
0.0
20.0
40.0
60.0
80.0
100.0
120.0
140.0
millio
ns
3.1% vs
PCP
Growth
Click Outs Generated Click Outs Sold
Sep 163.6 cents per
click sold
Sep 153.5 cents per
click sold
2.9%
Growth
September Quarter Performance
November 2016 Analyst Presentation
For
per
sona
l use
onl
y

Page 23
New Revenue Streams – Progress and Impact on BusinessSeptember Quarter Performance
November 2016 Analyst Presentation
Initiative Progress September Quarter Impact
CPC Self Service
Platform
Expected to launch in second half
November
Additional costs incurred by the business during the build out
of the self service platform
No revenues generated as not launched in September
quarter
Promotion
Products
Initial products launched in June and
being refined
Sales and marketing approach being
rolled out
Generated approximately 50% of the new product revenues
in the September quarter
Additional costs (vs first half) were incurred as product
development continued and promotion was rolled out
DotProperty
Acquisition
DotProperty growing inline with
business plan
Mitula implementing traffic sharing
initiatives to help accelerate growth
Generated approximately 50% of the new product revenues
in September quarter
Added additional costs to the business as it operated at an
EBTIDA loss in September
Fashion Vertical Launched Spain in September 2016
Commencing cross platform marketing
Initial revenue streams emerging
Initial, but small, revenues generated in September quarter
Costs being incurred as still in the set up phase
Overall impact has been an increase in operating
costs to fund new revenue stream development
and thus a reduction in EBITDA margin from the
first half. This will continue into the December
quarter.
For
per
sona
l use
onl
y

mitulagroup.com
Outlook Mission:
To be a leading
player in the global online classifieds
industry
For
per
sona
l use
onl
y

Page 25
CY 2016 Revenue Forecast
AUD 000’sCY16
1st Half(Actual)
CY162nd Half
(Forecast)
CY16Total
(Forecast)
CY15Total
(Actual)
Annual Growth
(Forecast)
CY15 2nd Half (Actual)
Half Year Growth
(Forecast)
Revenue (High) 13,587 15,413 29,000 20,568 41.0% 11,670 32.1%
Revenue (Low) 13,587 14,413 28,000 20,568 36.1% 11,670 23.5%
Source: Internal Management Reports
November 2016 Analyst Presentation
Outlook
For
per
sona
l use
onl
y

Page 26
Outlook
For display purposes, uses mid point data for Dec 2016 quarter forecast of between $6.8 m and $7.8 m in revenues.
Source: Internal Management Reports.
0.0
1.0
2.0
3.0
4.0
5.0
6.0
7.0
8.0
9.0
Mar-14 Jun-14 Sep-14 Dec-14 Mar-15 Jun-15 Sep-15 Dec-15 Mar-16 Jun-16 Sep-16 Dec-16
(fcst)
CPC AdSense Advertising/Listing
Quarterly Revenue Growth – December Quarter Forecast
Forecast 19.3% -
36.8% PCP
Revenue Growth
November 2016 Analyst Presentation
AU
D M
illion
s
Driven by a
combination of new
promotion revenues
on Mitula Group sites
+ DotProperty Group
revenues
$5.7m $6.8m-$7.8m
Expected CPC
revenues to return to
previous levels driven
by launch of self
service platform and
a strengthening of
the CPC market
For
per
sona
l use
onl
y
Page 27
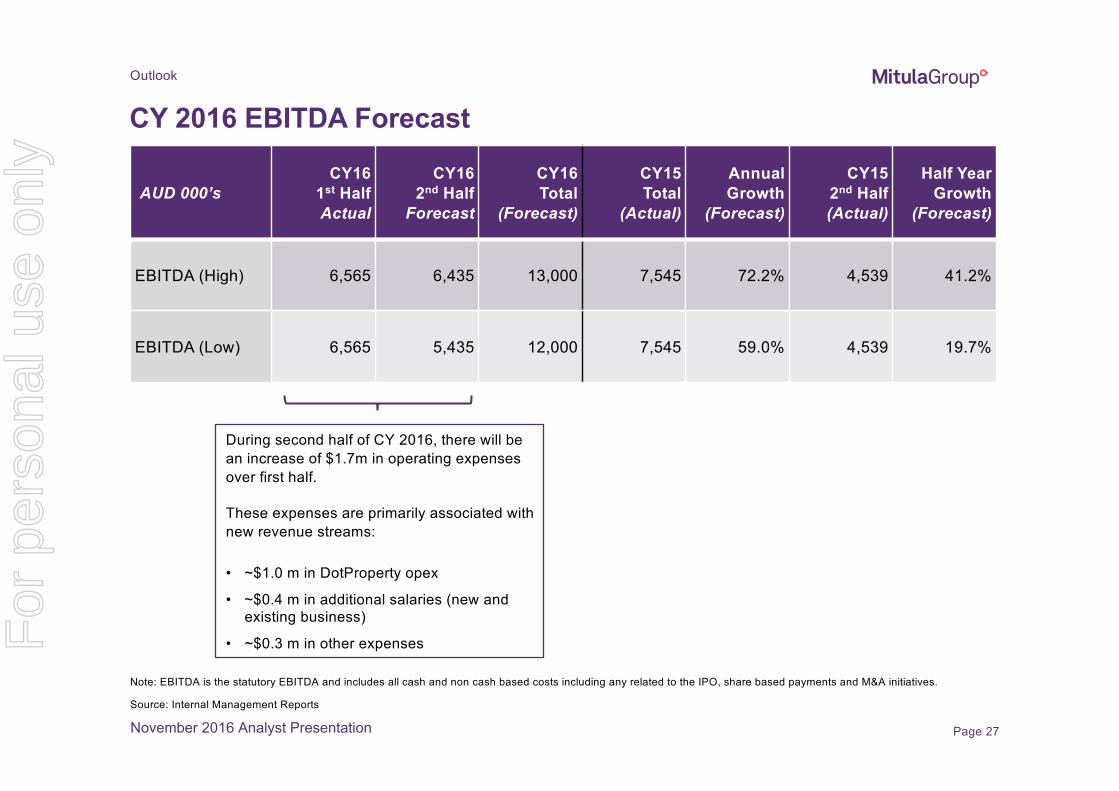
CY 2016 EBITDA Forecast
AUD 000’sCY16
1st HalfActual
CY162nd HalfForecast
CY16Total
(Forecast)
CY15Total
(Actual)
Annual Growth
(Forecast)
CY15 2nd Half (Actual)
Half Year Growth
(Forecast)
EBITDA (High) 6,565 6,435 13,000 7,545 72.2% 4,539 41.2%
EBITDA (Low) 6,565 5,435 12,000 7,545 59.0% 4,539 19.7%
November 2016 Analyst Presentation
Note: EBITDA is the statutory EBITDA and includes all cash and non cash based costs including any related to the IPO, share based payments and M&A initiatives.
Source: Internal Management Reports
During second half of CY 2016, there will be
an increase of $1.7m in operating expenses
over first half.
These expenses are primarily associated with
new revenue streams:
• ~$1.0 m in DotProperty opex
• ~$0.4 m in additional salaries (new and
existing business)
• ~$0.3 m in other expenses
Outlook
For
per
sona
l use
onl
y

Page 28
Outlook
Note: Prepared on a statutory basis. Lokku Limited acquired 8 May 2015, Nuroa acquired 28 February 2016, and DotProperty acquired 2 September 2016. Revenue projection does not include any M&A outcomes and EBITDA includes any costs associated with IPO, share based payments and M&A initiatives.
Source: Internal Management Reports.
0.0
5.0
10.0
15.0
20.0
25.0
30.0
35.0
40.0
45.0
CY 2012 CY 2013 CY 2014 CY 2015 CY 2016 (fcst) CY 2017 (fcst)
AU
D M
illio
ns
Annual Revenue Growth – CY 2017 Guidance
$38.0m -$41.0m
$28.0m -$29.0m
November 2016 Analyst Presentation
EBITDA
expected to be
between
$17.0m and
$19.0m for
CY 2017
$3.8m$5.3m
$10.7m
$20.6m
For
per
sona
l use
onl
y

mitulagroup.com
Appendix
Mission:
To be a leading
player in the global online classifieds
industry
For
per
sona
l use
onl
y
Page 30
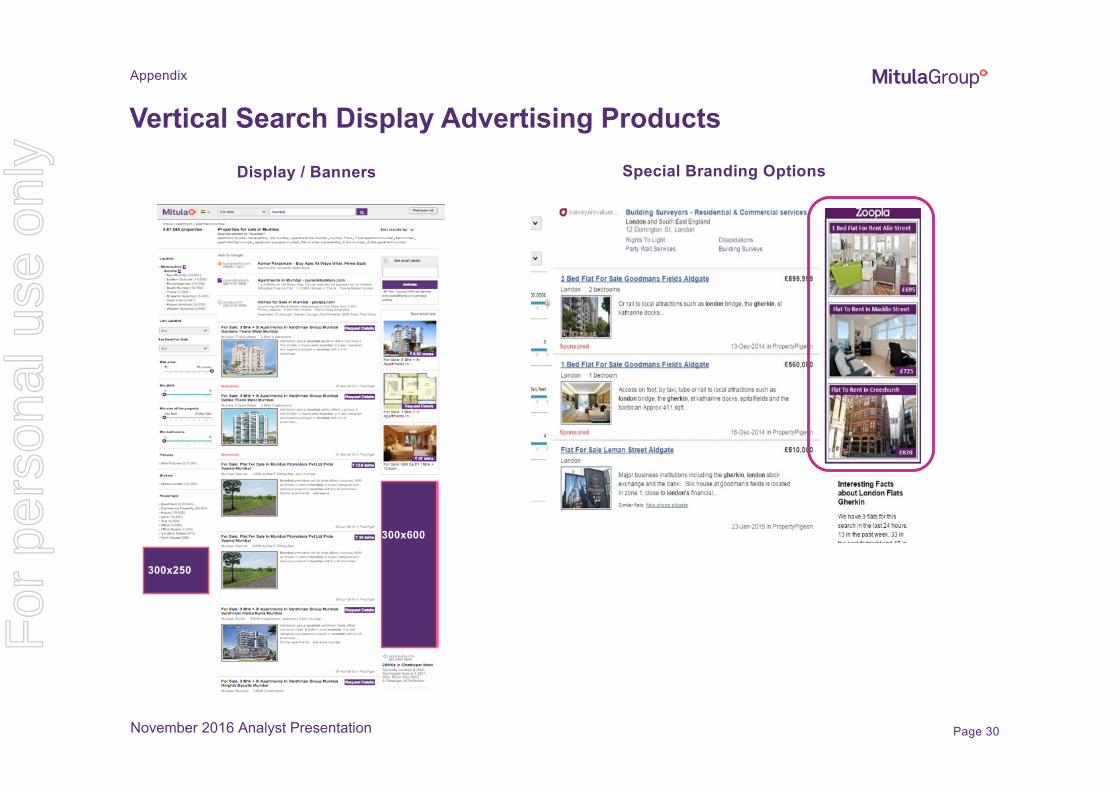
Vertical Search Display Advertising ProductsSpecial Branding Options
300x600
300x250
Display / Banners
Appendix
November 2016 Analyst Presentation
For
per
sona
l use
onl
y
Page 31
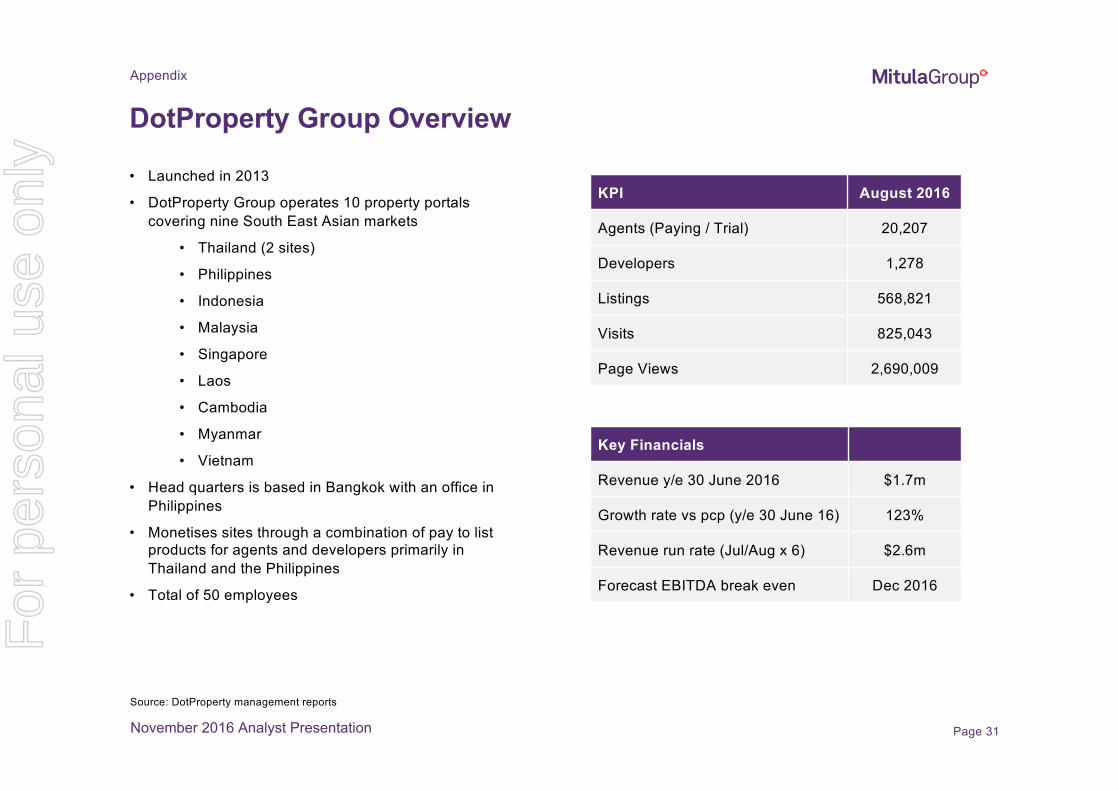
DotProperty Group Overview
• Launched in 2013
• DotProperty Group operates 10 property portals
covering nine South East Asian markets
• Thailand (2 sites)
• Philippines
• Indonesia
• Malaysia
• Singapore
• Laos
• Cambodia
• Myanmar
• Vietnam
• Head quarters is based in Bangkok with an office in
Philippines
• Monetises sites through a combination of pay to list
products for agents and developers primarily in
Thailand and the Philippines
• Total of 50 employees
KPI August 2016
Agents (Paying / Trial) 20,207
Developers 1,278
Listings 568,821
Visits 825,043
Page Views 2,690,009
Key Financials
Revenue y/e 30 June 2016 $1.7m
Growth rate vs pcp (y/e 30 June 16) 123%
Revenue run rate (Jul/Aug x 6) $2.6m
Forecast EBITDA break even Dec 2016
Source: DotProperty management reports
November 2016 Analyst Presentation
Appendix
For
per
sona
l use
onl
y

Page 32
Appendix
Currency Impact on Revenues
Note: Constant currency approach based on using a constant set of currency exchange rates for the complete period rather than monthly average exchange rates. The Mitula Group does not undertake any currency hedging
Source: Internal Management Information.
November 2016 Analyst Presentation
AUD 000’s Sep 2016 Quarter
Sep 2015 Quarter Growth
Revenues (Actual Currency) 7,225 5,996 20.5%
Revenues (Constant Currency) 7,560 5,996 26.1%
Negative exchange rate
movements resulted in
a decrease in year on
year growth of 5.6
percentage points
For
per
sona
l use
onl
y
Page 33
Appendix
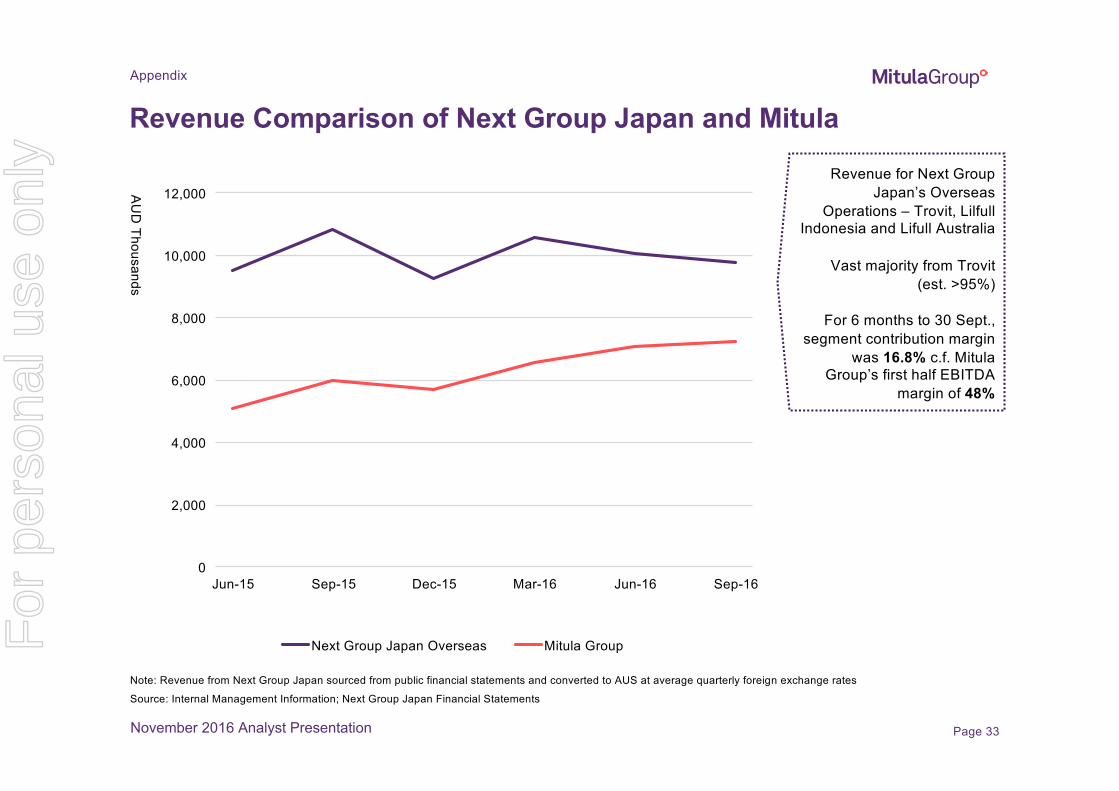
Revenue Comparison of Next Group Japan and Mitula
Note: Revenue from Next Group Japan sourced from public financial statements and converted to AUS at average quarterly foreign exchange rates
Source: Internal Management Information; Next Group Japan Financial Statements
November 2016 Analyst Presentation
0
2,000
4,000
6,000
8,000
10,000
12,000
Jun-15 Sep-15 Dec-15 Mar-16 Jun-16 Sep-16
Next Group Japan Overseas Mitula Group
AU
D T
ho
usa
nd
s
Revenue for Next Group
Japan’s Overseas
Operations – Trovit, Lilfull
Indonesia and Lifull Australia
Vast majority from Trovit
(est. >95%)
For 6 months to 30 Sept.,
segment contribution margin
was 16.8% c.f. Mitula
Group’s first half EBITDA
margin of 48%
For
per
sona
l use
onl
y

Gonzalo del Pozo
CEO
Contact us
HQ:
Mitula Group Ltd.
Enrique Granados 6, edif. B
28224 Pozuelo de Alarcón
Madrid, Spain
+34 917 082 147
Simon Baker
Chairman
Contact us
For
per
sona
l use
onl
y
![[Pick the date] - WordPress.com · [Pick the date] [FB ADSENSE NINJA (MAGIC TRICK)] [Pick the date] Surefire Way To Make Money With Adsense | Adsense Labs ADSENSELABS.COM FB ADSENSE](https://img.pdfslide.us/doc/110x75/5ce055df88c993d22e8dc2e8/pick-the-date-pick-the-date-fb-adsense-ninja-magic-trick-pick-the.jpg)