Embed Size (px)
Citation preview
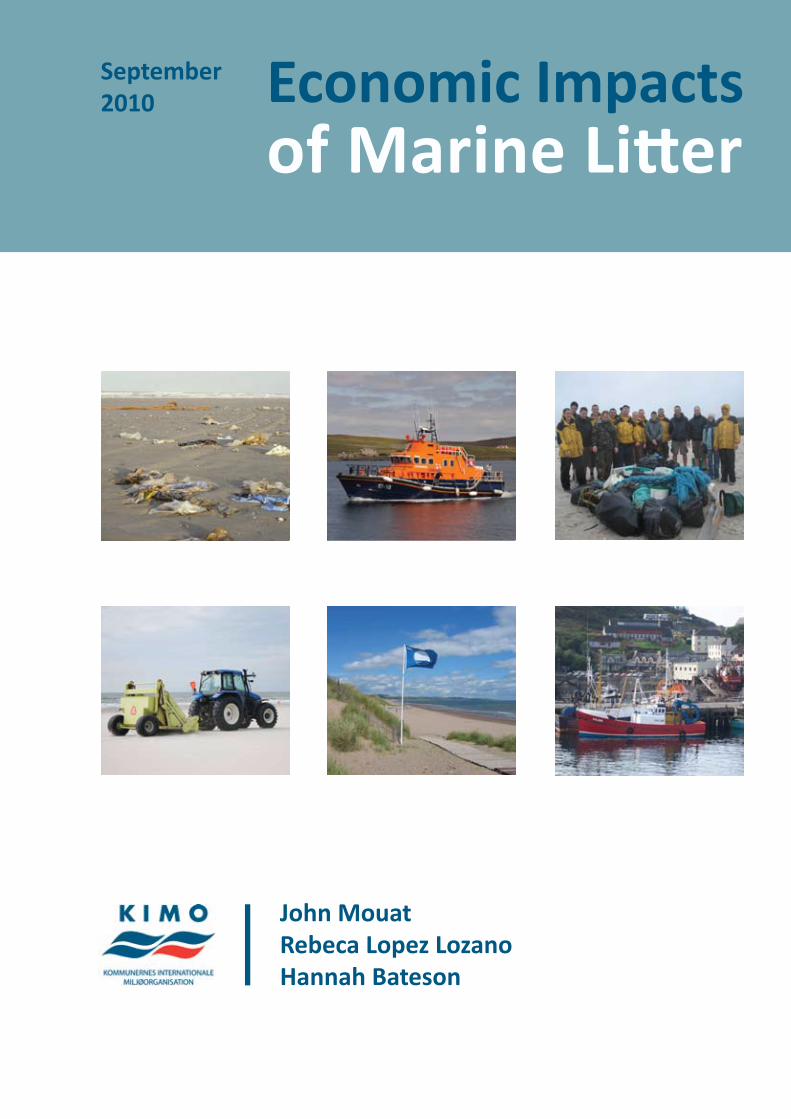
Economic Impactsof Marine Litt er
John MouatRebeca Lopez LozanoHannah Bateson
September2010

i
Economic Impacts of Marine Litt er
Acknowledgements
We would like to thank the following people for their support, assistance and advice throughout this project. In parti cular, we would like to express our grati tude to Suzanne Roberts, Coastal Campaigns Coordinator, Keep Scotland Beauti ful, Dr Kate Cole, former Secretary, Local Government Associati on Special Interest Group on Coastal Issues, Dr Sue Kinsey, Litt er Policy Offi cer, Marine Conservati on Society, all KIMO Networks andNati onal Coordinators, Ruth Henderson, Chief Executi ve, Seafood Shetland, David Sandison, General Manager, Shetland Aquaculture, Drew Ratt er, Convenor, Croft ers Commission and Mary Ross, Serving Croft ing Offi cer – Shetland, Croft ers Commission for their support in developing contacts and distributi ng questi onnaires.
This project has also benefi ted greatly from the advice and assistance provided by Hansen Black, Chief Executi ve, Shetland Fishermen’s Associati on, Carole Brown, Data and Stati sti cal Analyst, Royal Nati onal Lifeboat Insti tuti on, Valerie Carson, Campaigns Offi cer, Keep Scotland Tidy, Brian Cumming, Safety and Incidents Advisor, Briti sh Sub Aqua Club and Peter Moth, Secretary, UK Harbour Masters’ Associati on. We would like to parti cularly thank Clare Lewis, Environmental Awareness Coordinator, Council of the Isles of Scilly, Robbie Blyth, Beach and Coastal Offi cer, Fife Council, Dr Sue Kinsey, Litt er Policy Offi cer, Marine Conservati on Society, Dr Jan van Franeker, IMARES, and Suzanne Roberts, Coastal Campaigns Coordinator, Keep Scotland Beauti ful for kindly giving us permission to reproduce their photographs in this report.
This project was only possible thanks to the contributi ons made by all parti cipants and we would like to sincerely thank everybody for sharing their knowledge, informati on and enthusiasm for this research.
Cover images: Top row (L-R): Dr Jan van Franeker IMARES, © www.austi ntaylorphotography.com, Clare LewisMiddle row (L-R): © www.iStockphoto.com/matsou, Keep Scotland Beauti ful, KIMO Internati onal

ii
Economic Impacts of Marine Litt er
Executi ve Summary
Marine litt er is now present in every ocean (Cheshire et al 2009) and poses numerous threats to the marine environment. Marine litt er is defi ned as “any persistent,
manufactured or processed solid material discarded, disposed of or abandoned in the marine and coastal environment. Marine litt er consists of items that
have been made or used by people and deliberately discarded into the sea or rivers or on beaches; brought indirectly to the sea with rivers, sewage,
storm water or winds; accidentally lost, including material lost at sea in bad weather (fi shing gear, cargo); or deliberately left by people on
beaches and shores.” (UNEP 2005: 3)
Although marine litt er has received increasing att enti on in recent years, very few studies have explored the economic impact of marine litt er. Therefore, the objecti ve of this research was to investi gate the economic impact of marine litt er on coastal communiti es throughout the Northeast Atlanti c region. This study updates and extends the pilot project carried out by Hall (2000) and uses a similar methodology to examine how marine litt er aff ects key industries that rely on the marine environment. These industries include agriculture, aquaculture, fi sheries, harbours, industrial seawater users, marinas, municipaliti es, power stati ons, rescue services and voluntary organisati ons.
Municipaliti es throughout the Northeast Atlanti c region conti nue to face high costs associated with the removal of beach litt er. UK municipaliti es spend approximately €18 million each year removing beach litt er, which represents a 37% increase in cost over the past 10 years. Similarly,
removing beach litt er costs municipaliti es in the Netherlands and Belgium approximately €10.4 million per year. For most
municipaliti es, the potenti al economic impact of marine litt er on tourism provides the principal moti vati on for removing
beach litt er. In this respect, regularly removing beach litt er costs less than the potenti al reducti on in revenue that could result
from taking no acti on. The potenti al economic impact of marine litt er also provides a more powerful incenti ve for removing beach
litt er than current legislati on, parti cularly in the UK.
Voluntary organisati ons also remove a signifi cant amount of litt er from beaches and the coastline throughout the Northeast Atlanti c region. In the
UK, for instance, each volunteer contributes the equivalent of €16.23 of their ti me each year on average to removing marine litt er. Volunteer involvement in
2 of the largest clean up schemes in the UK, MCS Beachwatch and KSB Nati onal Spring Clean, is therefore worth approximately € 131,287.47, which suggests that the
total cost of voluntary acti on to remove marine litt er could be considerable.
iii
Economic Impacts of Marine Litt er
For many areas, the clean and unspoiled coastline is the principal att racti on for tourists. The organisati ons surveyed during this study were clear that marine litt er can threaten the image and reputati on of an area potenti ally leading to a decline in tourist numbers and revenue. With coastal tourism worth between €7 billion (Tourism Alliance 2007) and €11 billion (Deloitt e 2008) annually in the UK, this could have a signifi cant negati ve impact, parti cularly as tourism tends to make a disproporti onately large contributi on to coastal economies.
Fishing vessels can also experience a variety of issues due to marine litt er and of the Scotti sh vessels surveyed, 86% had experienced a restricted catch due to marine litt er, 82% had had their catch contaminated and 95% had snagged their nets on debris on the seabed. Incidents such as fouled propellers and blocked intake pipes were also relati vely common with an average of just under 1 incident reported per vessel per year. Marine litt er therefore costs the Scotti sh fi shing fl eet between €11.7 million and €13 million on average each year, which is the equivalent of 5% of the total revenue of aff ected fi sheries.
Marine litt er presents fewer problems for aquaculture producers and therefore the total cost to the aquaculture industry was comparati vely low at approximately €155,548.66 per year. The majority of costs for aquaculture producers relate to fouled propellers on workboats and while the individual cost of these incidents was high, the average cost of marine litt er was relati vely low due to the infrequent occurrence of these incidents.
Harbours and marinas remove marine litt er to ensure that their faciliti es remain clean, safe and att racti ve for users. Marine litt er costs harbours in the UK a total of €2.4 million each year with an average cost of €8,034.37 per harbour, although these costs are considerably higher for larger faciliti es and busy fi shing ports. While Spanish harbours experienced similar issues to the UK, the economic cost of marine litt er was almost 7 ti mes higher than in the UK.
The informati on provided by harbours and marinas also suggests that incidents involving vessel damage caused by marine litt er are widespread with over 70% of UK harbours and marinas reporti ng that their users had experienced incidents involving marine litt er. Fouled propellers were the most common type of incident reported but in general, incidents only occurred occasionally. The most frequently reported cause of fouled propellers was derelict fi shing gear, which suggests that this type of marine litt er can pose disproporti onately high health and safety risks.
Marine litt er therefore conti nues to pose a signifi cant navigati onal hazard to vessels in the North Atlanti c and while the safety of crew members is clearly the foremost concern in these situati ons, rescue operati ons involving the coastguard will also have fi nancial implicati ons. The rising trend in the number of rescues to vessels with fouled propellers is therefore of parti cular concern. In 2008, for example, there were 286 rescues to vessels with fouled propellers in UK waters at a cost of between €830,000 and €2,189,000.
Coastal agriculture producers experience a wide range of issues due to marine litt er including damage to property and machinery, harm to livestock and the cost of litt er removal. Marine litt er cost each croft an average of €841.10 per year and the vast majority of these costs are incurred during the removal of marine litt er, although harm to livestock and damage to machinery can result in high costs when these incidents occur. Overall, marine litt er costs the agriculture industry in Shetland approximately €252,331 per year but it is unknown how marine litt er aff ects farmers in other coastal regions.
Marine litt er clearly aff ects a wide range of industries and a case study of the Shetland Islands, in the United
iv
Economic Impacts of Marine Litt er
Kingdom, shows how these costs can aff ect one coastal community. Overall, marine litt er costs the Shetland economy between €1 million and €1.1 million on average each year. As fi shing is one of the main industries in Shetland, it bears the brunt of these costs but this is likely to vary in other coastal communiti es where industries such as tourism may be more important and thus aff ected by marine litt er to a larger extent. Since Shetland represents only a single case study, these fi ndings also suggest that the total economic impact of marine litt er on coastal communiti es in the Northeast Atlanti c region could be extremely high.
This study also investi gated the wider context of the impacts of marine litt er and in parti cular, the sensiti vity and prioriti es of various sectors as regards marine litt er. Although organisati ons stressed the importance of a clean and high quality environment, marine litt er aff ects almost 66% of the organisati ons surveyed during this project. Overall, marine litt er aff ects these organisati ons either by directly impacti ng on their core acti viti es or through the need to remove litt er, which requires additi onal resources and expenditure. The majority of organisati ons surveyed during this project also stated that absolutely no litt er was acceptable in the marine environment, although many recognised that achieving a minimal level of marine litt er is perhaps a more realisti c target. These organisati ons were therefore agreed that current levels of marine litt er are unacceptable.
Several general themes also emerged in this study and these were evident in virtually every industry surveyed. Firstly, it is clear that in the case of marine litt er, the polluter does not pay with many organisati ons forced to fi nd the resources and funds to deal with litt er caused by other parti es. Similarly, it is important to acknowledge that while many of these eff orts miti gate the short-term impact of marine litt er, they do not directly address the underlying marine litt er problem. Furthermore, marine litt er represents an additi onal and completely unnecessary cost to these organisati ons, many of which face increasing diffi culti es balancing service provision with limited funds.
This research also highlights that while the economic impact of marine litt er occurs at a local level, acti on to reduce it must be global. With marine litt er originati ng from many diff use sources, there needs to be a step change in how the problem is treated at a nati onal and internati onal level. As a starti ng point, marine litt er needs to be regarded as a pollutant on the same level as heavy metals, chemicals and oil and therefore given the same politi cal credibility.
Att enti on also needs to be given to the way we design and treat products, parti cularly those made of plasti c, with too many currently designed for one use and then thrown away. Similarly, the enforcement of litt er legislati on must be improved if the sources of marine litt er are to be signifi cantly reduced. In principle, current legislati on does much to reduce marine litt er but in practi ce, stronger networks of enforcement and signifi cant fi nes are required to realise the full potenti al of these regulati ons.
These challenges are not new but the way we address them must be if we are to signifi cantly reduce marine litt er. What is clear is that without strong acti on to tackle the sources of marine litt er, the costs associated with it will conti nue to rise.

v
Economic Impacts of Marine Litt er
ContentsAcknowledgements ..................................................................................iExecuti ve Summary ................................................................................iiContents .................................................................................................vList of Figures ..........................................................................................ixList of Tables ............................................................................................x1. Introducti on .........................................................................................12. Literature Review ................................................................................3 2.1 Types of marine litt er ...........................................................3 2.1.1 Plasti cs and syntheti c materials ......................................3 2.2 Sources of marine litt er ........................................................4 2.2.1 Land-based sources of marine litt er ...............................4 2.2.2. Ocean-based sources of marine litt er ............................5 2.3 Amount and persistence of marine litt er ..............................5 2.3.1 Amount of marine litt er ..................................................5 2.3.2 Persistence of marine litt er .............................................8 2.4 The impacts of marine litt er ..................................................9 2.4.1 Environmental impacts of marine litt er ...........................9 2.4.2 Social impacts of marine litt er .......................................13 2.4.3 Public health and safety impacts of marine litt er ..............................................................................14 2.4.4 Economic impacts of marine Litt er ...............................163. Legislati on and Policy Context ...........................................................22 3.1 Key internati onal legislati on ...............................................22 3.1.1 United Nati ons Conventi on on Oceans and the Law of the Sea (UNCLOS) ......................................22 3.1.2 Internati onal Conventi on for the Preventi on of Marine Polluti on from Ships, 1973, as modifi ed by the Protocol of 1978 relati ng thereto (MARPOL 73/78) Annex V .........................................................................22 3.1.3 London Conventi on on the Preventi on of Marine Polluti on by Dumping of Wastes and Other Matt er, 1972, and 1996 Protocol relati ng thereto ......................23 3.1.4 Other internati onal agreements ...................................23 3.2 Key European legislati on .....................................................24 3.2.1 EU Marine Strategy Framework Directi ve (2008/56/EC) ...............................................................24 3.2.2 EU Directi ve on port recepti on faciliti es for ship- generated waste and cargo residues (EC2000/59) .......24 3.2.3 Other European legislati on ..........................................25 3.3 Nati onal legislati on .............................................................254. Methodology .....................................................................................26
vi
Economic Impacts of Marine Litt er
4.1 Developing a methodology ..........................................................................................................26 4.2 Data collecti on ..............................................................................................................................27 4.3 Limitati ons ....................................................................................................................................305. Municipaliti es .............................................................................................................................................32 5.1 Introducti on ..................................................................................................................................32 5.2 United Kingdom ............................................................................................................................32 5.2.1 Beach cleansing .....................................................................................................................32 5.2.2 Beach characteristi cs and cleansing regimes..........................................................................34 5.2.3 Length of coastline where marine litt er is removed...............................................................36 5.2.4 Weight and volume of litt er collected ...................................................................................36 5.2.5 Disposal methods and litt er preventi on measures ................................................................36 5.2.6 Economic cost of beach litt er .................................................................................................37 5.3 Case study: The Netherlands and Belgium ..................................................................................41 5.3.1 Beach cleansing .....................................................................................................................41 5.3.2 Beach characteristi cs and cleansing regime ..........................................................................42 5.3.3 Length of coastline cleaned and weight of litt er removed ....................................................42 5.3.4 Disposal methods and litt er preventi on measures ................................................................43 5.3.5 Economic cost of beach litt er .................................................................................................43 5.3.6 Den Haag ...............................................................................................................................44 5.4 Additi onal Informati on .................................................................................................................44 5.5 Conclusion ....................................................................................................................................456. UK Voluntary Organisati ons ........................................................................................................................47 6.1 Introducti on ..................................................................................................................................47 6.2 Volunteer involvement and distance cleaned ..............................................................................47 6.3 Quanti ty of litt er collected and disposal ......................................................................................47 6.4 Economic cost of marine litt er ......................................................................................................48 6.4.1 External assistance .................................................................................................................48 6.4.2 Cost of volunteers’ ti me .........................................................................................................48 6.4.3 Total cost of voluntary initi ati ves ...........................................................................................49 6.5 Conclusion ....................................................................................................................................507. UK Tourism .................................................................................................................................................51 7.1 Introducti on ..................................................................................................................................51 7.2 Coastal visitors and tourist revenue .............................................................................................51 7.3 Awards and complaints ................................................................................................................51 7.4 Importance of a clean and high quality coastal environment to tourism branding .......................................................................................................................................52 7.5 Litt er preventi on and removal campaigns ....................................................................................53 7.6 Conclusion ....................................................................................................................................538. Sea Fisheries ...............................................................................................................................................54 8.1 Introducti on ..................................................................................................................................54 8.2 Scotti sh fi shing vessels .................................................................................................................54 8.2.1 Introducti on ...........................................................................................................................54 8.2.2 Common types of litt er and worst areas ...............................................................................55 8.2.3 Impact on catch and damage to nets ....................................................................................55 8.2.4 Incidents involving marine litt er ............................................................................................56 8.2.5 Economic cost of marine litt er ...............................................................................................56 8.2.6 Working practi ces ..................................................................................................................58

vii
Economic Impacts of Marine Litt er
8.3 Portuguese fi shing vessels ...........................................................................................................58 8.4 Spanish fi shing vessels .................................................................................................................59 8.5 Conclusion ....................................................................................................................................599. Scotti sh Aquaculture ..................................................................................................................................61 9.1 Introducti on ..................................................................................................................................61 9.2 Impact and types of litt er .............................................................................................................61 9.3 Time spent clearing and removing litt er .......................................................................................62 9.4 Economic cost of marine litt er ......................................................................................................62 9.5 Waste disposal and eff orts to minimise marine litt er ...................................................................63 9.6 Conclusion ....................................................................................................................................6310. Harbours and Marinas ..............................................................................................................................64 10.1 Introducti on ................................................................................................................................64 10.2 United Kingdom ..........................................................................................................................64 10.2.1 Litt er removal: dredging and manual cleansing .................................................................64 10.2.2 Incidents .............................................................................................................................65 10.2.3 Measures and campaigns to prevent marine litt er ............................................................67 10.2.4 Economic cost of marine litt er ...........................................................................................68 10.3 Case Study: Spain .......................................................................................................................69 10.3.1 Litt er removal: dredging and manual cleansing .................................................................69 10.3.2 Incidents .............................................................................................................................71 10.3.3 Measures and campaigns to prevent marine litt er ............................................................71 10.3.4 Economic cost of marine litt er ...........................................................................................71 10.4 Additi onal Informati on ...............................................................................................................72 10.5 Conclusion ..................................................................................................................................7211. Rescue Services ........................................................................................................................................75 11.1 Introducti on ................................................................................................................................75 11.2 United Kingdom ..........................................................................................................................75 11.2.1 Rescues to vessels with fouled propellers ..........................................................................75 11.2.2 Levels of danger .................................................................................................................78 11.2.3 Economic cost of rescues to vessels with fouled propellers ..............................................78 11.3 Norway .......................................................................................................................................79 11.4 Conclusion ..................................................................................................................................8012. Shetland Agricultural Industry ..................................................................................................................81 12.1 Introducti on ................................................................................................................................81 12.2 Types and levels of litt er .............................................................................................................81 12.3 Harm to livestock ........................................................................................................................82 12.4 Removal of marine litt er and damage to property .....................................................................82 12.5 Economic cost of marine litt er ....................................................................................................83 12.6 Conclusion ..................................................................................................................................8413. UK Power Stati ons, Industrial Seawater Abstractors and Water Authoriti es ...........................................85 13.1 Introducti on ................................................................................................................................85 13.2 Power Stati ons ............................................................................................................................85 13.2.1 Lerwick Power Stati on, Shetland ........................................................................................85 13.2.2 Peterhead Power Stati on, Aberdeenshire ..........................................................................85 13.2.3 Magnox North, Wylfa Site, Anglesey ..................................................................................86 13.3 Industrial seawater abstractors ..................................................................................................86 13.3.1 Problems with marine litt er ...............................................................................................86
viii
Economic Impacts of Marine Litt er
13.3.2 Debris screening and removal ............................................................................................86 13.4 Water authoriti es .......................................................................................................................87 13.4.1 Scotti sh Water ....................................................................................................................87 13.4.2 South West Water Ltd ........................................................................................................87 13.5 Conclusion ..................................................................................................................................8814. Case Study: Shetland Islands, United Kingdom ........................................................................................89 14.1 Introducti on ................................................................................................................................89 14.2 Economic cost of marine litt er ....................................................................................................89 14.3 Conclusion ..................................................................................................................................9115. Wider Context of the Impacts of Marine Litt er ......................................................................................92 15.1 Introducti on ................................................................................................................................92 15.2 Level of litt er in the local marine environment ........................................................................92 15.3 Impact of marine litt er ...............................................................................................................92 15.3.1 Organisati ons aff ected by marine litt er and types of impact ...........................................92 15.3.2 Organisati ons not aff ected by marine litt er and reasons why .........................................94 15.4 Importance of a clean and high quality marine and coastal environment ...............................94 15.5 Future sensiti vity to marine litt er .............................................................................................95 15.6 What level of litt er is acceptable in the marine and coastal environment? ............................96 15.7 Conclusion ..................................................................................................................................9716. Conclusion ................................................................................................................................................98References ....................................................................................................................................................100
ix
Economic Impacts of Marine Litt er
List of Figures
Figure 1.1 A litt ered beach in the UK. Image: © Jacki Clark, MCS ....................................................................1 Figure 2.1 Small plasti c resin pellets found on a beach. Image: Dr Jan van Franeker, IMARES ........................4Figure 2.2 Volunteers parti cipati ng in the Marine Conservati on Society’s Beachwatch scheme. Image: © Jacki Clark, MCS .............................................................................................................7Figure 2.3 The average quanti ty of marine litt er inside a fulmar’s stomach. Image: Dr Jan van Franeker, IMARES ............................................................................................................................................9Figure 2.4 Entangled seal at Gweek Seal Sanctuary in Cornwall. Image: Caroline Curti s ...............................10Figure 2.5 Microplasti cs collected using trawling equipment. Image: Dr Frederik Norén ...............................12Figure 2.6 Many municipaliti es use mechanical beach cleaners to remove beach litt er. Image: © iStockphoto/matsou ..................................................................................................................17Figure 2.7 Removing marine litt er can be costly for harbours and marinas. Image: KIMO Internati onal ......19 Figure 4.1 The impacts of marine litt er on sectors which rely on the marine environment .....................28-29Figure 5.1 Reasons why municipaliti es remove marine litt er .........................................................................32Figure 5.2 Extract from Fife Council’s Litt er Picking Procedures which outline the areas where beach litt er is to be picked. Image: Robbie Blyth, Fife Council .....................................................33 Figure 5.3 Percentage of municipaliti es remove beach litt er from each type of beach .................................34Figure 5.4 Percentage of municipaliti es which identi fi ed each group as key users of the coastline ..............35Figure 5.5 Breakdown of the average cost of marine litt er to municipaliti es .................................................38Figure 5.6 Changes in beach cleansing expenditure for municipaliti es between 2000 and 2010 ..................40Figure 5.7 Reasons why municipaliti es in the Netherlands and Belgium remove beach litt er .......................41Figure 5.8 Beach litt er collected in Ameland, the Netherlands. Image: KIMO Netherlands and Belgium .................................................................................................................................42Figure 6.1 Public beach clean organised by the Isles of Scilly AONB. Image: Clare Lewis .............................47Figure 6.2 Beach clean conducted by volunteers from 824 Squadron, RAF Culdrose. Image: Clare Lewis .....................................................................................................................................48Figure 6.3 Breakdown of the average cost of marine litt er to voluntary organisati ons .................................49Figure 7.1 The Blue Flag awards are used by municipaliti es to demonstrate that their beaches are managed to a high standard. Image: Keep Scotland Beauti ful .....................................................52Figure 7.2 Beach litt er in South West England. Image: Sarah Crosbie ............................................................53Figure 8.1 Marine litt er can result in numerous problems and high costs for fi shing vessels. Image: David Linkie .......................................................................................................................54Figure 8.2 Most common types of debris accumulati ng in hauls ...................................................................55Figure 8.3 Breakdown of the average cost of marine litt er to Scotti sh fi shing vessels ...................................57Figure 8.4 Full bags of marine litt er deposited by vessels involved in the Fishing for Litt er South West scheme. Image: Sarah Crosbie ..................................................................................58Figure 9.1 Types of litt er which aff ect aquaculture producers .......................................................................61Figure 9.2 Breakdown of the average cost of marine litt er to aquaculture producers ..................................62Figure 10.1 Most common types of litt er removed by harbours .................................................................65Figure 10.2 Frequency of fouled propellers among harbour and marina users per year ...............................66Figure 10.3 Commonly reported types of marine litt er which cause fouled propellers .................................67Figure 10.4 Most common types of recycling off ered by harbours ................................................................68Figure 10.5 Breakdown of the average cost of marine litt er to harbours in the UK .......................................69Figure 10.6 Most common types of litt er collected by Spanish harbours ......................................................70Figure 10.7 Amount of ti me spent removing marine litt er by Spanish harbours and marinas ......................70Figure 10.8 Breakdown of the average cost of marine litt er to Spanish harbours .........................................72
x
Economic Impacts of Marine Litt er
Figure 11.1 Marine litt er poses signifi cant navigati onal hazards for vessels and incidents involving marine litt er may require assistance from the emergency services. Image: © www.austi ntaylorphotography.com .......................................................................................75Figure 11.2 Types of vessel rescued by the RNLI due to a fouled propeller in 2008 ......................................76Figure 11.3 Map showing the locati on of vessels with fouled propellers att ended by the RNLI during 2008. Image: RNLI ............................................................................................................77Figure 11.4 Changes in the types and number of rescues to vessels with fouled propellers carried out by the RNLI 2002 – 2008 .......................................................................................................78Figure 11.5 Total cost of rescues carried out by the RNLI to vessels with fouled propellers 2002-2008 ........79Figure 11.6 Changes in the types and number of rescues to vessels with fouled propellers carried out by the NSSR 2002-2007.........................................................................................................80Figure 12.1 Marine litt er can accumulate on fences and result in signifi cant costs for croft ers to remove the litt er and repair the fences ......................................................................................81Figure 12.2 Types of litt er which aff ect croft ers’ land ....................................................................................81Figure 12.3 Catt le eati ng derelict fi shing net, Shetland Islands, United Kingdom. Image: John Bateson ..................................................................................................................82Figure 12.4 Breakdown of the average cost of marine litt er to croft ers .........................................................83Figure 14.1 Shetland’s Marine Litt er Bill .........................................................................................................90Figure 14.2 Breakdown of the average cost of marine litt er to Shetland .....................................................91Figure 15.1 Level of litt er in the local marine environment .........................................................................92
List of Tables
Table 2.1 Guideline esti mates of degradati on rates of selected types of litt er ................................................8Table 3.1 Polluti on types covered by MARPOL Annexes I-VI ..........................................................................23Table 4.1 Number of questi onnaires distributed per country ........................................................................27Table 4.2 Breakdown of responses in each sector ..........................................................................................30Table 5.1 Breakdown of costs to 16 municipaliti es .......................................................................................38Table 5.2 Brief summary of questi onnaires from countries where a small number of responses from municipaliti es were received .................................................................................................46Table 10.1 Brief summary of questi onnaires from countries where a small number of responses from harbours and marinas were received ...................................................................................74
1
Economic Impacts of Marine Litt er
1. Introducti on
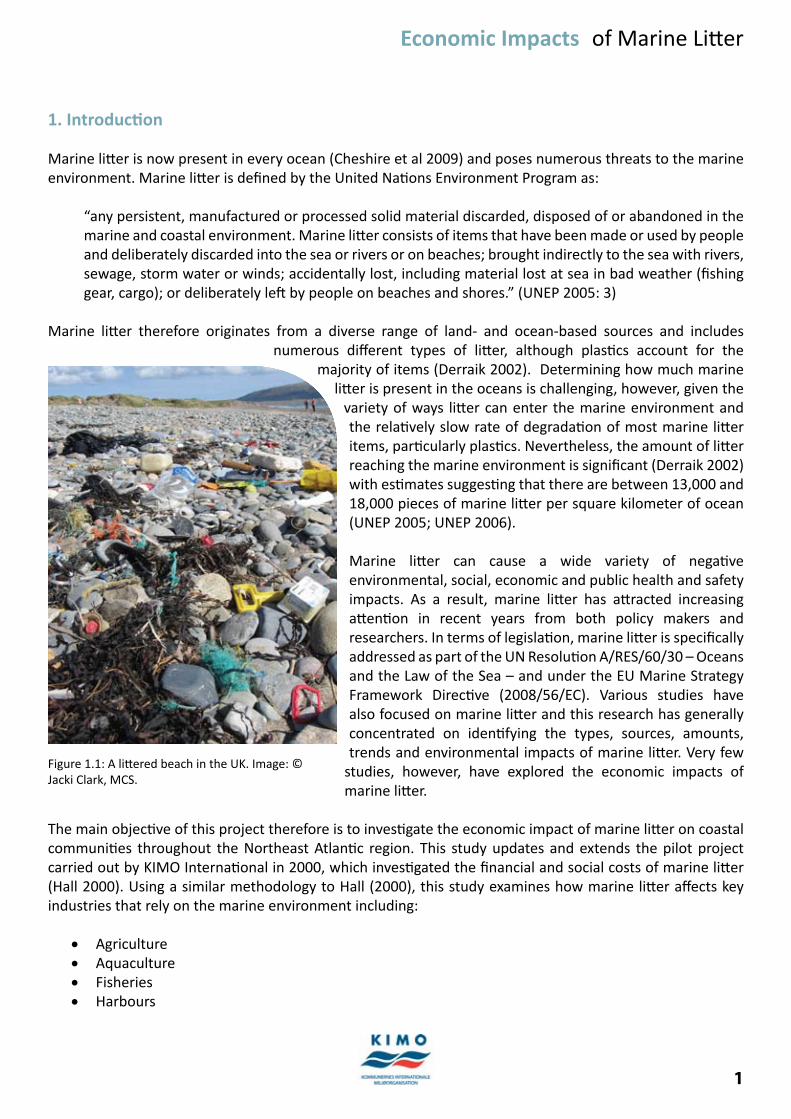
Marine litt er is now present in every ocean (Cheshire et al 2009) and poses numerous threats to the marine environment. Marine litt er is defi ned by the United Nati ons Environment Program as:
“any persistent, manufactured or processed solid material discarded, disposed of or abandoned in the marine and coastal environment. Marine litt er consists of items that have been made or used by people and deliberately discarded into the sea or rivers or on beaches; brought indirectly to the sea with rivers, sewage, storm water or winds; accidentally lost, including material lost at sea in bad weather (fi shing gear, cargo); or deliberately left by people on beaches and shores.” (UNEP 2005: 3)
Marine litt er therefore originates from a diverse range of land- and ocean-based sources and includes numerous diff erent types of litt er, although plasti cs account for the
majority of items (Derraik 2002). Determining how much marine litt er is present in the oceans is challenging, however, given the
variety of ways litt er can enter the marine environment and the relati vely slow rate of degradati on of most marine litt er items, parti cularly plasti cs. Nevertheless, the amount of litt er reaching the marine environment is signifi cant (Derraik 2002) with esti mates suggesti ng that there are between 13,000 and 18,000 pieces of marine litt er per square kilometer of ocean (UNEP 2005; UNEP 2006).
Marine litt er can cause a wide variety of negati ve environmental, social, economic and public health and safety impacts. As a result, marine litt er has att racted increasing att enti on in recent years from both policy makers and researchers. In terms of legislati on, marine litt er is specifi cally addressed as part of the UN Resoluti on A/RES/60/30 – Oceans and the Law of the Sea – and under the EU Marine Strategy Framework Directi ve (2008/56/EC). Various studies have also focused on marine litt er and this research has generally concentrated on identi fying the types, sources, amounts, trends and environmental impacts of marine litt er. Very few
studies, however, have explored the economic impacts of marine litt er.
The main objecti ve of this project therefore is to investi gate the economic impact of marine litt er on coastal communiti es throughout the Northeast Atlanti c region. This study updates and extends the pilot project carried out by KIMO Internati onal in 2000, which investi gated the fi nancial and social costs of marine litt er (Hall 2000). Using a similar methodology to Hall (2000), this study examines how marine litt er aff ects key industries that rely on the marine environment including:
Agriculture• Aquaculture• Fisheries• Harbours•
Figure 1.1: A litt ered beach in the UK. Image: © Jacki Clark, MCS.
2
Economic Impacts of Marine Litt er
Industrial seawater users• Marinas• Municipaliti es• Power stati ons• Rescue services• Voluntary organisati ons• Water Authoriti es•
To present the fi ndings of this research, the following structure has been adopted in this report. Chapter 2 provides a review of existi ng literature about the types, sources, amounts and impacts of marine litt er. Chapter 3 outlines the key internati onal agreements and legislati on that directly and indirectly address the problem of marine litt er. Chapter 4 sets out the methodology used in the project and describes the data collecti on process. In chapters 5 – 13, the key fi ndings are presented for each sector involved in the project. These chapters explore how marine litt er aff ects each sector, how much it costs to deal with and the types of litt er preventi on methods adopted by each sector. Chapter 14 draws together the various strands of the project into a case study of the economic impact of marine litt er on one coastal community in the United Kingdom. The project also investi gated the wider context of the impacts of marine litt er and these fi ndings are presented in Chapter 15. Finally, Chapter 16 outlines the conclusions of the project.
3
Economic Impacts of Marine Litt er
2. Literature Review
Marine litt er is one of the most pervasive polluti on problems aff ecti ng the marine environment and “unless eff ecti ve acti on is taken, the global marine litt er problem will only conti nue to worsen in the years to come” (UNEP 2009: 11). Marine litt er originates from numerous sources and can cause a wide range of environmental, social, economic and public health and safety impacts. Research to date has focused on the types, sources, amounts, trends and environmental impacts of marine litt er while studies into the economic impacts of marine litt er remain relati vely rare. Although the dynamic and diff use nature of marine litt er makes systemati c assessments of the problem diffi cult (UNEP 2009), research is crucial to provide a strong foundati on for confronti ng the marine litt er problem.
2.1 Types of marine litt er
Marine litt er includes a wide variety of diff erent types of debris and these can be classifi ed into several disti nct categories:
plasti cs• including moulded, soft , foam, nets, ropes, buoys, monofi lament line and other fi sheries related equipment, smoking related items such as cigarett e butt s or lighters, and microplasti c parti cles metal• including drink cans, aerosol cans, foil wrappers and disposable barbequesglass• including buoys, light globes, fl uorescent globes and bott lesprocessed ti mber• including pallets, crates and parti cle boardpaper and cardboard • including cartons, cups and bagsrubber• including tyres, balloons and glovesclothing and texti les • including shoes, furnishings and towelssewage related debris (SRD)• including cott on bud sti cks, nappies, condoms and sanitary products (Cheshire et al 2009; Beachwatch 2009a).
2.1.1 Plasti cs and syntheti c materials
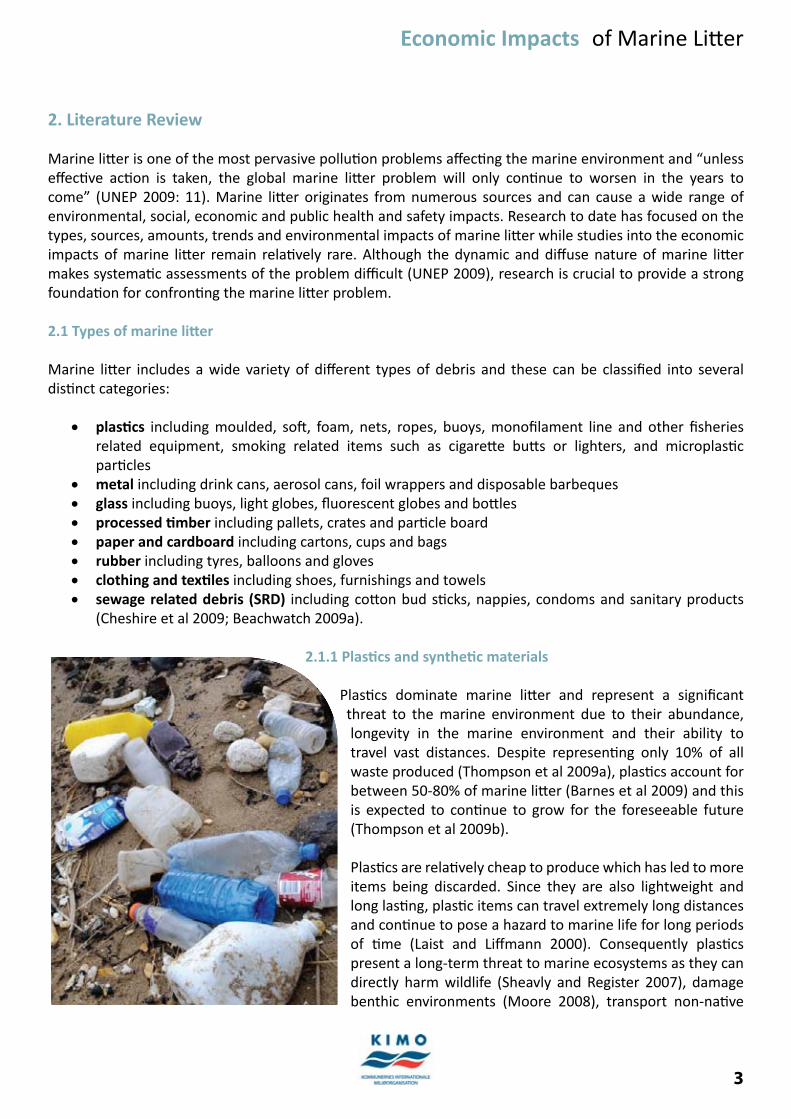
Plasti cs dominate marine litt er and represent a signifi cant threat to the marine environment due to their abundance, longevity in the marine environment and their ability to travel vast distances. Despite representi ng only 10% of all waste produced (Thompson et al 2009a), plasti cs account for between 50-80% of marine litt er (Barnes et al 2009) and this is expected to conti nue to grow for the foreseeable future (Thompson et al 2009b).
Plasti cs are relati vely cheap to produce which has led to more items being discarded. Since they are also lightweight and long lasti ng, plasti c items can travel extremely long distances and conti nue to pose a hazard to marine life for long periods of ti me (Laist and Liff mann 2000). Consequently plasti cs present a long-term threat to marine ecosystems as they can directly harm wildlife (Sheavly and Register 2007), damage benthic environments (Moore 2008), transport non-nati ve
4
Economic Impacts of Marine Litt er
and invasive species (Cheshire et al 2009), and concentrate toxic chemicals from seawater (Committ ee on the Eff ecti veness of Internati onal and Nati onal Measures to Prevent and Reduce Marine Debris and Its Impacts et al 2008). A growing area of concern is the potenti al impact of microplasti c parti cles, which are now abundant throughout the world’s oceans and beaches, but the environmental signifi cance of this type of polluti on is yet to be fully understood (Thompson et al 2004).
2.2 Sources of marine litt er
Marine litt er results from human acti ons and behaviour, whether deliberate or accidental, and is the product of poor waste management, inadequate infrastructure and a lack of public knowledge about the potenti al consequences of inappropriate waste disposal (UNEP 2009). Marine litt er therefore originates from numerous diff erent sources with approximately 80% of litt er entering the marine environment from land-based sources and the remaining 20% originati ng from ocean-based sources (GESAMP 1991), although this varies between areas (Allsopp et al 2006).
2.2.1 Land-based sources of marine litt er
Marine litt er can be generated on land in coastal areas including beaches, piers, harbours, marinas and docks (Allsopp et al 2006) as well as many kilometers inland, due to the long distances litt er can travel in the environment (Ten Brink et al 2009). Litt er is both intenti onally and inadvertently discharged into the environment and can result from a wide range of acti viti es including coastal tourism, fl y-ti pping, local businesses and poorly managed waste disposal sites (Allsopp et al 2006; UNEP 2009).
Land-based sources of marine litt er include (Allsopp et al 2006):
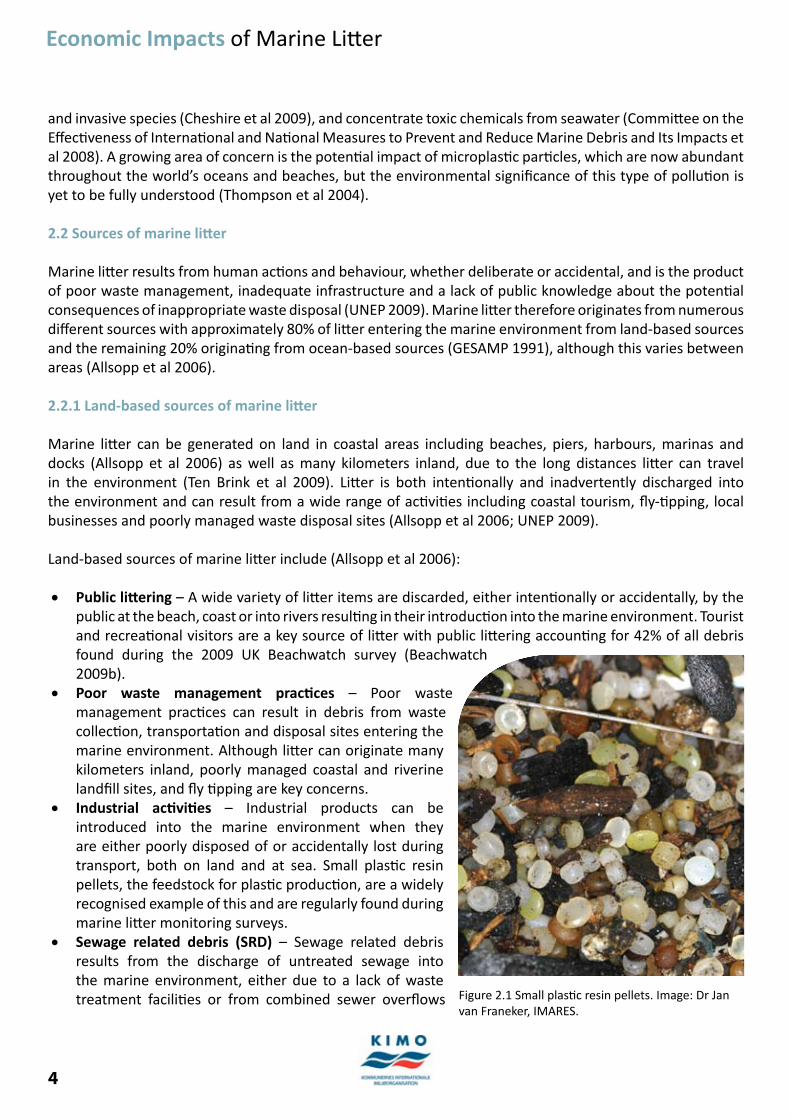
Public litt ering• – A wide variety of litt er items are discarded, either intenti onally or accidentally, by the public at the beach, coast or into rivers resulti ng in their introducti on into the marine environment. Tourist and recreati onal visitors are a key source of litt er with public litt ering accounti ng for 42% of all debris found during the 2009 UK Beachwatch survey (Beachwatch 2009b). Poor waste management practi ces• – Poor waste management practi ces can result in debris from waste collecti on, transportati on and disposal sites entering the marine environment. Although litt er can originate many kilometers inland, poorly managed coastal and riverine landfi ll sites, and fl y ti pping are key concerns.Industrial acti viti es • – Industrial products can be introduced into the marine environment when they are either poorly disposed of or accidentally lost during transport, both on land and at sea. Small plasti c resin pellets, the feedstock for plasti c producti on, are a widely recognised example of this and are regularly found during marine litt er monitoring surveys. Sewage related debris (SRD)• – Sewage related debris results from the discharge of untreated sewage into the marine environment, either due to a lack of waste treatment faciliti es or from combined sewer overfl ows Figure 2.1 Small plasti c resin pellets. Image: Dr Jan
van Franeker, IMARES.

5
Economic Impacts of Marine Litt er
during storm events. SRD consti tutes a small proporti on of the overall litt er problem, accounti ng for only 5.4% of marine litt er found during the 2009 UK Beachwatch survey (Beachwatch 2009a), but it can be parti cularly off ensive in nature (ENCAMS 2007).Storm water discharges• – Litt er can collect in storm drains and subsequently be discharged into the marine environment during storm events.
2.2.2. Ocean-based sources of marine litt er
Ocean-based sources of marine litt er include shipping, the fi shing industry and off shore oil/gas installati ons. Ocean-based litt er enters the environment through both accidental and deliberate discharges of items ranging from galley waste to cargo containers (Allsopp et al 2006).
Ocean-based litt er is generated by (Allsopp et al 2006):The fi shing industry• – Nets, ropes and other fi shing debris are among the most visible elements of marine litt er and result from a failure to remove gear, accidental loss of gear or the deliberate dumping of nets, ropes and other waste by fi shing crews. Shipping• – Despite internati onal legislati on prohibiti ng the disposal of manufactured items at sea, these conti nue to be accidentally released, stored inappropriately or discarded deliberately by shipping vessels, parti cularly on long journeys. A key concern is the frequent loss of cargo containers from commercial shipping with up to 10,000 of these containers lost worldwide each year (Podsada 2001). The leisure industry • – Recreati onal boat owners and operators may accidentally or deliberately discharge waste and other manufactured items into the marine environment. Such litt er can include food containers, plasti c bott les and recreati onal fi shing gear (Sheavly 2005).Off shore oil and gas platf orm explorati on• – Off shore oil and gas acti viti es can result in the release, both accidental and deliberate, of a wide variety of items into the marine environment. These include everyday items such as gloves and hard hats as well as waste generated from explorati on and resource extracti on.
2.3 Amount and persistence of marine litt er
2.3.1 Amount of marine litt er
While it is clearly evident that marine litt er is now present in every ocean (Cheshire et al 2009), establishing the amount of litt er in the oceans is extremely diffi cult (Allsopp et al 2006). Quanti fying the amount of marine litt er in the oceans has thus far been approached in three main ways: esti mati ng the amounts of litt er already in the ocean, determining how much is added each year and through marine litt er monitoring surveys.
2.3.1.1 Amount of marine litt er already in the ocean
Global esti mates of marine litt er levels are inherently complex and reliable esti mates are thus relati vely rare. In 2005, UNEP esti mated that on average there are 13,000 pieces of marine litt er per square kilometre (UNEP 2005) but a separate UNEP report a year later suggested that there are 46,000 pieces of marine litt er per square mile (approximately 18,000 per square kilometre) (UNEP 2006). Although these fi gures must be regarded with a degree of cauti on since no data was provided to support these esti mates, the amount of marine litt er reaching the oceans is undoubtedly ”substanti al” (Derraik 2002: 843).
6
Economic Impacts of Marine Litt er
2.3.1.2 Yearly increases in marine litt er
Various att empts have been made, both at a global and regional scale, to esti mate how much litt er enters the marine environment every year. Globally, esti mates suggest approximately 6.4 million tonnes of litt er enter the oceans each year (US Nati onal Academy of Science 1975 cited in Cheshire et al 2009), although this fi gure is now somewhat outdated. In the early 1980s, it was esti mated that up to 8 million items of marine litt er enter the oceans daily (Horsman 1982) but this fi gure now needs to be updated and multi plied several fold (Barnes 2005). At a regional level, the OSPAR Commission suggested that approximately 20,000 tonnes of marine litt er enters the North Sea each year (OSPAR 1995), although no sources were provided to support this esti mate. Despite variable overall esti mates, however, it is widely accepted that both the levels of marine litt er and the rate of input into the oceans are rising (Barnes 2002; Derraik 2002).
2.3.1.3 Marine litt er monitoring
Marine litt er monitoring programmes are currently carried out in a number of diff erent countries throughout the world but diff erences in study design, methodology and purpose makes comparison between monitoring programmes challenging (Cheshire et al 2009). Approximately 70% of marine litt er sinks to the seabed, 15% fl oats in the water column and 15% washes up on shore (OSPAR 1995), and diff erent methods of assessment are required to investi gate each of these litt er sinks. Generally, these programmes aim to establish long-term data sets from which it is then possible to interpret trends in the compositi on and abundance of litt er over ti me.
2.3.1.3.1 Amounts found on the coastline
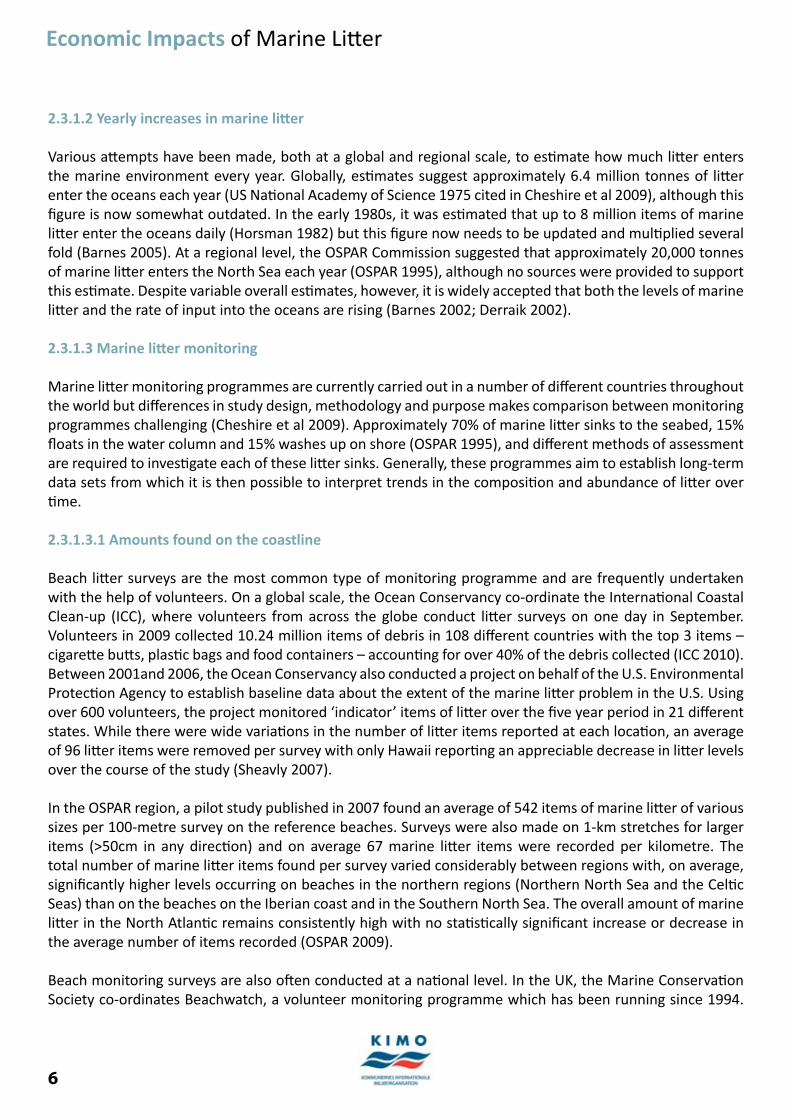
Beach litt er surveys are the most common type of monitoring programme and are frequently undertaken with the help of volunteers. On a global scale, the Ocean Conservancy co-ordinate the Internati onal Coastal Clean-up (ICC), where volunteers from across the globe conduct litt er surveys on one day in September. Volunteers in 2009 collected 10.24 million items of debris in 108 diff erent countries with the top 3 items – cigarett e butt s, plasti c bags and food containers – accounti ng for over 40% of the debris collected (ICC 2010). Between 2001and 2006, the Ocean Conservancy also conducted a project on behalf of the U.S. Environmental Protecti on Agency to establish baseline data about the extent of the marine litt er problem in the U.S. Using over 600 volunteers, the project monitored ‘indicator’ items of litt er over the fi ve year period in 21 diff erent states. While there were wide variati ons in the number of litt er items reported at each locati on, an average of 96 litt er items were removed per survey with only Hawaii reporti ng an appreciable decrease in litt er levels over the course of the study (Sheavly 2007).
In the OSPAR region, a pilot study published in 2007 found an average of 542 items of marine litt er of various sizes per 100-metre survey on the reference beaches. Surveys were also made on 1-km stretches for larger items (>50cm in any directi on) and on average 67 marine litt er items were recorded per kilometre. The total number of marine litt er items found per survey varied considerably between regions with, on average, signifi cantly higher levels occurring on beaches in the northern regions (Northern North Sea and the Celti c Seas) than on the beaches on the Iberian coast and in the Southern North Sea. The overall amount of marine litt er in the North Atlanti c remains consistently high with no stati sti cally signifi cant increase or decrease in the average number of items recorded (OSPAR 2009).
Beach monitoring surveys are also oft en conducted at a nati onal level. In the UK, the Marine Conservati on Society co-ordinates Beachwatch, a volunteer monitoring programme which has been running since 1994.
7
Economic Impacts of Marine Litt er
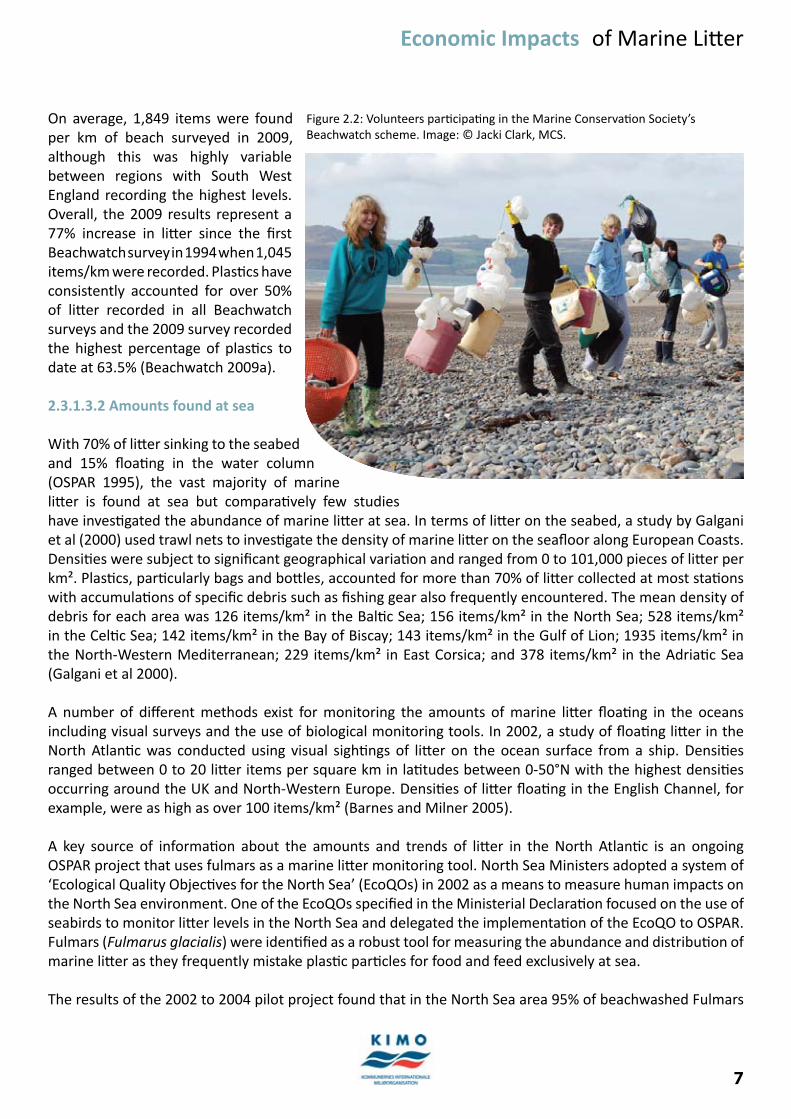
On average, 1,849 items were found per km of beach surveyed in 2009, although this was highly variable between regions with South West England recording the highest levels. Overall, the 2009 results represent a 77% increase in litt er since the fi rst Beachwatch survey in 1994 when 1,045 items/km were recorded. Plasti cs have consistently accounted for over 50% of litt er recorded in all Beachwatch surveys and the 2009 survey recorded the highest percentage of plasti cs to date at 63.5% (Beachwatch 2009a).
2.3.1.3.2 Amounts found at sea
With 70% of litt er sinking to the seabed and 15% fl oati ng in the water column (OSPAR 1995), the vast majority of marine litt er is found at sea but comparati vely few studies have investi gated the abundance of marine litt er at sea. In terms of litt er on the seabed, a study by Galgani et al (2000) used trawl nets to investi gate the density of marine litt er on the seafl oor along European Coasts. Densiti es were subject to signifi cant geographical variati on and ranged from 0 to 101,000 pieces of litt er per km². Plasti cs, parti cularly bags and bott les, accounted for more than 70% of litt er collected at most stati ons with accumulati ons of specifi c debris such as fi shing gear also frequently encountered. The mean density of debris for each area was 126 items/km² in the Balti c Sea; 156 items/km² in the North Sea; 528 items/km² in the Celti c Sea; 142 items/km² in the Bay of Biscay; 143 items/km² in the Gulf of Lion; 1935 items/km² in the North-Western Mediterranean; 229 items/km² in East Corsica; and 378 items/km² in the Adriati c Sea (Galgani et al 2000).
A number of diff erent methods exist for monitoring the amounts of marine litt er fl oati ng in the oceans including visual surveys and the use of biological monitoring tools. In 2002, a study of fl oati ng litt er in the North Atlanti c was conducted using visual sighti ngs of litt er on the ocean surface from a ship. Densiti es ranged between 0 to 20 litt er items per square km in lati tudes between 0-50°N with the highest densiti es occurring around the UK and North-Western Europe. Densiti es of litt er fl oati ng in the English Channel, for example, were as high as over 100 items/km² (Barnes and Milner 2005).
A key source of informati on about the amounts and trends of litt er in the North Atlanti c is an ongoing OSPAR project that uses fulmars as a marine litt er monitoring tool. North Sea Ministers adopted a system of ‘Ecological Quality Objecti ves for the North Sea’ (EcoQOs) in 2002 as a means to measure human impacts on the North Sea environment. One of the EcoQOs specifi ed in the Ministerial Declarati on focused on the use of seabirds to monitor litt er levels in the North Sea and delegated the implementati on of the EcoQO to OSPAR. Fulmars (Fulmarus glacialis) were identi fi ed as a robust tool for measuring the abundance and distributi on of marine litt er as they frequently mistake plasti c parti cles for food and feed exclusively at sea.
The results of the 2002 to 2004 pilot project found that in the North Sea area 95% of beachwashed Fulmars
Figure 2.2: Volunteers parti cipati ng in the Marine Conservati on Society’s Beachwatch scheme. Image: © Jacki Clark, MCS.

8
Economic Impacts of Marine Litt er
have plasti c in their stomachs with an average mass of 0.33 grams and an average of over 40 pieces per bird. Regional variati ons within this were considerable with the southeastern North Sea four ti mes more polluted than the seas around the Faroe Islands. These geographical diff erences suggest that marine litt er in the North Sea is largely determined by local sources of polluti on as all study regions are subject to the same background levels of marine litt er arriving on the Gulf Stream (Van Franeker et al 2005). In terms of appreciable trends in marine litt er, a background study for the EcoQO found that there was a reducti on in the amount of litt er at sea during the late 1990s, with the average amount of plasti c per bird falling from 0.5g to 0.3g, but this trend has since stagnated and there has been no signifi cant reducti on in recent years (OSPAR 2009).
Studies have also been undertaken investi gati ng the extent and abundance of microplasti c parti cles at sea. Research by Thompson et al (2004) has shown that microscopic plasti c parti cles and fi bres are present throughout the oceans and have collected both in pelagic zones and sedimentary habitats. This research also examined long-term trends in the abundance of microplasti cs and found that levels had signifi cantly risen over the past 40 years. While marine organisms have been shown to ingest microplasti c parti cles, research into the full biological and environmental implicati ons of this is sti ll in its early stages.
2.3.2 Persistence of marine litt er
The persistence of many types of litt er in the marine environment, parti cularly glass and plasti cs, is widely accepted (Cheshire et al 2009) but diff ering interpretati ons of when ‘degradati on’ occurs mean that esti mates of breakdown rates vary widely. The breakdown process occurs in stages ranging from initi al embritt lement to fragmentati on and the eventual chemical decompositi on of litt er items. Diff erent studies, however, pinpoint diff erent stages of this process as when ‘degradati on’ occurs resulti ng in the range of esti mates of breakdown rates. Plasti cs illustrate this well as they fragment to microplasti cs over ti mescales of hundreds of years but the length of ti me required for their full chemical decompositi on is unknown (Andrady 2005) and they “may never truly biodegrade” (DEFRA 2010: 78) In practi ce, degradati on rates can also vary substanti ally due to varying UV levels, temperatures, oxygen levels, wave energy and the presence of abrasive factors such as sand or gravel (Cheshire et al 2009). Guideline esti mates of degradati on rates are shown in Table 2.1 below.
MaterialDegradati on Rate (years)
Reference
Cott on rope 1 Ten Brink 2009Untreated plywood 1-3 Ten Brink 2009Cigarett e butt s 1-5 Cheshire et al 2009
Plasti c bag10-2020-30
Ten Brink 2009Cheshire et al 2009
Commercial netti ng 30-40 Ten Brink 2009Foamed plasti c buoy 80 Ten Brink 2009
Aluminium can80-20080-500
Ten Brink 2009Cheshire et al 2009
Plasti c beverage bott le 450 Ten Brink 2009Monofi lament fi shing line
600 Ten Brink 2009
Glass bott le 1 million Ten Brink 2009 Table 2.1: Guideline esti mates of degradati on rates of selected types of litt er
9
Economic Impacts of Marine Litt er
2.4 The impacts of marine litt er
Litt er in the marine environment gives rise to a wide range of negati ve environmental, social, economic and public health and safety impacts. While these impacts are diverse, they are oft en also interrelated and frequently dependent upon one another (Ten Brink et al 2009). Ghost fi shing, for example, can result in harm to the environment, economic losses to fi sheries and reduced opportuniti es for recreati onal fi shing (Macfadyen et al 2009). Our understanding of these impacts is variable and limited in areas, parti cularly as regards the socio-economic eff ects of marine litt er.
2.4.1. Environmental impacts of marine litt er
Marine litt er can cause a wide variety of adverse environmental impacts to individual organisms, species and ecosystems. Ingesti on and entanglement of wildlife are among the most well known impacts of marine litt er (Gregory 2009; Thompson et al 2009) and have now been recorded in over 267 species (Laist 1997). This includes 86% of all sea turtle species, 44% of all seabird species and 43% of all marine mammal species as well as numerous fi sh and crustacean species (Allsopp et al 2006). Marine litt er can also cause damage to benthic environments (Moore 2008), aff ect biodiversity (Derraik 2002) and potenti ally lead to the loss of ecosystem functi ons (Ten Brink 2009).
2.4.1.1 Ingesti on
The ingesti on of marine litt er has been reported to date in over 111 species of seabird (Allsopp et al 2006), 31 marine mammal species (Allsopp et al 2006) and 26 species of cetaceans (Derraik 2002). The main impacts of ingesti on include:
Physical damage to the digesti ve tract including wounds, scarring and ulcerati on which can lead to • infecti on, starvati on and potenti ally deathMechanical blockage of the digesti ve tract • Reduced quality of life and reproducti ve capacity• Drowning and reduced ability to avoid predators• Reduced feeding capacity and malnutriti on• A false sense of sati ati on leading to general • debilitati on, starvati on and possibly deathToxic chemical poisoning from • contaminated plasti cs leading to reproducti ve disorders, increased risk of diseases, altered hormone levels and possibly death (Derraik 2002; Gregory 2009; OSPAR 2009)
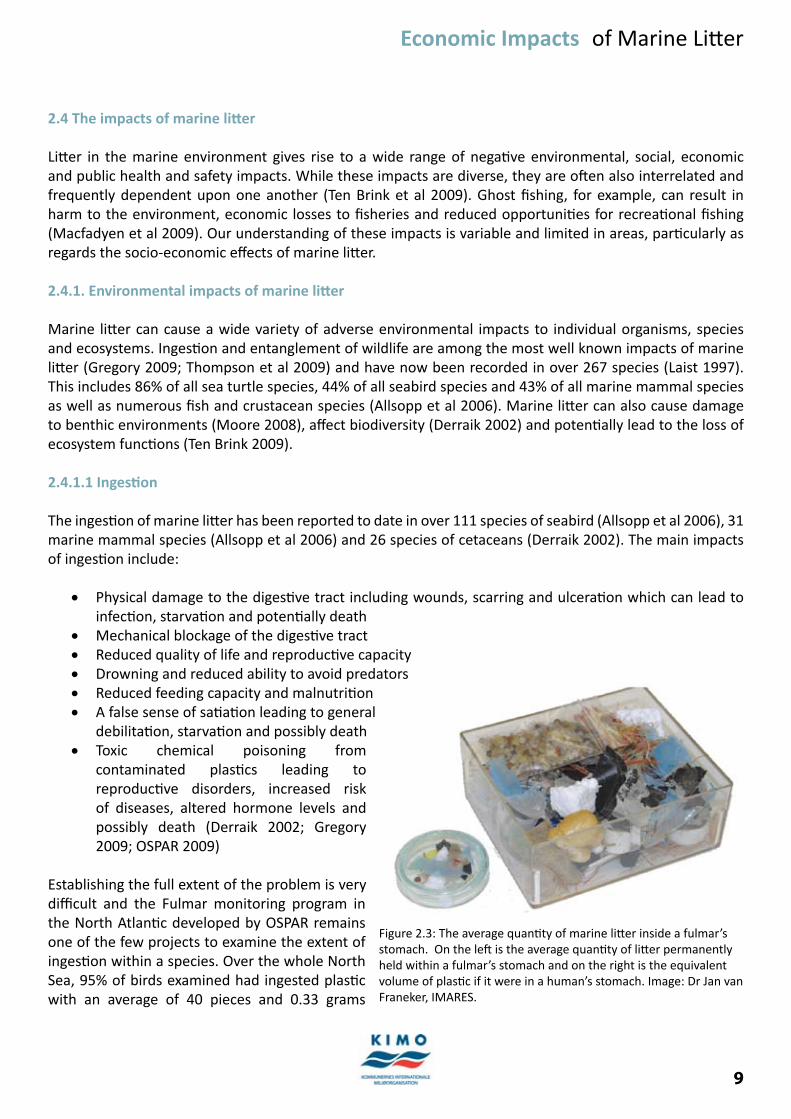
Establishing the full extent of the problem is very diffi cult and the Fulmar monitoring program in the North Atlanti c developed by OSPAR remains one of the few projects to examine the extent of ingesti on within a species. Over the whole North Sea, 95% of birds examined had ingested plasti c with an average of 40 pieces and 0.33 grams
Figure 2.3: The average quanti ty of marine litt er inside a fulmar’s stomach. On the left is the average quanti ty of litt er permanently held within a fulmar’s stomach and on the right is the equivalent volume of plasti c if it were in a human’s stomach. Image: Dr Jan van Franeker, IMARES.
10
Economic Impacts of Marine Litt er
found per bird (Van Franeker et al 2005). Typically, evidence of ingesti on is more commonly reported on a case-by-case basis such as the discovery by American scienti sts of a dead sperm whale with just under 200kg of fi shing gear in its stomach (ICC 2009). In the UK, the post-mortem of a large adult grey seal revealed it had swallowed a plasti c sea angling line splitt er, which had lacerated the seal’s gut, and prevented it from feeding (OSPAR 2009).
2.4.1.2 Entanglement
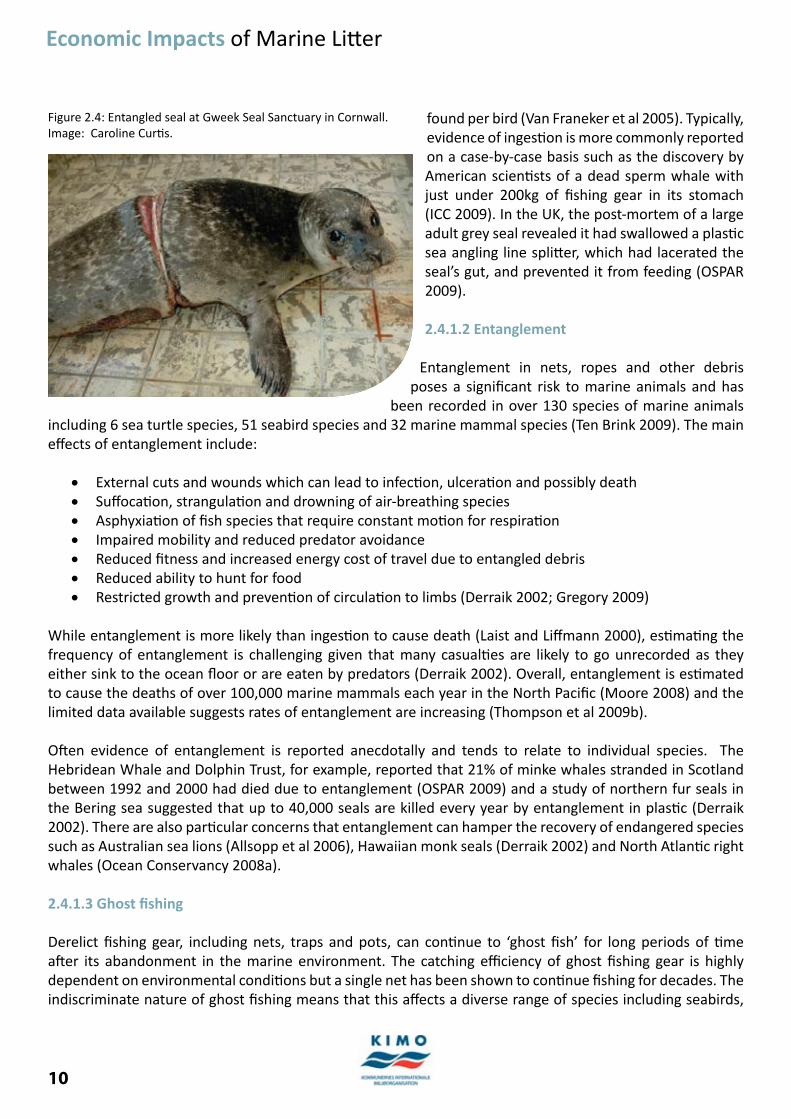
Entanglement in nets, ropes and other debris poses a signifi cant risk to marine animals and has
been recorded in over 130 species of marine animals including 6 sea turtle species, 51 seabird species and 32 marine mammal species (Ten Brink 2009). The main eff ects of entanglement include:
External cuts and wounds which can lead to infecti on, ulcerati on and possibly death• Suff ocati on, strangulati on and drowning of air-breathing species• Asphyxiati on of fi sh species that require constant moti on for respirati on• Impaired mobility and reduced predator avoidance• Reduced fi tness and increased energy cost of travel due to entangled debris• Reduced ability to hunt for food• Restricted growth and preventi on of circulati on to limbs (Derraik 2002; Gregory 2009)•
While entanglement is more likely than ingesti on to cause death (Laist and Liff mann 2000), esti mati ng the frequency of entanglement is challenging given that many casualti es are likely to go unrecorded as they either sink to the ocean fl oor or are eaten by predators (Derraik 2002). Overall, entanglement is esti mated to cause the deaths of over 100,000 marine mammals each year in the North Pacifi c (Moore 2008) and the limited data available suggests rates of entanglement are increasing (Thompson et al 2009b).
Oft en evidence of entanglement is reported anecdotally and tends to relate to individual species. The Hebridean Whale and Dolphin Trust, for example, reported that 21% of minke whales stranded in Scotland between 1992 and 2000 had died due to entanglement (OSPAR 2009) and a study of northern fur seals in the Bering sea suggested that up to 40,000 seals are killed every year by entanglement in plasti c (Derraik 2002). There are also parti cular concerns that entanglement can hamper the recovery of endangered species such as Australian sea lions (Allsopp et al 2006), Hawaiian monk seals (Derraik 2002) and North Atlanti c right whales (Ocean Conservancy 2008a).
2.4.1.3 Ghost fi shing
Derelict fi shing gear, including nets, traps and pots, can conti nue to ‘ghost fi sh’ for long periods of ti me aft er its abandonment in the marine environment. The catching effi ciency of ghost fi shing gear is highly dependent on environmental conditi ons but a single net has been shown to conti nue fi shing for decades. The indiscriminate nature of ghost fi shing means that this aff ects a diverse range of species including seabirds,
Figure 2.4: Entangled seal at Gweek Seal Sanctuary in Cornwall. Image: Caroline Curti s.

11
Economic Impacts of Marine Litt er
seals and cetaceans as well as both commercially important and non-target fi sh species (Macfadyen et al 2009). A key concern is the impact this could be having on already vulnerable species such as North Atlanti c deepwater sharks (Allsopp et al 2006) and Hawaiian monk seals (Derraik 2002). Commercial fi shing interests are also likely to be aff ected as ghost fi shing nets may capture immature fi sh and thus reduce the reproducti ve potenti al of fi sh stocks as a whole (Williams et al 2005).
Ghost fi shing can therefore act as direct competi ti on to commercial fi sheries (Macfadyen et al 2009) and could have parti cularly detrimental eff ects on the conservati on of vulnerable fi sh stocks (Sheavly and Register 2007). On the whole, ghost fi shing catches are likely to be low compared to commercial fi shing eff orts (Brown et al 2005). For example, ghost fi shing is not believed to account for more than 5% of commercial EU landings for gillnet and tangle fi sheries (Committ ee on the Eff ecti veness of Internati onal and Nati onal Measures to Prevent and Reduce Marine Debris and Its Impacts et al 2008) and less than 1.5% of commercial landings of monkfi sh in the Cantabrian sea (Brown et al 2005). The impact of ghost nets on other species tends to be reported anecdotally but esti mates suggest that approximately 130,000 cetaceans are killed each year by ghost fi shing gear (USEPA 1992 cited in Ten Brink 2009) and in the North East pacifi c, 15% of the mortality of young fur seals (Callorhinus usrinus) was att ributed to ghost fi shing (Ten Brink 2009).
2.4.1.4 Harm to benthic organisms and habitats
While approximately 70% of marine litt er is thought to accumulate on the seafl oor (OSPAR 1995), very few studies to date have investi gated the considerable threat this poses to benthic organisms and habitats. Accumulati ons of litt er can prevent gas exchange between overlying waters and the pore waters of sediment leading to reduced oxygen in sediments. This can result in adverse impacts on ecosystem functi oning, smothering of benthic organisms and changes to the compositi on of biota on the seafl oor (Derraik 2002). Marine litt er can also cause physical damage to benthic habitats through abrasion, scouring, breaking and smothering (Sheavly and Register 2007) while derelict fi shing gear in parti cular can “pluck” organisms and translocate sea-bed features (Macfadyen et al 2009). Benthic organisms are also at risk from entanglement and ingesti on of marine litt er (Derraik 2002).
2.4.1.5 Transport of non-nati ve and invasive species
Natural debris fl oati ng in the oceans has always acted as a means of travel for non-nati ve species but the proliferati on of marine litt er, parti cularly plasti cs, has radically increased the prospects for dispersal of non-nati ve and potenti ally invasive species (Gregory 2009). The slow travel rates of marine litt er also provide non-nati ve species with more ti me to adjust to changing environmental conditi ons (Moore 2008) and as a consequence, marine litt er may be a more eff ecti ve vector for the transport of non-nati ve species than ships hulls and ballast water (Moore 2008). Overall, marine litt er is esti mated to have doubled the opportuniti es for marine organisms to travel at tropical lati tudes and more than tripled it at high (>50°) lati tudes (Allsopp et al 2006 ).
Although marine litt er can be colonised by a diverse range of species (Gregory 2009), some of the most common hitchhikers include barnacles, bryozoans and polychaete worms (Allsopp et al 2006). The invasive and exoti c acorn barnacle (Eliminius modestus), for example, has been found on plasti c on the shoreline of the Shetland Islands (Barnes and Milner 2005) and plasti c debris has also been implicated in the northward range extension of the large barnacle Perforatus perforatus (Rees and Southward 2008 cited in Moore 2008).
The introducti on of invasive non-nati ve species can have devastati ng environmental eff ects including loss of
12
Economic Impacts of Marine Litt er
biodiversity, changes to habitat structure and changes to ecosystem functi ons (Derraik 2002; Donnan 2009). Invasive species can also out compete nati ve species as well as impact upon trophic structures and cause geneti c changes (Donnan 2009). As a consequence, invasive species have been recognised as one of the greatest threats to global biodiversity (Barnes and Milner 2005) and pose parti cular dangers for previously inaccessibly conservati on islands (Derraik 2002).
2.4.1.6 Loss of biodiversity
Marine litt er can act as an additi onal pressure on already vulnerable species and threaten their conti nued survival (Allsopp et al 2006; Derraik 2002.). The injury and death of individual animals from entanglement and ingesti on of marine litt er, in parti cular, can have profound implicati ons for the survival of an endangered species but to date very litt le research has investi gated the populati on-level eff ects of marine litt er (Laist and Liff mann 2000). For the Hawaiian monk seal (Monachus schauinslandi), which numbers just 1,200 in the wild today, entanglement in marine litt er “is arguably the most signifi cant documented impediment to the species’ recovery” (Committ ee on the Eff ecti veness of Internati onal and Nati onal Measures to Prevent and Reduce Marine Debris and Its Impacts et al 2008: 36).
Similarly, only 300 - 350 North Atlanti c right whales (Eubalaena glacialis) are left in the wild and entanglement accounts for a high proporti on of right whale mortality rates (Ocean Conservancy 2008a). A total of 24 North Atlanti c right whales were injured or died due to entanglement in marine litt er between 1999 and 2008 (Ocean Conservancy 2008b). A further 6 endangered species have been classifi ed by the Australian Government as adversely aff ected by marine litt er and these species include loggerhead turtles, blue whales and 2 species of albatross (Australian Government 2009). The loss of habitat and reduced ecosystem functi ons resulti ng from physical damage and smothering of benthic environments can also “alter the make-up of life on the sea fl oor” (Derraik 2002: 844). As outlined above, marine litt er can also act as a vector for the transportati on of invasive alien species and this can have devastati ng consequences for biodiversity in host habitats (Derraik 2002).
2.4.1.7 Microplasti cs
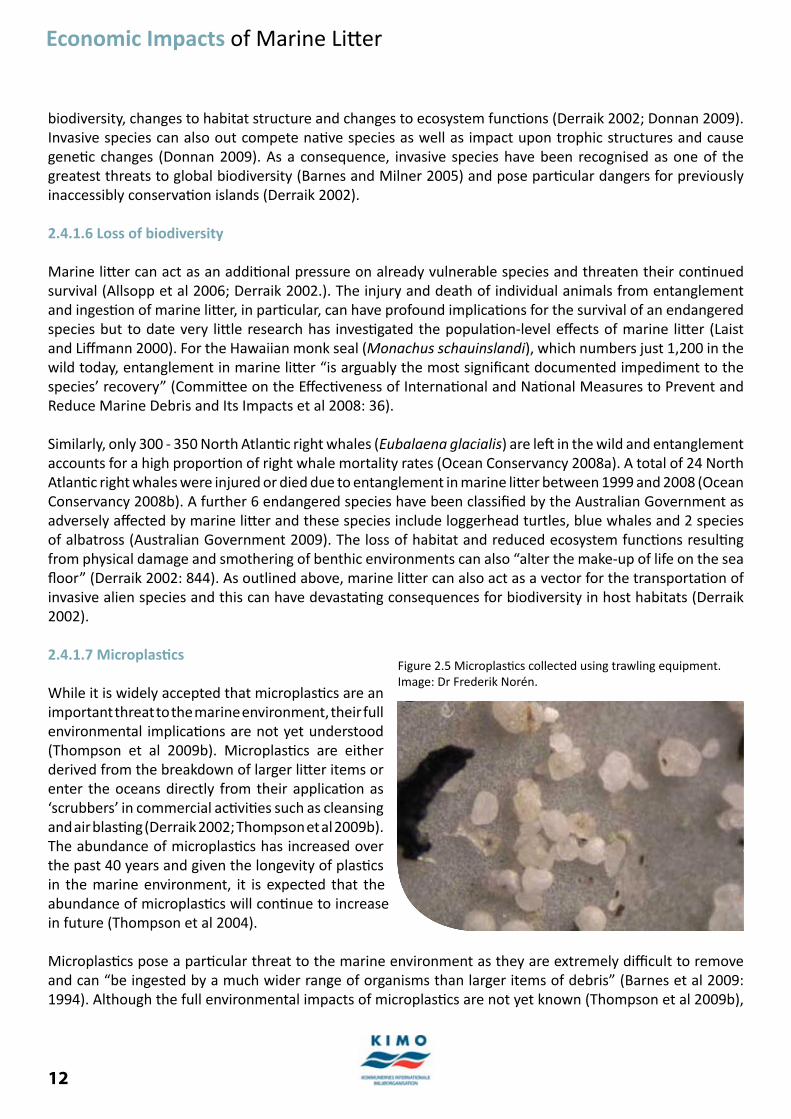
While it is widely accepted that microplasti cs are an important threat to the marine environment, their full environmental implicati ons are not yet understood (Thompson et al 2009b). Microplasti cs are either derived from the breakdown of larger litt er items or enter the oceans directly from their applicati on as ‘scrubbers’ in commercial acti viti es such as cleansing and air blasti ng (Derraik 2002; Thompson et al 2009b). The abundance of microplasti cs has increased over the past 40 years and given the longevity of plasti cs in the marine environment, it is expected that the abundance of microplasti cs will conti nue to increase in future (Thompson et al 2004).
Microplasti cs pose a parti cular threat to the marine environment as they are extremely diffi cult to remove and can “be ingested by a much wider range of organisms than larger items of debris” (Barnes et al 2009: 1994). Although the full environmental impacts of microplasti cs are not yet known (Thompson et al 2009b),
Figure 2.5 Microplasti cs collected using trawling equipment. Image: Dr Frederik Norén.
13
Economic Impacts of Marine Litt er
a key concern is the ability of plasti cs to concentrate persistent organic pollutants such as PCBs, DDE and nonylphenols (Moore 2008) and potenti ally transfer these to living organisms and the food chain (Committ ee on the Eff ecti veness of Internati onal and Nati onal Measures to Prevent and Reduce Marine Debris and Its Impacts et al 2008; DEFRA 2010). Microplasti cs in parti cular provide “a likely route for the transfer of these chemicals because they have a much greater surface area to volume rati o than larger items of debris…and because of their size they are available to a wide range of organisms (Barnes et al 2009: 1995). To date, marine organisms have been proven to ingest microplasti c fragments but whether this represents a pathway for the transport of these pollutants to the food chain is currently unknown (Thompson et al 2009b).
2.4.1.8 Long-term ecosystem deteriorati on
Establishing the long-term eff ects of marine litt er on the environment is very challenging due to the wide range of uncertainti es involved (Hyrenbach and Kennish 2008). Currently, it is unclear how and to what extent the diverse environmental impacts of marine litt er such as entanglement, ingesti on, damage to benthic environments and loss of biodiversity will combine and interact to cause ecosystem deteriorati on.
Marine litt er also acts as an additi onal pressure on oceans already under stress from over fi shing, coastal development, climate change and other forms of anthropogenic disturbance (Derraik 2002). Together these pressures may combine to cause rapid ecosystem deteriorati on and reduce the resilience of the oceans to withstand and adjust to large perturbati ons (ICC 2009). Marine litt er is thereby in eff ect “one of the straws that together could break the camel’s back – in this case, the ocean’s health” (ICC 2009: 19).
2.4.2 Social impacts of marine litt er
The social impacts of marine litt er are rooted in the ways in which marine litt er aff ects people’s quality of life and include reduced recreati onal opportuniti es, loss of aestheti c value and loss of non-use value (Cheshire et al 2009). Few studies to date have investi gated these issues and establishing exactly how and at what level marine litt er starts to have an appreciable social impact therefore requires more research (Cheshire et al 2009).
2.4.2.1 Reduced recreati onal opportuniti es
Beaches, coasts and seas are used for countless diff erent recreati onal acti viti es including swimming, diving, boati ng, recreati onal fi shing and a wide variety of water sports. Accumulati ons of marine litt er can have a strong deterrent eff ect and discourage recreati onal users from visiti ng polluted areas (Ballance et al 2000; Sheavly and Register 2005). The level of litt er required to acti vely deter people from visiti ng certain areas is clearly highly subjecti ve depending on personal preference, purpose of acti vity and litt er levels in surrounding areas but very litt le research into how marine litt er acts as a deterrent to marine recreati onal users has been undertaken to date.
Beach users, for instance, frequently rank cleanliness as their top priority when choosing where to visit (Ballance et al 2000; ENCAMS 2005). A pioneering South African study found that 85% of tourists and residents would not visit a beach with more than 2 debris items per metre and 97% would not go to a beach with 10 or more large items of litt er per metre (Ballance et al 2000). Marine litt er also deters other recreati onal users such as sailors and divers (Sheavly and Register 2007) due to both the reduced aestheti c quality of an area and concerns about the health and safety risks posed by accumulati ons of marine litt er (Cheshire et al 2009). More research is required to determine the approximate levels at which marine litt er aff ects recreati onal use
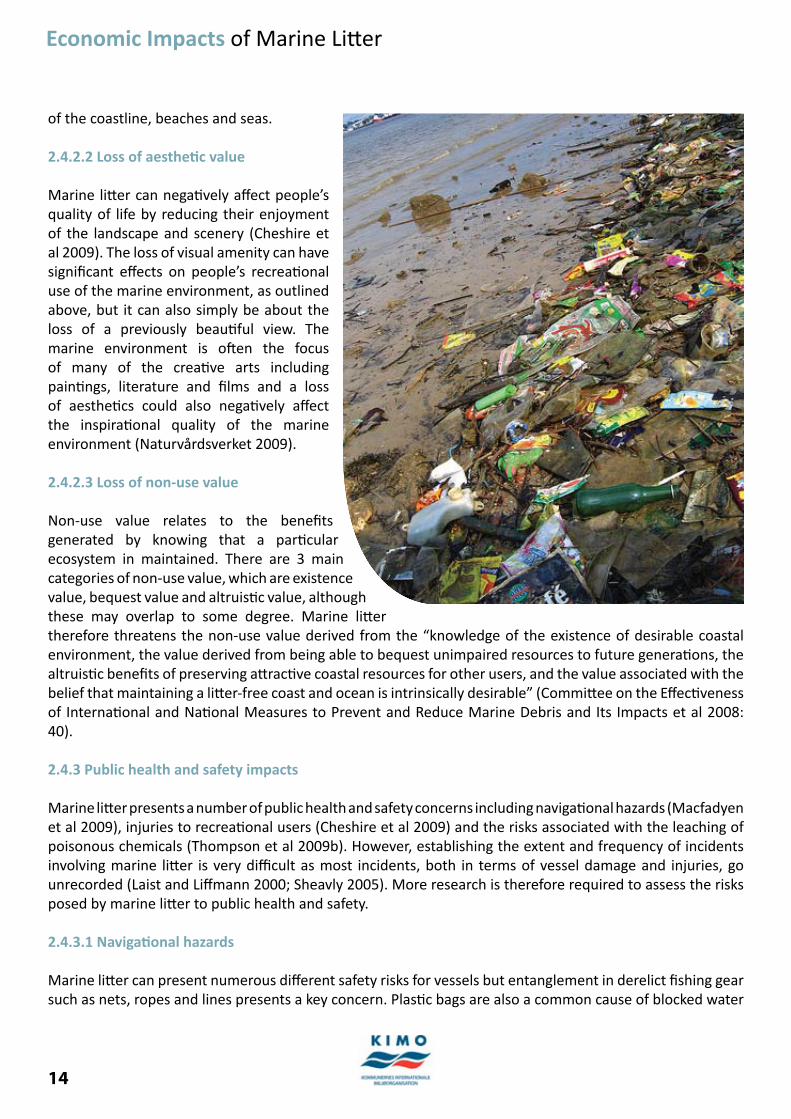
14
Economic Impacts of Marine Litt er
of the coastline, beaches and seas.
2.4.2.2 Loss of aestheti c value
Marine litt er can negati vely aff ect people’s quality of life by reducing their enjoyment of the landscape and scenery (Cheshire et al 2009). The loss of visual amenity can have signifi cant eff ects on people’s recreati onal use of the marine environment, as outlined above, but it can also simply be about the loss of a previously beauti ful view. The marine environment is oft en the focus of many of the creati ve arts including painti ngs, literature and fi lms and a loss of aestheti cs could also negati vely aff ect the inspirati onal quality of the marine environment (Naturvårdsverket 2009).
2.4.2.3 Loss of non-use value
Non-use value relates to the benefi ts generated by knowing that a parti cular ecosystem in maintained. There are 3 main categories of non-use value, which are existence value, bequest value and altruisti c value, although these may overlap to some degree. Marine litt er therefore threatens the non-use value derived from the “knowledge of the existence of desirable coastal environment, the value derived from being able to bequest unimpaired resources to future generati ons, the altruisti c benefi ts of preserving att racti ve coastal resources for other users, and the value associated with the belief that maintaining a litt er-free coast and ocean is intrinsically desirable” (Committ ee on the Eff ecti veness of Internati onal and Nati onal Measures to Prevent and Reduce Marine Debris and Its Impacts et al 2008: 40).
2.4.3 Public health and safety impacts
Marine litt er presents a number of public health and safety concerns including navigati onal hazards (Macfadyen et al 2009), injuries to recreati onal users (Cheshire et al 2009) and the risks associated with the leaching of poisonous chemicals (Thompson et al 2009b). However, establishing the extent and frequency of incidents involving marine litt er is very diffi cult as most incidents, both in terms of vessel damage and injuries, go unrecorded (Laist and Liff mann 2000; Sheavly 2005). More research is therefore required to assess the risks posed by marine litt er to public health and safety.
2.4.3.1 Navigati onal hazards
Marine litt er can present numerous diff erent safety risks for vessels but entanglement in derelict fi shing gear such as nets, ropes and lines presents a key concern. Plasti c bags are also a common cause of blocked water
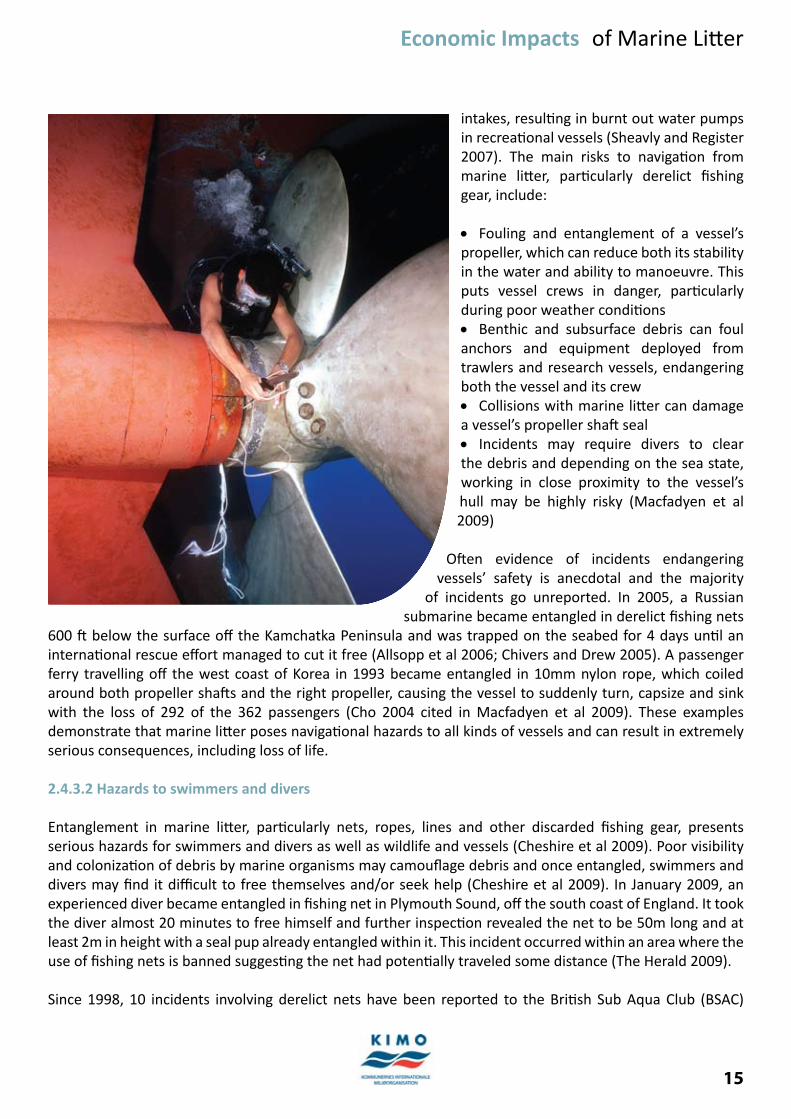
15
Economic Impacts of Marine Litt er
intakes, resulti ng in burnt out water pumps in recreati onal vessels (Sheavly and Register 2007). The main risks to navigati on from marine litt er, parti cularly derelict fi shing gear, include:
Fouling and entanglement of a vessel’s • propeller, which can reduce both its stability in the water and ability to manoeuvre. This puts vessel crews in danger, parti cularly during poor weather conditi ons
Benthic and subsurface debris can foul • anchors and equipment deployed from trawlers and research vessels, endangering both the vessel and its crew
Collisions with marine litt er can damage • a vessel’s propeller shaft seal
Incidents may require divers to clear • the debris and depending on the sea state, working in close proximity to the vessel’s hull may be highly risky (Macfadyen et al 2009)
Oft en evidence of incidents endangering vessels’ safety is anecdotal and the majority
of incidents go unreported. In 2005, a Russian submarine became entangled in derelict fi shing nets
600 ft below the surface off the Kamchatka Peninsula and was trapped on the seabed for 4 days unti l an internati onal rescue eff ort managed to cut it free (Allsopp et al 2006; Chivers and Drew 2005). A passenger ferry travelling off the west coast of Korea in 1993 became entangled in 10mm nylon rope, which coiled around both propeller shaft s and the right propeller, causing the vessel to suddenly turn, capsize and sink with the loss of 292 of the 362 passengers (Cho 2004 cited in Macfadyen et al 2009). These examples demonstrate that marine litt er poses navigati onal hazards to all kinds of vessels and can result in extremely serious consequences, including loss of life.
2.4.3.2 Hazards to swimmers and divers
Entanglement in marine litt er, parti cularly nets, ropes, lines and other discarded fi shing gear, presents serious hazards for swimmers and divers as well as wildlife and vessels (Cheshire et al 2009). Poor visibility and colonizati on of debris by marine organisms may camoufl age debris and once entangled, swimmers and divers may fi nd it diffi cult to free themselves and/or seek help (Cheshire et al 2009). In January 2009, an experienced diver became entangled in fi shing net in Plymouth Sound, off the south coast of England. It took the diver almost 20 minutes to free himself and further inspecti on revealed the net to be 50m long and at least 2m in height with a seal pup already entangled within it. This incident occurred within an area where the use of fi shing nets is banned suggesti ng the net had potenti ally traveled some distance (The Herald 2009).
Since 1998, 10 incidents involving derelict nets have been reported to the Briti sh Sub Aqua Club (BSAC)
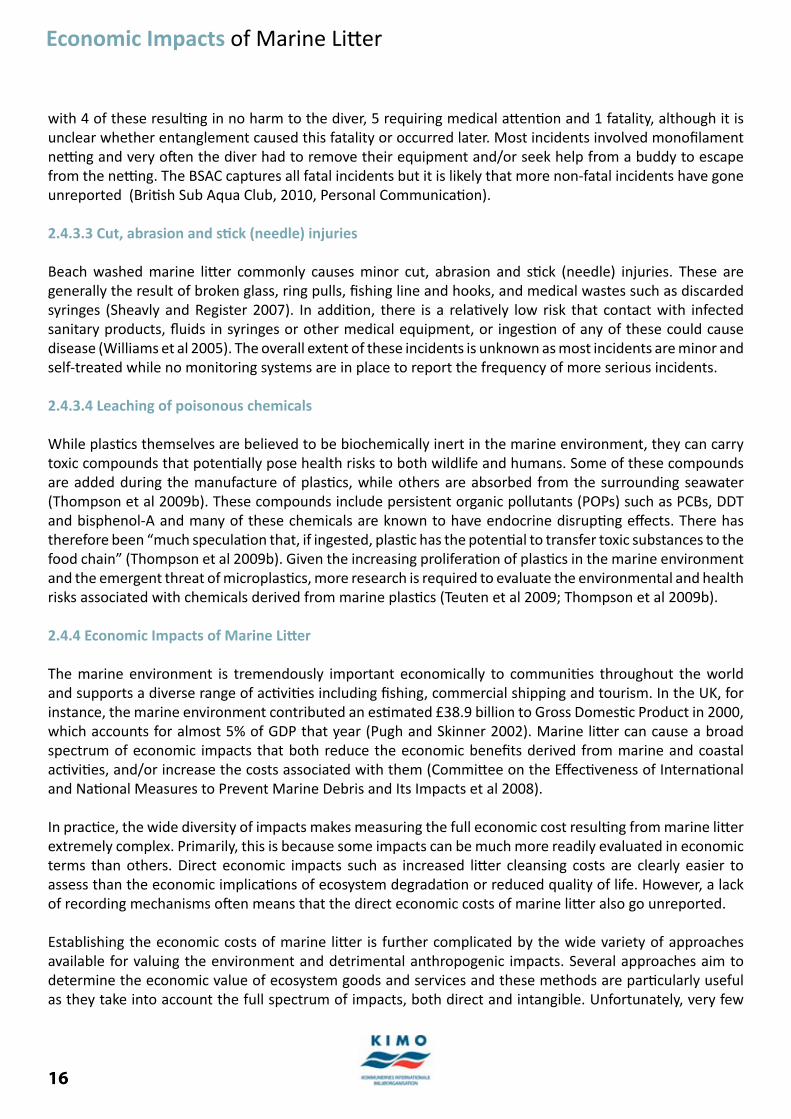
16
Economic Impacts of Marine Litt er
with 4 of these resulti ng in no harm to the diver, 5 requiring medical att enti on and 1 fatality, although it is unclear whether entanglement caused this fatality or occurred later. Most incidents involved monofi lament netti ng and very oft en the diver had to remove their equipment and/or seek help from a buddy to escape from the netti ng. The BSAC captures all fatal incidents but it is likely that more non-fatal incidents have gone unreported (Briti sh Sub Aqua Club, 2010, Personal Communicati on).
2.4.3.3 Cut, abrasion and sti ck (needle) injuries
Beach washed marine litt er commonly causes minor cut, abrasion and sti ck (needle) injuries. These are generally the result of broken glass, ring pulls, fi shing line and hooks, and medical wastes such as discarded syringes (Sheavly and Register 2007). In additi on, there is a relati vely low risk that contact with infected sanitary products, fl uids in syringes or other medical equipment, or ingesti on of any of these could cause disease (Williams et al 2005). The overall extent of these incidents is unknown as most incidents are minor and self-treated while no monitoring systems are in place to report the frequency of more serious incidents.
2.4.3.4 Leaching of poisonous chemicals
While plasti cs themselves are believed to be biochemically inert in the marine environment, they can carry toxic compounds that potenti ally pose health risks to both wildlife and humans. Some of these compounds are added during the manufacture of plasti cs, while others are absorbed from the surrounding seawater (Thompson et al 2009b). These compounds include persistent organic pollutants (POPs) such as PCBs, DDT and bisphenol-A and many of these chemicals are known to have endocrine disrupti ng eff ects. There has therefore been “much speculati on that, if ingested, plasti c has the potenti al to transfer toxic substances to the food chain” (Thompson et al 2009b). Given the increasing proliferati on of plasti cs in the marine environment and the emergent threat of microplasti cs, more research is required to evaluate the environmental and health risks associated with chemicals derived from marine plasti cs (Teuten et al 2009; Thompson et al 2009b).
2.4.4 Economic Impacts of Marine Litt er
The marine environment is tremendously important economically to communiti es throughout the world and supports a diverse range of acti viti es including fi shing, commercial shipping and tourism. In the UK, for instance, the marine environment contributed an esti mated £38.9 billion to Gross Domesti c Product in 2000, which accounts for almost 5% of GDP that year (Pugh and Skinner 2002). Marine litt er can cause a broad spectrum of economic impacts that both reduce the economic benefi ts derived from marine and coastal acti viti es, and/or increase the costs associated with them (Committ ee on the Eff ecti veness of Internati onal and Nati onal Measures to Prevent Marine Debris and Its Impacts et al 2008).
In practi ce, the wide diversity of impacts makes measuring the full economic cost resulti ng from marine litt er extremely complex. Primarily, this is because some impacts can be much more readily evaluated in economic terms than others. Direct economic impacts such as increased litt er cleansing costs are clearly easier to assess than the economic implicati ons of ecosystem degradati on or reduced quality of life. However, a lack of recording mechanisms oft en means that the direct economic costs of marine litt er also go unreported.
Establishing the economic costs of marine litt er is further complicated by the wide variety of approaches available for valuing the environment and detrimental anthropogenic impacts. Several approaches aim to determine the economic value of ecosystem goods and services and these methods are parti cularly useful as they take into account the full spectrum of impacts, both direct and intangible. Unfortunately, very few
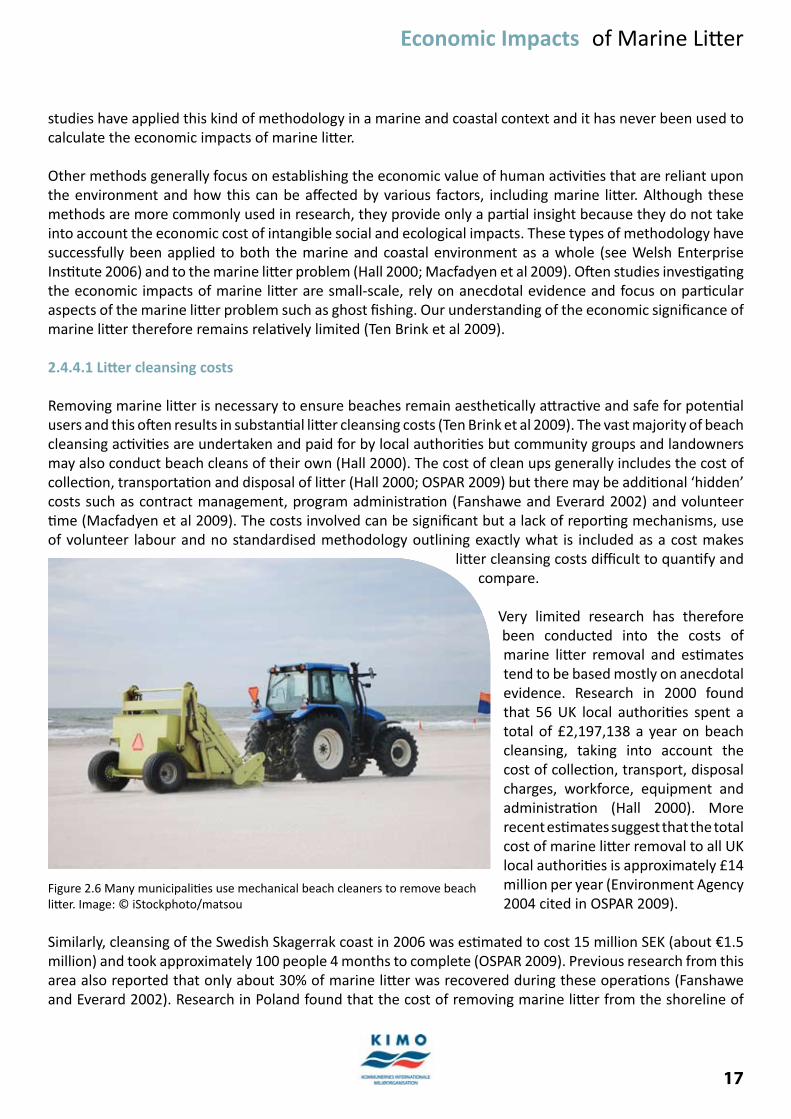
17
Economic Impacts of Marine Litt er
studies have applied this kind of methodology in a marine and coastal context and it has never been used to calculate the economic impacts of marine litt er.
Other methods generally focus on establishing the economic value of human acti viti es that are reliant upon the environment and how this can be aff ected by various factors, including marine litt er. Although these methods are more commonly used in research, they provide only a parti al insight because they do not take into account the economic cost of intangible social and ecological impacts. These types of methodology have successfully been applied to both the marine and coastal environment as a whole (see Welsh Enterprise Insti tute 2006) and to the marine litt er problem (Hall 2000; Macfadyen et al 2009). Oft en studies investi gati ng the economic impacts of marine litt er are small-scale, rely on anecdotal evidence and focus on parti cular aspects of the marine litt er problem such as ghost fi shing. Our understanding of the economic signifi cance of marine litt er therefore remains relati vely limited (Ten Brink et al 2009).
2.4.4.1 Litt er cleansing costs
Removing marine litt er is necessary to ensure beaches remain aestheti cally att racti ve and safe for potenti al users and this oft en results in substanti al litt er cleansing costs (Ten Brink et al 2009). The vast majority of beach cleansing acti viti es are undertaken and paid for by local authoriti es but community groups and landowners may also conduct beach cleans of their own (Hall 2000). The cost of clean ups generally includes the cost of collecti on, transportati on and disposal of litt er (Hall 2000; OSPAR 2009) but there may be additi onal ‘hidden’ costs such as contract management, program administrati on (Fanshawe and Everard 2002) and volunteer ti me (Macfadyen et al 2009). The costs involved can be signifi cant but a lack of reporti ng mechanisms, use of volunteer labour and no standardised methodology outlining exactly what is included as a cost makes
litt er cleansing costs diffi cult to quanti fy and compare.
Very limited research has therefore been conducted into the costs of marine litt er removal and esti mates tend to be based mostly on anecdotal evidence. Research in 2000 found that 56 UK local authoriti es spent a total of £2,197,138 a year on beach cleansing, taking into account the cost of collecti on, transport, disposal charges, workforce, equipment and administrati on (Hall 2000). More recent esti mates suggest that the total cost of marine litt er removal to all UK local authoriti es is approximately £14 million per year (Environment Agency 2004 cited in OSPAR 2009).
Similarly, cleansing of the Swedish Skagerrak coast in 2006 was esti mated to cost 15 million SEK (about €1.5 million) and took approximately 100 people 4 months to complete (OSPAR 2009). Previous research from this area also reported that only about 30% of marine litt er was recovered during these operati ons (Fanshawe and Everard 2002). Research in Poland found that the cost of removing marine litt er from the shoreline of
Figure 2.6 Many municipaliti es use mechanical beach cleaners to remove beach litt er. Image: © iStockphoto/matsou
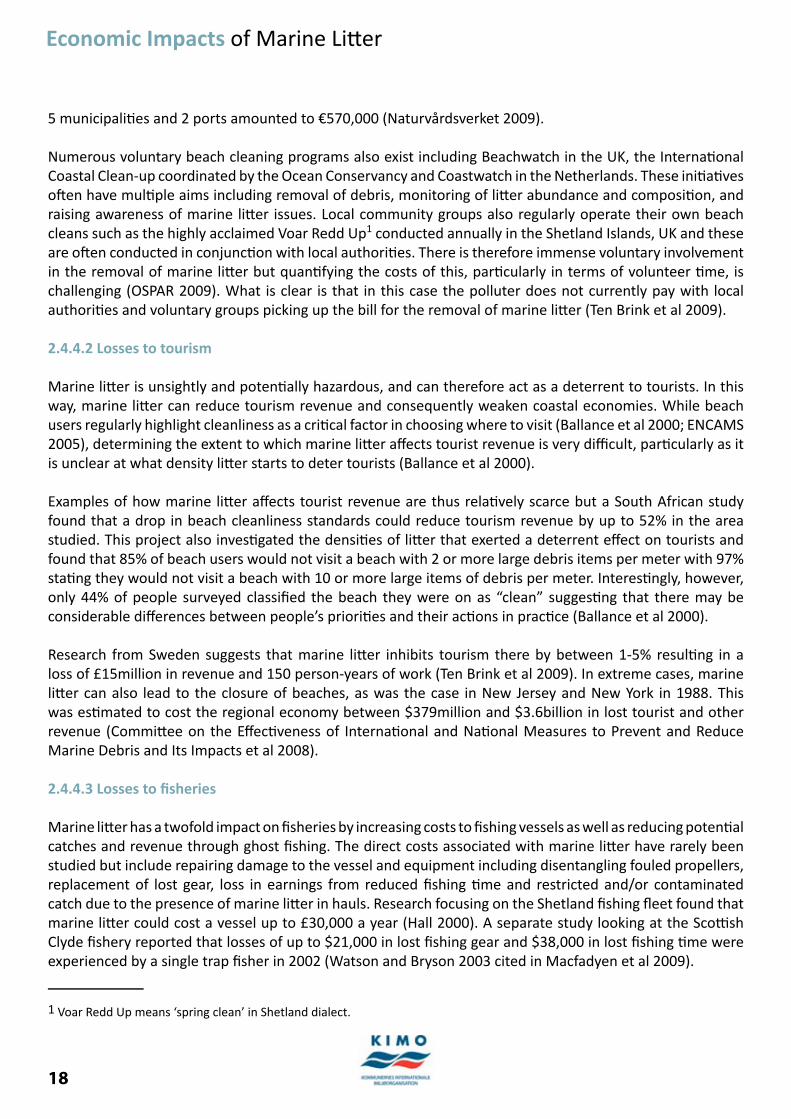
18
Economic Impacts of Marine Litt er
5 municipaliti es and 2 ports amounted to €570,000 (Naturvårdsverket 2009).
Numerous voluntary beach cleaning programs also exist including Beachwatch in the UK, the Internati onal Coastal Clean-up coordinated by the Ocean Conservancy and Coastwatch in the Netherlands. These initi ati ves oft en have multi ple aims including removal of debris, monitoring of litt er abundance and compositi on, and raising awareness of marine litt er issues. Local community groups also regularly operate their own beach cleans such as the highly acclaimed Voar Redd Up1 conducted annually in the Shetland Islands, UK and these are oft en conducted in conjuncti on with local authoriti es. There is therefore immense voluntary involvement in the removal of marine litt er but quanti fying the costs of this, parti cularly in terms of volunteer ti me, is challenging (OSPAR 2009). What is clear is that in this case the polluter does not currently pay with local authoriti es and voluntary groups picking up the bill for the removal of marine litt er (Ten Brink et al 2009).
2.4.4.2 Losses to tourism
Marine litt er is unsightly and potenti ally hazardous, and can therefore act as a deterrent to tourists. In this way, marine litt er can reduce tourism revenue and consequently weaken coastal economies. While beach users regularly highlight cleanliness as a criti cal factor in choosing where to visit (Ballance et al 2000; ENCAMS 2005), determining the extent to which marine litt er aff ects tourist revenue is very diffi cult, parti cularly as it is unclear at what density litt er starts to deter tourists (Ballance et al 2000).
Examples of how marine litt er aff ects tourist revenue are thus relati vely scarce but a South African study found that a drop in beach cleanliness standards could reduce tourism revenue by up to 52% in the area studied. This project also investi gated the densiti es of litt er that exerted a deterrent eff ect on tourists and found that 85% of beach users would not visit a beach with 2 or more large debris items per meter with 97% stati ng they would not visit a beach with 10 or more large items of debris per meter. Interesti ngly, however, only 44% of people surveyed classifi ed the beach they were on as “clean” suggesti ng that there may be considerable diff erences between people’s prioriti es and their acti ons in practi ce (Ballance et al 2000).
Research from Sweden suggests that marine litt er inhibits tourism there by between 1-5% resulti ng in a loss of £15million in revenue and 150 person-years of work (Ten Brink et al 2009). In extreme cases, marine litt er can also lead to the closure of beaches, as was the case in New Jersey and New York in 1988. This was esti mated to cost the regional economy between $379million and $3.6billion in lost tourist and other revenue (Committ ee on the Eff ecti veness of Internati onal and Nati onal Measures to Prevent and Reduce Marine Debris and Its Impacts et al 2008).
2.4.4.3 Losses to fi sheries
Marine litt er has a twofold impact on fi sheries by increasing costs to fi shing vessels as well as reducing potenti al catches and revenue through ghost fi shing. The direct costs associated with marine litt er have rarely been studied but include repairing damage to the vessel and equipment including disentangling fouled propellers, replacement of lost gear, loss in earnings from reduced fi shing ti me and restricted and/or contaminated catch due to the presence of marine litt er in hauls. Research focusing on the Shetland fi shing fl eet found that marine litt er could cost a vessel up to £30,000 a year (Hall 2000). A separate study looking at the Scotti sh Clyde fi shery reported that losses of up to $21,000 in lost fi shing gear and $38,000 in lost fi shing ti me were experienced by a single trap fi sher in 2002 (Watson and Bryson 2003 cited in Macfadyen et al 2009).
1 Voar Redd Up means ‘spring clean’ in Shetland dialect.
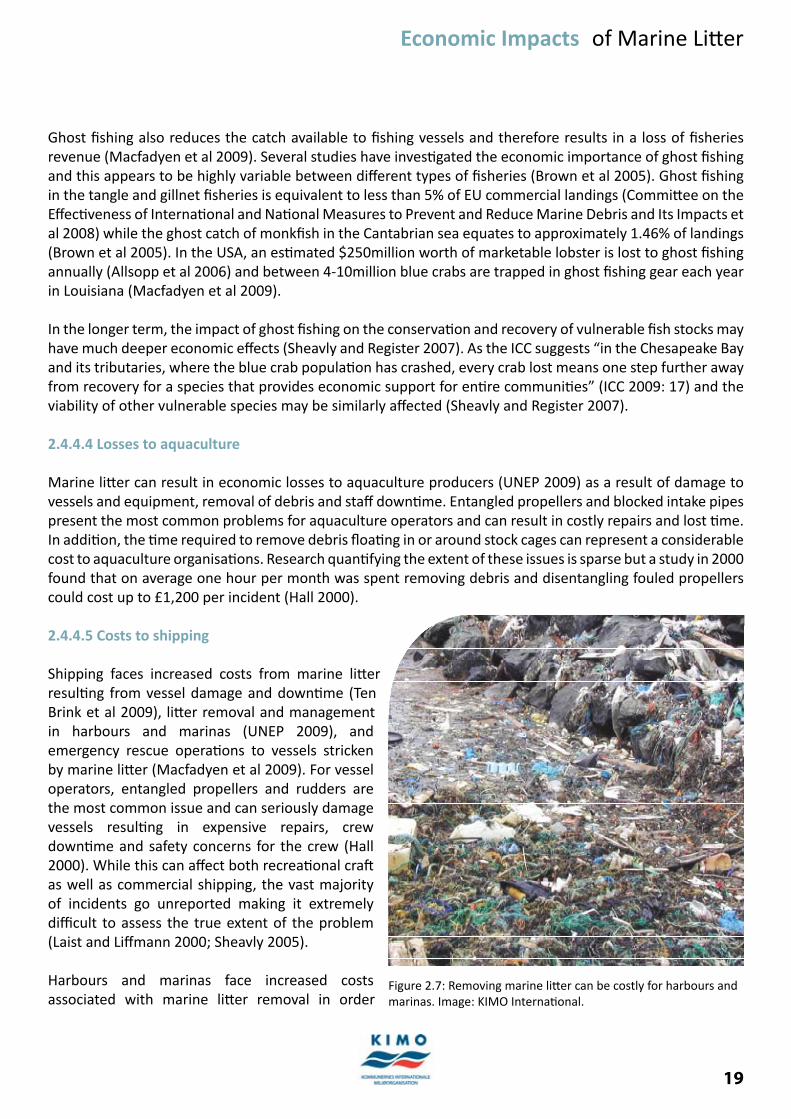
19
Economic Impacts of Marine Litt er
Ghost fi shing also reduces the catch available to fi shing vessels and therefore results in a loss of fi sheries revenue (Macfadyen et al 2009). Several studies have investi gated the economic importance of ghost fi shing and this appears to be highly variable between diff erent types of fi sheries (Brown et al 2005). Ghost fi shing in the tangle and gillnet fi sheries is equivalent to less than 5% of EU commercial landings (Committ ee on the Eff ecti veness of Internati onal and Nati onal Measures to Prevent and Reduce Marine Debris and Its Impacts et al 2008) while the ghost catch of monkfi sh in the Cantabrian sea equates to approximately 1.46% of landings (Brown et al 2005). In the USA, an esti mated $250million worth of marketable lobster is lost to ghost fi shing annually (Allsopp et al 2006) and between 4-10million blue crabs are trapped in ghost fi shing gear each year in Louisiana (Macfadyen et al 2009).
In the longer term, the impact of ghost fi shing on the conservati on and recovery of vulnerable fi sh stocks may have much deeper economic eff ects (Sheavly and Register 2007). As the ICC suggests “in the Chesapeake Bay and its tributaries, where the blue crab populati on has crashed, every crab lost means one step further away from recovery for a species that provides economic support for enti re communiti es” (ICC 2009: 17) and the viability of other vulnerable species may be similarly aff ected (Sheavly and Register 2007).
2.4.4.4 Losses to aquaculture
Marine litt er can result in economic losses to aquaculture producers (UNEP 2009) as a result of damage to vessels and equipment, removal of debris and staff downti me. Entangled propellers and blocked intake pipes present the most common problems for aquaculture operators and can result in costly repairs and lost ti me. In additi on, the ti me required to remove debris fl oati ng in or around stock cages can represent a considerable cost to aquaculture organisati ons. Research quanti fying the extent of these issues is sparse but a study in 2000 found that on average one hour per month was spent removing debris and disentangling fouled propellers could cost up to £1,200 per incident (Hall 2000).
2.4.4.5 Costs to shipping
Shipping faces increased costs from marine litt er resulti ng from vessel damage and downti me (Ten Brink et al 2009), litt er removal and management in harbours and marinas (UNEP 2009), and emergency rescue operati ons to vessels stricken by marine litt er (Macfadyen et al 2009). For vessel operators, entangled propellers and rudders are the most common issue and can seriously damage vessels resulti ng in expensive repairs, crew downti me and safety concerns for the crew (Hall 2000). While this can aff ect both recreati onal craft as well as commercial shipping, the vast majority of incidents go unreported making it extremely diffi cult to assess the true extent of the problem (Laist and Liff mann 2000; Sheavly 2005).
Harbours and marinas face increased costs associated with marine litt er removal in order
Figure 2.7: Removing marine litt er can be costly for harbours and marinas. Image: KIMO Internati onal.

20
Economic Impacts of Marine Litt er
to ensure that their faciliti es are safe and att racti ve for users. This can involve both the manual removal of fl oati ng debris and additi onal dredging to remove items obstructi ng the seabed. Although the costs of these acti viti es are believed to be signifi cant (UNEP 2009), only one study, undertaken by Hall in 2000, has investi gated the costs marine litt er poses for harbours and marinas. For harbours in the UK, the removal of debris could cost up to £15,000 a year with manual clearance of the harbour required up to four ti mes per week. Incidences of fouled propellers were also reported by 82% of harbours, although these costs are borne by vessel operators themselves. Anecdotal evidence received from marinas during the same study suggested that some marinas had to be manually cleaned on a daily basis at a cost of up to £10,000 a year (Hall 2000).
The cost of emergency rescues to vessels stricken by marine litt er can also be substanti al and most operati ons are commonly a result of entangled or fouled propellers. Research in 1998 found that 230 rescues were undertaken to vessels with fouled propellers in UK waters at a cost of £2,200 to £5,800 per incident, depending on the type of lifeboat required. This amounted to an overall cost of between £506,000 and £1,334,000 for that year (Hall 2000). In 2005, the US Coastguard made 269 rescues to incidents involving marine litt er resulti ng in 15 deaths, 116 injuries and $3 million in property damage (Moore 2008).
2.4.4.6 Control and eradicati on of invasive non-nati ve species
Non-nati ve species can travel by a number of means including through the colonisati on of marine litt er (Moore 2008; Gregory 2009). While tracing occurrences of non-nati ve species back to marine litt er is extremely diffi cult, marine litt er is esti mated to have doubled the opportuniti es for marine organisms to travel at tropical lati tudes and more than tripled it at high (>50°) lati tudes (Allsopp et al 2006). The introducti on of invasive non-nati ve species can have a highly damaging impact on the environment (Derraik 2002; Gregory 2009) and result in substanti al economic costs and losses (Donnan 2009).
At the very least, the discovery of invasive species results in increased costs due to monitoring, control and eradicati on measures. Additi onal losses can be incurred from the fouling of equipment and vessels, deteriorati on of ecosystem functi ons, loss of amenity value and impacts on human health (Donnan 2009). In a relati vely short period of ti me, invasive species can destroy enti re ecosystems and decimate the industries that relied upon them. The introducti on of the American comb jellyfi sh into the Black Sea during the 1990s, for instance, is widely accepted to have caused the collapse of the anchovy fi sheries with economic losses of €240million (Naturvårdsverket 2009).
The discovery of the Carpet sea squirt (Didemnum vexillum) in Holyhead Harbour in Wales in 2009 illustrates the range of costs involved in the control and eradicati on of invasive species. The carpet sea squirt has no known predators and its thick, sheet-like growths can smother organisms and marine habitats. The means by which the carpet sea squirt reached Holyhead Harbour are unknown but an eradicati on and monitoring program over the next 10 years is expected to cost approximately £525,000. The costs of inacti on, however, could amount to up to £6,875,625 over the same period for the nearby mussel fi sheries alone and could be signifi cantly higher were the carpet sea squirt to become established elsewhere in UK waters (Holt 2009).
2.4.4.7 Costs to coastal agriculture
Marine litt er can cause a broad spectrum of hazards and costs for the agriculture industry including damage to property and equipment, harm to livestock, additi onal vets bills and lost ti me removing debris (Hall 2000). Virtually no research, however, has been undertaken to document the extent and signifi cance of these impacts. A project in 2000 focusing on agriculture in Shetland found that 96% of responding farmers had
21
Economic Impacts of Marine Litt er
experienced problems with debris blowing onto their land and this could cost them up to £400 a year (Hall 2000). Unfortunately, no similar research has been undertaken to assess the extent of the problem in other locati ons.
2.4.4.8 Costs to power stati ons
The eff ects of marine litt er on power stati ons can include blockage of cooling water intake screens, increased removal of debris from screens and additi onal maintenance costs. Determining the extent of these costs is complex, parti cularly as costs resulti ng from marine litt er are diffi cult to diff erenti ate from those due to natural debris such as seaweed. Anecdotal evidence suggests that marine litt er can cost companies up to £50,000 to remove with additi onal costs for pump maintenance (Hall 2000) but it is unknown how widespread these impacts are.
2.4.4.9 Environmental damage and ecosystem degradati on
From the entanglement of wildlife to the loss of biodiversity, marine litt er can aff ect the environment in numerous ways. While these eff ects are all likely to have economic implicati ons, evaluati ng environmental damage in economic terms is extremely challenging and has generally not been addressed by research. Therefore “we do not have a complete picture of the magnitude of economic damages associated with the ecological eff ects of marine debris” (Laist and Liff mann 2000).
Establishing what the long-term eff ects of marine litt er will be on the environment is similarly highly complex and diffi cult to translate into economic damages. The potenti al for marine litt er to contribute to ecosystem deteriorati on and aff ect the oceans’ resilience to large-scale perturbati ons in future is a criti cal concern (Derraik 2002; ICC 2009) and research is urgently required to investi gate what the costs, both environmental and economic, of taking no further acti on to reduce marine litt er will be.
22
Economic Impacts of Marine Litt er
3. Legislati on and Policy Context
3.1 Key internati onal legislati on
A wide range of internati onal agreements and legislati on both directly and indirectly address the problem of marine litt er. Several pieces of legislati on are specifi cally designed to reduce marine litt er and prevent the discharge of waste into the marine environment but many of the existi ng agreements take a broader approach and outline fundamental principles for the sustainable use and conservati on of the oceans. The key pieces of internati onal legislati on are briefl y outlined below.
3.1.1 United Nati ons Conventi on on Oceans and the Law of the Sea (UNCLOS)
UNCLOS is designed to comprehensively govern the management of marine resources and their conservati on for future generati ons. Provisions of the Conventi on include territorial sea limits, conservati on and management of living marine resources, protecti on of the marine environment, economic and commercial acti viti es, marine scienti fi c research and a binding procedure for the sett lement of disputes relati ng to the oceans.
The protecti on and preservati on of the marine environment is addressed by Part XII of the Conventi on (Arti cles 192-237) which outlines basic obligati ons to prevent, reduce and control polluti on from land-based sources; polluti on from sea-bed acti viti es subject to nati onal jurisdicti on; polluti on from acti viti es in the Area; polluti on by dumping; polluti on from vessels; and polluti on from or through the atmosphere. Marine litt er was specifi cally addressed in November 2005 as part of UN General Assembly Resoluti on A/RES/60/30 – Oceans and the Law of the sea, which states:
“…The General Assembly,
65. Notes the lack of informati on and data on marine debris and encourages relevant nati onal and internati onal organisati ons to undertake further studies on the extent and nature of the problem, also encourages States to develop partnerships with industry and civil society to raise awareness of the extent of the impact of marine litt er on the health and producti vity of the marine environment and consequent economic loss;
66. Urges States to integrate the issue of marine debris within nati onal strategies dealing with waste management in the coastal zone, ports and mariti me industries, including recycling, reuse, reducti on and disposal, and to encourage the development of appropriate economic incenti ves to address this issue including the development of cost recovery systems that provide an incenti ve to use port recepti on faciliti es and discourage ships from discharging marine debris at sea, and encourages States to cooperate regionally and subregionally to develop and implement joint preventi on and recovery programmes for marine debris;…”
3.1.2 Internati onal Conventi on for the Preventi on of Marine Polluti on from Ships, 1973, as modifi ed by the Protocol of 1978 relati ng thereto (MARPOL 73/78) Annex V
The MARPOL Conventi on is the key internati onal agreement to prevent polluti on of the marine environment by ships and has six annexes concentrati ng on diff erent types of polluti on, as shown in Table 3.1 overleaf. Annex I (Oil) and Annex II (Chemicals) are compulsory but the other annexes are voluntary.

23
Economic Impacts of Marine Litt er
Annex I OilAnnex II Noxious liquid substances by bulk
Annex IIIHarmful substances carried by sea in packaged form or freight containers, portable tanks, or road and rail tank wagons
Annex IV SewageAnnex V GarbageAnnex VI Air polluti on
Table 3.1 Polluti on types covered by MARPOL Annexes I-VI
MARPOL Annex V regulates the types and quanti ti es of garbage that ships may discharge into the sea and specifi es the distances from land and manner in which they may be disposed of. For the purposes of Annex V, garbage includes “all kinds of food, domesti c and operati ng waste, excluding fresh fi sh, generated during the normal operati on of the vessel and liable to be disposed of conti nuously or periodically” (IMO 2002).
Under these regulati ons, the disposal of plasti c anywhere into the sea is strictly prohibited and the discharge of other wastes is severely restricted in coastal waters and “Special Areas”. The North Sea and adjacent areas are designated “Special Areas” under MARPOL Annex V and in accordance with these regulati ons, discharges of garbage, except food waste, into the sea are strictly prohibited.
As of March 2010, 140 states have rati fi ed MARPOL Annex V and these regulati ons now cover 97.5% of the world’s shipping tonnage (IMO 2010). The Internati onal Mariti me Organisati on (IMO) is currently reviewing MARPOL Annex V, in consultati on with relevant stakeholders, to assess and improve its eff ecti veness in addressing ocean-based sources of marine litt er.
3.1.3 London Conventi on on the Preventi on of Marine Polluti on by Dumping of Wastes and Other Matt er, 1972, and 1996 Protocol relati ng thereto
The London Conventi on aims to promote the eff ecti ve management of all sources of marine polluti on and prevent the dumping of wastes and other matt er at sea. It operates using a “black- and grey-list approach” whereby dumping of all blacklist items is strictly prohibited; dumping of grey-list materials requires a special permission and is subject to strict control; and the dumping of all other items is allowed with a general permit. Annex I of the London Conventi on explicitly prohibits signatories from dumping persistent plasti cs and other non-biodegradable materials into the sea from ships and other man-made structures.
Agreed in 1996, the London Protocol aims to modernise the Conventi on and will eventually replace it. The Protocol’s objecti ve is to protect the marine environment from all sources of polluti on and therefore all dumping is prohibited under the Protocol with the excepti on of possibly acceptable wastes on the “reverse list”. States can be a Party to either the London Conventi on 1972, or the 1996 Protocol, or both.
3.1.4 Other internati onal agreements
The following internati onal agreements are also important for the protecti on of the marine environment and the preventi on of marine litt er.
Agenda 21: The United Nati ons Programme of Acti on from Rio and the Johannesburg Plan of • Implementati onConventi on on Biological Diversity 1992, with the Jakarta Mandate on the Conservati on and •

24
Economic Impacts of Marine Litt er
Sustainable Use of Marine and Coastal Biological Diversity 1995
3.2 Key European legislati on
The European Union has introduced a number of directi ves that aff ect the marine litt er problem. Although this legislati on addresses a wide range of issues, they can be broadly categorised into directi ves that address the sustainable use of the marine environment; directi ves that focus on reducing ship based polluti on and directi ves that address the wider issue of waste in general. The key pieces of European legislati on are outlined below.
3.2.1 EU Marine Strategy Framework Directi ve (2008/56/EC)
The Marine Strategy Framework Directi ve (MSFD) was agreed in 2008 and is the fi rst integrated policy for the protecti on of the marine environment. The MSFD aims to address multi ple threats to the marine environment including climate change, over fi shing, loss of biodiversity, eutrophicati on, introducti on of alien species and polluti on from land- and ocean-based sources. Under the MSFD, Member States are required to develop strategies to achieve or maintain good environmental status in the marine environment by the year 2020 and must meet a strict ti metable for implementati on.
Good environmental status is defi ned under the MSFD as “the environmental status of marine waters where these provide ecologically diverse and dynamic oceans and seas which are clean, healthy and producti ve within their intrinsic conditi ons, and the use of the marine environment is at a level that is sustainable, thus safeguarding the potenti al for uses and acti viti es by current and future generati ons”. The MSFD also outlines 11 qualitati ve descriptors for determining good environmental status, one of which explicitly identi fi es marine litt er as an issue to be addressed by the MSFD. The descriptor states that to achieve good environmental status, the “properti es and quanti ti es of marine litt er do not cause harm to the coastal and marine environment”2
3.2.2 EU Directi ve on port recepti on faciliti es for ship-generated waste and cargo residues (EC2000/59)
This Directi ve aims to signifi cantly reduce the illegal discharge of ship-generated waste and cargo residues into the marine environment by improving the availability and use of port recepti on faciliti es. The regulati ons entered into force in July 2003 and key terms include:
The mandatory provision of waste recepti on faciliti es in all ports, tailored to the size of port and type • of vessels calling there. Ports must draw up waste recepti on and handling plans to be inspected and approved by Member States every three yearsAll ships must deliver their waste to the port recepti on faciliti es before leaving the port or terminal, • unless they are exempt or have suffi cient dedicated storage capacity to store the waste unti l the next port of callCaptains of ships bound for a port or terminal must noti fy it of certain informati on including the types • and quanti ti es of waste for discharge and the date and last port where waste was dischargedShips that do not deliver waste in one port and who are not subject to an exempti on will be reported • to their next port of call and required to undergo a detailed inspecti on before cargo and passengers
2 For the full text of the Marine Strategy Framework Directi ve, including Annexes, see htt p://eur-lex.europa.eu/LexUriServ/LexUriServ.do?uri=OJ:L:2008:164:0019:0040:EN:PDF
25
Economic Impacts of Marine Litt er
can be transferredPorts must establish a cost-recovery system to encourage vessels to discharge their waste on land and • discourage dumping at sea. All ships must pay a mandatory charge to make a signifi cant contributi on to the cost of the port recepti on faciliti es for ship generated waste, irrespecti ve of whether they use them or notMember states must ensure proper monitoring of compliance with the directi ve, both by ships and • ports, and submit a progress report to the European Commission every three years about the status of the Directi ve’s implementati on
3.2.3 Other European legislati on
The following European directi ves also contain provisions that aff ect marine litt er:
EU Bathing Water Directi ve (76/160/EEC and 2006/7/EC)• EC Urban Waste Water Treatment Directi ve (91/271/EEC and 98/15/EC)• EU Environmental Liability Directi ve (2004/35/EC) • EU Directi ve on Packaging and Packaging waste (2004/12/EC)• EU Waste Framework Directi ve 2006/12/EEC (to be replaced by 2008/98/EC with eff ect from 12 • December 2010)
3.3 Nati onal legislati on
There is no nati onal legislati on or policy dedicated to addressing marine litt er in any country within the North Atlanti c region. Many countries have, however, passed legislati on to enact the European directi ves and key pieces of internati onal legislati on, such as MARPOL, that have a bearing on marine litt er. Nati onal legislati on to address waste management, litt ering and the illegal discharge of waste is also common in countries throughout this region.
In 2009, the United Kingdom became the fi rst country in the world to introduce a single piece of legislati on to protect the marine environment when it passed the Marine and Coastal Access Act. This act outlines the Government’s vision for “clean, healthy, safe, producti ve and biologically diverse oceans and seas” (DEFRA 2009) and sets out a framework for delivering sustainable marine and coastal development, taking into account environmental, social and economic concerns.

26
Economic Impacts of Marine Litt er
4. Methodology
Taking Hall’s (2000) pioneering project as a starti ng point, the methodology adopted here focuses on the economic impact of marine litt er on human acti viti es and uses a sector-based approach to investi gate the increased costs and potenti al loss of revenue associated with marine litt er for key industries. This approach does not include an evaluati on of the economic cost of degradati on of ecosystem goods and services due to marine litt er and the fi ndings presented in this report are therefore likely to signifi cantly underesti mate the total economic costs of marine litt er.
4.1 Developing a methodology
Marine litt er can directly cause numerous economic impacts, parti cularly in terms of litt er clearance and removal. Marine litt er can also result in a wide range of indirect economic impacts, which are associated with the environmental, social, and public health and safety impacts of marine litt er. Evaluati ng the direct economic impacts of marine litt er such as increased litt er cleansing costs is relati vely straightf orward but many other impacts, parti cularly environmental eff ects, can be diffi cult to translate into economic terms. Loss of ecosystem functi ons and reduced biodiversity, for example, will clearly have economic implicati ons but in practi ce these are very diffi cult to measure. Esti mati ng the full economic impact of marine litt er is therefore complex as many impacts are challenging to quanti fy in economic terms.
As a result, “to date, very litt le informati on has been reported on the economic impacts of marine litt er” (UNEP 2009a: 10) and Hall’s (2000) project remains one of the few studies to investi gate the economic cost of marine litt er. The approach adopted by Hall focused on establishing how marine litt er aff ected the economic value of human acti viti es that relied upon a healthy marine environment. In practi ce, this was applied in terms of the increased costs or potenti al loss of revenue incurred due to marine litt er by various key industries.
It was decided to follow a similar approach in this assessment for several reasons. Firstly, research focusing on the economic value of human acti viti es has a strong theoreti cal basis and has been applied previously in a marine litt er context. This approach was similarly att racti ve due to its relati ve simplicity and, as it is based on actual expenditure, the increased likelihood that data would be available. Narrowing the focus of the project to examine the economic impacts of marine litt er upon human acti viti es, rather than the full spectrum of economic impacts, also enabled the project to balance key ti me and resource constraints.
Putti ng this approach into practi ce fi rstly involved identi fying the key sectors of human acti vity that could be aff ected by marine litt er. The sectors involved in this project are:
Agriculture• Aquaculture• Fisheries• Harbours• Industrial seawater users• Marinas• Municipaliti es• Power stati ons• Rescue services• Voluntary organisati ons• Water Authoriti es•

27
Economic Impacts of Marine Litt er
Each sector was then assessed individually to determine how marine litt er could aff ect them and the ways in which it could result in increased costs and/or a loss of revenue, as outlined in Figure 4.1 overleaf. Separate questi onnaires were then developed for each sector based on these issues and these were distributed to organisati ons throughout the Northeast Atlanti c region. Questi onnaires were identi fi ed as the most suitable method for collecti ng data as the project focused on a wide variety of sectors in a number of diff erent countries.
Short follow up questi onnaires were also developed to investi gate the wider context of the impacts of marine litt er. These follow up questi onnaires were broadly similar for all sectors and were designed to provide insights into the percepti ons, sensiti vity and prioriti es of various sectors with regard to marine litt er and its impact on the marine environment.
4.2 Data collecti on
The project began in 2007 and was conducted over a 3-year period due to changes in personnel. The project’s focus on the Northeast Atlanti c region required the distributi on of questi onnaires in a number of countries and this was carried out in conjuncti on with KIMO networks. Oft en, the support of industry organisati ons and associati ons was invaluable in making contacts and distributi ng the questi onnaires. The majority of questi onnaires were sent out via post or email but some were also conducted over the telephone and distributed at meeti ngs.
The main project questi onnaires were distributed in all the countries involved in 2007/2008. Based on the responses received, a clear format for the project emerged structured around a UK core with case studies and anecdotal evidence from other countries wherever data was available. To achieve this, it was necessary to strengthen the number of UK responses received and therefore a second set of questi onnaires was distributed within the UK in 2009. In total, 2,090 questi onnaires were distributed and Table 4.1 below shows how these were divided between countries. Refl ecti ng the fi nal structure of the project, the majority of questi onnaires were distributed within the UK.
Country Number of questi onnaires distributed Belgium Distributed by partner KIMO NetworkDenmark 41Ireland Distributed by partner KIMO NetworkNetherlands Distributed by partner KIMO NetworkNorway 363Portugal 114Spain 462Sweden 87UK 1023Total 2090 (plus network distributi on)
Table 4.1 Number of questi onnaires distributed per country
Responses were received from a total of 352 individuals and organisati ons overall, which represents a 16.9% response rate on average. Based on the structure of this report, a breakdown of the responses in each sector is given in Table 4.2 overleaf.
Short follow up questi onnaires were also developed to examine the wider context of the impact of marine

28
Economic Impacts of Marine Litt er
Figure 4.1: The impacts of marine litt er on sectors which rely on the marine environment
Municipaliti es
Statutory duty
Negati ve publicity
Beach awards
Public health risks
Legal acti on
Hidden costs
Disposal costsBeach cleansing
costs
Sea fi sheries
Lost and damaged fi shing
gear
Vessel damage and staff downti me
Contaminati on incidents
Reduced earnings and lost fi shing ti me
Restricted catch due to litt er in nets
Tourism
Negati ve publicity and reputati on
Area promoti on and branding
Reduced revenue
Beach awards
Reduced recreati onal
opportuniti es
Loss of aestheti cs and visual amenity
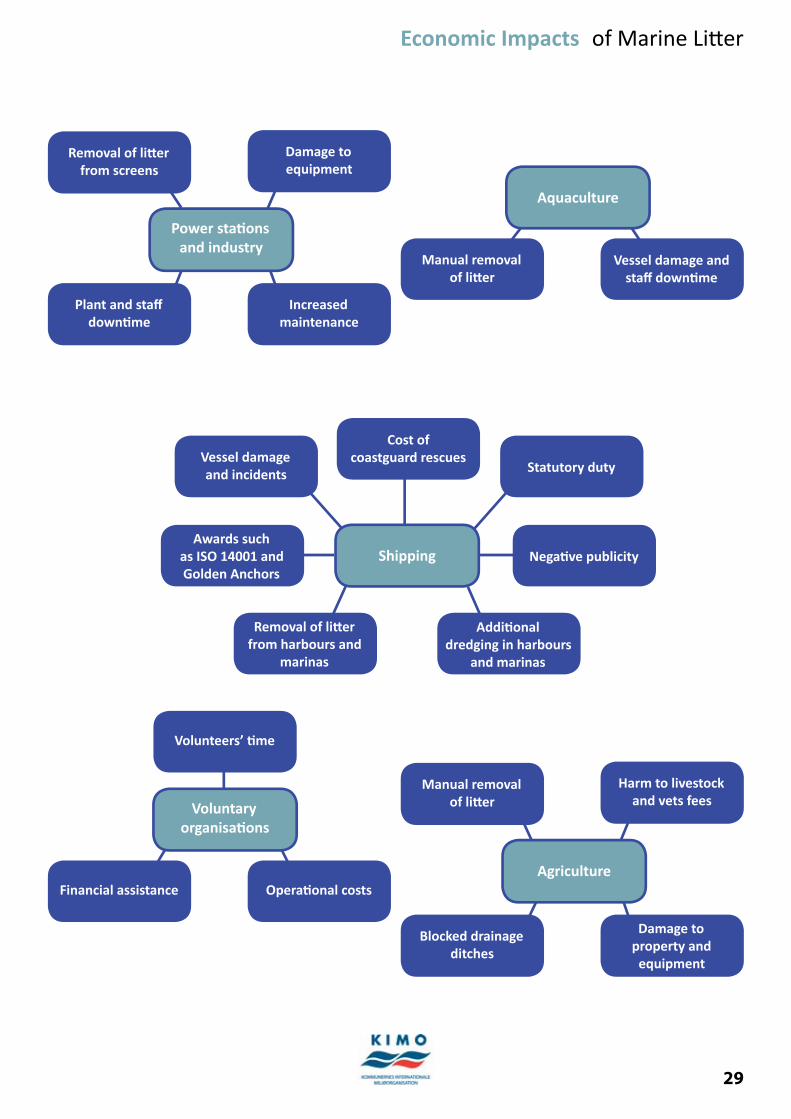
29
Economic Impacts of Marine Litt er
Aquaculture
Manual removal of litt er
Vessel damage and staff downti me
Voluntary organisati ons
Financial assistance Operati onal costs
Volunteers’ ti me
Power stati ons and industry
Damage to equipment
Increased maintenance
Removal of litt er from screens
Plant and staff downti me
Agriculture
Harm to livestock and vets fees
Damage to property and
equipment
Manual removal of litt er
Blocked drainage ditches
Shipping
Statutory duty
Negati ve publicity
Additi onal dredging in harbours
and marinas
Cost of coastguard rescuesVessel damage
and incidents
Awards such as ISO 14001 and Golden Anchors
Removal of litt er from harbours and
marinas
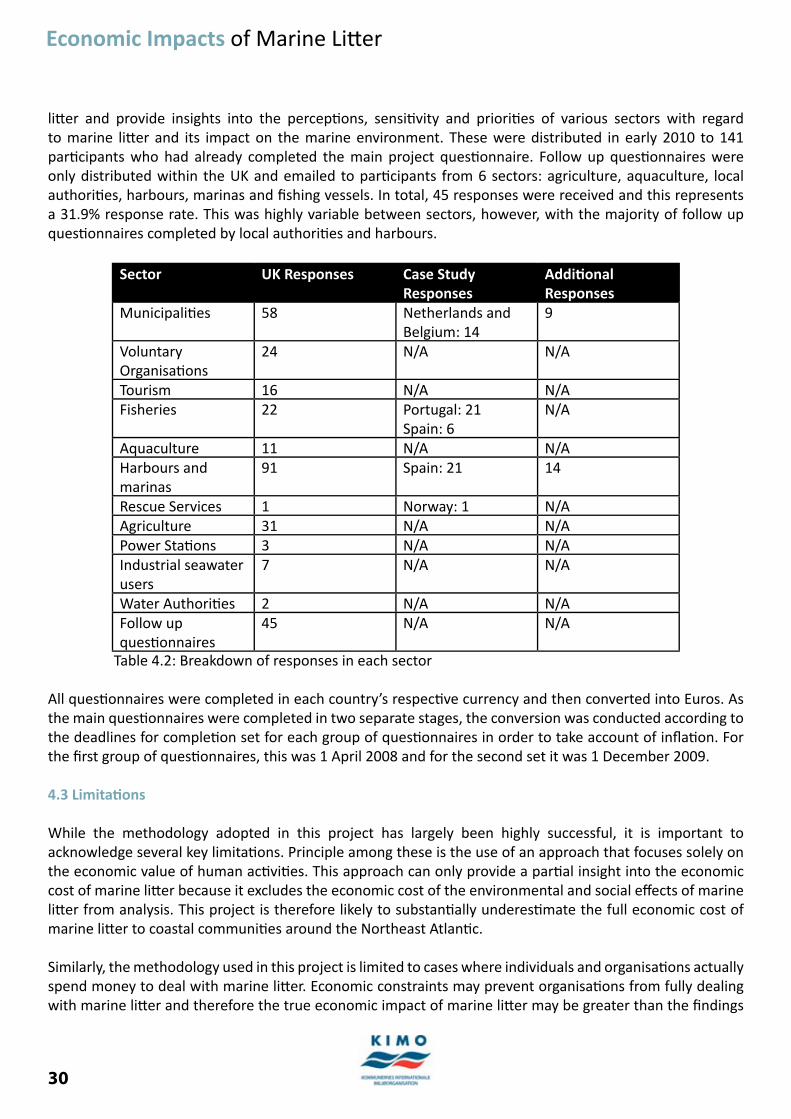
30
Economic Impacts of Marine Litt er
litt er and provide insights into the percepti ons, sensiti vity and prioriti es of various sectors with regard to marine litt er and its impact on the marine environment. These were distributed in early 2010 to 141 parti cipants who had already completed the main project questi onnaire. Follow up questi onnaires were only distributed within the UK and emailed to parti cipants from 6 sectors: agriculture, aquaculture, local authoriti es, harbours, marinas and fi shing vessels. In total, 45 responses were received and this represents a 31.9% response rate. This was highly variable between sectors, however, with the majority of follow up questi onnaires completed by local authoriti es and harbours.
Sector UK Responses Case Study Responses
Additi onal Responses
Municipaliti es 58 Netherlands and Belgium: 14
9
Voluntary Organisati ons
24 N/A N/A
Tourism 16 N/A N/AFisheries 22 Portugal: 21
Spain: 6N/A
Aquaculture 11 N/A N/AHarbours and marinas
91 Spain: 21 14
Rescue Services 1 Norway: 1 N/AAgriculture 31 N/A N/APower Stati ons 3 N/A N/AIndustrial seawater users
7 N/A N/A
Water Authoriti es 2 N/A N/AFollow up questi onnaires
45 N/A N/A
Table 4.2: Breakdown of responses in each sector
All questi onnaires were completed in each country’s respecti ve currency and then converted into Euros. As the main questi onnaires were completed in two separate stages, the conversion was conducted according to the deadlines for completi on set for each group of questi onnaires in order to take account of infl ati on. For the fi rst group of questi onnaires, this was 1 April 2008 and for the second set it was 1 December 2009.
4.3 Limitati ons
While the methodology adopted in this project has largely been highly successful, it is important to acknowledge several key limitati ons. Principle among these is the use of an approach that focuses solely on the economic value of human acti viti es. This approach can only provide a parti al insight into the economic cost of marine litt er because it excludes the economic cost of the environmental and social eff ects of marine litt er from analysis. This project is therefore likely to substanti ally underesti mate the full economic cost of marine litt er to coastal communiti es around the Northeast Atlanti c.
Similarly, the methodology used in this project is limited to cases where individuals and organisati ons actually spend money to deal with marine litt er. Economic constraints may prevent organisati ons from fully dealing with marine litt er and therefore the true economic impact of marine litt er may be greater than the fi ndings

31
Economic Impacts of Marine Litt er
here suggest. Local authoriti es, for example, may only remove a proporti on of beach washed marine litt er due to budget restricti ons and the cost to remove all litt er could be signifi cantly higher. Establishing the costs of marine litt er is further complicated by a lack of data recording mechanisms, which means that costs may oft en go unreported.
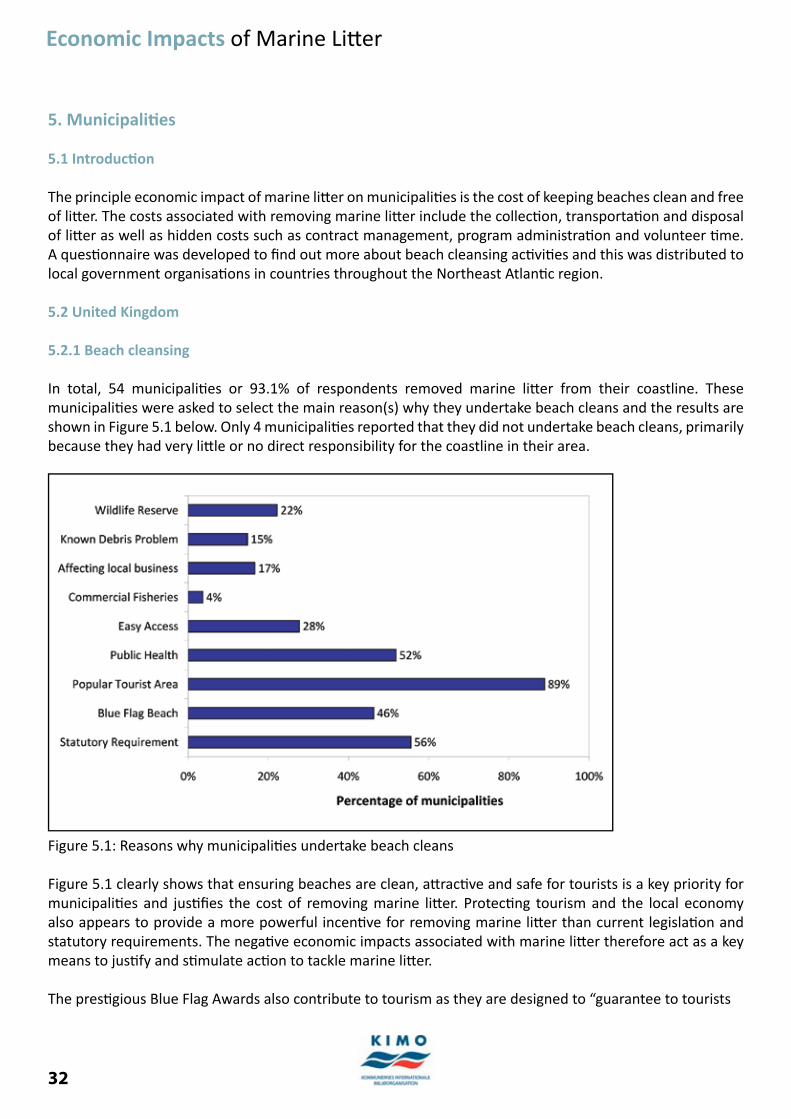
32
Economic Impacts of Marine Litt er
5. Municipaliti es
5.1 Introducti on
The principle economic impact of marine litt er on municipaliti es is the cost of keeping beaches clean and free of litt er. The costs associated with removing marine litt er include the collecti on, transportati on and disposal of litt er as well as hidden costs such as contract management, program administrati on and volunteer ti me. A questi onnaire was developed to fi nd out more about beach cleansing acti viti es and this was distributed to local government organisati ons in countries throughout the Northeast Atlanti c region.
5.2 United Kingdom
5.2.1 Beach cleansing
In total, 54 municipaliti es or 93.1% of respondents removed marine litt er from their coastline. These municipaliti es were asked to select the main reason(s) why they undertake beach cleans and the results are shown in Figure 5.1 below. Only 4 municipaliti es reported that they did not undertake beach cleans, primarily because they had very litt le or no direct responsibility for the coastline in their area.
Figure 5.1: Reasons why municipaliti es undertake beach cleans
Figure 5.1 clearly shows that ensuring beaches are clean, att racti ve and safe for tourists is a key priority for municipaliti es and justi fi es the cost of removing marine litt er. Protecti ng tourism and the local economy also appears to provide a more powerful incenti ve for removing marine litt er than current legislati on and statutory requirements. The negati ve economic impacts associated with marine litt er therefore act as a key means to justi fy and sti mulate acti on to tackle marine litt er.
The presti gious Blue Flag Awards also contribute to tourism as they are designed to “guarantee to tourists
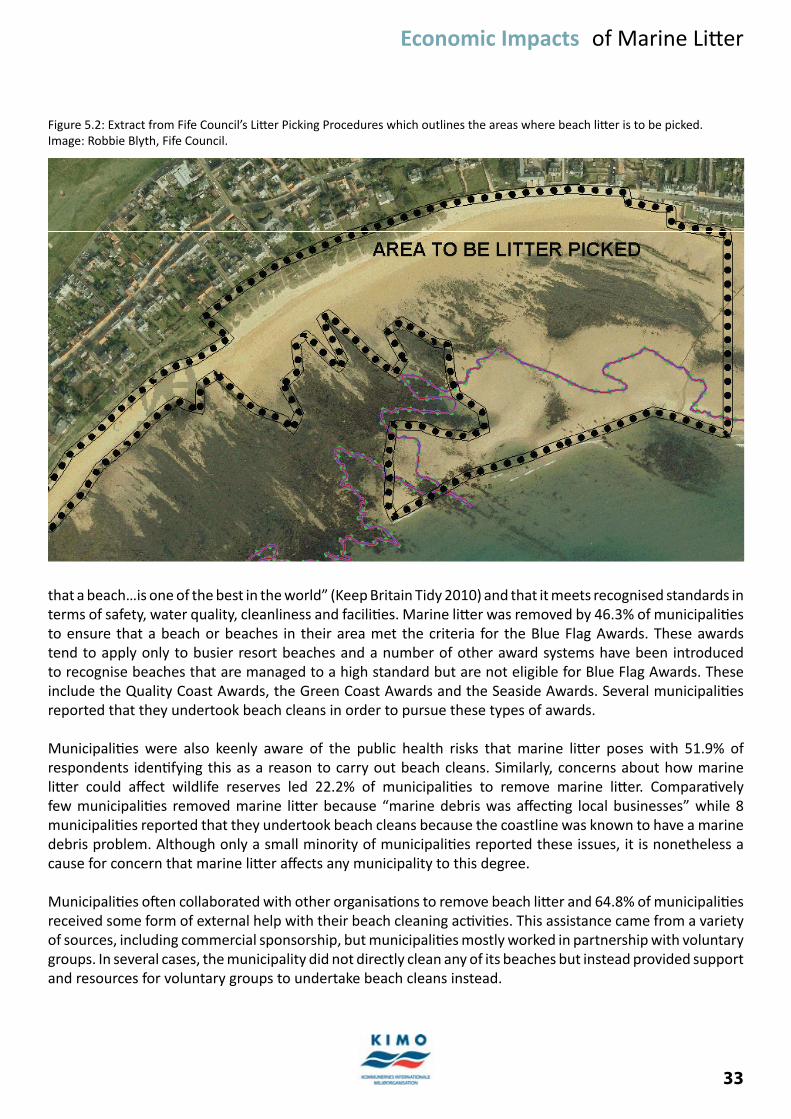
33
Economic Impacts of Marine Litt er
that a beach…is one of the best in the world” (Keep Britain Tidy 2010) and that it meets recognised standards in terms of safety, water quality, cleanliness and faciliti es. Marine litt er was removed by 46.3% of municipaliti es to ensure that a beach or beaches in their area met the criteria for the Blue Flag Awards. These awards tend to apply only to busier resort beaches and a number of other award systems have been introduced to recognise beaches that are managed to a high standard but are not eligible for Blue Flag Awards. These include the Quality Coast Awards, the Green Coast Awards and the Seaside Awards. Several municipaliti es reported that they undertook beach cleans in order to pursue these types of awards.
Municipaliti es were also keenly aware of the public health risks that marine litt er poses with 51.9% of respondents identi fying this as a reason to carry out beach cleans. Similarly, concerns about how marine litt er could aff ect wildlife reserves led 22.2% of municipaliti es to remove marine litt er. Comparati vely few municipaliti es removed marine litt er because “marine debris was aff ecti ng local businesses” while 8 municipaliti es reported that they undertook beach cleans because the coastline was known to have a marine debris problem. Although only a small minority of municipaliti es reported these issues, it is nonetheless a cause for concern that marine litt er aff ects any municipality to this degree.
Municipaliti es oft en collaborated with other organisati ons to remove beach litt er and 64.8% of municipaliti es received some form of external help with their beach cleaning acti viti es. This assistance came from a variety of sources, including commercial sponsorship, but municipaliti es mostly worked in partnership with voluntary groups. In several cases, the municipality did not directly clean any of its beaches but instead provided support and resources for voluntary groups to undertake beach cleans instead.
Figure 5.2: Extract from Fife Council’s Litt er Picking Procedures which outlines the areas where beach litt er is to be picked. Image: Robbie Blyth, Fife Council.

34
Economic Impacts of Marine Litt er
Many organisati ons also conducted independent beach cleans with no council involvement and this was the case for 72.4% of parti cipati ng municipaliti es. The vast majority of these beach cleans were undertaken by voluntary groups such as schools, environmental groups, university societi es, surf clubs and the Scouts. Several municipaliti es also reported that the probati on service and commercial businesses undertook independent beach cleans. Overall, municipaliti es reported a high level of volunteer engagement in beach cleaning acti viti es.
5.2.2 Beach characteristi cs and cleansing regimes
Several questi ons were designed to build up a picture of the beaches cleaned and to identi fy any trends in cleansing regimes. These questi ons focused on the number of beaches cleaned by each municipality in terms of type, usage, ownership and user groups. Questi ons were also asked about how oft en beaches were cleaned and the methods used to do so. Unfortunately, the majority of municipaliti es found it diffi cult to provide this informati on for each beach they cleaned and the fi gures in this secti on therefore refer to the number of municipaliti es answering a questi on rather than the number of beaches involved. As a consequence, these results are therefore not comparable with the fi ndings reported by Hall in 2000.
Within each municipality area, cleansing was generally carried out on more than one type of beach and the percentage of municipaliti es cleaning each type of beach is shown in Figure 5.3 below. Municipaliti es most commonly cleaned sandy beaches, which refl ects both tourists’ preferences for this type of beach and the increased diffi culty involved in cleaning rocky beaches.
Figure 5.3: Percentage of municipaliti es remove beach litt er from each type of beach
Over 90% of municipaliti es owned the beaches and coastlines where they removed beach litt er with a small number reporti ng that private businesses and individuals also owned some of the beaches cleaned in their area. Approximately 25% of municipaliti es also identi fi ed ‘other’ owners of the beaches and coastline cleaned including:
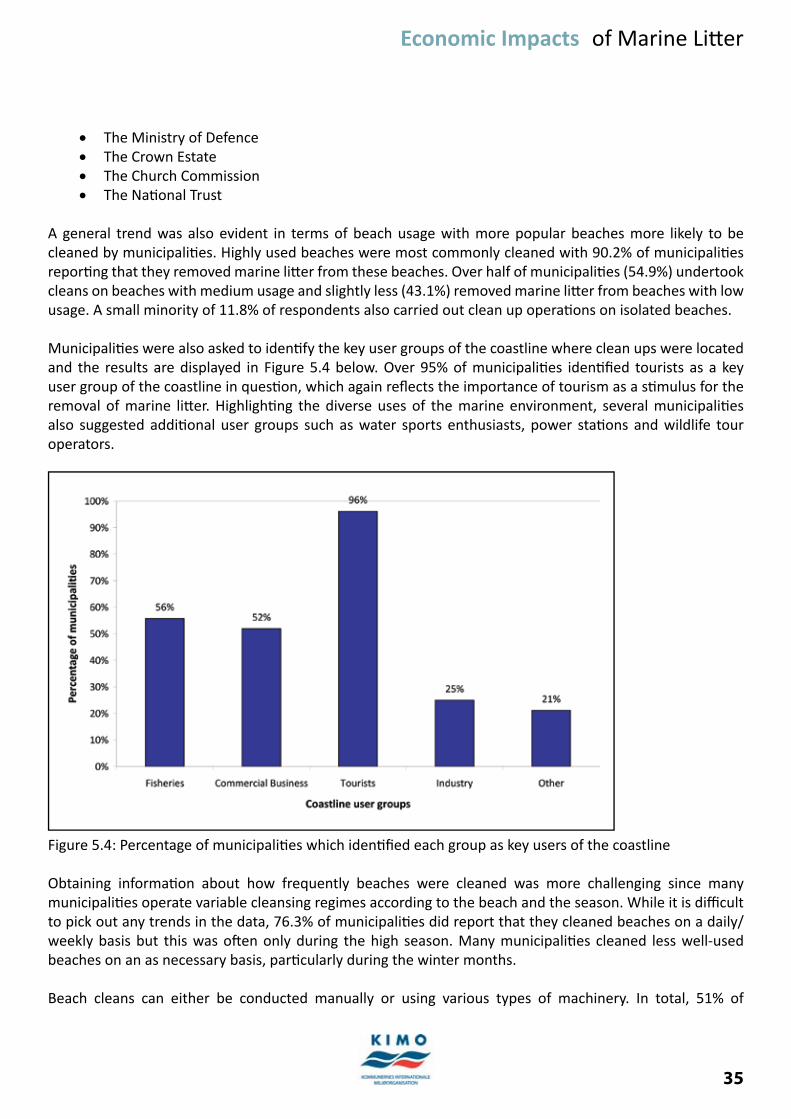
35
Economic Impacts of Marine Litt er
The Ministry of Defence• The Crown Estate• The Church Commission• The Nati onal Trust•
A general trend was also evident in terms of beach usage with more popular beaches more likely to be cleaned by municipaliti es. Highly used beaches were most commonly cleaned with 90.2% of municipaliti es reporti ng that they removed marine litt er from these beaches. Over half of municipaliti es (54.9%) undertook cleans on beaches with medium usage and slightly less (43.1%) removed marine litt er from beaches with low usage. A small minority of 11.8% of respondents also carried out clean up operati ons on isolated beaches.
Municipaliti es were also asked to identi fy the key user groups of the coastline where clean ups were located and the results are displayed in Figure 5.4 below. Over 95% of municipaliti es identi fi ed tourists as a key user group of the coastline in questi on, which again refl ects the importance of tourism as a sti mulus for the removal of marine litt er. Highlighti ng the diverse uses of the marine environment, several municipaliti es also suggested additi onal user groups such as water sports enthusiasts, power stati ons and wildlife tour operators.
Figure 5.4: Percentage of municipaliti es which identi fi ed each group as key users of the coastline
Obtaining informati on about how frequently beaches were cleaned was more challenging since many municipaliti es operate variable cleansing regimes according to the beach and the season. While it is diffi cult to pick out any trends in the data, 76.3% of municipaliti es did report that they cleaned beaches on a daily/weekly basis but this was oft en only during the high season. Many municipaliti es cleaned less well-used beaches on an as necessary basis, parti cularly during the winter months.
Beach cleans can either be conducted manually or using various types of machinery. In total, 51% of
36
Economic Impacts of Marine Litt er
municipaliti es removed marine litt er manually while 47% used a combinati on of both mechanical and manual methods. Only 1 municipality used mechanical methods alone.
5.2.3 Length of coastline where marine litt er is removed
As part of the questi onnaire, municipaliti es were asked to specify the length of coastline where marine litt er was removed and 48 municipaliti es were able to provide this informati on. In total, these municipaliti es cleaned 839 km of beaches and coastline with an average of 17.5km per municipality. The smallest distance cleaned by a single authority was 400m and the largest was 150km. Overall, the distance cleaned by the municipaliti es surveyed represents approximately 4.7% of the total UK coastline3.
5.2.4 Weight and volume of litt er collected
A total of 19 municipaliti es were able to provide informati on about the weight of litt er removed from beaches in their area. This ranged from 1 to 12,000 tonnes and amounted to 21,757 tonnes of litt er in total. Therefore the average amount of marine litt er removed per municipality was 1,145 tonnes.
A further 10 municipaliti es were able to provide informati on about the volume of litt er they removed in terms of the number of refuse sacks collected. A total of 28,561 refuse sacks were collected by these municipaliti es and several also gave details of other large items of marine litt er they had encountered, including:
Crates• Plasti c oil drums• Fish boxes• Tyres• Barbeques• Complete fi shing nets•
However, it is important to note that the impact of marine litt er is not necessarily related to the quanti ti es of litt er involved. This is parti cularly true in terms of visual impact as small lengths of syntheti c rope and cord, for example, weigh very litt le but can have an extremely high visual impact.
5.2.5 Disposal methods and litt er preventi on measures
Landfi ll, incinerati on and recycling are the three main opti ons available for the disposal of marine litt er and many municipaliti es oft en use a combinati on of these methods. Landfi ll is most commonly used with 88.5% of municipaliti es reporti ng that they disposed of marine litt er using this approach. Marine litt er is recycled by 43.3% of municipaliti es and 17.3% incinerate the litt er they collect. Only one municipality recycled all their litt er with many using a combinati on of landfi ll and recycling to dispose of marine litt er.
These results suggest that the way in which municipaliti es dispose of marine litt er has changed signifi cantly since Hall’s pilot project in 2000. In Hall’s study, 100% of parti cipati ng municipaliti es disposed of marine litt er using landfi ll with 21.5% also using recycling and just 3.6% using incinerati on. While the increasing emphasis
3 The Ordnance Survey (OS) has measured the length of mainland Britain’s coastline as 11,072 miles (OS 2010). This is equal to 17,818.66 km. This was used to calculate the percentage of the UK coastline cleaned by the municipaliti es in this project (839km as a percentage of 17,818.66km).
37
Economic Impacts of Marine Litt er
on recycling is encouraging, it remains diffi cult to determine whether a signifi cant quanti ty of marine litt er is being recycled.
Virtually all the municipaliti es involved had put in place some type of litt er preventi on measures with only 1 municipality reporti ng that it took no acti on whatsoever to prevent litt er. Litt er bins were the most common preventi on method with 94.3% of municipaliti es reporti ng that they used these on beaches and coastlines within their area. Noti ces were also popular and 71.7% of municipaliti es used these to discourage litt ering and promote responsible waste practi ces. Many municipaliti es were also taking additi onal acti on to prevent litt er such as:
Fixed penalty noti ces and fi nes for litt ering • Raising awareness of litt er issues in the community through newslett ers, talks, school visits and other • promoti onal acti viti esWarden and staff patrols on busy beaches• Providing specifi c recycling bins and faciliti es on beaches for parti cular types of litt er• The promoti on of nati onal awareness raising campaigns such as ‘No butt s on the beach’ and ‘Bin it, • don’t fl ush it’A beach litt er pledge where members of the public pledge not to drop litt er and to pick up 1 piece of • litt er every ti me they visit the coast. This initi ati ve is operated by Fife Council4
5.2.6 Economic cost of beach litt er
A key aim of this project focused on establishing the direct costs to municipaliti es resulti ng from marine litt er, parti cularly in terms of beach cleansing costs. Of the 58 UK municipaliti es surveyed during this project, only 28 were in a positi on to provide fi gures relati ng to beach cleansing costs and budgets. Virtually all the municipaliti es that could not provide cost data att ributed this to a lack of budget or contract breakdowns rather than because marine litt er posed no cost to their authority. Similarly, very few municipaliti es were aware of the specifi c costs involved in supporti ng voluntary groups to undertake beach cleans.
Questi ons in this secti on focused on the cost of clean ups, the budget for such acti viti es and the cost of litt er preventi on measures. Keep Scotland Beauti ful also kindly shared data collected during one of their projects, which contained informati on about the economic cost of marine litt er for a further 3 municipaliti es in Scotland.
5.2.6.1 Total cost and breakdown of expenditure
The total cost of removing beach litt er reported by 28 municipaliti es in the UK was €3,893,209.93 with an average of €139,043.21 spent on removing beach litt er per municipality each year. With the inclusion of the Keep Scotland Beauti ful data, this rises to a total expenditure of €4,513,189.28 by 31 municipaliti es with an average cost of €145,586.75 per municipality. The total cost of marine litt er to all coastal municipaliti es in the UK is therefore in the region of €17,936,000 - €18,780,000.
Municipaliti es were asked to break these costs down as far as possible into workforce, materials, collecti on, disposal and administrati on and 16 municipaliti es were able to provide detailed informati on at this level. The
4 For more informati on about the Fife Beach Pledge, visit htt ps://www.fi fedirect.org.uk/doitonline/index.cfm?fuseacti on=form.GetForm&Start=1&ModNo=1&sxl=0&forid=D46B06EE-EE92-A35B-5E0E0B27016A686A
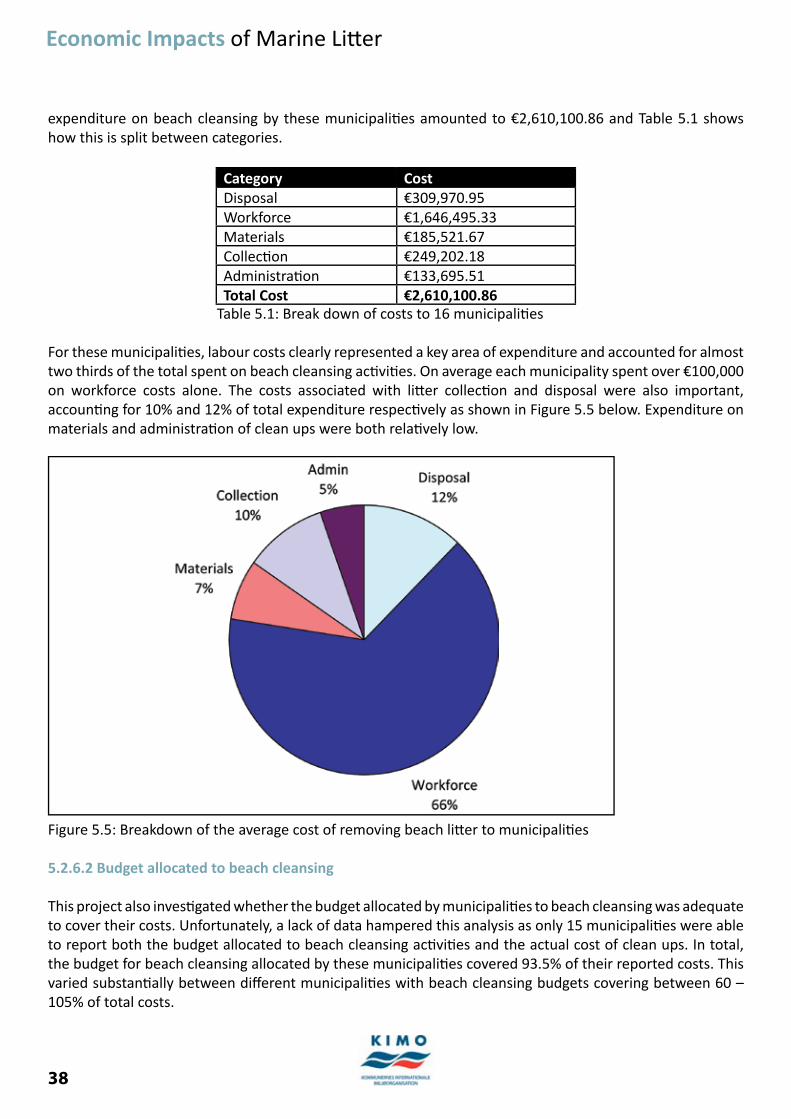
38
Economic Impacts of Marine Litt er
expenditure on beach cleansing by these municipaliti es amounted to €2,610,100.86 and Table 5.1 shows how this is split between categories.
Category CostDisposal €309,970.95Workforce €1,646,495.33Materials €185,521.67Collecti on €249,202.18Administrati on €133,695.51Total Cost €2,610,100.86
Table 5.1: Break down of costs to 16 municipaliti es
For these municipaliti es, labour costs clearly represented a key area of expenditure and accounted for almost two thirds of the total spent on beach cleansing acti viti es. On average each municipality spent over €100,000 on workforce costs alone. The costs associated with litt er collecti on and disposal were also important, accounti ng for 10% and 12% of total expenditure respecti vely as shown in Figure 5.5 below. Expenditure on materials and administrati on of clean ups were both relati vely low.
Figure 5.5: Breakdown of the average cost of removing beach litt er to municipaliti es
5.2.6.2 Budget allocated to beach cleansing
This project also investi gated whether the budget allocated by municipaliti es to beach cleansing was adequate to cover their costs. Unfortunately, a lack of data hampered this analysis as only 15 municipaliti es were able to report both the budget allocated to beach cleansing acti viti es and the actual cost of clean ups. In total, the budget for beach cleansing allocated by these municipaliti es covered 93.5% of their reported costs. This varied substanti ally between diff erent municipaliti es with beach cleansing budgets covering between 60 – 105% of total costs.
39
Economic Impacts of Marine Litt er
5.2.6.3 Beach cleansing expenditure per head of populati on and per km
Analysis was undertaken to determine the cost of marine litt er per head of populati on and per km of beach cleaned. The data relati ng to costs and distance cleaned was drawn from the questi onnaires while census data from 2001 was used to provide a reliable populati on baseline for each municipality.
On average, marine litt er removal cost €0.85 per person per year but this was highly variable between municipaliti es and ranged from less than €0.01 per person in some municipaliti es to €3.99 per person in others. Higher per person costs tended to occur where municipaliti es had responsibility for large areas of coastline or popular tourist beaches which are generally more expensive to keep free of litt er.
For 28 municipaliti es, it was also possible to work out how much beach litt er removal cost annually per km and on average municipaliti es spent between €7,031.33 and €7,294.82 per km per year removing beach litt er. There was wide variati on within this however with beach litt er removal costi ng from €171.05 to €82,101.55 per km each year. High per km costs oft en coincided with more intense beach cleansing operati ons that focused on regularly removing marine litt er from small areas of coastline, parti cularly in tourist areas.
5.2.6.4 Cost of Litt er Preventi on Measures
While municipaliti es employ a diverse range of litt er preventi on measures, this project focused on the costs associated with the provision of coastal litt erbins, as these are one of the most commonly used methods of litt er preventi on. Only 27 municipaliti es were able to provide this informati on, however, due to diffi culti es breaking down waste and litt er preventi on costs. In total these municipaliti es spent €159,496.60 per year on the provision of litt erbins. Expenditure on maintenance amounted to €74,837.85 while the cost of replacement bins was lower at €48,423.16. These fi ndings are likely to underesti mate the costs associated with marine litt er preventi on as they do not take into account the diverse range of measures, as outlined above, employed by municipaliti es to tackle litt ering.
5.2.6.5 Trends in the economic cost of marine litt er
This research has been conducted in a broadly similar manner to the project undertaken by Hall in 2000 which enables a degree of comparison between the two studies and an insight into how the economic impact of marine litt er has changed over the last 10 years. Unfortunately, it is not possible to compare the total cost to municipaliti es reported in each study, as many of the municipaliti es involved in each project are diff erent.
The average cost of beach cleansing acti viti es per municipality however has increased by 37.4% over the last 10 years, taking into account infl ati on. In 2000, beach cleansing cost approximately €87,037.005 per municipality on average while this project found the current average cost to be €139,043.21 per municipality. Based on these averages, beach cleansing therefore cost municipaliti es in the UK approximately €11,488,885 in 2000 with municipaliti es now spending approximately €17,936,000 dealing with marine litt er.
A small group of 9 municipaliti es responded to both projects and these results can be used to provide a more detailed and direct comparison of changes in beach cleansing expenditure over the last 10 years. Figure 5.6 overleaf illustrates the percentage change in beach cleansing expenditure experienced by these municipaliti es between 2000 and 2010. Overall these municipaliti es have experienced a 38% rise in beach
5 Hall’s fi gures have been adjusted for infl ati on and converted into Euros.
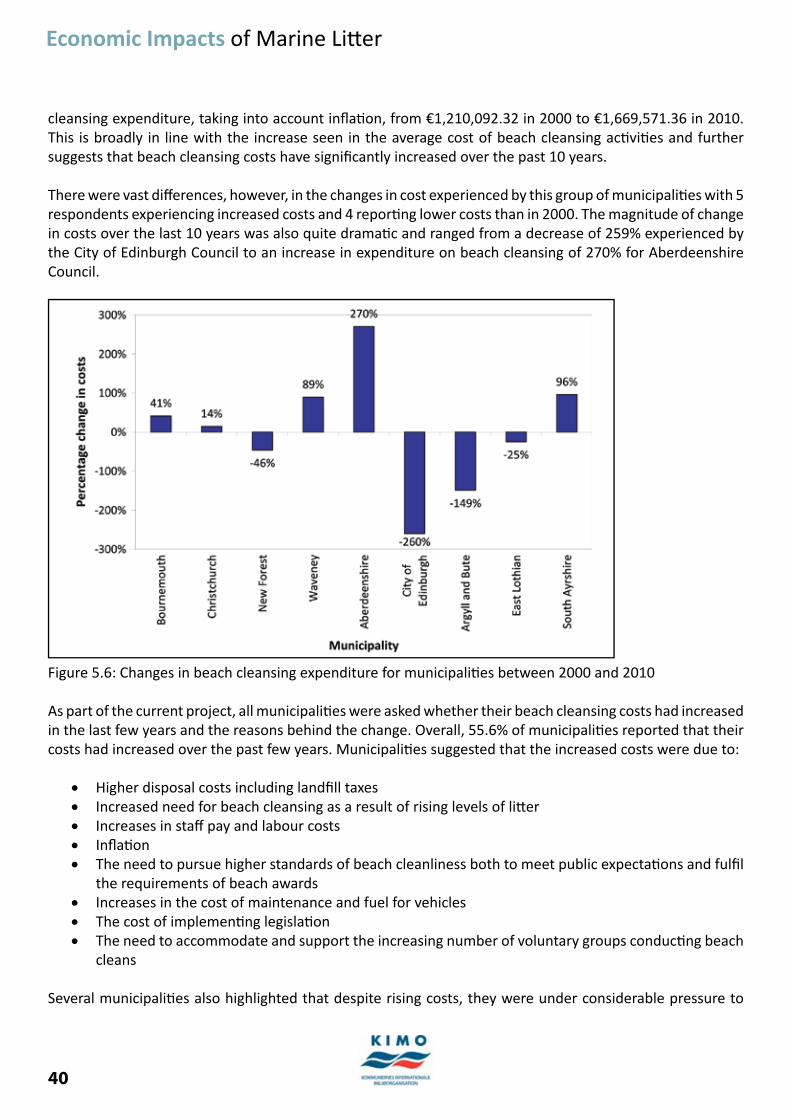
40
Economic Impacts of Marine Litt er
cleansing expenditure, taking into account infl ati on, from €1,210,092.32 in 2000 to €1,669,571.36 in 2010. This is broadly in line with the increase seen in the average cost of beach cleansing acti viti es and further suggests that beach cleansing costs have signifi cantly increased over the past 10 years.
There were vast diff erences, however, in the changes in cost experienced by this group of municipaliti es with 5 respondents experiencing increased costs and 4 reporti ng lower costs than in 2000. The magnitude of change in costs over the last 10 years was also quite dramati c and ranged from a decrease of 259% experienced by the City of Edinburgh Council to an increase in expenditure on beach cleansing of 270% for Aberdeenshire Council.
Figure 5.6: Changes in beach cleansing expenditure for municipaliti es between 2000 and 2010
As part of the current project, all municipaliti es were asked whether their beach cleansing costs had increased in the last few years and the reasons behind the change. Overall, 55.6% of municipaliti es reported that their costs had increased over the past few years. Municipaliti es suggested that the increased costs were due to:
Higher disposal costs including landfi ll taxes• Increased need for beach cleansing as a result of rising levels of litt er• Increases in staff pay and labour costs• Infl ati on• The need to pursue higher standards of beach cleanliness both to meet public expectati ons and fulfi l • the requirements of beach awardsIncreases in the cost of maintenance and fuel for vehicles • The cost of implementi ng legislati on• The need to accommodate and support the increasing number of voluntary groups conducti ng beach • cleans
Several municipaliti es also highlighted that despite rising costs, they were under considerable pressure to
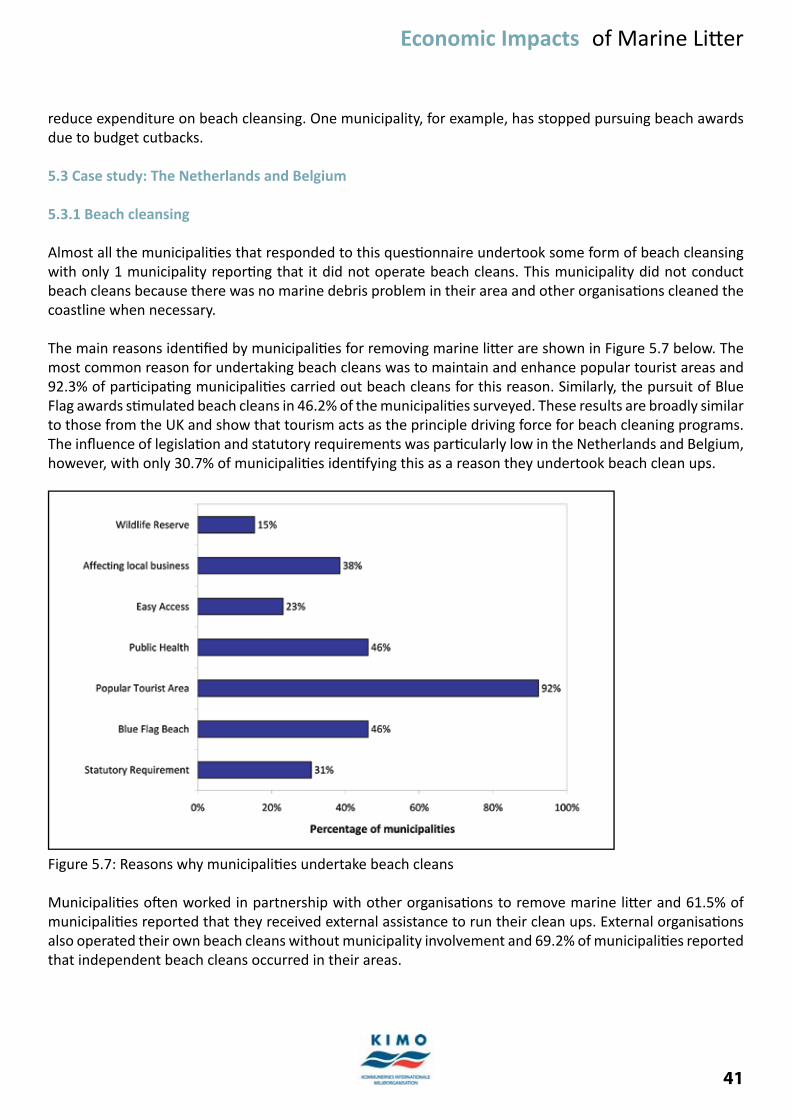
41
Economic Impacts of Marine Litt er
reduce expenditure on beach cleansing. One municipality, for example, has stopped pursuing beach awards due to budget cutbacks.
5.3 Case study: The Netherlands and Belgium
5.3.1 Beach cleansing
Almost all the municipaliti es that responded to this questi onnaire undertook some form of beach cleansing with only 1 municipality reporti ng that it did not operate beach cleans. This municipality did not conduct beach cleans because there was no marine debris problem in their area and other organisati ons cleaned the coastline when necessary.
The main reasons identi fi ed by municipaliti es for removing marine litt er are shown in Figure 5.7 below. The most common reason for undertaking beach cleans was to maintain and enhance popular tourist areas and 92.3% of parti cipati ng municipaliti es carried out beach cleans for this reason. Similarly, the pursuit of Blue Flag awards sti mulated beach cleans in 46.2% of the municipaliti es surveyed. These results are broadly similar to those from the UK and show that tourism acts as the principle driving force for beach cleaning programs. The infl uence of legislati on and statutory requirements was parti cularly low in the Netherlands and Belgium, however, with only 30.7% of municipaliti es identi fying this as a reason they undertook beach clean ups.
Figure 5.7: Reasons why municipaliti es undertake beach cleans
Municipaliti es oft en worked in partnership with other organisati ons to remove marine litt er and 61.5% of municipaliti es reported that they received external assistance to run their clean ups. External organisati ons also operated their own beach cleans without municipality involvement and 69.2% of municipaliti es reported that independent beach cleans occurred in their areas.
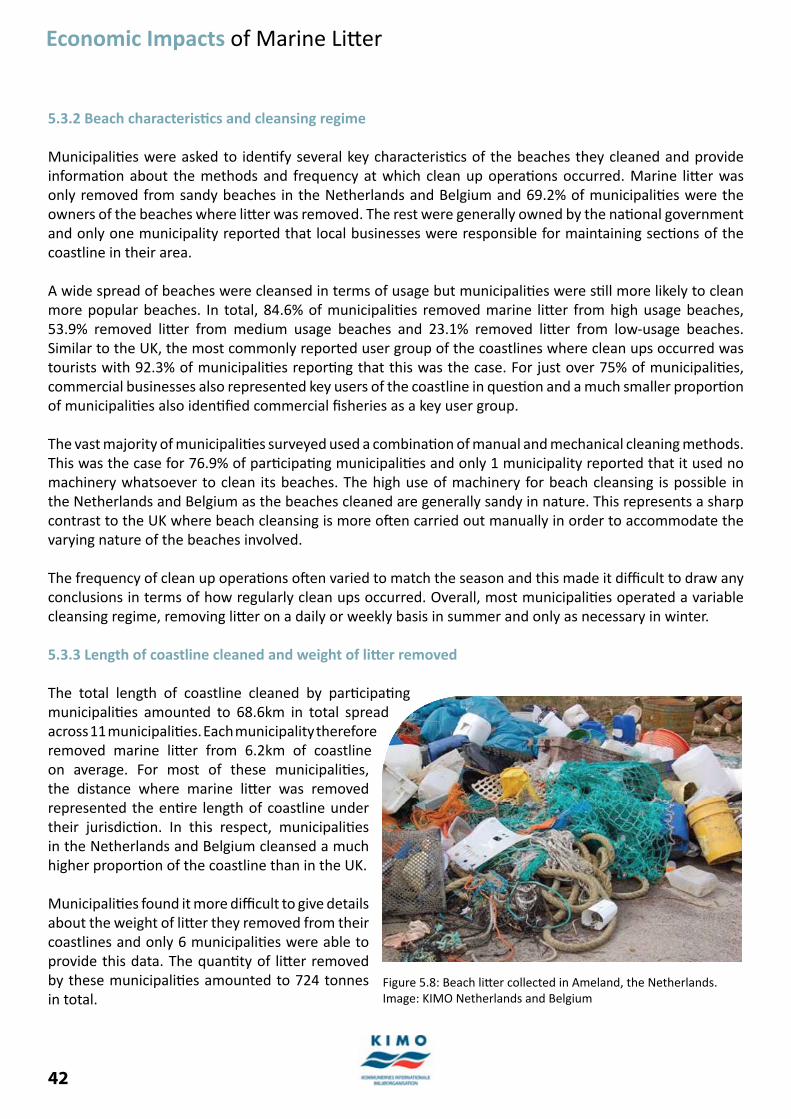
42
Economic Impacts of Marine Litt er
5.3.2 Beach characteristi cs and cleansing regime
Municipaliti es were asked to identi fy several key characteristi cs of the beaches they cleaned and provide informati on about the methods and frequency at which clean up operati ons occurred. Marine litt er was only removed from sandy beaches in the Netherlands and Belgium and 69.2% of municipaliti es were the owners of the beaches where litt er was removed. The rest were generally owned by the nati onal government and only one municipality reported that local businesses were responsible for maintaining secti ons of the coastline in their area.
A wide spread of beaches were cleansed in terms of usage but municipaliti es were sti ll more likely to clean more popular beaches. In total, 84.6% of municipaliti es removed marine litt er from high usage beaches, 53.9% removed litt er from medium usage beaches and 23.1% removed litt er from low-usage beaches. Similar to the UK, the most commonly reported user group of the coastlines where clean ups occurred was tourists with 92.3% of municipaliti es reporti ng that this was the case. For just over 75% of municipaliti es, commercial businesses also represented key users of the coastline in questi on and a much smaller proporti on of municipaliti es also identi fi ed commercial fi sheries as a key user group.
The vast majority of municipaliti es surveyed used a combinati on of manual and mechanical cleaning methods. This was the case for 76.9% of parti cipati ng municipaliti es and only 1 municipality reported that it used no machinery whatsoever to clean its beaches. The high use of machinery for beach cleansing is possible in the Netherlands and Belgium as the beaches cleaned are generally sandy in nature. This represents a sharp contrast to the UK where beach cleansing is more oft en carried out manually in order to accommodate the varying nature of the beaches involved.
The frequency of clean up operati ons oft en varied to match the season and this made it diffi cult to draw any conclusions in terms of how regularly clean ups occurred. Overall, most municipaliti es operated a variable cleansing regime, removing litt er on a daily or weekly basis in summer and only as necessary in winter.
5.3.3 Length of coastline cleaned and weight of litt er removed
The total length of coastline cleaned by parti cipati ng municipaliti es amounted to 68.6km in total spread across 11 municipaliti es. Each municipality therefore removed marine litt er from 6.2km of coastline on average. For most of these municipaliti es, the distance where marine litt er was removed represented the enti re length of coastline under their jurisdicti on. In this respect, municipaliti es in the Netherlands and Belgium cleansed a much higher proporti on of the coastline than in the UK.
Municipaliti es found it more diffi cult to give details about the weight of litt er they removed from their coastlines and only 6 municipaliti es were able to provide this data. The quanti ty of litt er removed by these municipaliti es amounted to 724 tonnes in total.
Figure 5.8: Beach litt er collected in Ameland, the Netherlands. Image: KIMO Netherlands and Belgium
43
Economic Impacts of Marine Litt er
5.3.4 Disposal methods and litt er preventi on measures
Municipaliti es were asked to identi fy the main methods they uti lised to dispose of marine litt er and 12 were able to provide this informati on. Municipaliti es in the Netherlands and Belgium overwhelmingly relied upon incinerators to dispose of the litt er they collected with 11 reporti ng that they used this method. One municipality disposed of marine litt er using a combinati on of landfi ll and recycling. These fi gures suggest that the Netherlands and Belgium put less emphasis on recycling marine litt er than the UK but without a breakdown of the quanti ti es of litt er disposed of using each method, it is diffi cult to determine whether this diff erence is signifi cant.
In terms of anti -litt er measures, litt erbins were again the most common method of litt er preventi on with all but one of the parti cipati ng municipaliti es reporti ng that they used coastal litt erbins. 5 municipaliti es also used noti ce boards that discouraged litt ering and promoted responsible waste practi ces. In additi on, a small number of municipaliti es used other litt er preventi on methods such as raising public awareness of litt er issues and control by the police force.
In 2009, 9 municipaliti es also launched the “Zwerend langs Zee” project in conjuncti on with KIMO Netherlands and Belgium, Rijkswaterstaat and the North Sea Foundati on. The 2-year project aims to promote the responsible disposal of litt er by tourists and therefore decrease the amount of litt er visitors leave at the beach. “Zwerend langs Zee” therefore involves a variety of diff erent initi ati ves such as displaying the amount of litt er left behind in a single day, introducing “cleanteams” on the beaches to discuss marine litt er with tourists, organising free lectures on the theme “The beach is more than sand” and encouraging shopkeepers at the beaches to use more sustainable packaging materials.
5.3.5 Costs of marine litt er
5.3.5.1 Total cost and budget for marine litt er
In total, 10 municipaliti es in the Netherlands and Belgium were able to supply fi gures as regards the total cost of removing beach litt er but very few of these were able to provide a breakdown of these costs. The total cost of beach litt er removal reported by municipaliti es was €2,265,415.30 with an average cost of €226,541.53 per municipality per year. Based on this average, removing beach litt er costs all municipaliti es in the Netherlands and Belgium a total of €10.4 million per year.
All the municipaliti es that reported the cost of removing marine litt er were also able to provide data about the budget allocated to beach cleansing acti viti es. The budget reported by these municipaliti es amounted to €1,816,968 in total and this covered approximately 80% of the costs reported by these municipaliti es. The ability of the budget to meet the costs involved in removing marine litt er however varied substanti ally between municipaliti es and ranged from 21.5% to 160% of costs reported. Unfortunately, many municipaliti es that experienced budget defi cits did not report where the funding to cover these shortf alls came from. 4 municipaliti es did receive assistance with their beach cleansing programs but this was oft en delivered ‘in kind’ in the form of equipment, labour and/or machinery. This support came either from the nati onal government or from local businesses within the area.
5.3.5.2 Beach cleaning expenditure per km
In the Netherlands and Belgium, removing beach litt er cost an average of €34,441.04 per km per year. In
44
Economic Impacts of Marine Litt er
practi ce, this varied substanti ally with municipaliti es experiencing annual costs of between €627.91 and €97,346.15 per km for the removal of beach litt er. Higher costs per km tended to occur in tourist areas where small lengths of beach were cleaned on a regular basis to ensure beaches remained safe and att racti ve for visitors.
5.3.5.3 Trends in the economic cost of marine litt er
As the Netherlands and Belgium were not featured in Hall’s (2000) study, no comparison can be drawn between the two sets of fi ndings. The municipality of Den Haag, however, responded to both projects and details of this municipality’s approach to marine litt er is given in 5.3.6 below. Municipaliti es were also asked as part of the current project whether their costs had increased in the past few years and the reasons behind any change. Overall, 7 out of the 13 municipaliti es surveyed reported that their beach cleansing costs had increased in the past few years. The reasons given for this included:
Increased labour costs• Infl ati on• More intense use of the beach all year round• More litt er being washed ashore from the sea and more rubbish being dropped by tourists• Use of a mechanical cleaner• More voluntary clean up operati ons and increasing number of people becoming involved in clean ups • resulti ng in more litt er being collected
5.3.6 Den Haag
The municipality of Den Haag in the Netherlands is responsible for a 13km stretch of coastline divided into the North and South beaches. The municipality cleans both beaches due to statutory requirements and because they are popular with tourists and easily accessible. These beaches are cleaned daily during the high season (May to October) using both mechanical and manual methods. The weight of debris collected can be highly variable and all litt er removed is incinerated. Litt er preventi on measures uti lised by the municipality include litt erbins and a communicati ons campaign beach team.
The total cost of Den Haag’s beach cleansing program is an esti mated €1,265,500 which is the highest cost reported by any municipality in this project. Removing marine litt er therefore costs each person in Den Haag an esti mated €2.64, although Den Haag’s budget for beach cleansing covers only 75% of the total costs. Den Haag also experiences a relati vely high per km cost of €97,346.15 per km per year due to the need to repeatedly clean small areas of beach to ensure they remain att racti ve to tourists. While Den Haag reported that its beach cleansing costs have remained stati c in the past few years, comparison with Hall’s research6 reveals that expenditure on beach cleansing has risen in real terms by approximately 83.2% over the last 10 years.
5.4 Additi onal Informati on
In several countries, only a few responses from municipaliti es were received and a brief summary of these questi onnaires is provided in Table 5.2 overleaf.
6 Hall’s fi gures have been adjusted for infl ati on and converted to euros

45
Economic Impacts of Marine Litt er
5.5 Conclusion
For most municipaliti es, the potenti al economic impact of marine litt er, parti cularly in terms of lost tourist revenue, provides the principal moti vati on for removing beach litt er. In this respect, regularly removing beach litt er represents a lower cost to municipaliti es than the potenti al reducti on in revenue that would result from taking no acti on. It is also striking that the potenti al economic impact of marine litt er provides a much more powerful incenti ve for removing marine litt er than current legislati on and statutory requirements, parti cularly in the UK.
Coastal municipaliti es in the UK spend approximately €18 million each year removing beach litt er with an average cost of €139,000 per municipality. Over the past 10 years, the average cost of removing beach litt er has also increased by 37.4%. Given the considerable pressure to reduce expenditure, municipaliti es are fi nding it increasingly diffi cult to balance limited budgets with increasing demand for service provision. It is also clear that in this case the polluter does not pay, as municipaliti es must fi nd the resources and funds to deal with litt er caused by other parti es. Similarly, it is important to acknowledge that although the repeated beach clean-up eff orts reduce the amount of litt er on the shore in the short-term, they do not directly address the underlying problem.
In the Netherlands and Belgium, coastal municipaliti es spend a total of €10.4 million each year removing beach litt er. The highest costs are experienced in the municipality of Den Haag, which spent an esti mated €1,265,000 removing beach litt er in 2008. Although tourism provides the main moti vati on for removing beach litt er, it is of parti cular concern that almost 40% of municipaliti es in the Netherlands and Belgium removed beach litt er because it threatened local business interests.
While the challenges involved in dealing with marine litt er vary from municipality to municipality, the fi ndings outlined here suggest that marine litt er conti nues to pose signifi cant issues for municipaliti es throughout the Northeast Atlanti c region. With many of the areas cleaned by municipaliti es popular with tourists, more acti on is required to understand why people litt er and develop ways to positi vely infl uence their behaviour. The “Zwerend langs Zee” project in the Netherlands and Belgium is a good example of joint acti on to reduce the amount of marine litt er visitors leave at the beach. The project involves a variety of initi ati ves designed to change tourists’ atti tudes to litt er and also aims to develop examples of best practi ce to share with other municipaliti es.
There are a number of other initi ati ves which could also help to reduce the amount of litt er visitors leave at the beach and several of these are already in operati on in some countries. The introducti on of a deposit scheme on drinks packaging in Denmark, Germany and Malta, for example, has been used to encourage recycling. Similarly, the tax on plasti c bags in Ireland has reduced the number of bags issued by 90% (Ten Brink et al 2009). More work is required to assess the potenti al of these schemes on a larger scale and develop methods for stakeholders to easily share informati on and examples of best practi ce to prevent litt er. The development of new funding mechanisms for beach-cleaning programmes, which respect the polluter pays principle, would also increase the capacity of municipaliti es to deal with marine
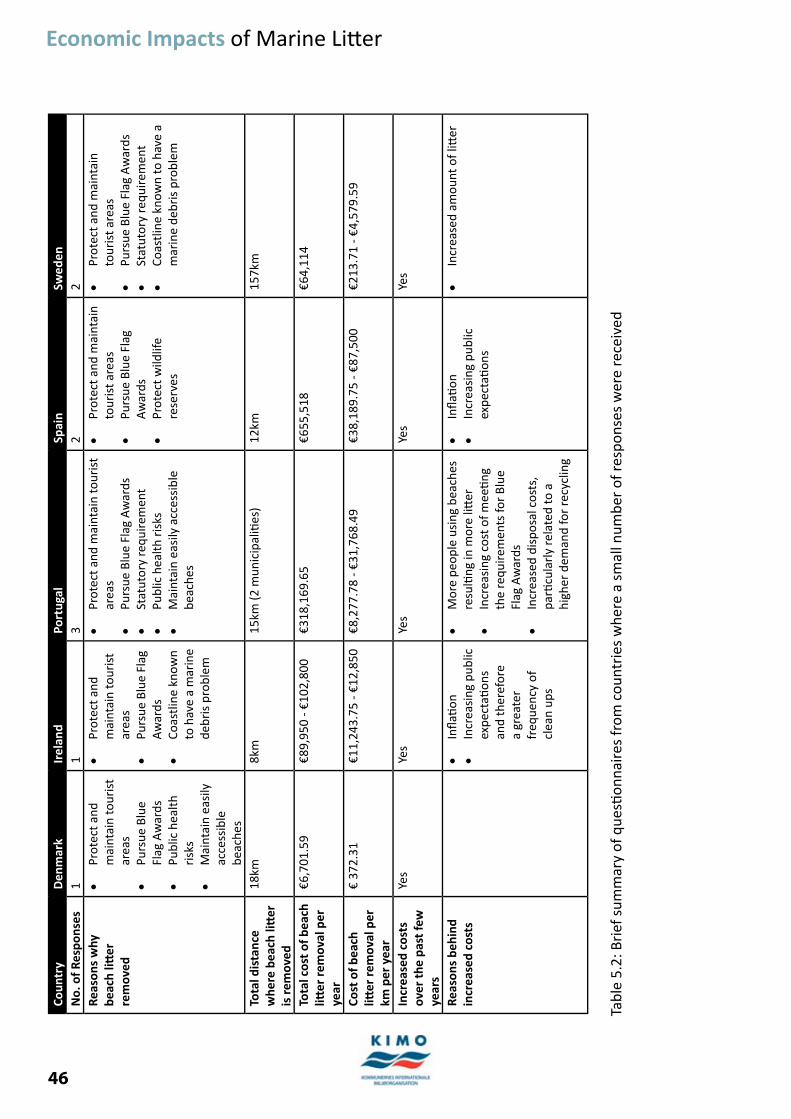
46
Economic Impacts of Marine Litt erCo
untr
yD
enm
ark
Irel
and
Port
ugal
Spai
nSw
eden
No.
of R
espo
nses
11
32
2Re
ason
s w
hy
beac
h litt
er
rem
oved
Prot
ect a
nd
• m
aint
ain
tour
ist
area
sPu
rsue
Blu
e •
Flag
Aw
ards
Publ
ic h
ealth
•
risk
sM
aint
ain
easi
ly
• ac
cess
ible
be
ache
s
Prot
ect a
nd
• m
aint
ain
tour
ist
area
sPu
rsue
Blu
e Fl
ag
• A
war
dsCo
astli
ne k
now
n •
to h
ave
a m
arin
e de
bris
pro
blem
Prot
ect a
nd m
aint
ain
tour
ist
• ar
eas
Purs
ue B
lue
Flag
Aw
ards
• St
atut
ory
requ
irem
ent
• Pu
blic
hea
lth r
isks
• M
aint
ain
easi
ly a
cces
sibl
e •
beac
hes
Prot
ect a
nd m
aint
ain
• to
uris
t are
asPu
rsue
Blu
e Fl
ag
• A
war
dsPr
otec
t wild
life
• re
serv
es
Prot
ect a
nd m
aint
ain
• to
uris
t are
asPu
rsue
Blu
e Fl
ag A
war
ds•
Stat
utor
y re
quire
men
t•
Coas
tline
kno
wn
to h
ave
a •
mar
ine
debr
is p
robl
em
Tota
l dis
tanc
e w
here
bea
ch li
tt er
is
rem
oved
18km
8km
15
km (2
mun
icip
aliti
es)
12km
157k
m
Tota
l cos
t of b
each
litt
er
rem
oval
per
ye
ar
€6,7
01.5
9€8
9,95
0 - €
102,
800
€318
,169
.65
€655
,518
€64,
114
Cost
of b
each
litt
er
rem
oval
per
km
per
yea
r
€ 37
2.31
€11,
243.
75 -
€12,
850
€8,2
77.7
8 - €
31,7
68.4
9€3
8,18
9.75
- €8
7,50
0€2
13.7
1 - €
4,57
9.59
Incr
ease
d co
sts
over
the
past
few
ye
ars
Yes
Yes
Yes
Yes
Yes
Reas
ons
behi
nd
incr
ease
d co
sts
Infl a
ti on
• In
crea
sing
pub
lic
• ex
pect
ati o
ns
and
ther
efor
e a
grea
ter
freq
uenc
y of
cl
ean
ups
Mor
e pe
ople
usi
ng b
each
es
• re
sulti
ng in
mor
e litt
er
Incr
easi
ng c
ost o
f mee
ti ng
• th
e re
quire
men
ts fo
r Bl
ue
Flag
Aw
ards
Incr
ease
d di
spos
al c
osts
, •
parti
cul
arly
rela
ted
to a
hi
gher
dem
and
for
recy
clin
g
Infl a
ti on
• In
crea
sing
pub
lic
• ex
pect
ati o
ns
Incr
ease
d am
ount
of l
itt er
•
Tabl
e 5.
2: B
rief
sum
mar
y of
que
sti o
nnai
res
from
cou
ntri
es w
here
a s
mal
l num
ber
of re
spon
ses
wer
e re
ceiv
ed

47
Economic Impacts of Marine Litt er
6. UK Voluntary Organisati ons
6.1 Introducti on
Voluntary organisati ons play a key role in removing litt er from around the coast and raising public awareness of marine litt er issues. These organisati ons range from small community groups dedicated to beach cleaning to large umbrella organisati ons that focus on diverse marine and coastal issues. Several nati onal campaigns have also been set up to tackle marine litt er issues including the Beachwatch and Adopt-a-Beach schemes, operated by the Marine Conservati on Society (MCS), and the Return To Off ender campaign organised by Surfers Against Sewage (SAS).
The primary economic impact of marine litt er on voluntary groups is the cost of running beach cleans in terms of operati onal expenditure, fi nancial assistance and the value of volunteers’ ti me. A questi onnaire was developed to fi nd out more about voluntary beach cleansing initi ati ves and this was distributed to voluntary organisati ons within the UK.
6.2 Volunteer involvement and distance cleaned
The voluntary groups surveyed during this project varied greatly in size and the number of volunteers involved in each group ranged from 1 to 4125 people. In total, between 6219 and 6753 volunteers took part in beach cleans organised by the voluntary groups surveyed in this project. These groups carried out beach cleans at various frequencies ranging from daily ti dy ups to annual clean up events.
The length of coastline over which marine litt er was removed was similarly variable for these organisati ons and ranged from just 20m to over 1000km. Many of the distances recorded are relati vely small, refl ecti ng the involvement of these groups in the Beachwatch and Adopt-a-Beach schemes. Several of the larger organisati ons were unable to provide fi gures about the distances cleaned, as this was generally not recorded by the voluntary groups they supported.
6.3 Quanti ty of litt er collected and disposal
The voluntary organisati ons surveyed during this project reported the quanti ty of beach litt er they removed either in terms of weight or the number of refuse sacks collected. 15 parti cipati ng groups recorded the weight of litt er removed during their beach cleans and this amounted to 71.5 to 73.1 tonnes in total. In eff ect, therefore, each volunteer taking part in these beach cleans removed between 12.8kg and 14.3kg of beach litt er on average.
Figure 6.1: Public beach clean organised by the Isles of Scilly Area of Outstanding Natural Beauty. Photography: Clare Lewis.
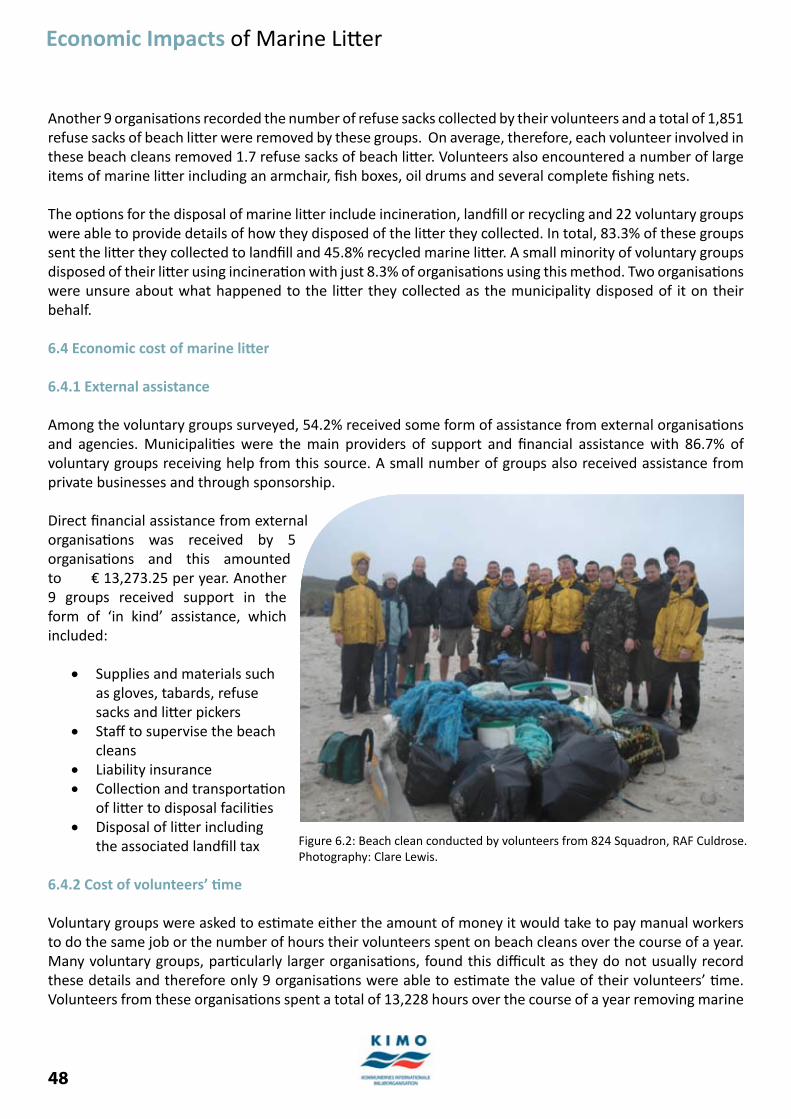
48
Economic Impacts of Marine Litt er
Another 9 organisati ons recorded the number of refuse sacks collected by their volunteers and a total of 1,851 refuse sacks of beach litt er were removed by these groups. On average, therefore, each volunteer involved in these beach cleans removed 1.7 refuse sacks of beach litt er. Volunteers also encountered a number of large items of marine litt er including an armchair, fi sh boxes, oil drums and several complete fi shing nets.
The opti ons for the disposal of marine litt er include incinerati on, landfi ll or recycling and 22 voluntary groups were able to provide details of how they disposed of the litt er they collected. In total, 83.3% of these groups sent the litt er they collected to landfi ll and 45.8% recycled marine litt er. A small minority of voluntary groups disposed of their litt er using incinerati on with just 8.3% of organisati ons using this method. Two organisati ons were unsure about what happened to the litt er they collected as the municipality disposed of it on their behalf.
6.4 Economic cost of marine litt er
6.4.1 External assistance
Among the voluntary groups surveyed, 54.2% received some form of assistance from external organisati ons and agencies. Municipaliti es were the main providers of support and fi nancial assistance with 86.7% of voluntary groups receiving help from this source. A small number of groups also received assistance from private businesses and through sponsorship.
Direct fi nancial assistance from external organisati ons was received by 5 organisati ons and this amounted to € 13,273.25 per year. Another 9 groups received support in the form of ‘in kind’ assistance, which included:
Supplies and materials such • as gloves, tabards, refuse sacks and litt er pickersStaff to supervise the beach • cleansLiability insurance• Collecti on and transportati on • of litt er to disposal faciliti esDisposal of litt er including • the associated landfi ll tax
6.4.2 Cost of volunteers’ ti me
Voluntary groups were asked to esti mate either the amount of money it would take to pay manual workers to do the same job or the number of hours their volunteers spent on beach cleans over the course of a year. Many voluntary groups, parti cularly larger organisati ons, found this diffi cult as they do not usually record these details and therefore only 9 organisati ons were able to esti mate the value of their volunteers’ ti me. Volunteers from these organisati ons spent a total of 13,228 hours over the course of a year removing marine
Figure 6.2: Beach clean conducted by volunteers from 824 Squadron, RAF Culdrose. Photography: Clare Lewis.

49
Economic Impacts of Marine Litt er
litt er from beaches. These hours are equal to € 84,579.34 in labour costs to pay manual workers to do the same job at the Briti sh minimum wage.
6.4.3 Total cost of voluntary initi ati ves
Overall, 10 voluntary organisati ons were able to provide data about the costs associated with their beach cleans. For these groups, the total cost of voluntary clean ups amounts to €97,852.59 and Figure 6.3 below shows how these costs are divided between direct fi nancial assistance and volunteer ti me. The cost to pay manual workers to do the same job is relati vely high and in eff ect each volunteer involved in these groups contributes the equivalent of €16.23 of their ti me on average each year. In reality, the full cost of voluntary clean ups is likely to be substanti ally higher as this analysis does not include the administrati ve costs involved in organising beach cleans or the cost of in kind support and assistance provided by external organisati ons.
Figure 6.3: Breakdown of the average cost of marine litt er to voluntary organisati ons
On a broader scale, it is diffi cult to calculate the total cost of voluntary clean up eff orts due to the sheer diversity and widespread nature of these groups. However, esti mati ng the contributi on volunteers make to some of the big voluntary clean up initi ati ves in the UK gives some indicati on of the cost of these eff orts. Within the UK, the MCS Beachwatch scheme and Keep Scotland Beauti ful’s (KSB) Nati onal Spring Clean both remove a substanti al quanti ty of litt er from around the UK coastline and a total of 8,809 adult volunteers were involved in the most recent events held by these organisati ons. Volunteers involved in these events therefore contribute the equivalent of € 131,287.477 of their ti me on average each year. Given the high
7 In 2009, MCS Beachwatch volunteers spent a total of 9,995 volunteer hours removing beach litt er at a cost of €63,868.05 at the Briti sh minimum wage. In 2010, coastal clean ups held under the KSB Nati onal Spring Clean banner involved 4,154 adult volunteers but unfortunately the number of volunteer hours is unknown. However, applying the average cost of ti me contributed by volunteers surveyed during this project (€16.23) suggests that these volunteers contributed the equivalent of approximately €67,419.42 of their ti me. In total, therefore, volunteers contributed the equivalent of €131,287.47 of their ti me to these events.
50
Economic Impacts of Marine Litt er
level of volunteer involvement in removing beach litt er in the UK, these fi gures suggest that the full cost of voluntary beach litt er removal in the UK is likely to be signifi cant.
6.5 Conclusion
Voluntary organisati ons clearly make a signifi cant and extremely positi ve contributi on to ensuring the UK’s coastline remains clean and litt er free. With each volunteer contributi ng €16.23 on average of their ti me each year, the full economic cost of voluntary involvement in removing beach litt er is likely to be substanti al. Indeed, the 8,809 volunteers involved in the most recent MCS Beachwatch and KSB Nati onal Spring Clean campaigns contributed approximately € 131,287.47 of their ti me to removing beach litt er. In reality, the full cost of voluntary clean ups is likely to be substanti ally higher as this analysis does not include the administrati ve costs involved in organising beach cleans or the cost of in kind support and assistance provided by external organisati ons. It is also important to acknowledge that while these repeated beach cleans reduce the amount of litt er on the shore in the short-term, they do not directly address the underlying problem.
Although volunteers contribute their ti me for free, most voluntary groups oft en seek small grants from external bodies to cover operati ng costs such as equipment for volunteers and administrati ve costs. Within the current fi nancial climate, however, voluntary groups are fi nding it increasingly diffi cult to source the external funding necessary to support their work and it is therefore unclear whether some groups will be able to conti nue in their present form.
While this project has focused on the UK, countless voluntary groups around the world are involved in similar acti viti es aimed at reducing the amount of litt er in the marine and coastal environment. More research is required to fully account for the eff orts of these organisati ons and ensure that voluntary acti on does not mask the true cost of marine litt er.
51
Economic Impacts of Marine Litt er
7. UK Tourism
7.1 Introducti on
Tourism is one of the UK’s largest industries and directly accounts for approximately 3.7% of nati onal GDP (Deloitt e 2008). Coastal tourism, in parti cular, contributes between €7 billion (Tourism Alliance 2007) and €11 billion (Deloitt e 2008) to the UK economy each year. For visitors to the coastline, beach cleanliness is a key priority when choosing where to visit (ENCAMS 2005) and the presence of marine litt er can therefore act as a deterrent to tourists (Ballance et al 2000). Marine litt er can consequently have a negati ve eff ect on tourism revenue and weaken coastal economies. A questi onnaire was developed to investi gate the eff ects of marine litt er on tourism and this questi onnaire was distributed to tourist authoriti es within the UK.
7.2 Coastal visitors and tourist revenue
A total of 8 local and regional tourist organisati ons were able to provide fi gures regarding the number of tourists visiti ng their area. They recorded approximately 39.4 million visitors to their areas, of which between 16.5 and 17.4 million visited the area specifi cally to go to the beach or coastline. The percentage of tourists specifi cally att racted by the beach or coastline varied signifi cantly between areas and ranged from 18% to 90% of total visitors to an area. Any drop in cleanliness standards could therefore result in a serious decline in tourist numbers.
For the 5 organisati ons that provided fi gures, tourism generated an esti mated € 3.4 billion in their areas and, assuming visitors spend the same regardless of the att racti on, tourists therefore spend € 1.8 billion while visiti ng coastal locati ons. Clearly any reducti on in tourist revenue due to marine litt er could have a detrimental eff ect on coastal economies, parti cularly as tourism oft en makes a disproporti onately high contributi on to coastal economies (Deloitt e 2008; Visit Wales 2008).
7.3 Awards and Complaints
Within the UK, various awards schemes have been developed to recognise beaches that are managed to a high standard. These include:
Blue Flag Awards. These are judged according to recognised standards in terms of safety, water • quality, cleanliness and faciliti es. Throughout the UK, 122 beaches have successfully achieved Blue Flag Awards in 2010.Quality Coast Awards. This scheme operates only in England and aims to raise standards at the coast. • A total of 111 Quality Coast Awards have been presented in 2010.Green Coast Awards. This initi ati ve was developed to recognise more remote rural beaches in Wales • and Ireland that are managed to a high standard and meet the guideline standards for bathing water. During the 2010 season, a record 50 beaches in Wales achieved Green Coast Awards.Seaside Awards. This scheme is split into two categories, resort and rural beaches, and operates • in Scotland, Wales and Northern Ireland. It recognises beaches that meet mandatory water quality standards and are clean, safe and well managed. In 2010, a total of 173 beaches met the criteria for Seaside Awards.
In this project, 10 out of the 16 tourist authoriti es surveyed reported that beaches in their area held at least one type of award. Among this group, Blue Flag Awards were the most commonly held type of award closely

52
Economic Impacts of Marine Litt er
followed by Quality Coast Awards.
All the tourist organisati ons surveyed during this project reported that complaints about marine litt er and rubbish on the beach were extremely rare. Altogether, these organisati ons had only received 13 complaints about marine litt er in total with tourists more likely to switch to other desti nati ons rather than complain. Reports of illness and injuries resulti ng from marine litt er were similarly rare and in most cases these were minor incidents that generally go unrecorded.
7.4 Importance of a clean and high quality coastal environment to tourism branding
The tourist organisati ons surveyed during this project agreed that a clean and high quality coastal environment was important or very important for tourism branding. For many areas, the coast is the principal att racti on for tourists and therefore ensuring it remains att racti ve, clean and safe is criti cally important. As one parti cipant stated, “visitors and locals alike want to visit unspoiled coastal sites and appreciate the beauty there. They don’t want to be confronted with rubbish strewn across the landscape.”
Public percepti ons of the cleanliness and quality of a beach were also very important with several tourist organisati ons suggesti ng that bad visitor experiences would damage their branding positi on as a clean and high quality desti nati on. Several organisati ons therefore felt it was important to acti vely demonstrate to prospecti ve visitors that their beaches were managed to a high standard, generally through parti cipati on in awards schemes and initi ati ves such as the Blue Flag Awards.
Parti cipants also highlighted the potenti al economic impact of a reducti on in tourism due to marine litt er. A parti cipant stated, “The coastline/beaches is the main reason visitors choose to visit this area and with an industry worth more than £1 billion then anything which aff ects this would be hugely detrimental.” Ensuring visitors have a positi ve experience at the beach is also a key part of encouraging repeat visits to the area.
One organisati on stated that “visitors are att racted to a clean beach and a beach
is remembered for the cleanliness, resulti ng in repeat visits to the area. We also have a lot of water sports, such as surfi ng and kite surfi ng on our coastline, this would be hugely aff ected if the water and beach area were not clean.”
As a result, the vast majority of organisati ons surveyed believed that only natural debris such as seaweed was acceptable in the marine and coastal environment; all man-made litt er is unnecessary and unacceptable. Several organisati ons, however, felt that litt er was nearly impossible to control.
Figure 7.1: The Blue Flag awards are used by municipaliti es to demonstrate that their beaches are managed to a high standard. Image: Keep Scotland Beauti ful.
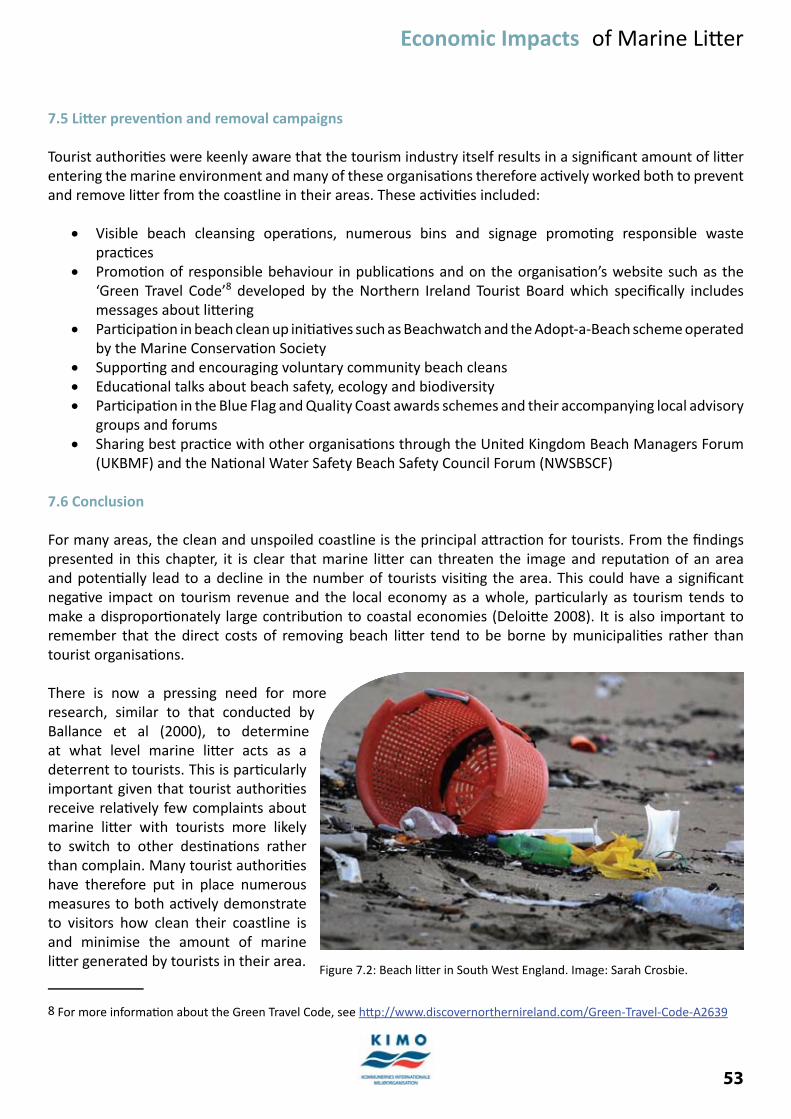
53
Economic Impacts of Marine Litt er
7.5 Litt er preventi on and removal campaigns
Tourist authoriti es were keenly aware that the tourism industry itself results in a signifi cant amount of litt er entering the marine environment and many of these organisati ons therefore acti vely worked both to prevent and remove litt er from the coastline in their areas. These acti viti es included:
Visible beach cleansing operati ons, numerous bins and signage promoti ng responsible waste • practi cesPromoti on of responsible behaviour in publicati ons and on the organisati on’s website such as the • ‘Green Travel Code’8 developed by the Northern Ireland Tourist Board which specifi cally includes messages about litt eringParti cipati on in beach clean up initi ati ves such as Beachwatch and the Adopt-a-Beach scheme operated • by the Marine Conservati on SocietySupporti ng and encouraging voluntary community beach cleans • Educati onal talks about beach safety, ecology and biodiversity • Parti cipati on in the Blue Flag and Quality Coast awards schemes and their accompanying local advisory • groups and forumsSharing best practi ce with other organisati ons through the United Kingdom Beach Managers Forum • (UKBMF) and the Nati onal Water Safety Beach Safety Council Forum (NWSBSCF)
7.6 Conclusion
For many areas, the clean and unspoiled coastline is the principal att racti on for tourists. From the fi ndings presented in this chapter, it is clear that marine litt er can threaten the image and reputati on of an area and potenti ally lead to a decline in the number of tourists visiti ng the area. This could have a signifi cant negati ve impact on tourism revenue and the local economy as a whole, parti cularly as tourism tends to make a disproporti onately large contributi on to coastal economies (Deloitt e 2008). It is also important to remember that the direct costs of removing beach litt er tend to be borne by municipaliti es rather than tourist organisati ons.
There is now a pressing need for more research, similar to that conducted by Ballance et al (2000), to determine at what level marine litt er acts as a deterrent to tourists. This is parti cularly important given that tourist authoriti es receive relati vely few complaints about marine litt er with tourists more likely to switch to other desti nati ons rather than complain. Many tourist authoriti es have therefore put in place numerous measures to both acti vely demonstrate to visitors how clean their coastline is and minimise the amount of marine litt er generated by tourists in their area.
8 For more informati on about the Green Travel Code, see htt p://www.discovernorthernireland.com/Green-Travel-Code-A2639
Figure 7.2: Beach litt er in South West England. Image: Sarah Crosbie.
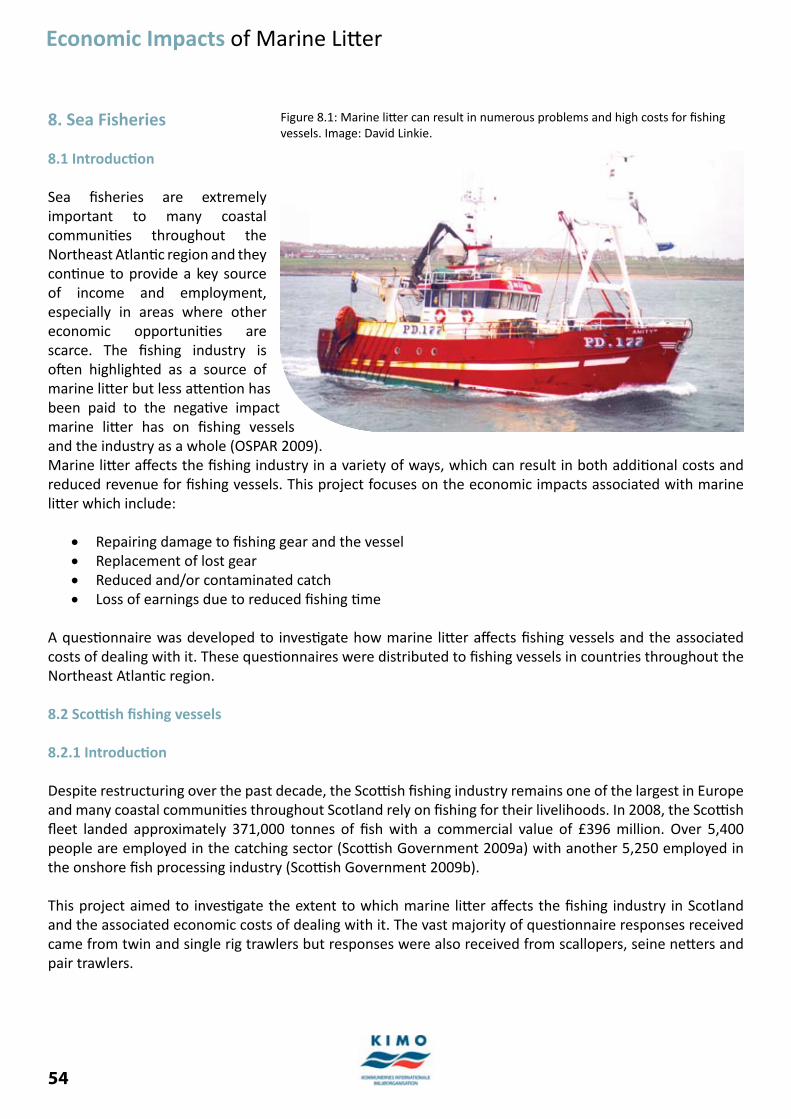
54
Economic Impacts of Marine Litt er
8. Sea Fisheries
8.1 Introducti on
Sea fi sheries are extremely important to many coastal communiti es throughout the Northeast Atlanti c region and they conti nue to provide a key source of income and employment, especially in areas where other economic opportuniti es are scarce. The fi shing industry is oft en highlighted as a source of marine litt er but less att enti on has been paid to the negati ve impact marine litt er has on fi shing vessels and the industry as a whole (OSPAR 2009). Marine litt er aff ects the fi shing industry in a variety of ways, which can result in both additi onal costs and reduced revenue for fi shing vessels. This project focuses on the economic impacts associated with marine litt er which include:
Repairing damage to fi shing gear and the vessel• Replacement of lost gear• Reduced and/or contaminated catch• Loss of earnings due to reduced fi shing ti me•
A questi onnaire was developed to investi gate how marine litt er aff ects fi shing vessels and the associated costs of dealing with it. These questi onnaires were distributed to fi shing vessels in countries throughout the Northeast Atlanti c region.
8.2 Scotti sh fi shing vessels
8.2.1 Introducti on
Despite restructuring over the past decade, the Scotti sh fi shing industry remains one of the largest in Europe and many coastal communiti es throughout Scotland rely on fi shing for their livelihoods. In 2008, the Scotti sh fl eet landed approximately 371,000 tonnes of fi sh with a commercial value of £396 million. Over 5,400 people are employed in the catching sector (Scotti sh Government 2009a) with another 5,250 employed in the onshore fi sh processing industry (Scotti sh Government 2009b).
This project aimed to investi gate the extent to which marine litt er aff ects the fi shing industry in Scotland and the associated economic costs of dealing with it. The vast majority of questi onnaire responses received came from twin and single rig trawlers but responses were also received from scallopers, seine nett ers and pair trawlers.
Figure 8.1: Marine litt er can result in numerous problems and high costs for fi shing vessels. Image: David Linkie.

55
Economic Impacts of Marine Litt er
8.2.2 Common types of litt er and worst areas
Fishermen were asked to identi fy the types of litt er that commonly accumulate in their hauls and the results are shown in Figure 8.2 below. The most common type of litt er was rope closely followed by plasti c with over 90% of fi shermen experiencing these types of litt er accumulati ng in their nets. Bott les, wire, derelict fi shing nets and tyres were also very common and over 70% of fi shermen found these types of debris in their hauls. Fishing vessels had also encountered a wide range of other types of debris including:
Oil and fuel fi lters• Tins of paint and grease• Debris from oil related acti viti es • Foreign gill nets• Washing machines• Cars•
Figure 8.2: Most common types of litt er accumulati ng in hauls
Fishermen were also asked to identi fy the “worst area” for collecti ng or snagging marine litt er in their nets but it quickly became apparent that there is no single “worst area” for litt er. Fishing vessels can experience problems with marine litt er wherever they are, although a small number of vessels specifi cally reported problems near areas of recent oil related acti vity. One vessel suggested that “80% of torn and damaged gear, and lost nets is due to oil debris”.
8.2.3 Impact on catch and damage to nets
Marine litt er can restrict the amount vessels catch by accumulati ng in their nets during hauls and this aff ected approximately 86% of vessels surveyed during this project. As one vessel reported “Plasti cs in my net restrict
56
Economic Impacts of Marine Litt er
my trawl fi shing to its full potenti al, as the cod-ends fi ll up with silt quickly. This then alters the geometry of the twin trawl resulti ng in a poor trawl tow”. Several fi shermen also commented that they were now experiencing less litt er on the fi shing grounds than in past years due to the Fishing for Litt er project, which acti vely removes litt er from the seas around Scotland.
Various types of marine litt er can also contaminate a vessel’s catch resulti ng in the fi sh having to be dumped, additi onal costs to clean the vessel and equipment, and lost fi shing ti me. Approximately 82% of vessels surveyed had discarded fi sh due to contaminati on with one vessel reporti ng that it had to “dump three boxes of prawns last trip due to paint”. Every boat that had experienced a contaminated catch identi fi ed paint as a cause with 88% also reporti ng that oil fi lters have fouled their catch. A small number of vessels had also experienced problems with grease and detergents. Contaminati on incidents could occur quite regularly with some vessels experiencing as many as one incident per month.
Over 95% of vessels had snagged their nets on debris on the seabed, although it is not always possible to identi fy whether this debris is natural or man-made. Fishermen commented that debris from oil related acti viti es and old wires on the seabed were parti cular problems in terms of damaging nets.
8.2.4 Incidents involving marine litt er
Marine litt er can pose navigati onal hazards for fi shing vessels and potenti ally result in vessel damage. The types of incidents involving marine litt er include fouled propellers, fouled anchors, fouled rudders and blocked intake pipes and valves. For many vessels, it was diffi cult to esti mate the number of incidents that occur in a year but only 4 vessels reported that they had experienced no incidents with marine debris in the last year.
For the 18 vessels that had experienced incidents with marine litt er, fouled propellers were generally the most common type of incident closely followed by blocked intake pipes and valves. Only one vessel had experienced a fouled rudder and no vessels reported having fouled their anchor on marine litt er.
In terms of specifi c fi gures, 7 vessels were able to provide data about the number of incidents involving marine litt er they had experienced over the course of a year. These vessels reported 20 incidents in total including 6 fouled propellers and 14 cases of blocked intake pipes or valves. On average therefore each vessel parti cipati ng in the project experienced just under 1 incident per year involving marine litt er.
8.2.5 Economic cost of marine litt er to fi shing vessels
This project concentrated on the direct economic impact of marine litt er on fi shing vessels including:
The value of dumped catch• The cost of repairs to fi shing gear and nets• The overall cost of fouling incidents• 9
Lost earnings as a result of reduced fi shing ti me due to clearing litt er from nets• 10
On average, marine litt er costs each fi shing vessel in the Scotti sh fi shing fl eet between €17,219 and €19,165
9 Calculated using the cost of a fouling incident as reported by each vessel.
10 Calculated using the average value of one hour’s fi shing ti me as esti mated by vessels surveyed during this project.

57
Economic Impacts of Marine Litt er
each year and Figure 8.3 below shows how this is split on average between diff erent categories. The loss of fi shing ti me incurred due to clearing nets of marine litt er accounts for the majority of costs experienced by fi shing vessels as a result of marine litt er. On average, each vessel spends 41 hours per year clearing litt er from their nets at a cost of approximately €12,00011. With conti nuing European restricti ons on the number of days fi shing vessels can spend at sea, lost fi shing ti me due to marine litt er is a cost few fi shing vessels can aff ord.
The relati vely low average cost incurred due to fouling incidents refl ects the overall infrequency of these events across the fi shing fl eet. It is also important to note that the economic impact of an incident involving marine litt er is highly dependent upon how good the fi shing is when an incident occurs. As one fi sherman put it, this can result in virtually no cost if the fi shing is poor but “a hell of a lot of money” if the fi shing is good.
Dumped catch12%
Net repairs21%
Fouling incidents1%
Time lost clearing nets
66%
Figure 8.3: Breakdown of the average cost of marine litt er to Scotti sh fi shing vessels
The economic impact of marine litt er on fi shing vessels can clearly be substanti al and represents an additi onal burden on an industry already under pressure. Based on the average fi gures, marine litt er costs the Scotti sh fi shing industry between €11.7 million and €13 million each year12. Marine litt er therefore reduces the revenue generated by aff ected fi sheries by up to 5% per year13.
11 Calculated using the average value of one hour’s fi shing ti me as esti mated by vessels surveyed during this project.
12 Calculated using the average cost of marine litt er per vessel and the number of vessels involved in aff ected fi sheries. Number of vessels in aff ected fi sheries taken from Table 5 of Scotti sh Government (2009a): demersal (355 vessels), nephrops trawl (274 vessels), mechanical dredging (91 vessels) and sucti on dredging (3 vessels). Total of 678 vessels in aff ected fi sheries.
13 Calculated based on the average cost of marine litt er to all vessels in aff ected fi sheries as a percentage of the value of landings for these fi sheries. Value of landings for aff ected fi sheries taken from Table 30 of Scotti sh Government (2009a): demersal (£139,416,000), nephrops (£91,287,000) and scallops (£28,485,000). Total value of landings in aff ected fi sheries: £259,188,000. Converted to Euros: €272,112,428.02.

58
Economic Impacts of Marine Litt er
In general, very few vessels received any assistance to cover costs incurred due to marine litt er. Only 27% of vessels have claimed insurance for incidents involving marine litt er and just 9% had claimed income support. Many vessels also commented that it was very diffi cult to get compensati on for incidents involving oil related debris as it is quite challenging to provide the evidence necessary to support a claim.
8.2.6 Working practi ces
The fi shermen surveyed during this project acknowledged that fi shing vessels do contribute to marine litt er with one fi sherman stati ng, “A lot of beach litt er is coming from fi shing vessels dumping their rubbish on the way to fi shing grounds”. The fi shing industry overall however has adopted a number of positi ve measures to tackle marine litt er and reduce its environmental impact.
All the vessels surveyed had signed up to the Fishing For Litt er scheme, which acti vely removes marine litt er from the seas. Several fi shermen commented that they were already seeing the positi ve eff ects of this project since “fi shing grounds do appear to have less debris on them as we are not seeing the same amounts of plasti cs etc”. Over 77% of the vessels surveyed were also members of a responsible fi shing scheme, which includes commitments to prevent and remove marine litt er.
8.3 Portuguese fi shing vessels
Since most of the Portuguese vessels surveyed used long-lines rather than nets, they encountered very few problems with marine litt er aff ecti ng their catch. Therefore, only 29% of vessels had experienced a restricted catch due to marine litt er and 38% had experienced a contaminated catch, which was caused by oil fi lters in all cases.
In terms of incidents, only 4 Portuguese vessels had sustained no incidents involving marine litt er whatsoever. Fouled propellers were the most common type of incident with 12 vessels sustaining at least one fouled propeller per year. These vessels recorded a total of 19 fouled propellers per year, which is signifi cantly higher than the number reported by Scotti sh vessels. A further 5 Portuguese vessels reported that they experienced fouled propellers approximately once every fi ve years.
Blocked intake pipes and valves were much less common than in the Scotti sh fl eet with only 4 Portuguese vessels experiencing one or more blocked intake pipes or valves per year. Just one vessel had fouled its rudder on marine litt er in the past year and fouled anchors were extremely rare with only one incident of this
Figure 8.4: Full bags of marine litt er deposited by vessels involved in the Fishing for Litt er South West scheme. Image: Sarah Crosbie
59
Economic Impacts of Marine Litt er
type occurring in the past 20 years. Overall, the Portuguese vessels surveyed experienced 1.1 incidents per vessel per year on average, slightly above the incidence rate for Scotti sh vessels.
The economic impact of marine litt er upon Portuguese vessels was on average relati vely low, parti cularly in comparison to the Scotti sh fi gures. Marine litt er cost each Portuguese vessel €2,930 per year on average and over 80% of these costs related to fouled propellers. Indeed, fouled propellers could cost as much as €15,000 per incident. Although repairing nets makes up only 18% of the average cost, this is relati vely high considering the small number of vessels using a net-based approach. Despite high costs for individual vessels, the average cost of marine litt er appears quite low, as these problems seem to aff ect only a small proporti on of the Portuguese fl eet.
Portuguese vessels were oft en successful in claiming insurance to cover the cost of incidents with 81% of vessels reporti ng this to be the case. The number of vessels able to claim income support was also slightly higher than in Scotland and 19% of vessels had been able to do so in the event of an incident. Just under half of the vessels surveyed were also involved in a responsible fi shing scheme.
8.4 Spanish Fishing Vessels
A total of 6 responses were received from Spanish fi shing vessels and all of these vessels fi shed within the Mediterranean Sea. These responses came from trawlers and vessels using seine nets. While representi ng only a small sample, the Spanish vessels surveyed experienced broadly similar problems with marine litt er to those occurring in Scotland.
All the vessels surveyed had experienced a restricted catch due to marine litt er accumulati ng in their nets and plasti c, parti cularly plasti c bott les, was the most common type of debris. Marine litt er had contaminated the catch of 3 vessels with paint the most common cause, although grease and oil fi lters also proved to be a problem. Virtually all the vessels surveyed had snagged their nets on debris on the seabed.
Every vessel surveyed had experienced at least one incident involving marine litt er but only 3 vessels were able to report how oft en this occurred per year. These vessels had experienced 1 fouled propeller and 3 blocked intake pipes or valves in the past year. With minimal data, it is not possible to determine the economic cost of these incidents. All of the vessels surveyed were also signed up to a responsible fi shing scheme.
8.5 Conclusion
The fi ndings presented in this chapter clearly show that marine litt er poses numerous and widespread issues for the fi shing industry. Of the Scotti sh vessels that responded, 86% had experienced a restricted catch due to marine litt er, 82% had had their catch contaminated and 95% had snagged their nets on debris on the seabed. Incidents such as fouled propellers and blocked intake pipes were also relati vely common with an average of just under 1 incident reported per vessel per year.
Although subject to variability depending on the quality of fi shing, it is also clear that marine litt er results in high costs both to individual fi shing vessels and to the industry as a whole. Marine litt er costs the Scotti sh fi shing industry €11.7 - €13 million each year, which is the equivalent of up to 5% of the total revenue of aff ected fi sheries. Given the conti nuing restricti ons on the number of days fi shing vessels can spend at sea, the large amount of lost fi shing ti me due to marine litt er is an area of parti cular concern.
60
Economic Impacts of Marine Litt er
Vessels surveyed during this project also acknowledged that the fi shing industry is both a source and a victi m of marine litt er. Within Scotland, plasti cs and rope were the most common types of litt er encountered by fi shing vessels and oil industry debris conti nued to pose signifi cant problems. The fi shing industry is also making a considerable eff ort to reduce marine litt er by both preventi ng litt er entering the marine environment and removing existi ng marine litt er through the Fishing for Litt er scheme.
While the impacts of marine litt er are variable, case studies from Portugal and Spain demonstrate that marine litt er can cause widespread problems for fi shing vessels. Fouled propellers posed the main issues for Portuguese vessels and although individual incidents could be very costly, the average cost of marine litt er per vessel was relati vely low as only a small proporti on of the vessels surveyed were aff ected. Although the small group of Spanish vessels surveyed fi shed in the Mediterranean Sea, they experienced fairly similar problems with marine litt er to those reported by the Scotti sh fl eet in the Northeast Atlanti c.
Marine litt er poses numerous issues for fi shing vessels and there are a number of acti ons the industry could take to reduce its own contributi on to marine litt er. In parti cular, environmental awareness training, incorporati ng marine litt er issues, for all professional fi shermen could be implemented and made compulsory. Port waste recepti on faciliti es regulati ons could also be expanded to include fi shing vessels, which are currently exempt, in order to monitor waste disposal and deter illegal discharges at sea. In additi on, Scotti sh fi shermen are fi nding less litt er on their fi shing grounds thanks to the Fishing for Litt er scheme and therefore encouraging further parti cipati on in this scheme and extending it into new areas would be benefi cial for both fi shermen and the environment.
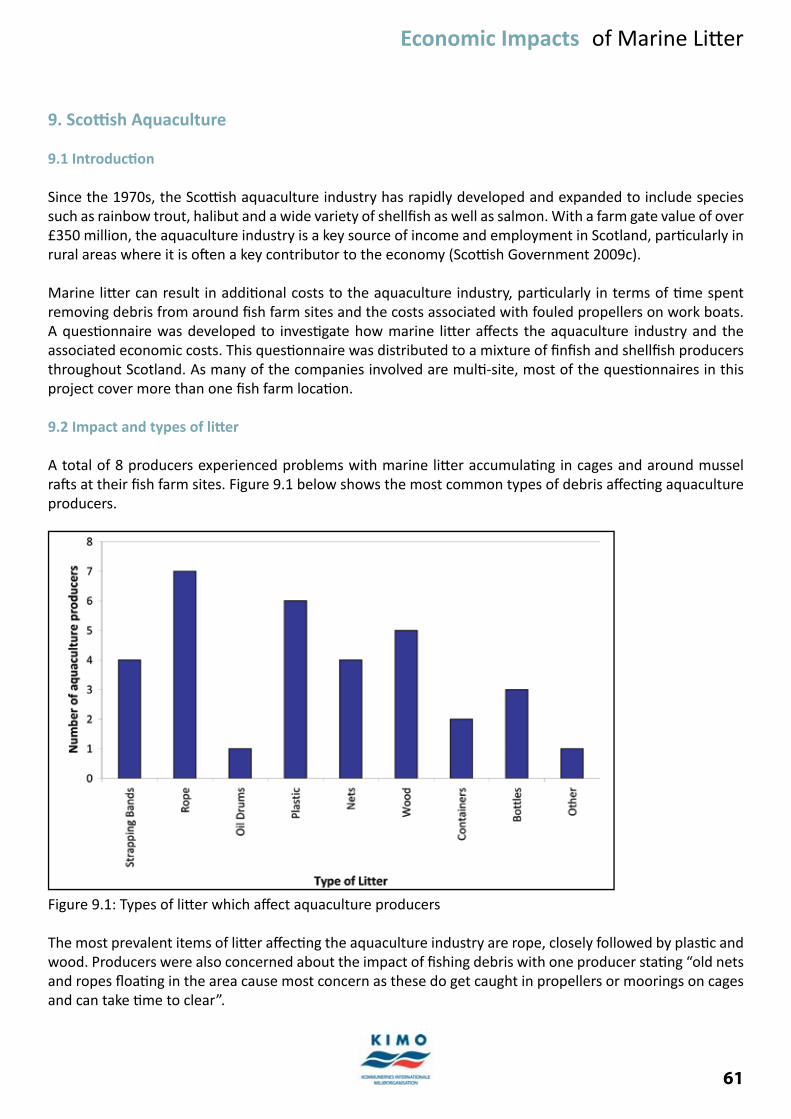
61
Economic Impacts of Marine Litt er
9. Scotti sh Aquaculture
9.1 Introducti on
Since the 1970s, the Scotti sh aquaculture industry has rapidly developed and expanded to include species such as rainbow trout, halibut and a wide variety of shellfi sh as well as salmon. With a farm gate value of over £350 million, the aquaculture industry is a key source of income and employment in Scotland, parti cularly in rural areas where it is oft en a key contributor to the economy (Scotti sh Government 2009c).
Marine litt er can result in additi onal costs to the aquaculture industry, parti cularly in terms of ti me spent removing debris from around fi sh farm sites and the costs associated with fouled propellers on work boats. A questi onnaire was developed to investi gate how marine litt er aff ects the aquaculture industry and the associated economic costs. This questi onnaire was distributed to a mixture of fi nfi sh and shellfi sh producers throughout Scotland. As many of the companies involved are multi -site, most of the questi onnaires in this project cover more than one fi sh farm locati on.
9.2 Impact and types of litt er
A total of 8 producers experienced problems with marine litt er accumulati ng in cages and around mussel raft s at their fi sh farm sites. Figure 9.1 below shows the most common types of debris aff ecti ng aquaculture producers.
Figure 9.1: Types of litt er which aff ect aquaculture producers
The most prevalent items of litt er aff ecti ng the aquaculture industry are rope, closely followed by plasti c and wood. Producers were also concerned about the impact of fi shing debris with one producer stati ng “old nets and ropes fl oati ng in the area cause most concern as these do get caught in propellers or moorings on cages and can take ti me to clear”.
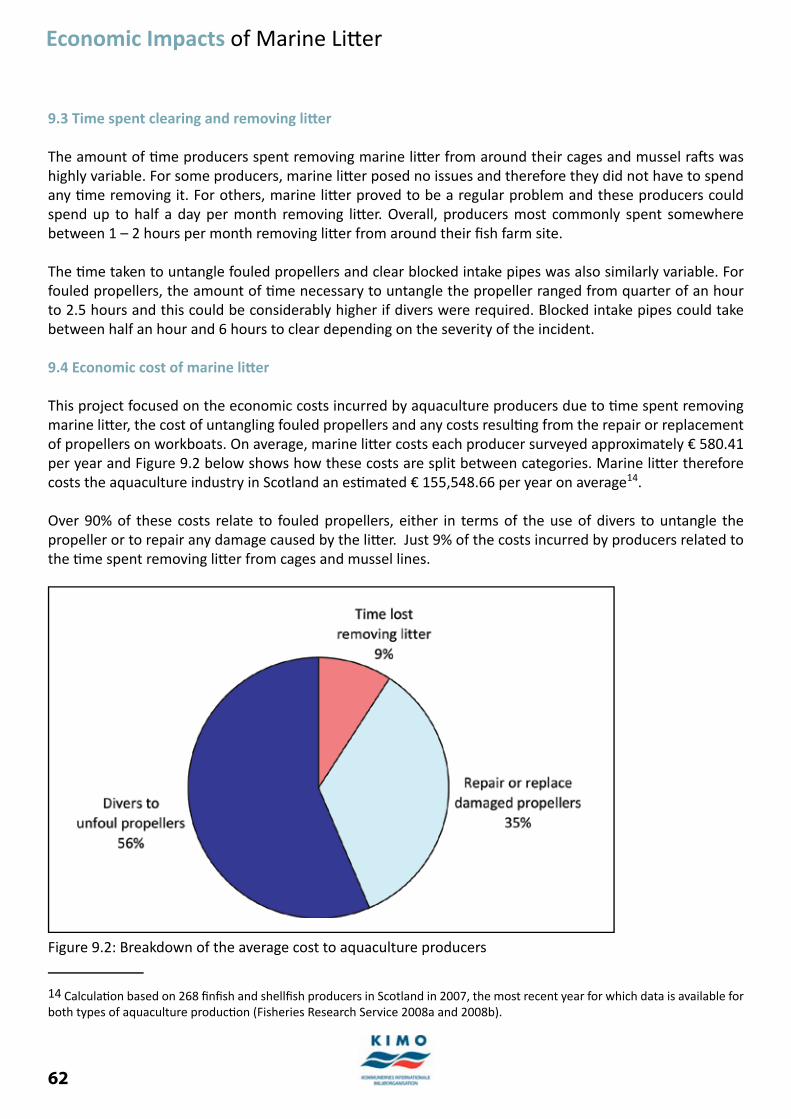
62
Economic Impacts of Marine Litt er
9.3 Time spent clearing and removing litt er
The amount of ti me producers spent removing marine litt er from around their cages and mussel raft s was highly variable. For some producers, marine litt er posed no issues and therefore they did not have to spend any ti me removing it. For others, marine litt er proved to be a regular problem and these producers could spend up to half a day per month removing litt er. Overall, producers most commonly spent somewhere between 1 – 2 hours per month removing litt er from around their fi sh farm site.
The ti me taken to untangle fouled propellers and clear blocked intake pipes was also similarly variable. For fouled propellers, the amount of ti me necessary to untangle the propeller ranged from quarter of an hour to 2.5 hours and this could be considerably higher if divers were required. Blocked intake pipes could take between half an hour and 6 hours to clear depending on the severity of the incident.
9.4 Economic cost of marine litt er
This project focused on the economic costs incurred by aquaculture producers due to ti me spent removing marine litt er, the cost of untangling fouled propellers and any costs resulti ng from the repair or replacement of propellers on workboats. On average, marine litt er costs each producer surveyed approximately € 580.41 per year and Figure 9.2 below shows how these costs are split between categories. Marine litt er therefore costs the aquaculture industry in Scotland an esti mated € 155,548.66 per year on average14.
Over 90% of these costs relate to fouled propellers, either in terms of the use of divers to untangle the propeller or to repair any damage caused by the litt er. Just 9% of the costs incurred by producers related to the ti me spent removing litt er from cages and mussel lines.
Figure 9.2: Breakdown of the average cost to aquaculture producers
14 Calculati on based on 268 fi nfi sh and shellfi sh producers in Scotland in 2007, the most recent year for which data is available for both types of aquaculture producti on (Fisheries Research Service 2008a and 2008b).
63
Economic Impacts of Marine Litt er
9.5 Waste disposal and eff orts to minimise marine litt er
Responsible waste disposal is a key part of minimising the release of litt er into the environment and over 90% of producers surveyed sent their waste to landfi ll. Over 60% also recycled some of their waste. Aquaculture producers were also taking a number of other steps to reduce the amount of litt er entering the marine environment with 82% acti vely trying to reduce the amount of packaging taken to sea. Similarly, 73% of producers surveyed try to provide supplies with minimal packaging and 82% bring ashore any waste seen fl oati ng in their cages or around mussel raft s.
9.6 Conclusion
While representi ng only a small sample, the aquaculture producers surveyed experienced highly variable problems with marine litt er. Overall, fouled propellers on work boats presented the most common issue and could lead to high costs in terms of repairing and replacing damaged propellers. In comparison, removing marine litt er from around producti on sites was less of an issue for aquaculture producers.
While the cost of individual incidents was high, the average cost of marine litt er to aquaculture producers was low at € 580.41 per year, refl ecti ng the infrequent occurrence of fouled propellers. Marine litt er therefore costs the aquaculture industry in Scotland an esti mated €155,548.66 per year on average, which is relati vely low, parti cularly in comparison to other industries such as sea fi sheries.

64
Economic Impacts of Marine Litt er
10. Harbours and Marinas
10.1 Introducti on
With over 90% of global trade carried by sea (IMO 2009), ports and harbours are essenti al gateways for the transportati on of goods around the world. Marinas also make an important contributi on to many coastal communiti es by att racti ng tourists and generati ng income and employment. In the UK for example, the marina industry has a turnover of approximately £113 million and directly employs more than 1,700 people (BMF 2007).
The primary economic impact of marine litt er on harbours and marinas is the cost of removing marine litt er in order to ensure that these faciliti es remain clean, safe and att racti ve for users. This can involve both the manual removal of fl oati ng debris and dredging specifi cally to remove marine litt er items obstructi ng the seabed. Questi onnaires were developed to investi gate the impact of marine litt er and the associated cost of dealing with it for harbours and marinas. These were distributed to harbours and marinas in countries throughout the Northeast Atlanti c region.
10.2 United Kingdom
10.2.1 Litt er removal: dredging and manual cleansing
Overall, 46.1% of harbours and marinas surveyed took acti on to remove marine litt er. Within this, 6 harbours and marinas dredged specifi cally to remove marine litt er and a further 36 organisati ons manually removed marine litt er. It is worth noti ng that the number of harbours that manually remove marine litt er may be higher than these results suggest as these fi gures are drawn solely from harbours’ comments. In additi on, one harbour used a ‘seabed dragging program’ and biennial dive surveys to remove dumped wire and other debris from within harbour limits.
The ti me these organisati ons spent on litt er clearance acti viti es varied considerably depending on the method they used to remove litt er. Dredging due to marine litt er was generally required only once every few years in most cases while the manual removal of marine litt er tended to occur on a monthly basis. This could take anything from 1 hour per month to more than 36 hours per month, although the majority of organisati ons spent between 1 and 5 hours per month manually removing marine litt er. On average, this was part of the duti es of 2 members of staff in each harbour and marina.
Harbours were also asked to identi fy the most common types of litt er removed during dredging and manual removal of litt er, and the results are displayed in Figure 10.1 overleaf. Rope and plasti c were the most common types of litt er found with over 70% of those surveyed reporti ng that they collect these types of litt er. Wood and nets were also relati vely common and these were found by 58.3% and 54.2% of harbours respecti vely.

65
Economic Impacts of Marine Litt er
Figure 10.1: Most common types of litt er removed by harbours
Harbours disposed of marine litt er using a variety of methods including landfi ll, incinerati on and recycling. Landfi ll was the most popular means of disposal with 91.9% of harbours using this method to dispose of marine litt er. The uptake of recycling among harbours was also very encouraging and 48.7% of harbours sent at least some of the marine litt er they collected to be recycled. Only 16.2% of harbours incinerated marine litt er.
10.2.2 Incidents
To gage the extent to which marine litt er aff ects vessels, harbours and marinas were asked whether their users had experienced any incidents with marine debris over the last year. Over 71% of harbours and marinas reported that their users had experienced incidents such as fouled propellers, fouled anchors, fouled rudders and blocked intake pipes and valves.
10.2.2.1 Fouled Propellers
Fouled propellers were by far the most commonly reported type of incident with 69% of harbours and marinas stati ng that their users had experienced this type of incident. These organisati ons were asked to identi fy how oft en their users either sustained a fouled propeller within harbour limits or entered the harbour having fouled their propeller elsewhere at sea. As Figure 10.2 overleaf illustrates, harbours and marinas most commonly reported between 1 and 5 fouled propellers among their users per year. Only a small proporti on of organisati ons reported that vessels using their faciliti es sustained more than 5 fouled propellers per year, although one harbour did report that its users had experienced as many as 20 fouled propellers over the course of a year.
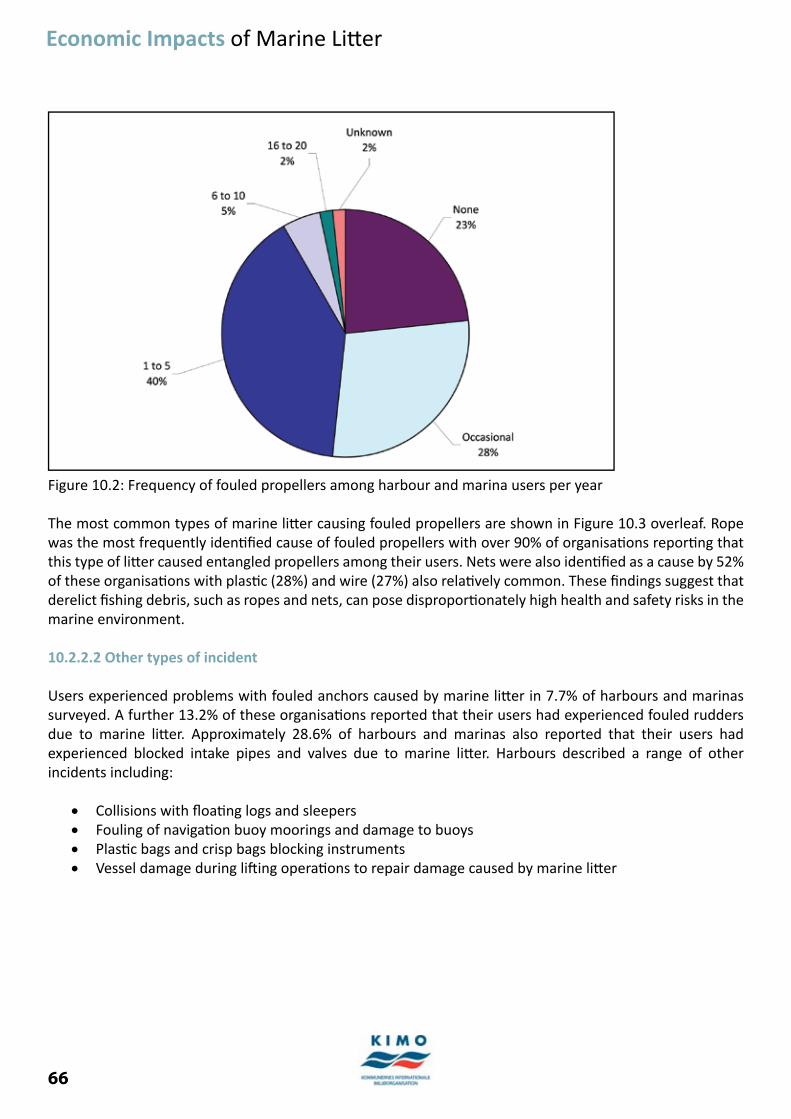
66
Economic Impacts of Marine Litt er
Figure 10.2: Frequency of fouled propellers among harbour and marina users per year
The most common types of marine litt er causing fouled propellers are shown in Figure 10.3 overleaf. Rope was the most frequently identi fi ed cause of fouled propellers with over 90% of organisati ons reporti ng that this type of litt er caused entangled propellers among their users. Nets were also identi fi ed as a cause by 52% of these organisati ons with plasti c (28%) and wire (27%) also relati vely common. These fi ndings suggest that derelict fi shing debris, such as ropes and nets, can pose disproporti onately high health and safety risks in the marine environment.
10.2.2.2 Other types of incident
Users experienced problems with fouled anchors caused by marine litt er in 7.7% of harbours and marinas surveyed. A further 13.2% of these organisati ons reported that their users had experienced fouled rudders due to marine litt er. Approximately 28.6% of harbours and marinas also reported that their users had experienced blocked intake pipes and valves due to marine litt er. Harbours described a range of other incidents including:
Collisions with fl oati ng logs and sleepers• Fouling of navigati on buoy moorings and damage to buoys• Plasti c bags and crisp bags blocking instruments• Vessel damage during lift ing operati ons to repair damage caused by marine litt er•
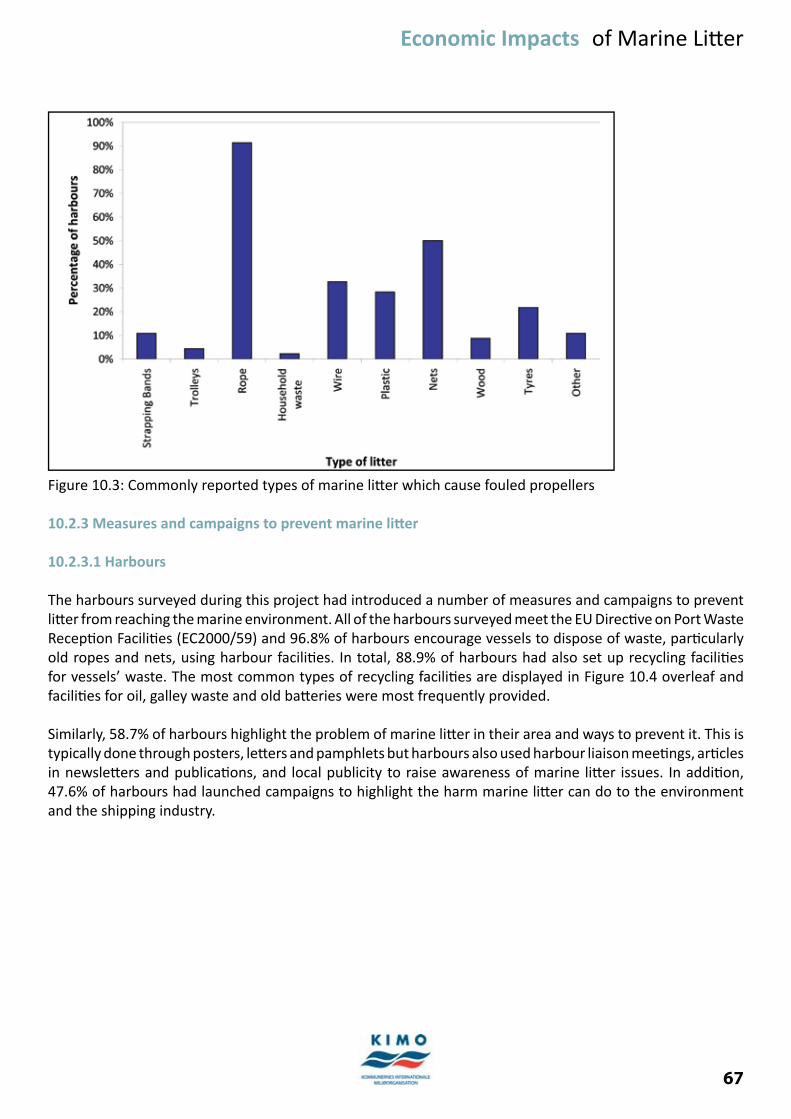
67
Economic Impacts of Marine Litt er
Figure 10.3: Commonly reported types of marine litt er which cause fouled propellers
10.2.3 Measures and campaigns to prevent marine litt er
10.2.3.1 Harbours
The harbours surveyed during this project had introduced a number of measures and campaigns to prevent litt er from reaching the marine environment. All of the harbours surveyed meet the EU Directi ve on Port Waste Recepti on Faciliti es (EC2000/59) and 96.8% of harbours encourage vessels to dispose of waste, parti cularly old ropes and nets, using harbour faciliti es. In total, 88.9% of harbours had also set up recycling faciliti es for vessels’ waste. The most common types of recycling faciliti es are displayed in Figure 10.4 overleaf and faciliti es for oil, galley waste and old batt eries were most frequently provided.
Similarly, 58.7% of harbours highlight the problem of marine litt er in their area and ways to prevent it. This is typically done through posters, lett ers and pamphlets but harbours also used harbour liaison meeti ngs, arti cles in newslett ers and publicati ons, and local publicity to raise awareness of marine litt er issues. In additi on, 47.6% of harbours had launched campaigns to highlight the harm marine litt er can do to the environment and the shipping industry.
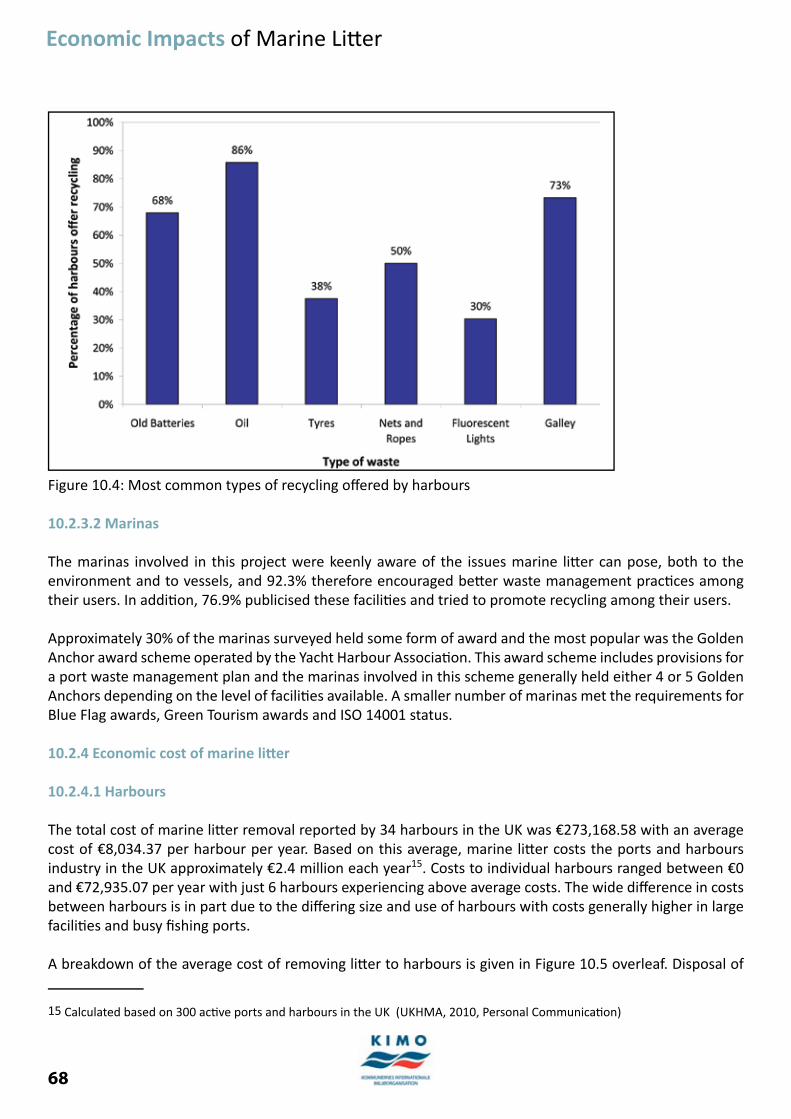
68
Economic Impacts of Marine Litt er
Figure 10.4: Most common types of recycling off ered by harbours
10.2.3.2 Marinas
The marinas involved in this project were keenly aware of the issues marine litt er can pose, both to the environment and to vessels, and 92.3% therefore encouraged bett er waste management practi ces among their users. In additi on, 76.9% publicised these faciliti es and tried to promote recycling among their users.
Approximately 30% of the marinas surveyed held some form of award and the most popular was the Golden Anchor award scheme operated by the Yacht Harbour Associati on. This award scheme includes provisions for a port waste management plan and the marinas involved in this scheme generally held either 4 or 5 Golden Anchors depending on the level of faciliti es available. A smaller number of marinas met the requirements for Blue Flag awards, Green Tourism awards and ISO 14001 status.
10.2.4 Economic cost of marine litt er
10.2.4.1 Harbours
The total cost of marine litt er removal reported by 34 harbours in the UK was €273,168.58 with an average cost of €8,034.37 per harbour per year. Based on this average, marine litt er costs the ports and harbours industry in the UK approximately €2.4 million each year15. Costs to individual harbours ranged between €0 and €72,935.07 per year with just 6 harbours experiencing above average costs. The wide diff erence in costs between harbours is in part due to the diff ering size and use of harbours with costs generally higher in large faciliti es and busy fi shing ports.
A breakdown of the average cost of removing litt er to harbours is given in Figure 10.5 overleaf. Disposal of
15 Calculated based on 300 acti ve ports and harbours in the UK (UKHMA, 2010, Personal Communicati on)
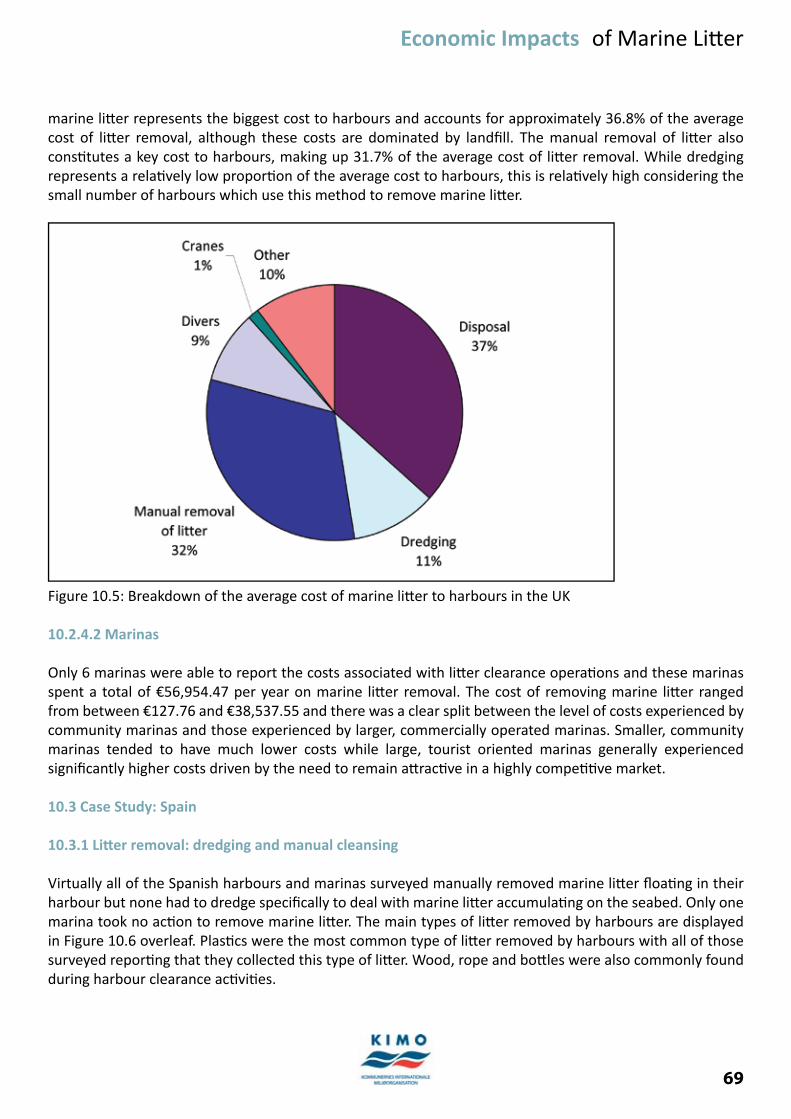
69
Economic Impacts of Marine Litt er
marine litt er represents the biggest cost to harbours and accounts for approximately 36.8% of the average cost of litt er removal, although these costs are dominated by landfi ll. The manual removal of litt er also consti tutes a key cost to harbours, making up 31.7% of the average cost of litt er removal. While dredging represents a relati vely low proporti on of the average cost to harbours, this is relati vely high considering the small number of harbours which use this method to remove marine litt er.
Figure 10.5: Breakdown of the average cost of marine litt er to harbours in the UK
10.2.4.2 Marinas
Only 6 marinas were able to report the costs associated with litt er clearance operati ons and these marinas spent a total of €56,954.47 per year on marine litt er removal. The cost of removing marine litt er ranged from between €127.76 and €38,537.55 and there was a clear split between the level of costs experienced by community marinas and those experienced by larger, commercially operated marinas. Smaller, community marinas tended to have much lower costs while large, tourist oriented marinas generally experienced signifi cantly higher costs driven by the need to remain att racti ve in a highly competi ti ve market.
10.3 Case Study: Spain
10.3.1 Litt er removal: dredging and manual cleansing
Virtually all of the Spanish harbours and marinas surveyed manually removed marine litt er fl oati ng in their harbour but none had to dredge specifi cally to deal with marine litt er accumulati ng on the seabed. Only one marina took no acti on to remove marine litt er. The main types of litt er removed by harbours are displayed in Figure 10.6 overleaf. Plasti cs were the most common type of litt er removed by harbours with all of those surveyed reporti ng that they collected this type of litt er. Wood, rope and bott les were also commonly found during harbour clearance acti viti es.
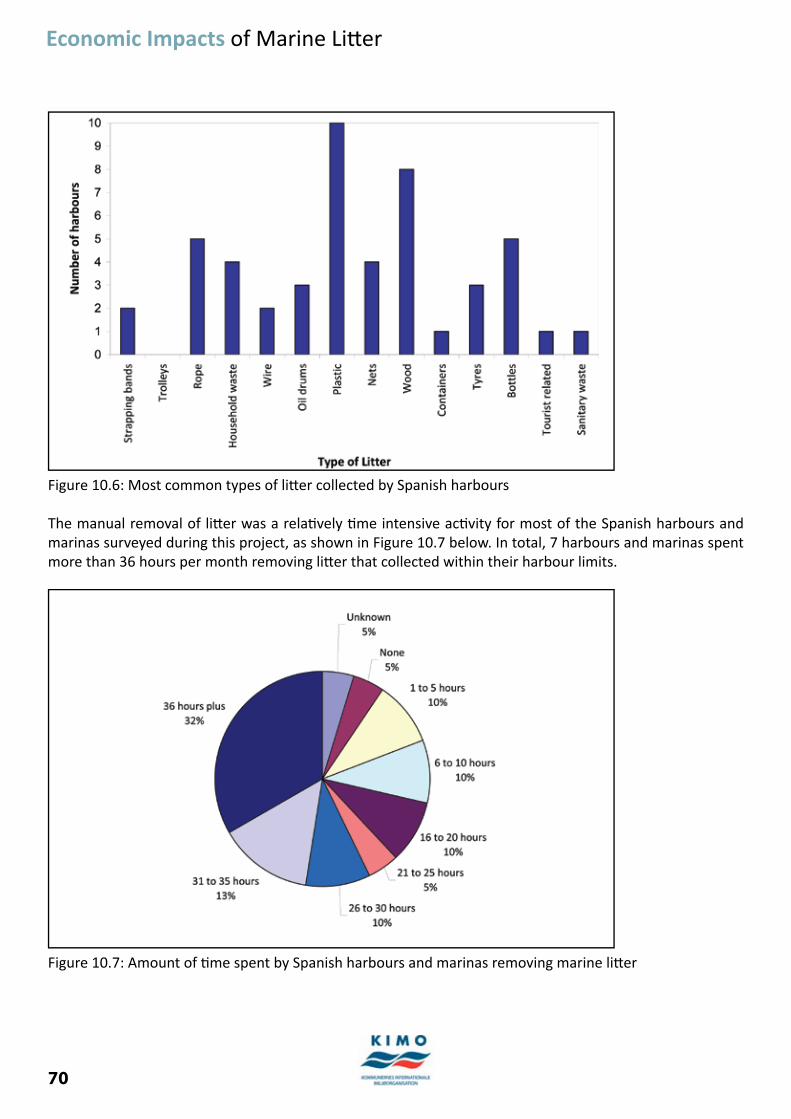
70
Economic Impacts of Marine Litt er
Figure 10.6: Most common types of litt er collected by Spanish harbours
The manual removal of litt er was a relati vely ti me intensive acti vity for most of the Spanish harbours and marinas surveyed during this project, as shown in Figure 10.7 below. In total, 7 harbours and marinas spent more than 36 hours per month removing litt er that collected within their harbour limits.
Figure 10.7: Amount of ti me spent by Spanish harbours and marinas removing marine litt er

71
Economic Impacts of Marine Litt er
In terms of disposal, 8 harbours sent marine litt er to landfi ll while 7 used recycling faciliti es. Therefore 2 harbours exclusively relied on recycling to dispose of marine litt er and this is very encouraging as marine litt er is generally thought to be diffi cult to recycle due to contaminati on and diffi culti es separati ng waste streams.
10.3.2 Incidents
Spanish harbours and marinas were also asked whether their users had experienced any incidents with marine litt er over the last year to gage how marine litt er aff ects vessels in that area. Over half of the organisati ons surveyed reported that their users had experienced some kind of incident involving marine litt er. The most common type of incident was a fouled propeller with 10 harbours and marinas reporti ng that their users had experienced this type of incident. Fouled propellers generally only occurred occasionally but 1 marina did report that its users had sustained as many as 15 fouled propellers over the course of a year. The causes of fouled propellers were broadly similar to those reported in the UK with rope, nets and plasti cs identi fi ed as the main causes of these incidents.
Other types of incidents involving marine litt er were relati vely rare according to Spanish harbours and marinas. Only 3 organisati ons reported that vessels using their faciliti es had experienced blocked intake pipes caused by marine litt er. A further 2 organisati ons reported that their users had sustained fouled rudders and only 1 marina reported a fouled anchor among its users.
10.3.3 Measures and campaigns to prevent marine litt er
The Spanish harbours surveyed during this project have introduced a number of measures to tackle marine litt er and all those surveyed met the requirements of the EU Directi ve on Port Waste Recepti on Faciliti es (EC2000/59). 9 out of 10 harbours also encouraged users to dispose of their waste using harbour faciliti es, parti cularly ropes, nets and fi sh boxes. In additi on, 8 harbours had set up recycling areas and these mostly focused on oil, nets, ropes and galley waste.
Just over half of the harbours surveyed highlighted the issue of marine litt er in their area and ways to prevent it. This was typically done using posters, lett ers and pamphlets but several harbours also off ered free lectures and courses about marine litt er. Half of the harbours surveyed had launched campaigns to raise awareness of the harm marine litt er can cause to the environment and the shipping industry.
Similarly, all the marinas surveyed as part of this project encouraged their users to practi ce bett er waste management techniques. In additi on, 10 marinas publicised their faciliti es and promoted recycling among their users. More than half the marinas surveyed also held some form of award that required them to meet environmental and waste management commitments. The most common types of awards were Blue Flags and ISO 14001 certi fi cati on.
10.3.4 Economic cost of marine litt er
10.3.4.1 Harbours
The total cost of marine litt er reported by 9 Spanish ports and harbours amounted to €549,117.33 with an average cost of €61,013.04 per harbour per year. A breakdown of costs is presented in Figure 10.8 overleaf and the vast majority of costs clearly relate to the manual removal of litt er. While this is a small case study,
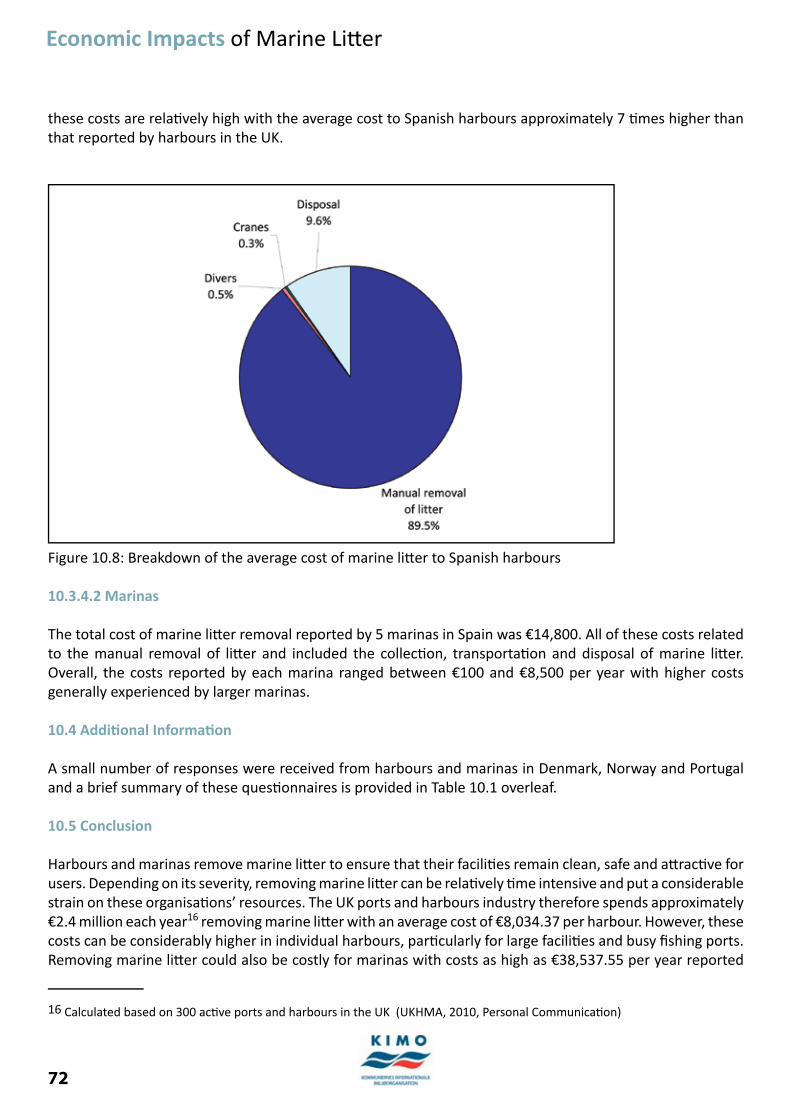
72
Economic Impacts of Marine Litt er
these costs are relati vely high with the average cost to Spanish harbours approximately 7 ti mes higher than that reported by harbours in the UK.
Figure 10.8: Breakdown of the average cost of marine litt er to Spanish harbours
10.3.4.2 Marinas
The total cost of marine litt er removal reported by 5 marinas in Spain was €14,800. All of these costs related to the manual removal of litt er and included the collecti on, transportati on and disposal of marine litt er. Overall, the costs reported by each marina ranged between €100 and €8,500 per year with higher costs generally experienced by larger marinas.
10.4 Additi onal Informati on
A small number of responses were received from harbours and marinas in Denmark, Norway and Portugal and a brief summary of these questi onnaires is provided in Table 10.1 overleaf.
10.5 Conclusion
Harbours and marinas remove marine litt er to ensure that their faciliti es remain clean, safe and att racti ve for users. Depending on its severity, removing marine litt er can be relati vely ti me intensive and put a considerable strain on these organisati ons’ resources. The UK ports and harbours industry therefore spends approximately €2.4 million each year16 removing marine litt er with an average cost of €8,034.37 per harbour. However, these costs can be considerably higher in individual harbours, parti cularly for large faciliti es and busy fi shing ports. Removing marine litt er could also be costly for marinas with costs as high as €38,537.55 per year reported
16 Calculated based on 300 acti ve ports and harbours in the UK (UKHMA, 2010, Personal Communicati on)

73
Economic Impacts of Marine Litt er
in the UK but the small size of the sample prevented the calculati on of the cost of marine litt er to the marina industry.
The informati on provided by harbours and marinas also suggests that incidents involving vessel damage caused by marine litt er are widespread with over 70% of UK harbours and marinas reporti ng that their users had experienced incidents involving marine litt er. Fouled propellers were the most common type of incidents reported but overall, incidents involving marine litt er generally only occurred occasionally. The most common cause of fouled propellers was derelict fi shing gear such as ropes and nets, which suggests that this type of marine litt er can pose disproporti onately high health and safety risks.
The harbours and marinas surveyed during this project were making a considerable eff ort to prevent marine litt er and promote responsible waste practi ces among vessels using their faciliti es. All the harbours surveyed met the EU Directi ve on Port Waste Recepti on Faciliti es (EC2000/59) and many organisati ons had put in place additi onal measures to encourage the responsible disposal of ships’ waste including recycling faciliti es, informati on boards and publicity campaigns about the detrimental impact of marine litt er on shipping and the environment. Marinas were similarly keen to promote responsible waste practi ces amongst their users and many held some form of award that included commitments towards responsible waste disposal.
In additi on to current eff orts by harbours and marinas to reduce marine litt er, there are a number of other programs and measures that could also help to reduce the amount of litt er entering the marine environment. Improvements to the enforcement of the EU Directi ve on Port Waste Recepti on Faciliti es (EC2000/50), the introducti on of compulsory waste disposal for all vessels and the implementati on of a “no special fee” system for the use of waste recepti on faciliti es would increase the incenti ve for vessels to responsibly dispose of waste in harbours.
Similarly, the introducti on of a zero waste policy for all vessels, which bans the disposal of any waste at sea, including incinerator ash, and higher minimum penalti es for illegal dumping could deter vessels from illegally discharging waste. Acti on is also required to improve the monitoring and enforcement of current legislati on, as there have been very few prosecuti ons to date under MARPOL Annex V legislati on. Finally, environmental awareness training, including marine litt er issues, should be made compulsory for all ship owners and operators, crew members, fi shermen and recreati onal boat owners.

74
Economic Impacts of Marine Litt er
Country Denmark Norway PortugalNumber of responses 4 harbours and 1 marina 4 harbours 5 marinasDredge for marine litt er 1 harbour, once or twice per
year1 harbour, once or twice per year
None
Manually remove marine litt er
4 organisati ons, plasti c items are a parti cular problem
3 harbours 1 marina, 6-10 hours per month
Cost of removing marine litt er
Between €0 and €21,520.41 per harbour per year
Between €0 and €20,104.13 per harbour per year
Unknown
Incidents involving marine litt er per year
Between 1 and 5 fouled propellers: 2 harbours and marinasOccasional fouled propellers: 1 harbourNone: 2 harbours Blocked intake pipes: 1 marina
Between 1 and 5 fouled propellers: 1 harbourOccasional fouled propellers: 2 harboursNone: 1 harbour
Between 11-15 fouled propellers: 1 marinaOccasional fouled propellers: 2 marinasNone: 2 marinasFouled anchors: 1 marinaFouled rudders: 1 marinaBlocked intake pipes: 1 marina
Sati sfy EU Directi ve on Port Waste Recepti on Faciliti es (EC2000/59)
All harbours All harbours Not asked
Recycling areas in port 4 organisati ons, wide variety of items including nets and ropes, galley waste, oil and tyres
All harbours, wide variety of items including old batt eries, nets and ropes, oil and galley waste
All marinas
Runs campaigns to draw att enti on to harm marine litt er can cause to the environment and shipping industry
3 harbours 3 harbours Not asked
Table 10.1: Brief summary of questi onnaires from countries where a small number of responses were received
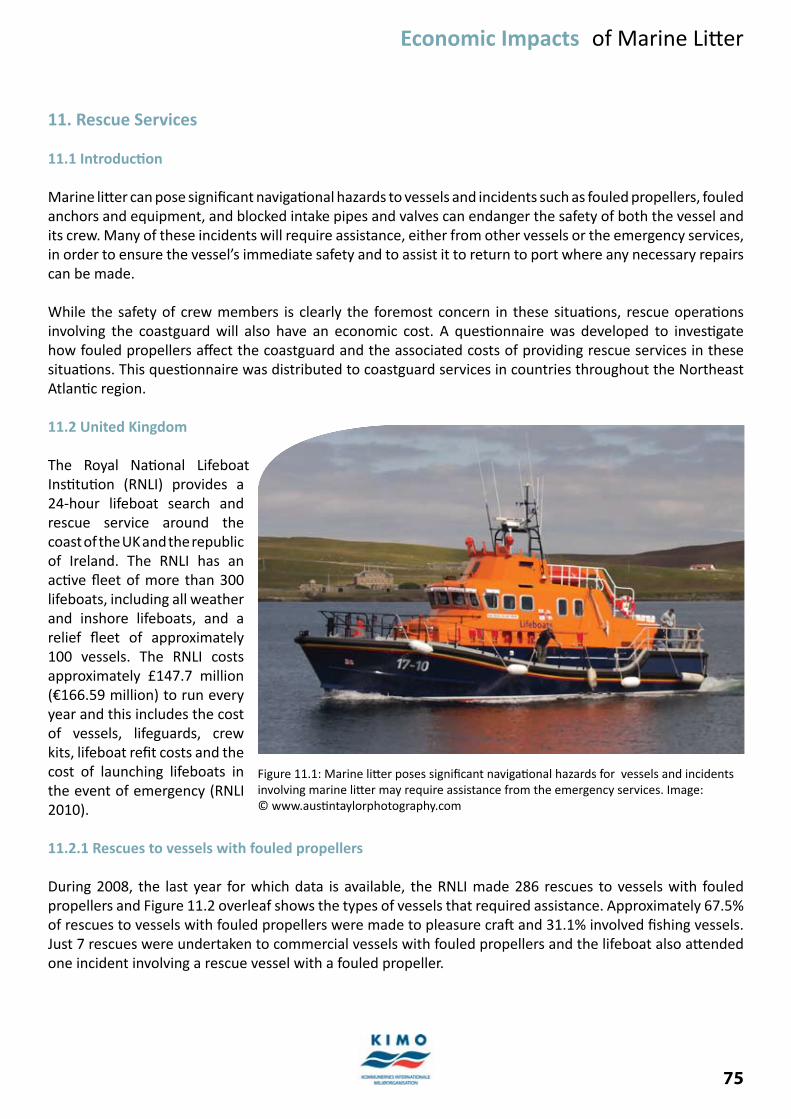
75
Economic Impacts of Marine Litt er
11. Rescue Services
11.1 Introducti on
Marine litt er can pose signifi cant navigati onal hazards to vessels and incidents such as fouled propellers, fouled anchors and equipment, and blocked intake pipes and valves can endanger the safety of both the vessel and its crew. Many of these incidents will require assistance, either from other vessels or the emergency services, in order to ensure the vessel’s immediate safety and to assist it to return to port where any necessary repairs can be made.
While the safety of crew members is clearly the foremost concern in these situati ons, rescue operati ons involving the coastguard will also have an economic cost. A questi onnaire was developed to investi gate how fouled propellers aff ect the coastguard and the associated costs of providing rescue services in these situati ons. This questi onnaire was distributed to coastguard services in countries throughout the Northeast Atlanti c region.
11.2 United Kingdom
The Royal Nati onal Lifeboat Insti tuti on (RNLI) provides a 24-hour lifeboat search and rescue service around the coast of the UK and the republic of Ireland. The RNLI has an acti ve fl eet of more than 300 lifeboats, including all weather and inshore lifeboats, and a relief fl eet of approximately 100 vessels. The RNLI costs approximately £147.7 million (€166.59 million) to run every year and this includes the cost of vessels, lifeguards, crew kits, lifeboat refi t costs and the cost of launching lifeboats in the event of emergency (RNLI 2010).
11.2.1 Rescues to vessels with fouled propellers
During 2008, the last year for which data is available, the RNLI made 286 rescues to vessels with fouled propellers and Figure 11.2 overleaf shows the types of vessels that required assistance. Approximately 67.5% of rescues to vessels with fouled propellers were made to pleasure craft and 31.1% involved fi shing vessels. Just 7 rescues were undertaken to commercial vessels with fouled propellers and the lifeboat also att ended one incident involving a rescue vessel with a fouled propeller.
Figure 11.1: Marine litt er poses signifi cant navigati onal hazards for vessels and incidents involving marine litt er may require assistance from the emergency services. Image: © www.austi ntaylorphotography.com
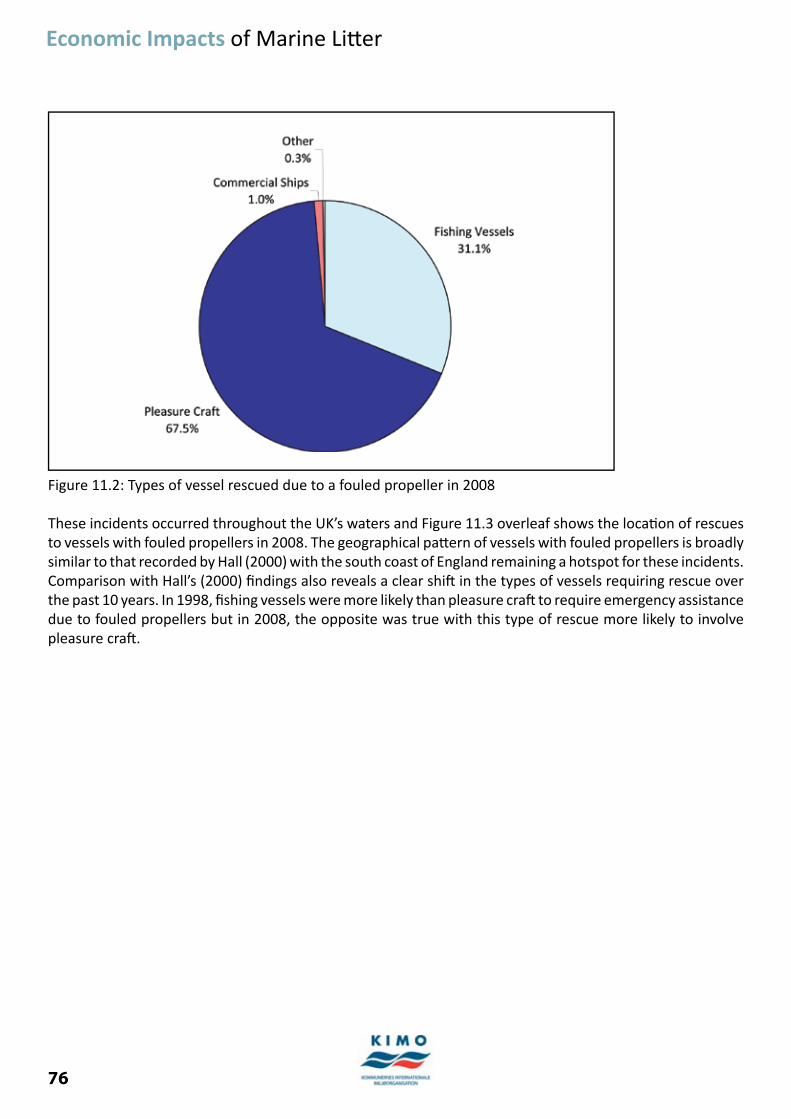
76
Economic Impacts of Marine Litt er
Figure 11.2: Types of vessel rescued due to a fouled propeller in 2008
These incidents occurred throughout the UK’s waters and Figure 11.3 overleaf shows the locati on of rescues to vessels with fouled propellers in 2008. The geographical patt ern of vessels with fouled propellers is broadly similar to that recorded by Hall (2000) with the south coast of England remaining a hotspot for these incidents. Comparison with Hall’s (2000) fi ndings also reveals a clear shift in the types of vessels requiring rescue over the past 10 years. In 1998, fi shing vessels were more likely than pleasure craft to require emergency assistance due to fouled propellers but in 2008, the opposite was true with this type of rescue more likely to involve pleasure craft .
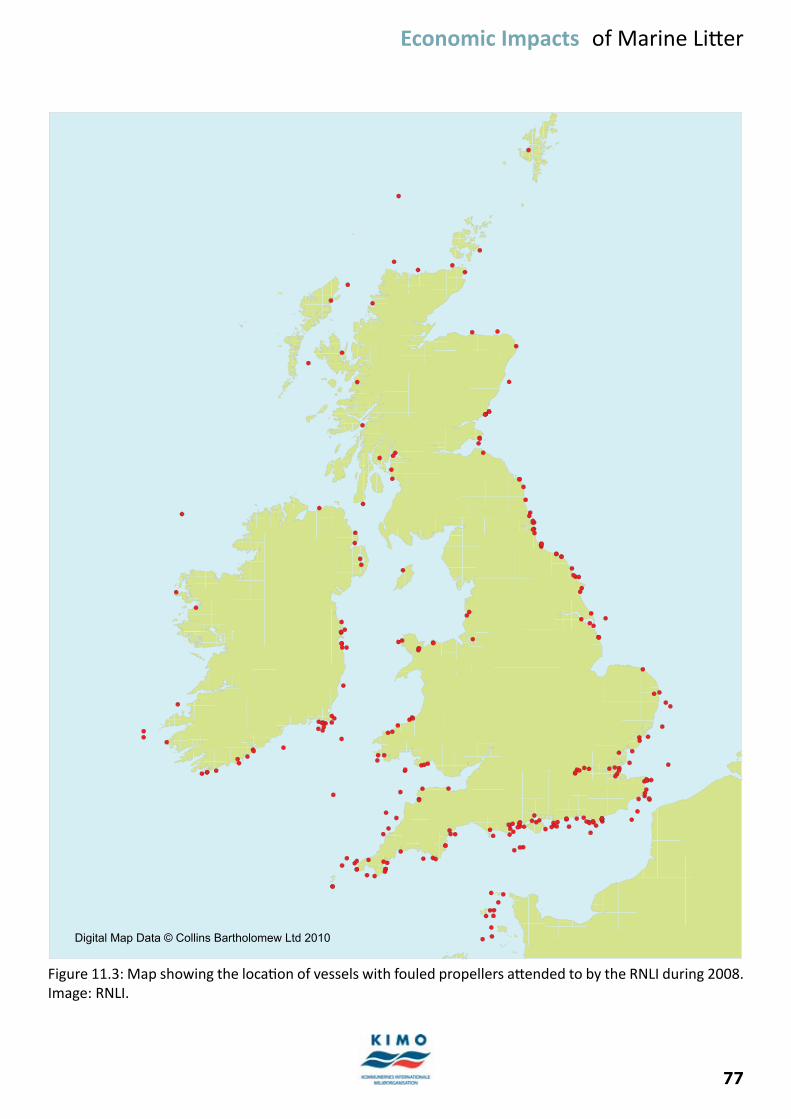
77
Economic Impacts of Marine Litt er
Digital Map Data © Collins Bartholomew Ltd 2010
Figure 11.3: Map showing the locati on of vessels with fouled propellers att ended to by the RNLI during 2008. Image: RNLI.
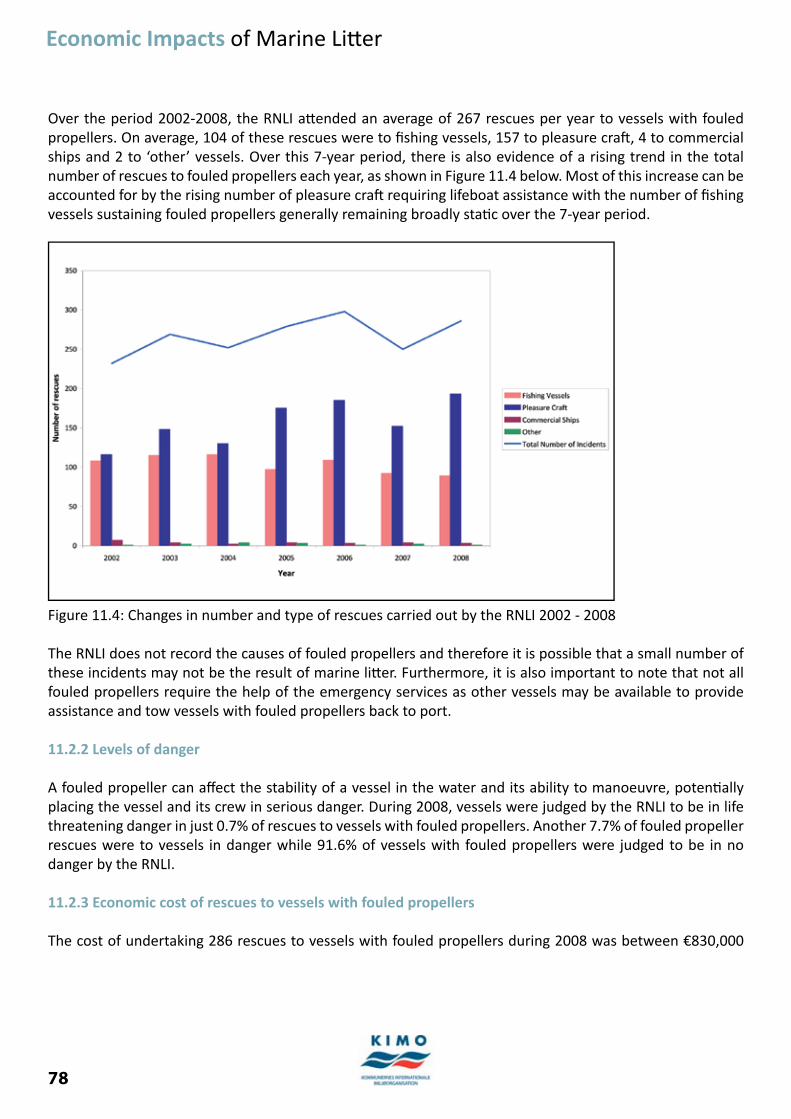
78
Economic Impacts of Marine Litt er
Over the period 2002-2008, the RNLI att ended an average of 267 rescues per year to vessels with fouled propellers. On average, 104 of these rescues were to fi shing vessels, 157 to pleasure craft , 4 to commercial ships and 2 to ‘other’ vessels. Over this 7-year period, there is also evidence of a rising trend in the total number of rescues to fouled propellers each year, as shown in Figure 11.4 below. Most of this increase can be accounted for by the rising number of pleasure craft requiring lifeboat assistance with the number of fi shing vessels sustaining fouled propellers generally remaining broadly stati c over the 7-year period.
Figure 11.4: Changes in number and type of rescues carried out by the RNLI 2002 - 2008
The RNLI does not record the causes of fouled propellers and therefore it is possible that a small number of these incidents may not be the result of marine litt er. Furthermore, it is also important to note that not all fouled propellers require the help of the emergency services as other vessels may be available to provide assistance and tow vessels with fouled propellers back to port.
11.2.2 Levels of danger
A fouled propeller can aff ect the stability of a vessel in the water and its ability to manoeuvre, potenti ally placing the vessel and its crew in serious danger. During 2008, vessels were judged by the RNLI to be in life threatening danger in just 0.7% of rescues to vessels with fouled propellers. Another 7.7% of fouled propeller rescues were to vessels in danger while 91.6% of vessels with fouled propellers were judged to be in no danger by the RNLI.
11.2.3 Economic cost of rescues to vessels with fouled propellers
The cost of undertaking 286 rescues to vessels with fouled propellers during 2008 was between €830,000
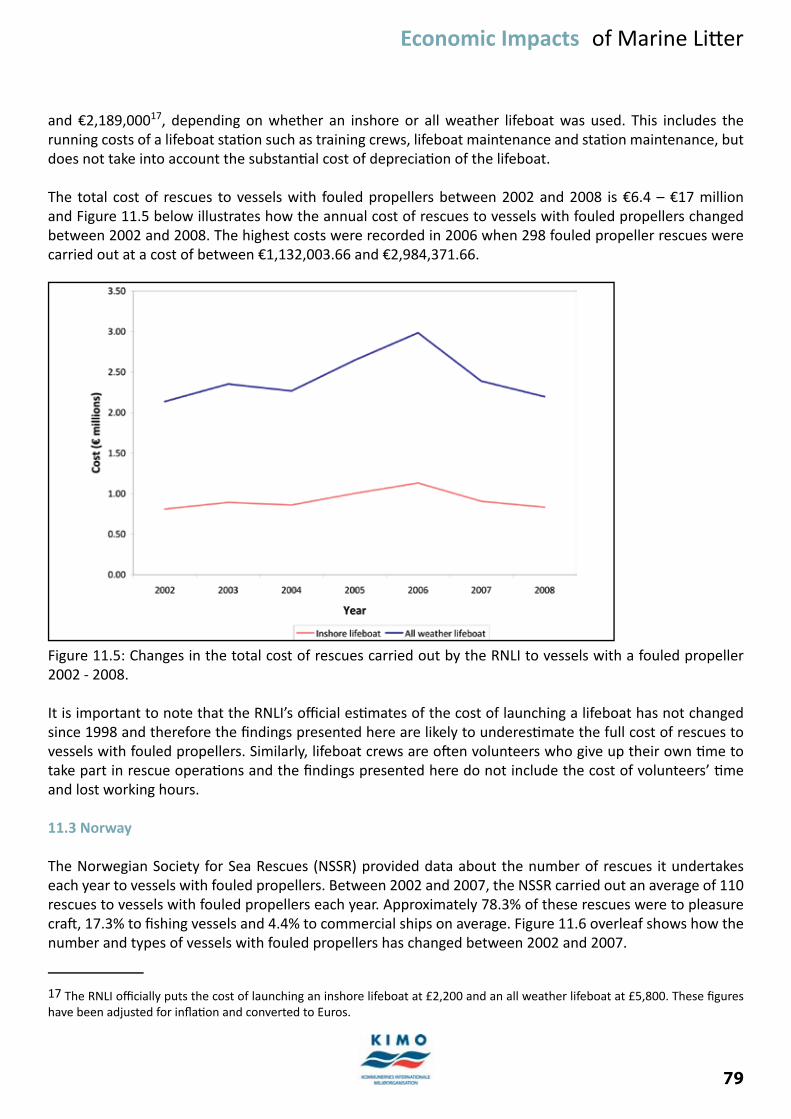
79
Economic Impacts of Marine Litt er
and €2,189,00017, depending on whether an inshore or all weather lifeboat was used. This includes the running costs of a lifeboat stati on such as training crews, lifeboat maintenance and stati on maintenance, but does not take into account the substanti al cost of depreciati on of the lifeboat.
The total cost of rescues to vessels with fouled propellers between 2002 and 2008 is €6.4 – €17 million and Figure 11.5 below illustrates how the annual cost of rescues to vessels with fouled propellers changed between 2002 and 2008. The highest costs were recorded in 2006 when 298 fouled propeller rescues were carried out at a cost of between €1,132,003.66 and €2,984,371.66.
Figure 11.5: Changes in the total cost of rescues carried out by the RNLI to vessels with a fouled propeller 2002 - 2008.
It is important to note that the RNLI’s offi cial esti mates of the cost of launching a lifeboat has not changed since 1998 and therefore the fi ndings presented here are likely to underesti mate the full cost of rescues to vessels with fouled propellers. Similarly, lifeboat crews are oft en volunteers who give up their own ti me to take part in rescue operati ons and the fi ndings presented here do not include the cost of volunteers’ ti me and lost working hours.
11.3 Norway
The Norwegian Society for Sea Rescues (NSSR) provided data about the number of rescues it undertakes each year to vessels with fouled propellers. Between 2002 and 2007, the NSSR carried out an average of 110 rescues to vessels with fouled propellers each year. Approximately 78.3% of these rescues were to pleasure craft , 17.3% to fi shing vessels and 4.4% to commercial ships on average. Figure 11.6 overleaf shows how the number and types of vessels with fouled propellers has changed between 2002 and 2007.
17 The RNLI offi cially puts the cost of launching an inshore lifeboat at £2,200 and an all weather lifeboat at £5,800. These fi gures have been adjusted for infl ati on and converted to Euros.
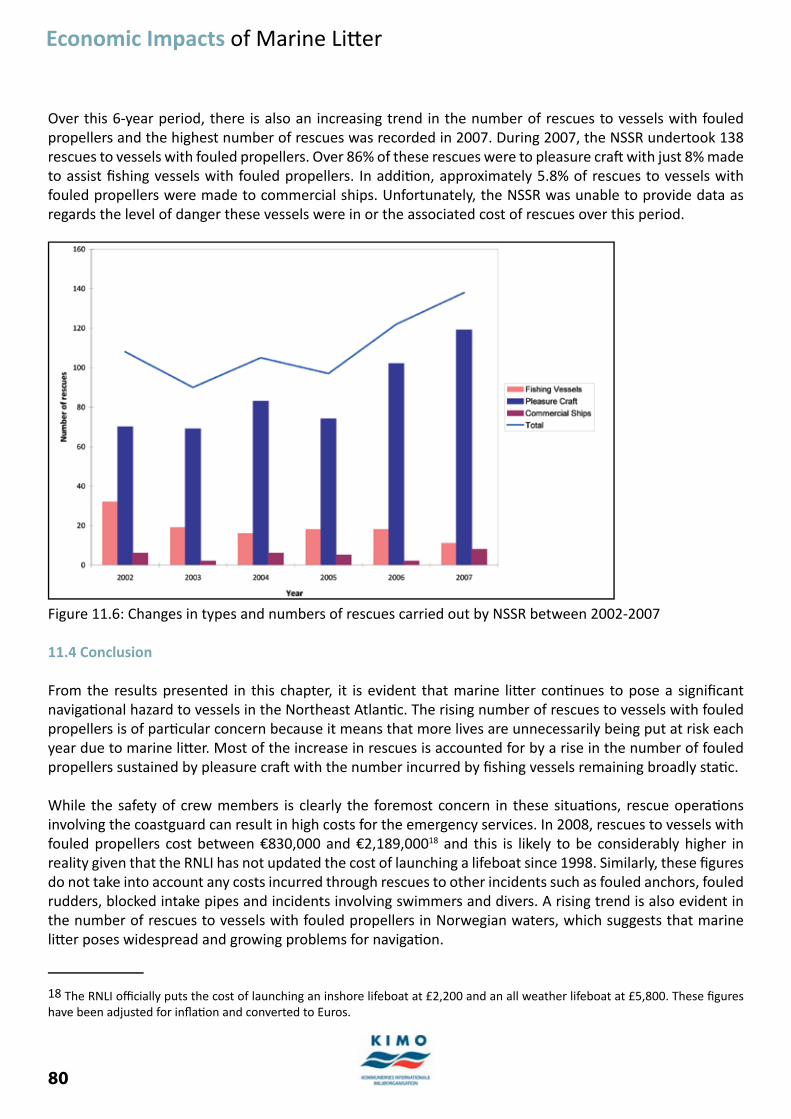
80
Economic Impacts of Marine Litt er
Over this 6-year period, there is also an increasing trend in the number of rescues to vessels with fouled propellers and the highest number of rescues was recorded in 2007. During 2007, the NSSR undertook 138 rescues to vessels with fouled propellers. Over 86% of these rescues were to pleasure craft with just 8% made to assist fi shing vessels with fouled propellers. In additi on, approximately 5.8% of rescues to vessels with fouled propellers were made to commercial ships. Unfortunately, the NSSR was unable to provide data as regards the level of danger these vessels were in or the associated cost of rescues over this period.
Figure 11.6: Changes in types and numbers of rescues carried out by NSSR between 2002-2007
11.4 Conclusion
From the results presented in this chapter, it is evident that marine litt er conti nues to pose a signifi cant navigati onal hazard to vessels in the Northeast Atlanti c. The rising number of rescues to vessels with fouled propellers is of parti cular concern because it means that more lives are unnecessarily being put at risk each year due to marine litt er. Most of the increase in rescues is accounted for by a rise in the number of fouled propellers sustained by pleasure craft with the number incurred by fi shing vessels remaining broadly stati c.
While the safety of crew members is clearly the foremost concern in these situati ons, rescue operati ons involving the coastguard can result in high costs for the emergency services. In 2008, rescues to vessels with fouled propellers cost between €830,000 and €2,189,00018 and this is likely to be considerably higher in reality given that the RNLI has not updated the cost of launching a lifeboat since 1998. Similarly, these fi gures do not take into account any costs incurred through rescues to other incidents such as fouled anchors, fouled rudders, blocked intake pipes and incidents involving swimmers and divers. A rising trend is also evident in the number of rescues to vessels with fouled propellers in Norwegian waters, which suggests that marine litt er poses widespread and growing problems for navigati on.
18 The RNLI offi cially puts the cost of launching an inshore lifeboat at £2,200 and an all weather lifeboat at £5,800. These fi gures have been adjusted for infl ati on and converted to Euros.
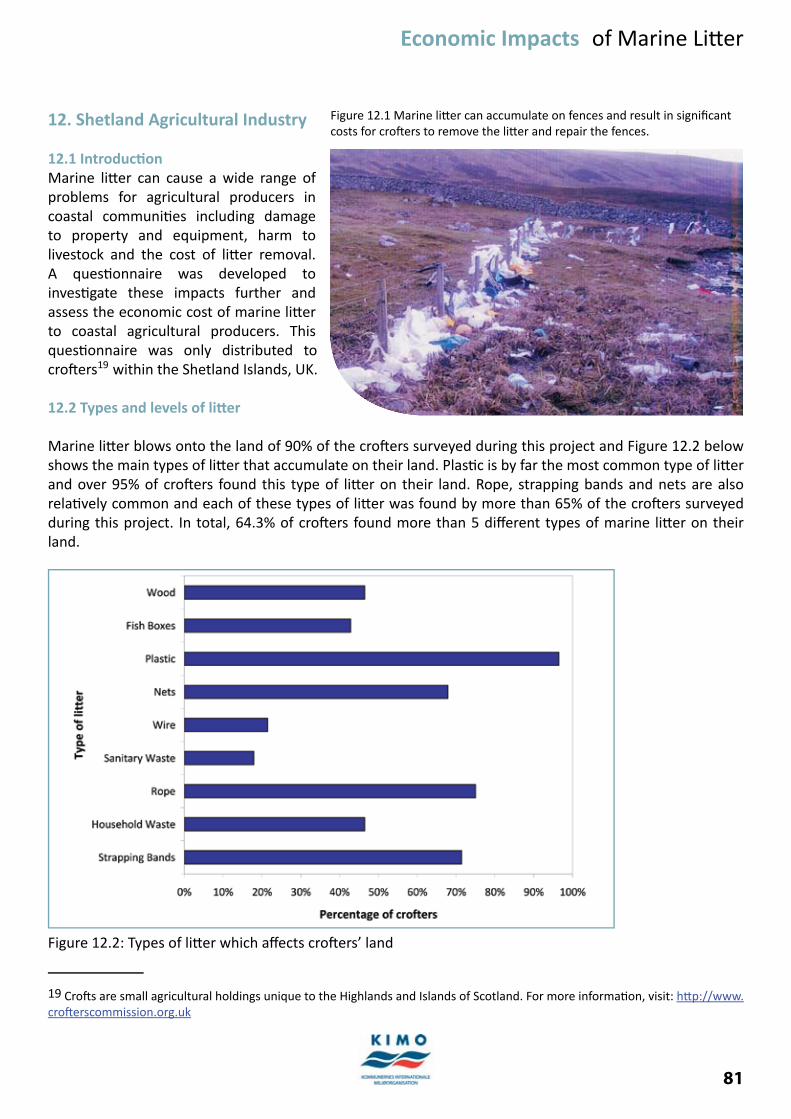
81
Economic Impacts of Marine Litt er
12. Shetland Agricultural Industry
12.1 Introducti onMarine litt er can cause a wide range of problems for agricultural producers in coastal communiti es including damage to property and equipment, harm to livestock and the cost of litt er removal. A questi onnaire was developed to investi gate these impacts further and assess the economic cost of marine litt er to coastal agricultural producers. This questi onnaire was only distributed to croft ers19 within the Shetland Islands, UK.
12.2 Types and levels of litt er
Marine litt er blows onto the land of 90% of the croft ers surveyed during this project and Figure 12.2 below shows the main types of litt er that accumulate on their land. Plasti c is by far the most common type of litt er and over 95% of croft ers found this type of litt er on their land. Rope, strapping bands and nets are also relati vely common and each of these types of litt er was found by more than 65% of the croft ers surveyed during this project. In total, 64.3% of croft ers found more than 5 diff erent types of marine litt er on their land.
Figure 12.2: Types of litt er which aff ects croft ers’ land
19 Croft s are small agricultural holdings unique to the Highlands and Islands of Scotland. For more informati on, visit: htt p://www.croft erscommission.org.uk
Figure 12.1 Marine litt er can accumulate on fences and result in signifi cant costs for croft ers to remove the litt er and repair the fences.
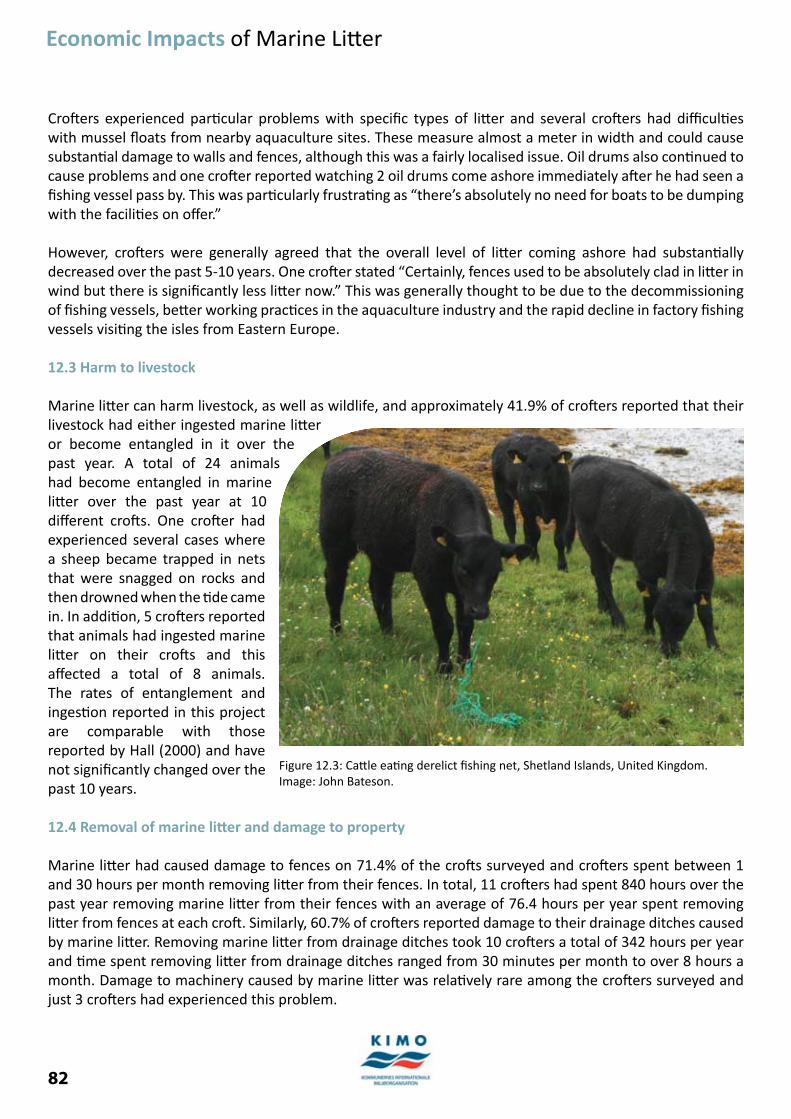
82
Economic Impacts of Marine Litt er
Croft ers experienced parti cular problems with specifi c types of litt er and several croft ers had diffi culti es with mussel fl oats from nearby aquaculture sites. These measure almost a meter in width and could cause substanti al damage to walls and fences, although this was a fairly localised issue. Oil drums also conti nued to cause problems and one croft er reported watching 2 oil drums come ashore immediately aft er he had seen a fi shing vessel pass by. This was parti cularly frustrati ng as “there’s absolutely no need for boats to be dumping with the faciliti es on off er.”
However, croft ers were generally agreed that the overall level of litt er coming ashore had substanti ally decreased over the past 5-10 years. One croft er stated “Certainly, fences used to be absolutely clad in litt er in wind but there is signifi cantly less litt er now.” This was generally thought to be due to the decommissioning of fi shing vessels, bett er working practi ces in the aquaculture industry and the rapid decline in factory fi shing vessels visiti ng the isles from Eastern Europe.
12.3 Harm to livestock
Marine litt er can harm livestock, as well as wildlife, and approximately 41.9% of croft ers reported that their livestock had either ingested marine litt er or become entangled in it over the past year. A total of 24 animals had become entangled in marine litt er over the past year at 10 diff erent croft s. One croft er had experienced several cases where a sheep became trapped in nets that were snagged on rocks and then drowned when the ti de came in. In additi on, 5 croft ers reported that animals had ingested marine litt er on their croft s and this aff ected a total of 8 animals. The rates of entanglement and ingesti on reported in this project are comparable with those reported by Hall (2000) and have not signifi cantly changed over the past 10 years.
12.4 Removal of marine litt er and damage to property
Marine litt er had caused damage to fences on 71.4% of the croft s surveyed and croft ers spent between 1 and 30 hours per month removing litt er from their fences. In total, 11 croft ers had spent 840 hours over the past year removing marine litt er from their fences with an average of 76.4 hours per year spent removing litt er from fences at each croft . Similarly, 60.7% of croft ers reported damage to their drainage ditches caused by marine litt er. Removing marine litt er from drainage ditches took 10 croft ers a total of 342 hours per year and ti me spent removing litt er from drainage ditches ranged from 30 minutes per month to over 8 hours a month. Damage to machinery caused by marine litt er was relati vely rare among the croft ers surveyed and just 3 croft ers had experienced this problem.
Figure 12.3: Catt le eati ng derelict fi shing net, Shetland Islands, United Kingdom. Image: John Bateson.
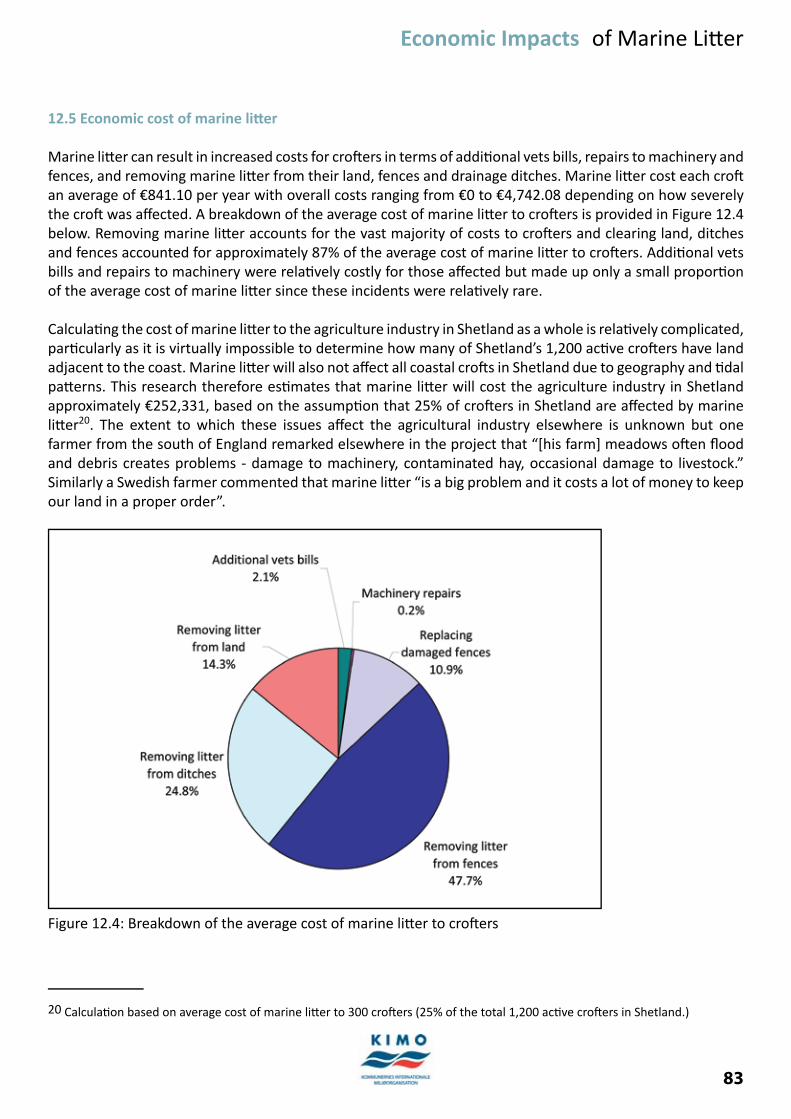
83
Economic Impacts of Marine Litt er
12.5 Economic cost of marine litt er
Marine litt er can result in increased costs for croft ers in terms of additi onal vets bills, repairs to machinery and fences, and removing marine litt er from their land, fences and drainage ditches. Marine litt er cost each croft an average of €841.10 per year with overall costs ranging from €0 to €4,742.08 depending on how severely the croft was aff ected. A breakdown of the average cost of marine litt er to croft ers is provided in Figure 12.4 below. Removing marine litt er accounts for the vast majority of costs to croft ers and clearing land, ditches and fences accounted for approximately 87% of the average cost of marine litt er to croft ers. Additi onal vets bills and repairs to machinery were relati vely costly for those aff ected but made up only a small proporti on of the average cost of marine litt er since these incidents were relati vely rare.
Calculati ng the cost of marine litt er to the agriculture industry in Shetland as a whole is relati vely complicated, parti cularly as it is virtually impossible to determine how many of Shetland’s 1,200 acti ve croft ers have land adjacent to the coast. Marine litt er will also not aff ect all coastal croft s in Shetland due to geography and ti dal patt erns. This research therefore esti mates that marine litt er will cost the agriculture industry in Shetland approximately €252,331, based on the assumpti on that 25% of croft ers in Shetland are aff ected by marine litt er20. The extent to which these issues aff ect the agricultural industry elsewhere is unknown but one farmer from the south of England remarked elsewhere in the project that “[his farm] meadows oft en fl ood and debris creates problems - damage to machinery, contaminated hay, occasional damage to livestock.” Similarly a Swedish farmer commented that marine litt er “is a big problem and it costs a lot of money to keep our land in a proper order”.
Figure 12.4: Breakdown of the average cost of marine litt er to croft ers
20 Calculati on based on average cost of marine litt er to 300 croft ers (25% of the total 1,200 acti ve croft ers in Shetland.)
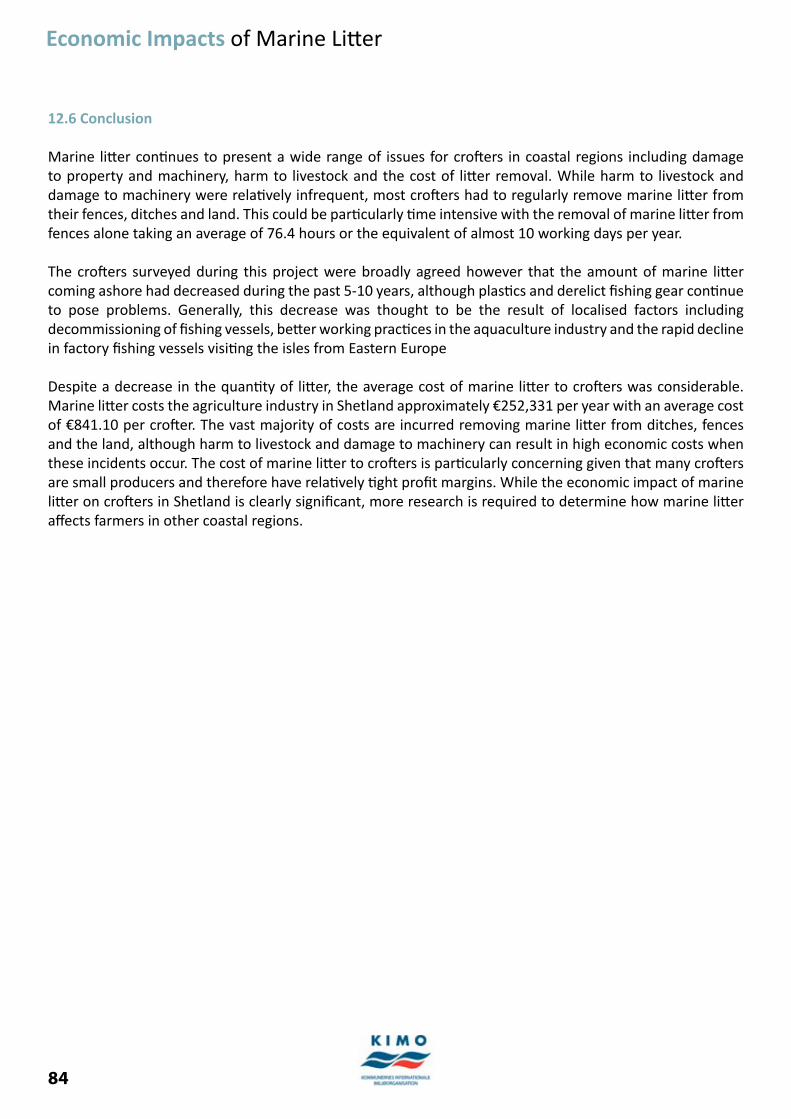
84
Economic Impacts of Marine Litt er
12.6 Conclusion
Marine litt er conti nues to present a wide range of issues for croft ers in coastal regions including damage to property and machinery, harm to livestock and the cost of litt er removal. While harm to livestock and damage to machinery were relati vely infrequent, most croft ers had to regularly remove marine litt er from their fences, ditches and land. This could be parti cularly ti me intensive with the removal of marine litt er from fences alone taking an average of 76.4 hours or the equivalent of almost 10 working days per year.
The croft ers surveyed during this project were broadly agreed however that the amount of marine litt er coming ashore had decreased during the past 5-10 years, although plasti cs and derelict fi shing gear conti nue to pose problems. Generally, this decrease was thought to be the result of localised factors including decommissioning of fi shing vessels, bett er working practi ces in the aquaculture industry and the rapid decline in factory fi shing vessels visiti ng the isles from Eastern Europe
Despite a decrease in the quanti ty of litt er, the average cost of marine litt er to croft ers was considerable. Marine litt er costs the agriculture industry in Shetland approximately €252,331 per year with an average cost of €841.10 per croft er. The vast majority of costs are incurred removing marine litt er from ditches, fences and the land, although harm to livestock and damage to machinery can result in high economic costs when these incidents occur. The cost of marine litt er to croft ers is parti cularly concerning given that many croft ers are small producers and therefore have relati vely ti ght profi t margins. While the economic impact of marine litt er on croft ers in Shetland is clearly signifi cant, more research is required to determine how marine litt er aff ects farmers in other coastal regions.
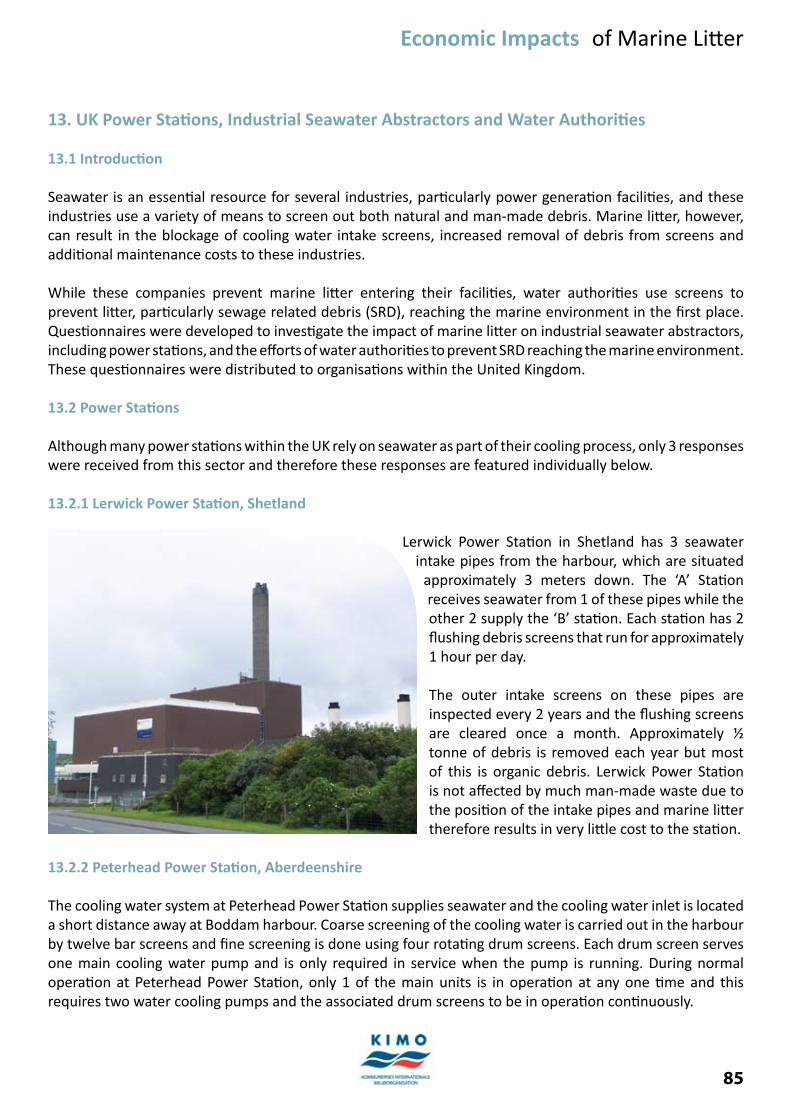
85
Economic Impacts of Marine Litt er
13. UK Power Stati ons, Industrial Seawater Abstractors and Water Authoriti es
13.1 Introducti on
Seawater is an essenti al resource for several industries, parti cularly power generati on faciliti es, and these industries use a variety of means to screen out both natural and man-made debris. Marine litt er, however, can result in the blockage of cooling water intake screens, increased removal of debris from screens and additi onal maintenance costs to these industries.
While these companies prevent marine litt er entering their faciliti es, water authoriti es use screens to prevent litt er, parti cularly sewage related debris (SRD), reaching the marine environment in the fi rst place. Questi onnaires were developed to investi gate the impact of marine litt er on industrial seawater abstractors, including power stati ons, and the eff orts of water authoriti es to prevent SRD reaching the marine environment. These questi onnaires were distributed to organisati ons within the United Kingdom.
13.2 Power Stati ons
Although many power stati ons within the UK rely on seawater as part of their cooling process, only 3 responses were received from this sector and therefore these responses are featured individually below.
13.2.1 Lerwick Power Stati on, Shetland
Lerwick Power Stati on in Shetland has 3 seawater intake pipes from the harbour, which are situated
approximately 3 meters down. The ‘A’ Stati on receives seawater from 1 of these pipes while the other 2 supply the ‘B’ stati on. Each stati on has 2 fl ushing debris screens that run for approximately 1 hour per day.
The outer intake screens on these pipes are inspected every 2 years and the fl ushing screens are cleared once a month. Approximately ½ tonne of debris is removed each year but most of this is organic debris. Lerwick Power Stati on is not aff ected by much man-made waste due to the positi on of the intake pipes and marine litt er therefore results in very litt le cost to the stati on.
13.2.2 Peterhead Power Stati on, Aberdeenshire
The cooling water system at Peterhead Power Stati on supplies seawater and the cooling water inlet is located a short distance away at Boddam harbour. Coarse screening of the cooling water is carried out in the harbour by twelve bar screens and fi ne screening is done using four rotati ng drum screens. Each drum screen serves one main cooling water pump and is only required in service when the pump is running. During normal operati on at Peterhead Power Stati on, only 1 of the main units is in operati on at any one ti me and this requires two water cooling pumps and the associated drum screens to be in operati on conti nuously.
86
Economic Impacts of Marine Litt er
The coarse screens at Boddam harbour are cleaned approximately 3 ti mes a year. Debris collected from the cooling water using the rotati ng drum screens is washed into 2 trash pits via rubbish gullies and regular visual inspecti ons are carried out to assess the need to empty the trash pits. During the fi rst 9 months of 2009, a total of 24.78 tonnes of debris was collected using the intake screens at Peterhead Power Stati on. Approximately 5% of this waste is marine litt er and the rest is organic debris, although it is very diffi cult to determine the quanti ty of waste that comes from human acti viti es.
The cost of cleaning the screens and disposing of the waste removed is € 16,516.09 per year. Marine litt er therefore costs the power stati on approximately € 825.8021 per year but a reducti on in marine litt er is unlikely to result in any signifi cant cost savings since the stati on would sti ll have to remove organic debris.
13.2.3 Magnox North, Wylfa Site, Anglesey
At Wylfa, there are 4 48’ diameter drum screens and each of these serves a cooling water pump. These screens are in service 24 hours a day and are used to screen out seaweed, fi sh, shells and fl oati ng debris. The clearance of the drum screens is very dependent on the prevailing weather conditi ons with a combinati on of north or northwesterly winds, low water and an incoming ti de resulti ng in the highest quanti ti es of debris.
Under normal operati ng conditi ons, the daily volume of debris is generally small and amounts to approximately 1 cubic metre per drum screen. In extreme situati ons, there could be stati on personnel clearing debris from the drum screens conti nuously for up to 24 hours. Marine litt er, such as plasti c bott les and carrier bags, accounts for up to 1% of the debris removed using screens and organic debris, parti cularly seaweed, presents the most problems for Wylfa.
13.3 Industrial seawater abstractors
While many industrial seawater abstractors experience similar issues with marine litt er to power stati ons, the response rate was similarly low and 7 organisati ons completed the questi onnaire in total.
13.3.1 Problems with marine litt er
The companies surveyed during this project used seawater for a variety of functi ons including:
Flushing sewerage faciliti es• Suppression of dust at a coal terminal• Cooling purposes• To feed a salt-water fi re main•
Each company was asked to rate the extent to which marine litt er posed problems for their company. In total, 4 respondents stated that marine litt er posed no problems for their company and the remaining 3 identi fi ed marine litt er as an “occasional problem”.
13.3.2 Debris screening and removal
Most of the companies surveyed during this project used screens to remove marine debris and these screens
21 Calculated using the total cost of clearing debris from intake screens and the percentage of debris collected that is man-made.

87
Economic Impacts of Marine Litt er
needed cleansing on variable frequencies depending on the build up of litt er. The level of debris experienced by some companies meant they had to clean intake screens every week while others only needed to clean screens once a year. The amount of debris removed using these screens was generally small and ranged from 3 cubic metres to several large trailer loads a year.
Determining what percentage of the debris removed using these screens was marine litt er was diffi cult but companies esti mated that between 40 – 90% of the debris removed was man-made. Only 1 company was able to provide data about how much marine litt er cost to remove and this amounted to approximately € 132.1322. These costs would be unlikely to decrease in the event that less marine litt er accumulated on screens since cleansing operati ons would sti ll be necessary to deal with organic debris.
13.4 Water authoriti es
Questi onnaires were distributed to all water authoriti es in the UK with responsibility for water and sewerage services in coastal areas in order to investi gate their eff orts to prevent marine litt er.
13.4.1 Scotti sh Water
Scotti sh Water provides water and waste water services to over 2.4million households across an area of 79,000 square kilometres. During 2008/2009, Scotti sh water removed a total of 11,345 tonnes of grit and solid items using its screens. Unfortunately, it is not possible to determine what proporti on of these screenings was SRD.
In additi on, approximately 6.7% of domesti c dwellings in Scotland are not connected to the public sewerage system. Scotti sh Water has parti cipated in the nati onal ‘Bag It and Bin It’ campaign, which aims to protect the UK’s beaches, rivers and canals from SRD.
13.4.2 South West Water Ltd
South West Water Ltd. (SWW) is the water and sewerage services provider for Devon, Cornwall and small parts of Dorset and Somerset. Although the smallest of the water and sewerage companies in England and Wales, it has 33% of the countries’ designated bathing beaches within its area. During 2009, 4,023 tonnes of debris were removed using screens but this includes all material removed from sewerage treatment works and combined sewer overfl ows (CSO’s) and therefore not all of this will be SRD.
Since privati sati on of the water industry in 1989, SWW has invested €2.26 billion in its Clean Sweep programme to improve bathing waters around its coast. This has included the removal of 250 crude sewage outf alls that previously existed and were inherited by the company during privati sati on. Over the last 10 years, SWW has also invested €84.6 million in improving the quality of discharges from CSO’s throughout the region. South West Water also point out that “much of what is described as sewage related debris may not have come from sewers at all but actually have been discarded on the beach (e.g. condoms, sanitary items) or off shore via shipping and pleasure craft for example.”
South West Water acti vely promotes the responsible use of sewers and is part of the Sewer Network Abuse Preventi on (SNAP) group, which is concerned with inappropriate discharges into sewers. The company has
22 Calculated using the total cost of clearing debris from intake screens and the percentage of debris collected that is man-made.
88
Economic Impacts of Marine Litt er
also produced a number of leafl ets and posters over the past few years to highlight various issues such as ‘The Dirty Dozen’, targeti ng the 12 most common causes of sewer blockages. South West Water has also parti cipated in the ‘Bin It Don’t Flush it’ campaign and operates a customer caravan at numerous shows and events throughout the year to draw att enti on to the problems caused by inappropriate discharges.
13.5 Conclusion
Marine litt er can result in multi ple issues for seawater abstractors including the blockage of cooling water intake screens, increased removal of debris from screens and additi onal maintenance costs to these industries. From the examples provided in this chapter, it appears that the impact of marine litt er on seawater abstractors, including power stati ons, can be quite variable but generally tends to occur at a relati vely low level. Unfortunately, it is very diffi cult to determine the economic cost of marine litt er to these companies, as most do not record this kind of informati on.
Water authoriti es play a key role in preventi ng SRD reaching the marine environment and the examples in this project demonstrate the diverse measures and initi ati ves water authoriti es use to promote responsible use of sewage faciliti es and reduce the amount of SRD entering the sewage system.
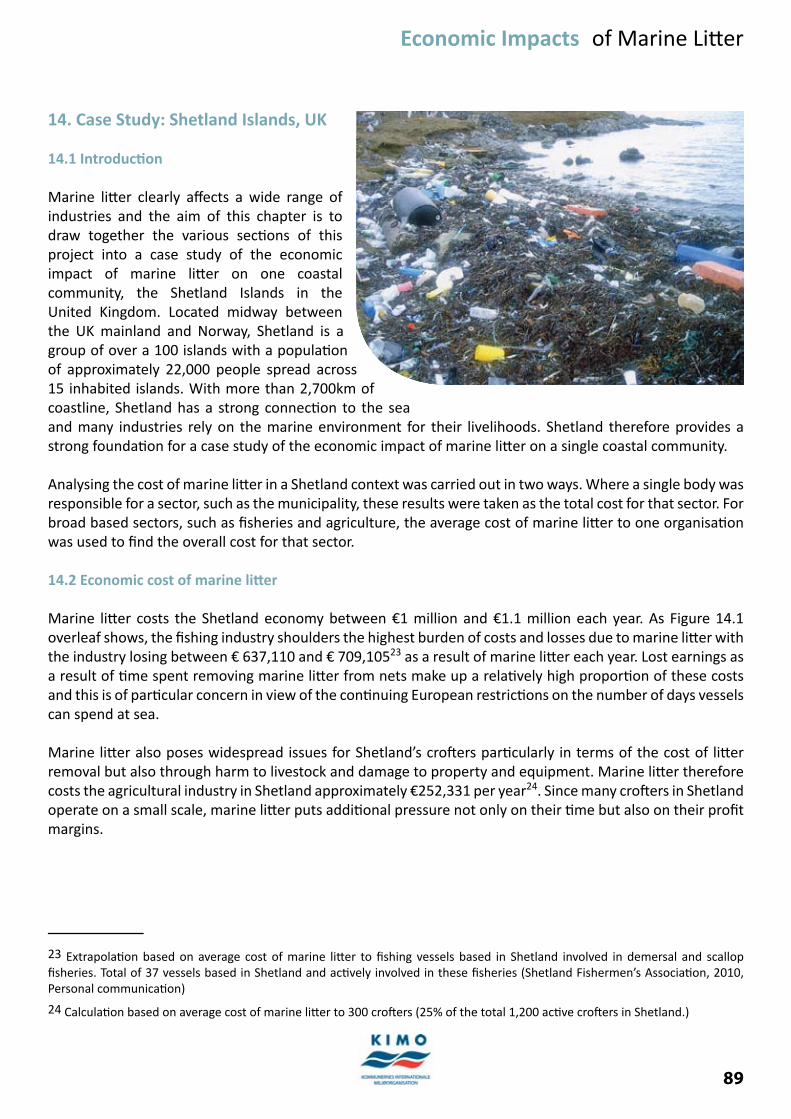
89
Economic Impacts of Marine Litt er
14. Case Study: Shetland Islands, UK
14.1 Introducti on
Marine litt er clearly aff ects a wide range of industries and the aim of this chapter is to draw together the various secti ons of this project into a case study of the economic impact of marine litt er on one coastal community, the Shetland Islands in the United Kingdom. Located midway between the UK mainland and Norway, Shetland is a group of over a 100 islands with a populati on of approximately 22,000 people spread across 15 inhabited islands. With more than 2,700km of coastline, Shetland has a strong connecti on to the sea and many industries rely on the marine environment for their livelihoods. Shetland therefore provides a strong foundati on for a case study of the economic impact of marine litt er on a single coastal community.
Analysing the cost of marine litt er in a Shetland context was carried out in two ways. Where a single body was responsible for a sector, such as the municipality, these results were taken as the total cost for that sector. For broad based sectors, such as fi sheries and agriculture, the average cost of marine litt er to one organisati on was used to fi nd the overall cost for that sector.
14.2 Economic cost of marine litt er
Marine litt er costs the Shetland economy between €1 million and €1.1 million each year. As Figure 14.1 overleaf shows, the fi shing industry shoulders the highest burden of costs and losses due to marine litt er with the industry losing between € 637,110 and € 709,10523 as a result of marine litt er each year. Lost earnings as a result of ti me spent removing marine litt er from nets make up a relati vely high proporti on of these costs and this is of parti cular concern in view of the conti nuing European restricti ons on the number of days vessels can spend at sea.
Marine litt er also poses widespread issues for Shetland’s croft ers parti cularly in terms of the cost of litt er removal but also through harm to livestock and damage to property and equipment. Marine litt er therefore costs the agricultural industry in Shetland approximately €252,331 per year24. Since many croft ers in Shetland operate on a small scale, marine litt er puts additi onal pressure not only on their ti me but also on their profi t margins.
23 Extrapolati on based on average cost of marine litt er to fi shing vessels based in Shetland involved in demersal and scallop fi sheries. Total of 37 vessels based in Shetland and acti vely involved in these fi sheries (Shetland Fishermen’s Associati on, 2010, Personal communicati on)
24 Calculati on based on average cost of marine litt er to 300 croft ers (25% of the total 1,200 acti ve croft ers in Shetland.)

90
Economic Impacts of Marine Litt er
Figure 14.1: Shetland’s Marine Litt er Bill.
Shetland takes an acti ve response to marine litt er in the form of the annual Voar Redd Up25 where volunteers remove litt er that has collected on beaches and roadsides during the year. As the largest community clean up event in Scotland, Da Voar Redd Up has removed well over 1,000 tonnes of litt er and has won numerous awards including the United Nati ons Dubai Internati onal Award for Best Practi ce to Improve the Living Environment.
During the 2009 Redd Up, volunteers spent over 8,250 hours removing a total of 65 tonnes of marine litt er from around Shetland. In 2009, Da Voar Redd Up cost approximately € 53,819 to run based on the value of volunteers’ ti me and a small donati on from BP towards operati onal costs. This fi gure is likely to underesti mate the total cost of the Redd Up, however, as it does not include the contributi on of the Shetland Amenity Trust, who organise the event, or the cost of disposing of the litt er collected, which is generally covered by Shetland Islands Council.
Relati vely low costs were experienced by the Shetland aquaculture industry, which accounted for just 1.2% of the total cost of marine litt er to Shetland, as shown in Figure 14.2 overleaf. Similarly, the rescue services experienced relati vely low costs since the coastguard att ended just 1 vessel with a fouled propeller during 2008. The Lerwick Power Stati on reported very few problems with marine litt er and therefore incurred zero costs as a result. It was unfortunately not possible to meaningfully calculate the economic cost of marine litt er to either the tourism industry or marinas within Shetland.
25 Da Voar Redd Up means “the spring clean” in Shetland dialect.

91
Economic Impacts of Marine Litt er
Figure 14.2: Breakdown of the average annual cost of marine litt er to Shetland
14.3 Conclusion
Marine litt er costs the Shetland economy between €1 million and €1.1 million on average each year, based on the increased costs and losses aff ecti ng key industries that rely on the marine environment. As fi shing is one of the main industries in Shetland, it bears the brunt of these costs but this is likely to vary in other coastal communiti es where industries such as tourism may be more important and thus aff ected by marine litt er to a larger extent.
As marine litt er is a highly dynamic problem, it is inevitable that these costs will vary to some degree but it is important to recognise that the economic cost of marine litt er to Shetland is both signifi cant and enti rely unnecessary. Since Shetland represents only a single case study, these fi ndings also suggest that the total economic impact of marine litt er on coastal communiti es in the Northeast Atlanti c region could be extremely high.
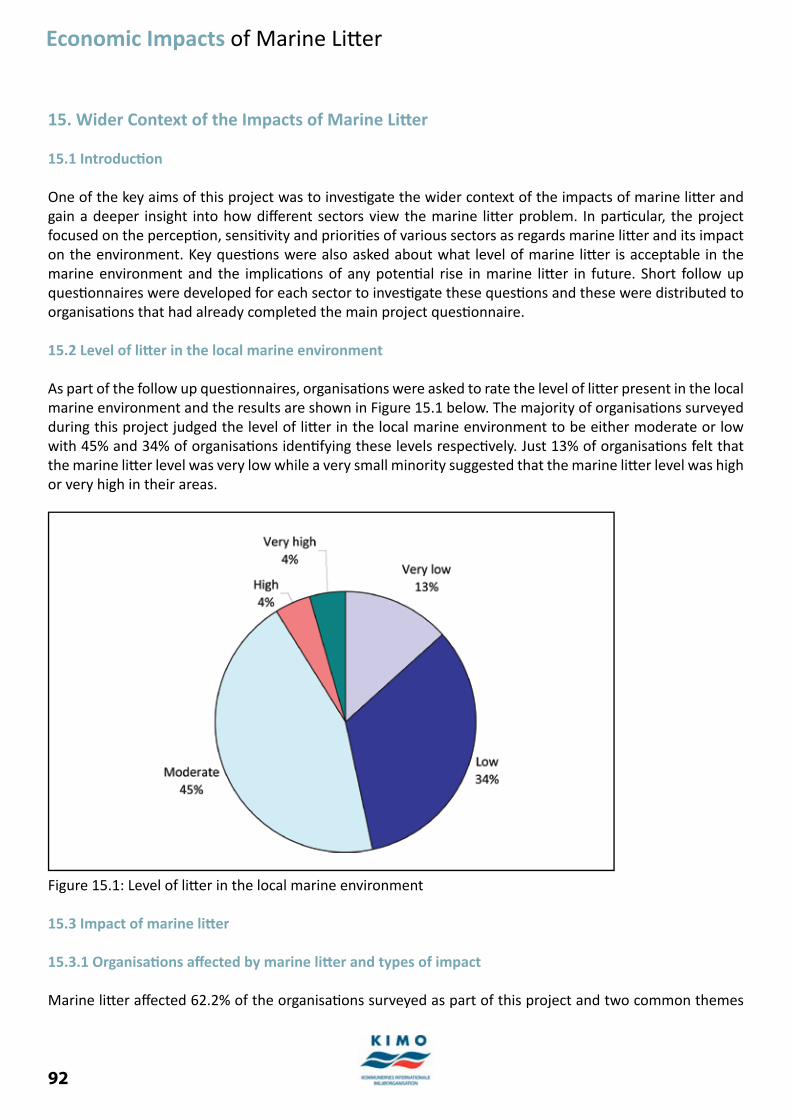
92
Economic Impacts of Marine Litt er
15. Wider Context of the Impacts of Marine Litt er
15.1 Introducti on
One of the key aims of this project was to investi gate the wider context of the impacts of marine litt er and gain a deeper insight into how diff erent sectors view the marine litt er problem. In parti cular, the project focused on the percepti on, sensiti vity and prioriti es of various sectors as regards marine litt er and its impact on the environment. Key questi ons were also asked about what level of marine litt er is acceptable in the marine environment and the implicati ons of any potenti al rise in marine litt er in future. Short follow up questi onnaires were developed for each sector to investi gate these questi ons and these were distributed to organisati ons that had already completed the main project questi onnaire.
15.2 Level of litt er in the local marine environment
As part of the follow up questi onnaires, organisati ons were asked to rate the level of litt er present in the local marine environment and the results are shown in Figure 15.1 below. The majority of organisati ons surveyed during this project judged the level of litt er in the local marine environment to be either moderate or low with 45% and 34% of organisati ons identi fying these levels respecti vely. Just 13% of organisati ons felt that the marine litt er level was very low while a very small minority suggested that the marine litt er level was high or very high in their areas.
Figure 15.1: Level of litt er in the local marine environment
15.3 Impact of marine litt er
15.3.1 Organisati ons aff ected by marine litt er and types of impact
Marine litt er aff ected 62.2% of the organisati ons surveyed as part of this project and two common themes
93
Economic Impacts of Marine Litt er
emerged in the ways these organisati ons are aff ected by marine litt er. For many organisati ons, this was a questi on of the increased resources and expenditure necessary to remove marine litt er and prevent it from having any further impacts upon their organisati on. Other organisati ons observed that the presence of marine litt er was already having an eff ect on their organisati on in terms of reduced trade, catch or visitor numbers. Several organisati ons also used a combinati on of both these reasons to describe how marine litt er had aff ected them. Examples of how organisati ons are aff ected by marine litt er include:
“Apart from visual impact and threat to environment, litt er collecti on is a manpower issue.” • (Harbour)“Providing fi nancial support and assistance to local community groups and organisati ons in beach • cleanup initi ati ves.” (Harbour)“Marine litt er can…result in wasted ti me and less catch. It could also spoil the catch if it were paint” • (Fishing vessel)“There has been fairly regular feedback to the council that the shorefront area in the town centre • would be bett er used if the amount of litt er was less” (Municipality)“Mainly aff ected by rope, netti ng, plasti c sheet, packing straps occasionally wrapping around longlines • and dropper ropes on mussel farm sites. These can chafe off rope droppers or at least take ti me to disentangle and create nuisance in disposal.” (Mussel farm)“Increases the maintenance of boats, rubbish aff ecti ng the propellers, fi lters etc. For this reason the • harbour launch removes rubbish build-up in the marina and this means extra work” (Marina)“Harbour staff has litt er retrieval/cleaning duti es built into their daily work routi nes thus aff ecti ng • other operati onal duti es. Negati ve impact on visitors/tourists. Environmental concerns in terms of damage to marine eco-systems. Damage caused to vessel propulsion systems. Direct/indirect costs to the Harbour when enforcing harbour byelaws on off enders – ti me/eff ort/money etc.” (Harbour) “The knock-on eff ect in the enjoyment of visitors, from tourists to local people, to the local beaches • could be aff ected. The designated bathing beaches and coast around the area have to be kept regularly cleaned by employed cleansing staff , which is increased from Easter to September each year.” (Municipality)
A key issue, parti cularly among municipaliti es, was that public expectati ons of beach cleanliness were increasing and becoming harder to meet. One municipality stated, “Members of the public have greater expectati ons and want the beach to be clean.” This could cause competi ti on between areas with another municipality concerned that “Residents and visitors have been discouraged from using the beaches because of litt er. When deciding which beaches to visit, tourists have chosen to go to other areas where the beaches are cleaner.”
Another municipality directly linked this to a potenti al reducti on in tourist revenue, stati ng, “Marine litt er generates negati ve comments locally and from visitors from outside the area. This can tarnish the reputati on of tourist desti nati ons and therefore contribute to economic loss.” This municipality was also parti cularly concerned about how to cost-eff ecti vely remove marine litt er and commented, “Some community groups do come forward to carry out voluntary collecti ons at ‘hotspots’, but this is not sustainable and cannot resolve the problems alone.”
Municipaliti es and harbours accounted for the majority of organisati ons surveyed during this stage of the project and there were notable diff erences between these two sectors in terms of how they were aff ected by marine litt er. Approximately 83.3% of harbours reported that they were aff ected by marine litt er, mainly because they either experienced additi onal costs for removing marine litt er or because the litt er in the
94
Economic Impacts of Marine Litt er
harbour was unsightly. In contrast, 68.4% of municipaliti es reported that marine litt er did not aff ect the level of beach use. Municipaliti es suggested that this was because appropriate litt er removal measures are in place to ensure beaches remain free of litt er and att racti ve to beach users.
15.3.2 Organisati ons not aff ected by marine litt er and reasons why
Approximately 37.8% of the organisati ons surveyed stated that they were not aff ected by marine litt er. One of the most common reasons given by organisati ons for this is that they had suffi cient litt er removal plans and measures in place to ensure that litt er did not have a knock on eff ect on their organisati on. As one organisati on stated, marine litt er has no impact because the organisati on has “a robust cleansing regime in place to keep on top of the debris coming ashore.” There is a valid argument, however, that these organisati ons are actually aff ected by marine litt er since they have adopted measures and allocated resources to deal with marine litt er. Many organisati ons that stated they were aff ected by marine litt er in fact used a broadly similar reason – increased workload, resources and expenditure required to remove marine litt er - to show how they were aff ected.
A number of other explanati ons were given by organisati ons for why they were not aff ected by marine litt er with several organisati ons stati ng that marine litt er had no impact on them for the simple reason that “there’s not much litt er” in their local area. For some municipaliti es, in parti cular, the level of litt er present on beaches was not enough to deter tourists and visitors with one stati ng, “we are in a high tourist area, and the level of marine litt er is not suffi cient to aff ect this”. In these cases, demand was so high that marine litt er had very litt le eff ect and “the public will come anyway”. Several municipaliti es also felt that there were “very few commercial interests [in their area] that could be aff ected” by marine litt er.
15.4 Importance of a clean and high quality marine and coastal environment
The organisati ons surveyed during this stage of the project were agreed that a clean and high quality marine and coastal environment was either ‘important’ or ‘very important’. While these groups clearly have a vested interest in ensuring the marine environment remains clean and litt er free, they nonetheless gave a wide variety of reasons as to why a clean and high quality marine and coastal environment was important. For many organisati ons, the local marine and coastal environment was key to the conti nued success of the tourist industry and the contributi on it made to the local economy. As one organisati on commented “it is the high quality marine environment that att racts the recreati onal visitors (sailors, walkers and more) which sustain the local economy”. Another suggested that “without signifi cant eff orts by the local authority in terms of beach cleansing, the tourism economy would be negati vely aff ected.”
Many organisati ons also felt that ensuring the marine environment remained clean and free of litt er was important to maintain their corporate reputati on and meet clients’ expectati ons. A clean marine environment was “indicati ve of good port stewardship” according to one harbour and this type of atti tude was generally shared by many organisati ons. One marina commented “We try to present a high quality marine environment for our customers, who are paying a high price for leaving their very expensive vessels here with me, under my care. The customers are also bringing a lot of money to the local economy and the last thing they wish to see is a large amount of litt er…that could potenti ally cause damage to their vessel.” Similarly, a shellfi sh producer was “reliant on [their] “clean” reputati on, and the reality of clean water for a healthy product”.
Another key theme among the responses was that a clean and high quality marine and coastal environment was important for the protecti on of ecosystems, wildlife and the environment in general. A municipality
95
Economic Impacts of Marine Litt er
summed this positi on up by stati ng that it was important to maintain a “safe, natural environment for people, animals and birds”. Several organisati ons also specifi cally linked this to a litt er free environment with one harbour stati ng “Having litt er in the environment is horrible – it is bad for the animals that are such a delight to watch and the general environment.” For some organisati ons, protecti ng the marine environment also had commercial benefi ts with one fi shing vessel stati ng “We need clean seas so that fi sh can reproduce in their natural habitat.”
Harbours and marinas placed parti cular emphasis on maintaining a clean marine environment in order to ensure vessel safety. Reasons such as “A litt ered marina could cause damage to boats” and “to avoid rope and nets from going into propellers and causing incidents that are avoidable” were common among responses from harbours and marinas. These organisati ons were concerned about damage both to visiti ng vessels and vessels used in the operati on of the harbour. One harbour, for instance, stated “we operate a fast craft and they are suscepti ble to damage by drawing in large pieces of refuse into the water jet intakes”.
15.5 Future sensiti vity to marine litt er
Looking to the future, organisati ons were asked what impact any increase in marine litt er level would have on their organisati on and responses ranged from no eff ect whatsoever to extremely negati ve impacts on organisati ons’ core acti viti es. For several organisati ons, an increase in marine litt er would have very litt le eff ect with one harbour stati ng an increase in marine litt er would have a “minimal eff ect, ships would sti ll come and go.” Generally, these organisati ons were also of the opinion that it would take a substanti al increase in litt er levels before any impact was felt. One municipality, for instance, commented that marine litt er “would have to dramati cally increase to directly aff ect beach usage.”
For many organisati ons, additi onal resources and expenditure would be required to prevent increased levels of litt er having a negati ve impact on their core acti viti es. Dealing with more marine litt er would increase costs at every stage of the removal process, from collecti on to disposal, and result in increased staffi ng pressures to cope with the additi onal workload. One harbour, for example, commented that increased levels of marine litt er “would require more ti me spent by harbour staff in cleaning up, leading to less ti me for other operati ons such as structure maintenance etc.”
There were also concerns that increased levels of litt er “would have increased costs not only in beach cleaning but in potenti al liti gati on and increased liability.” This could have signifi cant fi nancial implicati ons for organisati ons, such as municipaliti es, which have a statutory duty to ensure the environment remains clean and free of litt er. In this respect, organisati ons were also concerned about the possibility of higher insurance premiums as a result of increased levels of marine litt er.
Several organisati ons had deep reservati ons, however, about their ability to meet increased costs resulti ng from higher levels of marine litt er. These organisati ons would fi nd it diffi cult to locate the necessary resources, staff and budgets to deal with an increase in marine litt er and therefore they would be unable to prevent marine litt er from building up and aff ecti ng their core business. As one municipality stated, “With reducing budgets to provide clearance teams, any increase in litt er would have an impact on the local tourist industry.” For some organisati ons, current marine litt er levels are already challenging to deal with and one harbour commented that “it is impossible with current labour levels to remove it and some areas remain unkempt.”
Approximately half the organisati ons surveyed during this stage of the project reported that any increase in marine litt er levels in future would have a negati ve impact on their core acti viti es, including tourist numbers,
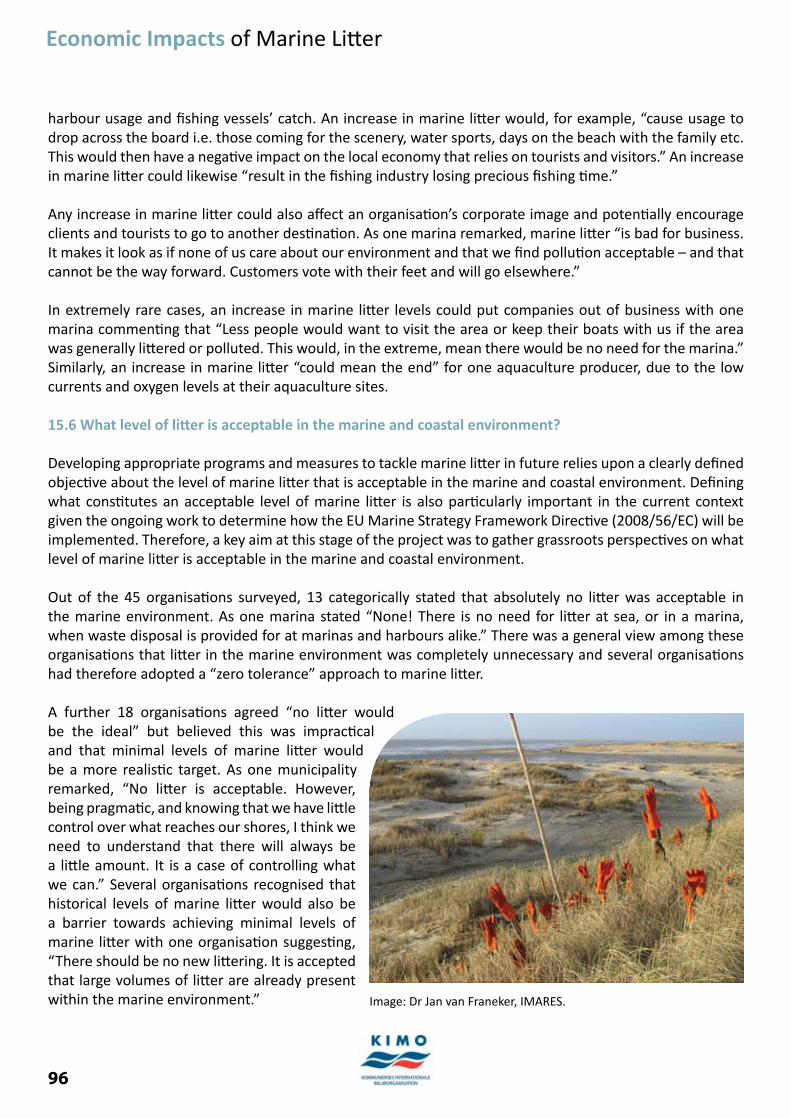
96
Economic Impacts of Marine Litt er
harbour usage and fi shing vessels’ catch. An increase in marine litt er would, for example, “cause usage to drop across the board i.e. those coming for the scenery, water sports, days on the beach with the family etc. This would then have a negati ve impact on the local economy that relies on tourists and visitors.” An increase in marine litt er could likewise “result in the fi shing industry losing precious fi shing ti me.”
Any increase in marine litt er could also aff ect an organisati on’s corporate image and potenti ally encourage clients and tourists to go to another desti nati on. As one marina remarked, marine litt er “is bad for business. It makes it look as if none of us care about our environment and that we fi nd polluti on acceptable – and that cannot be the way forward. Customers vote with their feet and will go elsewhere.”
In extremely rare cases, an increase in marine litt er levels could put companies out of business with one marina commenti ng that “Less people would want to visit the area or keep their boats with us if the area was generally litt ered or polluted. This would, in the extreme, mean there would be no need for the marina.” Similarly, an increase in marine litt er “could mean the end” for one aquaculture producer, due to the low currents and oxygen levels at their aquaculture sites.
15.6 What level of litt er is acceptable in the marine and coastal environment?
Developing appropriate programs and measures to tackle marine litt er in future relies upon a clearly defi ned objecti ve about the level of marine litt er that is acceptable in the marine and coastal environment. Defi ning what consti tutes an acceptable level of marine litt er is also parti cularly important in the current context given the ongoing work to determine how the EU Marine Strategy Framework Directi ve (2008/56/EC) will be implemented. Therefore, a key aim at this stage of the project was to gather grassroots perspecti ves on what level of marine litt er is acceptable in the marine and coastal environment.
Out of the 45 organisati ons surveyed, 13 categorically stated that absolutely no litt er was acceptable in the marine environment. As one marina stated “None! There is no need for litt er at sea, or in a marina, when waste disposal is provided for at marinas and harbours alike.” There was a general view among these organisati ons that litt er in the marine environment was completely unnecessary and several organisati ons had therefore adopted a “zero tolerance” approach to marine litt er.
A further 18 organisati ons agreed “no litt er would be the ideal” but believed this was impracti cal and that minimal levels of marine litt er would be a more realisti c target. As one municipality remarked, “No litt er is acceptable. However, being pragmati c, and knowing that we have litt le control over what reaches our shores, I think we need to understand that there will always be a litt le amount. It is a case of controlling what we can.” Several organisati ons recognised that historical levels of marine litt er would also be a barrier towards achieving minimal levels of marine litt er with one organisati on suggesti ng, “There should be no new litt ering. It is accepted that large volumes of litt er are already present within the marine environment.” Image: Dr Jan van Franeker, IMARES.
97
Economic Impacts of Marine Litt er
In total, 11 organisati ons explicitly stated that marine litt er levels should be “the lowest possible”. For many organisati ons, this was about achieving as low a level of marine litt er as possible given the limited funds and resources available. As one harbour remarked, “the practi caliti es and cost constraints of achieving the acceptable and accepti ng the reality have to be acknowledged.” For others, “the lowest possible” level of litt er was determined according to the level of litt er which is acceptable to clients and visitors. Thus, for one municipality, a small amount of litt er was acceptable since “a reasonably small degree of litt ering on the main beaches is probably seen as reasonable by most visitors.” Organisati ons therefore generally shared the view that the current level of marine litt er is unacceptable.
15.7 Conclusion
Although organisati ons stressed the importance of a clean and high quality environment, marine litt er aff ects almost 66% of the organisati ons surveyed during this project. Overall, marine litt er tends to aff ect these organisati ons in two main ways either by directly impacti ng on their core business or through the need to remove litt er, which requires additi onal resources and expenditure. For many organisati ons, however, it is diffi cult to fi nd the resources and funds necessary to support the level of service provision required to ensure their area is clean and free of litt er.
The impact of any future increase in marine litt er could be quite variable. At one end of the spectrum, several organisati ons stated that they would not be aff ected by any increase in marine litt er while many suggested it would put additi onal pressure on their resources and budgets. In a few extreme cases, a signifi cant increase in marine litt er could put the organisati on out of business.
A key aim at this stage of the project was to determine what level of marine litt er is acceptable in the marine and coastal environment and the responses ranged from no litt er whatsoever to the minimum amount of litt er possible. The organisati ons surveyed during this project were therefore agreed that current levels of marine litt er are unacceptable. This suggests that concerted acti on is now required at all levels to reduce existi ng levels of marine litt er and prevent new litt er from entering the marine environment.
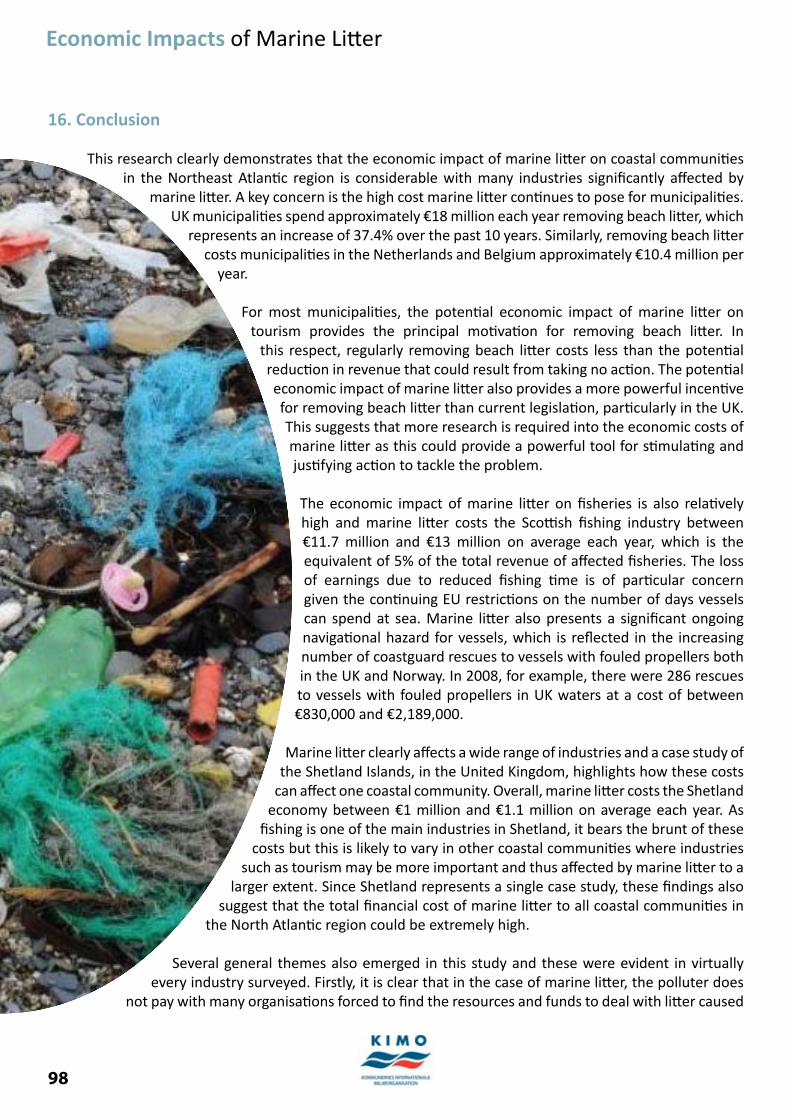
98
Economic Impacts of Marine Litt er
16. Conclusion
This research clearly demonstrates that the economic impact of marine litt er on coastal communiti es in the Northeast Atlanti c region is considerable with many industries signifi cantly aff ected by
marine litt er. A key concern is the high cost marine litt er conti nues to pose for municipaliti es. UK municipaliti es spend approximately €18 million each year removing beach litt er, which
represents an increase of 37.4% over the past 10 years. Similarly, removing beach litt er costs municipaliti es in the Netherlands and Belgium approximately €10.4 million per
year.
For most municipaliti es, the potenti al economic impact of marine litt er on tourism provides the principal moti vati on for removing beach litt er. In
this respect, regularly removing beach litt er costs less than the potenti al reducti on in revenue that could result from taking no acti on. The potenti al economic impact of marine litt er also provides a more powerful incenti ve for removing beach litt er than current legislati on, parti cularly in the UK. This suggests that more research is required into the economic costs of marine litt er as this could provide a powerful tool for sti mulati ng and justi fying acti on to tackle the problem.
The economic impact of marine litt er on fi sheries is also relati vely high and marine litt er costs the Scotti sh fi shing industry between €11.7 million and €13 million on average each year, which is the equivalent of 5% of the total revenue of aff ected fi sheries. The loss of earnings due to reduced fi shing ti me is of parti cular concern given the conti nuing EU restricti ons on the number of days vessels can spend at sea. Marine litt er also presents a signifi cant ongoing navigati onal hazard for vessels, which is refl ected in the increasing number of coastguard rescues to vessels with fouled propellers both in the UK and Norway. In 2008, for example, there were 286 rescues to vessels with fouled propellers in UK waters at a cost of between €830,000 and €2,189,000.
Marine litt er clearly aff ects a wide range of industries and a case study of the Shetland Islands, in the United Kingdom, highlights how these costs
can aff ect one coastal community. Overall, marine litt er costs the Shetland economy between €1 million and €1.1 million on average each year. As
fi shing is one of the main industries in Shetland, it bears the brunt of these costs but this is likely to vary in other coastal communiti es where industries
such as tourism may be more important and thus aff ected by marine litt er to a larger extent. Since Shetland represents a single case study, these fi ndings also
suggest that the total fi nancial cost of marine litt er to all coastal communiti es in the North Atlanti c region could be extremely high.
Several general themes also emerged in this study and these were evident in virtually every industry surveyed. Firstly, it is clear that in the case of marine litt er, the polluter does
not pay with many organisati ons forced to fi nd the resources and funds to deal with litt er caused
99
Economic Impacts of Marine Litt er
by other parti es. Similarly, it is important to acknowledge that while many of these eff orts miti gate the short-term impact of marine litt er, they do not directly address the underlying marine litt er problem. Furthermore, marine litt er represents an additi onal and completely unnecessary cost to these organisati ons, many of which face increasing diffi culti es balancing service provision with limited funds.
This study also investi gated the wider context of the impacts of marine litt er and in parti cular, the sensiti vity and prioriti es of various sectors as regards marine litt er. Although organisati ons stressed the importance of a clean and high quality environment, marine litt er aff ects almost 66% of the organisati ons surveyed during this project. Overall, marine litt er aff ects these organisati ons either by directly impacti ng on their core acti viti es or through the need to remove litt er, which requires additi onal resources and expenditure. The majority of organisati ons surveyed during this project also stated that absolutely no litt er was acceptable in the marine environment, although many recognised that achieving a minimal level of marine litt er is perhaps a more realisti c target. These organisati ons were therefore agreed that current levels of marine litt er are unacceptable.
This research also highlights that while the economic impact of marine litt er occurs at a local level, acti on to reduce it must be global. With marine litt er originati ng from many diff use sources, there needs to be a step change in how the problem is treated at a nati onal and internati onal level. As a starti ng point, marine litt er needs to be regarded as a pollutant on the same level as heavy metals, chemicals and oil and therefore given the same politi cal credibility. In most countries, NGO’s and volunteers currently undertake monitoring of marine litt er and there are no nati onal monitoring programmes, as there are for other pollutants. The level of resources committ ed to tackle marine litt er by states is also far less than for other pollutants although, as we have shown here, the impacts can be signifi cant.
At a broader level, we also need to consider the way we design and treat products, especially those made of plasti c, with too many currently designed for one use and then thrown away. In the Northeast Atlanti c, plasti cs make up 80-62% of marine litt er and yet we conti nue to design and develop disposable products that encourage litt ering. Systems need to be implemented to place value on these products to encourage their reuse and encourage manufacturers to design them for reuse and recycling. There are already several initi ati ves, such as deposit schemes and reverse vending, which incenti vise the reuse of plasti c bott les and these could be extended to include a wider range of plasti c containers. For higher value items, extended produce responsibility should be adopted with fi shing nets, for example, rented by the producers rather than sold. The net would then be returned at the end of its life and it would be the producer’s responsibility to recycle them, reducing the temptati on to dispose of them at sea.
The enforcement of litt er legislati on also needs to be improved if the sources of marine litt er are to be signifi cantly reduced. The dumping of all plasti c at sea is banned under MARPOL Annex V, for example, but with poor enforcement and insignifi cant fi nes, it holds very litt le deterrent for polluters. Despite holding Special Area status under MARPOL Annex V, the North Sea remains polluted by large quanti ti es of plasti c and other litt er. Similarly, the provisions of the EU Port Waste Recepti on Directi ve must be improved to include all vessels, introduce signifi cant fi nes and ensure that those who break the law can be prosecuted. In principle, current legislati on does much to reduce marine litt er but in practi ce, stronger networks of enforcement and signifi cant fi nes are required to realise the full potenti al of these regulati ons.
These challenges are not new but the way we address them must be if we are to signifi cantly reduce marine litt er. What is clear is that without strong acti on to tackle the sources of marine litt er, the costs associated with it will conti nue to rise.
100
Economic Impacts of Marine Litt er
References
Allsopp, M., Walters, A., Santi llo, D. and Johnston, P. (2006) Plasti c debris in the world’s oceans. Available from: htt p://www.unep.org/regionalseas/marinelitt er/publicati ons/docs/plasti c_ocean_report.pdf [accessed July 2010.]
Andrady, A. (2005) Plasti cs in the Marine Environment: A Technical Perspecti ve. White Paper for the Plasti c Debris Rivers to Sea Conference, Sept 7-9 2005. Redondo Beach, California.
Australian Government (2009) Harmful Marine Debris. Available from: htt p://www.environment.gov.au/biodiversity/threatened/publicati ons/marine-debris.html [accessed July 2010.]
Ballance, A., Ryan, P.G. and Turpie, J.K. (2000) How much is a clean beach worth? The impact of litt er on beach users in the Cape Peninsula, South Africa. South Africa Journal of Science 96: 5210 – 5213.
Barnes, D.K.A. (2002) Invasions by marine life on plasti c debris. Nature 416: 808-809.
Barnes, D.K.A. (2005) Remote Islands Reveal Rapid Rise of Southern Hemisphere Sea Debris. The Scienti fi c World Journal 5: 915-921.
Barnes, D.K.A. and Milner, P. (2005) Drift ing plasti c and its consequences for sessile organism dispersal in the Atlanti c Ocean. Marine Biology 146: 815-825.
Barnes, D.K.A., Galgani, F., Thompson, R.C. and Barlaz, M. (2009) Accumulati on and fragmentati on of plasti c debris in global environments. Philosophical Transacti ons of the Royal Society B: Biological Sciences 364(1526): 1985-1998.
Beachwatch (2009a) Methods and Full Results. Available from: htt p://www.mcsuk.org/downloads/polluti on/beachwatch/Beachwatch%20Big%20Weekend%202009%20-%20methods%20and%20full%20results.pdf [accessed July 2010.]
Beachwatch (2009b) Summary Report. Available from: htt p://www.mcsuk.org/downloads/polluti on/beachwatch/Summary%20report_2009_e-mail.pdf [accessed July 2010.]
BMF (2007) Economic Benefi ts of Coastal Marinas UK and Channel Islands: Executi ve Summary. Available from: htt p://www.briti shmarine.co.uk/upload_pub/2027.pdf [accessed July 2010.]
Brown, J., Macfadyen, G., Hunti ngton, T., Magnus, J. and Tumilty, J. (2005). Ghost Fishing by Lost Fishing Gear. Final Report to DG Fisheries and Mariti me Aff airs of the Euopean Commission. Fish/2004/20. Insti tute for European Environmental Policy/Poseidon Aquati c Resource Management Ltd joint report.
Cheshire, A.C., Adler, E., Barbière, J., Cohen, Y., Evans, S., Jarayabhand, S., Jeft ic, L., Jung, R.T., Kinsey, S., Kusui, E.T., Lavine, I., Manyara, P., Oosterbaan, L., Pereira, M.A., Sheavly, S., Tkalin, A., Varadarajan, S., Wenneker, B. and Westphalen, G. (2009) UNEP/IOC Guidelines on Survey and Monitoring of Marine Litt er. UNEP Regional Seas Reports and Studies, No. 186; IOC Technical Serious No. 83.
101
Economic Impacts of Marine Litt er
Chivers, C.J. and Drew, C. (2005) All 7 Men Alive as Russian Submarine Is Raised. Available from: htt p://nyti mes.com/2005/08/07/internati onal/europe/07russia.html?_r=1 [accessed July 2010.]
Committ ee on the Eff ecti veness of Internati onal and Nati onal Measures to Prevent and Reduce Marine Debris and Its Impacts, Nati onal Research Council, Ocean Studies Board and Division on Earth and Life Sciences (2008) Tackling Marine Debris in the 21st Century. Washington D.C.: The Nati onal Academies Press.
DEFRA (2009) Marine and Coastal Access Act 2009. Available from: htt p://www.defra.gov.uk/environment/marine/legislati on/mcaa/index.htm [accessed July 2010].
DEFRA (2010) Charti ng Progress 2: The state of UK seas. Available from: htt p://charti ngprogress.defra.gov.uk/ [accessed July 2010.]
Deloitt e (2008) The economic case for the Visitor Economy: Final report. Available from: htt p://www.visitbritain.org/Images/EconomicCaseforTourism_tcm139-168288.pdf [accessed July 2010.]
Derraik, J.G.B. (2002) The polluti on of the marine environment by plasti c debris: a review. Marine Polluti on Bulleti n 44: 842-852.
Donnan, D. (2009) Marine non-nati ve species: responding to the threat. Presentati on to the Scotti sh Natural Heritage Conference ‘Marine non-nati ve species: responding to the threat’, 27 Oct 2009. Batt leby, Scotland.
ENCAMS (2005) Beach and surrounding area user segmentati on. Available from: htt p://www.keepbritainti dy.org/ImgLibrary/beach_segmentati on_2005_637.pdf [accessed July 2010.]
ENCAMS (2007) Sewage Related Litt er: Flushing Toilets onto Beaches. Available from: htt p://www.keepbritainti dy.org/ImgLibrary/sewagelitt er_report_651.pdf [accessed July 2010.]
Fanshawe, T. and Everard, M. (2002) The Impacts of Marine Litt er: Report of the Marine Litt er Task Team (MaLiTT). Available from: htt p://www.marlab.ac.uk/Uploads/Documents/Impacts%20of%20Marine%20Litt er.pdf [accessed July 2010.]
Fisheries Research Service (2008a) Scotti sh Fish Farms Annual Producti on Survey 2007. Available from: htt p://www.frs-scotland.gov.uk/FRS.Web/Uploads/Documents/surveytext2007fi nal.pdf [accessed July 2010.]
Fisheries Research Service (2008b) Scotti sh Shellfi sh Farm Producti on Survey 2007. Available from: htt p://www.frs-scotland.gov.uk/FRS.Web/Uploads/Documents/shell%202007v7.pdf [accessed July 2010.]
Galgani, F., Leaute, J.P., Moguedet, P., Souplet, A., Verin, Y., Carpenti er, A., Goraguer, H., Latrouite, D., Andral, B., Cadiou, Y., Mahe, J.C., Poulard, J.C. and Nerisson, P. (2000) Litt er on the Sea Floor Along European Coasts. Marine Polluti on Bulleti n 40(6): 516-527.
GESAMP (Group of Experts on the Scienti fi c Aspects of Marine Polluti on) (1991) The State of the Marine Environment. London: Blackwell Scienti fi c Publicati ons.
102
Economic Impacts of Marine Litt er
Gregory, M.R. (2009) Environmental implicati ons of plasti c debris in marine setti ngs – entanglement, ingesti on, smothering, hanger’s on, hitch-hiking and alien invasions. Philosophical Transacti ons of the Royal Society B: Biological Sciences 364(1526): 2013-2025.
Hall, K. (2000) Impacts of Marine Debris and Oil: Economic and Social Costs to Coastal Communiti es. Available from: htt p://www.kimointernati onal.org/Portals/0/Files/Karensreport.pdf [accessed July 2010.]
Holt, R. (2009) The carpet sea squirt Didemnum vexillum: Eradicati on from Holyhead Marina. Presentati on to the Scotti sh Natural Heritage Conference ‘Marine non-nati ve species: responding to the threat’, 27 Oct 2009. Batt leby, Scotland.
Horsman, P.V. (1982) The Amount of Garbage Polluti on from Merchant Ships. Marine Polluti on Bulleti n 13(5): 167-169.
Hyrenbach, D. and Kennish, J. (2008) Questi on 6: How Does Marine Debris Aff ect Wildlife and the Environment? In: Williams, M., and E. Ammann (eds.) Marine debris in Alaska: Coordinati ng our eff orts. Alaska: Alaska Sea Grant College Program pp 109-120.
ICC (2009) A Rising Tide of Ocean Debris. Available from: htt p://www.oceanconservancy.org/pdf/A_Rising_Tide_full_hires.pdf [accessed July 2010.]
ICC (2010) Trash Travels: From Our Hands to the Sea, Around the Globe, and Through Time. Available from: http://www.oceanconservancy.org/images/2010ICCReportRelease_pressPhotos/2010_ICC_Report.pdf [accessed July 2010.]
IMO (2002) Preventi on of Polluti on by Garbage from Ships. Available from: htt p://www.imo.org/Environment/mainframe.asp?topic_id=297 [accessed July 2010.]
IMO (2009) Internati onal Shipping and World Trade: Facts and Figures. Available from: htt p://www.imo.org/includes/blastDataOnly.asp/data_id%3D28127/InternationalShippingandWorldTrade-factsandfi guresoct2009rev1__tmp65768b41.pdf [accessed July 2010.]
IMO (2010) Summary of Status of Conventi ons. Available from: htt p://www.imo.org/Conventi ons/mainframe.asp?topic_id=247 [accessed July 2010.]
Keep Britain Tidy (2010) Blue Flag. Available from: htt p://www.keepbritainti dy.org/Programmes/Beaches/BlueFlag/Default.aspx [accessed July 2010.]
Laist, D.W. (1997) Impacts of marine debris: entanglement of marine life in marine debris including a comprehensive list of species with entanglement and ingesti on records. In: Coe, J.M. and D.B. Rogers (eds.) Marine Debris: Sources, Impacts, Soluti ons. New York: Springer Verlag, pp 99-140.
Laist, D.W. and Liff mann, M. (2000) Impacts of Debris: Research and Management Needs. Issue Papers of the Internati onal Marine Debris Conference, Aug 6-11, 2000. Honolulu, Hawaii.
103
Economic Impacts of Marine Litt er
Macfadyen, G., Hunti ngton, T. and Cappell, R. (2009) Abandoned, lost or otherwise discarded fi shing gear. UNEP Regional Seas Reports and Studies No. 185; FAO Fisheries and Aquaculture Technical Paper No. 523. Rome: UNEP/FAO.
Moore, C.J. (2008) Syntheti c polymers in the marine environment: a rapidly increasing, long-term threat. Environmental Research 108: 131-139.
Naturvårdsverket (2009) What’s in the Sea for Me? Ecosystem Services Provided by the Balti c Sea and Skaggerak. Report 5872. Available from: htt p://www.naturvardsverket.se/Documents/publikati oner/978-91-620-5872-2.pdf [accessed July 2010.]
Ocean Conservancy (2008a) North Atlanti c Right Whale: The Right Time to Take Acti on. Available from: htt p://www.oceanconservancy.org/site/DocServer/North_Atlanti c_RW_fi nal1.pdf?docID=4541 [accessed July 2010.]
Ocean Conservancy (2008b) Summary of North Atlanti c Right Whale Incidents 1999-2008. Available from: htt p://www.oceanconservancy.org/site/DocServer/SummaryRWDeaths20042006_WhaleDolphinSociety.pdf?docID=2121 [accessed July 2010].
Ordnance Survey (2010) An introducti on to Ordnance Survey. Available from: htt p://www.ordnancesurvey.co.uk/oswebsite/media/features/introos/ [accessed July 2010.]
OSPAR (1995) Summary Record of the Oslo and Paris Conventi ons for the Preventi on of Marine Polluti on Working Group on Impacts on the Marine Environment (IMPACT) Group, IMPACT 95/14/1-E.
OSPAR (2009) Marine litt er in the North-East Atlanti c Region: Assessment and prioriti es for response. London: United Kingdom.
Podsada, J. (2001) Lost Sea Cargo: Beach Bounty or Junk? Available from: htt p://news.nati onalgeographic.co.uk/news/2001/06/0619_seacargo.html [accessed July 2010.]
Pugh, D. and Skinner, L. (2002) A new analysis of marine-related acti viti es in the UK economy with supporti ng science and technology. IACMST Informati on Document No. 10.
RNLI (2010) Money matt ers. Available from: htt p://www.rnli.org.uk/what_we_do/money_matt ers [accessed July 2010.]
Scotti sh Government (2009a) Scotti sh Sea Fisheries: Stati sti cs 2008. Available from: htt p://www.scotland.gov.uk/Resource/Doc/284286/0086304.pdf [accessed July 2010.]
Scotti sh Government (2009b) The Scotti sh Government’s Response to the European Commission’s Green Paper on Reform of the Common Fisheries Policy. Available from: htt p://www.scotland.gov.uk/Resource/Doc/297585/0092572.pdf [accessed July 2010.]
Scotti sh Government (2009c) A Fresh Start: The renewed Strategic Framework for Scotti sh Aquaculture. Available from: htt p://www.scotland.gov.uk/Resource/Doc/272866/0081461.pdf [accessed July 2010].
104
Economic Impacts of Marine Litt er
Sheavly, S.B. (2005) Marine Debris – an Overview of a Criti cal Issue for Our Oceans. Presentati on at Sixth Meeti ng of the UN Open-ended Informal Consultati ve Process on Oceans and the Law of the Sea. Available from: htt p://www.un.org/Depts/los/consultati ve_process/documents/6_sheavly.pdf [accessed July 2010.]
Sheavly, S.B. (2007) Nati onal Marine Debris Monitoring Program: Executi ve Summary. Prepared for U.S. Environmental Protecti on Agency by Ocean Conservancy, Grant Number X83053401-02. Available from: htt p://www.oceanconservancy.org/site/DocServer/NMDMP_ExecSummary.pdf?docID=3221 [accessed July 2010.]
Sheavly, S.B. and Register, K.M. (2007) Marine Debris and Plasti cs: Environmental Concerns, Sources, Impacts and Soluti ons. Journal of Polymers and the Environment 15: 301-305.
Ten Brink, P., Lutchman, I., Bassi, S., Speck, S., Sheavly, S., Register, K. and Woolaway, C. (2009) Guidelines on the Use of Market-based Instruments to Address the Problem of Marine Litt er. Insti tute for European Environmental Policy (IEEP), Brussels, Belgium, and Sheavly Consultants, Virginia Beach, Virginia, USA.
Teuten, E.L., Saquing, J.M., Knappe, D.R.U., Barlaz, M.A., Jonsson, S., Björn, A., Rowland, S.J., Thompson, R.C., Galloway, T.S., Yamashita, R., Ochi, D., Watanuki, Y., Moore, C., Viet, P.H., Tana, T.S., Prudente, M., Boonyatumanond, R., Zakaria, M.P., Akkhavong, K., Ogata, Y., Hirai, H., Iwasa, S., Mizukawa, K., Hagino, Y., Imamura, A., Saha, M. and Takada, H. (2009) Transport and release of chemicals from plasti cs to the environment and to wildlife. Philosophical Transacti ons of the Royal Society B: Biological Sciences 364(1526): 2027-2045.
The Herald (2009) Terror as diver is trapped in net. Available from: htt p://www.thisisplymouth.co.uk/news/TERROR-DIVER-ENTANGLED-NET/arti cle-602003-detail/arti cle.html [accessed July 2010.]
Thompson, R.C., Olsen, Y., Mitchell, R.P., Davis, A., Rowland, S.J., John, A.W.G., McGonigle, D. and Russell, A.E. (2004) Lost at Sea: Where is all the Plasti c? Science 304: 838.
Thompson, R.C., Swan, S.H., Moore, C.J. and vom Saal, F.S. (2009a) Our Plasti c Age. Philosophical Transacti ons of the Royal Society B: Biological Sciences 364(1526): 1969-2166.
Thompson, R.C., Moore, C.J., vom Saal, F.S., and Swan, S.H. (2009b) Plasti cs, the environment and human health: current consensus and future trends. Philosophical Transacti ons of the Royal Society B: Biological Sciences 364(1526): 2153-2166.
Tourism Alliance (2007) Facts and Figures. Available from: htt p://www.tourismalliance.com/TA_Bchr_2008.pdf [accessed July 2010.]
UNEP (2005) Marine Litt er: An Analyti cal Overview. Available from: htt p://www.unep.org/regionalseas/marinelitt er/publicati ons/docs/anl_oview.pdf [accessed July 2010.]
UNEP (2006) Ecosystems and biodiversity in deep waters and high seas. UNEP Regional Seas Reports and Studies No. 178. Switzerland: UNEP/IUCN.
UNEP (2009) Marine Litt er: A Global Challenge. Nairobi: UNEP.
105
Economic Impacts of Marine Litt er
Van Franeker, J.A., Heubeck, M., Fairclough, K., Turner, D.M., Grantham, M., Sti enen, E.W.M., Guse, N., Pedersen, J., Olsen, K.O., Andersson, P.J. and Olsen, B. (2005) Save the North Sea Fulmar Study 2002-2004: a regional pilot project for the Fulmar-Litt er EcoQO in the OSPAR area. Wageningen, Alterra, Alterra-rapport 1162.
Visit Wales (2008) Coastal Tourism Strategy. Available from: htt p://wales.gov.uk/docs/drah/publicati ons/Tourism/090612coastaleng.pdf [accessed July 2010.]
Welsh Enterprise Insti tute (2006) Taking Forward Valuing Our Environment: A Study That Applies the VoE Framework to the Marine and Coast Environment of Wales. Available from: htt p://www.nati onaltrust.org.uk/main/w-wales-valuing_our_environment-full_report.pdf [accessed July 2010.]
Williams, A.T., Gregory, M. and Tudor, D.T. (2005) Marine Debris – onshore, off shore, seafl oor litt er. In: M.L. Schwartz (ed.) Encyclopedia of Coastal Science. The Netherlands: Springer, pp 623-628.