Embed Size (px)
Citation preview
September 21, 2016
VIA E-MAIL and U.S. MAIL
Mr. Robert Kaplan
Acting Regional Administrator
United States Environmental Protection Agency, Region 5
77 West Jackson Boulevard (R-19J)
Chicago, Illinois 60604-3507
RE: Comments on MDEQ’s Sulfur Dioxide One-Hour National
Ambient Air Quality Standard State Implementation Plan
Submitted to EPA for Approval
Dear Mr. Kaplan:
Please accept these comments submitted on behalf of Sierra Club and Earthjustice
regarding the Michigan Department of Environmental Quality’s (“MDEQ’s”) Sulfur Dioxide
One-Hour National Ambient Air Quality Standard State Implementation Plan (“Submitted NSIP”
or “Plan”), submitted to EPA on May 31, 2016 for approval and amended with an addendum on
June 30, 2016. The Plan is required to address the portion of Wayne County that has been
designated as out of attainment (“nonattainment area”) with the 1-hour sulfur dioxide (“SO2”)
National Ambient Air Quality Standards (“NAAQS”). MDEQ’s Plan falls short of bringing the
area into attainment, and does not require enforceable, sufficient reduction in actual SO2
emissions from major sources in the area. As a result, EPA must deny approval of the Submitted
NSIP.
SO2 pollution poses a serious public health threat in Detroit and Downriver communities.
The 1-hour SO2 NAAQS is intended to alleviate this threat, but will only succeed if EPA
expeditiously denies approval of the Submitted NSIP and issues a compliant federal plan that
establishes and implements permanently enforceable measures to bring Wayne County into
attainment with the standard.
In the Submitted NSIP, MDEQ erroneously claims that its plan will achieve compliance
with the federal standard.1 As detailed in Dr. Andrew Gray’s 2016 air quality modeling report,
attached, and as discussed further below, MDEQ’s Submitted NSIP is fatally deficient for at least
the following reasons:
1 Michigan Dep’t of Envtl. Quality (MDEQ), Sulfur Dioxide One-Hour National Ambient Air Quality Standard
Nonattainment State Implementation Plan for Wayne County (partial), at i (June 30, 2016) (hereinafter “Submitted
NSIP”) (“this SIP demonstrates attainment with the 1-hour SO2 NAAQS”).

2
MDEQ arbitrarily changed the background level of SO2 used in its modeling to a level
that brought the modeling results to just under the federal standard. As Dr. Gray
demonstrates, MDEQ did not provide any rationale for this change and an analysis of
the data shows that this change is unreasonable. Had MDEQ continued to use the
previous and correct background concentration, the modeling would have showed that
three hotspots will still persist;
The proposed limits are based on a 720-hour rolling average when only 1-hour limits
can fully ensure compliance with the 1-hour SO2 NAAQS;
Even if the use of 720-hour rolling average limits could be adequate, MDEQ failed to
properly account in its modeling for the higher emissions that such a long averaging
period would allow for, and did not take supplemental steps necessary to reduce the
chance of exceedances of the NAAQS that could result from the use of longer
averaging times; and
The Submitted NSIP does not clearly establish permanent and enforceable limits, as
required by the Clean Air Act.2
In short, the MDEQ’s Submitted NSIP fails to demonstrate the attainment of the 1-hour SO2
NAAQS that is required by law, and unconscionably prolongs the significant public health and
environmental justice impacts of excessive SO2 pollution in Wayne County. MDEQ’s
inadequate submission, made more than a year after the statutory deadline for such submission,
signals that MDEQ has no intention of mandating the more stringent SO2 emissions limitations
that are needed to attain the NAAQS. In such a situation, the U.S. EPA has the legal authority
and duty to issue its own Federal Implementation Plan (“FIP”) in order to ensure that timely
attainment is achieved in Wayne County. As such, EPA must not only reject MDEQ’s Submitted
NSIP as legally inadequate, but also expeditiously issue a federal plan that will address the
pressing health problems posed by excessive SO2 pollution in Detroit and Downriver
communities. Every week of delay means more hospitalizations and missed school and work for
Wayne County residents. This delay cannot be permitted to continue.
I. Elevated Levels of Sulfur Dioxide Pollution Pose a Serious Public Health Threat in
Wayne County, an Area Long-Overburdened with Pollution.
Every year, major industrial facilities in the Detroit area emit tens of thousands of tons of
SO2 into the air that people who live, work, and recreate in Detroit and Downriver communities
breathe. An overwhelming weight of scientific evidence shows that even short-term exposure to
elevated levels of SO2 pollution poses a serious public health threat. The 1-hour SO2 NAAQS
was established in 2010 to help reduce the exact public health threat that Wayne County
residents face every day.
2 Dr. H. Andrew Gray, Evaluation of MDEQ’s May 31, 2016 Proposed Sulfur Dioxide One-Hour National Ambient
Air Quality Standard State Implementation Plan and June 30, 2016 Addendum (Aug. 22, 2016) (hereafter referred to
as “2016 Dr. Gray Report), attached hereto as Exhibit 1.

3
A. Sulfur Dioxide Pollution Poses a Serious Public Health Threat.
Current scientific evidence on the harmful health effects of sulfur dioxide is well-
established. Sulfur dioxide, a colorless gas with a pungent odor, enters the body primarily
through inhalation3 and reacts with the mucous membranes of the lungs and upper respiratory
tract to form sulfurous acid, a severe irritant.4 According to the Agency for Toxic Substances and
Disease Registry (a federal public health agency of the U.S. Department of Health and Human
Services):
People with asthma can experience increased airway resistance with sulfur
dioxide concentrations of less than 0.1 ppm [“parts per million”] when exercising.
Healthy adults experience increased airway resistance at 5 ppm, sneezing and
coughing at 10 ppm, and bronchospasm at 20ppm. Respiratory protection is
required for exposures at or above 20 ppm. Exposures of 50 to 100 ppm may be
tolerated for more than 30 to 60 minutes, but higher or longer exposures can cause
death from airway obstruction. Sulfur dioxide is heavier than air; thus, exposure
in poorly ventilated, enclosed, or low-lying areas can result in asphyxiation.
Children exposed to the same levels of sulfur dioxide as adults may receive a
larger dose because they have greater lung surface area [to] body weight ratios
and increased minute volumes [to] weight ratios. In addition, they may be
exposed to higher levels than adults in the same location because of their short
stature and the higher levels of sulfur dioxide found nearer to the ground and
because they are slow to leave the site of an exposure.5
Symptoms of sulfur dioxide inhalation include “sneezing, sore throat, wheezing,
shortness of breath, chest tightness, and a feeling of suffocation.”6 Sulfur dioxide respiratory
irritation can also induce fluid accumulation in the larynx and lungs and inflammation of lung
tissue. Strikingly, many of these adverse respiratory effects can occur even with only short-
term exposure to sulfur dioxide (five minutes to 24 hours). The negative health impacts of
sulfur dioxide inhalation become much more prevalent in asthmatics, children, the elderly, and
those with cardiovascular or chronic lung disease (bronchitis, emphysema), all of whom are
especially sensitive to the effects of sulfur dioxide and may be affected by lower concentrations
than healthy adults.
3 Sulfur dioxide can also be absorbed through the skin and other mucous membranes (like the eyes) where the
chemical also acts as an extreme irritant. Agency for Toxic Substances & Disease Registry, Sulfur Dioxide (SO2)
CAS 7446-09-5; UN 1079, at 5-6, available at http://www.atsdr.cdc.gov/MHMI/mmg116.pdf (emphasis added)
(hereinafter “ATSDR Sulfur Dioxide”). 4 Id. at 1. Sulfur dioxide in the ambient air can also react with other chemicals and convert to a small particle that
can lodge deeply in the most sensitive part of the lung. EPA, Sulfur Dioxide Basics, available at
https://www.epa.gov/so2-pollution/sulfur-dioxide-basics#what is so2 (last updated Aug. 16, 2016).
5 ATSDR Sulfur Dioxide at 1-2; see also Agency for Toxic Substances & Disease Registry, Public Health
Statement Sulfur Dioxide 2-3 (Dec. 1998), available at http://www.atsdr.cdc.gov/ToxProfiles/tp116-c1-b.pdf.
6 ATSDR Sulfur Dioxide at 5.

4
B. The 1-Hour SO2 NAAQS.
U.S. EPA promulgated initial primary and secondary NAAQS for SO2 in 1971.7 On June
2, 2010, U.S. EPA issued a new SO2 NAAQS standard, recognizing that the prior 24-hour and
annual SO2 standards did not adequately protect the public against adverse respiratory effects
associated with short term (five minutes to 24 hours) SO2 exposure.8 The new 2010 SO2
NAAQS standard is a 1-hour standard set at 196 micrograms per cubic meter (“µg/m3”) or 75
parts per billion (“ppb”).9 The “standard is met…when the three-year average of the annual (99th
percentile) of the daily maximum 1-hour average concentrations is less than or equal to 75
ppb.”10
Due to both the shorter averaging time and the numerical difference, the new 1-hour SO2
NAAQS is far more stringent than the prior standard. On July 20, 2012, the U.S. Circuit Court of
Appeals for the District of Columbia upheld the 1-hour SO2 NAAQS.11
U.S. EPA must set the NAAQS at a level adequate to protect public health with an
adequate margin of safety.12
Relying upon years of research, and an extensive notice and
comment process, U.S. EPA established the new 1-hour SO2 NAAQS because a substantial
body of scientific evidence demonstrated that exposure to SO2 in even very short time periods—
such as five minutes—causes decrements in lung function, aggravation of asthma, and
respiratory and cardiovascular morbidity, and that the then-existing NAAQS were inadequate to
protect public health from such impacts. These findings were thoroughly documented in an
Integrated Science Assessment13
completed as part of the NAAQS evaluation, and in the final
NAAQS rule itself.14
Based on this strong scientific evidence, U.S. EPA has estimated that the
1-hour SO2 NAAQS will prevent 2,300-5,900 premature deaths and 54,000 asthma attacks a
year.15
C. The Wayne County Non-Attainment Area and its Disproportionate
Pollution Burden: an Environmental Justice Crisis.
The promulgation of the new 1-hour SO2 NAAQS triggered a process by which U.S.
EPA was required within three years to designate areas of the country that are failing to attain
the NAAQS.16
In 2013, after data collected from a monitor located at Southwestern High School
7 The EPA originally set the primary standard for SO2 at 0.14 parts per million (“ppm”), 24-hour average, and 0.03
ppm, annual average. EPA, Sulfur Dioxide (SO2) Primary Standards - Table of Historical SO2 NAAQS, available at
http://www.epa.gov/ttn/naaqs/standards/so2/s_so2_history.html (last updated Mar. 4, 2016).
8 EPA, Final Rule for the Primary National Ambient Air Quality Standard for Sulfur Dioxide, 75 Fed. Reg. 35,520,
35,550 (June 22, 2010) (hereinafter “2010 SO2 NAAQS”). 9 40 C.F.R. § 50.17(a).
10 Id. § 50.17(b).
11 Nat’l Envtl. Defense Ass’n’s Clean Air Project v. EPA, 686 F.3d
803 (D.C. Cir. 2012). 12
42 U.S.C. § 7409(b).
13 EPA, Integrated Science Assessment for Sulfur Oxides—Health Criteria, EPA/600/R-08/047F, at 5-3–5-4, Tables
5-1, 5-2 (2008). 14
75 Fed. Reg. at 35,524-29. 15
EPA, Final Regulatory Impact Analysis (RIA) for the SO2 National Ambient Air Quality Standards (NAAQS), at
5-35, Table 5.14 (2010).
16 42 U.S.C. § 7407(d)(1)(B)(i).

5
in Detroit (“SWHS Monitor”) showed clear violations of the 2010 NAAQS,17
a significant area
of Wayne County was designated as nonattainment for sulfur dioxide.18
Notably, in deciding
boundaries for the nonattainment area, National Emissions Inventory air data compiled by U.S.
EPA showed that the two largest sources of sulfur dioxide in Wayne County were (and are),
DTE’s Trenton Channel and River Rouge facilities, which together emit 80 percent of the area’s
sulfur dioxide pollution.19
The designation of the Wayne County non-attainment area (and 28
other 1-hour SO2 non-attainment areas nationwide) was published in the Federal Register on
August 5, 2013, with an effective date of October 4, 2013.20
In response to this nonattainment designation, MDEQ began collecting and analyzing
monitoring and modeling data from sources of SO2 in the area in order to prepare the required
NSIP.21
The Submitted NSIP sent to EPA by MDEQ on May 31, 2016 and amended on June 30,
2016,22
incorporates several of the affected facilities’ air permits and sets emissions limits for the
US Steel facility via rule change.23
In 2012, the MDEQ found the largest sources of SO2 in the
nonattainment area whose modeled impacts exceeded the new standard to be: Carmeuse Lime,
U.S. Steel, DTE River Rouge power plant, DTE Trenton Channel power plant, and EES Coke.24
Excluding DTE Trenton Channel, all the aforementioned sources of SO2 are located within two
miles of the SWHS monitor, and therefore their combined emissions of tens of thousands of tons
of SO2 each year is heavily concentrated within a relatively small geographic area.25
The dangers posed to human health by sulfur dioxide pollution are especially concerning
in Wayne County, which has been dealing with more than its share of sulfur dioxide and other
pollutants for decades. For example, the Wayne County non-attainment area includes what
University of Michigan scientists have described as the state’s most polluted ZIP code—the
48217 neighborhood.26
This neighborhood, like many others in the area, is surrounded by major 17
EPA, Michigan, Area Designations For the 2010 SO2 Primary National Ambient Air Quality Standard, Technical
Support Document (TSD) 5 (2013), available at https://www.epa.gov/sites/production/files/2016-03/documents/mi-
tsd.pdf , attached as Exhibit 2 (hereinafter “MI Technical Support Document”). 18
The area bounded on the east by the Michigan-Ontario border, on the south by the Wayne County-Monroe County
border, on the west by Interstate 75 north to Southfield Road, Southfield Road to Interstate 94, and Interstate 94
north to Michigan Avenue, and on the north by Michigan Avenue to Woodward Avenue and a line on Woodward
Avenue extended to the Michigan-Ontario border. EPA, Air Quality Designations for the 2010 Sulfur Dioxide (SO2)
Primary National Ambient Air Quality Standard, 78 Fed. Reg. 47,191-02, 47,201 (Aug. 5, 2013) (hereinafter “EPA
SO2 Designations”). 19
MI Technical Support Document at 5-6. The seven major emitting facilities within the State Recommended
Nonattainment Area emit a total of 52,015 tons of SO2 per year. The River Rouge and Trenton Channel are
responsible for 42,113 tons of SO2 emitted per year, or 80.96 percent of the total emissions. Combined, these two
facilities produce more than six times the sulfur dioxide (in tons per year) than the next highest producing facility in
the county. Id.
20 EPA SO2 Designations, 78 Fed. Reg. at 47,191-92.
21 States are required, under the CAA to submit a SIP within 18 months after an area has been designated as a
“nonattainment area” for a new NAAQS. SIPs contain the state’s plan to ensure the area is brought into attainment
within 5 years of its nonattainment designation. Submitted NSIP at 1. 22
Id. at 38. 23
Id. at 42; see also id. at Appendices D, E, G, and H. 24
Id. at i, 4. 25
Id. at 4. 26
Jonathan Oosting, Detroit's 48217 Zip Code is Michigan's Most Polluted, available at
http://www.mlive.com/news/detroit/index.ssf/2010/06/must-read_report_detroits_4821.html
6
industrial facilities, and pollution from these facilities has cumulative and adverse effects. As
documented in U.S. EPA’s technical support document for the Wayne County non-attainment
area designation, those major industrial facilities emitted a total of 55,560 tons of SO2 in 2008,
with 42,113 tons of that pollution coming from the River Rouge and Trenton Channel plants
alone.27
The concentration of a number of large SO2 emitting facilities in a single neighborhood
correlates with the striking prevalence of respiratory disorders in area residents. In 2008,
following an exhaustive survey, the Michigan Department of Community Health (“MDCH”)
coined Detroit “the epicenter of asthma burden in Michigan,” stating that the severity of the
asthma burden in Detroit warrants immediate attention.28
More specifically, MDCH found that
the prevalence of asthma among adults in Detroit was 50% higher than the statewide average.29
Likewise, rates of asthma hospitalization in Detroit (for both children and adults) were found to
be three times higher than that of Michigan as a whole and rates of asthma death over two times
higher compared to overall state numbers.30
The prevalence of asthma in children31
covered by
Medicaid in Detroit was a special focus of MDCH; these children were shown to be 10% more
likely to have persistent asthma32
and 50% more likely to visit the emergency department as a
result of asthma than their statewide counterparts.33
In addition to these persistent adverse health effects, such pollution has been found to
take a toll on educational achievement. Ninety-two schools are located in the nonattainment area.
In 2011, a study conducted by the University of Michigan found that air pollution from industrial
sources near Michigan public schools (including those in the nonattainment area) jeopardizes not
only children’s health, but their academic success, and that minority students bear a
disproportionately high share of the air pollution burden. More particularly, “schools located in
areas with the highest air pollution levels had the lowest attendance rates—a potential indicator
27
MI Technical Support Document at 6.
28 Elizabeth Wasilevich et al., Detroit – The Epicenter of Asthma Burden, Epidemiology of Asthma in Michigan,
MDCH 1 (2008) (emphasis added), available at
https://www.michigan.gov/documents/mdch/14_Ch12_Detroit_Epicenter_of_Asthma_276687_7.pdf 29
Id. 30
Id. 31
Meaning under the age of 18. See id.
32 Persistent asthma is defined according to HEDIS® specifications: in the year of the prevalence measurement year
having (1) ≥4 asthma medication dispensing events OR (2) ≥1 emergency department visits for asthma OR (3) ≥1
hospitalization for asthma OR (4) ≥4 outpatient visits for asthma and ≥2 asthma medication dispensing events. Id. at
2. 33
Id. at 1; The increased air pollution is not just impacting Detroit area communities; it is also drifting into
communities across the Detroit River in Windsor, Ontario. In fact, Ontario estimates that air pollution
results in health costs of near $1 billion per year and has linked poor air quality in Essex County (which
includes Winsor) to at least “260 premature deaths, 900 hospital admissions and 2,750 emergency visits.”
City of Windsor, Ontario, Illness Costs of Air Pollution, available at
http://www.citywindsor.ca/residents/environment/Environmental-Master-Plan/Goal-B-Create-Healthy-
Communities/Pages/Illness-Costs-of-Air-Pollution.aspx (last visited Sept. 7, 2016). One 2005 medical
study even associated short term sulfur dioxide exposure to daily cardiac hospital admissions for people
over the age of 65 living in Windsor. Karen Y. Fung et al., Air Pollution and Daily Hospital Admissions
for Cardiovascular Diseases in Windsor, Ontario, Canada J. Pub. Health 29-33 (Jan.-Feb. 2005), available
at http://www.ncbi.nlm.nih.gov/pmc/articles/PMC2919554/.

7
of poor health—and the highest proportions of students who failed to meet state educational
testing standards.”34
Based on Detroit Public Schools School Nurse Monthly Reports, 18 percent
of students have physician-diagnosed asthma, and an estimated 7-10 percent of students have
undiagnosed asthma. During the 2003-2004 school year, nurses handled three to five life-
threatening asthma episodes per month.35
The Detroit Alliance for Asthma Awareness lists
asthma as the leading chronic condition causing school absenteeism in Detroit, as well as the
leading cause of preventable hospitalizations for children under 18.36
Furthermore, schools
located in the most polluted zones also had the highest percentage of minority students – 81.5%
of African American students and 62.1% of Hispanic students attended school in places ranked
in the top 10% for dirtiest air in the state – only 44.4% of white children experienced the same.
II. The Clean Air Act’s Non-Attainment State Implementation Plan Requirements
The designation of a portion of Wayne County as non-attainment for the 1-hour SO2
NAAQS triggered a requirement for MDEQ to submit to EPA a non-attainment state
implementation plan (“NSIP”) that sets forth emission limits and other provisions for bringing
the area into attainment with the NAAQS.37
Pursuant to the relevant Clean Air Act provisions,
such NSIP must comply with four basic requirements (among others):
The NSIP must “provide for attainment” of the NAAQS “as expeditiously as
practicable,” but in any event within five years of the nonattainment designation.38
The NSIP must require “the implementation of all reasonably available control measures
[“RACM”] … including such reductions in emissions from existing sources in the area as
may be obtained through the adoption, at a minimum, of reasonably available control
technology [“RACT”];”39
The NSIP must demonstrate that the emissions reductions are “enforceable;”40
and
MDEQ must submit an NSIP to EPA for approval within eighteen months of the non-
attainment area designation.41
34
Paul Mohai et al., Air Pollution Around Schools Is Linked To Poorer Student Health And Academic
Performance, Health Affairs vol. 30, no. 5, 852-62 (May 2011), available at
http://content.healthaffairs.org/content/30/5/852.full.pdf+html.
35 American Lung Association, Detroit, Michigan: Extensive Team Effort throughout an Urban System, available at
http://www.lung.org/lung-disease/asthma/creating-asthma-friendly-environments/asthma-in-schools/open-airways-
for-schools/success-stories/detroit-michigan.html? (last visited Sept. 30, 2015). 36
Asthma Initiative of Michigan, Detroit Alliance for Asthma Awareness: Detroit Asthma Statistics, available at
http://getasthmahelp.org/detroit-alliance-for-asthma-awareness.aspx (last visited Sept. 7, 2016). 37
42 U.S.C. § 7514(a). 38
Id. § 7514a. 39
42 U.S.C. § 7502(c)(1). 40
42 U.S.C. § 7410(a)(2)(A) 41
Id. § 7514(a).
8
Given that the Wayne County non-attainment area designation was effective as of
October 4, 2013, MDEQ’s deadline for submitting an NSIP to EPA was April 6, 2015. Given
that MDEQ failed to timely submit an NSIP that meets the minimum criteria established by the
Clean Air Act, U.S. EPA is required to issue a FIP within two years if the state does not correct
the deficiency.42
After the FIP clock begins running, “EPA is not obliged to wait two years or
postpone its action even a single day: The Act empowers the Agency to promulgate a FIP ‘at any
time’ within the two-year limit.”43
EPA’s Guidance for 1-Hour SO2 Nonattainment Area SIP Submissions further clarifies
the steps a regulatory agency must take to develop a compliant NSIP.44
In particular, EPA
specifies that “for attainment demonstrations for the 2010 SO2 NAAQS, the air agency should
demonstrate future attainment and maintenance of the NAAQS in the entire area designated as
nonattainment (i.e., not just at the violating monitor) by using air quality dispersion modeling
(see Appendix W to 40 CFR part 51) to show that the mix of sources and enforceable emission
rates in an identified area will not lead to a violation of the SO2 NAAQS.” (emphasis added)45
The EPA NSIP Guidance further states that an “approvable attainment demonstration
would be an air quality modeling analysis that demonstrates that the emission limits in the plan
will suffice to provide for timely attainment of the affected standard,” using “allowable
emissions.”46
MDEQ must submit an NSIP that demonstrate the NAAQS will be met at all locations in
the nonattainment area while sources are operating up to their legally permissible rate; i.e.,
allowable” emissions. As MDEQ correctly elaborated in its Draft NSIP:
“To meet the requirements for an attaining SIP, the MDEQ must show via dispersion
modeling that the SWHS monitor will meet the NAAQS and no other areas in the
nonattainment area will violate the NAAQS. This analysis must use allowable emissions in
the modeling. That is, the highest combined impact point, called a “hotspot,” resulting from
overlapping emission impacts should be reduced to meet the NAAQS.”47
While MDEQ identified the appropriate requirements, it unfortunately failed to develop a plan
that complies with those requirements, as discussed in Section IV, below.
42
Id. § 7410(c)(1). 43
EPA v. EME Homer City Generation, L.P., 134 S. Ct. 1584, 1601 (2014). 44
EPA Office of Air Quality Planning and Standards, Guidance for 1-Hour SO2 Nonattainment Area SIP
Submissions (Apr. 23, 2014), available at
http://www.epa.gov/oaqps001/sulfurdioxide/pdfs/20140423guidance.pdf (hereinafter “EPA NSIP Guidance”). 45
Id. at 11-12. 46
Id. at 9-10. 47
MDEQ, Air Quality Division, Proposed Sulfur Dioxide One-Hour National Ambient Air Quality Standard State
Implementation Plan, at iv (Aug. 20, 2015) (hereinafter “Draft NSIP”).
9
III. MDEQ Continually Places the Wishes of Regulated Entities Over Mandating
Actions That Are Necessary to Protect Public Health.
MDEQ’s response to the designation of Wayne County as non-attainment for the 1-hour
SO2 NAAQS has substantially weakened over time. First, in the spring and summer of 2014,
MDEQ proposed to address each of the major SO2 sources in the non-attainment area in a single
comprehensive plan. The resulting June 2014 Draft included proposed 1-hour SO2 limits for six
major sources in Wayne County and would have come very close to demonstrating compliance
with the 1-hour SO2 NAAQS. Sometime in late 2014, however, MDEQ appears to have
abandoned the June 2014 Draft and, instead, has piecemealed the NSIP process through
individual permit modifications that reflect what emitters are voluntarily willing to accept for the
various sources of SO2 pollution. This latter approach does not produce a nonattainment plan that
meets the minimum criteria established by law.
A. The June 2014 Draft
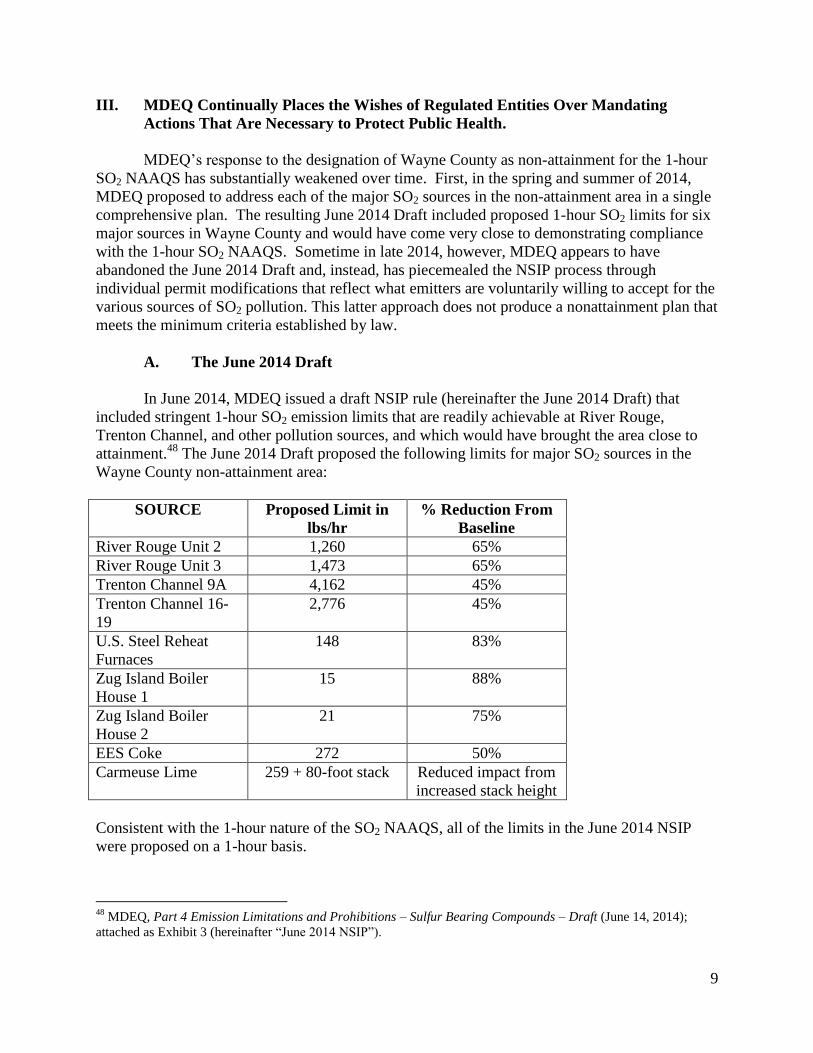
In June 2014, MDEQ issued a draft NSIP rule (hereinafter the June 2014 Draft) that
included stringent 1-hour SO2 emission limits that are readily achievable at River Rouge,
Trenton Channel, and other pollution sources, and which would have brought the area close to
attainment.48
The June 2014 Draft proposed the following limits for major SO2 sources in the
Wayne County non-attainment area:
SOURCE Proposed Limit in
lbs/hr
% Reduction From
Baseline
River Rouge Unit 2 1,260 65%
River Rouge Unit 3 1,473 65%
Trenton Channel 9A 4,162 45%
Trenton Channel 16-
19
2,776 45%
U.S. Steel Reheat
Furnaces
148 83%
Zug Island Boiler
House 1
15 88%
Zug Island Boiler
House 2
21 75%
EES Coke 272 50%
Carmeuse Lime 259 + 80-foot stack Reduced impact from
increased stack height
Consistent with the 1-hour nature of the SO2 NAAQS, all of the limits in the June 2014 NSIP
were proposed on a 1-hour basis.
48
MDEQ, Part 4 Emission Limitations and Prohibitions – Sulfur Bearing Compounds – Draft (June 14, 2014);
attached as Exhibit 3 (hereinafter “June 2014 NSIP”).

10
As discussed in the attached 2015 expert report from Dr. Andrew Gray (hereafter referred
to as Dr. Gray 2015 Report), MDEQ’s own AERMOD modeling revealed that the limits
proposed in the June 2014 draft would have gotten Wayne County close to attainment, with SO2
concentrations at the peak cumulative hotspot falling from a baseline of 362.1 ppb to 78.7 ppb,
which is over the limit of 75 ppb.49
A few minor improvements to the June 2014 Draft would
enable the plan to demonstrate compliance with the 1-hour SO2 NAAQS.
B. MDEQ’s August 2015 Draft NSIP
Rather than continue to promulgate the June 2014 Draft, however, MDEQ changed
direction. MDEQ contends that the June 2014 Draft was merely a “backstop” created in order to
encourage polluters to voluntarily commit to the needed reductions, and that its proposed NSIP
was based on the level of voluntary commitments it was able to secure.50
Internal
correspondence between MDEQ and the regulated entities shows those entities were not willing
to agree to the limits proposed in the June 2014 Draft, and that MDEQ accepted both the
regulated entities’ proposed limits as well as the method by which those entities wanted those
limits to be incorporated into the SIP.51
Under its new approach, MDEQ added new SO2 limits to
permits for individual sources, and proposed to incorporate the SO2 limits from the modified
permits into its 2015 Draft Plan. MDEQ’s August 2015 Draft NSIP made the following changes
from the June 2014 Draft:52
The proposed emission limits for River Rouge increased approximately 45% compared
to the June 2014 NSIP, to a combined emissions limit of 3,980 lbs/hour for Units 2 and
3.
For Trenton Channel, MDEQ proposed a limit of 5,907 lbs/hr for all five boilers
combined, while the June 2014 Draft would have had a separate limit for Unit 9A than
for the other four boilers. Given that DTE has announced its plan to shut down Units 16-
19, the net result was to increase the limit for Unit 9A from the 4,162 lbs/hr proposed in
the June 2014 NSIP to 5,907 lbs/hr.
The emission limits for River Rouge and Trenton Channel were based on a 720-hour
rolling average, rather than a 1-hour basis.
The August 2015 Draft NSIP limits, when modeled, revealed a maximum cumulative hotspot of
98.1 ppb, with a hotspot at the SWHS monitor of 87.6 ppb.53
49
Dr. H. Andrew Gray, Comments on MDEQ’s Proposed Sulfur Dioxide One-Hour National Ambient Air Quality
Standard State Implementation Plan (dated August 20, 2015), at 3 (Oct. 5, 2015), attached as Exhibit 4 (hereinafter
“Dr. Gray 2015 Report”). 50
MDEQ Email Communications at 9 (Email from Robert Irvine, Envtl. Manager, Strategy Dev. Unit, MDEQ Air
Quality Division, to Jeffrey Korniski, “RE: Update on DTE - River Rouge & Trenton Channel” (Nov. 3, 2014 11:25
AM), attached as Exhibit 5 (hereinafter “MDEQ Emails”). 51
Id. at 7-8 (Email from Robert Irvine to Melissa Byrnes, “RE: Update on DTE – River Rouge & Trenton Channel
(Oct. 31, 2014 4:10 PM). (“It appears at this point that we will be accepting the values [DTE is] proposing….”). 52
Draft NSIP at 7-12. 53
Id. at 37.
11
C. MDEQ’s Submitted NSIP
On May 31, 2016, MDEQ submitted to the U.S. EPA for review and approval Michigan’s
2010 Sulfur Dioxide One-Hour National Ambient Air Quality Standard Nonattainment State
Implementation Plan for Wayne County (partial).54
The May 2016 submittal contained the final
NSIP requirements for all emitters except for U.S. Steel.55
On June 30, 2016, MDEQ submitted
an Addendum to Michigan State Implementation Plan (SIP) submittal for Michigan's 2010
National Ambient Air Quality Standard (NAAQS) Sulfur Dioxide (SO2) Nonattainment Area.
This addendum contains final Rule 430 (Appendix E), which is the SO2 control plan for U.S.
Steel.56
The Submitted NSIP differs from the August 2015 Draft NSIP in three main ways. First,
MDEQ revised the meteorological data that was used in the modeling.57
In its 2014 Draft and
2015 Draft NSIP, MDEQ used meteorological data from the Detroit airport from 2010-2012.58
In
the Submitted NSIP, MDEQ used meteorological data from the same airport but for years 2010-
2014.59
Modeling of the base case emissions from the 2008-2012 data resulted in a design value
concentration of 355 parts per billion.60
The new meteorological data resulted in a design value
of 337 parts per billion.61
Second, MDEQ used a lower background concentration in the modeling, described in
detail below.62
Specifically, the August 2015 Draft NSIP (as well as the 2014 Draft), used a
background concentration of 15 ppb.63
This was based on measured concentration data from the
Allen Park monitor.64
MDEQ arbitrarily adjusted this background concentration value, without
any explanation.65
The air dispersion modeling that supports the Submitted NSIP arbitrarily
adjusts this number down so that the background concentration is 12 ppb.66
If MDEQ had used
the same background concentration that it used in the June 2014 Draft and the August 2015 Draft
NSIP, its modeling would not have shown attainment.67
54
MDEQ, Sulfur Dioxide One-Hour National Ambient Air Quality Standard Nonattainment State Implementation
Plan for Wayne County (partial) (May 31, 2016). 55
Id.; see also Letter from Keith Creagh, MDEQ Director, to Robert Kaplan, Acting Administrator, EPA, Region 5
(June 30, 2016), available at http://www.michigan.gov/documents/deq/deq-aqd-sip-
wayne_county_so2_cover_letter_addendum_528406_7.pdf#page=1. 56
Id. 57
Dr. Gray 2016 Report at 1. 58
Id. 59
Id. 60
Id. 61
Id. 62
Id. at 2. 63
Id. 64
Id. 65
Id. at 7 66
Id. at 2. 67
Id. at 2-3.
12
Third, MDEQ included additional emission limitations that MDEQ has incorporated into
Renewable Operating Permits and Permits to Install for certain facilities.68
Specifically, MDEQ
required the River Rouge plant to reduce its emissions by 45%, which simply reflects DTE’s
announced plan to shut down River Rouge unit 2.69
For Trenton Channel, MDEQ has kept the
same limit that was in the 2015 Draft NSIP of 5,907 lbs/hr for all five boilers combined even
though the company has retired four of those boilers.70
Finally, MDEQ required the Carmeuse
Lime facility to increase its stack height to 120 feet.71
IV. MDEQ’s Submitted NSIP Fails to Satisfy the Clean Air Act.
MDEQ contends that its Submitted NSIP describes the “control strategies [voluntarily]
adopted by the affected companies, and how these controls” will bring the area into attainment.
But the source emissions limits included in the Submitted Plan —particularly those for the River
Rouge and Trenton Channel coal-fired power plants—are inadequate to achieve attainment, as
shown by Dr. Gray’s 2016 Report.72
Moreover, the Plan contains several other fatal flaws,
including MDEQ’s failure to establish 1-hour emissions limits or to set supplemental standards
that will ensure the 720-hour averaging times will not lead to substantial violations of the
NAAQS and its failure to establish that the proposed emissions limits are permanent and
enforceable.73
A. The Draft NSIP Does Not Provide for Attainment.
Under the Clean Air Act, MDEQ must submit an NSIP that “provides for attainment” of
the NAAQS “as expeditiously as practicable,” but in any event within five years of the
nonattainment designation.74
Such NSIP is further required to include “enforceable emission
limitations, and such other control measures, means or techniques . . . as may be necessary or
appropriate to provide for attainment . . . .”75
While the Submitted Plan includes emission limits,
those limits are insufficient to provide for attainment.
1. MDEQ Fabricated its Attainment Demonstration by Arbitrarily Lowering the
Background Concentration of SO2 to the Exact Level that Would Show
Attainment.
A fundamental flaw with MDEQ’s Submitted NSIP is that the MDEQ arbitrarily and
erroneously changed a key assumption, the background SO2 concentration level, in its AERMOD
modeling.76
This change allowed MDEQ to fabricate attainment results as the arbitrarily changed
68
Id. at 1-2. 69
Id. at 1. 70
Id. at 2. 71
Id. 72
Id. at 2-15 73
Id. at 16-22. 74
42 U.S.C. § 7514a. 75
42 U.S.C. § 7502(c)(6). 76
Dr. Gray 2016 Report at 2-9.
13
background level of SO2 brought the modeling results to just under the federal standard.77
Had
MDEQ continued to use the previous and correct background concentration, the modeling would
have showed that three hotspots will still persist under its Submitted NSIP – i.e., areas in which
air quality modeling demonstrates that SO2 concentrations would remain above the 1-hour SO2
NAAQS standard of 75 ppb.78
As MDEQ acknowledges,
[t]o meet the requirements for an attaining SIP, the MDEQ must show via
dispersion modeling that the SWHS [Southwestern High School] monitor will
meet the NAAQS and no other areas in the nonattainment area will violate the
NAAQS. This analysis must use allowable emissions in the modeling. That is, the
highest combined impact point, called a “hotspot,” resulting from overlapping
emission impacts should be reduced to meet the NAAQS.79
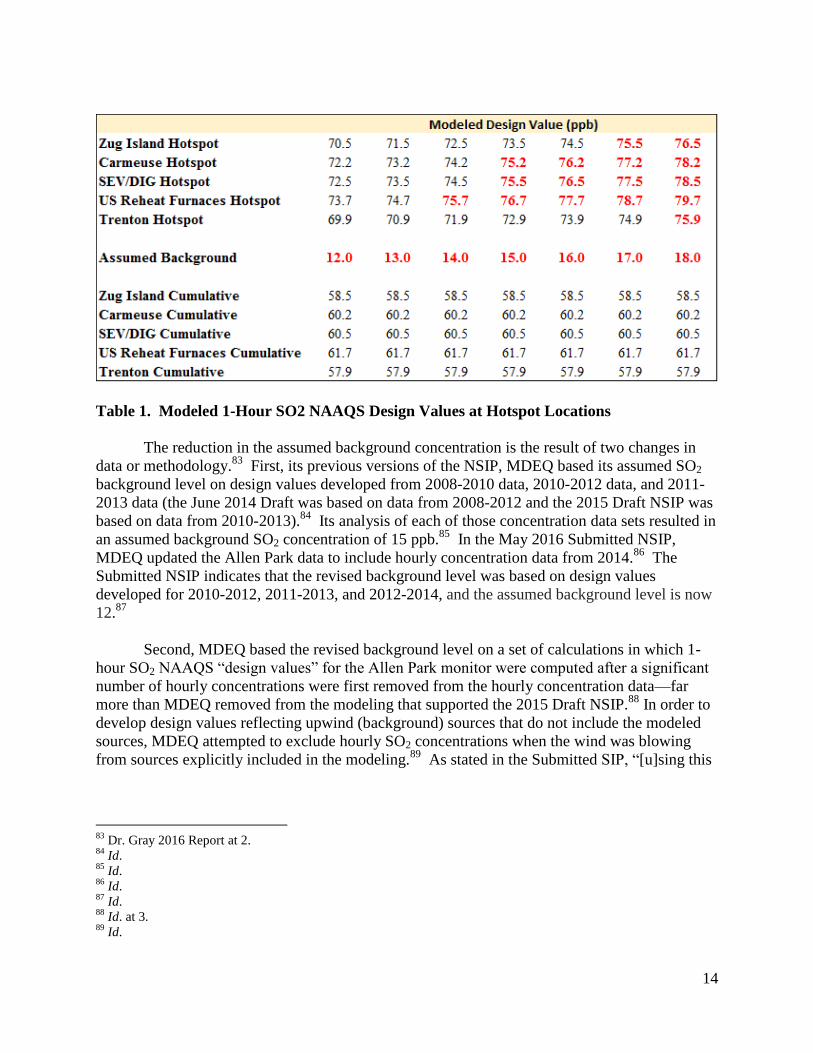
As explained in his expert report, attached as Exhibit 1, Dr. Gray reviewed the AERMOD
modeling conducted by MDEQ of its Submitted Plan. Dr. Gray’s review confirmed that the
modeled design value, which represents the highest cumulative hotspot, for the limits proposed
under the Draft Plan is 73.7 ppb, just below the 1-hour SO2 NAAQS limit of 75 ppb.80
MDEQ
reduced the assumed background concentration from 15 to 12 ppb.81
Using the 15 ppb
background level, but otherwise including the updated emission limits and meteorological data,
demonstrates nonattainment at three of the hotspot locations.82
77
Id. at 2-3. 78
Id. 79
Draft NSIP at iv, v; see also EPA NSIP Guidance at 11-12 (stating that “…for attainment demonstrations for the
2010 S02 NAAQS, the air agency should demonstrate future attainment and maintenance of the NAAQS in the
entire area designated as nonattainment (i.e., not just at the violating monitor) by using air quality dispersion
modeling (see Appendix W to 40 CFR part 51) to show that the mix of sources and enforceable emission rates in an
identified area will not lead to a violation of the SO2 NAAQS.”). 80
Dr. Gray 2016 Report at 3, Table 1 (“Modeled 1-Hour SO2 NAAQS Design Values at Hotspot Locations”). 81
Id. at 2. 82
Id. at 2-3; see also id. at 3, Table 1.
14
Table 1. Modeled 1-Hour SO2 NAAQS Design Values at Hotspot Locations
The reduction in the assumed background concentration is the result of two changes in
data or methodology.83
First, its previous versions of the NSIP, MDEQ based its assumed SO2
background level on design values developed from 2008-2010 data, 2010-2012 data, and 2011-
2013 data (the June 2014 Draft was based on data from 2008-2012 and the 2015 Draft NSIP was
based on data from 2010-2013).84
Its analysis of each of those concentration data sets resulted in
an assumed background SO2 concentration of 15 ppb.85
In the May 2016 Submitted NSIP,
MDEQ updated the Allen Park data to include hourly concentration data from 2014.86
The
Submitted NSIP indicates that the revised background level was based on design values
developed for 2010-2012, 2011-2013, and 2012-2014, and the assumed background level is now
12.87
Second, MDEQ based the revised background level on a set of calculations in which 1-
hour SO2 NAAQS “design values” for the Allen Park monitor were computed after a significant
number of hourly concentrations were first removed from the hourly concentration data—far
more than MDEQ removed from the modeling that supported the 2015 Draft NSIP.88
In order to
develop design values reflecting upwind (background) sources that do not include the modeled
sources, MDEQ attempted to exclude hourly SO2 concentrations when the wind was blowing
from sources explicitly included in the modeling.89
As stated in the Submitted SIP, “[u]sing this
83
Dr. Gray 2016 Report at 2. 84
Id. 85
Id. 86
Id. 87
Id. 88
Id. at 3. 89
Id.
15
methodology, the spreadsheet ignores all hours (and associated preceding hour) when the wind
direction is between 40 degrees and 205 degrees.”90
For the August 2015 Draft NSIP, MDEQ’s modeling excluded angle range was between
40 and 180 degrees.91
For the Submitted SIP, MDEQ changed the excluded wind direction range
to 40-205 degrees. MDEQ provided absolutely no explanation for the change.92
Examination of
the pollution roses, as described in Dr. Gray’s report, for Allen Park shows that 40-180 degrees
is the appropriate range to use in order to exclude impacts from the large sources included in the
model and that use of a larger range does not exclude impacts from other large modeled sources.
Changing the range of excluded angles from 40-180 degrees to 40-205 degrees had a
significant effect on the resulting background SO2 design values for 2010-2012 and 2011-2013.
Using the previous 40-180 degree range for excluded angles resulted in average design values of
15 ppb for 2010-2012 and 14 ppb for 2011-2013, either of which results in hotspots not attaining
the federal standard.93
There are three reasons why MDEQ’s unexplained exclusion of more angles is
inappropriate. First, as shown in Figures 1 and 2 from Dr. Gray’s 2016 Report, the most recent
pollution rose (2015) for Allen Park appears to show even less of a tendency for high SO2
concentrations to be associated with wind directions greater than 180 degrees than during earlier
years (2012-2014).94
The pollution roses in Figures 1 and 2 clearly demonstrate that excluding
wind directions between 40 and 180 degrees will sufficiently exclude impacts from the large
sources located to the southeast of the Allen Park monitor (Trenton and/or Monroe).95
Second, there is an inherent problem with MDEQ’s methodology. The nature of the 1-
hour SO2 NAAQS requires that peak (99th
percentile) daily values be used both for the modeled
design values and for determination of the appropriate background levels.96
Excluding hours in
which the wind direction angle may include impacts from the modeled sources necessitates
removing most of the highest concentrations recorded at Allen Park.97
The background design
value is then determined as the 4th
highest remaining daily peak 1-hour concentration.98
90
Submitted NSIP at 21. 91
Dr. Gray 2016 Report at 3. 92
Id. at 7; See also, e.g., Encino Motorcars, LLC v. Navarro, 136 S. Ct. 2117, 2125–26 (2016) (“When an agency
changes its existing position, it ‘need not always provide a more detailed justification than what would suffice for a
new policy created on a blank slate.’ But the agency must at least ‘display awareness that it is changing position’
and ‘show that there are good reasons for the new policy.’ In explaining its changed position, an agency must also
be cognizant that longstanding policies may have ‘engendered serious reliance interests that must be taken into
account.’‘In such cases it is not that further justification is demanded by the mere fact of policy change; but that a
reasoned explanation is needed for disregarding facts and circumstances that underlay or were engendered by the
prior policy.’ It follows that an ‘[u]nexplained inconsistency’ in agency policy is ‘a reason for holding an
interpretation to be an arbitrary and capricious change from agency practice.’”) (internal citations omitted) 93
Dr. Gray 2016 Report at 3. 94
Id. at 4, 7. 95
Id. 96
Id. at 7. 97
Id. 98
Id.
16
As an example, the design value (99th
percentile daily peak) of the complete Allen Park
data set was 40 ppb during 2013 (and the maximum hourly concentration was 66 ppb), whereas
the design value (99th
percentile) concentration was only 16 ppb after concentrations from 111
days were removed by excluding wind directions between 40 and 205 degrees.99
Days were
excluded if less than 8 hours during the day had valid concentrations (concentrations were valid
if the wind direction in that hour and the preceding hour was not between 40 and 205 degrees).
The maximum hourly concentration in the resulting distribution (after 111 days were excluded)
was 24 ppb, which was the 17th
highest daily peak concentration in the original unaltered data
set.100
The design value (approximately the 4th
highest daily peak) of the remaining data (16
ppb) would be the 44th
highest daily peak in the original unaltered data.101
The remaining
distribution of the lower concentrations at Allen Park cannot reliably be used to represent the 99th
percentile (peak impact) of the background level.102
Finally, expanding the range of excluded angles creates too much uncertainty to represent
a reasonable approach.103
The three-year average (2012-2014) design values for various excluded
wind direction ranges were plotted by Dr. Gray, see Figure 1 below.104
The plot shows the three-
year average design value for each pair of lower excluded angle (along the right axis) and upper
excluded angle (along the lower axis).105
The plot illustrates the sensitivity of the background
design value to the selection of the excluded angle range.106
This further demonstrates that
MDEQ’s selection of 40-205 degrees results in a highly uncertain estimate for the background
level.
99
Id. at 8. 100
Id. 101
Id. 102
Id. 103
Id. at 9. 104
Id. 105
Id. 106
Id.

17
Figure 1. Average Background SO2 Design Values for 2012-2014 Using Allen Park
Concentration Data with Varying Excluded Wind Direction Angles
2. MDEQ Has Failed to Account For the 1-Hour Basis of the SO2
NAAQS in Proposing Emission Limits with Far Longer Averaging
Times.
A second major deficiency with the limits in the Submitted NSIP is that they are set on a
720-hour rolling average basis, rather than on a 1-hour basis. As Dr. Gray explains, given that
the SO2 NAAQS is a 1-hour standard, the only way to fully ensure compliance with the 1-hour
NAAQS would be to also limit emissions on an hourly basis at an emission rate that
demonstrates attainment when modeled.107
This is because averaging an SO2 limit over a longer
period of time would allow for spikes in emissions that could cause exceedances of the 1-hour
NAAQS. MDEQ initially recognized the need for 1-hour SO2 limits in its June 2014 Draft,108
but
has now removed that aspect of the limits in its final proposal.
Even assuming that the limits in the Submitted NSIP were numerically adequate—which,
as discussed above, they are not—allowing such limits to be averaged over a 720-hour timeframe
would likely permit violations of the 1-hour SO2 NAAQS because hours of excess emissions that
cause violations of the NAAQS could be balanced out with hours of operation below emission
107
Dr. Gray 2016 Report at 16. 108
June 2014 NSIP.
18
limits.109
Such a result would contravene the very basis for U.S. EPA’s promulgation of the 1-
hour SO2 standard—its recognition that there is a causal relationship between respiratory
morbidity and short-term (5-minutes to 24-hours) exposure to SO2 and acknowledgment that
even five minute emission peaks can result in adverse respiratory effects.110
Given the
demonstrated negative effects of even short-term exposure to elevated SO2 levels, and the
establishment of a 1-hour NAAQS, 1-hour emission limits are needed to ensure that compliance
is attained.111
It is true that EPA recently concluded in its guidance regarding 1-hour SO2 NSIPs that
emission limit averaging times of up to 30 days may be permissible under certain conditions and
upon meeting added burdens.112
Most significantly, EPA guidance provides that “any emissions
limits based on averaging periods longer than 1 hour” must be commensurately lower so as to
have “comparable stringency to a 1-hour average limit,” and then sets forth a detailed
methodology for calculating the downward adjustment needed to convert a 30-day limit to a 1-
hour limit of “comparable stringency.”113
But even assuming, for the sake of argument, that
emission limits based on a 720-hour averaging time could demonstrate attainment with a 1-hour
NAAQS, the limits in the Submitted NSIP do not do so because MDEQ failed to ensure that the
720-hour emission limits are of comparable stringency to the 1-hour limits that are needed to
achieve attainment. As explained by Dr. Gray in his 2016 report, while MDEQ purported to
adjust the proposed 720-hour limits for River Rouge and Trenton Channel to higher 1-hour
emission rates for purposes of carrying out the air quality modeling of the Submitted NSIP, the
agency’s calculation and application of the adjustment ratio was flawed in a number of critical
ways.
First, in addition to using an adjustment ratio, EPA also recommends that the regulatory
agency evaluate how frequently the longer averaging time will result in exceedances of the
NAAQS, but MDEQ has not done so.114
EPA’s guidance states:
“[T]he EPA believes that air agencies that use longer term average limits should provide
additional justification for the application of such limits. The EPA expects to consider
the following factors in evaluating the adequacy of plans with limits based on longer
averaging times: (1) whether the numerical value of the mass emissions limit averaged
over a longer time is comparably stringent to a 1-hour limit at the critical emission value;
and (2) whether the longer term average limit, potentially in combination with other
limits, can be expected to constrain emissions sufficiently so that any occasions of
109
Dr. Gray 2016 Report at 16-22. 110
See 75 Fed. Reg. at 35,525-26. 111
See, e.g., In re: Mississippi Lime Co., 2011 WL 3557194, at *26-27 (U.S. EAB Aug. 9, 2011) (holding that SO2
emission limits should be based on hourly averaging times and rejecting an agency’s attempt to use a 3-hour
averaging time because “[e]mission limits should be based on concentration estimates for the averaging time that
results in the most stringent control requirements. 40 C.F.R. pt. 51, app. W, § 10.2.3.1.a.”) 112
EPA NSIP Guidance at 22-36. 113
Id. at 24-25. 114
EPA NSIP Guidance at 28.

19
emissions above the critical emission value will be limited in frequency and magnitude
and, if they occur, would not be expected to result in NAAQS violations."115
EPA further clarified that:
“EPA’s general expectation [is] that, if periods of hourly emissions above the critical
emission value are a rare occurrence at a source, particularly if the magnitude of the
emissions is not substantially higher than the critical emissions value, these periods
would be unlikely to have a significant impact on air quality, insofar as they would be
very unlikely to occur repeatedly at the times when the meteorology is conducive for high
ambient concentrations of SO2.”116
Even assuming that such longer averaging times could be appropriate in certain
circumstances, MDEQ has made no effort to evaluate whether the magnitude and frequency of
periods of hourly emissions above the critical emissions value are likely to occur with the 720-
hour averaging times. Instead, MDEQ simply derived an adjustment ratio based on historical
data between peak 1-hour average and peak 720-hour average emission rates.117
Second, even if it were acceptable for MDEQ to rely only on an adjustment ratio, the
agency failed to properly apply the ratio for River Rouge Unit 3.118
The most recent permit for
River Rouge includes a 720-hour SO2 emission rate limit for Unit 3 of 2,300 pounds per hour.
For its attainment demonstration, MDEQ modeled an hourly rate of 2,517.3 lb/hr, which is
equivalent to a ratio of 1.09.119
In other words, the proposed permitted 720-hour emission limit
was only scaled by 1.09 when determining the appropriate adjusted hourly emission rates for
River Rouge Unit 3 to plug into the model.120
This is inaccurate. But according to MDEQ’s
own calculations using the 43 months of data (Jan 2011 – July 2014), the adjustment ratio for
River Rouge should have been 1.18.121
While MDEQ’s methodology for identifying the 1.18
adjustment ratio is flawed as discussed further below, even using that 1.18 ratio, the agency
should have set the River Rouge Unit 3 720-hour emission limit at 2,133.3 lbs (which is
2,517.3/1.18), or modeled River Rouge Unit 3 with an hourly rate of 2,714 lb/hr ( = 2,300
*1.18).122
Failure to use the right ratio decreased the modeled impacts from this facility by
approximately 8 percent.123
Third, MDEQ’s methodology for calculating the adjustment ratio does not account for
the potential variability in Trenton Channel and River Rouge’s operating patterns.124
The ratio
that MDEQ uses represents the historical statistical relationship of the operating patterns and
115
Id. at 27-28. 116
Id. at 24. 117
Dr. Gray 2016 Report at 16. 118
Id. 119
Id. 120
Id. at 17. 121
Id. 122
Id. 123
Id. 124
Id.
20
provides an estimate of the 1-hour max given an observed 720-hour average. Using 43 months of
data, MDEQ found 1-hour/720-hour ratios of 1.18 (River Rouge) and 1.15 (Trenton Channel).125
Dr. Gray examined the 2014 hourly emission data for River Rouge and found that the ratios of
the 99th percentiles for the 1-hour and 720-hour rolling averages of 1.32 (Unit 2) and 1.44 (Unit
3).126
To show the impact of using the more appropriate 99th
percentile data in calculating the
adjustment ratios, Dr. Gray modeled River Rouge Unit 3 impacts using the hourly/720-hour
average ratio from the 2014 data of 1.44 and found that MDEQ would have either needed to set a
720-hour emission limit of 1,748 lbs (=2,517.3/1.44), or modeled River Rouge Unit 3 with an
hourly emission rate of approximately 3,312 lb/hr, which is 32 percent greater than the rate
MDEQ actually modeled (2,517.3 lb/hr).127
Increasing the modeled impacts from River Rouge
by 32 percent (the SO2 impacts are proportional to the modeled emission rates) would increase
the overall modeled SO2 design value concentrations above the nonattainment threshold (even
using MDEQ’s new arbitrary background level of 12 ppb).128
Fourth, and most importantly, Dr. Gray conclusively showed that MDEQ’s methodology
does not effectively provide ANY limit for the hourly emission rate at the area’s largest sources,
Trenton Channel and River Rouge.129
To demonstrate that the 720-hour averaging times provide
essentially no limit, Dr. Gray examined the River Rouge plant. The 2014 emission data for River
Rouge shows many “down” periods for each unit, in which the emission rate was zero for
multiple hours and often for multiple days on end. For instance, Unit 2 recorded non-zero
emissions for only 60 percent of the hours during 2014, and Unit 3 recorded non-zero emissions
for 79 percent of the total hours.130
The result is that most of the 720-hour averages consist of far
less than 720 hours of actual unit operation. For example, only 14 percent of the 720-hour
rolling average emission rates for Unit 2 consisted of all 720 non-zero values, and only 20
percent of the 720-hour averages for Unit 3 consisted of all 720 non-zero values.131
For Unit 2,
39 percent of the 720-hour rolling averages during 2014 consisted of less than 540 non-zero
hours (i.e., more than 180 hours were zero).132
For Unit 3, 35 percent of the 720-hour rolling
averages during 2014 consisted of less than 540 non-zero hours.133
During these periods, the “effective” hourly emission rate limit is increased because
emissions during times of operation are averaged for at least part of the 720 hours against times
of zero emissions because the unit is not operating.134
The result is that by allowing non-
operating hours to be factored into the 720-hour average, there is almost no limit (or at least an
extremely high limit) being placed on the individual one-hour averages.135
Mathematically, the
hourly average emission rates during those hours when the unit is operating are NOT constrained
125
Id. 126
Id. 127
Id. 128
Id. at 17-18. 129
Id. at 18. 130
Id. 131
Id. 132
Id. 133
Id. 134
Id. 135
Id.
21
to be lower than 1.15 times the 720-hour permitted rate (or whatever conversion ratio was used).
For example, during a 720-hour period in which River Rouge Unit 3 was not operating for 120
hours, the remaining hours could emit up to 2,760 lb/hr for every remaining hour, and still meet
the 720-hour rolling average permit limit of 2,300 lb/hr.136
Yet in its modeling, MDEQ used an
hourly modeled rate for Unit 3, which is supposed to represent the maximum hourly emission
rate, of 2,517.3 lb/hr.137
As such, using only the 720-hour standard, one can easily show that the
hourly emission rate can exceed a level that would cause exceedances of the one-hour NAAQS
sufficiently often (i.e., more than 3 times per year) to be in non-attainment, despite meeting the
requirements of the 720-hour permit.138
To truly highlight the fallacy that a 720-hour average could actually ensure compliance
with the 1-hour NAAQS, Dr. Gray “modified” the River Rouge Unit 3 hourly emission data by
randomly inserting 25 extremely high hourly average emission rates (10,000 lb/hr) throughout
the data set.139
The maximum hourly average emission rate in the original 2014 data was 3,861
lb/hr, and the maximum 720-hour rolling average was 2,361 lb/hr.140
After inserting the 25 high
hourly emission rate values of 10,000 lb/hr, the maximum 720-hour rolling average (2,361 lb/hr)
was completely unchanged.141
In other words, this facility would still demonstrate compliance
with the 720-hour emission limit, despite including numerous episodes significantly above the
acceptable maximum hourly emission rate.142
In order to reduce the inadequacy of a 720-hour limit in achieving attainment with a 1-
hour standard, MDEQ must, at a minimum, provide that the permits for River Rouge Unit 3 and
Trenton Channel Unit 9 only allow the permittee to include hours when the unit is actually
operating and emitting non-zero levels of pollution in calculating the 720-hour average emission
rate and demonstrating compliance with the 720-hour average emission limit at each unit.143
Such an approach would not fully address the ineffectiveness of a 720-hour average permitted
emission rate in limiting peak hourly emissions, but it would at least help lower actual emissions
to a rate somewhat closer to the hourly rate assumed in MDEQ’s modeling.144
B. The Submitted NSIP Does Not Provide for Enforceable Limits as Key
Elements are Included in Permits and Not the NSIP Itself.
According to EPA’s guidelines, the NSIP “should provide for attainment of the standard
based on SO2 emission reductions from control measures that are permanent and enforceable.”145
Yet there is reason to question whether the proposed limits for all of the sources other than U.S.
Steel would meet this standard. MDEQ incorporates into the Submitted NSIP permit
136
Id. at 18-19. 137
Id. at 19. 138
Id. 139
Id. at 20-22. 140
Id. at 20. 141
Id. 142
Id. 143
Id. at 22. 144
Id. 145
EPA NSIP Guidance at 14.
22
requirements from Permits to Install for Carmeuse, River Rouge, Trenton Channel, and EES
Coke.146
MDEQ attached these permits as appendices to the Submitted NSIP.147
These are not
permanent permits. In fact, MDEQ noted previously that it plans to void those permits and
incorporate their limits into renewable operating permits, which are renewed every five years.
MDEQ previously stated that it plans to also include the limits in source-wide Permits to Install,
which will “remain[] in effect” unless certain other regulatory provisions are met.148
MDEQ’s own internal communications demonstrate uncertainty regarding whether such
limits qualify as “permanent” and “enforceable.” In October 2013, for instance, an AQD
supervisor wrote his colleague to recommend that “the legally enforceable emission reduction
[for Carmeuse Lime] should be in rules rather than a permit,” because “EPA has often stated that
permits are not ‘permanent.’”149
In another email, an MDEQ employee expressed serious concerns about incorporating
limits from permits to install by reference, rather than directly into the rule:
“I would still think – from a programmatic view – we would want to ensure permanency
at the State level. We can void a PTI and still have it be part of the SIP, but we can’t
enforce the SIP – only EPA can. That leaves open the possibility that only EPA could
keep enforcing those sulfur requirements but the State could not.
Also, what happens when the PTI gets voided when it is rolled into the ROP?
Theoretically, DTE will get the PTI, then submit an M-001 form, then the PTI will get
rolled into the ROP and the PTI will be voided. This process could take as little time as a
month or two. So what are we going to do then – submit the voided PTI as part of the
SIP package, or submit the new ROP as part of the SIP package? And then what happens
when the ROP gets renewed – do we need to resubmit it to EPA for inclusion into the
SIP. The more I think about this, the more uncertain I am that going the PTI route
works.”150
Moreover, communications between MDEQ and DTE indicate that DTE preferred a
permit process to a rulemaking precisely because the Permits to Install could provide flexibility
in the future. In September 2014, DTE wrote MDEQ to state its preference that “our permit not
be referenced in the SIP” because it would “only cause difficulties later if we need to revise our
permit.” 151
One month later, DTE wrote again to “reiterate that DTE's preferred path for the
required SO2 reductions is still through the permit process and not through rule making,” and to
146
Submitted NSIP at 42, see also Submitted NSIP appendices D, G, H, and I. 147
Id. 148
Draft NSIP at 44. 149
MDEQ Emails at 1 (Email from Barb Rosenbaum, Supervisor, Air Quality Evaluation Section, MDEQ Air
Quality Division, to Robert Irvine, Envtl. Manager, Strategy Dev. Unit, MDEQ Air Quality Division, “RE:
Carmeuse” (Oct. 30, 2013, 1:44 PM). 150
Id. at 6 (Email from Jeffrey Kornisky to Robert Irvine, “RE: Update on DTE – River Rouge and Trenton
Channel”). 151
Id. at 3 (Email from Steve M. Zervas, Supervisor, Envtl. Affairs, DTE Energy Services, to Robert Irvine, “RE:
COG Fuel Sulfur Monitoring” (Sept. 17, 2014, 12:53 PM).
23
confirm that the “rulemaking process [was] not moving forward until [the parties agreed] on the
permits.”152
Indeed, bargaining between MDEQ and its regulated entities over their method of
compliance with the 1-hour SO2 NAAQS appears to have extended to all the major sources
except for U.S Steel. In November 2014, an internal MDEQ email noted that, “DTE wants the
permit revision and not the rule, so we will remove subrule (4) and (5) from the rule before
proceeding with the rule into the formal rule process. Carmeuse has also expressed interest in
using this approach and will be talking to Permit staff to do so. Coke also wants out of the rule
by putting the language in subrule (7) into the permit currently out for public comment.”153
MDEQ’s “parallel process” of working with individual companies to set emissions
limits154
is not what the law requires.155
Instead, the agency has a duty to set emissions at levels
necessary to achieve attainment of the standard based on permanent and enforceable measures,
not to create a plan that is “acceptable to both parties.”156
Finally, it is inappropriate to make permits that are subject to continual modification the
source for NSIP limits as it creates logistical problems. MDEQ attached the Permits to Install for
four facilities as appendices to the NSIP. MDEQ has stated that it intends to modify these
permits in the future with Renewable Operating Permits. There could be elements of the PTI that
at some point in time become no longer relevant, more stringent, or less stringent. This would
create a tension between a facilities operating permit and an appendix to an NSIP and generate
confusion about the appropriate limit. To ensure that the NSIP is permanently enforceable, all
emission limits must be clearly articulated in the NSIP itself and not in a temporary permit that
the agency acknowledges will become moot.
C. EPA Should Disregard MDEQ’s Attempts to Downplay How Bad the
Pollution is in Wayne County
MDEQ also attempts to justify its Submitted Plan’s on the fact that the SWHS monitor
“dropped below the standard with the 2014 design value, thereby meeting the 1-hour SO2
standard.”157
MDEQ has relied on these results to claim to the media that “real air quality” in the
Wayne County non-attainment area “is protective of public health” and that SO2 pollution
concerns reflect nothing more than “theoretical air quality, based on an unrealistic operating
scenario.”158
Such statements ignore the fact that the SWHS monitor measures air quality in
only a single discrete location in a non-attainment area that is 40 kilometers long by six
152
Id. at 4 (Email from Fadi K. Mourad, Director, Envtl. Strategy and Non Utility, DTE Energy, to Robert Irvine,
“RE: documentation for desulf” (Oct. 29, 2014, 11:59 AM). 153
Id. at 8 (Email from Robert Irvine to Jeffrey Korniski, “RE: Update on DTE - River Rouge and Trenton Channel”
(Nov. 3, 2014 11:25 AM). 154
Draft NSIP, Appendix F at 19. 155
Id. 156
Id. 157
Submitted NSIP at 3. 158
Jim Lynch, Michigan’s tactics for cutting air pollution under fire, The Detroit News (Mar. 9, 2015), available at
http://www.detroitnews.com/story/news/local/michigan/2015/03/09/michigans-tactics-cutting-air-pollution-fire/24683209/.
24
kilometers wide.159
In addition, monitors are especially poorly suited to evaluating the air
quality impacts of a strongly source-specific pollutant such as SO2.160
Moreover, while the
SWHS monitor may have recorded design values below 75 ppb in 2014 and 2015, the SWHS
monitor still had exceedances of the NAAQS in those years.161
Because of the inability of
monitors to fully assess the ambient impacts of SO2 emissions from major pollution sources,
EPA has long recognized the importance of using air quality modeling to evaluate whether an
area is in attainment with SO2 air quality standards. As discussed above, such air quality
modeling data plainly demonstrates that the Wayne County non-attainment area continues to be
impacted by excessive levels of SO2 pollution.
In promulgating the 2010 1-hour SO2 NAAQS, EPA strongly endorsed the importance of
air quality modeling as the primary tool for assessing whether an area will achieve attainment of
the NAAQS. For example, EPA recognized the “strong source-oriented nature of SO2 ambient
impacts,” and concluded that dispersion modeling is “the most technically appropriate, efficient
and readily available method for assessing short-term ambient SO2 concentrations in areas with
large point sources.”162
Similarly, in its White Paper discussing implementation of the NAAQS,
EPA stated that using modeling to determine attainment for the SO2 standard “could better
address several potentially problematic issues than would the narrower monitoring-focused
approach discussed in the proposal for the SO2 NAAQS, including the unique source-specific
impacts of SO2 emissions and the special challenges SO2 emissions have historically presented in
terms of monitoring short-term SO2 levels for comparison with the NAAQS in many
situations.”163
EPA further confirmed this preference for modeling in its Guidance for 1-Hour SO2
Nonattainment Area SIP Submissions. There, EPA stated that
The comparison of all receptor design values to the NAAQS is necessary given
the short term nature of the SO2 NAAQS and the fact that SO2 emissions are
primarily from stationary combustion sources with strong local concentration
gradients. Given the variability of meteorology (especially wind speed and
direction) and the short term nature of the NAAQS, comparison of modeled
design values at only one receptor, such as the location of the monitor, would not
yield results that provide for informing the most stringent controls to aid the area
to demonstrate attainment. Because monitors represent a single location,
modeling with a multitude of receptors allows for determining other possible
locations of high concentrations given the meteorological variability.164
159
MI Technical Support Document at 4. 160
See, e.g., EPA, Implementation of the 1-Hour SO2 NAAQS, Draft White Paper for Discussion, at 3-4 (May 2012)
(explaining that modeling to determine attainment for the SO2 standard “could better address several potentially
problematic issues than [a] monitoring-focused approach . . . including the unique source-specific impacts of S02
emissions”), attached as Exhibit 6 (hereinafter “EPA Draft White Paper”) 161
MDEQ Air Quality Report at A6; see also Dr. Gray 2015 Report at 7. 162
2010 SO2 NAAQS, 75 Fed. Reg at 35,551. See also id. at 35,570 (noting that “it is more appropriate and
efficient to principally use modeling to assess compliance for medium to larger sources . . . ”). 163
EPA Draft White Paper at 3-4. 164
EPA NSIP Guidance at A-7 –A-8.

25
EPA’s focus on modeling in the 1-hour SO2 NAAQS is fully consistent with the agency’s
historic use of modeling in determining attainment with earlier SO2 standards. As the agency has
explained:
Historically, we have favored dispersion modeling to support SO2 NAAQS
compliance determinations for areas with sources that have the potential to cause
an SO2 NAAQS violation, and we have explained that for an area to be designated
as “attainment,” dispersion modeling regarding such sources needs to show the
absence of violations even if monitoring does not show a violation. This has been
our general position throughout the history of implementation of the SO2 NAAQS
program.165
Similarly, in its 1994 SO2 Guideline Document, EPA noted that “[f]or SO2 attainment
demonstrations, monitoring data alone will generally not be adequate,” and that “[a]ttainment
determinations for SO2 will generally not rely on ambient monitoring data alone, but instead will
be supported by an acceptable modeling analysis which quantifies that the SIP strategy is sound
and that enforceable emission limits are responsible for attainment.”166
As EPA explained, “[f]or
SO2, dispersion modeling will generally be necessary to evaluate comprehensively a source’s
impacts and to determine the areas of expected high concentrations based upon current
conditions.”167
Courts have upheld EPA’s use of modeling to determine an area’s attainment status, such
as EPA’s reliance on air quality modeling to support its issuance of a Federal Implementation
Plan to bring the Billings/Laurel, Montana area into attainment with the SO2 NAAQS.168
Further
demonstrating the superiority of modeling, the D.C. Circuit has acknowledged the inherent
problem of using monitored data for criteria pollutants, namely that “a monitor only measures air
quality in its immediate vicinity.”169
EPA’s practice in a number of other contexts also demonstrates that modeling is a
technically superior approach for ascertaining impacts on NAAQS, and the history of EPA’s
preference for modeling to evaluate compliance rather than monitoring. For example, all NO2,
PM2.5, and SO2 NAAQS and PSD increment compliance verification analyses are performed
with air dispersion modeling, such as running AERMOD in a manner consistent with the
Guideline on Air Quality Models.
165
2010 SO2 NAAQS, 75 Fed. Reg at 35,551. 166
U.S. EPA, 1994 SO2 Guideline Document, at 2-1, 2-5, available at
http://www.epa.gov/ttn/oarpg/t1/memoranda/so2_guide_092109.pdf. 167
Id. at 2-3. 168
Montana Sulphur & Chemical Co. v. U.S. EPA, 666 F.3d 1174 (9th Cir. 2012); see also Sierra Club v. Costle,
657 F.2d 298, 332 (D.C. Cir. 1981) (“Realistically, computer modeling is a useful and often essential tool for
performing the Herculean labors Congress imposed on EPA in the Clean Air Act”); Republic Steel Corp. v. Costle,
621 F.2d 797, 805 (6th Cir. 1980) (approving use of modeling to predict future violations and incorporating “worst
day” assumptions regarding weather and full-capacity operations of pollutant sources). 169
Catawba County v. EPA, 571 F.3d 20, 30 (D.C. Cir. 2009).
26
EPA uses modeling because EPA is well aware that modeling produces reliable results
and is more accurate than monitoring. For example, John C. Vimont, who was the Region 9
Regional Meteorologist 170
at the time, stated under oath in 1990 that:
EPA does recognize the usefulness of ambient measurements for information on
background concentrations, provided reliable monitoring techniques are available.
EPA does not recommend, however, that ambient measurements be used as the
sole basis of setting emission limitations or determining the ambient
concentrations resulting from emissions from an industrial source. These should
be based on an appropriate modeling analysis. 171
Similarly, Roger Brode, is a physical scientist in EPA’s Air Quality Modeling Group.172
He also co-chairs the AMS/EPA Regulatory Model Improvement Committee (AERMIC) and the
AERMOD Implementation Workgroup.173
Mr. Brode, has stated under oath that AERMOD is
“readily capable of accurately predicting whether the revised primary SO2 NAAQS is attained
and whether individual sources cause or contribute to a violation of the SO2 NAAQS.”174
Mr.
Brode has explained:
As part of the basis for EPA adopting the AERMOD model as the preferred
model for nearfield applications in the Guideline on Air Quality Models,
Appendix W to 40 CFR Part 51, the performance of the AERMOD model was
extensively evaluated based on a total of 17 field study data bases (AERMOD:
Latest Features and Evaluation Results. EPA-454/R-03-003. U.S. Environmental
Protection Agency, Research Triangle Park (2003), portions of which are attached
to this affidavit) (“EPA 2003”). The scope of the model evaluations conducted for
AERMOD far exceeds the scope of evaluations conducted on any other model
that has been adopted in Appendix W to Part 51. These evaluations demonstrate
the overall good performance of the AERMOD model based on technically sound
model evaluation procedures, and also illustrate the significant advancement in
the science of dispersion modeling represented by the AERMOD model as
compared to other models that have been used in the past. In particular, adoption
of the AERMOD model has significantly reduced the potential for overestimation
of ambient impacts from elevated sources in complex terrain compared to other-
models.175
U.S. EPA must reject any argument that monitoring results at the SWHS obviate the need for a
stronger NSIP when air quality modeling shows ongoing exceedances of the 1-hour SO2
NAAQS.
170
Decl. of John C. Vimont at 11, attached as Exhibit 7. 171
Id. at 11 (emphasis added). 172
Decl. of Roger W. Brode at 1, attached as Exhibit 8. 173
Id. at 2. 174
Id. 175
Id. at 3-4 (emphasis added).
27
V. Conclusion
The Submitted NSIP does not demonstrate attainment of the 1-hour SO2 NAAQS as
required by law, and U.S. EPA should expeditiously deny approval of the Submitted NSIP and
issues a compliant federal plan that establishes and implements permanently enforceable
measures to bring Wayne County into attainment with the standard. As demonstrated above, that
plan must be based on a proper background SO2 level of at least 15 ppb and establish emission
limits that are measured on a 1-hour basis. In the event that U.S. EPA, improperly, fails to
establish SO2 limits measured on a 1-hour basis, the agency must, at a minimum: (1) establish
emission limits based on proper adjustment ratios, and (2) ensure that only hours when a
generating unit is actually operating and emitting non-zero levels of pollution are used in
calculating the 720-hour average emission rate and demonstrating compliance with the 720-hour
average emission limit at each unit.
As an alternative to calculating and modeling more stringent emission limits for River
Rouge Unit 3 and Trenton Channel Unit 9 than what MDEQ included in the Submitted NSIP,
U.S. EPA could instead require that both of those units be retired by the October 4, 2018
deadline for bringing the Wayne County area into attainment. DTE Energy has already
announced its intent to retire those units by the end of 2020 and 2023, respectively, though that
announcement is not legally binding. By requiring the retirement of both of those units as part of
a federal plan, EPA could ensure that attainment would be achieved through permanent and
enforceable reductions in SO2 emissions.
Given the health threat posed by excessive SO2 pollution, MDEQ’s slow and inadequate
approach to dealing with this issue, and the fact that attainment is required to be achieved by
October 4, 2018, U.S. EPA must move quickly to adopt a plan that would demonstrate
attainment throughout the nonattainment area as required by the Clean Air Act.
Respectfully Submitted by:
Kristin Henry
Senior Attorney
Sierra Club
2101 Webster Street, Suite 1300
Oakland, CA 94612
415-977-5716
28
Shannon Fisk
Managing Attorney, Coal Program
Earthjustice
1617 John F. Kennedy Blvd., Suite 1675
Philadelphia, PA 19130
215-717-4522
Submitted on behalf of:
Sierra Club and Earthjustice
cc:
John Mooney, U.S. EPA Region 5
Sarah Arra, U.S. EPA Region 5
Keith Creagh, Director, Michigan Department of Environmental Quality
Mr. Jim Sygo, Chief Deputy Director, Michigan Department of Environmental Quality
Ms. Lynn Fiedler, Michigan Department of Environmental Quality
Mr. Robert Irvine, Michigan Department of Environmental Quality


![Health Status: Types of Validity and by Robert M Kaplan ...rmkaplan.bol.ucla.edu/Robert_M._Kaplan/1976_Publications_files/00… · by Robert M. Kaplan, ].W. Bush, and Charles C. Berry](https://img.pdfslide.us/doc/110x75/60246b910d793f42e26bcfc7/health-status-types-of-validity-and-by-robert-m-kaplan-by-robert-m-kaplan.jpg)


![[Robert S. Kaplan and David P. Norton] (BookZa.org)](https://img.pdfslide.us/doc/110x75/55cf984a550346d03396c7f3/robert-s-kaplan-and-david-p-norton-bookzaorg.jpg)


![[Robert S. Kaplan, David P. Norton] Having Trouble(Bookos.org)](https://img.pdfslide.us/doc/110x75/55cf8576550346484b8e4c6c/robert-s-kaplan-david-p-norton-having-troublebookosorg.jpg)