Embed Size (px)
Citation preview
01 – Social Security General Figures02 – Evolution of Benefit Concession 2006/201803 – Benefit Concession, According To Species Groups04 – Benefits Conceded According To Large Groups, Value Ranges05 – Benefits Conceded By Sector and Large Groups, According To Value Ranges06 – Benefits Conceded By Value Range, According To Federal States07 – Benefits Conceded, According To Federal States08 – Benefits Conceded, According To Species09 – Value of Credits at Concession10 – Evolution of Benefit Emission 2006/201811 – Benefit Emission, According To Groups of Species12 – Benefit Emission by Large Groups, According To Value Ranges13 – Benefit Emission by Sector and Large Groups, According To Value Ranges14 – Benefit Emission by Value Ranges, According To Federal States15 – Benefit Emission, According To Federal States16 – Benefit Emission, By Benefit Species17 – Benefit Cessation, According To Groups of Species18 – Benefits Ceased and Suspended, According To Federal States19 – Benefit Requirements, According To Federal States20 – Evolution of Benefit Requirements, Concessions and Denials 2006/201821 – Situation of Benefits under Analysis by Duration of Analysis and Responsibility of Next Action22 – Evolution of Social Security Revenue 2006/201823 – Social Security Revenue by Source, According To Federal States24 – Value of Contributions Deposited By Companies, According To Economic Sector25 – Values Deposited By Companies, According To Federal States26 – Other Informations 2017/2018
SECRETARIA DE POLÍTICAS DE PREVIDÊNCIA SOCIALCOORDENAÇÃO-GERAL DE ESTATÍSTICA, DEMOGRAFIA E ATUÁRIA
SOCIAL SECURITY
A
September 2018
Volume 23, nº 09

uytyy

PRESENTATION
The Social Security Statistical Bulletin – BEPS is a monthly publication of the Social Security Secretary of the Ministry of Finance. It is composed by 27 tables with data on benefits, revenue, the INSS cash flow and a set of economic and demographic indicators. Hence it covers the General Regime and social assistance benefits operated by the National Institute of Social Insurance (INSS). This bulletin neither contains information on current public servant funds (Regimes Próprios de Previdência Social) nor on the supplementary pension system (Previdência Complementar).
Table 1 is meant to bring basic information in a nutshell, with key data on benefits, revenue, cash flow, population and coverage. The following tables 2 to 8 unfold information on benefit concession: according to urban/rural sectors (table 2); quantity and value by species of benefits (table 3); quantity and value by value ranges (tables 4 and 5); geographical dispersion according to federal states (tables 6 and 7); and by species of benefits (table 8).
Table 9 shows information on new emissions, benefits which have been paid for the first time in the month of reference and still are not part of the permanent benefit roster.
Data 10 to 16 bring data on benefit emission, i.e. credits sent to be paid and generated from the active roster. The table sequence follows the structure used for benefit concession (tables 2 to 8).
Information on tables 17 and 18 refers to benefit cessation and suspension and is usually presented with a delay of one month. The benefits mentioned in those tables were suspended or ceased from the day the payment spreadsheet of the month of reference was generated until the elaboration of the following spreadsheet. Benefit requirements according to federal states are shown on table 19, classified as required, denied and under analysis. Table 20 brings the monthly evolution of benefit requirements, concessions and denials. The quantity of benefits under analysis, unfolded according to time since requirement and on whom depends the next step of the concession/denial process is the content of table 21.
Revenue of Social Security stemming from all sources collected by means of the Guia da Previdência Social (GPS) are shown on tables 22 to 25: on table 22 one sees the monthly evolution of social security revenue; table 23 brings detailed information on the sources of revenue; table 24 shows revenue from companies by economic sector and table 25 is by federal states.
The last two tables show the INSS cash flow (table 26) and other basic data on social security and the economy (table 27). The definitions used are presented after the last table.
For a long time the Brazilian Social Security has been owing information accessible in foreign languages. We hope the Statistical Bulletin helps to fill that gap. Please do not hesitate to contact us if you have any doubts or suggestions on the information presented.
Social Security Statistical Bulletin Sep/2018
01
SEP/2018ACCUMULATED
IN 2018
ACCUM. LAST 12
MONTHSEXPLANATION TOTAL
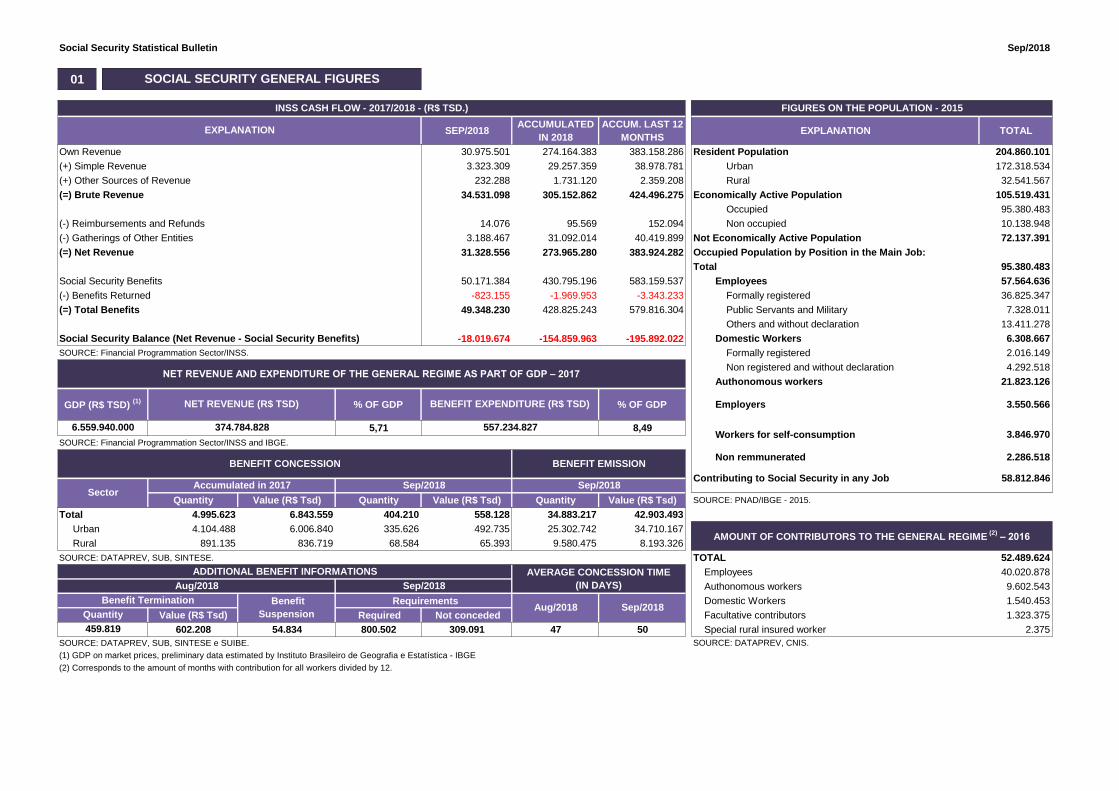
Own Revenue 30.975.501 274.164.383 383.158.286 Resident Population 204.860.101
(+) Simple Revenue 3.323.309 29.257.359 38.978.781 Urban 172.318.534
(+) Other Sources of Revenue 232.288 1.731.120 2.359.208 Rural 32.541.567
(=) Brute Revenue 34.531.098 305.152.862 424.496.275 Economically Active Population 105.519.431
Occupied 95.380.483
(-) Reimbursements and Refunds 14.076 95.569 152.094 Non occupied 10.138.948
(-) Gatherings of Other Entities 3.188.467 31.092.014 40.419.899 Not Economically Active Population 72.137.391
(=) Net Revenue 31.328.556 273.965.280 383.924.282 Occupied Population by Position in the Main Job:
Total 95.380.483
Social Security Benefits 50.171.384 430.795.196 583.159.537 Employees 57.564.636
(-) Benefits Returned -823.155 -1.969.953 -3.343.233 Formally registered 36.825.347
(=) Total Benefits 49.348.230 428.825.243 579.816.304 Public Servants and Military 7.328.011
Others and without declaration 13.411.278
Social Security Balance (Net Revenue - Social Security Benefits) -18.019.674 -154.859.963 -195.892.022 Domestic Workers 6.308.667
SOURCE: Financial Programmation Sector/INSS. Formally registered 2.016.149
Non registered and without declaration 4.292.518
Authonomous workers 21.823.126
% OF GDP % OF GDP Employers 3.550.566
5,71 8,49
SOURCE: Financial Programmation Sector/INSS and IBGE.
Non remmunerated 2.286.518
Quantity Value (R$ Tsd) Quantity Value (R$ Tsd) Quantity Value (R$ Tsd) SOURCE: PNAD/IBGE - 2015.
Total 4.995.623 6.843.559 404.210 558.128 34.883.217 42.903.493
Urban 4.104.488 6.006.840 335.626 492.735 25.302.742 34.710.167
Rural 891.135 836.719 68.584 65.393 9.580.475 8.193.326
SOURCE: DATAPREV, SUB, SINTESE. TOTAL 52.489.624
Employees 40.020.878
Authonomous workers 9.602.543
Requirements Domestic Workers 1.540.453
Value (R$ Tsd) Required Not conceded Facultative contributors 1.323.375
602.208 54.834 800.502 309.091 47 50 Special rural insured worker 2.375
SOURCE: DATAPREV, SUB, SINTESE e SUIBE. SOURCE: DATAPREV, CNIS.
(1) GDP on market prices, preliminary data estimated by Instituto Brasileiro de Geografia e Estatística - IBGE
(2) Corresponds to the amount of months with contribution for all workers divided by 12.
Benefit
Suspension
58.812.846
3.846.970
BENEFIT CONCESSION
Sector
6.559.940.000
459.819
Benefit Termination
Sep/2018
Quantity
Accumulated in 2017
Aug/2018
Sep/2018
ADDITIONAL BENEFIT INFORMATIONS
Aug/2018 Sep/2018
SOCIAL SECURITY GENERAL FIGURES
INSS CASH FLOW - 2017/2018 - (R$ TSD.)
BENEFIT EMISSION
Sep/2018
FIGURES ON THE POPULATION - 2015
EXPLANATION
AMOUNT OF CONTRIBUTORS TO THE GENERAL REGIME (2)
– 2016
AVERAGE CONCESSION TIME
(IN DAYS)
Workers for self-consumption
Contributing to Social Security in any Job
BENEFIT EXPENDITURE (R$ TSD)
557.234.827
NET REVENUE AND EXPENDITURE OF THE GENERAL REGIME AS PART OF GDP – 2017
GDP (R$ TSD) (1) NET REVENUE (R$ TSD)
374.784.828
Social Security Statistical Bulletin Sep/2018
02
QUANTITY VALUE (R$) AVERAGE VALUE (R$)
Sector Sector Sector
Urban Rural Urban Rural Urban Rural
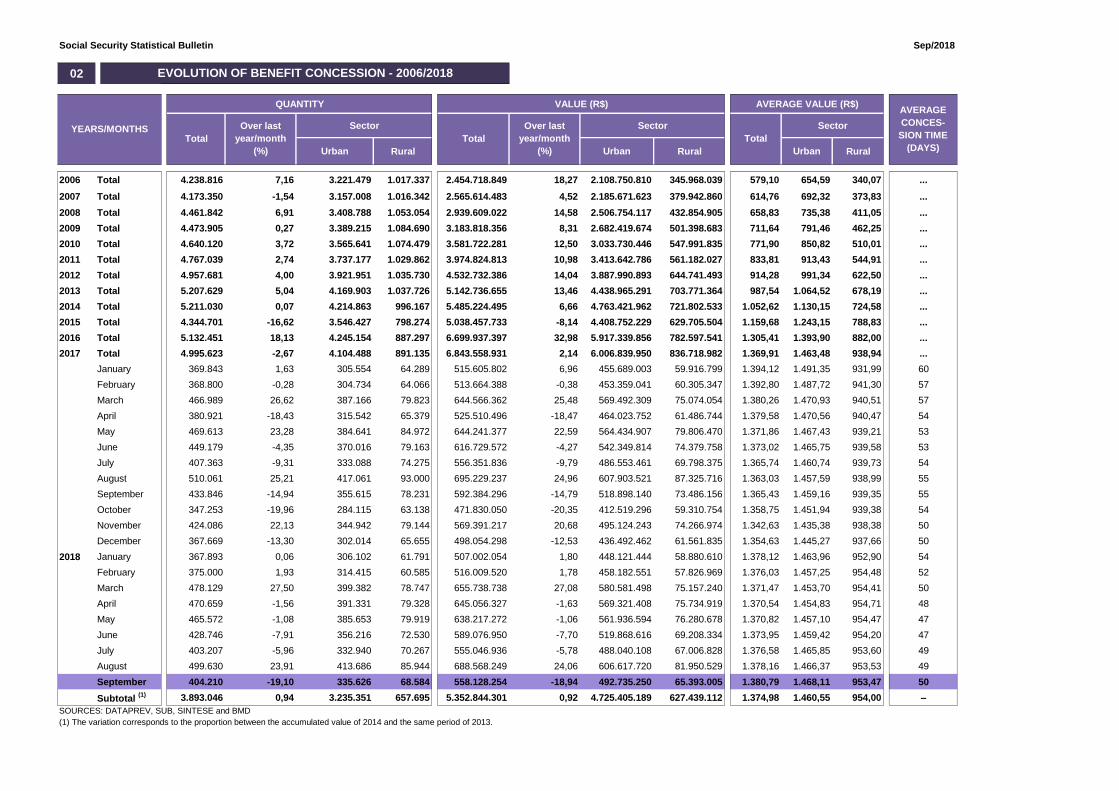
2006 Total 4.238.816 7,16 3.221.479 1.017.337 2.454.718.849 18,27 2.108.750.810 345.968.039 579,10 654,59 340,07 ...
2007 Total 4.173.350 -1,54 3.157.008 1.016.342 2.565.614.483 4,52 2.185.671.623 379.942.860 614,76 692,32 373,83 ...
2008 Total 4.461.842 6,91 3.408.788 1.053.054 2.939.609.022 14,58 2.506.754.117 432.854.905 658,83 735,38 411,05 ...
2009 Total 4.473.905 0,27 3.389.215 1.084.690 3.183.818.356 8,31 2.682.419.674 501.398.683 711,64 791,46 462,25 ...
2010 Total 4.640.120 3,72 3.565.641 1.074.479 3.581.722.281 12,50 3.033.730.446 547.991.835 771,90 850,82 510,01 ...
2011 Total 4.767.039 2,74 3.737.177 1.029.862 3.974.824.813 10,98 3.413.642.786 561.182.027 833,81 913,43 544,91 ...
2012 Total 4.957.681 4,00 3.921.951 1.035.730 4.532.732.386 14,04 3.887.990.893 644.741.493 914,28 991,34 622,50 ...
2013 Total 5.207.629 5,04 4.169.903 1.037.726 5.142.736.655 13,46 4.438.965.291 703.771.364 987,54 1.064,52 678,19 ...
2014 Total 5.211.030 0,07 4.214.863 996.167 5.485.224.495 6,66 4.763.421.962 721.802.533 1.052,62 1.130,15 724,58 ...
2015 Total 4.344.701 -16,62 3.546.427 798.274 5.038.457.733 -8,14 4.408.752.229 629.705.504 1.159,68 1.243,15 788,83 ...
2016 Total 5.132.451 18,13 4.245.154 887.297 6.699.937.397 32,98 5.917.339.856 782.597.541 1.305,41 1.393,90 882,00 ...
2017 Total 4.995.623 -2,67 4.104.488 891.135 6.843.558.931 2,14 6.006.839.950 836.718.982 1.369,91 1.463,48 938,94 ...
January 369.843 1,63 305.554 64.289 515.605.802 6,96 455.689.003 59.916.799 1.394,12 1.491,35 931,99 60
February 368.800 -0,28 304.734 64.066 513.664.388 -0,38 453.359.041 60.305.347 1.392,80 1.487,72 941,30 57
March 466.989 26,62 387.166 79.823 644.566.362 25,48 569.492.309 75.074.054 1.380,26 1.470,93 940,51 57
April 380.921 -18,43 315.542 65.379 525.510.496 -18,47 464.023.752 61.486.744 1.379,58 1.470,56 940,47 54
May 469.613 23,28 384.641 84.972 644.241.377 22,59 564.434.907 79.806.470 1.371,86 1.467,43 939,21 53
June 449.179 -4,35 370.016 79.163 616.729.572 -4,27 542.349.814 74.379.758 1.373,02 1.465,75 939,58 53
July 407.363 -9,31 333.088 74.275 556.351.836 -9,79 486.553.461 69.798.375 1.365,74 1.460,74 939,73 54
August 510.061 25,21 417.061 93.000 695.229.237 24,96 607.903.521 87.325.716 1.363,03 1.457,59 938,99 55
September 433.846 -14,94 355.615 78.231 592.384.296 -14,79 518.898.140 73.486.156 1.365,43 1.459,16 939,35 55
October 347.253 -19,96 284.115 63.138 471.830.050 -20,35 412.519.296 59.310.754 1.358,75 1.451,94 939,38 54
November 424.086 22,13 344.942 79.144 569.391.217 20,68 495.124.243 74.266.974 1.342,63 1.435,38 938,38 50
December 367.669 -13,30 302.014 65.655 498.054.298 -12,53 436.492.462 61.561.835 1.354,63 1.445,27 937,66 50
2018 January 367.893 0,06 306.102 61.791 507.002.054 1,80 448.121.444 58.880.610 1.378,12 1.463,96 952,90 54
February 375.000 1,93 314.415 60.585 516.009.520 1,78 458.182.551 57.826.969 1.376,03 1.457,25 954,48 52
March 478.129 27,50 399.382 78.747 655.738.738 27,08 580.581.498 75.157.240 1.371,47 1.453,70 954,41 50
April 470.659 -1,56 391.331 79.328 645.056.327 -1,63 569.321.408 75.734.919 1.370,54 1.454,83 954,71 48
May 465.572 -1,08 385.653 79.919 638.217.272 -1,06 561.936.594 76.280.678 1.370,82 1.457,10 954,47 47
June 428.746 -7,91 356.216 72.530 589.076.950 -7,70 519.868.616 69.208.334 1.373,95 1.459,42 954,20 47
July 403.207 -5,96 332.940 70.267 555.046.936 -5,78 488.040.108 67.006.828 1.376,58 1.465,85 953,60 49
August 499.630 23,91 413.686 85.944 688.568.249 24,06 606.617.720 81.950.529 1.378,16 1.466,37 953,53 49
September 404.210 -19,10 335.626 68.584 558.128.254 -18,94 492.735.250 65.393.005 1.380,79 1.468,11 953,47 50
Subtotal (1) 3.893.046 0,94 3.235.351 657.695 5.352.844.301 0,92 4.725.405.189 627.439.112 1.374,98 1.460,55 954,00 –
SOURCES: DATAPREV, SUB, SINTESE and BMD
(1) The variation corresponds to the proportion between the accumulated value of 2014 and the same period of 2013.
EVOLUTION OF BENEFIT CONCESSION - 2006/2018
AVERAGE
CONCES-
SION TIME
(DAYS)
YEARS/MONTHSTotal Total
Over last
year/month
(%)
Over last
year/month
(%)
Total
Social Security Statistical Bulletin Sep/2018
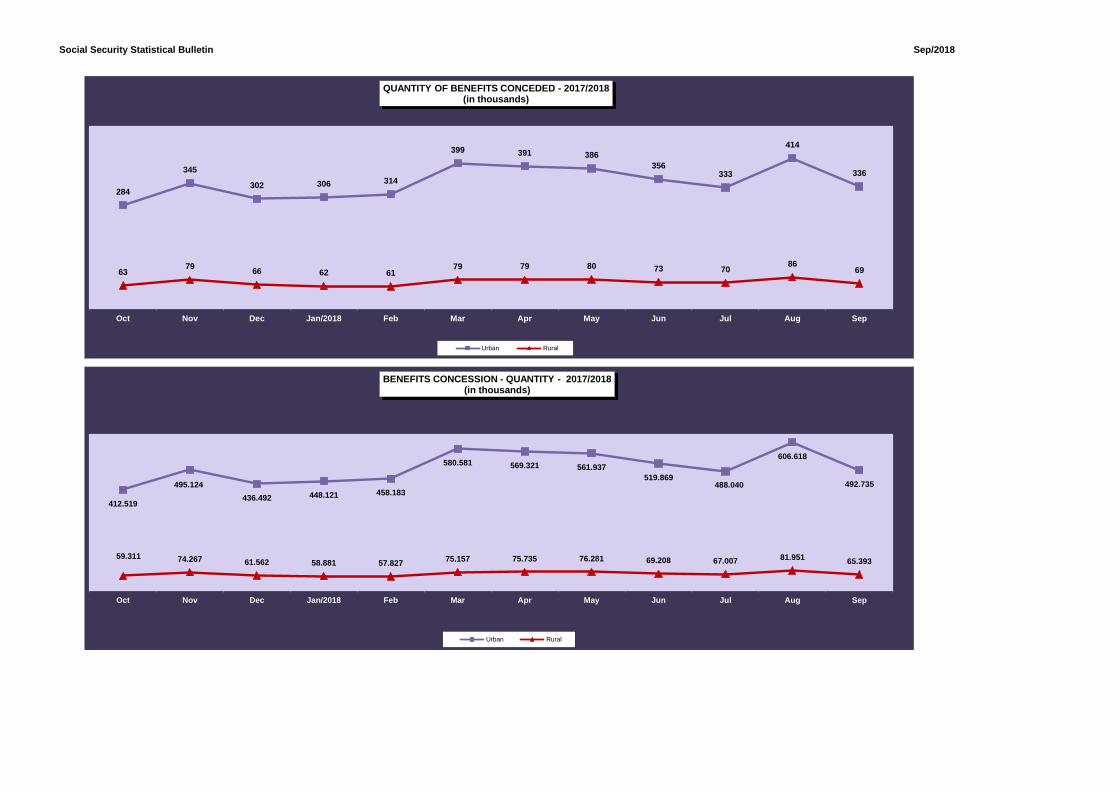
284
345
302 306 314
399 391 386
356333
414
336
6379
66 62 6179 79 80 73 70
8669
Oct Nov Dec Jan/2018 Feb Mar Apr May Jun Jul Aug Sep
QUANTITY OF BENEFITS CONCEDED - 2017/2018(in thousands)
Urban Rural
412.519
495.124
436.492 448.121 458.183
580.581 569.321 561.937
519.869488.040
606.618
492.735
59.311 74.267 61.562 58.881 57.82775.157 75.735 76.281 69.208 67.007 81.951
65.393
Oct Nov Dec Jan/2018 Feb Mar Apr May Jun Jul Aug Sep
BENEFITS CONCESSION - QUANTITY - 2017/2018 (in thousands)
Urban Rural

Social Security Statistical Bulletin Sep/2018
03
QUANTITY VALUE (R$) AVERAGE VALUE (R$)
Sector Sector Sector
Urban Rural Urban Rural Urban Rural
TOTAL 404.210 100,00 -19,10 335.626 68.584 558.128.254 100,00 -18,94 492.735.250 65.393.005 1.380,79 1.468,11 953,47
GENERAL REGIME BENEFITS 379.514 93,89 100,00 -19,10 310.930 68.584 534.540.231 95,77 100,00 -18,94 469.147.227 65.393.005 1.408,49 1.508,85 953,47
Social Security Contributory 360.648 89,22 95,03 100,00 -19,11 292.751 67.897 505.011.241 90,48 94,48 100,00 -18,91 440.242.165 64.769.076 1.400,29 1.503,81 953,93
Retirements 100.455 24,85 26,47 27,85 -20,61 74.827 25.628 151.283.878 27,11 28,30 29,96 -20,52 126.732.925 24.550.953 1.505,99 1.693,68 957,97
by Age 52.550 13,00 13,85 14,57 -21,79 29.603 22.947 59.099.069 10,59 11,06 11,70 -21,67 37.133.058 21.966.011 1.124,63 1.254,37 957,25
by Invalidity 20.840 5,16 5,49 5,78 -15,28 18.240 2.600 30.048.689 5,38 5,62 5,95 -14,54 27.557.516 2.491.173 1.441,88 1.510,83 958,14
by Length of Contribution 27.065 6,70 7,13 7,50 -22,10 26.984 81 62.136.120 11,13 11,62 12,30 -22,08 62.042.351 93.769 2.295,81 2.299,23 1.157,64
Survivor Pension 27.858 6,89 7,34 7,72 -18,36 18.965 8.893 40.872.289 7,32 7,65 8,09 -18,38 32.351.943 8.520.346 1.467,17 1.705,88 958,10
Temporary Benefits 184.740 45,70 48,68 51,22 -17,35 167.625 17.115 263.633.200 47,24 49,32 52,20 -17,24 247.448.570 16.184.631 1.427,05 1.476,20 945,64
Sickness Benefits 181.513 44,91 47,83 50,33 -17,29 164.811 16.702 260.503.826 46,67 48,73 51,58 -17,21 244.568.833 15.934.993 1.435,18 1.483,94 954,08
Partial Invalidity 1.687 0,42 0,44 0,47 -23,63 1.372 315 1.240.574 0,22 0,23 0,25 -22,06 1.087.922 152.652 735,37 792,95 484,61
Imprisionment Benefit 1.540 0,38 0,41 0,43 -17,69 1.442 98 1.888.800 0,34 0,35 0,37 -18,19 1.791.815 96.986 1.226,49 1.242,59 989,65
Maternity Benefit 47.595 11,77 12,54 13,20 -22,82 31.334 16.261 49.221.873 8,82 9,21 9,75 -22,85 33.708.727 15.513.146 1.034,18 1.075,79 954,01
Continued Service Bonus 20% – – – – – – – – – – – – – – – – –
Labor Accident Insurance 18.866 4,67 4,97 100,00 -19,01 18.179 687 29.528.991 5,29 5,52 100,00 -19,40 28.905.062 623.928 1.565,20 1.590,02 908,19
Retirment by Invalidity 941 0,23 0,25 4,99 -15,83 888 53 1.688.611 0,30 0,32 5,72 -14,99 1.636.582 52.028 1.794,49 1.843,00 981,67
Survivor Pension 24 0,01 0,01 0,13 41,18 24 – 47.343 0,01 0,01 0,16 60,67 47.343 – 1.972,63 1.972,63 –
Sickness Benefits 16.066 3,97 4,23 85,16 -19,41 15.506 560 25.900.668 4,64 4,85 87,71 -19,92 25.366.428 534.240 1.612,14 1.635,91 954,00
Partial Invalidity 1.831 0,45 0,48 9,71 -17,26 1.757 74 1.890.609 0,34 0,35 6,40 -16,92 1.852.949 37.660 1.032,56 1.054,61 508,92
Supplementary Benefit 4 0,00 0,00 0,02 -55,56 4 – 1.760 0,00 0,00 0,01 -51,16 1.760 – 440,03 440,03 –
SOCIAL ASSISTANCE BENEFITS 24.669 6,10 100,00 -18,97 24.669 – 23.534.620 4,22 100,00 -18,97 23.534.620 – 954,02 954,02 –
Social Assistance Pension (LOAS) 24.669 6,10 100,00 100,00 -18,97 24.669 – 23.534.620 4,22 100,00 100,00 -18,97 23.534.620 – 954,02 954,02 –
for the Aged 11.580 2,86 46,94 46,94 -15,77 11.580 – 11.047.463 1,98 46,94 46,94 -15,77 11.047.463 – 954,01 954,01 –
for the Impaired 13.089 3,24 53,06 53,06 -21,61 13.089 – 12.487.157 2,24 53,06 53,06 -21,61 12.487.157 – 954,02 954,02 –
Old Social Assistance Benefit (RMV) – – – – – – – – – – – – – – – – –
for the Aged – – – – – – – – – – – – – – – – –
for the Impaired – – – – – – – – – – – – – – – – –
27 0,01 – – -48,08 27 – 53.403 0,01 – – -45,69 53.403 – 1.977,89 1.977,89 –
SOURCE: DATAPREV, SUB, SINTESE.
(1) Includes the following species: 22 - Old public servant pension; 26 - Special Pension (Law 593/48); 37 - Extinct Supernummerary Federal Servant Retirements; 38 - Retirements of former CAPIN; 56 - Talidomid victim special pension;
58 - Special benefit for victims of dictatorship; 59 - Special survivor pension for victims of dictatorship; 76 - Family benefit of former Train Company RFFSA; 89 - Special pension for hemodialysis victims of Caruaru. Doesn't include BLE complements.
OTHER TREASURY OWED PENSIONS
(BLE) (1)
GROUPS OF SPECIESTotal
% of
total
BENEFIT CONCESSION, ACCORDING TO SPECIES GROUPS
Total
% of
the
group
% of
sub-
group
TotalOver last
month (%)
% of
the
group
% of
sub-
group
Over last
month (%)
% of
total
Social Security Statistical Bulletin Sep/2018
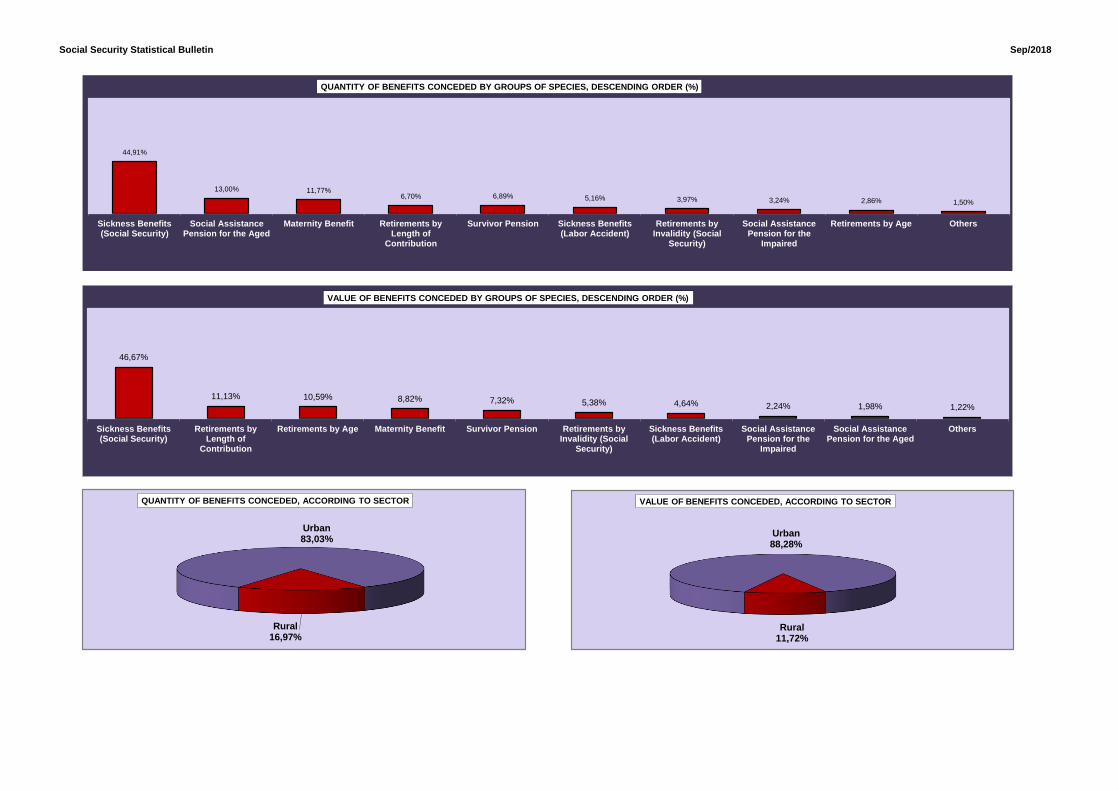
Urban88,28%
Rural11,72%
VALUE OF BENEFITS CONCEDED, ACCORDING TO SECTOR
44,91%
13,00% 11,77%6,70% 6,89% 5,16% 3,97% 3,24% 2,86% 1,50%
Sickness Benefits(Social Security)
Social AssistancePension for the Aged
Maternity Benefit Retirements byLength of
Contribution
Survivor Pension Sickness Benefits(Labor Accident)
Retirements byInvalidity (Social
Security)
Social AssistancePension for the
Impaired
Retirements by Age Others
QUANTITY OF BENEFITS CONCEDED BY GROUPS OF SPECIES, DESCENDING ORDER (%)
46,67%
11,13% 10,59% 8,82% 7,32% 5,38% 4,64% 2,24% 1,98% 1,22%
Sickness Benefits(Social Security)
Retirements byLength of
Contribution
Retirements by Age Maternity Benefit Survivor Pension Retirements byInvalidity (Social
Security)
Sickness Benefits(Labor Accident)
Social AssistancePension for the
Impaired
Social AssistancePension for the Aged
Others
VALUE OF BENEFITS CONCEDED BY GROUPS OF SPECIES, DESCENDING ORDER (%)
Urban83,03%
Rural16,97%
QUANTITY OF BENEFITS CONCEDED, ACCORDING TO SECTOR

Social Security Statistical Bulletin
(continue)
03
URBAN
AgeLenght of
Contribution28 Age
Lenght of
ContributionInvalidity
Up to 45 1 576 2.256 2.833 – 409 1.441 1.850
46 to 50 1 2.365 1.545 3.911 – 2.370 1.023 3.393
51 to 55 5 5.849 2.292 8.146 18 4.733 1.600 6.351
56 to 60 28 6.019 2.596 8.643 12.081 2.253 1.859 16.193
61 to 65 9.852 2.193 2.014 14.059 4.259 134 1.187 5.580
66 to 70 1.479 49 418 1.946 1.208 19 557 1.784
over 70 271 11 101 383 400 4 239 643
Total 11.637 17.062 11.222 39.921 17.966 9.922 7.906 35.794
RURAL
AgeLenght of
ContributionInvalidity Age
Lenght of
ContributionInvalidity
Up to 45 1 2 355 358 – – 323 323
46 to 50 1 12 258 271 – 4 224 228
51 to 55 7 23 384 414 9.014 5 309 9.328
56 to 60 7.645 28 439 8.112 2.757 2 126 2.885
61 to 65 1.980 5 130 2.115 809 – 49 858
66 to 70 245 – 32 277 166 – 15 181
over 70 105 – 6 111 217 – 3 220
Total 9.984 70 1.604 11.658 12.963 11 1.049 14.023
TOTAL
AgeLenght of
ContributionInvalidity Age
Lenght of
ContributionInvalidity
Up to 45 2 578 2.611 3.191 – 409 1.764 2.173
46 to 50 2 2.377 1.803 4.182 – 2.374 1.247 3.621
51 to 55 12 5.872 2.676 8.560 9.032 4.738 1.909 15.679
56 to 60 7.673 6.047 3.035 16.755 14.838 2.255 1.985 19.078
61 to 65 11.832 2.198 2.144 16.174 5.068 134 1.236 6.438
66 to 70 1.724 49 450 2.223 1.374 19 572 1.965
over 70 376 11 107 494 617 4 242 863
Total 21.621 17.132 12.826 51.579 30.929 9.933 8.955 49.817
SOURCE: DATAPREV, SUB, SINTESE.
Obs.: The retirements conceded at ages below the minimum legal age and the early retirements by length of contribution are due to judicial process or conceded according the Lei Complementar nº 142/2013
Age Range
MEN WOMEN
Retirement by
Total
Retirement by
Total
Age Range
MEN WOMEN
Retirement by
Total
Retirement by
Total
Sep/2018
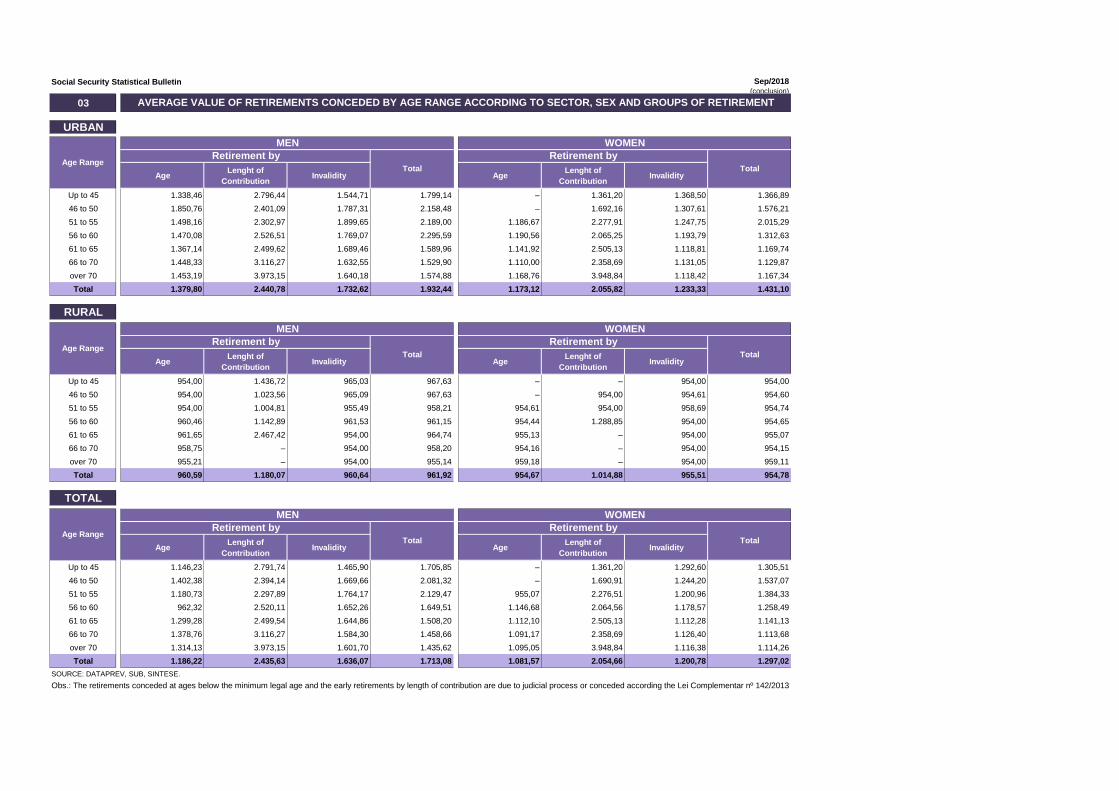
RETIREMENTS CONCEDED BY AGE RANGE ACCORDING TO SECTOR, SEX AND GROUPS OF RETIREMENT
Age Range
MEN WOMEN
Retirement by
Total
Retirement by
Total
Social Security Statistical Bulletin(conclusion)
03
URBAN
AgeLenght of
ContributionInvalidity Age
Lenght of
ContributionInvalidity
Up to 45 1.338,46 2.796,44 1.544,71 1.799,14 – 1.361,20 1.368,50 1.366,89
46 to 50 1.850,76 2.401,09 1.787,31 2.158,48 – 1.692,16 1.307,61 1.576,21
51 to 55 1.498,16 2.302,97 1.899,65 2.189,00 1.186,67 2.277,91 1.247,75 2.015,29
56 to 60 1.470,08 2.526,51 1.769,07 2.295,59 1.190,56 2.065,25 1.193,79 1.312,63
61 to 65 1.367,14 2.499,62 1.689,46 1.589,96 1.141,92 2.505,13 1.118,81 1.169,74
66 to 70 1.448,33 3.116,27 1.632,55 1.529,90 1.110,00 2.358,69 1.131,05 1.129,87
over 70 1.453,19 3.973,15 1.640,18 1.574,88 1.168,76 3.948,84 1.118,42 1.167,34
Total 1.379,80 2.440,78 1.732,62 1.932,44 1.173,12 2.055,82 1.233,33 1.431,10
RURAL
AgeLenght of
ContributionInvalidity Age
Lenght of
ContributionInvalidity
Up to 45 954,00 1.436,72 965,03 967,63 – – 954,00 954,00
46 to 50 954,00 1.023,56 965,09 967,63 – 954,00 954,61 954,60
51 to 55 954,00 1.004,81 955,49 958,21 954,61 954,00 958,69 954,74
56 to 60 960,46 1.142,89 961,53 961,15 954,44 1.288,85 954,00 954,65
61 to 65 961,65 2.467,42 954,00 964,74 955,13 – 954,00 955,07
66 to 70 958,75 – 954,00 958,20 954,16 – 954,00 954,15
over 70 955,21 – 954,00 955,14 959,18 – 954,00 959,11
Total 960,59 1.180,07 960,64 961,92 954,67 1.014,88 955,51 954,78
TOTAL
AgeLenght of
ContributionInvalidity Age
Lenght of
ContributionInvalidity
Up to 45 1.146,23 2.791,74 1.465,90 1.705,85 – 1.361,20 1.292,60 1.305,51
46 to 50 1.402,38 2.394,14 1.669,66 2.081,32 – 1.690,91 1.244,20 1.537,07
51 to 55 1.180,73 2.297,89 1.764,17 2.129,47 955,07 2.276,51 1.200,96 1.384,33
56 to 60 962,32 2.520,11 1.652,26 1.649,51 1.146,68 2.064,56 1.178,57 1.258,49
61 to 65 1.299,28 2.499,54 1.644,86 1.508,20 1.112,10 2.505,13 1.112,28 1.141,13
66 to 70 1.378,76 3.116,27 1.584,30 1.458,66 1.091,17 2.358,69 1.126,40 1.113,68
over 70 1.314,13 3.973,15 1.601,70 1.435,62 1.095,05 3.948,84 1.116,38 1.114,26
Total 1.186,22 2.435,63 1.636,07 1.713,08 1.081,57 2.054,66 1.200,78 1.297,02
SOURCE: DATAPREV, SUB, SINTESE.
Obs.: The retirements conceded at ages below the minimum legal age and the early retirements by length of contribution are due to judicial process or conceded according the Lei Complementar nº 142/2013
Sep/2018
Age Range
MEN WOMEN
Retirement by
Total
Retirement by
Total
Age Range
MEN WOMEN
Retirement by
Total
Retirement by
Total
AVERAGE VALUE OF RETIREMENTS CONCEDED BY AGE RANGE ACCORDING TO SECTOR, SEX AND GROUPS OF RETIREMENT
Age Range
MEN WOMEN
Retirement by
Total
Retirement by
Total
Social Security Statistical Bulletin Sep/2018
04
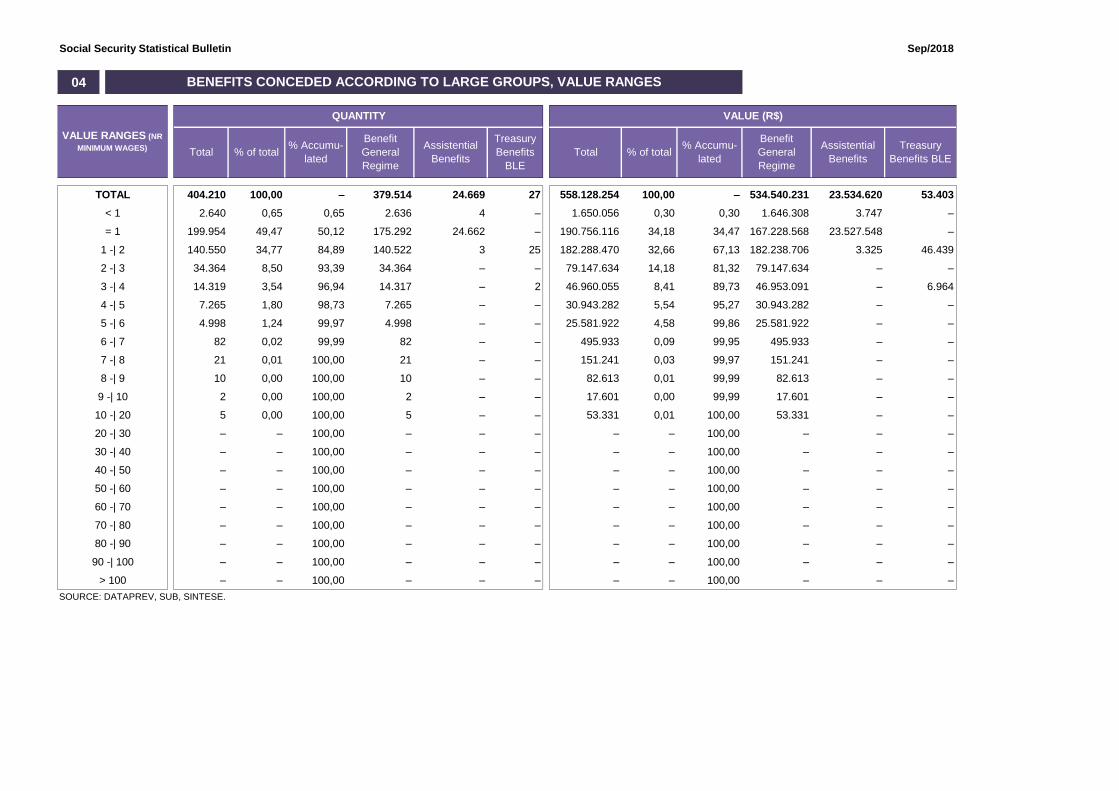
TOTAL 404.210 100,00 – 379.514 24.669 27 558.128.254 100,00 – 534.540.231 23.534.620 53.403
< 1 2.640 0,65 0,65 2.636 4 – 1.650.056 0,30 0,30 1.646.308 3.747 –
= 1 199.954 49,47 50,12 175.292 24.662 – 190.756.116 34,18 34,47 167.228.568 23.527.548 –
1 -| 2 140.550 34,77 84,89 140.522 3 25 182.288.470 32,66 67,13 182.238.706 3.325 46.439
2 -| 3 34.364 8,50 93,39 34.364 – – 79.147.634 14,18 81,32 79.147.634 – –
3 -| 4 14.319 3,54 96,94 14.317 – 2 46.960.055 8,41 89,73 46.953.091 – 6.964
4 -| 5 7.265 1,80 98,73 7.265 – – 30.943.282 5,54 95,27 30.943.282 – –
5 -| 6 4.998 1,24 99,97 4.998 – – 25.581.922 4,58 99,86 25.581.922 – –
6 -| 7 82 0,02 99,99 82 – – 495.933 0,09 99,95 495.933 – –
7 -| 8 21 0,01 100,00 21 – – 151.241 0,03 99,97 151.241 – –
8 -| 9 10 0,00 100,00 10 – – 82.613 0,01 99,99 82.613 – –
9 -| 10 2 0,00 100,00 2 – – 17.601 0,00 99,99 17.601 – –
10 -| 20 5 0,00 100,00 5 – – 53.331 0,01 100,00 53.331 – –
20 -| 30 – – 100,00 – – – – – 100,00 – – –
30 -| 40 – – 100,00 – – – – – 100,00 – – –
40 -| 50 – – 100,00 – – – – – 100,00 – – –
50 -| 60 – – 100,00 – – – – – 100,00 – – –
60 -| 70 – – 100,00 – – – – – 100,00 – – –
70 -| 80 – – 100,00 – – – – – 100,00 – – –
80 -| 90 – – 100,00 – – – – – 100,00 – – –
90 -| 100 – – 100,00 – – – – – 100,00 – – –
> 100 – – 100,00 – – – – – 100,00 – – –
SOURCE: DATAPREV, SUB, SINTESE.
% Accumu-
latedTotal
Benefit
General
Regime
VALUE RANGES (NR
MINIMUM WAGES) Total % of total
BENEFITS CONCEDED ACCORDING TO LARGE GROUPS, VALUE RANGES
QUANTITY VALUE (R$)
Treasury
Benefits BLE
Assistential
Benefits
Treasury
Benefits
BLE
Benefit
General
Regime
Assistential
Benefits
% Accumu-
lated% of total

Social Security Statistical Bulletin Sep/2018
05
TotalGeneral
Regime
Assistential
Benefits
Treasury
OwedTotal
General
Regime
Assistential
Benefits
Treas.
OwedTotal
General
Regime
Assistential
BenefitsTotal
General
Regime
Assistential
Benefits
TOTAL 335.626 310.930 24.669 27 492.735.250 469.147.227 23.534.620 53.403 68.584 68.584 – 65.393.005 65.393.005 –
< 1 2.244 2.240 4 – 1.458.312 1.454.565 3.747 – 396 396 – 191.743 191.743 –
= 1 132.132 107.470 24.662 – 126.053.928 102.526.380 23.527.548 – 67.822 67.822 – 64.702.188 64.702.188 –
1 -| 2 140.206 140.178 3 25 181.850.865 181.801.101 3.325 46.439 344 344 – 437.605 437.605 –
2 -| 3 34.350 34.350 – – 79.117.139 79.117.139 – – 14 14 – 30.496 30.496 –
3 -| 4 14.314 14.312 – 2 46.943.013 46.936.049 – 6.964 5 5 – 17.042 17.042 –
4 -| 5 7.263 7.263 – – 30.934.997 30.934.997 – – 2 2 – 8.285 8.285 –
5 -| 6 4.997 4.997 – – 25.576.276 25.576.276 – – 1 1 – 5.646 5.646 –
6 -| 7 82 82 – – 495.933 495.933 – – – – – – – –
7 -| 8 21 21 – – 151.241 151.241 – – – – – – – –
8 -| 9 10 10 – – 82.613 82.613 – – – – – – – –
9 -| 10 2 2 – – 17.601 17.601 – – – – – – – –
10 -| 20 5 5 – – 53.331 53.331 – – – – – – – –
20 -| 30 – – – – – – – – – – – – – –
30 -| 40 – – – – – – – – – – – – – –
40 -| 50 – – – – – – – – – – – – – –
50 -| 60 – – – – – – – – – – – – – –
60 -| 70 – – – – – – – – – – – – – –
70 -| 80 – – – – – – – – – – – – – –
80 -| 90 – – – – – – – – – – – – – –
90 -| 100 – – – – – – – – – – – – – –
> 100 – – – – – – – – – – – – – –
SOURCE: DATAPREV, SUB, SINTESE.
VALUE RANGES
(in min. wages)
BENEFITS CONCEDED BY SECTOR AND LARGE GROUPS, ACCORDING TO VALUE RANGES
URBAN SECTOR RURAL SECTOR
Quantity Value (R$) Quantity Value (R$)

Social Security Statistical Bulletin Sep/2018
< 1 = 1 1 ─┤ 2 2 ─┤ 3 3 ─┤ 4 4 ─┤ 5 >5
0,67%
39,37% 41,77%
10,23%
4,26% 2,16% 1,53%0,58%
98,89%
0,50% 0,02% 0,01% 0,00% 0,00%
In minimum wages
QUANTITY OF BENEFITS CONCEDED, ACCORDING TO VALUE RANGES (%)
Urban Rural
< 1 = 1 1 ─┤ 2 2 ─┤ 3 3 ─┤ 4 4 ─┤ 5 >5
0,30%
25,58%
36,91%
16,06%
9,53%6,28% 5,36%
0,29%
98,94%
0,67% 0,05% 0,03% 0,01% 0,01%
In minimum wages
VALUE OF BENEFITS CONCEDED, ACCORDING TO VALUE RANGES – (%)
Urban Rural

Social Security Statistical Bulletin Sep/2018
06
Total < 1 = 1 1 to 5 5 to 10 > 10 Total < 1 = 1 1 to 5 5 to 10 > 10
BRAZIL 404.210 2.640 199.954 196.498 5.113 5 558.128.254 1.650.056 190.756.116 339.339.441 26.329.311 53.331
NORTH 20.793 241 13.050 7.352 150 – 25.796.090 140.485 12.449.700 12.437.470 768.434 –
Rondônia 3.578 76 2.065 1.418 19 – 4.305.060 44.248 1.970.010 2.193.619 97.183 –
Acre 1.276 8 928 332 8 – 1.481.554 4.788 885.312 550.397 41.057 –
Amazonas 4.464 47 2.632 1.738 47 – 5.907.128 29.692 2.510.928 3.123.407 243.101 –
Roraima 748 5 551 183 9 – 889.686 2.493 525.654 315.697 45.843 –
Pará 7.375 45 4.649 2.629 52 – 9.241.673 24.347 4.435.146 4.517.454 264.725 –
Amapá 932 4 698 225 5 – 1.082.233 3.247 665.892 386.500 26.594 –
Tocantins 2.420 56 1.527 827 10 – 2.888.755 31.670 1.456.758 1.350.396 49.931 –
NORTHEAST 92.694 604 67.220 24.274 594 2 107.031.743 343.049 64.127.880 39.494.905 3.043.798 22.111
Maranhão 13.073 73 11.372 1.577 50 1 13.851.748 43.981 10.848.888 2.690.305 257.896 10.678
Piauí 5.939 39 4.511 1.363 26 – 6.581.935 20.547 4.303.494 2.126.031 131.863 –
Ceará 13.512 123 9.625 3.682 82 – 15.395.051 66.135 9.182.250 5.720.751 425.915 –
Rio Grande do Norte 6.759 30 4.533 2.148 48 – 8.075.196 16.807 4.324.482 3.488.346 245.561 –
Paraíba 7.560 75 5.369 2.073 43 – 8.641.970 42.005 5.122.026 3.258.787 219.152 –
Pernambuco 13.108 103 8.520 4.379 105 1 15.847.119 60.698 8.128.080 7.112.639 534.269 11.433
Alagoas 5.708 27 4.123 1.523 35 – 6.629.412 17.468 3.933.342 2.500.493 178.110 –
Sergipe 3.893 9 2.626 1.220 38 – 4.705.792 7.491 2.505.204 1.997.465 195.632 –
Bahia 23.142 125 16.541 6.309 167 – 27.303.521 67.917 15.780.114 10.600.089 855.401 –
SOUTHEAST 164.055 809 60.677 99.507 3.060 2 253.435.446 546.155 57.885.858 179.220.754 15.762.904 19.775
Minas Gerais 45.150 120 23.219 21.378 431 2 59.315.181 70.397 22.150.926 34.844.191 2.229.892 19.775
Espírito Santo 7.235 31 3.744 3.357 103 – 9.844.693 19.083 3.571.776 5.728.774 525.060 –
Rio de Janeiro 26.144 59 10.114 15.480 491 – 39.631.276 38.407 9.648.756 27.435.057 2.509.056 –
São Paulo 85.526 599 23.600 59.292 2.035 – 144.644.297 418.269 22.514.400 111.212.733 10.498.895 –
SOUTH 73.632 847 30.609 41.451 725 – 102.040.003 532.543 29.200.986 68.564.285 3.742.189 –
Paraná 24.326 192 10.597 13.303 234 – 32.910.696 126.727 10.109.538 21.463.822 1.210.609 –
Santa Catarina 21.584 341 7.794 13.255 194 – 30.533.484 215.164 7.435.476 21.887.867 994.977 –
Rio Grande do Sul 27.722 314 12.218 14.893 297 – 38.595.823 190.652 11.655.972 25.212.595 1.536.604 –
CENTER-WEST 53.036 139 28.398 23.914 584 1 69.824.973 87.823 27.091.692 39.622.026 3.011.986 11.446
Mato Grosso do Sul 6.606 54 2.977 3.536 39 – 8.702.922 34.185 2.840.058 5.627.344 201.334 –
Mato Grosso 6.075 19 2.784 3.232 40 – 8.116.564 11.726 2.655.936 5.241.696 207.206 –
Goiás 10.295 38 4.616 5.534 107 – 14.028.061 24.354 4.403.664 9.051.653 548.390 –
Federal District 30.060 28 18.021 11.612 398 1 38.977.426 17.558 17.192.034 19.701.332 2.055.056 11.446
SOURCE: DATAPREV, SUB, SINTESE.
GEOGRAPHICAL
REGIONS AND FEDERAL
STATES
BENEFITS CONCEDED BY VALUE RANGE, ACCORDING TO FEDERAL STATES
QUANTITY VALUE (R$)
Value ranges (in minimum wages) Value ranges (in minimum wages)
Social Security Statistical Bulletin Sep/2018
07
Urban Rural Urban Rural Urban Rural
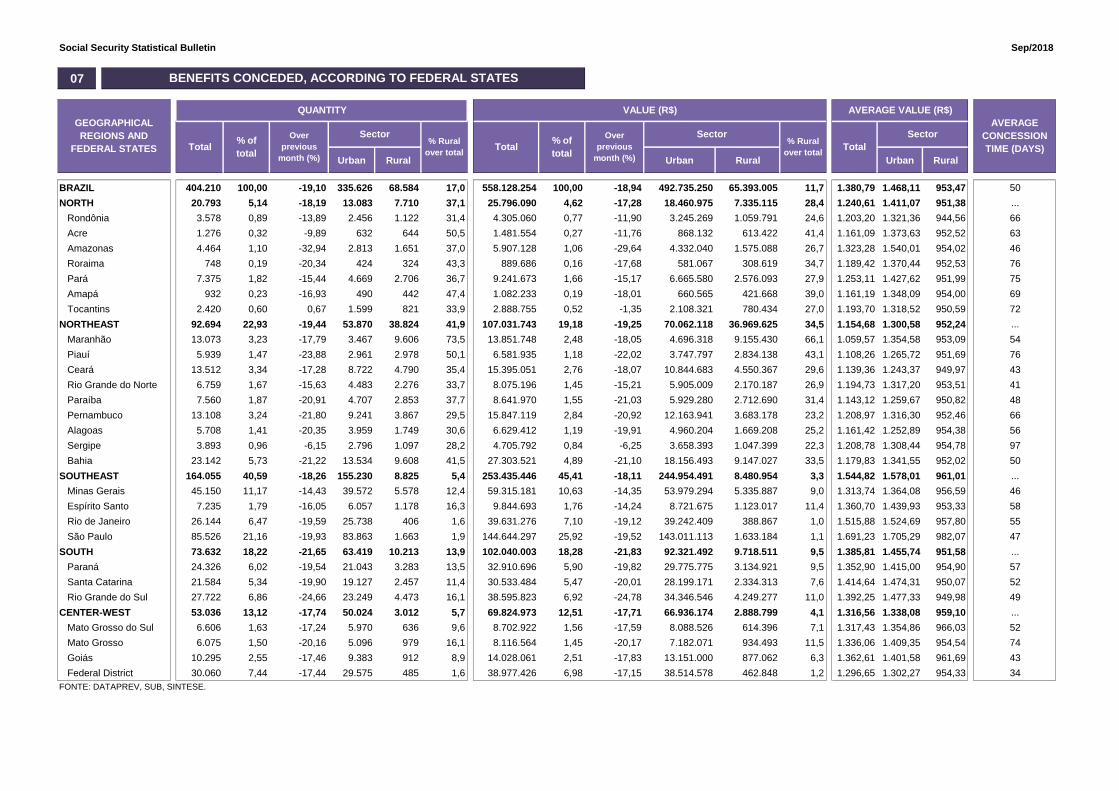
BRAZIL 404.210 100,00 -19,10 335.626 68.584 17,0 558.128.254 100,00 -18,94 492.735.250 65.393.005 11,7 1.380,79 1.468,11 953,47 50
NORTH 20.793 5,14 -18,19 13.083 7.710 37,1 25.796.090 4,62 -17,28 18.460.975 7.335.115 28,4 1.240,61 1.411,07 951,38 ...
Rondônia 3.578 0,89 -13,89 2.456 1.122 31,4 4.305.060 0,77 -11,90 3.245.269 1.059.791 24,6 1.203,20 1.321,36 944,56 66
Acre 1.276 0,32 -9,89 632 644 50,5 1.481.554 0,27 -11,76 868.132 613.422 41,4 1.161,09 1.373,63 952,52 63
Amazonas 4.464 1,10 -32,94 2.813 1.651 37,0 5.907.128 1,06 -29,64 4.332.040 1.575.088 26,7 1.323,28 1.540,01 954,02 46
Roraima 748 0,19 -20,34 424 324 43,3 889.686 0,16 -17,68 581.067 308.619 34,7 1.189,42 1.370,44 952,53 76
Pará 7.375 1,82 -15,44 4.669 2.706 36,7 9.241.673 1,66 -15,17 6.665.580 2.576.093 27,9 1.253,11 1.427,62 951,99 75
Amapá 932 0,23 -16,93 490 442 47,4 1.082.233 0,19 -18,01 660.565 421.668 39,0 1.161,19 1.348,09 954,00 69
Tocantins 2.420 0,60 0,67 1.599 821 33,9 2.888.755 0,52 -1,35 2.108.321 780.434 27,0 1.193,70 1.318,52 950,59 72
NORTHEAST 92.694 22,93 -19,44 53.870 38.824 41,9 107.031.743 19,18 -19,25 70.062.118 36.969.625 34,5 1.154,68 1.300,58 952,24 ...
Maranhão 13.073 3,23 -17,79 3.467 9.606 73,5 13.851.748 2,48 -18,05 4.696.318 9.155.430 66,1 1.059,57 1.354,58 953,09 54
Piauí 5.939 1,47 -23,88 2.961 2.978 50,1 6.581.935 1,18 -22,02 3.747.797 2.834.138 43,1 1.108,26 1.265,72 951,69 76
Ceará 13.512 3,34 -17,28 8.722 4.790 35,4 15.395.051 2,76 -18,07 10.844.683 4.550.367 29,6 1.139,36 1.243,37 949,97 43
Rio Grande do Norte 6.759 1,67 -15,63 4.483 2.276 33,7 8.075.196 1,45 -15,21 5.905.009 2.170.187 26,9 1.194,73 1.317,20 953,51 41
Paraíba 7.560 1,87 -20,91 4.707 2.853 37,7 8.641.970 1,55 -21,03 5.929.280 2.712.690 31,4 1.143,12 1.259,67 950,82 48
Pernambuco 13.108 3,24 -21,80 9.241 3.867 29,5 15.847.119 2,84 -20,92 12.163.941 3.683.178 23,2 1.208,97 1.316,30 952,46 66
Alagoas 5.708 1,41 -20,35 3.959 1.749 30,6 6.629.412 1,19 -19,91 4.960.204 1.669.208 25,2 1.161,42 1.252,89 954,38 56
Sergipe 3.893 0,96 -6,15 2.796 1.097 28,2 4.705.792 0,84 -6,25 3.658.393 1.047.399 22,3 1.208,78 1.308,44 954,78 97
Bahia 23.142 5,73 -21,22 13.534 9.608 41,5 27.303.521 4,89 -21,10 18.156.493 9.147.027 33,5 1.179,83 1.341,55 952,02 50
SOUTHEAST 164.055 40,59 -18,26 155.230 8.825 5,4 253.435.446 45,41 -18,11 244.954.491 8.480.954 3,3 1.544,82 1.578,01 961,01 ...
Minas Gerais 45.150 11,17 -14,43 39.572 5.578 12,4 59.315.181 10,63 -14,35 53.979.294 5.335.887 9,0 1.313,74 1.364,08 956,59 46
Espírito Santo 7.235 1,79 -16,05 6.057 1.178 16,3 9.844.693 1,76 -14,24 8.721.675 1.123.017 11,4 1.360,70 1.439,93 953,33 58
Rio de Janeiro 26.144 6,47 -19,59 25.738 406 1,6 39.631.276 7,10 -19,12 39.242.409 388.867 1,0 1.515,88 1.524,69 957,80 55
São Paulo 85.526 21,16 -19,93 83.863 1.663 1,9 144.644.297 25,92 -19,52 143.011.113 1.633.184 1,1 1.691,23 1.705,29 982,07 47
SOUTH 73.632 18,22 -21,65 63.419 10.213 13,9 102.040.003 18,28 -21,83 92.321.492 9.718.511 9,5 1.385,81 1.455,74 951,58 ...
Paraná 24.326 6,02 -19,54 21.043 3.283 13,5 32.910.696 5,90 -19,82 29.775.775 3.134.921 9,5 1.352,90 1.415,00 954,90 57
Santa Catarina 21.584 5,34 -19,90 19.127 2.457 11,4 30.533.484 5,47 -20,01 28.199.171 2.334.313 7,6 1.414,64 1.474,31 950,07 52
Rio Grande do Sul 27.722 6,86 -24,66 23.249 4.473 16,1 38.595.823 6,92 -24,78 34.346.546 4.249.277 11,0 1.392,25 1.477,33 949,98 49
CENTER-WEST 53.036 13,12 -17,74 50.024 3.012 5,7 69.824.973 12,51 -17,71 66.936.174 2.888.799 4,1 1.316,56 1.338,08 959,10 ...
Mato Grosso do Sul 6.606 1,63 -17,24 5.970 636 9,6 8.702.922 1,56 -17,59 8.088.526 614.396 7,1 1.317,43 1.354,86 966,03 52
Mato Grosso 6.075 1,50 -20,16 5.096 979 16,1 8.116.564 1,45 -20,17 7.182.071 934.493 11,5 1.336,06 1.409,35 954,54 74
Goiás 10.295 2,55 -17,46 9.383 912 8,9 14.028.061 2,51 -17,83 13.151.000 877.062 6,3 1.362,61 1.401,58 961,69 43
Federal District 30.060 7,44 -17,44 29.575 485 1,6 38.977.426 6,98 -17,15 38.514.578 462.848 1,2 1.296,65 1.302,27 954,33 34
FONTE: DATAPREV, SUB, SINTESE.
Sector% Rural
over total
AVERAGE
CONCESSION
TIME (DAYS)Total% of
total
Over
previous
month (%)
Total
Sector
BENEFITS CONCEDED, ACCORDING TO FEDERAL STATES
QUANTITY VALUE (R$) AVERAGE VALUE (R$)
GEOGRAPHICAL
REGIONS AND
FEDERAL STATES Total% of
total
Over
previous
month (%)
Sector% Rural
over total
Social Security Statistical Bulletin Sep/2018
97
74
66
75
34
76
76
72
56
66
54
57
69
55
58
50
49
46
52
63
47
52
48
46
41
43
43
Sergipe
Mato Grosso
Pernambuco
Pará
Federal District
Piauí
Roraima
Tocantins
Alagoas
Rondônia
Maranhão
Paraná
Amapá
Rio de Janeiro
Espírito Santo
Bahia
Rio Grande do Sul
Amazonas
Santa Catarina
Acre
São Paulo
Mato Grosso do Sul
Paraíba
Minas Gerais
Rio Grande do Norte
Ceará
Goiás
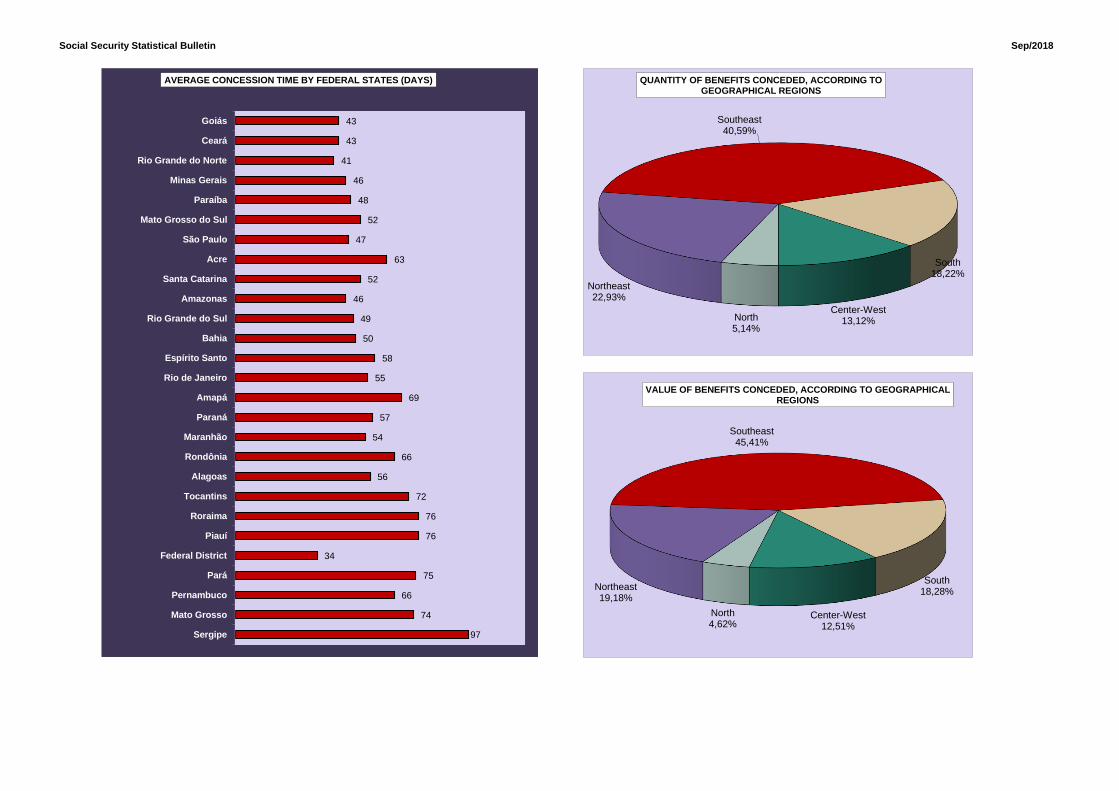
AVERAGE CONCESSION TIME BY FEDERAL STATES (DAYS)
North5,14%
Northeast22,93%
Southeast40,59%
South18,22%
Center-West13,12%
QUANTITY OF BENEFITS CONCEDED, ACCORDING TO GEOGRAPHICAL REGIONS
North4,62%
Northeast19,18%
Southeast45,41%
South18,28%
Center-West12,51%
VALUE OF BENEFITS CONCEDED, ACCORDING TO GEOGRAPHICAL REGIONS
Social Security Statistical Bulletin Sep/2018
08
(continue)
Urban Rural Urban Rural Urban Rural
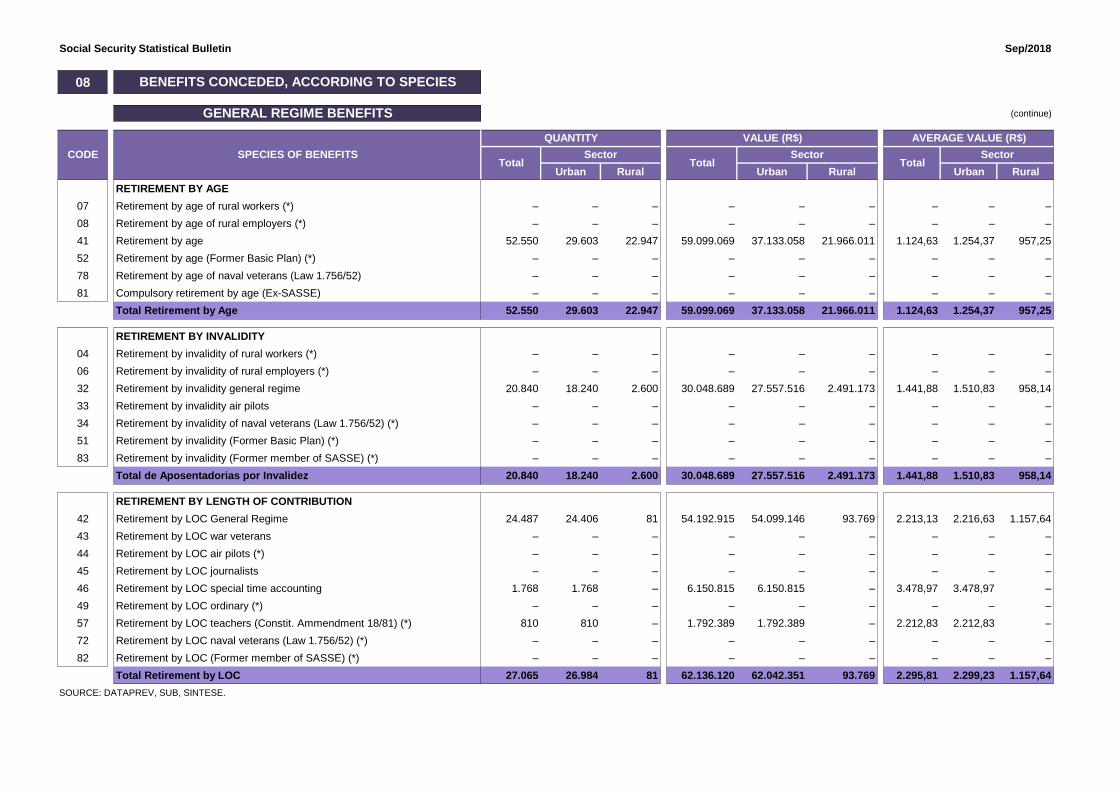
RETIREMENT BY AGE
07 Retirement by age of rural workers (*) – – – – – – – – –
08 Retirement by age of rural employers (*) – – – – – – – – –
41 Retirement by age 52.550 29.603 22.947 59.099.069 37.133.058 21.966.011 1.124,63 1.254,37 957,25
52 Retirement by age (Former Basic Plan) (*) – – – – – – – – –
78 Retirement by age of naval veterans (Law 1.756/52) – – – – – – – – –
81 Compulsory retirement by age (Ex-SASSE) – – – – – – – – –
Total Retirement by Age 52.550 29.603 22.947 59.099.069 37.133.058 21.966.011 1.124,63 1.254,37 957,25
RETIREMENT BY INVALIDITY
04 Retirement by invalidity of rural workers (*) – – – – – – – – –
06 Retirement by invalidity of rural employers (*) – – – – – – – – –
32 Retirement by invalidity general regime 20.840 18.240 2.600 30.048.689 27.557.516 2.491.173 1.441,88 1.510,83 958,14
33 Retirement by invalidity air pilots – – – – – – – – –
34 Retirement by invalidity of naval veterans (Law 1.756/52) (*) – – – – – – – – –
51 Retirement by invalidity (Former Basic Plan) (*) – – – – – – – – –
83 Retirement by invalidity (Former member of SASSE) (*) – – – – – – – – –
Total de Aposentadorias por Invalidez 20.840 18.240 2.600 30.048.689 27.557.516 2.491.173 1.441,88 1.510,83 958,14
RETIREMENT BY LENGTH OF CONTRIBUTION
42 Retirement by LOC General Regime 24.487 24.406 81 54.192.915 54.099.146 93.769 2.213,13 2.216,63 1.157,64
43 Retirement by LOC war veterans – – – – – – – – –
44 Retirement by LOC air pilots (*) – – – – – – – – –
45 Retirement by LOC journalists – – – – – – – – –
46 Retirement by LOC special time accounting 1.768 1.768 – 6.150.815 6.150.815 – 3.478,97 3.478,97 –
49 Retirement by LOC ordinary (*) – – – – – – – – –
57 Retirement by LOC teachers (Constit. Ammendment 18/81) (*) 810 810 – 1.792.389 1.792.389 – 2.212,83 2.212,83 –
72 Retirement by LOC naval veterans (Law 1.756/52) (*) – – – – – – – – –
82 Retirement by LOC (Former member of SASSE) (*) – – – – – – – – –
Total Retirement by LOC 27.065 26.984 81 62.136.120 62.042.351 93.769 2.295,81 2.299,23 1.157,64
SOURCE: DATAPREV, SUB, SINTESE.
TotalCODE SPECIES OF BENEFITS
Total Total
AVERAGE VALUE (R$)
Sector Sector Sector
BENEFITS CONCEDED, ACCORDING TO SPECIES
GENERAL REGIME BENEFITS
QUANTITY VALUE (R$)

Social Security Statistical Bulletin Sep/2018
(continue)
Urban Rural Urban Rural Urban Rural
SURVIVOR PENSIONS
01 Survivor pension of rural worker (*) – – – – – – – – –
03 Suvivor pension of rural employer (*) – – – – – – – – –
21 Survivor pension General Regime 27.850 18.957 8.893 40.841.281 32.320.935 8.520.346 1.466,47 1.704,96 958,10
23 Survivor pension of war veteran 6 6 – 19.731 19.731 – 3.288,43 3.288,43 –
27 Survivor pension federal servant with double retirement – – – – – – – – –
28 Survivor Pension General Regime (Decree 20.465/31) (*) – – – – – – – – –
29 Survivor pension of naval veteran (Law 1.756/52) – – – – – – – – –
55 Survivor pension (Former Basic Plan) (*) – – – – – – – – –
84 Survivor pension (Former member of SASSE) (*) 2 2 – 11.277 11.277 – 5.638,62 5.638,62 –
Total Survivor Pensions 27.858 18.965 8.893 40.872.289 32.351.943 8.520.346 1.467,17 1.705,88 958,10
TEMPORARY BENEFITS
13 Sickness benefit of rural worker (*) – – – – – – – – –
25 Imprisionment benefit 1.540 1.442 98 1.888.800 1.791.815 96.986 1.226,49 1.242,59 989,65
31 Sickness benefit General Regime 181.513 164.811 16.702 260.503.826 244.568.833 15.934.993 1.435,18 1.483,94 954,08
36 Partial Invalidity Benefit 1.687 1.372 315 1.240.574 1.087.922 152.652 735,37 792,95 484,61
50 Sickness Benefit (Former Basic Plan) (*) – – – – – – – – –
Total Temporary Benefits 184.740 167.625 17.115 263.633.200 247.448.570 16.184.631 1.427,05 1.476,20 945,64
LABOUR ACCIDENT BENEFITS
02 Survivor pension due to labour accident of rural worker (*) – – – – – – – – –
05 Retirement by Invalidity due to labour accident of rural worker (*) – – – – – – – – –
10 Sickness benefit due to labour accident of rural worker (*) – – – – – – – – –
91 Sickness benefit due to labour accident 16.066 15.506 560 25.900.668 25.366.428 534.240 1.612,14 1.635,91 954,00
92 Retirement by Invalidity due to labour accident 941 888 53 1.688.611 1.636.582 52.028 1.794,49 1.843,00 981,67
93 Survivor pension due to labour accident 24 24 – 47.343 47.343 – 1.972,63 1.972,63 –
94 Partial invalidity benefit due to labour accident 1.831 1.757 74 1.890.609 1.852.949 37.660 1.032,56 1.054,61 508,92
95 Supplementary benefit due to labour accident (*) 4 4 – 1.760 1.760 – 440,03 440,03 –
Total Labour Accident Benefits 18.866 18.179 687 29.528.991 28.905.062 623.928 1.565,20 1.590,02 908,19
OTHER BENEFITS
47 Continued Service Bonus 25% (*) – – – – – – – – –
48 Continued Service Bonus 20% (*) – – – – – – – – –
79 Continued Service Bonus Public Servant (Law 1.756/52) – – – – – – – – –
80 Maternity benefit 47.595 31.334 16.261 49.221.873 33.708.727 15.513.146 1.034,18 1.075,79 954,01
Total Other Benefits 47.595 31.334 16.261 49.221.873 33.708.727 15.513.146 1.034,18 1.075,79 954,01
TOTAL BENEFITS OF THE GENERAL REGIME 379.514 310.930 68.584 534.540.231 469.147.227 65.393.005 1.408,49 1.508,85 953,47
SOURCE: DATAPREV, SUB, SINTESE.
CODE SPECIES OF BENEFITSTotal Total
QUANTITY VALUE (R$) AVERAGE VALUE (R$)
Sector Sector SectorTotal

Social Security Statistical Bulletin Sep/2018
(conclusion)
Urban Rural Urban Rural Urban Rural
11 Old Social Assistance Pens. invalidity rural worker (Law 6.179/74) (*) – – – – – – – – –
12 Old Social Assistance Pens. age rural worker (Law 6.179/74) (*) – – – – – – – – –
30 Old Social Assistance Pension by invalidity (Law 6179/74) (*) – – – – – – – – –
40 Old Social Assistance Pension by age (Law 6179/74) (*) – – – – – – – – –
87 New Social Assistance Pension impaired person (LOAS) 13.089 13.089 – 12.487.157 12.487.157 – 954,02 954,02 –
88 New Social Assistance Pension aged person (LOAS) 11.580 11.580 – 11.047.463 11.047.463 – 954,01 954,01 –
Total Assistential Benefits 24.669 24.669 – 23.534.620 23.534.620 – 954,02 954,02 –
SOURCE: DATAPREV, SUB, SINTESE.
Urban Rural Urban Rural Urban Rural
22 Survivor pension of former public servants (*) – – – – – – – – –
26 Special Pensions (Law 593/48) (*) – – – – – – – – –
37 Retirement of supernummerary of federal servants (*) – – – – – – – – –
38 Retirements of Former CAPIN (*) – – – – – – – – –
54 Special lifelong survivor pensions (Law 9.793/99) – – – – – – – – –
56 Talidomid victim special pension (Law 7.070/82) 3 3 – 8.270 8.270 – 2.756,74 2.756,74 –
58 Special retirement of victims of dictatorship (Law 6.683/79) – – – – – – – – –
59 Survivor benefit victims of dictatorship (Law 6.683/79) – – – – – – – – –
60 Special Lifelong Pension (Law 10.923/2004) 1 1 – 1.326 1.326 – 1.326,06 1.326,06 –
76 Family benefit of former Train Company RFFSA (Decree-Law 956/69) – – – – – – – – –
85 Assistance Benefit of rubber worker (Law 7.986/89) 7 7 – 13.356 13.356 – 1.908,00 1.908,00 –
86 Assistential Survivor Benefit of rubber worker (Law 7.986/89) 13 13 – 24.804 24.804 – 1.908,00 1.908,00 –
89 Special pension for hemodialysis victims of Caruaru – – – – – – – – –
96 Special Pension to victims of Hansen Disease (Law 11.520/2007) 3 3 – 5.647 5.647 – 1.882,24 1.882,24 –
Total Treasury Owed Benefits 27 27 – 53.403 53.403 – 1.977,89 1.977,89 –
SOURCE: DATAPREV, SUB, SINTESE.
(*) Extinct Species. Any concessions are due to judicial decision or administrative revisions.
CODE SPECIES OF BENEFITSTotal Total
QUANTITY VALUE (R$)
Sector Sector
CODE SPECIES OF BENEFITSTotal Total
AVERAGE VALUE (R$)
TREASURY OWED BENEFITS - BLE
ASSISTENTIAL BENEFITS
QUANTITY VALUE (R$)
Sector
Sector Sector SectorTotal
Total
AVERAGE VALUE (R$)

Social Security Statistical Bulletin Sep/2018
Sickness Benefits Maternity Benefit Imprisionment Benefit Others
50,33%
27,85%
13,20%
7,72%
0,43% 0,47% 0,00%
QUANTITY OF BENEFITS CONCEDED OF THE GENERAL REGIME, ACCORDING TO GROUPS OF SPECIES
Sickness Benefits Maternity Benefit Imprisionment Benefit Others
51,58%
29,96%
9,75%8,09%
0,37% 0,25% 0,00%
VALUE OF BENEFITS CONCEDED OF THE GENERAL REGIME, ACCORDING TO GROUPS OF SPECIES
SicknessBenefits
Partial Invalidity Retirements SurvivorPension
Siupplementarybenefit
85,16%
9,71%4,99% 0,13% 0,02%
QUANTITY OF LABOUR ACCIDENT BENEFITS CONCEDED ACCORDING TO GROUPS OF SPECIES
SicknessBenefits
Partial Invalidity Retirements SurvivorPension
Siupplementarybenefit
87,71%
6,40% 5,72%0,16% 0,01%
VALUE OF LABOUR ACCIDENT BENEFITS CONCEDED, ACCORDING TO GROUPS OF SPECIES
Social Security Statistical Bulletin Sep/2018
09
Urban Rural Urban Rural
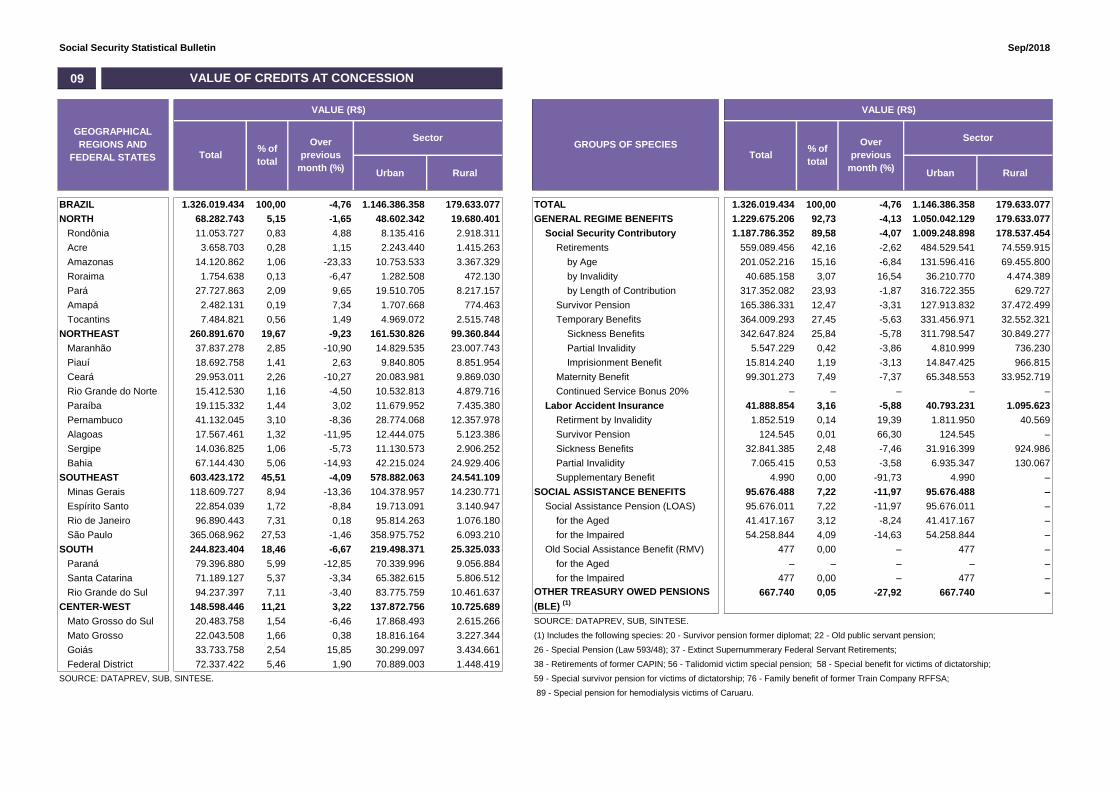
BRAZIL 1.326.019.434 100,00 -4,76 1.146.386.358 179.633.077 TOTAL 1.326.019.434 100,00 -4,76 1.146.386.358 179.633.077
NORTH 68.282.743 5,15 -1,65 48.602.342 19.680.401 GENERAL REGIME BENEFITS 1.229.675.206 92,73 -4,13 1.050.042.129 179.633.077
Rondônia 11.053.727 0,83 4,88 8.135.416 2.918.311 Social Security Contributory 1.187.786.352 89,58 -4,07 1.009.248.898 178.537.454
Acre 3.658.703 0,28 1,15 2.243.440 1.415.263 Retirements 559.089.456 42,16 -2,62 484.529.541 74.559.915
Amazonas 14.120.862 1,06 -23,33 10.753.533 3.367.329 by Age 201.052.216 15,16 -6,84 131.596.416 69.455.800
Roraima 1.754.638 0,13 -6,47 1.282.508 472.130 by Invalidity 40.685.158 3,07 16,54 36.210.770 4.474.389
Pará 27.727.863 2,09 9,65 19.510.705 8.217.157 by Length of Contribution 317.352.082 23,93 -1,87 316.722.355 629.727
Amapá 2.482.131 0,19 7,34 1.707.668 774.463 Survivor Pension 165.386.331 12,47 -3,31 127.913.832 37.472.499
Tocantins 7.484.821 0,56 1,49 4.969.072 2.515.748 Temporary Benefits 364.009.293 27,45 -5,63 331.456.971 32.552.321
NORTHEAST 260.891.670 19,67 -9,23 161.530.826 99.360.844 Sickness Benefits 342.647.824 25,84 -5,78 311.798.547 30.849.277
Maranhão 37.837.278 2,85 -10,90 14.829.535 23.007.743 Partial Invalidity 5.547.229 0,42 -3,86 4.810.999 736.230
Piauí 18.692.758 1,41 2,63 9.840.805 8.851.954 Imprisionment Benefit 15.814.240 1,19 -3,13 14.847.425 966.815
Ceará 29.953.011 2,26 -10,27 20.083.981 9.869.030 Maternity Benefit 99.301.273 7,49 -7,37 65.348.553 33.952.719
Rio Grande do Norte 15.412.530 1,16 -4,50 10.532.813 4.879.716 Continued Service Bonus 20% – – – – –
Paraíba 19.115.332 1,44 3,02 11.679.952 7.435.380 Labor Accident Insurance 41.888.854 3,16 -5,88 40.793.231 1.095.623
Pernambuco 41.132.045 3,10 -8,36 28.774.068 12.357.978 Retirment by Invalidity 1.852.519 0,14 19,39 1.811.950 40.569
Alagoas 17.567.461 1,32 -11,95 12.444.075 5.123.386 Survivor Pension 124.545 0,01 66,30 124.545 –
Sergipe 14.036.825 1,06 -5,73 11.130.573 2.906.252 Sickness Benefits 32.841.385 2,48 -7,46 31.916.399 924.986
Bahia 67.144.430 5,06 -14,93 42.215.024 24.929.406 Partial Invalidity 7.065.415 0,53 -3,58 6.935.347 130.067
SOUTHEAST 603.423.172 45,51 -4,09 578.882.063 24.541.109 Supplementary Benefit 4.990 0,00 -91,73 4.990 –
Minas Gerais 118.609.727 8,94 -13,36 104.378.957 14.230.771 SOCIAL ASSISTANCE BENEFITS 95.676.488 7,22 -11,97 95.676.488 –
Espírito Santo 22.854.039 1,72 -8,84 19.713.091 3.140.947 Social Assistance Pension (LOAS) 95.676.011 7,22 -11,97 95.676.011 –
Rio de Janeiro 96.890.443 7,31 0,18 95.814.263 1.076.180 for the Aged 41.417.167 3,12 -8,24 41.417.167 –
São Paulo 365.068.962 27,53 -1,46 358.975.752 6.093.210 for the Impaired 54.258.844 4,09 -14,63 54.258.844 –
SOUTH 244.823.404 18,46 -6,67 219.498.371 25.325.033 Old Social Assistance Benefit (RMV) 477 0,00 – 477 –
Paraná 79.396.880 5,99 -12,85 70.339.996 9.056.884 for the Aged – – – – –
Santa Catarina 71.189.127 5,37 -3,34 65.382.615 5.806.512 for the Impaired 477 0,00 – 477 –
Rio Grande do Sul 94.237.397 7,11 -3,40 83.775.759 10.461.637 667.740 0,05 -27,92 667.740 –
CENTER-WEST 148.598.446 11,21 3,22 137.872.756 10.725.689
Mato Grosso do Sul 20.483.758 1,54 -6,46 17.868.493 2.615.266 SOURCE: DATAPREV, SUB, SINTESE.
Mato Grosso 22.043.508 1,66 0,38 18.816.164 3.227.344 (1) Includes the following species: 20 - Survivor pension former diplomat; 22 - Old public servant pension;
Goiás 33.733.758 2,54 15,85 30.299.097 3.434.661 26 - Special Pension (Law 593/48); 37 - Extinct Supernummerary Federal Servant Retirements;
Federal District 72.337.422 5,46 1,90 70.889.003 1.448.419 38 - Retirements of former CAPIN; 56 - Talidomid victim special pension; 58 - Special benefit for victims of dictatorship;
SOURCE: DATAPREV, SUB, SINTESE. 59 - Special survivor pension for victims of dictatorship; 76 - Family benefit of former Train Company RFFSA;
89 - Special pension for hemodialysis victims of Caruaru.
GROUPS OF SPECIES
OTHER TREASURY OWED PENSIONS
(BLE) (1)
Total% of
total
VALUE OF CREDITS AT CONCESSION
VALUE (R$) VALUE (R$)
Sector Sector
Total% of
total
Over
previous
month (%)
GEOGRAPHICAL
REGIONS AND
FEDERAL STATES
Over
previous
month (%)

Social Security Statistical Bulletin Sep/2018
27,53%8,94%
7,31%
7,11%
5,99%
5,37%
5,06%
3,10%
2,85%
2,54%
2,26%
1,72%
2,09%
5,46%
1,66%
1,32%
1,44%
1,54%
1,06%
1,41%
1,16%
1,06%
0,83%
0,56%
0,28%
0,19%
0,13%
São Paulo
Minas Gerais
Rio de Janeiro
Rio Grande do Sul
Paraná
Santa Catarina
Bahia
Pernambuco
Maranhão
Goiás
Ceará
Espírito Santo
Pará
Federal District
Mato Grosso
Alagoas
Paraíba
Mato Grosso do Sul
Amazonas
Piauí
Rio Grande do Norte
Sergipe
Rondônia
Tocantins
Acre
Amapá
Roraima
VALUE OF CREDITS AT CONCESSION, ACCORDING TO FEDERAL STATES
Social Security Contributory
89,59%
Labor Accident Insurance
3,16%
Social Assistance Benefits7,22%
BLE0,03%
VALUE OF CREDITS AT CONCESSION, ACCORDING TO LARGE GROUPS
Urban86,45%
Rural13,55%
ALUE OF CREDITS AT CONCESSION, ACCORDING TO SECTOR

Social Security Statistical Bulletin Sep/2018
10
VALUE (R$) AVERAGE VALUE (R$)
Urban Rural Urban Rural Urban Rural
2006 December 24.593.390 2,68 17.088.587 7.504.803 12.635.504.461 11,41 10.181.274.305 2.454.230.156 513,78 595,79 327,02
2007 December 25.170.283 2,35 17.493.668 7.676.615 13.600.616.846 7,64 10.921.267.175 2.679.349.671 540,34 624,30 349,03
2008 December 26.095.625 3,68 18.193.777 7.901.848 15.205.539.497 11,80 12.181.513.603 3.024.025.894 582,69 669,54 382,70
2009 December 27.048.356 3,65 18.906.231 8.142.125 17.124.126.415 12,62 13.660.404.584 3.463.721.831 633,09 722,53 425,41
2010 December 28.141.263 4,04 19.763.710 8.377.553 19.336.202.952 12,92 15.469.082.460 3.867.120.492 687,11 782,70 461,61
2011 December 29.051.423 3,23 20.473.754 8.577.669 21.199.611.087 9,64 17.033.178.566 4.166.432.521 729,73 831,95 485,73
2012 December 30.057.265 3,46 21.251.776 8.805.489 24.137.036.929 13,86 19.272.270.404 4.864.766.526 803,04 906,85 552,47
2013 December 31.199.043 3,80 22.151.402 9.047.641 27.140.475.950 12,44 21.689.482.793 5.450.993.157 869,91 979,15 602,48
2014 December 32.152.518 3,06 22.900.497 9.252.021 29.829.510.579 9,91 23.858.195.669 5.971.314.910 927,75 1.041,82 645,41
2015 December 32.701.562 1,71 23.355.198 9.346.364 32.730.831.216 9,73 26.147.191.768 6.583.639.449 1.000,90 1.119,54 704,41
2016 December 33.755.917 0,18 24.269.925 9.485.992 37.915.706.574 -32,42 30.425.243.410 7.490.463.164 1.123,23 1.253,62 789,63
2017 Total – – – – 531.142.558.449 9,45 426.051.649.342 105.090.909.108 – – –
January 33.795.638 0,12 24.307.886 9.487.752 40.546.100.489 6,94 32.523.951.898 8.022.148.591 1.199,74 1.338,00 845,53
February 33.825.153 0,09 24.334.986 9.490.167 40.563.236.164 0,04 32.549.301.982 8.013.934.182 1.199,20 1.337,55 844,45
March 33.843.284 0,05 24.352.042 9.491.242 40.620.568.779 0,14 32.608.315.422 8.012.253.357 1.200,25 1.339,04 844,17
April 33.917.410 0,22 24.411.042 9.506.368 40.697.070.193 0,19 32.680.910.409 8.016.159.784 1.199,89 1.338,78 843,24
May 33.991.925 0,22 24.480.149 9.511.776 40.847.173.199 0,37 32.824.169.500 8.023.003.699 1.201,67 1.340,85 843,48
June 34.029.485 0,11 24.516.513 9.512.972 40.914.592.834 0,17 32.893.750.998 8.020.841.835 1.202,33 1.341,70 843,15
July 34.067.090 0,11 24.550.358 9.516.732 40.973.657.915 0,14 32.954.247.454 8.019.410.461 1.202,73 1.342,31 842,66
August (1) 34.194.510 0,37 24.658.794 9.535.716 60.726.648.881 48,21 48.331.967.275 12.394.681.606 1.775,92 1.960,03 1.299,82
September 34.258.928 0,19 24.717.508 9.541.420 41.184.866.337 -32,18 33.154.470.507 8.030.395.830 1.202,16 1.341,34 841,64
October 34.289.291 0,09 24.750.966 9.538.325 41.262.128.119 0,19 33.235.415.906 8.026.712.213 1.203,35 1.342,79 841,52
November (1) 34.448.737 0,47 24.879.545 9.569.192 61.402.373.848 48,81 48.938.214.768 12.464.159.080 1.782,43 1.967,01 1.302,53
December 34.497.835 0,14 24.918.305 9.579.530 41.404.141.690 -32,57 33.356.933.222 8.047.208.468 1.200,20 1.338,65 840,04
2018 January 34.476.185 -0,06 24.912.639 9.563.546 42.293.694.384 2,15 34.094.985.914 8.198.708.469 1.226,75 1.368,58 857,29
February 34.528.077 0,15 24.958.940 9.569.137 42.343.521.874 0,12 34.144.833.138 8.198.688.736 1.226,35 1.368,04 856,78
March 34.613.955 0,25 25.037.492 9.576.463 42.370.137.696 0,06 34.173.753.026 8.196.384.670 1.224,08 1.364,90 855,89
April 34.671.708 0,17 25.091.258 9.580.450 42.566.028.274 0,46 34.362.365.317 8.203.662.956 1.227,69 1.369,50 856,29
May 34.638.381 -0,10 25.086.044 9.552.337 42.583.053.262 0,04 34.404.071.505 8.178.981.757 1.229,36 1.371,44 856,23
June 34.753.378 0,33 25.176.043 9.577.335 42.730.938.436 0,35 34.530.755.260 8.200.183.176 1.229,55 1.371,57 856,21
July 34.810.436 0,16 25.225.550 9.584.886 42.816.340.443 0,20 34.612.734.370 8.203.606.073 1.229,99 1.372,13 855,89
August (1) 34.730.284 -0,23 25.191.509 9.538.775 63.308.958.243 47,86 50.685.804.621 12.623.153.622 1.822,87 2.012,02 1.323,35
September 34.883.217 0,44 25.302.742 9.580.475 42.903.492.518 -32,23 34.710.166.733 8.193.325.785 1.229,92 1.371,79 855,21
Subtotal (2) – – – – 403.916.165.130 4,35 325.719.469.886 78.196.695.243 – – –
SOURCE: DATAPREV, SUB, SINTESE.
(1) Includes 13th payment. Emission value without the portion of the 13th benefit-salary: Total: R $ 41,289,813,307; Urban: R $ 33,263,536,325; Rural: R $ 8,026,276,982
(2) The variation corresponds to the proportion between the accumulated value of 2017 and the same period of 2016.
TotalOver last
year/month (%)Total
Sector
EVOLUTION OF BENEFIT EMISSION – 2006/2018
QUANTITY
Sector SectorYEARS/MONTHSTotal
Over last
year/month (%)
Social Security Statistical Bulletin Sep/2018
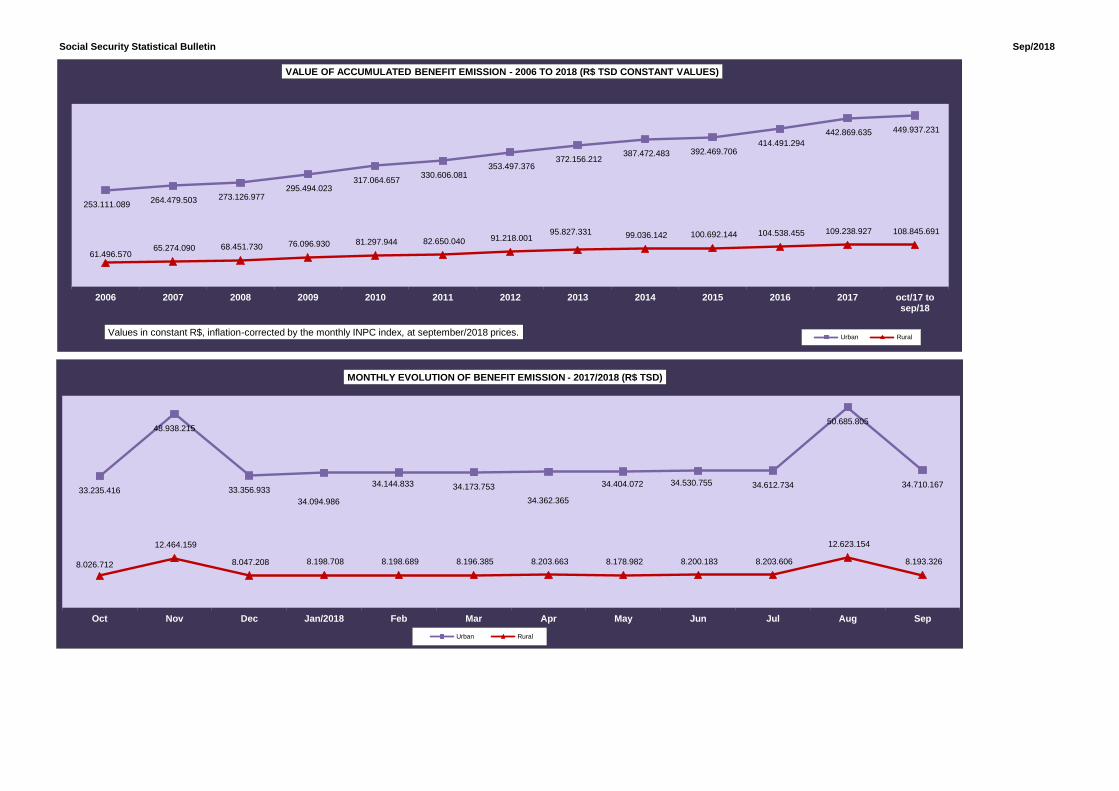
33.235.416
48.938.215
33.356.933
34.094.986
34.144.833 34.173.753
34.362.365
34.404.072 34.530.755 34.612.734
50.685.805
34.710.167
8.026.712
12.464.159
8.047.208 8.198.708 8.198.689 8.196.385 8.203.663 8.178.982 8.200.183 8.203.606
12.623.154
8.193.326
Oct Nov Dec Jan/2018 Feb Mar Apr May Jun Jul Aug Sep
MONTHLY EVOLUTION OF BENEFIT EMISSION - 2017/2018 (R$ TSD)
Urban Rural
253.111.089 264.479.503 273.126.977
295.494.023 317.064.657
330.606.081 353.497.376
372.156.212 387.472.483 392.469.706
414.491.294
442.869.635 449.937.231
61.496.570 65.274.090 68.451.730 76.096.930 81.297.944 82.650.040 91.218.001
95.827.331 99.036.142 100.692.144 104.538.455 109.238.927 108.845.691
2006 2007 2008 2009 2010 2011 2012 2013 2014 2015 2016 2017 oct/17 tosep/18
Values in constant R$, inflation-corrected by the monthly INPC index, at september/2018 prices.
VALUE OF ACCUMULATED BENEFIT EMISSION - 2006 TO 2018 (R$ TSD CONSTANT VALUES)
Urban Rural

Social Security Statistical Bulletin Sep/2018
11
Urban Rural Urban Rural Urban Rural
TOTAL 34.883.217 100,00 0,44 25.302.742 9.580.475 42.903.492.518 100,00 -32,23 34.710.166.733 8.193.325.785 1.229,92 1.371,79 855,21
GENERAL REGIME BENEFITS 30.126.344 86,36 100,00 0,49 20.599.497 9.526.847 38.358.047.785 89,41 100,00 -34,73 30.215.784.988 8.142.262.797 1.273,24 1.466,82 854,67
Social Security Contributory 29.322.117 84,06 97,33 100,00 0,48 19.824.755 9.497.362 37.447.808.334 87,28 97,63 100,00 -34,80 29.327.959.856 8.119.848.479 1.277,12 1.479,36 854,96
Retirements 20.234.789 58,01 67,17 69,01 0,77 13.286.541 6.948.248 26.692.231.463 62,21 69,59 71,28 -35,27 20.749.938.734 5.942.292.728 1.319,13 1.561,73 855,22
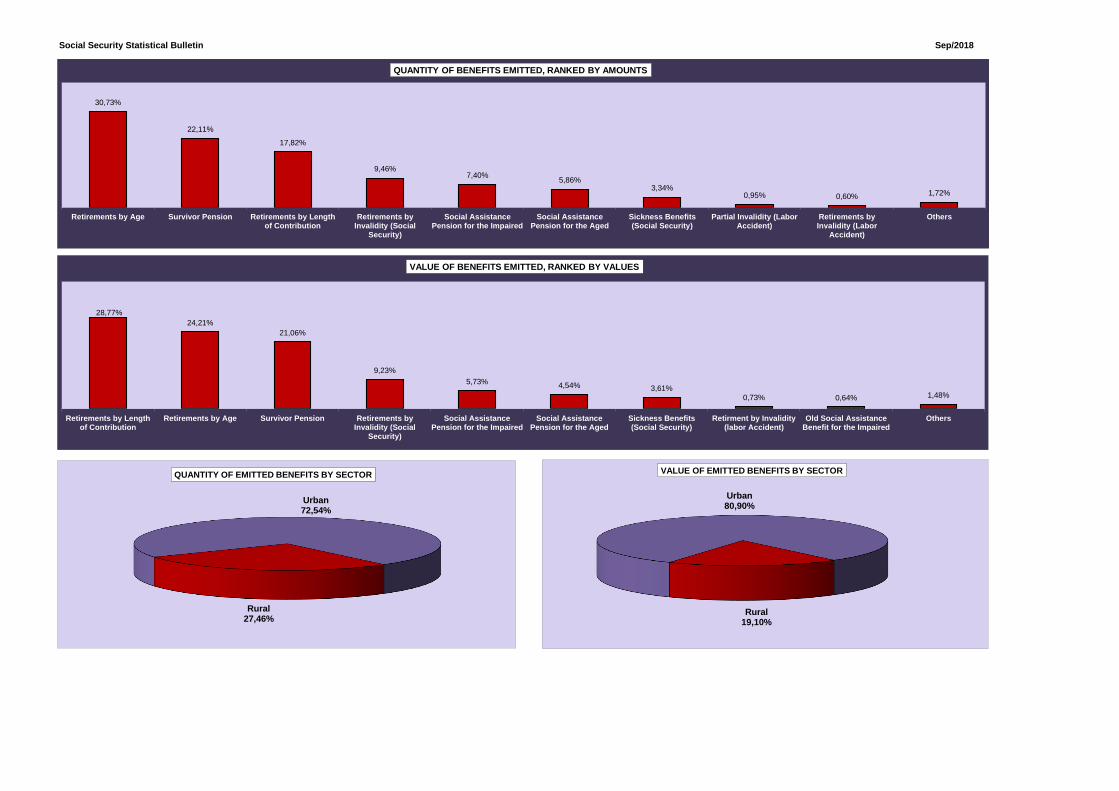
by Age 10.718.489 30,73 35,58 36,55 0,30 4.246.675 6.471.814 10.388.261.108 24,21 27,08 27,74 -35,32 4.862.229.396 5.526.031.712 969,19 1.144,95 853,86
by Invalidity 3.299.794 9,46 10,95 11,25 3,28 2.846.648 453.146 3.960.477.204 9,23 10,33 10,58 -34,93 3.569.235.663 391.241.541 1.200,22 1.253,84 863,39
by Length of Contribution 6.216.506 17,82 20,63 21,20 0,28 6.193.218 23.288 12.343.493.150 28,77 32,18 32,96 -35,32 12.318.473.675 25.019.475 1.985,60 1.989,03 1.074,35
Survivor Pension 7.714.294 22,11 25,61 26,31 0,07 5.342.946 2.371.348 9.033.441.766 21,06 23,55 24,12 -35,92 7.013.276.151 2.020.165.615 1.171,00 1.312,62 851,91
Temporary Benefits 1.306.762 3,75 4,34 4,46 -0,92 1.135.759 171.003 1.665.485.386 3,88 4,34 4,45 -18,00 1.513.316.252 152.169.134 1.274,51 1.332,43 889,86
Sickness Benefits 1.165.839 3,34 3,87 3,98 -1,11 1.016.580 149.259 1.550.395.697 3,61 4,04 4,14 -16,66 1.409.953.513 140.442.184 1.329,85 1.386,96 940,93
Partial Invalidity 92.996 0,27 0,31 0,32 1,78 74.573 18.423 66.102.308 0,15 0,17 0,18 -31,59 57.295.683 8.806.625 710,81 768,32 478,02
Imprisionment Benefit 47.927 0,14 0,16 0,16 -1,32 44.606 3.321 48.987.381 0,11 0,13 0,13 -33,87 46.067.056 2.920.325 1.022,12 1.032,75 879,35
Maternity Benefit 66.183 0,19 0,22 0,23 -8,18 59.420 6.763 56.578.509 0,13 0,15 0,15 -21,79 51.357.508 5.221.001 854,88 864,31 771,99
Continued Service Bonus 20% 89 0,00 0,00 0,00 – 89 – 71.211 0,00 0,00 0,00 – 71.211 – 800,13 800,13 –
Labor Accident Insurance 804.227 2,31 2,67 100,00 0,70 774.742 29.485 910.239.450 2,12 2,37 100,00 -31,66 887.825.133 22.414.318 1.131,82 1.145,96 760,19
Retirment by Invalidity 211.025 0,60 0,70 26,24 3,55 198.099 12.926 311.233.034 0,73 0,81 34,19 -35,03 300.248.979 10.984.055 1.474,86 1.515,65 849,76
Survivor Pension 109.645 0,31 0,36 13,63 -0,23 105.893 3.752 139.143.020 0,32 0,36 15,29 -37,52 135.916.176 3.226.845 1.269,03 1.283,52 860,03
Sickness Benefits 112.091 0,32 0,37 13,94 -1,57 107.535 4.556 173.320.669 0,40 0,45 19,04 -16,32 169.044.341 4.276.328 1.546,25 1.571,99 938,61
Partial Invalidity 330.855 0,95 1,10 41,14 0,22 322.604 8.251 276.718.806 0,64 0,72 30,40 -33,02 272.791.716 3.927.090 836,37 845,59 475,95
Supplementary Benefit 40.611 0,12 0,13 5,05 -0,81 40.611 – 9.823.921 0,02 0,03 1,08 -0,82 9.823.921 – 241,90 241,90 –
SOCIAL ASSISTANCE BENEFITS 4.737.686 13,58 100,00 0,13 4.684.058 53.628 4.509.521.137 10,51 100,00 0,13 4.458.458.149 51.062.988 951,84 951,84 952,17
Social Assistance Pension (LOAS) 4.625.576 13,26 97,63 100,00 0,16 4.625.576 – 4.402.840.570 10,26 97,63 100,00 0,16 4.402.840.570 – 951,85 951,85 –
for the Aged 2.042.932 5,86 43,12 44,17 0,10 2.042.932 – 1.946.428.138 4,54 43,16 44,21 0,10 1.946.428.138 – 952,76 952,76 –
for the Impaired 2.582.644 7,40 54,51 55,83 0,20 2.582.644 – 2.456.412.432 5,73 54,47 55,79 0,20 2.456.412.432 – 951,12 951,12 –
Old Social Assistance Benefit (RMV) 112.110 0,32 2,37 100,00 -0,92 58.482 53.628 106.680.567 0,25 2,37 100,00 -0,92 55.617.579 51.062.988 951,57 951,02 952,17
for the Aged 13.978 0,04 0,30 12,47 -1,82 6.984 6.994 13.329.983 0,03 0,30 12,50 -1,82 6.658.543 6.671.440 953,64 953,40 953,88
for the Impaired 98.132 0,28 2,07 87,53 -0,79 51.498 46.634 93.350.584 0,22 2,07 87,50 -0,79 48.959.036 44.391.548 951,28 950,70 951,91
19.187 0,06 – – -0,49 19.187 – 35.923.596 0,08 – – -11,68 35.923.596 – 1.872,29 1.872,29 –
SOURCE: DATAPREV, SUB, SINTESE.
(1) Includes the following species: 47 - Continued Service Bonus 25%; 48 - Continued Service Bonus 20%; 68 - Special retirement lump sum payment; 79 - Continued Service Bonus Federal Servant. (2) Includes the species: 22 - Survivor Pension of Former Servant;
26 - Special Pension (Law 593/48); 37 - Extinct Supernummerary Federal Servant Retirements; 38 - Retirements of former CAPIN; 56 - Talidomid victim special pension; 58 - Special benefit for victims of dictatorship;
59 - Special survivor pension for victims of dictatorship; 60 - Special lifelong survivor pension; 76 - Family benefit of former Train Company RFFSA; 85 - Assistance Benefit of rubber worker; 86 - 'Assistential Survivor Benefit of rubber worker;
89 - Special pension for hemodialysis victims of Caruaru. Doesn't include BLE complements.
SectorGROUPS OF SPECIES Sector
OTHER TREASURY OWED PENSIONS
(BLE) (1)
VALUE (R$)
Sector
AVERAGE VALUE (R$)
% of
sub-
group
Total
BENEFIT EMISSION, ACCORDING TO GROUPS OF SPECIES
QUANTITY
% of
total
Over last
month (%)Total
Over last
month (%)
% of
the
group
Total% of
total
% of
the
group
% of
sub-
group
Social Security Statistical Bulletin Sep/2018
Urban72,54%
Rural27,46%
QUANTITY OF EMITTED BENEFITS BY SECTOR
Urban80,90%
Rural19,10%
VALUE OF EMITTED BENEFITS BY SECTOR
30,73%
22,11%
17,82%
9,46%7,40%
5,86%3,34%
0,95% 0,60% 1,72%
Retirements by Age Survivor Pension Retirements by Lengthof Contribution
Retirements byInvalidity (Social
Security)
Social AssistancePension for the Impaired
Social AssistancePension for the Aged
Sickness Benefits(Social Security)
Partial Invalidity (LaborAccident)
Retirements byInvalidity (Labor
Accident)
Others
QUANTITY OF BENEFITS EMITTED, RANKED BY AMOUNTS
28,77%
24,21%
21,06%
9,23%
5,73%4,54% 3,61%
0,73% 0,64% 1,48%
Retirements by Lengthof Contribution
Retirements by Age Survivor Pension Retirements byInvalidity (Social
Security)
Social AssistancePension for the Impaired
Social AssistancePension for the Aged
Sickness Benefits(Social Security)
Retirment by Invalidity(labor Accident)
Old Social AssistanceBenefit for the Impaired
Others
VALUE OF BENEFITS EMITTED, RANKED BY VALUES

Social Security Statistical Bulletin Sep/2018
12
TOTAL 34.883.217 100,00 – 30.126.344 4.737.686 19.187 47.305.367.613 100,00 – 42.754.366.342 4.513.181.306 37.819.965
< 1 785.517 2,25 2,25 775.974 9.413 130 401.945.777 0,85 0,85 399.488.267 2.401.375 56.135
= 1 22.479.497 64,44 66,69 17.749.133 4.728.251 2.113 21.445.440.138 45,33 46,18 16.932.672.882 4.510.751.454 2.015.802
1 -| 2 5.863.542 16,81 83,50 5.847.622 20 15.900 7.872.127.093 16,64 62,82 7.844.707.407 23.332 27.396.354
2 -| 3 2.860.093 8,20 91,70 2.859.829 1 263 6.749.550.010 14,27 77,09 6.748.911.161 2.166 636.684
3 -| 4 1.804.183 5,17 96,87 1.803.939 1 243 5.937.587.844 12,55 89,64 5.936.787.661 2.979 797.204
4 -| 5 779.722 2,24 99,11 779.643 – 79 3.278.776.253 6,93 96,58 3.278.440.689 – 335.564
5 -| 6 301.923 0,87 99,97 301.858 – 65 1.542.129.706 3,26 99,84 1.541.791.513 – 338.193
6 -| 7 3.233 0,01 99,98 3.183 – 50 20.141.201 0,04 99,88 19.833.266 – 307.934
7 -| 8 1.927 0,01 99,99 1.896 – 31 13.521.723 0,03 99,91 13.299.689 – 222.035
8 -| 9 706 0,00 99,99 677 – 29 5.691.312 0,01 99,92 5.453.993 – 237.319
9 -| 10 478 0,00 99,99 460 – 18 4.336.010 0,01 99,93 4.173.189 – 162.821
10 -| 20 2.065 0,01 100,00 1.916 – 149 25.513.012 0,05 99,98 23.405.251 – 2.107.761
20 -| 30 224 0,00 100,00 159 – 65 5.013.135 0,01 99,99 3.566.159 – 1.446.976
30 -| 40 103 0,00 100,00 55 – 48 3.423.068 0,01 100,00 1.835.214 – 1.587.854
40 -| 50 3 0,00 100,00 – – 3 120.415 0,00 100,00 – – 120.415
50 -| 60 1 0,00 100,00 – – 1 50.915 0,00 100,00 – – 50.915
60 -| 70 – – 100,00 – – – – – 100,00 – – –
70 -| 80 – – 100,00 – – – – – 100,00 – – –
80 -| 90 – – 100,00 – – – – – 100,00 – – –
90 -| 100 – – 100,00 – – – – – 100,00 – – –
> 100 – – 100,00 – – – – – 100,00 – – –
SOURCE: DATAPREV, SUB, SINTESE.
Note: The sum of the emissions in this table differs from tables 10, 11, 15 and 16 because data refer to the monthly payments adjusted to inflation and exclude other credits/debits authorized by the beneficiary.
% of
total
% Accumu-
lated
% Accumu-
lated
Benefit
General
Regime
Assistential
Benefits
Treasury
Benefits
BLE
BENEFIT EMISSION BY LARGE GROUPS, ACCORDING TO VALUE RANGES
QUANTITY VALUE (R$)
Treasury
Benefits BLE
VALUE RANGES (NR MINIMUM WAGES) Total
Benefit General
Regime
Assistential
BenefitsTotal
% of
total

Social Security Statistical Bulletin Sep/2018
13
TotalBenefits
Gral Reg.
Assistential
Benefits
Treasur
y EPUTotal
Benefits Gral
Reg.
Assistential
Benefits
Treasury
EPUTotal
Benefits
Gral Reg.
Assistential
BenefitsTotal
Benefits Gral
Reg.
Assistential
Benefits
TOTAL 25.302.742 20.599.497 4.684.058 19.187 38.173.178.864 33.673.270.179 4.462.088.719 37.819.965 9.580.475 9.526.847 53.628 9.132.188.749 9.081.096.163 51.092.587
< 1 705.854 696.411 9.313 130 366.921.510 364.489.841 2.375.533 56.135 79.663 79.563 100 35.024.268 34.998.426 25.842
= 1 13.055.279 8.378.441 4.674.725 2.113 12.454.736.166 7.993.032.714 4.459.687.650 2.015.802 9.424.218 9.370.692 53.526 8.990.703.972 8.939.640.168 51.063.804
1 -| 2 5.796.202 5.780.284 18 15.900 7.789.693.483 7.762.276.739 20.391 27.396.354 67.340 67.338 2 82.433.610 82.430.668 2.941
2 -| 3 2.853.297 2.853.033 1 263 6.734.238.081 6.733.599.232 2.166 636.684 6.796 6.796 – 15.311.929 15.311.929 –
3 -| 4 1.802.366 1.802.122 1 243 5.931.617.254 5.930.817.070 2.979 797.204 1.817 1.817 – 5.970.590 5.970.590 –
4 -| 5 779.167 779.088 – 79 3.276.476.950 3.276.141.386 – 335.564 555 555 – 2.299.303 2.299.303 –
5 -| 6 301.840 301.775 – 65 1.541.704.203 1.541.366.010 – 338.193 83 83 – 425.503 425.503 –
6 -| 7 3.230 3.180 – 50 20.121.626 19.813.692 – 307.934 3 3 – 19.575 19.575 –
7 -| 8 1.927 1.896 – 31 13.521.723 13.299.689 – 222.035 – – – – – –
8 -| 9 706 677 – 29 5.691.312 5.453.993 – 237.319 – – – – – –
9 -| 10 478 460 – 18 4.336.010 4.173.189 – 162.821 – – – – – –
10 -| 20 2.065 1.916 – 149 25.513.012 23.405.251 – 2.107.761 – – – – – –
20 -| 30 224 159 – 65 5.013.135 3.566.159 – 1.446.976 – – – – – –
30 -| 40 103 55 – 48 3.423.068 1.835.214 – 1.587.854 – – – – – –
40 -| 50 3 – – 3 120.415 – – 120.415 – – – – – –
50 -| 60 1 – – 1 50.915 – – 50.915 – – – – – –
60 -| 70 – – – – – – – – – – – – – –
70 -| 80 – – – – – – – – – – – – – –
80 -| 90 – – – – – – – – – – – – – –
90 -| 100 – – – – – – – – – – – – – –
> 100 – – – – – – – – – – – – – –
SOURCE: DATAPREV, SUB, SINTESE.
Note: The sum of the emissions in this table differs from tables 10, 11, 15 and 16 because data refer to the monthly payments adjusted to inflation and exclude other credits/debits authorized by the beneficiary.
VALUE RANGES (NR MINIMUM WAGES)
BENEFIT EMISSION BY SECTOR AND LARGE GROUPS, ACCORDING TO VALUE RANGES
URBAN SECTOR RURAL SECTOR
Quantity Value (R$) Quantity Value (R$)
Social Security Statistical Bulletin Sep/2018
Valor
< 1
= 1
1 ─┤ 2
2 ─┤ 3
3 ─┤ 4
4 ─┤ 5
< 1 = 1 1 ─┤ 2 2 ─┤ 3 3 ─┤ 4 4 ─┤ 5 >5
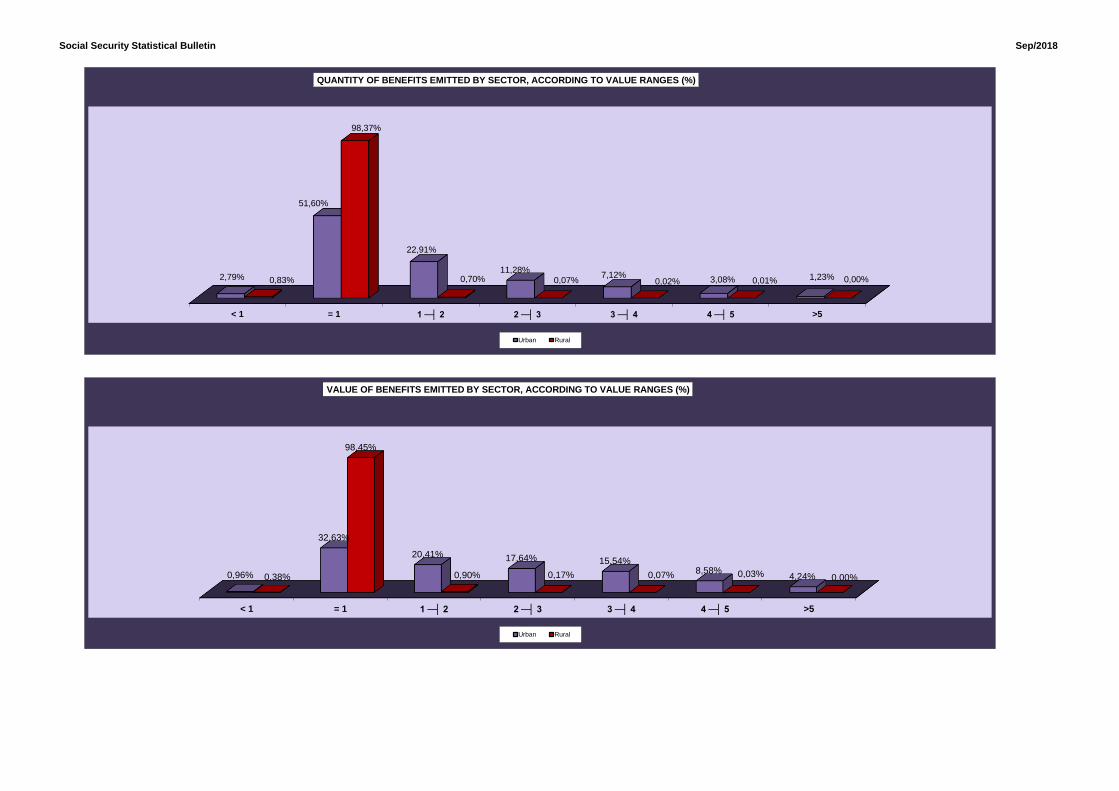
0,96%
32,63%
20,41% 17,64% 15,54%8,58%
4,24%0,38%
98,45%
0,90% 0,17% 0,07% 0,03% 0,00%
VALUE OF BENEFITS EMITTED BY SECTOR, ACCORDING TO VALUE RANGES (%)
Urban Rural
< 1 = 1 1 ─┤ 2 2 ─┤ 3 3 ─┤ 4 4 ─┤ 5 >5
2,79%
51,60%
22,91%
11,28%7,12%
3,08% 1,23%0,83%
98,37%
0,70% 0,07% 0,02% 0,01% 0,00%
QUANTITY OF BENEFITS EMITTED BY SECTOR, ACCORDING TO VALUE RANGES (%)
Urban Rural
Social Security Statistical Bulletin Sep/2018
14
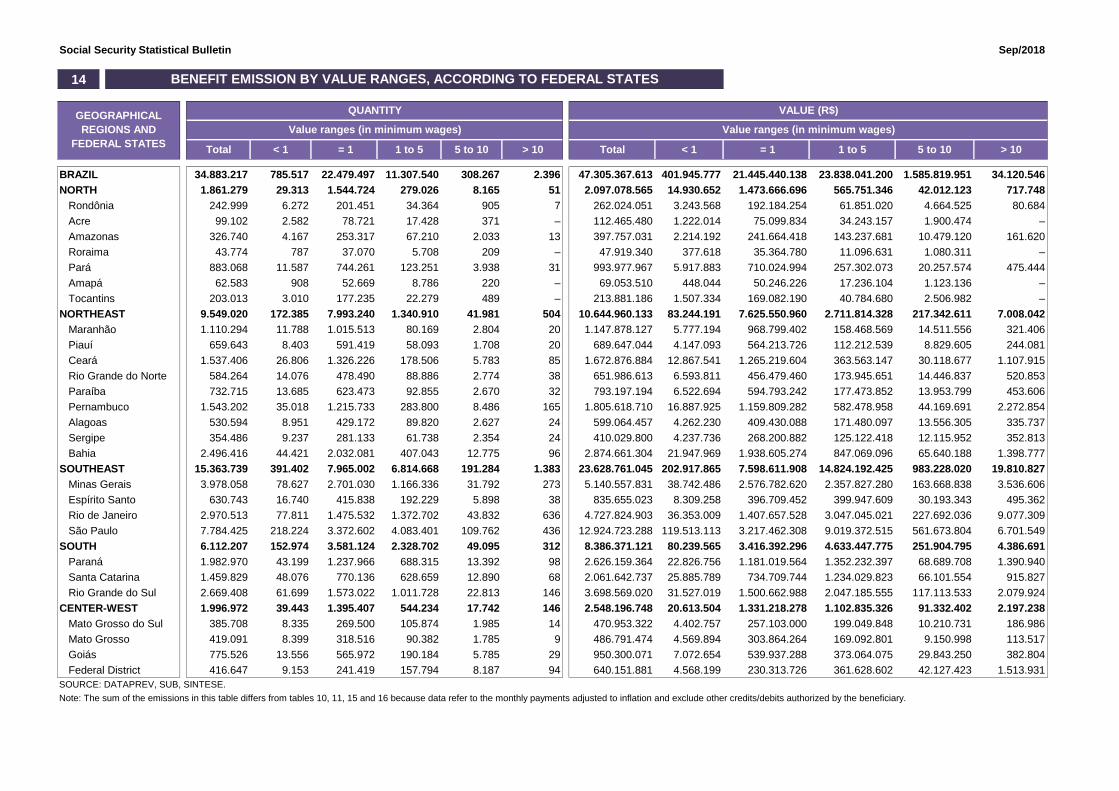
Total < 1 = 1 1 to 5 5 to 10 > 10 Total < 1 = 1 1 to 5 5 to 10 > 10
BRAZIL 34.883.217 785.517 22.479.497 11.307.540 308.267 2.396 47.305.367.613 401.945.777 21.445.440.138 23.838.041.200 1.585.819.951 34.120.546
NORTH 1.861.279 29.313 1.544.724 279.026 8.165 51 2.097.078.565 14.930.652 1.473.666.696 565.751.346 42.012.123 717.748
Rondônia 242.999 6.272 201.451 34.364 905 7 262.024.051 3.243.568 192.184.254 61.851.020 4.664.525 80.684
Acre 99.102 2.582 78.721 17.428 371 – 112.465.480 1.222.014 75.099.834 34.243.157 1.900.474 –
Amazonas 326.740 4.167 253.317 67.210 2.033 13 397.757.031 2.214.192 241.664.418 143.237.681 10.479.120 161.620
Roraima 43.774 787 37.070 5.708 209 – 47.919.340 377.618 35.364.780 11.096.631 1.080.311 –
Pará 883.068 11.587 744.261 123.251 3.938 31 993.977.967 5.917.883 710.024.994 257.302.073 20.257.574 475.444
Amapá 62.583 908 52.669 8.786 220 – 69.053.510 448.044 50.246.226 17.236.104 1.123.136 –
Tocantins 203.013 3.010 177.235 22.279 489 – 213.881.186 1.507.334 169.082.190 40.784.680 2.506.982 –
NORTHEAST 9.549.020 172.385 7.993.240 1.340.910 41.981 504 10.644.960.133 83.244.191 7.625.550.960 2.711.814.328 217.342.611 7.008.042
Maranhão 1.110.294 11.788 1.015.513 80.169 2.804 20 1.147.878.127 5.777.194 968.799.402 158.468.569 14.511.556 321.406
Piauí 659.643 8.403 591.419 58.093 1.708 20 689.647.044 4.147.093 564.213.726 112.212.539 8.829.605 244.081
Ceará 1.537.406 26.806 1.326.226 178.506 5.783 85 1.672.876.884 12.867.541 1.265.219.604 363.563.147 30.118.677 1.107.915
Rio Grande do Norte 584.264 14.076 478.490 88.886 2.774 38 651.986.613 6.593.811 456.479.460 173.945.651 14.446.837 520.853
Paraíba 732.715 13.685 623.473 92.855 2.670 32 793.197.194 6.522.694 594.793.242 177.473.852 13.953.799 453.606
Pernambuco 1.543.202 35.018 1.215.733 283.800 8.486 165 1.805.618.710 16.887.925 1.159.809.282 582.478.958 44.169.691 2.272.854
Alagoas 530.594 8.951 429.172 89.820 2.627 24 599.064.457 4.262.230 409.430.088 171.480.097 13.556.305 335.737
Sergipe 354.486 9.237 281.133 61.738 2.354 24 410.029.800 4.237.736 268.200.882 125.122.418 12.115.952 352.813
Bahia 2.496.416 44.421 2.032.081 407.043 12.775 96 2.874.661.304 21.947.969 1.938.605.274 847.069.096 65.640.188 1.398.777
SOUTHEAST 15.363.739 391.402 7.965.002 6.814.668 191.284 1.383 23.628.761.045 202.917.865 7.598.611.908 14.824.192.425 983.228.020 19.810.827
Minas Gerais 3.978.058 78.627 2.701.030 1.166.336 31.792 273 5.140.557.831 38.742.486 2.576.782.620 2.357.827.280 163.668.838 3.536.606
Espírito Santo 630.743 16.740 415.838 192.229 5.898 38 835.655.023 8.309.258 396.709.452 399.947.609 30.193.343 495.362
Rio de Janeiro 2.970.513 77.811 1.475.532 1.372.702 43.832 636 4.727.824.903 36.353.009 1.407.657.528 3.047.045.021 227.692.036 9.077.309
São Paulo 7.784.425 218.224 3.372.602 4.083.401 109.762 436 12.924.723.288 119.513.113 3.217.462.308 9.019.372.515 561.673.804 6.701.549
SOUTH 6.112.207 152.974 3.581.124 2.328.702 49.095 312 8.386.371.121 80.239.565 3.416.392.296 4.633.447.775 251.904.795 4.386.691
Paraná 1.982.970 43.199 1.237.966 688.315 13.392 98 2.626.159.364 22.826.756 1.181.019.564 1.352.232.397 68.689.708 1.390.940
Santa Catarina 1.459.829 48.076 770.136 628.659 12.890 68 2.061.642.737 25.885.789 734.709.744 1.234.029.823 66.101.554 915.827
Rio Grande do Sul 2.669.408 61.699 1.573.022 1.011.728 22.813 146 3.698.569.020 31.527.019 1.500.662.988 2.047.185.555 117.113.533 2.079.924
CENTER-WEST 1.996.972 39.443 1.395.407 544.234 17.742 146 2.548.196.748 20.613.504 1.331.218.278 1.102.835.326 91.332.402 2.197.238
Mato Grosso do Sul 385.708 8.335 269.500 105.874 1.985 14 470.953.322 4.402.757 257.103.000 199.049.848 10.210.731 186.986
Mato Grosso 419.091 8.399 318.516 90.382 1.785 9 486.791.474 4.569.894 303.864.264 169.092.801 9.150.998 113.517
Goiás 775.526 13.556 565.972 190.184 5.785 29 950.300.071 7.072.654 539.937.288 373.064.075 29.843.250 382.804
Federal District 416.647 9.153 241.419 157.794 8.187 94 640.151.881 4.568.199 230.313.726 361.628.602 42.127.423 1.513.931
SOURCE: DATAPREV, SUB, SINTESE.
Note: The sum of the emissions in this table differs from tables 10, 11, 15 and 16 because data refer to the monthly payments adjusted to inflation and exclude other credits/debits authorized by the beneficiary.
GEOGRAPHICAL
REGIONS AND
FEDERAL STATES
BENEFIT EMISSION BY VALUE RANGES, ACCORDING TO FEDERAL STATES
QUANTITY VALUE (R$)
Value ranges (in minimum wages) Value ranges (in minimum wages)

Social Security Statistical Bulletin Sep/2018
15
Urban Rural Urban Rural Urban Rural
BRAZIL 34.883.217 100,00 0,44 25.302.742 9.580.475 27,5 42.903.492.518 100,00 -32,23 34.710.166.733 8.193.325.785 19,1 1.229,92 1.371,79 855,21
NORTH 1.861.279 5,34 0,54 986.930 874.349 47,0 1.890.573.686 4,41 -28,79 1.167.795.648 722.778.038 38,2 1.015,74 1.183,26 826,65
Rondônia 242.999 0,70 1,35 108.891 134.108 55,2 241.308.819 0,56 -28,50 126.087.189 115.221.630 47,7 993,04 1.157,92 859,17
Acre 99.102 0,28 0,70 53.544 45.558 46,0 103.253.068 0,24 -25,28 65.609.408 37.643.661 36,5 1.041,89 1.225,34 826,28
Amazonas 326.740 0,94 0,64 219.226 107.514 32,9 359.870.041 0,84 -27,35 270.214.017 89.656.024 24,9 1.101,40 1.232,58 833,90
Roraima 43.774 0,13 0,58 23.784 19.990 45,7 43.271.425 0,10 -27,82 26.828.621 16.442.804 38,0 988,52 1.128,01 822,55
Pará 883.068 2,53 0,25 453.658 429.410 48,6 885.078.768 2,06 -29,90 537.387.938 347.690.830 39,3 1.002,28 1.184,57 809,69
Amapá 62.583 0,18 0,26 42.536 20.047 32,0 62.641.625 0,15 -24,63 46.526.858 16.114.767 25,7 1.000,94 1.093,82 803,85
Tocantins 203.013 0,58 0,69 85.291 117.722 58,0 195.149.939 0,45 -29,90 95.141.618 100.008.321 51,2 961,27 1.115,49 849,53
NORTHEAST 9.549.020 27,37 0,55 4.820.796 4.728.224 49,5 9.615.915.813 22,41 -30,80 5.654.158.065 3.961.757.748 41,2 1.007,01 1.172,87 837,90
Maranhão 1.110.294 3,18 0,77 369.420 740.874 66,7 1.010.087.751 2,35 -30,91 412.830.362 597.257.388 59,1 909,75 1.117,51 806,15
Piauí 659.643 1,89 0,51 236.202 423.441 64,2 621.099.694 1,45 -31,79 264.848.848 356.250.846 57,4 941,57 1.121,28 841,32
Ceará 1.537.406 4,41 0,43 743.204 794.202 51,7 1.516.419.444 3,53 -30,81 849.895.508 666.523.937 44,0 986,35 1.143,56 839,24
Rio Grande do Norte 584.264 1,67 0,44 309.843 274.421 47,0 582.883.077 1,36 -31,47 354.727.722 228.155.355 39,1 997,64 1.144,86 831,41
Paraíba 732.715 2,10 0,54 369.098 363.617 49,6 718.625.964 1,67 -31,16 409.275.098 309.350.867 43,0 980,77 1.108,85 850,76
Pernambuco 1.543.202 4,42 0,38 944.516 598.686 38,8 1.632.955.864 3,81 -30,51 1.134.455.974 498.499.890 30,5 1.058,16 1.201,10 832,66
Alagoas 530.594 1,52 0,95 336.248 194.346 36,6 539.656.557 1,26 -29,52 378.894.391 160.762.166 29,8 1.017,08 1.126,83 827,20
Sergipe 354.486 1,02 0,73 205.737 148.749 42,0 370.744.668 0,86 -30,86 246.018.297 124.726.371 33,6 1.045,87 1.195,79 838,50
Bahia 2.496.416 7,16 0,55 1.306.528 1.189.888 47,7 2.623.442.793 6,11 -30,68 1.603.211.865 1.020.230.928 38,9 1.050,88 1.227,08 857,42
SOUTHEAST 15.363.739 44,04 0,30 13.517.725 1.846.014 12,0 21.438.139.932 49,97 -33,07 19.805.739.475 1.632.400.456 7,6 1.395,37 1.465,17 884,28
Minas Gerais 3.978.058 11,40 0,35 2.926.826 1.051.232 26,4 4.669.822.549 10,88 -32,44 3.744.800.652 925.021.897 19,8 1.173,90 1.279,47 879,94
Espírito Santo 630.743 1,81 0,61 448.190 182.553 28,9 754.827.107 1,76 -32,50 596.099.752 158.727.355 21,0 1.196,73 1.330,02 869,49
Rio de Janeiro 2.970.513 8,52 0,12 2.896.537 73.976 2,5 4.277.872.917 9,97 -33,17 4.212.554.485 65.318.432 1,5 1.440,11 1.454,34 882,97
São Paulo 7.784.425 22,32 0,33 7.246.172 538.253 6,9 11.735.617.359 27,35 -33,31 11.252.284.587 483.332.772 4,1 1.507,58 1.552,86 897,97
SOUTH 6.112.207 17,52 0,50 4.567.743 1.544.464 25,3 7.634.390.260 17,79 -32,98 6.266.119.694 1.368.270.567 17,9 1.249,04 1.371,82 885,92
Paraná 1.982.970 5,68 0,52 1.400.548 582.422 29,4 2.390.870.539 5,57 -32,54 1.876.740.230 514.130.309 21,5 1.205,70 1.340,00 882,75
Santa Catarina 1.459.829 4,18 0,68 1.137.169 322.660 22,1 1.876.413.129 4,37 -33,16 1.590.815.844 285.597.285 15,2 1.285,37 1.398,93 885,13
Rio Grande do Sul 2.669.408 7,65 0,40 2.030.026 639.382 24,0 3.367.106.592 7,85 -33,18 2.798.563.620 568.542.972 16,9 1.261,37 1.378,59 889,21
CENTER-WEST 1.996.972 5,72 0,69 1.409.548 587.424 29,4 2.324.472.827 5,42 -30,38 1.816.353.851 508.118.976 21,9 1.164,00 1.288,61 865,00
Mato Grosso do Sul 385.708 1,11 0,71 281.518 104.190 27,0 430.328.860 1,00 -29,33 338.904.080 91.424.779 21,2 1.115,69 1.203,85 877,48
Mato Grosso 419.091 1,20 1,23 249.540 169.551 40,5 445.111.511 1,04 -29,21 298.486.117 146.625.394 32,9 1.062,09 1.196,15 864,79
Goiás 775.526 2,22 0,48 527.438 248.088 32,0 863.917.760 2,01 -31,10 650.222.329 213.695.431 24,7 1.113,98 1.232,79 861,37
Federal District 416.647 1,19 0,50 351.052 65.595 15,7 585.114.696 1,36 -30,93 528.741.325 56.373.371 9,6 1.404,34 1.506,16 859,42
SOURCE: DATAPREV, SUB, SINTESE.
% of
total
Over previous
month (%)TotalTotal
% of
total
Over previous
month (%)
Sector
BENEFIT EMISSION, ACCORDING TO FEDERAL STATES
QUANTITY VALUE (R$) AVERAGE VALUE (R$)GEOGRAPHICAL
REGIONS AND
FEDERAL STATES% Rural over
total
Sector% Rural over total
SectorTotal

Social Security Statistical Bulletin Sep/2018
North5,34%
Northeast27,37%
Southeast44,04%
South17,52%
Center-West5,72%
QUANTITY OF BENEFITS EMITTED, ACCORDING TO GEOGRAPHICAL REGIONS
North4,41%
Northeast22,41%
Southeast49,97%
South17,79%
Center-West5,42%
QUANTITY OF BENEFITS EMITTED, ACCORDING TO GEOGRAPHICAL REGIONS
1.552,86
1.506,16
1.454,34
1.398,93
1.378,59
1.340,00
1.330,02
1.279,47
1.232,58
1.232,79
1.227,08
1.225,34
1.203,85
1.201,10
1.195,79
1.196,15
1.184,57
1.157,92
1.143,56
1.144,86
1.128,01
1.126,83
1.121,28
1.117,51
1.115,49
1.108,85
1.093,82
897,97
859,42
882,97
885,13
889,21
882,75
869,49
879,94
861,37
833,90
857,42
826,28
832,66
877,48
838,50
864,79
809,69
859,17
839,24
831,41
822,55
827,20
841,32
806,15
849,53
850,76
803,85
São Paulo
Federal District
Rio de Janeiro
Santa Catarina
Rio Grande do Sul
Paraná
Espírito Santo
Minas Gerais
Amazonas
Goiás
Bahia
Acre
Mato Grosso do Sul
Pernambuco
Sergipe
Mato Grosso
Pará
Rondônia
Ceará
Rio Grande do Norte
Roraima
Alagoas
Piauí
Maranhão
Tocantins
Paraíba
Amapá
AVERAGE VALUE OF BENEFITS EMITTED, ACCORDING TO FEDERAL STATES
Rural Urban
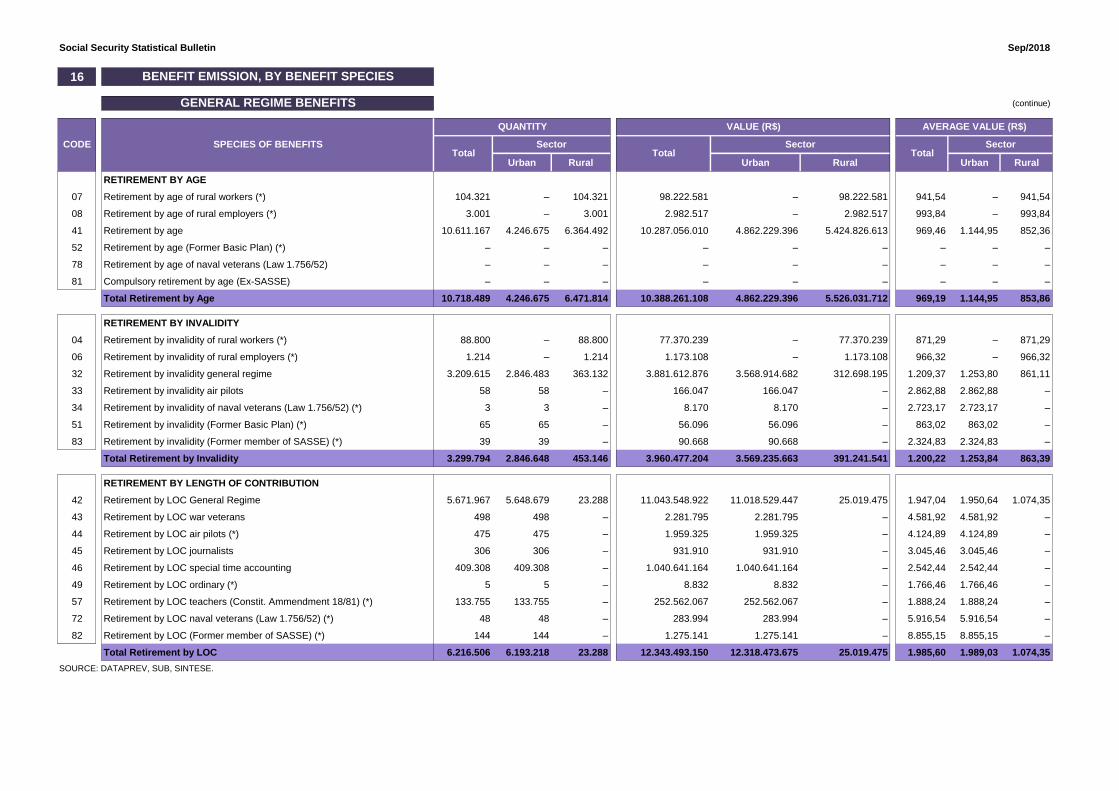
Social Security Statistical Bulletin Sep/2018
16
(continue)
Urban Rural Urban Rural Urban Rural
RETIREMENT BY AGE
07 Retirement by age of rural workers (*) 104.321 – 104.321 98.222.581 – 98.222.581 941,54 – 941,54
08 Retirement by age of rural employers (*) 3.001 – 3.001 2.982.517 – 2.982.517 993,84 – 993,84
41 Retirement by age 10.611.167 4.246.675 6.364.492 10.287.056.010 4.862.229.396 5.424.826.613 969,46 1.144,95 852,36
52 Retirement by age (Former Basic Plan) (*) – – – – – – – – –
78 Retirement by age of naval veterans (Law 1.756/52) – – – – – – – – –
81 Compulsory retirement by age (Ex-SASSE) – – – – – – – – –
Total Retirement by Age 10.718.489 4.246.675 6.471.814 10.388.261.108 4.862.229.396 5.526.031.712 969,19 1.144,95 853,86
RETIREMENT BY INVALIDITY
04 Retirement by invalidity of rural workers (*) 88.800 – 88.800 77.370.239 – 77.370.239 871,29 – 871,29
06 Retirement by invalidity of rural employers (*) 1.214 – 1.214 1.173.108 – 1.173.108 966,32 – 966,32
32 Retirement by invalidity general regime 3.209.615 2.846.483 363.132 3.881.612.876 3.568.914.682 312.698.195 1.209,37 1.253,80 861,11
33 Retirement by invalidity air pilots 58 58 – 166.047 166.047 – 2.862,88 2.862,88 –
34 Retirement by invalidity of naval veterans (Law 1.756/52) (*) 3 3 – 8.170 8.170 – 2.723,17 2.723,17 –
51 Retirement by invalidity (Former Basic Plan) (*) 65 65 – 56.096 56.096 – 863,02 863,02 –
83 Retirement by invalidity (Former member of SASSE) (*) 39 39 – 90.668 90.668 – 2.324,83 2.324,83 –
Total Retirement by Invalidity 3.299.794 2.846.648 453.146 3.960.477.204 3.569.235.663 391.241.541 1.200,22 1.253,84 863,39
RETIREMENT BY LENGTH OF CONTRIBUTION
42 Retirement by LOC General Regime 5.671.967 5.648.679 23.288 11.043.548.922 11.018.529.447 25.019.475 1.947,04 1.950,64 1.074,35
43 Retirement by LOC war veterans 498 498 – 2.281.795 2.281.795 – 4.581,92 4.581,92 –
44 Retirement by LOC air pilots (*) 475 475 – 1.959.325 1.959.325 – 4.124,89 4.124,89 –
45 Retirement by LOC journalists 306 306 – 931.910 931.910 – 3.045,46 3.045,46 –
46 Retirement by LOC special time accounting 409.308 409.308 – 1.040.641.164 1.040.641.164 – 2.542,44 2.542,44 –
49 Retirement by LOC ordinary (*) 5 5 – 8.832 8.832 – 1.766,46 1.766,46 –
57 Retirement by LOC teachers (Constit. Ammendment 18/81) (*) 133.755 133.755 – 252.562.067 252.562.067 – 1.888,24 1.888,24 –
72 Retirement by LOC naval veterans (Law 1.756/52) (*) 48 48 – 283.994 283.994 – 5.916,54 5.916,54 –
82 Retirement by LOC (Former member of SASSE) (*) 144 144 – 1.275.141 1.275.141 – 8.855,15 8.855,15 –
Total Retirement by LOC 6.216.506 6.193.218 23.288 12.343.493.150 12.318.473.675 25.019.475 1.985,60 1.989,03 1.074,35
SOURCE: DATAPREV, SUB, SINTESE.
SectorCODE SPECIES OF BENEFITSTotal Total Total
AVERAGE VALUE (R$)
BENEFIT EMISSION, BY BENEFIT SPECIES
GENERAL REGIME BENEFITS
QUANTITY VALUE (R$)
Sector Sector
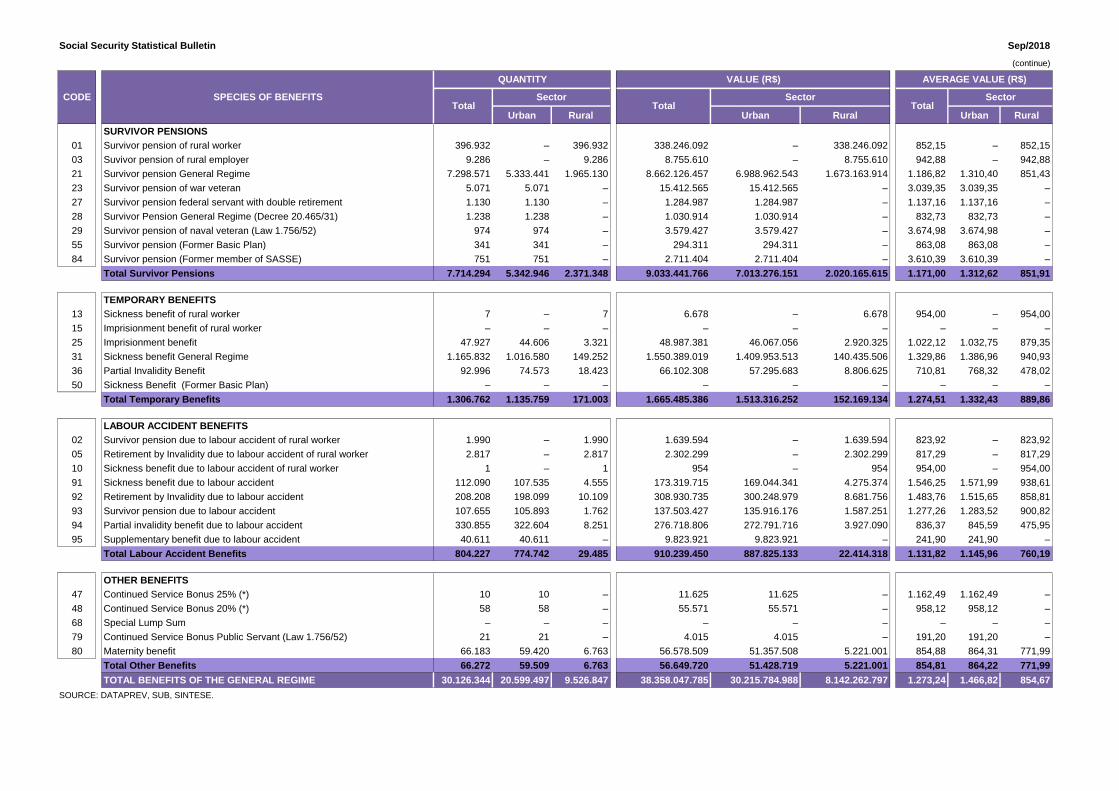
Social Security Statistical Bulletin Sep/2018
(continue)
Urban Rural Urban Rural Urban Rural
SURVIVOR PENSIONS
01 Survivor pension of rural worker 396.932 – 396.932 338.246.092 – 338.246.092 852,15 – 852,15
03 Suvivor pension of rural employer 9.286 – 9.286 8.755.610 – 8.755.610 942,88 – 942,88
21 Survivor pension General Regime 7.298.571 5.333.441 1.965.130 8.662.126.457 6.988.962.543 1.673.163.914 1.186,82 1.310,40 851,43
23 Survivor pension of war veteran 5.071 5.071 – 15.412.565 15.412.565 – 3.039,35 3.039,35 –
27 Survivor pension federal servant with double retirement 1.130 1.130 – 1.284.987 1.284.987 – 1.137,16 1.137,16 –
28 Survivor Pension General Regime (Decree 20.465/31) 1.238 1.238 – 1.030.914 1.030.914 – 832,73 832,73 –
29 Survivor pension of naval veteran (Law 1.756/52) 974 974 – 3.579.427 3.579.427 – 3.674,98 3.674,98 –
55 Survivor pension (Former Basic Plan) 341 341 – 294.311 294.311 – 863,08 863,08 –
84 Survivor pension (Former member of SASSE) 751 751 – 2.711.404 2.711.404 – 3.610,39 3.610,39 –
Total Survivor Pensions 7.714.294 5.342.946 2.371.348 9.033.441.766 7.013.276.151 2.020.165.615 1.171,00 1.312,62 851,91
TEMPORARY BENEFITS
13 Sickness benefit of rural worker 7 – 7 6.678 – 6.678 954,00 – 954,00
15 Imprisionment benefit of rural worker – – – – – – – – –
25 Imprisionment benefit 47.927 44.606 3.321 48.987.381 46.067.056 2.920.325 1.022,12 1.032,75 879,35
31 Sickness benefit General Regime 1.165.832 1.016.580 149.252 1.550.389.019 1.409.953.513 140.435.506 1.329,86 1.386,96 940,93
36 Partial Invalidity Benefit 92.996 74.573 18.423 66.102.308 57.295.683 8.806.625 710,81 768,32 478,02
50 Sickness Benefit (Former Basic Plan) – – – – – – – – –
Total Temporary Benefits 1.306.762 1.135.759 171.003 1.665.485.386 1.513.316.252 152.169.134 1.274,51 1.332,43 889,86
LABOUR ACCIDENT BENEFITS
02 Survivor pension due to labour accident of rural worker 1.990 – 1.990 1.639.594 – 1.639.594 823,92 – 823,92
05 Retirement by Invalidity due to labour accident of rural worker 2.817 – 2.817 2.302.299 – 2.302.299 817,29 – 817,29
10 Sickness benefit due to labour accident of rural worker 1 – 1 954 – 954 954,00 – 954,00
91 Sickness benefit due to labour accident 112.090 107.535 4.555 173.319.715 169.044.341 4.275.374 1.546,25 1.571,99 938,61
92 Retirement by Invalidity due to labour accident 208.208 198.099 10.109 308.930.735 300.248.979 8.681.756 1.483,76 1.515,65 858,81
93 Survivor pension due to labour accident 107.655 105.893 1.762 137.503.427 135.916.176 1.587.251 1.277,26 1.283,52 900,82
94 Partial invalidity benefit due to labour accident 330.855 322.604 8.251 276.718.806 272.791.716 3.927.090 836,37 845,59 475,95
95 Supplementary benefit due to labour accident 40.611 40.611 – 9.823.921 9.823.921 – 241,90 241,90 –
Total Labour Accident Benefits 804.227 774.742 29.485 910.239.450 887.825.133 22.414.318 1.131,82 1.145,96 760,19
OTHER BENEFITS
47 Continued Service Bonus 25% (*) 10 10 – 11.625 11.625 – 1.162,49 1.162,49 –
48 Continued Service Bonus 20% (*) 58 58 – 55.571 55.571 – 958,12 958,12 –
68 Special Lump Sum – – – – – – – – –
79 Continued Service Bonus Public Servant (Law 1.756/52) 21 21 – 4.015 4.015 – 191,20 191,20 –
80 Maternity benefit 66.183 59.420 6.763 56.578.509 51.357.508 5.221.001 854,88 864,31 771,99
Total Other Benefits 66.272 59.509 6.763 56.649.720 51.428.719 5.221.001 854,81 864,22 771,99
TOTAL BENEFITS OF THE GENERAL REGIME 30.126.344 20.599.497 9.526.847 38.358.047.785 30.215.784.988 8.142.262.797 1.273,24 1.466,82 854,67
SOURCE: DATAPREV, SUB, SINTESE.
AVERAGE VALUE (R$)
SectorTotalTotal
QUANTITY VALUE (R$)
Sector SectorCODE SPECIES OF BENEFITSTotal
Total TotalTotal TotalTotal TotalTotal TotalCÓD ESPÉCIES DE BENEFÍCIOS
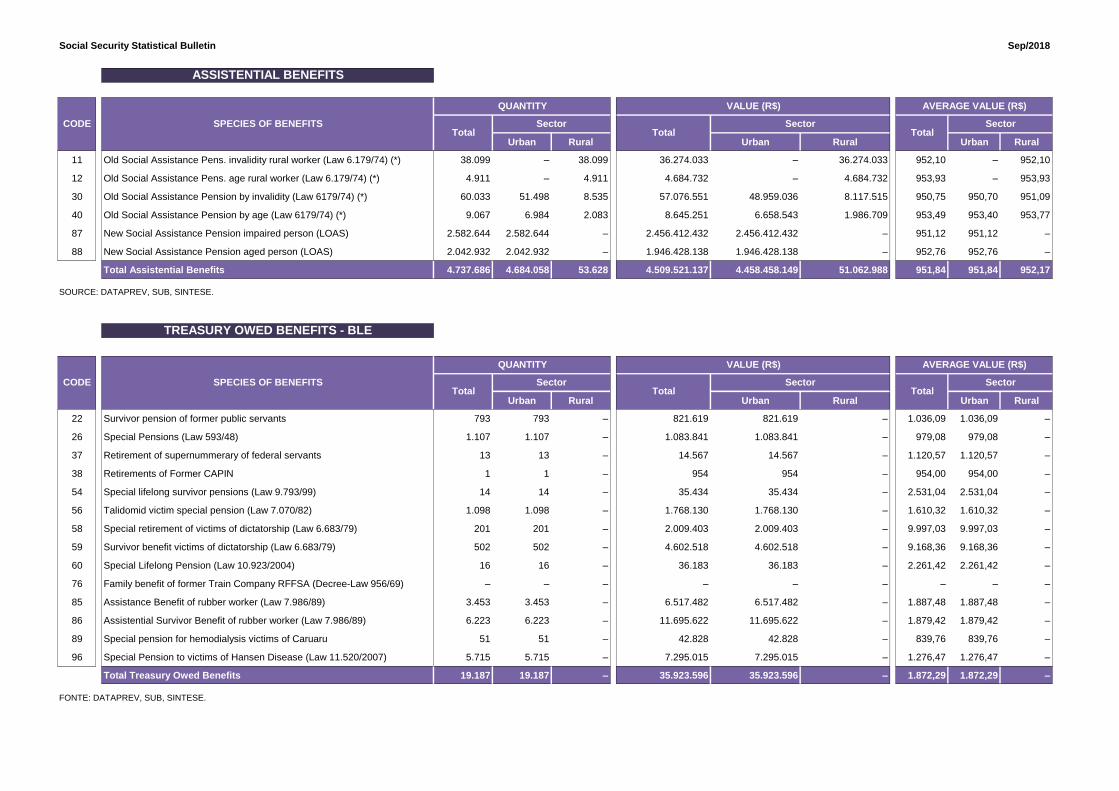
Social Security Statistical Bulletin Sep/2018
Urban Rural Urban Rural Urban Rural
11 Old Social Assistance Pens. invalidity rural worker (Law 6.179/74) (*) 38.099 – 38.099 36.274.033 – 36.274.033 952,10 – 952,10
12 Old Social Assistance Pens. age rural worker (Law 6.179/74) (*) 4.911 – 4.911 4.684.732 – 4.684.732 953,93 – 953,93
30 Old Social Assistance Pension by invalidity (Law 6179/74) (*) 60.033 51.498 8.535 57.076.551 48.959.036 8.117.515 950,75 950,70 951,09
40 Old Social Assistance Pension by age (Law 6179/74) (*) 9.067 6.984 2.083 8.645.251 6.658.543 1.986.709 953,49 953,40 953,77
87 New Social Assistance Pension impaired person (LOAS) 2.582.644 2.582.644 – 2.456.412.432 2.456.412.432 – 951,12 951,12 –
88 New Social Assistance Pension aged person (LOAS) 2.042.932 2.042.932 – 1.946.428.138 1.946.428.138 – 952,76 952,76 –
Total Assistential Benefits 4.737.686 4.684.058 53.628 4.509.521.137 4.458.458.149 51.062.988 951,84 951,84 952,17
SOURCE: DATAPREV, SUB, SINTESE.
Urban Rural Urban Rural Urban Rural
22 Survivor pension of former public servants 793 793 – 821.619 821.619 – 1.036,09 1.036,09 –
26 Special Pensions (Law 593/48) 1.107 1.107 – 1.083.841 1.083.841 – 979,08 979,08 –
37 Retirement of supernummerary of federal servants 13 13 – 14.567 14.567 – 1.120,57 1.120,57 –
38 Retirements of Former CAPIN 1 1 – 954 954 – 954,00 954,00 –
54 Special lifelong survivor pensions (Law 9.793/99) 14 14 – 35.434 35.434 – 2.531,04 2.531,04 –
56 Talidomid victim special pension (Law 7.070/82) 1.098 1.098 – 1.768.130 1.768.130 – 1.610,32 1.610,32 –
58 Special retirement of victims of dictatorship (Law 6.683/79) 201 201 – 2.009.403 2.009.403 – 9.997,03 9.997,03 –
59 Survivor benefit victims of dictatorship (Law 6.683/79) 502 502 – 4.602.518 4.602.518 – 9.168,36 9.168,36 –
60 Special Lifelong Pension (Law 10.923/2004) 16 16 – 36.183 36.183 – 2.261,42 2.261,42 –
76 Family benefit of former Train Company RFFSA (Decree-Law 956/69) – – – – – – – – –
85 Assistance Benefit of rubber worker (Law 7.986/89) 3.453 3.453 – 6.517.482 6.517.482 – 1.887,48 1.887,48 –
86 Assistential Survivor Benefit of rubber worker (Law 7.986/89) 6.223 6.223 – 11.695.622 11.695.622 – 1.879,42 1.879,42 –
89 Special pension for hemodialysis victims of Caruaru 51 51 – 42.828 42.828 – 839,76 839,76 –
96 Special Pension to victims of Hansen Disease (Law 11.520/2007) 5.715 5.715 – 7.295.015 7.295.015 – 1.276,47 1.276,47 –
Total Treasury Owed Benefits 19.187 19.187 – 35.923.596 35.923.596 – 1.872,29 1.872,29 –
FONTE: DATAPREV, SUB, SINTESE.
AVERAGE VALUE (R$)
CODE
CODE SPECIES OF BENEFITSTotal
Sector
Sector
SectorTotal
ASSISTENTIAL BENEFITS
QUANTITY VALUE (R$)
SPECIES OF BENEFITSTotal Total
Sector
SectorTotal
TREASURY OWED BENEFITS - BLE
QUANTITY VALUE (R$) AVERAGE VALUE (R$)
TotalSector
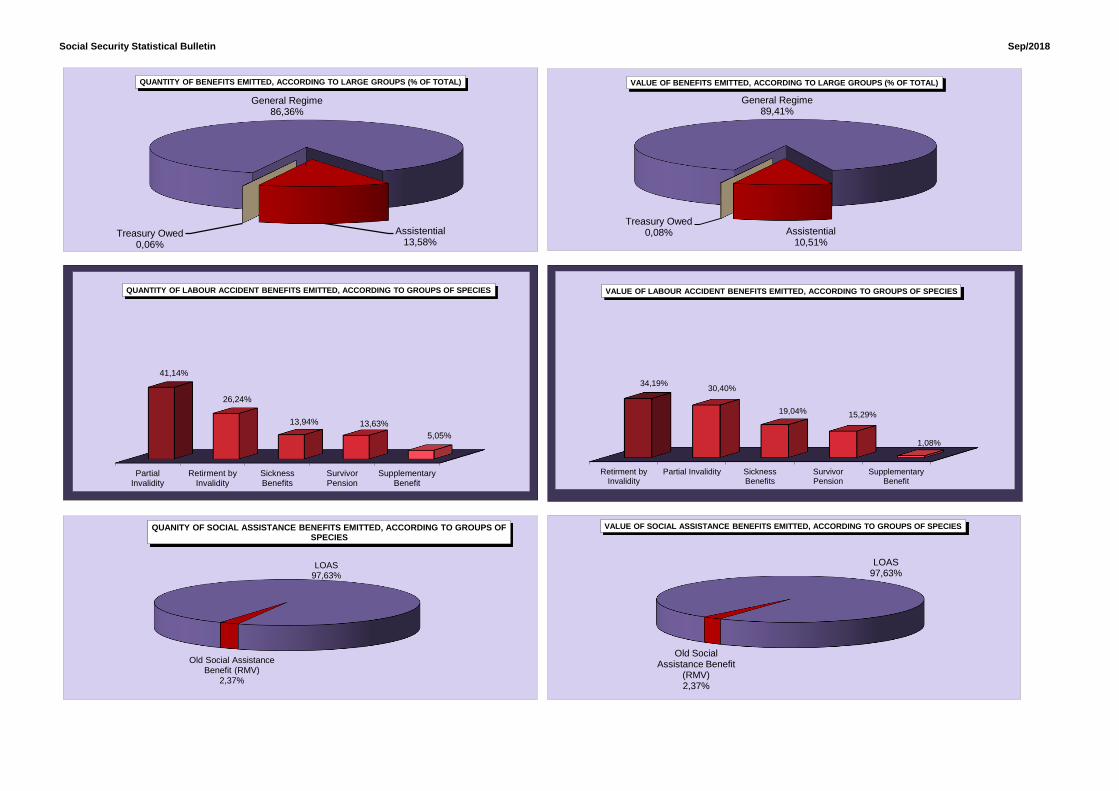
Social Security Statistical Bulletin Sep/2018
Retirment byInvalidity
Partial Invalidity SicknessBenefits
SurvivorPension
SupplementaryBenefit
34,19%30,40%
19,04% 15,29%
1,08%
VALUE OF LABOUR ACCIDENT BENEFITS EMITTED, ACCORDING TO GROUPS OF SPECIES
LOAS97,63%
Old Social Assistance Benefit (RMV)
2,37%
QUANITY OF SOCIAL ASSISTANCE BENEFITS EMITTED, ACCORDING TO GROUPS OF SPECIES
PartialInvalidity
Retirment byInvalidity
SicknessBenefits
SurvivorPension
SupplementaryBenefit
41,14%
26,24%
13,94% 13,63%
5,05%
QUANTITY OF LABOUR ACCIDENT BENEFITS EMITTED, ACCORDING TO GROUPS OF SPECIES
LOAS97,63%
Old Social Assistance Benefit
(RMV)2,37%
VALUE OF SOCIAL ASSISTANCE BENEFITS EMITTED, ACCORDING TO GROUPS OF SPECIES
General Regime86,36%
Assistential13,58%
Treasury Owed0,06%
QUANTITY OF BENEFITS EMITTED, ACCORDING TO LARGE GROUPS (% OF TOTAL)
''
General Regime89,41%
Assistential10,51%
Treasury Owed0,08%
VALUE OF BENEFITS EMITTED, ACCORDING TO LARGE GROUPS (% OF TOTAL)

Social Security Statistical Bulletin Sep/2018
17
Urban Rural Urban Rural Urban Rural
TOTAL 459.819 100,00 -2,02 382.162 77.657 602.207.504 100,00 -1,52 529.683.365 72.524.139 1.309,66 1.386,02 933,90
GENERAL REGIME BENEFITS 446.419 97,09 100,00 -1,58 369.124 77.295 589.345.542 97,86 100,00 -1,19 517.166.751 72.178.791 1.320,16 1.401,07 933,81
Social Security Contributory 417.516 90,80 93,53 100,00 -1,83 341.422 76.094 544.998.585 90,50 92,48 100,00 -1,50 473.946.017 71.052.568 1.305,34 1.388,15 933,75
Retirements 46.993 10,22 10,53 11,26 -15,84 31.544 15.449 62.325.880 10,35 10,58 11,44 -14,69 47.871.669 14.454.211 1.326,28 1.517,62 935,61
by Age 23.897 5,20 5,35 5,72 -16,96 9.864 14.033 23.024.895 3,82 3,91 4,22 -17,11 9.907.081 13.117.814 963,51 1.004,37 934,78
by Invalidity 10.901 2,37 2,44 2,61 -15,83 9.524 1.377 13.317.367 2,21 2,26 2,44 -14,44 12.026.130 1.291.237 1.221,66 1.262,72 937,72
by Length of Contribution 12.195 2,65 2,73 2,92 -13,56 12.156 39 25.983.618 4,31 4,41 4,77 -12,57 25.938.459 45.159 2.130,68 2.133,80 1.157,93
Survivor Pension 23.145 5,03 5,18 5,54 -12,12 15.918 7.227 24.232.116 4,02 4,11 4,45 -12,41 17.660.627 6.571.489 1.046,97 1.109,48 909,30
Temporary Benefits 281.161 61,15 62,98 67,34 1,54 250.927 30.234 392.196.631 65,13 66,55 71,96 1,43 363.425.387 28.771.244 1.394,92 1.448,33 951,62
Sickness Benefits 280.243 60,95 62,78 67,12 1,64 250.126 30.117 391.318.718 64,98 66,40 71,80 1,49 362.611.968 28.706.749 1.396,36 1.449,72 953,17
Partial Invalidity 345 0,08 0,08 0,08 -24,67 256 89 256.459 0,04 0,04 0,05 -22,37 215.113 41.346 743,36 840,28 464,56
Imprisionment Benefit 573 0,12 0,13 0,14 -18,26 545 28 621.455 0,10 0,11 0,11 -18,85 598.306 23.148 1.084,56 1.097,81 826,73
Maternity Benefit 66.217 14,40 14,83 15,86 0,02 43.033 23.184 66.243.958 11,00 11,24 12,15 0,53 44.988.333 21.255.625 1.000,41 1.045,44 916,82
Continued Service Bonus 20% – – – – -100,00 – – – – – – -100,00 – – – – –
Labor Accident Insurance 28.903 6,29 6,47 100,00 2,03 27.702 1.201 44.346.957 7,36 7,52 100,00 2,80 43.220.734 1.126.223 1.534,34 1.560,20 937,74
Retirment by Invalidity 428 0,09 0,10 1,48 -23,43 403 25 648.808 0,11 0,11 1,46 -21,25 624.713 24.095 1.515,91 1.550,16 963,82
Survivor Pension 208 0,05 0,05 0,72 -18,11 195 13 244.552 0,04 0,04 0,55 -13,07 233.129 11.423 1.175,73 1.195,53 878,70
Sickness Benefits 26.770 5,82 6,00 92,62 3,58 25.644 1.126 42.359.957 7,03 7,19 95,52 3,83 41.284.280 1.075.677 1.582,37 1.609,90 955,31
Partial Invalidity 1.209 0,26 0,27 4,18 -13,89 1.172 37 1.045.253 0,17 0,18 2,36 -11,48 1.030.226 15.027 864,56 879,03 406,14
Supplementary Benefit 288 0,06 0,06 1,00 8,27 288 – 48.386 0,01 0,01 0,11 -14,37 48.386 – 168,01 168,01 –
SOCIAL ASSISTANCE BENEFITS 13.277 2,89 100,00 -14,96 12.915 362 12.664.282 2,10 100,00 -14,97 12.318.934 345.348 953,85 953,85 954,00
Social Assistance Pension (LOAS) 12.481 2,71 94,00 100,00 -14,81 12.481 – 11.904.898 1,98 94,00 100,00 -14,81 11.904.898 – 953,84 953,84 –
for the Aged 7.604 1,65 57,27 60,92 -13,75 7.604 – 7.254.165 1,20 57,28 60,93 -13,74 7.254.165 – 953,99 953,99 –
for the Impaired 4.877 1,06 36,73 39,08 -16,40 4.877 – 4.650.733 0,77 36,72 39,07 -16,44 4.650.733 – 953,61 953,61 –
Old Social Assistance Benefit (RMV) 796 0,17 6,00 100,00 -17,34 434 362 759.384 0,13 6,00 100,00 -17,34 414.036 345.348 954,00 954,00 954,00
for the Aged 189 0,04 1,42 23,74 -19,57 97 92 180.306 0,03 1,42 23,74 -19,57 92.538 87.768 954,00 954,00 954,00
for the Impaired 607 0,13 4,57 76,26 -16,62 337 270 579.078 0,10 4,57 76,26 -16,62 321.498 257.580 954,00 954,00 954,00
123 0,03 23,00 123 – 197.680 0,03 15,58 197.680 – 1.607,15 1.607,15 –
SOURCE: DATAPREV, SUB, SINTESE.
(1) Includes the following species: 47 - Continued Service Bonus 25%; 48 - Continued Service Bonus 20%; 68 - Special retirement lump sum payment; 79 - Continued Service Bonus Federal Servant. (2) Includes the species: 22 - Survivor Pension of Former Servant;
26 - Special Pension (Law 593/48); 37 - Extinct Supernummerary Federal Servant Retirements; 38 - Retirements of former CAPIN; 56 - Talidomid victim special pension; 58 - Special benefit for victims of dictatorship;
59 - Special survivor pension for victims of dictatorship; 60 - Special lifelong survivor pension; 76 - Family benefit of former Train Company RFFSA; 85 - Assistance Benefit of rubber worker; 86 - 'Assistential Survivor Benefit of rubber worker;
OTHER TREASURY OWED PENSIONS
(BLE) (1)
Total% of
total
GROUPS OF SPECIES Over last
month (%)Total
% of
total
% of
the
group
% of
sub-
group
BENEFIT CESSATION, ACCORDING TO GROUPS OF SPECIES - AUG/2018
QUANTITY VALUE (R$) AVERAGE VALUE (R$)
Sector Sector
Over last
month (%)Total
% of
the
group
% of sub-
group
Sector

Social Security Statistical Bulletin Sep/2018
18
BRAZIL 459.819 100,00 -2,02 602.207.504 100,00 -1,52 54.834 100,00 -73,83
NORTH 24.556 5,34 6,36 29.508.555 4,90 6,27 2.896 5,28 -79,07
Rondônia 4.338 0,94 8,97 5.085.003 0,84 9,83 296 0,54 -92,99
Acre 1.353 0,29 2,89 1.528.180 0,25 0,85 169 0,31 -84,10
Amazonas 5.360 1,17 -12,20 6.730.900 1,12 -8,18 474 0,86 -69,52
Roraima 773 0,17 2,11 863.576 0,14 -3,81 65 0,12 -79,23
Pará 9.422 2,05 20,22 11.464.157 1,90 16,98 1.539 2,81 -68,29
Amapá 1.052 0,23 23,33 1.151.305 0,19 16,12 117 0,21 -48,91
Tocantins 2.258 0,49 0,80 2.685.434 0,45 3,18 236 0,43 -85,26
NORTHEAST 106.232 23,10 -2,72 119.994.259 19,93 -2,44 12.862 23,46 -79,94
Maranhão 12.605 2,74 3,40 13.291.866 2,21 3,01 2.526 4,61 -78,02
Piauí 7.558 1,64 6,18 8.367.730 1,39 9,60 740 1,35 -80,42
Ceará 16.034 3,49 0,70 17.841.062 2,96 0,29 1.707 3,11 -79,73
Rio Grande do Norte 7.330 1,59 -6,27 8.382.073 1,39 -7,15 863 1,57 -71,98
Paraíba 8.587 1,87 1,57 9.339.690 1,55 0,08 763 1,39 -82,24
Pernambuco 17.173 3,73 -2,98 20.387.244 3,39 -0,30 1.870 3,41 -75,48
Alagoas 6.349 1,38 -6,36 7.165.774 1,19 -4,30 734 1,34 -85,73
Sergipe 3.474 0,76 -5,52 3.949.003 0,66 -4,73 473 0,86 -81,71
Bahia 27.122 5,90 -8,18 31.269.817 5,19 -8,65 3.186 5,81 -81,98
SOUTHEAST 199.375 43,36 -0,78 282.538.547 46,92 -0,67 26.581 48,48 -63,79
Minas Gerais 50.792 11,05 0,61 63.253.199 10,50 1,11 8.493 15,49 -66,54
Espírito Santo 8.862 1,93 -9,22 11.375.052 1,89 -8,91 814 1,48 -83,73
Rio de Janeiro 37.931 8,25 9,12 53.543.245 8,89 7,66 5.185 9,46 -57,90
São Paulo 101.790 22,14 -3,91 154.367.051 25,63 -3,32 12.089 22,05 -60,63
SOUTH 94.667 20,59 -6,71 123.240.851 20,46 -5,72 9.536 17,39 -77,50
Paraná 29.513 6,42 -8,26 37.532.720 6,23 -7,06 3.139 5,72 -75,52
Santa Catarina 26.963 5,86 -2,13 36.007.837 5,98 -2,05 2.669 4,87 -80,42
Rio Grande do Sul 38.191 8,31 -8,54 49.700.294 8,25 -7,23 3.728 6,80 -76,59
CENTER-WEST 34.989 7,61 1,09 46.925.292 7,79 3,03 2.959 5,40 -81,28
Mato Grosso do Sul 7.491 1,63 -5,87 9.634.346 1,60 -4,00 517 0,94 -82,01
Mato Grosso 7.419 1,61 1,31 9.701.965 1,61 3,67 643 1,17 -89,01
Goiás 12.179 2,65 5,35 15.733.496 2,61 7,23 1.093 1,99 -75,42
Federal District 7.900 1,72 1,67 11.855.485 1,97 3,26 706 1,29 -73,20
SOURCE: DATAPREV, SUB, SINTESE.
Over previous
month (%)% of total
BENEFITS SUSPENDED
% of totalQuantityOver previous
month (%)Total
Over previous
month (%)% OF total
BENEFITS CEASED AND SUSPENDED, ACCORDING TO FEDERAL STATES - AUG/2018
BENEFITS CEASED
Quantity ValueGEOGRAPHICAL REGIONS
AND FEDERAL STATESTotal (R$)

Social Security Statistical Bulletin Sep/2018
101.79050.792
38.191
37.931
29.513
26.963
27.122
17.173
16.034
12.179
12.605
8.862
9.422
7.330
7.900
8.587
7.491
7.419
7.558
6.349
5.360
4.338
3.474
2.258
1.353
1.052
773
São Paulo
Minas Gerais
Rio Grande do Sul
Rio de Janeiro
Paraná
Santa Catarina
Bahia
Pernambuco
Ceará
Goiás
Maranhão
Espírito Santo
Pará
Rio Grande do Norte
Distrito Federal
Paraíba
Mato Grosso do Sul
Mato Grosso
Piauí
Alagoas
Amazonas
Rondônia
Sergipe
Tocantins
Acre
Amapá
Roraima
QUANTITY OF CEASED BENEFITS, ACCORDING TO FEDERAL STATES - AUG/2018
12.089
8.4933.728
2.669
5.185
3.186
3.139
1.870
2.526
1.707
1.539
1.093
734
763
706
740
814
643
863
517
169
473
474
296
236
65
117
São Paulo
Minas Gerais
Rio Grande do Sul
Santa Catarina
Rio de Janeiro
Bahia
Paraná
Pernambuco
Maranhão
Ceará
Pará
Goiás
Alagoas
Paraíba
Distrito Federal
Piauí
Espírito Santo
Mato Grosso
Rio Grande do Norte
Mato Grosso do Sul
Acre
Sergipe
Amazonas
Rondônia
Tocantins
Roraima
Amapá
QUANTITY OF SUSPENDED BENEFITS, ACCORDING TO FEDERAL STATES - AUG/2018
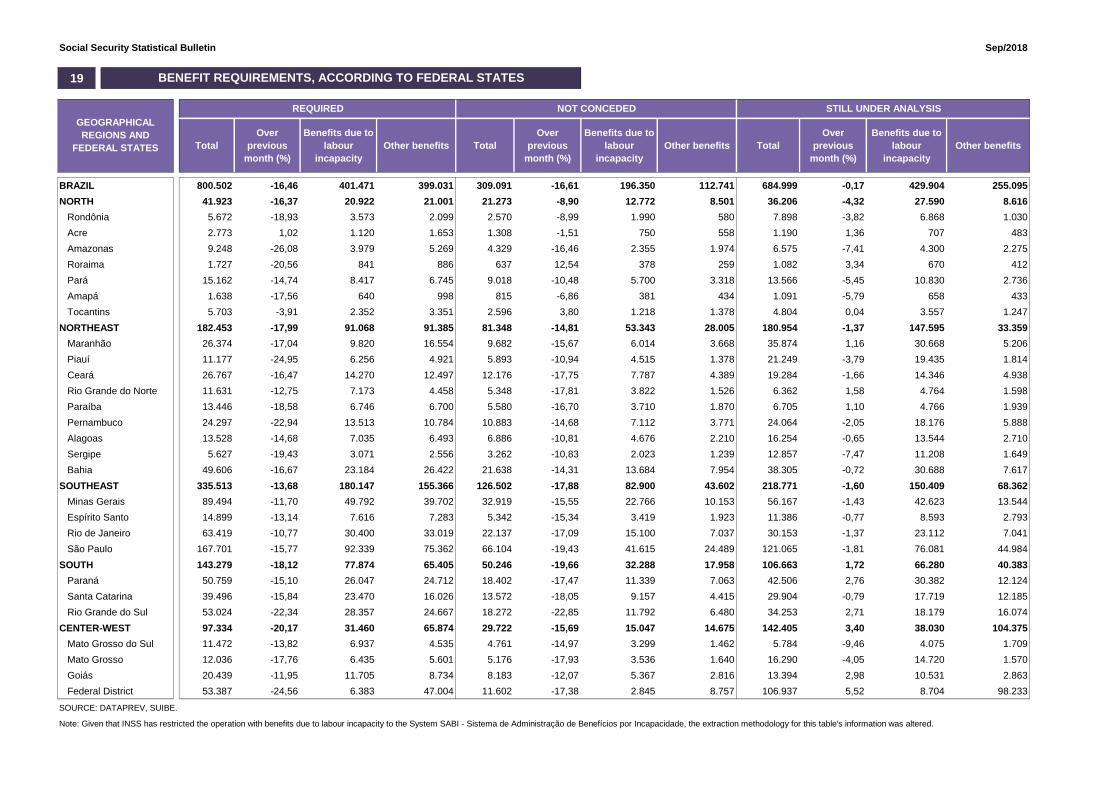
Social Security Statistical Bulletin Sep/2018
19
Total
Over
previous
month (%)
Benefits due to
labour
incapacity
Other benefits Total
Over
previous
month (%)
Benefits due to
labour
incapacity
Other benefits Total
Over
previous
month (%)
Benefits due to
labour
incapacity
Other benefits
BRAZIL 800.502 -16,46 401.471 399.031 309.091 -16,61 196.350 112.741 684.999 -0,17 429.904 255.095
NORTH 41.923 -16,37 20.922 21.001 21.273 -8,90 12.772 8.501 36.206 -4,32 27.590 8.616
Rondônia 5.672 -18,93 3.573 2.099 2.570 -8,99 1.990 580 7.898 -3,82 6.868 1.030
Acre 2.773 1,02 1.120 1.653 1.308 -1,51 750 558 1.190 1,36 707 483
Amazonas 9.248 -26,08 3.979 5.269 4.329 -16,46 2.355 1.974 6.575 -7,41 4.300 2.275
Roraima 1.727 -20,56 841 886 637 12,54 378 259 1.082 3,34 670 412
Pará 15.162 -14,74 8.417 6.745 9.018 -10,48 5.700 3.318 13.566 -5,45 10.830 2.736
Amapá 1.638 -17,56 640 998 815 -6,86 381 434 1.091 -5,79 658 433
Tocantins 5.703 -3,91 2.352 3.351 2.596 3,80 1.218 1.378 4.804 0,04 3.557 1.247
NORTHEAST 182.453 -17,99 91.068 91.385 81.348 -14,81 53.343 28.005 180.954 -1,37 147.595 33.359
Maranhão 26.374 -17,04 9.820 16.554 9.682 -15,67 6.014 3.668 35.874 1,16 30.668 5.206
Piauí 11.177 -24,95 6.256 4.921 5.893 -10,94 4.515 1.378 21.249 -3,79 19.435 1.814
Ceará 26.767 -16,47 14.270 12.497 12.176 -17,75 7.787 4.389 19.284 -1,66 14.346 4.938
Rio Grande do Norte 11.631 -12,75 7.173 4.458 5.348 -17,81 3.822 1.526 6.362 1,58 4.764 1.598
Paraíba 13.446 -18,58 6.746 6.700 5.580 -16,70 3.710 1.870 6.705 1,10 4.766 1.939
Pernambuco 24.297 -22,94 13.513 10.784 10.883 -14,68 7.112 3.771 24.064 -2,05 18.176 5.888
Alagoas 13.528 -14,68 7.035 6.493 6.886 -10,81 4.676 2.210 16.254 -0,65 13.544 2.710
Sergipe 5.627 -19,43 3.071 2.556 3.262 -10,83 2.023 1.239 12.857 -7,47 11.208 1.649
Bahia 49.606 -16,67 23.184 26.422 21.638 -14,31 13.684 7.954 38.305 -0,72 30.688 7.617
SOUTHEAST 335.513 -13,68 180.147 155.366 126.502 -17,88 82.900 43.602 218.771 -1,60 150.409 68.362
Minas Gerais 89.494 -11,70 49.792 39.702 32.919 -15,55 22.766 10.153 56.167 -1,43 42.623 13.544
Espírito Santo 14.899 -13,14 7.616 7.283 5.342 -15,34 3.419 1.923 11.386 -0,77 8.593 2.793
Rio de Janeiro 63.419 -10,77 30.400 33.019 22.137 -17,09 15.100 7.037 30.153 -1,37 23.112 7.041
São Paulo 167.701 -15,77 92.339 75.362 66.104 -19,43 41.615 24.489 121.065 -1,81 76.081 44.984
SOUTH 143.279 -18,12 77.874 65.405 50.246 -19,66 32.288 17.958 106.663 1,72 66.280 40.383
Paraná 50.759 -15,10 26.047 24.712 18.402 -17,47 11.339 7.063 42.506 2,76 30.382 12.124
Santa Catarina 39.496 -15,84 23.470 16.026 13.572 -18,05 9.157 4.415 29.904 -0,79 17.719 12.185
Rio Grande do Sul 53.024 -22,34 28.357 24.667 18.272 -22,85 11.792 6.480 34.253 2,71 18.179 16.074
CENTER-WEST 97.334 -20,17 31.460 65.874 29.722 -15,69 15.047 14.675 142.405 3,40 38.030 104.375
Mato Grosso do Sul 11.472 -13,82 6.937 4.535 4.761 -14,97 3.299 1.462 5.784 -9,46 4.075 1.709
Mato Grosso 12.036 -17,76 6.435 5.601 5.176 -17,93 3.536 1.640 16.290 -4,05 14.720 1.570
Goiás 20.439 -11,95 11.705 8.734 8.183 -12,07 5.367 2.816 13.394 2,98 10.531 2.863
Federal District 53.387 -24,56 6.383 47.004 11.602 -17,38 2.845 8.757 106.937 5,52 8.704 98.233
SOURCE: DATAPREV, SUIBE.
Note: Given that INSS has restricted the operation with benefits due to labour incapacity to the System SABI - Sistema de Administração de Benefícios por Incapacidade, the extraction methodology for this table's information was altered.
BENEFIT REQUIREMENTS, ACCORDING TO FEDERAL STATES
GEOGRAPHICAL
REGIONS AND
FEDERAL STATES
STILL UNDER ANALYSISREQUIRED NOT CONCEDED

Social Security Statistical Bulletin Sep/2018
20,95%
11,18%
6,62%
7,92%
6,34%
6,20%
4,93%
3,34%
3,29%
3,04%
2,55%
1,86%
6,67%
1,68%
1,89%
1,69%
1,40%
1,43%
1,50%
1,16%
1,45%
0,70%
0,71%
0,71%
0,35%
0,20%
0,22%
São Paulo
Minas Gerais
Rio Grande do Sul
Rio de Janeiro
Paraná
Bahia
Santa Catarina
Ceará
Maranhão
Pernambuco
Goiás
Espírito Santo
Distrito Federal
Paraíba
Pará
Alagoas
Piauí
Mato Grosso do Sul
Mato Grosso
Amazonas
Rio Grande do Norte
Sergipe
Rondônia
Tocantins
Acre
Amapá
Roraima
TOTAL BENEFIT REQUIREMENTS, ACCORDING TO FEDERAL STATES (%)
North5,24%
Northeast22,79%
Southeast41,91%
South17,90%
Center-West12,16%
QUANTITY OF BENEFIT REQUIREMENTS, ACCORDING TO GEOGRAPHICAL REGIONS (%)
North5,21%
Northeast22,68%
Southeast44,87%
South19,40%Center-West
7,84%
QUANTITY OF BENEFITS DUE TO LABOUR INCAPACITY REQUIRED, ACCORDING TO GEOGRAPHICAL REGIONS (%)

Social Security Statistical Bulletin Sep/2018
20
REQUIREMENTS
TotalOver last
period (%)
Benefits due
to Labour
Incapacity
(SABI)
Other
BenefitsTotal
Over last
period (%)
Benefits due to
Labour
Incapacity
(SABI)
Other
BenefitsTotal
Over last
period (%)
Benefits due to
Labour
Incapacity
(SABI)
Other
Benefits
2006 Total 7.072.086 66,90 2.837.159 4.234.927 4.238.816 7,16 2.653.247 1.585.569 2.771.128 52,07 1.694.719 1.076.409
2007 Total 6.544.886 -7,45 3.415.082 3.129.804 4.173.350 -1,54 2.400.086 1.773.264 3.211.819 15,90 2.359.332 852.487
2008 Total 7.080.399 8,18 4.283.025 2.797.374 4.461.842 6,91 2.546.020 1.915.822 3.606.924 12,30 2.585.458 1.021.466
2009 Total 7.769.544 9,73 4.407.067 3.362.477 4.473.905 0,27 2.416.025 2.057.880 3.325.257 -7,81 2.148.896 1.176.361
2010 Total 7.813.606 0,57 4.316.661 3.496.945 4.639.867 3,71 2.647.912 1.991.955 3.233.763 -2,75 2.131.567 1.102.196
2011 Total 8.046.153 2,98 4.536.044 3.510.109 4.767.039 2,74 2.744.344 2.022.695 3.250.290 0,51 2.146.431 1.103.859
2012 Total 8.425.296 4,71 4.617.303 3.807.993 4.957.681 4,00 2.856.653 2.101.028 3.310.576 1,85 2.120.882 1.189.694
2013 Total 8.701.787 3,28 4.613.969 4.087.818 5.207.629 5,04 3.000.724 2.206.905 3.297.415 -0,40 2.059.822 1.237.593
2014 Total 8.625.968 -0,87 4.706.530 3.919.438 5.211.030 0,07 3.024.026 2.187.004 3.136.186 -4,89 1.939.823 1.196.363
2015 Total 7.834.471 -9,18 4.046.810 3.787.661 4.435.621 -14,88 2.396.324 2.039.297 2.632.464 -16,06 1.593.002 1.039.462
2016 Total 8.680.134 10,79 4.387.234 4.292.900 5.132.451 15,71 2.807.042 2.325.409 4.164.435 58,20 2.548.629 1.615.806
2017 Total 9.388.515 8,16 4.556.856 4.831.659 4.995.623 -2,67 2.970.338 2.025.285 3.950.436 -5,14 2.350.796 1.599.640
January 694.112 5,37 349.182 344.930 369.843 1,63 193.886 175.957 254.982 -9,75 146.984 107.998
February 659.421 -5,00 329.013 330.408 368.800 -0,28 198.204 170.596 319.199 25,18 215.493 103.706
March 828.157 25,59 417.515 410.642 466.989 26,62 253.055 213.934 360.297 12,88 225.250 135.047
April 692.170 -16,42 351.363 340.807 380.921 -18,43 203.331 177.590 275.896 -23,43 164.908 110.988
May 919.457 32,84 415.520 503.937 469.613 23,28 247.574 222.039 329.651 19,48 188.624 141.027
June 804.452 -12,51 373.237 431.215 449.179 -4,35 231.205 217.974 359.296 8,99 211.512 147.784
July 770.946 -4,17 378.250 392.696 407.363 -9,31 205.117 202.246 349.144 -2,83 212.938 136.206
August 900.563 16,81 437.281 463.282 510.061 25,21 261.283 248.778 393.694 12,76 225.527 168.167
September 789.780 -12,30 391.484 398.296 433.846 -14,94 355.615 78.231 342.460 -13,01 194.783 147.677
October 851.224 7,78 403.754 447.470 347.253 -19,96 284.115 63.138 358.708 4,74 196.567 162.141
November 789.475 -7,25 372.593 416.882 424.086 22,13 344.942 79.144 326.151 -9,08 195.329 130.822
December 688.758 -12,76 337.664 351.094 367.669 -13,30 192.011 175.658 280.958 -13,86 172.881 108.077
2018 January 674.944 -2,01 370.501 304.443 367.893 0,06 201.465 166.428 274.693 -2,23 170.795 103.898
February 670.517 -0,66 337.656 332.861 375.000 1,93 214.167 160.833 283.740 3,29 187.286 96.454
March 860.082 28,27 413.109 446.973 478.129 27,50 269.457 208.672 357.496 25,99 228.485 129.011
April 897.520 4,35 430.301 467.219 470.659 -1,56 270.677 199.982 359.766 0,63 224.450 135.316
May 928.938 3,50 433.419 495.519 465.572 -1,08 262.296 203.276 353.020 -1,88 222.900 130.120
June 860.357 -7,38 401.413 458.944 428.746 -7,91 242.476 186.270 326.050 -7,64 203.098 122.952
July 836.448 -2,78 412.473 423.975 403.207 -5,96 226.174 177.033 309.131 -5,19 189.062 120.069
August 958.176 14,55 446.399 511.777 499.630 23,91 286.271 213.359 370.677 19,91 232.873 137.804
September 800.502 -16,46 401.471 399.031 404.210 -19,10 235.994 168.216 309.091 -16,61 196.350 112.741
Subtotal (1) 7.487.484 6,07 3.646.742 3.840.742 3.893.046 0,94 2.208.977 1.684.069 2.943.664 -1,37 1.855.299 1.088.365
SOURCE: DATAPREV, SUIBE, SUB, SINTESE.
(1) The variation corresponds to the proportion between the accumulated value of 2018 and the same period of 2017.
YEARS/MONTHS
CONCESSIONS DENIALS
EVOLUTION OF BENEFIT REQUIREMENTS, CONCESSIONS AND DENIALS - 2006/2018
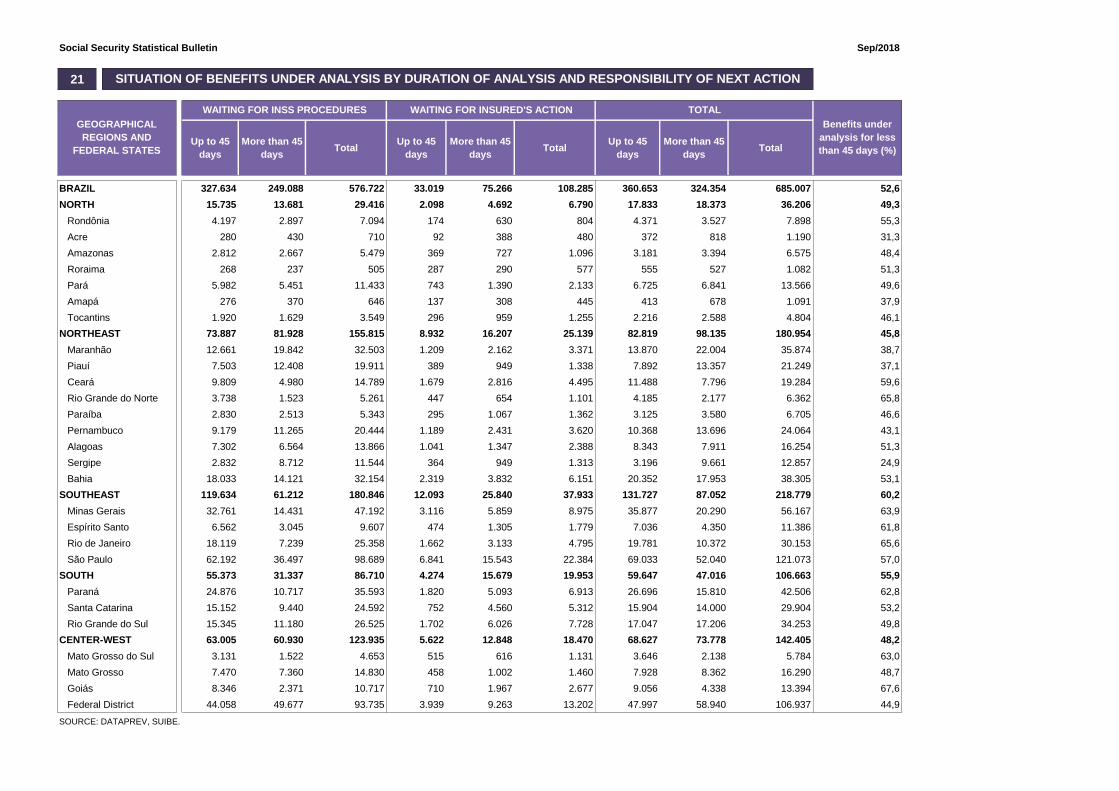
Social Security Statistical Bulletin Sep/2018
21
Up to 45
days
More than 45
daysTotal
Up to 45
days
More than 45
daysTotal
Up to 45
days
More than 45
daysTotal
BRAZIL 327.634 249.088 576.722 33.019 75.266 108.285 360.653 324.354 685.007 52,6
NORTH 15.735 13.681 29.416 2.098 4.692 6.790 17.833 18.373 36.206 49,3
Rondônia 4.197 2.897 7.094 174 630 804 4.371 3.527 7.898 55,3
Acre 280 430 710 92 388 480 372 818 1.190 31,3
Amazonas 2.812 2.667 5.479 369 727 1.096 3.181 3.394 6.575 48,4
Roraima 268 237 505 287 290 577 555 527 1.082 51,3
Pará 5.982 5.451 11.433 743 1.390 2.133 6.725 6.841 13.566 49,6
Amapá 276 370 646 137 308 445 413 678 1.091 37,9
Tocantins 1.920 1.629 3.549 296 959 1.255 2.216 2.588 4.804 46,1
NORTHEAST 73.887 81.928 155.815 8.932 16.207 25.139 82.819 98.135 180.954 45,8
Maranhão 12.661 19.842 32.503 1.209 2.162 3.371 13.870 22.004 35.874 38,7
Piauí 7.503 12.408 19.911 389 949 1.338 7.892 13.357 21.249 37,1
Ceará 9.809 4.980 14.789 1.679 2.816 4.495 11.488 7.796 19.284 59,6
Rio Grande do Norte 3.738 1.523 5.261 447 654 1.101 4.185 2.177 6.362 65,8
Paraíba 2.830 2.513 5.343 295 1.067 1.362 3.125 3.580 6.705 46,6
Pernambuco 9.179 11.265 20.444 1.189 2.431 3.620 10.368 13.696 24.064 43,1
Alagoas 7.302 6.564 13.866 1.041 1.347 2.388 8.343 7.911 16.254 51,3
Sergipe 2.832 8.712 11.544 364 949 1.313 3.196 9.661 12.857 24,9
Bahia 18.033 14.121 32.154 2.319 3.832 6.151 20.352 17.953 38.305 53,1
SOUTHEAST 119.634 61.212 180.846 12.093 25.840 37.933 131.727 87.052 218.779 60,2
Minas Gerais 32.761 14.431 47.192 3.116 5.859 8.975 35.877 20.290 56.167 63,9
Espírito Santo 6.562 3.045 9.607 474 1.305 1.779 7.036 4.350 11.386 61,8
Rio de Janeiro 18.119 7.239 25.358 1.662 3.133 4.795 19.781 10.372 30.153 65,6
São Paulo 62.192 36.497 98.689 6.841 15.543 22.384 69.033 52.040 121.073 57,0
SOUTH 55.373 31.337 86.710 4.274 15.679 19.953 59.647 47.016 106.663 55,9
Paraná 24.876 10.717 35.593 1.820 5.093 6.913 26.696 15.810 42.506 62,8
Santa Catarina 15.152 9.440 24.592 752 4.560 5.312 15.904 14.000 29.904 53,2
Rio Grande do Sul 15.345 11.180 26.525 1.702 6.026 7.728 17.047 17.206 34.253 49,8
CENTER-WEST 63.005 60.930 123.935 5.622 12.848 18.470 68.627 73.778 142.405 48,2
Mato Grosso do Sul 3.131 1.522 4.653 515 616 1.131 3.646 2.138 5.784 63,0
Mato Grosso 7.470 7.360 14.830 458 1.002 1.460 7.928 8.362 16.290 48,7
Goiás 8.346 2.371 10.717 710 1.967 2.677 9.056 4.338 13.394 67,6
Federal District 44.058 49.677 93.735 3.939 9.263 13.202 47.997 58.940 106.937 44,9
SOURCE: DATAPREV, SUIBE.
Benefits under
analysis for less
than 45 days (%)
SITUATION OF BENEFITS UNDER ANALYSIS BY DURATION OF ANALYSIS AND RESPONSIBILITY OF NEXT ACTION
GEOGRAPHICAL
REGIONS AND
FEDERAL STATES
WAITING FOR INSS PROCEDURES WAITING FOR INSURED'S ACTION TOTAL
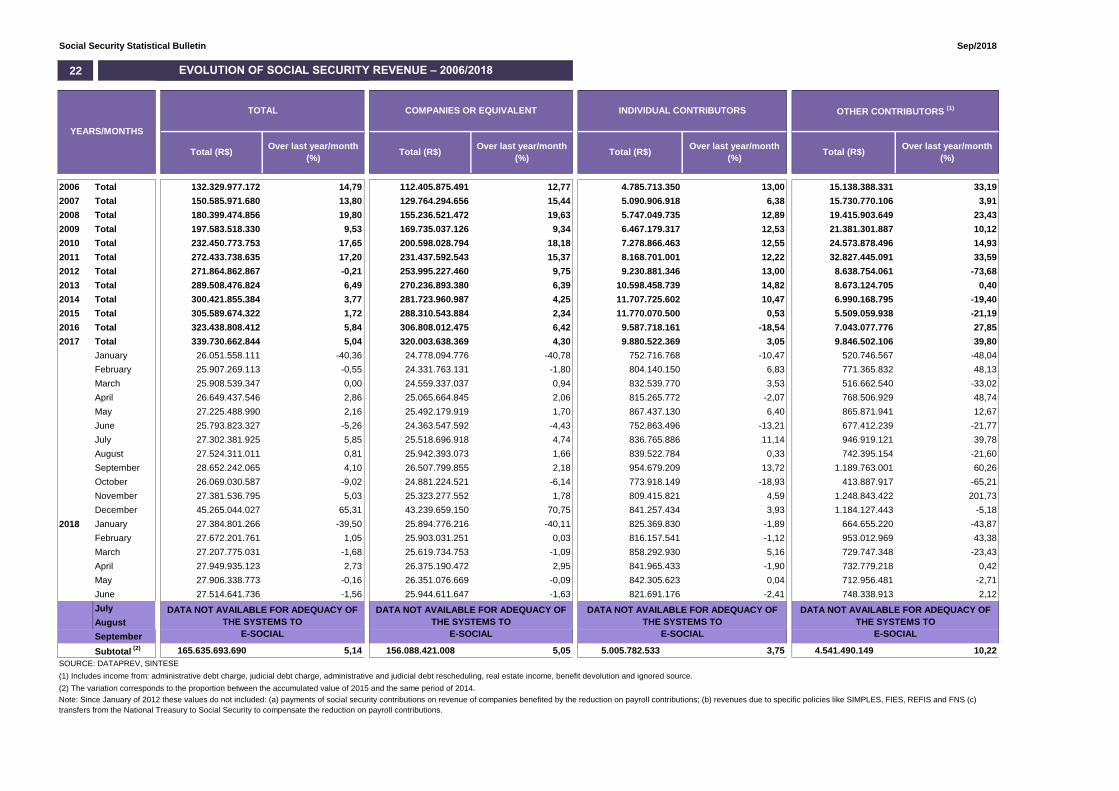
Social Security Statistical Bulletin Sep/2018
22
2006 Total 132.329.977.172 14,79 112.405.875.491 12,77 4.785.713.350 13,00 15.138.388.331 33,19
2007 Total 150.585.971.680 13,80 129.764.294.656 15,44 5.090.906.918 6,38 15.730.770.106 3,91
2008 Total 180.399.474.856 19,80 155.236.521.472 19,63 5.747.049.735 12,89 19.415.903.649 23,43
2009 Total 197.583.518.330 9,53 169.735.037.126 9,34 6.467.179.317 12,53 21.381.301.887 10,12
2010 Total 232.450.773.753 17,65 200.598.028.794 18,18 7.278.866.463 12,55 24.573.878.496 14,93
2011 Total 272.433.738.635 17,20 231.437.592.543 15,37 8.168.701.001 12,22 32.827.445.091 33,59
2012 Total 271.864.862.867 -0,21 253.995.227.460 9,75 9.230.881.346 13,00 8.638.754.061 -73,68
2013 Total 289.508.476.824 6,49 270.236.893.380 6,39 10.598.458.739 14,82 8.673.124.705 0,40
2014 Total 300.421.855.384 3,77 281.723.960.987 4,25 11.707.725.602 10,47 6.990.168.795 -19,40
2015 Total 305.589.674.322 1,72 288.310.543.884 2,34 11.770.070.500 0,53 5.509.059.938 -21,19
2016 Total 323.438.808.412 5,84 306.808.012.475 6,42 9.587.718.161 -18,54 7.043.077.776 27,85
2017 Total 339.730.662.844 5,04 320.003.638.369 4,30 9.880.522.369 3,05 9.846.502.106 39,80
January 26.051.558.111 -40,36 24.778.094.776 -40,78 752.716.768 -10,47 520.746.567 -48,04
February 25.907.269.113 -0,55 24.331.763.131 -1,80 804.140.150 6,83 771.365.832 48,13
March 25.908.539.347 0,00 24.559.337.037 0,94 832.539.770 3,53 516.662.540 -33,02
April 26.649.437.546 2,86 25.065.664.845 2,06 815.265.772 -2,07 768.506.929 48,74
May 27.225.488.990 2,16 25.492.179.919 1,70 867.437.130 6,40 865.871.941 12,67
June 25.793.823.327 -5,26 24.363.547.592 -4,43 752.863.496 -13,21 677.412.239 -21,77
July 27.302.381.925 5,85 25.518.696.918 4,74 836.765.886 11,14 946.919.121 39,78
August 27.524.311.011 0,81 25.942.393.073 1,66 839.522.784 0,33 742.395.154 -21,60
September 28.652.242.065 4,10 26.507.799.855 2,18 954.679.209 13,72 1.189.763.001 60,26
October 26.069.030.587 -9,02 24.881.224.521 -6,14 773.918.149 -18,93 413.887.917 -65,21
November 27.381.536.795 5,03 25.323.277.552 1,78 809.415.821 4,59 1.248.843.422 201,73
December 45.265.044.027 65,31 43.239.659.150 70,75 841.257.434 3,93 1.184.127.443 -5,18
2018 January 27.384.801.266 -39,50 25.894.776.216 -40,11 825.369.830 -1,89 664.655.220 -43,87
February 27.672.201.761 1,05 25.903.031.251 0,03 816.157.541 -1,12 953.012.969 43,38
March 27.207.775.031 -1,68 25.619.734.753 -1,09 858.292.930 5,16 729.747.348 -23,43
April 27.949.935.123 2,73 26.375.190.472 2,95 841.965.433 -1,90 732.779.218 0,42
May 27.906.338.773 -0,16 26.351.076.669 -0,09 842.305.623 0,04 712.956.481 -2,71
June 27.514.641.736 -1,56 25.944.611.647 -1,63 821.691.176 -2,41 748.338.913 2,12
July
August
September
Subtotal (2) 165.635.693.690 5,14 156.088.421.008 5,05 5.005.782.533 3,75 4.541.490.149 10,22
SOURCE: DATAPREV, SINTESE
(1) Includes income from: administrative debt charge, judicial debt charge, administrative and judicial debt rescheduling, real estate income, benefit devolution and ignored source.
(2) The variation corresponds to the proportion between the accumulated value of 2015 and the same period of 2014.
Note: Since January of 2012 these values do not included: (a) payments of social security contributions on revenue of companies benefited by the reduction on payroll contributions; (b) revenues due to specific policies like SIMPLES, FIES, REFIS and FNS (c)
transfers from the National Treasury to Social Security to compensate the reduction on payroll contributions.
DATA NOT AVAILABLE FOR ADEQUACY OF
THE SYSTEMS TO
E-SOCIAL
DATA NOT AVAILABLE FOR ADEQUACY OF
THE SYSTEMS TO
E-SOCIAL
DATA NOT AVAILABLE FOR ADEQUACY OF
THE SYSTEMS TO
E-SOCIAL
DATA NOT AVAILABLE FOR ADEQUACY OF
THE SYSTEMS TO
E-SOCIAL
Over last year/month
(%)
Over last year/month
(%)Total (R$)
Over last year/month
(%)
INDIVIDUAL CONTRIBUTORS OTHER CONTRIBUTORS (1)
Total (R$)Over last year/month
(%)Total (R$)
EVOLUTION OF SOCIAL SECURITY REVENUE – 2006/2018
YEARS/MONTHS
TOTAL COMPANIES OR EQUIVALENT
Total (R$)
Social Security Statistical Bulletin Sep/2018
23
SOURCE OF REVENUE (R$)
Companies and
Equivalent
Individual
Contributor
Administrative
Charge
Benefit
Devolution
Real Estate
Income
Outstanding
Debt
Fine for Late
Payment Other Sources
Ignored
Source
BRAZIL
NORTH
Rondônia
Acre
Amazonas
Roraima
Pará
Amapá
Tocantins
NORTHEAST
Maranhão
Piauí
Ceará
Rio Grande do Norte
Paraíba
Pernambuco
Alagoas
Sergipe
Bahia
SOUTHEAST
Minas Gerais
Espírito Santo
Rio de Janeiro
São Paulo
SOUTH
Paraná
Santa Catarina
Rio Grande do Sul
CENTER-WEST
Mato Grosso do Sul
Mato Grosso
Goiás
Federal District
GENERAL MANAGEMENT (1)
IGNORED
SOURCE: DATAPREV, SINTESE.
(1) Includes Treasury transfers to the INSS due to FIES contributions.
Note:Since January of 2012 these values do not included: (a) payments of social security contributions on revenue of companies benefited by the reduction on payroll contributions; (b) revenues due to specific policies like SIMPLES, FIES, REFIS and FNS (c) transfers from
the National Treasury to Social Security to compensate the reduction on payroll contributions.
SOCIAL SECURITY REVENUE BY SOURCE, ACCORDING TO FEDERAL STATES
GEOGRAPHICAL REGIONS
AND FEDERAL STATESTotal (R$)
% of
total
Over previous
month (%)
DATA NOT AVAILABLE FOR ADEQUACY
OF THE SYSTEMS TO
E-SOCIAL

Social Security Statistical Bulletin Sep/2018
24
TOTAL Services
Agriculture Commerce of Cars and Fuel
Industry Wholesale Commerce
Mineral Extraction Retail Commerce
Building Lodging and Alimentation
Industrial Public Services Transport and Storage
Transformation Communications
Food and Beverages Financial Intermediation
Textile Real Estate Activities
Pulp and Paper Data Processing and Informatic Services
Crude Oil Refination and Ethanol Production Services to Companies
Chemical Products Public Admin., Defense and Social Security
Rubber and Plastic Products Education
Non Metallic Mineral Products Health and Social Services
Basic Metallurgy Associations, Culture and Sports
Metal Products Other Services
Machines and Equipments Ignored
Electrical Machines and Tools
Automobiles and Transport Vehicles
Other Transformation Industries
SOURCE: DATAPREV, SINTESE.
Note: Data in this table is by localization of the company, other than tables 22 and 23 which present data by local of payment.
Since January of 2012 these values do not included the payments of social security contributions on revenue of companies benefited by the reduction on payroll contributions.
DATA NOT
AVAILABLE FOR
ADEQUACY OF THE
SYSTEMS TO
E-SOCIAL
DATA NOT
AVAILABLE FOR
ADEQUACY OF THE
SYSTEMS TO
E-SOCIAL
The sum also differs from tables 22 and 23 because this table excludes the companies' information with errors (when the sum of informed values does not match total value informed by company), meanwhile the previous table consider the
whole information avalailable.
% of
total
Over previous
month (em %)
VALUE OF CONTRIBUTIONS DEPOSITED BY COMPANIES, ACCORDING TO ECONOMIC SECTOR
ECONOMIC SECTOR Total (R$) % of totalOver previous
month (em %)ECONOMIC SECTOR Total (R$)
Social Security Statistical Bulletin Sep/2018
25
Total Commerce
Transport, Storage
and
Communication
Financial
IntermediationOthers
BRAZIL
NORTH
Rondônia
Acre
Amazonas
Roraima
Pará
Amapá
Tocantins
NORTHEAST
Maranhão
Piauí
Ceará
Rio Grande do Norte
Paraíba
Pernambuco
Alagoas
Sergipe
Bahia
SOUTHEAST
Minas Gerais
Espírito Santo
Rio de Janeiro
São Paulo
SOUTH
Paraná
Santa Catarina
Rio Grande do Sul
CENTER-WEST
Mato Grosso do Sul
Mato Grosso
Goiás
Federal District
IGNORED
FONTE: DATAPREV, SINTESE.
Note: Data in this table is by localization of the company, other than tables 22 and 23 which present data by local of payment.
Since January of 2012 these values do not included the payments of social security contributions on revenue of companies benefited by the reduction on payroll contributions.
VALUES DEPOSITED BY COMPANIES, ACCORDING TO FEDERAL STATES
ECONOMIC ACTIVITY CLASSES (R$)
Services
Agriculture IndustryIgnored
Activities
GEOGRAPHICAL
REGIONS AND
FEDERAL STATES
Total
(R$)
% of
total
Over pre-
vious
month
(%)
The sum also differs from tables 22 and 23 because this table excludes the companies' information with errors (when the sum of informed values does not match total value informed by company), meanwhile the aforementioned tables consider
the whole information avalailable.
DATA NOT AVAILABLE FOR
ADEQUACY OF THE SYSTEMS TO
E-SOCIAL
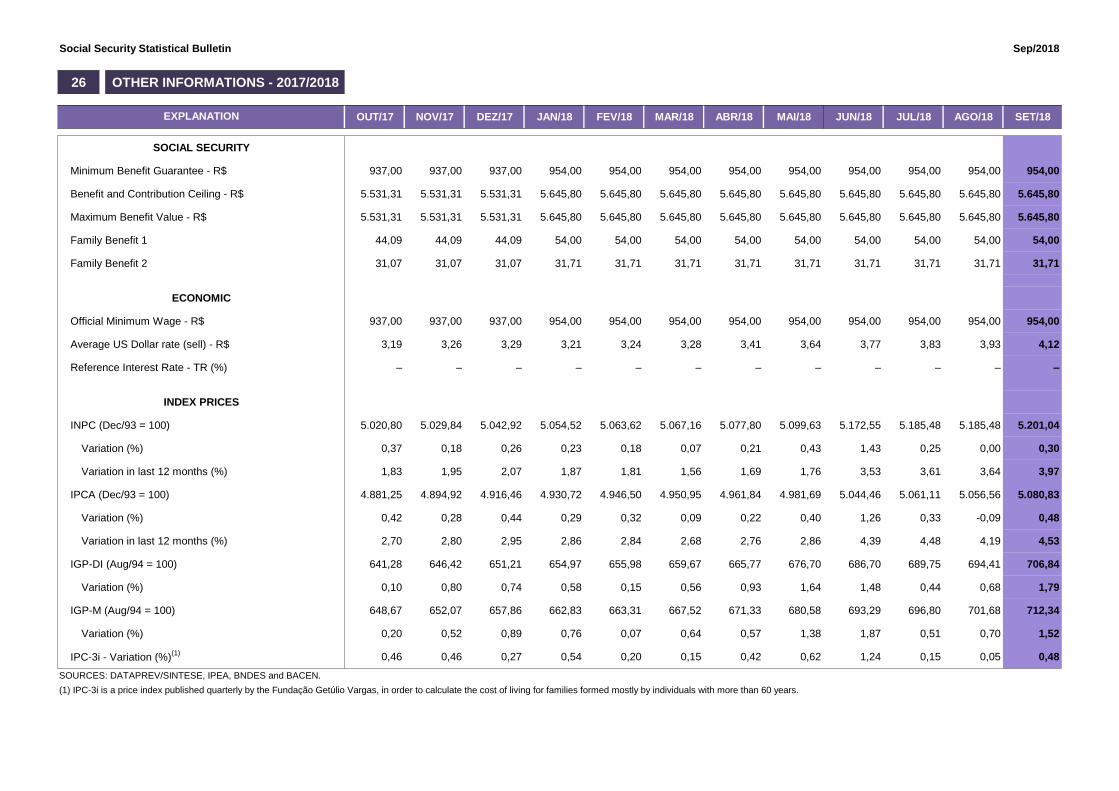
Social Security Statistical Bulletin Sep/2018
26 OTHER INFORMATIONS - 2017/2018
OUT/17 NOV/17 DEZ/17 JAN/18 FEV/18 MAR/18 ABR/18 MAI/18 JUN/18 JUL/18 AGO/18 SET/18
SOCIAL SECURITY
Minimum Benefit Guarantee - R$ 937,00 937,00 937,00 954,00 954,00 954,00 954,00 954,00 954,00 954,00 954,00 954,00
Benefit and Contribution Ceiling - R$ 5.531,31 5.531,31 5.531,31 5.645,80 5.645,80 5.645,80 5.645,80 5.645,80 5.645,80 5.645,80 5.645,80 5.645,80
Maximum Benefit Value - R$ 5.531,31 5.531,31 5.531,31 5.645,80 5.645,80 5.645,80 5.645,80 5.645,80 5.645,80 5.645,80 5.645,80 5.645,80
Family Benefit 1 44,09 44,09 44,09 54,00 54,00 54,00 54,00 54,00 54,00 54,00 54,00 54,00
Family Benefit 2 31,07 31,07 31,07 31,71 31,71 31,71 31,71 31,71 31,71 31,71 31,71 31,71
ECONOMIC
Official Minimum Wage - R$ 937,00 937,00 937,00 954,00 954,00 954,00 954,00 954,00 954,00 954,00 954,00 954,00
Average US Dollar rate (sell) - R$ 3,19 3,26 3,29 3,21 3,24 3,28 3,41 3,64 3,77 3,83 3,93 4,12
Reference Interest Rate - TR (%) – – – – – – – – – – – –
INDEX PRICES
INPC (Dec/93 = 100) 5.020,80 5.029,84 5.042,92 5.054,52 5.063,62 5.067,16 5.077,80 5.099,63 5.172,55 5.185,48 5.185,48 5.201,04
Variation (%) 0,37 0,18 0,26 0,23 0,18 0,07 0,21 0,43 1,43 0,25 0,00 0,30
Variation in last 12 months (%) 1,83 1,95 2,07 1,87 1,81 1,56 1,69 1,76 3,53 3,61 3,64 3,97
IPCA (Dec/93 = 100) 4.881,25 4.894,92 4.916,46 4.930,72 4.946,50 4.950,95 4.961,84 4.981,69 5.044,46 5.061,11 5.056,56 5.080,83
Variation (%) 0,42 0,28 0,44 0,29 0,32 0,09 0,22 0,40 1,26 0,33 -0,09 0,48
Variation in last 12 months (%) 2,70 2,80 2,95 2,86 2,84 2,68 2,76 2,86 4,39 4,48 4,19 4,53
IGP-DI (Aug/94 = 100) 641,28 646,42 651,21 654,97 655,98 659,67 665,77 676,70 686,70 689,75 694,41 706,84
Variation (%) 0,10 0,80 0,74 0,58 0,15 0,56 0,93 1,64 1,48 0,44 0,68 1,79
IGP-M (Aug/94 = 100) 648,67 652,07 657,86 662,83 663,31 667,52 671,33 680,58 693,29 696,80 701,68 712,34
Variation (%) 0,20 0,52 0,89 0,76 0,07 0,64 0,57 1,38 1,87 0,51 0,70 1,52
0,46 0,46 0,27 0,54 0,20 0,15 0,42 0,62 1,24 0,15 0,05 0,48
SOURCES: DATAPREV/SINTESE, IPEA, BNDES and BACEN.
(1) IPC-3i is a price index published quarterly by the Fundação Getúlio Vargas, in order to calculate the cost of living for families formed mostly by individuals with more than 60 years.
EXPLANATION
IPC-3i - Variation (%)(1)
BENEFITS
Benefits consist of monetary payments by Social Security to insured persons or their dependents. They aim at covering the events of sickness, labour accidents, invalidity, death or age, as well as length of
contribution and work under hazardous and special health menacing conditions; protection to maternity; family benefit (for each child) and imprisonments benefit; and assistance benefits paid to the aged or
disabled persons.
Continued benefits are characterized as continuous monthly payments, which endure until a certain event (e.g. death) cause their interruption. Benefits are adjusted each year to inflation according to an
index stipulated by law (currently the INPC – National Consumer Price Index), always the same month than the minimum wage adjustment occurs.
The cycle of a benefit in the social security system comprehends: a) Concession, the flow of new benefits into the system; b) Maintenance, the administration of active and suspended benefits which are part
of the roster; c) Cessation , corresponding to the benefits which do not generate credits any longer and are excluded from the active roster; and, d) Emission, which refers to the generation of a payment
credit corresponding to an active benefit. A benefit is considered as suspended when it is not generating payment credits; however, it may be reactivated at any moment.
Benefits can be classified as: a) GENERAL REGIME BENEFITS are ruled by the General Social Security Regime (Regime Geral de Previdência Social – RGPS); they depend on the contribution of the
insured (be they mandatory or voluntary contributors) and encompass general benefits and labour accident benefits. Their monthly value is calculated with reference to the wages on which were calculated
the contributions and they are adjusted to inflation according to an index given by legislation. General Benefits usually depend on the fulfillment of a minimum contribution period before the insured can
qualify to the concession. They include retirement benefits, survivor pensions, temporary benefits, family benefits and maternity benefits. Labour Accident Benefits are due to the insured that suffered an
accident, or to his/her dependent, if the accident occurs when the insured is working serving a company. Professional or occupational diseases are also listed under labour accident figures, as well as the
accident suffered during the displacement of the insured between his/her residence and the work place, provoking lesion or functional impact which cause death or reduce the capability to work; and, b)
SOCIAL ASSISTANCE BENEFITS are ruled by the Social Assistance Law (Lei Orgânica da Assistência Social – LOAS), granting a monthly minimum wage benefit to those aged 65 or more and to
disabled people. In both cases the family income must be below the threshold of 25% of the minimum wage per member. These benefits do not depend on a previous contribution record.
CONCEDED BENEFITS:
Correspond to the benefit requirements presented by insured or their dependents to Social Security, which are analyzed, approved and authorized for payment because they fulfilled all criteria necessary for
obtaining the specific benefit. Information displayed refers to the Date of Benefit Analysis (Data de Despacho do Benefício – DDB). Quantity figures include neither alimonies nor splitting of a single
survivor pension among different dependents because they correspond to the fraction of a same benefit despite of the existence of a Benefit Number (Número de Benefício – NB) of its own for each fraction.
Value data correspond to the converted Initial Monthly Payment (Renda Mensal Inicial – RMI). Conversion is done from the Date of Benefit Start (Data de Início do Benefício – DIB) to the Date of Benefit
Analysis (Data de Despacho do Benefício – DDB). Displayed value information does not include positive complements, discounts or delayed benefit payments.
VALUE OF CREDIT EMISSION AT CONCESSION:
Corresponds to the credits emitted for the first payment of conceded benefits. From the second payment on credit emissions are displayed in the tables referring to Benefit Emission.
Unlike information displayed in other concession tables, values refer to net values, which means the difference between the gross value (value of the benefit plus complements, etc.) and the value of
discounts (income tax, alimonies, etc.), including, if given, the value of delayed payments. The reference month corresponds to the payment date and not to the Date of Benefit Authorization (DDB), used in
the rest of the concession tables.
EMITTED BENEFITS:
Emitted benefits are credits sent to the payment system referring to continuous payment benefits that are in the active benefit roster. Positive Complements (Complementos Positivos – CP) of a benefit, e.g.
those stemming from a judicial decision, reactivation or revision of a benefit, etc. also constitute emitted credits as long as they are of low unitary value. Emitted benefits do not include Alternative Benefit
Payments (Pagamentos Alternativos de Benefícios – PAB), which are commanded by Social Security Offices (Agências da Previdência Social – APS) and paid directly at Banco do Brasil. The amount of
emitted credits can be larger than the quantity of active benefits because one benefit may generate more than one credit within a single month. Information on quantity includes alimonies and survivor
pension unfolding. Value information refers to the net value, obtained by the difference between the gross value (benefit value plus complements, family benefit, etc.) and the value of reductions (income
tax, alimonies, etc.). Tables 12, 13 and 14, unlike all other tables, consider the value of the benefit plus complements and do not incorporate non-permanent credits nor reductions. Information usually refers
to the calendar month of the benefit, not the payment month. The 13th yearly payment are part of the calendar months of August and November, paid in the months of September and December respectively.

REQUIREMENTS, DENIALS AND BENEFITS UNDER ANALYSIS:
REQUIRED: Quantity of processes requiring a benefit (receiving a Benefit Number– NB) and whose Requirement Entrance (Data de Entrada do Requerimento – DER) is the month of reference.
DENIED: Refers to benefit requirements that were analyzed and not conceded because they did not fulfill all legal criteria needed for concession.
UNDER ANALYSIS: Correspond to the benefit requirement stock which has still not been dispatched by the INSS, that means, neither conceded nor refused or concluded until the month of reference, or
which need the requiring person to supply additional information or documents. Comprehend the benefit requirements that have a DER but no Benefit Dispatch Data (Data de Despacho do Benefício –
DDB).
Information on requirements, denials and benefits under analysis include benefits of the General Regime, labour accident, social assistance and treasury-owed (BLE) benefits. Data related to Social
Assistance Pensions – Invalidity and Old Age are included, respectively, under Benefits by Labour Incapability and Other Benefits.
SUSPENDED BENEFITS:
Correspond to the benefits of the roster that, temporarily, do not generate credit for payment, although their value is updated each month and they can be reactivated any time by the INSS. They include
alimonies and split survivor benefits.
CEASED BENEFITS:
Correspond to continuous benefits that do not generate credits for several possible reasons, like death, medical decision, transformation into another benefit, legal age limit surpassed, etc. in accordance to
legislation. Since the communication of the event generating the cessation of a benefit may occur, in some cases, with delay, those information are subject to ulterior correction. They include alimonies and
split survivor benefits.
AVERAGE CONCESSION TIME:
Corresponds to the average number of days used to conclude a concession process. The time is measured between the Requirement Entrance Date (Data de Entrada do Requerimento – DER) or Date of
Document Regularization (Data de Regularização da Documentação – DRD) if there had been some information to be provided by the insured and the Date of Benefit Analysis (Data de Despacho do
Benefício – DDB). Encompasses all benefits under normal analysis process, except those in phases 3 (administrative appeal) and 4 (at court).
REVENUE
Comprehends the activities related to the collecting of social security revenue, patrimonial revenue and other values due to Social Security as foreseen in legislation. Social Security contributions are: a)
those due by companies and similar, incident on the remuneration paid, due or credited to the insured at their service and those on gross revenue and net profit; b) those due by domestic employers; c) those
due by the insured (employee, including domestic ones, daily workers, self employed, special rural insured and optative insured) and, d) those incident on lotteries.
Contributions of companies on gross revenue, total turn-over and net profit, except those substituting employer contributions which in the normal case would have been on the payroll, and those refering to
lotteries, are collected by the Federal Revenue Secretary (Secretaria da Receita Federal do Brasil) and are not included in the tables of this bulletin. Contributions referring to the remuneration of those
insured serving a company, the substitutive contributions incident on turn-over, gross revenue and net profit (sport associations with professional soccer team, farmers) as well as patrimonial revenue
encompassing income generated by negotiation or location of INSS real estate, are administered by the INSS.
TOTAL REVENUE:
Value of all income included in the Social Security Revenue Form (Guia da Previdência Social – GPS). Encompasses social security contributions (from companies and similar as well as contributors in
general), debt total and programmed payments (administrative and judicial phases), patrimonial income, benefit devolution, labour court decisions and others. Includes contributions related to other entities
(Salário-Educação, INCRA, SENAI, SESC, etc.) and all legal additionals (inflation adjustment, interest and fines), that means it corresponds to position # 11 of the GPS Form. Data are registered by place
of payment and the reference month is the calendar month the form was processed.
REVENUE FROM COMPANIES AND SIMILAR:
Value of payments stemming from social security contributions from companies and similar entities. Covers those parts due by companies and the insured (on the payroll), to the labour accident insurance,
the first commercialization of rural production, to gross revenue of sport events. Also includes contributions referring to other entities (Salário-Educação, INCRA, SENAI, SESC, etc.) and the legal
additionals (inflation adjustment, interest and fine), that means it corresponds to position # 11 of the GPS Form. Data are registered by place of payment and the reference month is the calendar month the
form was processed. Value of companies and similar according to States in table 23 differs from table 24 because in the first data is shown by place of payment and in the second by company location. The
sum also differs between both tables because the first considers all GPS Forms and the second excludes those GPS Forms with totalization error (the sum of the parts differs from the informed total).
CASH FLOW:
Corresponds to the financial movimentation of Social Security, with daily monitoring of inflows (revenues) and outflows (payments) of financial resources in the INSS accountability.
OTHER SOCIAL SECURITY INFORMATION
MINIMUM BENEFIT GUARANTEE: Is the minimum value established by Constitution, Art. 201, § 2º, which reads as follows: “No income substituting benefit should be lower than the monthly value
of the official minimum wage.”
CONTRIBUTION CEILING: It is the largest value of the contribution basis to the General Regime.
BENEFIT CEILING: It is the largest value of benefits paid by the General Regime (except maternity benefits and court decisions).
FAMILY BENEFIT: Due to the employee and the day worker, be them active or retired by age, invalidity or all other retired after age 65 if men and 60 if women, or still if receiving sickness benefit,
according to the number of children aged until 14 or of any age if invalid. Starting January 2015, the family benefit for each child or similar until age 14 or invalid of any age, corresponds to: a) R$ 37.18
(thirty seven real and eighteen cents) with monthly income of up to R$ 725.02 (seven hundred and twenty-five real and two cents); b) R$ 26.20 (twenty-six real and twenty cents) for the insured with
monthly income between R$725.03 (seven hundred and twenty-five real and three cents) and R$ 1,089.72 (one thousand and eighty-nine real and seventy-two cents) inclusive.
CONTRIBUTION BASIS:
The contribution basis lies between the minimum official wage and the contribution ceiling (respectively R$ 788.00 and R$ 4,663.75 – starting January 2015): a) for the employee and day worker – the
remuneration received in one or more companies, comprehending the totality of all income paid in exchange for work during that certain month; b) for the domestic employee – the remuneration registered
in the individual Labour Booklet (Carteira de Trabalho e Previdência Social – CTPS); c) for the self employed – the remuneration received for services to one or more companies or for the autonomous
work during that certain month; and for the voluntary insured – the value declared.
BENEFIT CALCULATION BASIS:
It is the basic reference used to calculate the monthly value of continuous benefits: a) for retirement by age and length of contribution, the arithmetic average of the 80% largest monthly contribution bases,
inflation adjusted, multiplied by the demographic factor (fator previdenciário – mandatory in case of length of contribution, optional in case of age); and for the retirement by invalidity, special retirement
due to health hazards, sickness benefit and partial invalidity benefit, the arithmetic average of the 80% largest monthly contribution bases, inflation adjusted.
CONTRIBUTORS TO THE GENERAL REGIME:
Contributors to Social Security are the company or similar, the domestic employer and the worker. The following persons are compulsory contributors: employee, domestic employee, self employed, day
worker and special rural insured. There are still those who voluntarily affiliate to Social Security, the voluntary contributors. Each contributor has a specific kind of contribution. The main concepts are:
COMPANY – individual firm or society which assumes the risk of urban or rural economic activity, with purpose of profit or not, as well as organisms of public direct or indirect administration and
their foundations. Similar to a company, for social security purposes, is a self employed who hires the service of another insured, as well as cooperatives, associations or entities of any kind, diplomatic
and consular foreign missions.
DOMESTIC EMPLOYER – Person or family which admits, without purpose of profit, domestic employee(s).

WORKER – Can be classified as follows:
Employee – Delivering continuous services to urban or rural companies, subordinated and in exchange for remuneration, including the employed directors; and,
Day Worker – Delivers services to one or more urban or rural companies, without permanent employment, with intermediation of unions or manpower organizations (usually at ports).
SELF EMPLOYED – Law 9.876/1999 unified employers, autonomous workers and similar into one single group. It includes: farmers; gold washers; religious ministers; civil Brazilians working
abroad; urban and rural employers; worker which sells services occasionally; and the autonomous worker. Decree 3.048/1999 also includes: the member of a cooperative, association or similar, as well
as the house keeper elected, which work for remuneration, the retiree of any regime nominated temporary class judge of Labour Justice or Electoral Justice and others.
Autonomous Worker and Similar – The person delivering eventual urban or rural services to one or more companies a without employment relation; or the urban or rural self employed with or
without purpose of profit.
Employer – Corresponds to the owner of a firm, not employed director, member of administration board and similar.
DOMESTIC EMPLOYEE – Person which delivers continuous services to another person of family, in exchange of remuneration, without purpose of profit.
VOLUNTARY INSURED – Person aged 16 or more which affiliates to the General Regime and pays contributions, provided he/she does not perform remunerated work which turns him/her into a
mandatory insured.
SPECIAL RURAL INSURED – Farmer, partner, sharer or tenant, small fisher or similar, which perform those activities individually or within their families, including children aged 16 or more and
similar, provided they work with the respective family group.
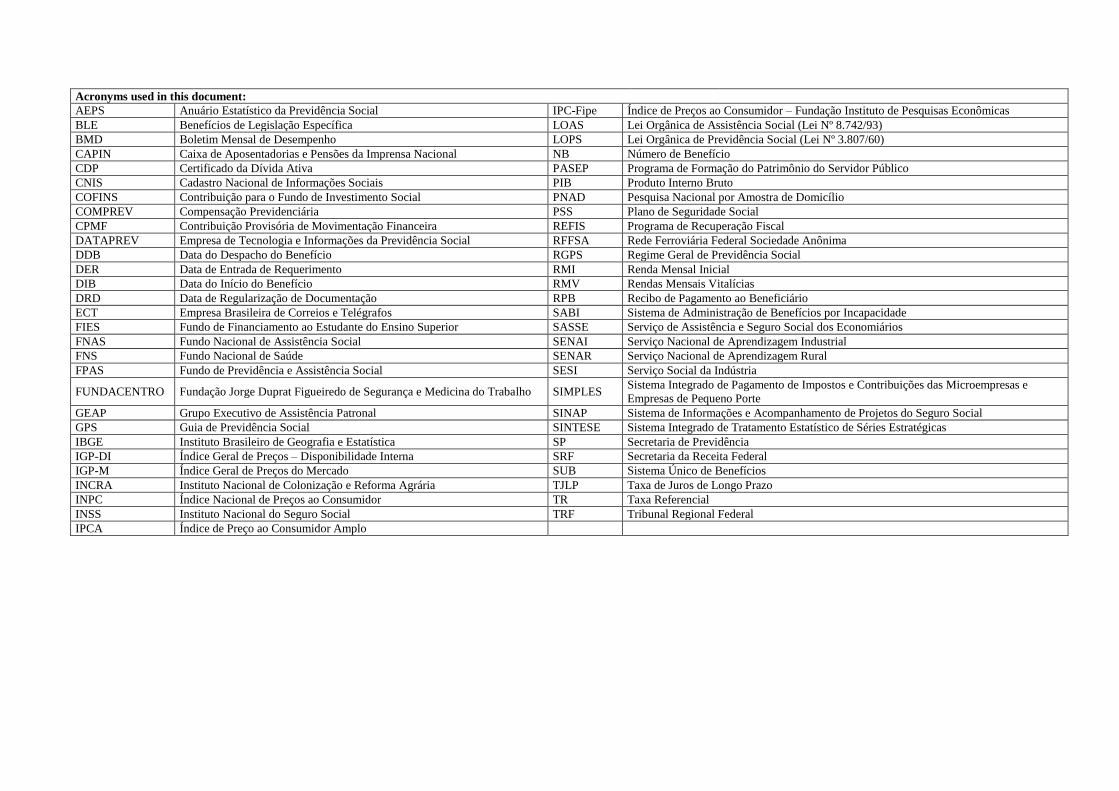
Acronyms used in this document:
AEPS Anuário Estatístico da Previdência Social IPC-Fipe Índice de Preços ao Consumidor – Fundação Instituto de Pesquisas Econômicas
BLE Benefícios de Legislação Específica LOAS Lei Orgânica de Assistência Social (Lei Nº 8.742/93)
BMD Boletim Mensal de Desempenho LOPS Lei Orgânica de Previdência Social (Lei Nº 3.807/60)
CAPIN Caixa de Aposentadorias e Pensões da Imprensa Nacional NB Número de Benefício
CDP Certificado da Dívida Ativa PASEP Programa de Formação do Patrimônio do Servidor Público
CNIS Cadastro Nacional de Informações Sociais PIB Produto Interno Bruto
COFINS Contribuição para o Fundo de Investimento Social PNAD Pesquisa Nacional por Amostra de Domicílio
COMPREV Compensação Previdenciária PSS Plano de Seguridade Social
CPMF Contribuição Provisória de Movimentação Financeira REFIS Programa de Recuperação Fiscal
DATAPREV Empresa de Tecnologia e Informações da Previdência Social RFFSA Rede Ferroviária Federal Sociedade Anônima
DDB Data do Despacho do Benefício RGPS Regime Geral de Previdência Social
DER Data de Entrada de Requerimento RMI Renda Mensal Inicial
DIB Data do Início do Benefício RMV Rendas Mensais Vitalícias
DRD Data de Regularização de Documentação RPB Recibo de Pagamento ao Beneficiário
ECT Empresa Brasileira de Correios e Telégrafos SABI Sistema de Administração de Benefícios por Incapacidade
FIES Fundo de Financiamento ao Estudante do Ensino Superior SASSE Serviço de Assistência e Seguro Social dos Economiários
FNAS Fundo Nacional de Assistência Social SENAI Serviço Nacional de Aprendizagem Industrial
FNS Fundo Nacional de Saúde SENAR Serviço Nacional de Aprendizagem Rural
FPAS Fundo de Previdência e Assistência Social SESI Serviço Social da Indústria
FUNDACENTRO Fundação Jorge Duprat Figueiredo de Segurança e Medicina do Trabalho SIMPLES Sistema Integrado de Pagamento de Impostos e Contribuições das Microempresas e
Empresas de Pequeno Porte
GEAP Grupo Executivo de Assistência Patronal SINAP Sistema de Informações e Acompanhamento de Projetos do Seguro Social
GPS Guia de Previdência Social SINTESE Sistema Integrado de Tratamento Estatístico de Séries Estratégicas
IBGE Instituto Brasileiro de Geografia e Estatística SP Secretaria de Previdência
IGP-DI Índice Geral de Preços – Disponibilidade Interna SRF Secretaria da Receita Federal
IGP-M Índice Geral de Preços do Mercado SUB Sistema Único de Benefícios
INCRA Instituto Nacional de Colonização e Reforma Agrária TJLP Taxa de Juros de Longo Prazo
INPC Índice Nacional de Preços ao Consumidor TR Taxa Referencial
INSS Instituto Nacional do Seguro Social TRF Tribunal Regional Federal
IPCA Índice de Preço ao Consumidor Amplo

Note
Groups of Species are composed by following benefits:
Retirement by Age 07, 08, 41, 52, 78 and 81
Retirement by Invalidity 04, 06, 32, 33, 34, 51 and 83
Retirement by Length of Contribution 42, 43, 44, 45, 46, 49, 57, 72 and 82
Survivor Pension 01, 03, 21, 23, 27, 28, 29, 55 and 84
Temporary Benefits 13, 15, 25, 31, 36 and 50
Labour Accident Benefits 02, 05, 10, 91, 92, 93, 94 and 95
Others 47, 48, 68, 79 and 80
Social Assistance Benefits 11, 12, 30, 40, 85, 86, 87 and 88
Treasury Owed Benefits – BLE 22, 26, 37, 38, 54, 56, 58, 59, 60, 76 and 89.
Conventions
... the phenomenon may or may not have occurred, but its value is unknown.
- the phenomenon has not been verified.
0 or 0,00 the phenomenon has been verified, but its value is below half the unit used in the table.
PERSONS INVOLVED: Minister of Finance: Eduardo Refinetti Guardia ; Executive Secretary of Ministry of Finance: Ana Paula Vitali Janes Vescovi ; Secretary of Social Security: Marcelo
Caetano; Secretary of Social Security Policies: Benedito Adalberto Brunca; General Coordinator for Statistics, Demography and Actuary: Alexandre Zioli Fernandes; Assistants: Carolina Fernandes dos
Santos, Sergio Luiz Maximino e Valdemir de Souza Silva.
Social Security Statistical Bulletin is a monthly publication of the Social Security Secretary of the Ministry of Finance , under responsibility of the Secretary of Social Security Policies and prepared by the
General Coordination of Statistics, Demography and Actuary. Printing: Social Communication. Also available at internet at the address: www.previdencia.gov.br
Total or partial reproduction of information contained in this bulletin is allowed, regarded mention of source.
CORRESPONDENCE: Secretaria da Fazenda do Ministério da Fazenda – Secretaria de Políticas de Previdência Social
Esplanada dos Ministérios Bloco “F” 7º andar Sala 741 – 70.059-900 – Brasília/DF
Tel: +55 61 2021 5115. Fax: +55 61 2021 5020


![[2015] PwC-BEPS Final Reports.pdf](https://img.pdfslide.us/doc/110x75/577c783a1a28abe0548f2d80/2015-pwc-beps-final-reportspdf.jpg)