Embed Size (px)
Citation preview
AssetManagementin Europe
10th Edition Facts and figures
An overview of the Asset Management Industry
EFAMAEuropean Fund and Asset Management Association
Address: 47 Rue Montoyer, B-1000 Brussels
T. +32 2 513 39 69
E. [email protected] - www.efama.org
Follow us on Twitter @EFAMAnews
Download our EFAMA App for iPad | Android
September 2018
380091_Asset Management Report 2018 cover_1.indd 1 04/09/2018 11:52

1
1. Introduction
This report aims at providing facts and figures on the financial assets managed through investment funds and discretionary mandates, focusing on where the assets are managed. This perspective is distinct from most other EFAMA reports, such as the Fact Book, Fact Sheets and Quarterly Statistical Releases, which analyze the trends in the European investment fund market from the standpoint of the countries in which the funds are domiciled.
The report is primarily based on data provided by EFAMA national member associations through a questionnaire. Eighteen national member associations provided data on the value of the assets managed in their countries at end 2016: Austria, Belgium, Bulgaria, the Czech Republic, Denmark, France, Germany, Greece, Hungary, Italy, Netherlands, Portugal, Romania, Slovenia, Switzerland, Spain, Turkey and the UK. According to our estimation, these countries account for 86% of the assets under management (AuM) in Europe. Additional internal and external data have been used to estimate the AuM in the other European countries. The value of total AuM at end 2017 has been estimated on the basis of the growth in investment fund assets in 2017.
2. Role of Third-Party Asset Managers
Retail and institutional investors may outsource the management of their portfolios to third-party regulated asset managers (hereafter “asset managers” for the sake of simplicity), which manage assets to achieve a specific investment goal as set out by their clients. Investors’ assets always remain the property of the investor and are held by third parties (called depositaries, custodians or trustees). In this way, they are kept safe and can be withdrawn or transferred to be managed by another manager, if necessary.
Channeling savings towards investment
Asset managers play a key role in the economy. Their most important role is to channel savings towards investment. Asset managers do this by creating products that match investors’ needs with companies in need of capital to finance their investments. This helps to create jobs and to support a strong economy. In addition, by buying and selling assets, asset managers also contribute to the smooth operation of financial markets.
Asset managers also help to fund governments. Acting on behalf of their clients, asset managers are one of the biggest investors in government bonds.
Linking investors and companies
By providing a connection between the pools of savings and the investment opportunities, the asset management industry links investors and companies. Typically, those companies would issue capital market securities, such as corporate bonds and stocks, to fund their operations and investments.
In response to the financing demand, asset managers play an important intermediary role in the financial system by funding new investment projects and generating returns to millions of savers and investors.

2
Engaging with investee companies Asset managers play an important role as stewards of companies with a view to maintaining and enhancing the long-term value of companies for investors. This responsibility is often described as active ownership or engagement, also called shareholder engagement or shareholder advocacy. Shareholders hold the companies accountable to ensure that they are well run and thrive. This involves regular engagement and contact, voting at general meetings, and holding these companies to the highest corporate governance standards. Many asset managers, acting on behalf of investors, also integrate environmental, social and governance (ESG) concerns in their investment processes. Serving the needs of investors Asset managers are required by law to act in the best interests of their clients and to invest in accordance with a predefined set of rules and principles. Asset managers must therefore provide the information necessary for investors to make informed decisions and report regularly on how their investments are doing. Asset managers usually charge a fee which is based on the value of the assets they manage. In this way, the incentives of investors and asset managers to achieve positive returns are aligned. Asset managers allow their clients to gain access, in a cost effective way, to a wider range of products and solutions than would be available to someone who chose to do it themselves. They can reduce risk by helping investors diversify their financial wealth across asset classes, products and geographies.
Stylized View of the Asset Management’s Key Roles

3
3. Assets under Management in Europe
Assets managed in Europe reached a record high of EUR 25.2 trillion in 2017. This brought the ratio of Assets under Management (AuM) to European GDP to 147% at the end of 2017. Total assets under management have not ceased growing since 2008. The good performance of both equity and bond markets since 2011 paved the way for this asset growth. The flows of new money into investment funds and discretionary mandates also contributed to that evolution, as investors regained confidence in financial markets.
The pool of assets managed in Europe remains centered on a small number of European countries. The UK is the largest asset management market in Europe, followed by France and Germany; together; these three countries represented 62% of the total AuM in Europe at end 2016. This high concentration reflects the size of these countries’ economies, the experience of these countries in financial services and their pool of savings accumulated over the years.
Asset management portfolios can be made up of investment funds and/or discretionary mandates. Investment funds are regulated funds that pool together savings of investors with similar investment goals. A discretionary mandate is a specific investment ‘mandate’ delegated to an asset manager by a specific investor, tailor-made to that particular investors’ precise investment goals. Asset managers typically receive mandates from institutional clients, whereas retail investors are generally offered investment funds. In Europe, discretionary mandates represented EUR 10,984 billion or 48.1% of total AuM at end 2016, whereas the share of investment fund assets in total AuM stood at 51.9% and amounted to EUR 11,867 billion.
European AuM at end 2016 (EUR billion and percent of total)
European AuM (EUR trillion and percent)
4
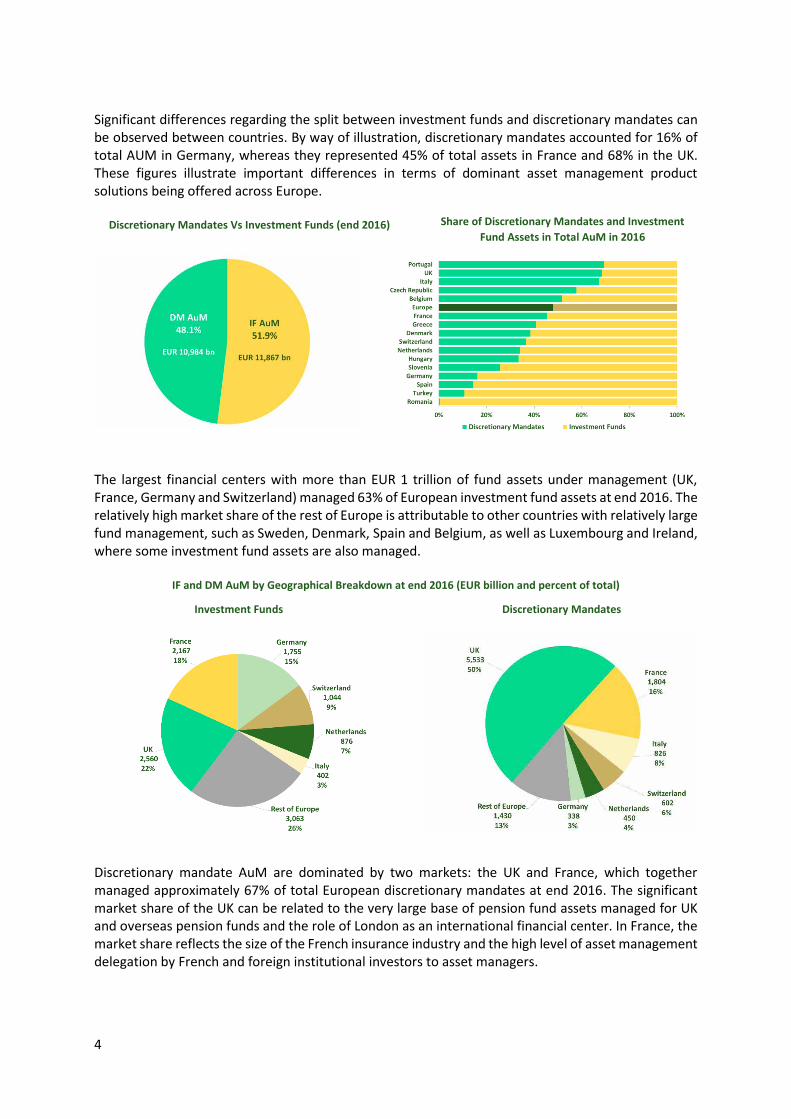
Significant differences regarding the split between investment funds and discretionary mandates can be observed between countries. By way of illustration, discretionary mandates accounted for 16% of total AUM in Germany, whereas they represented 45% of total assets in France and 68% in the UK. These figures illustrate important differences in terms of dominant asset management product solutions being offered across Europe. The largest financial centers with more than EUR 1 trillion of fund assets under management (UK, France, Germany and Switzerland) managed 63% of European investment fund assets at end 2016. The relatively high market share of the rest of Europe is attributable to other countries with relatively large fund management, such as Sweden, Denmark, Spain and Belgium, as well as Luxembourg and Ireland, where some investment fund assets are also managed.
Discretionary mandate AuM are dominated by two markets: the UK and France, which together managed approximately 67% of total European discretionary mandates at end 2016. The significant market share of the UK can be related to the very large base of pension fund assets managed for UK and overseas pension funds and the role of London as an international financial center. In France, the market share reflects the size of the French insurance industry and the high level of asset management delegation by French and foreign institutional investors to asset managers.
Discretionary Mandates Vs Investment Funds (end 2016) Share of Discretionary Mandates and Investment Fund Assets in Total AuM in 2016
Discretionary Mandates
IF and DM AuM by Geographical Breakdown at end 2016 (EUR billion and percent of total)
Investment Funds

5
4. Clients of the European Asset Management Industry The European asset management industry serves both retail clients – usually composed of households and high net worth individuals (HNWI) – and institutional clients, who are the most important clients of the industry. Institutional clients are dominated by insurance companies and pension funds, which accounted for 25% and 28% of the total assets managed in Europe at end 2016, respectively. These high shares can be explained by the fact that pension funds and insurance companies control large amounts of financial assets and outsource the management of all, or part, of their assets to external asset managers. Institutional investors strongly dominate the discretionary mandate segment of the market, for two main reasons. Firstly, mandates are typically associated with minimum investment amount, making them less attractive investment vehicles for retail investors. Secondly, mandates can offer specific investment solutions according to the investors’ sophisticated needs, such as asset-liability management, liability driven investments and separation of alpha and beta investment strategies. In general, asset managers deliver such customized solutions and services to clients with a high level of investable assets. The situation is different in the investment fund market where retail clients tend to be the dominant client. This being said, pension funds and insurers also invest a significant share of their portfolios into investment funds. This is the case in particular in Germany and Austria, where special investment funds (Spezialfonds) are very popular investment vehicles dedicated exclusively to institutional investors, i.e. insurance companies, pension funds and municipal agencies. In France, investment funds are also used extensively in workplace pension schemes and money market funds play and important role in the cash management of many French corporations.
Discretionary Mandates by Client Type (end 2016) Investment Funds by Client Type (end 2016)
Breakdown of Clients by AuM (end 2016) Evolution of the Breakdown between Clients by AuM
6
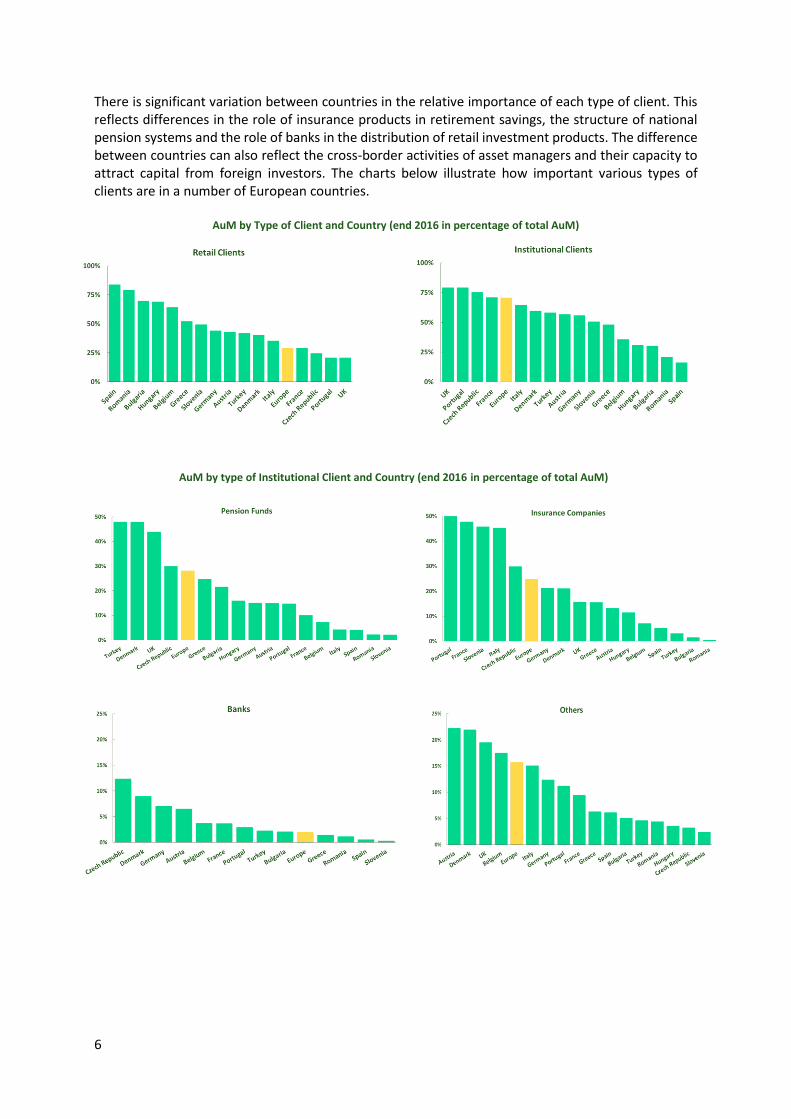
There is significant variation between countries in the relative importance of each type of client. This reflects differences in the role of insurance products in retirement savings, the structure of national pension systems and the role of banks in the distribution of retail investment products. The difference between countries can also reflect the cross-border activities of asset managers and their capacity to attract capital from foreign investors. The charts below illustrate how important various types of clients are in a number of European countries.
AuM by Type of Client and Country (end 2016 in percentage of total AuM)
AuM by type of Institutional Client and Country (end 2016 in percentage of total AuM)
7
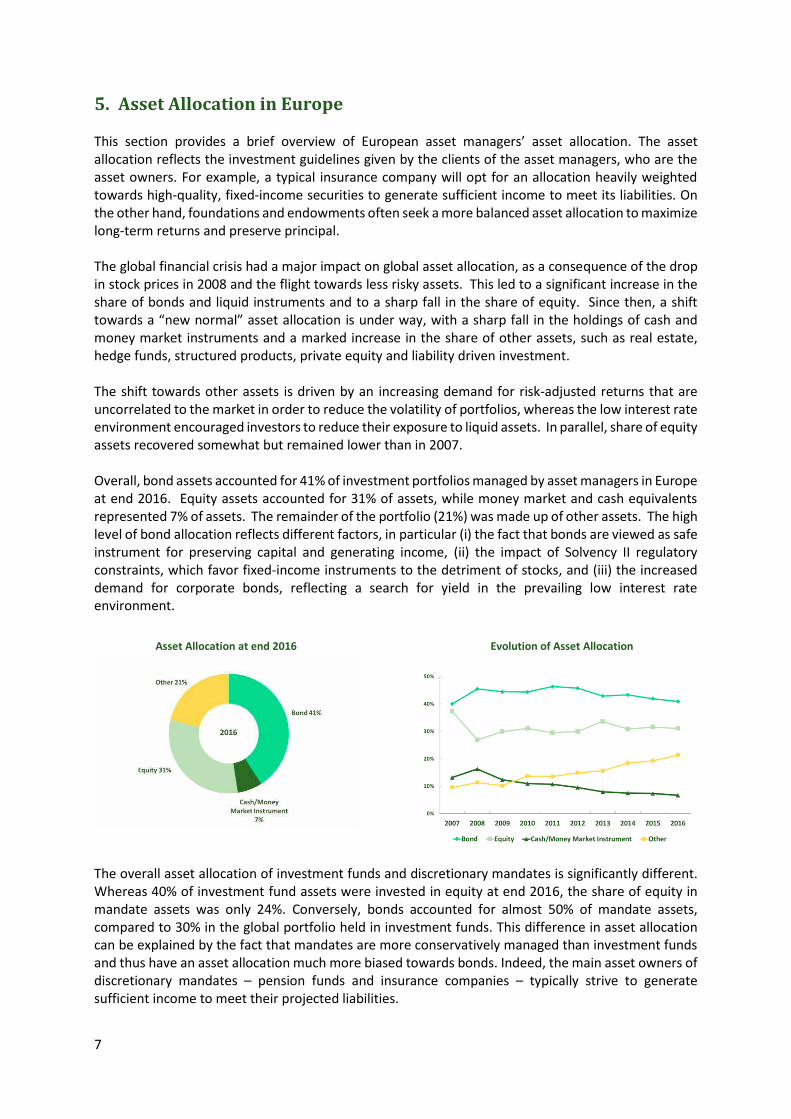
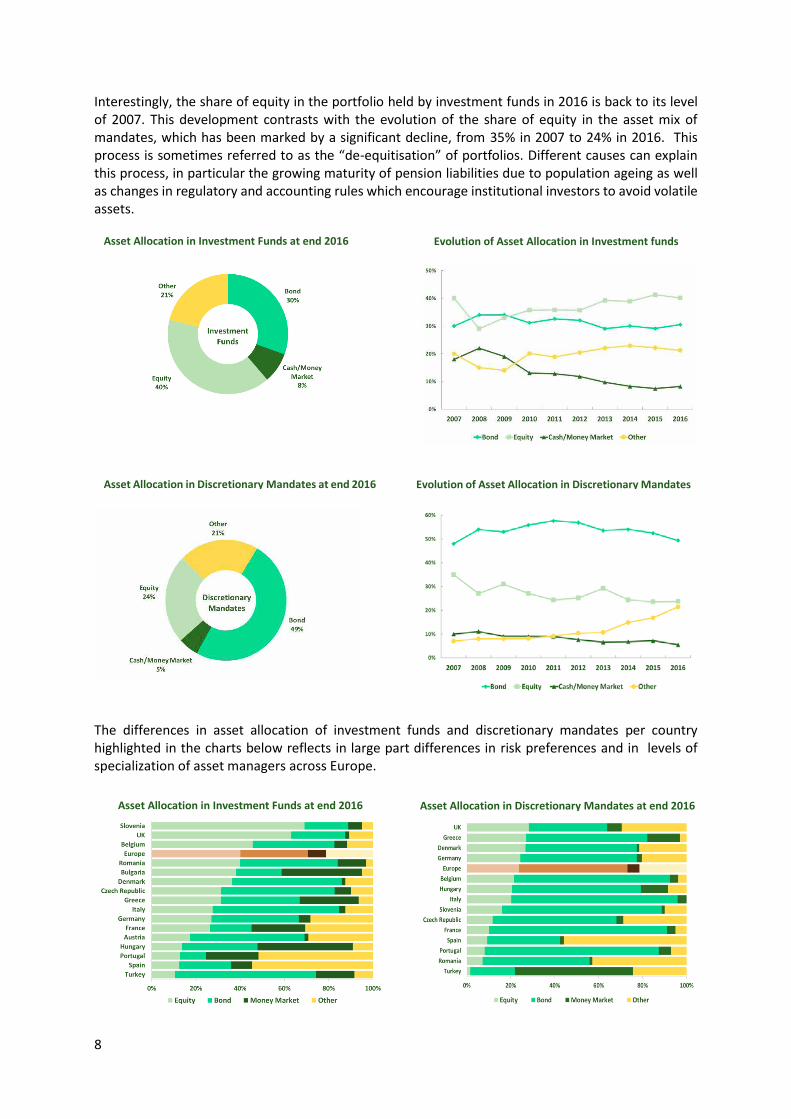
5. Asset Allocation in Europe This section provides a brief overview of European asset managers’ asset allocation. The asset allocation reflects the investment guidelines given by the clients of the asset managers, who are the asset owners. For example, a typical insurance company will opt for an allocation heavily weighted towards high-quality, fixed-income securities to generate sufficient income to meet its liabilities. On the other hand, foundations and endowments often seek a more balanced asset allocation to maximize long-term returns and preserve principal. The global financial crisis had a major impact on global asset allocation, as a consequence of the drop in stock prices in 2008 and the flight towards less risky assets. This led to a significant increase in the share of bonds and liquid instruments and to a sharp fall in the share of equity. Since then, a shift towards a “new normal” asset allocation is under way, with a sharp fall in the holdings of cash and money market instruments and a marked increase in the share of other assets, such as real estate, hedge funds, structured products, private equity and liability driven investment. The shift towards other assets is driven by an increasing demand for risk-adjusted returns that are uncorrelated to the market in order to reduce the volatility of portfolios, whereas the low interest rate environment encouraged investors to reduce their exposure to liquid assets. In parallel, share of equity assets recovered somewhat but remained lower than in 2007. Overall, bond assets accounted for 41% of investment portfolios managed by asset managers in Europe at end 2016. Equity assets accounted for 31% of assets, while money market and cash equivalents represented 7% of assets. The remainder of the portfolio (21%) was made up of other assets. The high level of bond allocation reflects different factors, in particular (i) the fact that bonds are viewed as safe instrument for preserving capital and generating income, (ii) the impact of Solvency II regulatory constraints, which favor fixed-income instruments to the detriment of stocks, and (iii) the increased demand for corporate bonds, reflecting a search for yield in the prevailing low interest rate environment. The overall asset allocation of investment funds and discretionary mandates is significantly different. Whereas 40% of investment fund assets were invested in equity at end 2016, the share of equity in mandate assets was only 24%. Conversely, bonds accounted for almost 50% of mandate assets, compared to 30% in the global portfolio held in investment funds. This difference in asset allocation can be explained by the fact that mandates are more conservatively managed than investment funds and thus have an asset allocation much more biased towards bonds. Indeed, the main asset owners of discretionary mandates – pension funds and insurance companies – typically strive to generate sufficient income to meet their projected liabilities.
Other Assets
Asset Allocation at end 2016 Evolution of Asset Allocation
8
Interestingly, the share of equity in the portfolio held by investment funds in 2016 is back to its level of 2007. This development contrasts with the evolution of the share of equity in the asset mix of mandates, which has been marked by a significant decline, from 35% in 2007 to 24% in 2016. This process is sometimes referred to as the “de-equitisation” of portfolios. Different causes can explain this process, in particular the growing maturity of pension liabilities due to population ageing as well as changes in regulatory and accounting rules which encourage institutional investors to avoid volatile assets.
The differences in asset allocation of investment funds and discretionary mandates per country highlighted in the charts below reflects in large part differences in risk preferences and in levels of specialization of asset managers across Europe.
Asset Allocation in Investment Funds at end 2016
Asset Allocation in Discretionary Mandates at end 2016
Evolution of Asset Allocation in Investment funds
Evolution of Asset Allocation in Discretionary Mandates
Asset Allocation in Investment Funds at end 2016 Asset Allocation in Discretionary Mandates at end 2016

9
6. Industry Organization
6.1. Asset Management Companies There were almost 4,200 asset management companies operating in Europe in 2016. The table below shows the number of firms in each country. The high number of asset management companies in the UK, France and Germany reflects the relative importance of London, Paris and Frankfurt as asset management centers and the role played by independent and specialized asset managers, such as management companies of private equity funds. The high number of asset management companies operating in Ireland and Luxembourg mirrors the role played by these two countries in the cross-border distribution of UCITS. Another dimension of the organization of the European asset management industry is the extent to which asset management firms operate as stand-alone companies, or form part of financial services groups. The chart to the right shows the relative importance of asset management companies belonging to a banking group or an insurance group. The companies that are independent or controlled by other types of financial firms are regrouped in the other category. It is important to note here that these figures relate to the number of firms, and not their AuM.
Number of Asset Management Companies 1
Number of Asset Management Companies by Parent Group Categories (end 2016)
1 The figures give the number of management companies registered in the countries concerned, except for Austria, Czech Republic, Hungary and Romania where the figures refer to the members of the national trade association. For Ireland, the number refers to the number of UCITS Management companies and AIF Managers in 2017. For Slovenia, the number includes subsidiaries of foreign asset management companies. For the UK, the number is an estimation; there were 138 asset management companies that were members of The IA in 2016; these members managed 85% of the AuM in the UK.
Country 2016 Country 2016Austria 26 Liechtenstein 16Belgium 64 Luxembourg 314Bulgaria 31 Malta 120Croatia 21 Netherlands 224Cyprus 102 Norway 31
Czech Republic 22 Portugal 72Denmark 50 Romania 21Finland 25 Slovakia 9France 630 Slovenia 7
Germany 325 Spain 101Greece 52 Sweden 100
Hungary 27 Switzerland 190Ireland 253 Turkey 50Italy 261 United Kingdom 1,050
Europe 4,194

10
6.2. Employment An important indicator of the contribution of the asset management industry to the overall economy is the level of direct employment in asset management companies. The number of people directly employed in asset management companies in the UK, France and Germany is estimated to total almost 70,000 at end 2016. Based on this data and the fact that these countries represent around 62% of AuM in Europe, we estimate that around 110,000 individuals are directly employed by the asset management industry across Europe. When looking at the total number of people employed by the industry, it is necessary to take into account the indirect employment associated with fund distribution, and related services and support functions of asset management such as accounting, auditing, custodianship, IT, legal, marketing, research and FinTech. Taking into account these related services along the asset management value chain, the French asset management association (AFG) has estimated that every direct job in asset management, in France, gives rise to 4.6 full-time equivalent jobs in related services. Using this ratio, total employment of the asset management industry in Europe can be estimated to approximately 610,000 full-time equivalent jobs.
Direct Employment in European Asset Management Companies in 2016
Asset Management and Related Services
Total Employment in the European Asset Management Industry in 2016
1 Full-time equivalent jobs.
11
7. Statistical Annex
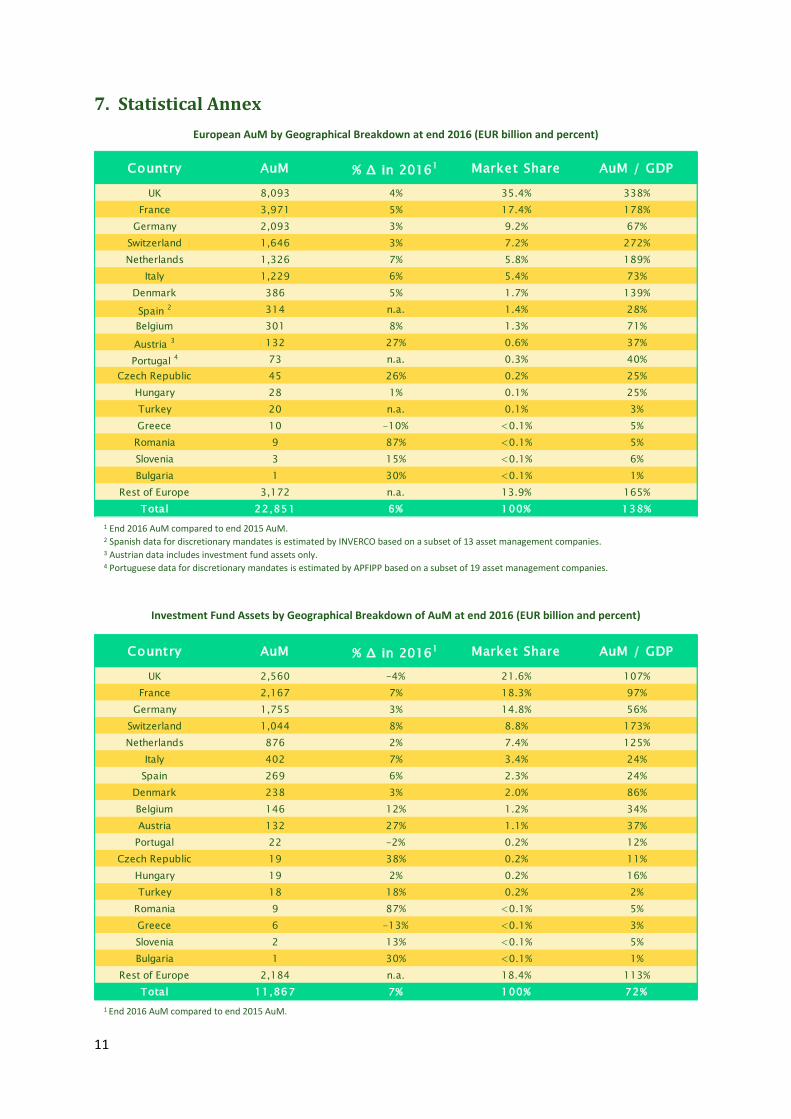
European AuM by Geographical Breakdown at end 2016 (EUR billion and percent)
1 End 2016 AuM compared to end 2015 AuM. 2 Spanish data for discretionary mandates is estimated by INVERCO based on a subset of 13 asset management companies. 3 Austrian data includes investment fund assets only. 4 Portuguese data for discretionary mandates is estimated by APFIPP based on a subset of 19 asset management companies.
1 End 2016 AuM compared to end 2015 AuM.
Investment Fund Assets by Geographical Breakdown of AuM at end 2016 (EUR billion and percent)
Country AuM % Δ in 20161 Market Share AuM / GDPUK 8,093 4% 35.4% 338%
France 3,971 5% 17.4% 178%Germany 2,093 3% 9.2% 67%
Switzerland 1,646 3% 7.2% 272%Netherlands 1,326 7% 5.8% 189%
Italy 1,229 6% 5.4% 73%Denmark 386 5% 1.7% 139%Spain 2 314 n.a. 1.4% 28%Belgium 301 8% 1.3% 71%Austria 3 132 27% 0.6% 37%Portugal 4 73 n.a. 0.3% 40%
Czech Republic 45 26% 0.2% 25%Hungary 28 1% 0.1% 25%Turkey 20 n.a. 0.1% 3%Greece 10 -10% <0.1% 5%
Romania 9 87% <0.1% 5%Slovenia 3 15% <0.1% 6%Bulgaria 1 30% <0.1% 1%
Rest of Europe 3,172 n.a. 13.9% 165%Total 22,851 6% 100% 138%
Country AuM % Δ in 20161 Market Share AuM / GDPUK 2,560 -4% 21.6% 107%
France 2,167 7% 18.3% 97%Germany 1,755 3% 14.8% 56%
Switzerland 1,044 8% 8.8% 173%Netherlands 876 2% 7.4% 125%
Italy 402 7% 3.4% 24%Spain 269 6% 2.3% 24%
Denmark 238 3% 2.0% 86%Belgium 146 12% 1.2% 34%Austria 132 27% 1.1% 37%
Portugal 22 -2% 0.2% 12%Czech Republic 19 38% 0.2% 11%
Hungary 19 2% 0.2% 16%Turkey 18 18% 0.2% 2%
Romania 9 87% <0.1% 5%Greece 6 -13% <0.1% 3%Slovenia 2 13% <0.1% 5%Bulgaria 1 30% <0.1% 1%
Rest of Europe 2,184 n.a. 18.4% 113%Total 11,867 7% 100% 72%
12
1 End 2016 AuM compared to end 2015 AuM. 2 Belgian data includes unit-linked insurance products and pension funds. 3 Portuguese data for discretionary mandates is estimated by APFIPP based on a subset of 19 asset management companies. 4 Spanish data for discretionary mandates is estimated by INVERCO based on a subset of 13 asset management companies.
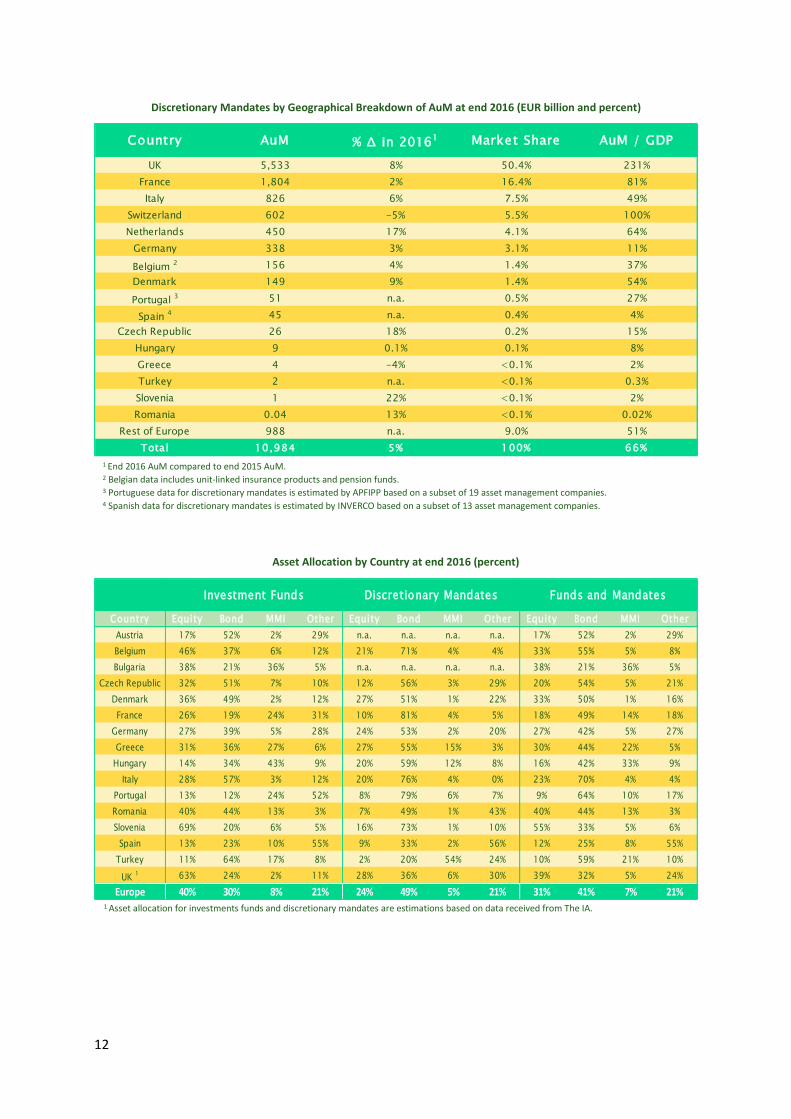
Discretionary Mandates by Geographical Breakdown of AuM at end 2016 (EUR billion and percent)
Asset Allocation by Country at end 2016 (percent)
1 Asset allocation for investments funds and discretionary mandates are estimations based on data received from The IA.
Country Equity Bond MMI Other Equity Bond MMI Other Equity Bond MMI OtherAustria 17% 52% 2% 29% n.a. n.a. n.a. n.a. 17% 52% 2% 29%Belgium 46% 37% 6% 12% 21% 71% 4% 4% 33% 55% 5% 8%Bulgaria 38% 21% 36% 5% n.a. n.a. n.a. n.a. 38% 21% 36% 5%
Czech Republic 32% 51% 7% 10% 12% 56% 3% 29% 20% 54% 5% 21%Denmark 36% 49% 2% 12% 27% 51% 1% 22% 33% 50% 1% 16%France 26% 19% 24% 31% 10% 81% 4% 5% 18% 49% 14% 18%
Germany 27% 39% 5% 28% 24% 53% 2% 20% 27% 42% 5% 27%Greece 31% 36% 27% 6% 27% 55% 15% 3% 30% 44% 22% 5%
Hungary 14% 34% 43% 9% 20% 59% 12% 8% 16% 42% 33% 9%Italy 28% 57% 3% 12% 20% 76% 4% 0% 23% 70% 4% 4%
Portugal 13% 12% 24% 52% 8% 79% 6% 7% 9% 64% 10% 17%Romania 40% 44% 13% 3% 7% 49% 1% 43% 40% 44% 13% 3%Slovenia 69% 20% 6% 5% 16% 73% 1% 10% 55% 33% 5% 6%
Spain 13% 23% 10% 55% 9% 33% 2% 56% 12% 25% 8% 55%Turkey 11% 64% 17% 8% 2% 20% 54% 24% 10% 59% 21% 10%
UK 1 63% 24% 2% 11% 28% 36% 6% 30% 39% 32% 5% 24%Europe 40% 30% 8% 21% 24% 49% 5% 21% 31% 41% 7% 21%
Discretionary Mandates Funds and MandatesInvestment Funds
Country AuM % Δ in 20161 Market Share AuM / GDPUK 5,533 8% 50.4% 231%
France 1,804 2% 16.4% 81%Italy 826 6% 7.5% 49%
Switzerland 602 -5% 5.5% 100%Netherlands 450 17% 4.1% 64%
Germany 338 3% 3.1% 11%Belgium 2 156 4% 1.4% 37%Denmark 149 9% 1.4% 54%Portugal 3 51 n.a. 0.5% 27%
Spain 4 45 n.a. 0.4% 4%Czech Republic 26 18% 0.2% 15%
Hungary 9 0.1% 0.1% 8%Greece 4 -4% <0.1% 2%Turkey 2 n.a. <0.1% 0.3%Slovenia 1 22% <0.1% 2%Romania 0.04 13% <0.1% 0.02%
Rest of Europe 988 n.a. 9.0% 51%Total 10,984 5% 100% 66%

AssetManagementin Europe
10th Edition Facts and figures
An overview of the Asset Management Industry
EFAMAEuropean Fund and Asset Management Association
Address: 47 Rue Montoyer, B-1000 Brussels
T. +32 2 513 39 69
E. [email protected] - www.efama.org
Follow us on Twitter @EFAMAnews
Download our EFAMA App for iPad | Android
September 2018
380091_Asset Management Report 2018 cover_1.indd 1 04/09/2018 11:52