Embed Size (px)
Citation preview

September 2016
Traffic Engineering Division

2011-2015 Virginia Work Zone Crash Facts i
The Virginia Department of Transportation (VDOT) is pleased to present 2011-2015 Virginia
Work Zone Crash Facts. This publication provides an overview of traffic crashes that occurred
in work zones throughout Virginia from 2011 through 2015.
For the purpose of this publication, a work zone crash is defined as a crash for which a “Yes” is
indicated for work zone status on the Virginia Police Crash Report, Form FR-300. Work zone
crashes that occurred on roads maintained by VDOT including interstates, primary roads, and
secondary roads and on local roads maintained by Arlington and Henrico counties, cities, and
towns are included in this publication. Work zone crash data for 2011-2015 were extracted from
the crash database in VDOT’s Roadway Network System (RNS) and used to produce the work
zone crash statistics provided in this publication.
To calculate work zone exposure statistics such as the annual number of work zones statewide,
2011-2015 work zone activities were extracted from the Virginia Traffic Information
Management System (VaTraffic) database, which contains information on traffic incidents, work
zones, planned events, weather conditions, etc. In this publication, a work zone in the exposure
statistics is defined as an event in the VaTraffic database indicating “work zone” in the event
type and such an event with a unique event identification number is regarded as one work zone.
It should be noted that the work zone crash statistics reported in previous publications such as
1999-2003 Virginia Work Zone Crash Facts defined a work zone crash as a crash with an
indication of “road under repair” in the roadway defect information in the crash database since
work zone information was not part of reporting items in a police crash report before 2004. It
should be noted, however, that the police could still report work zone information in a space for
a note or drawing. Meanwhile, work zone crashes reported in this publication were based on
work zone information included as a reporting item in a later version of the form. In addition,
the damage threshold for a reportable crash in Virginia changed from $1,000 to $1,500 in July
2008. For these reasons, readers should be advised that the work zone crash statistics shown in
this publication are not necessarily comparable to those in the previous publications.
Readers should be advised that under Title 23, Section 409, of the United States Code, the
statistics and information in this publication cannot be used in discovery or evidence in a federal
or state court proceeding or be considered for any other purposes in any action for damages
against VDOT or the State of Virginia arising from any occurrence at locations identified. The
statistics and information in this publication are intended mainly for training purposes, for public
relations purposes especially in conjunction with National Work Zone Awareness Week, and for
Strategic Highway Safety Plan (SHSP) development or updating.
Foreword

2011-2015 Virginia Work Zone Crash Facts ii
Foreword.........................................................................................................................................................................i
Glossary ........................................................................................................................................................................iv
Virginia’s Work Zone Safety Measures ........................................................................................................................ 1
Safety Performance Measures ................................................................................................................................... 2
All Work Zone Crashes (2011-2015) ................................................................................................................... 2
Fatal and Injury Work Zone Crashes (2011-2015)............................................................................................... 2
All Work Zone Crashes per Million Work Zone-Hour-Miles (2011-2015) ......................................................... 3
Fatal and Injury Work Zone Crashes per Million Work Zone-Hour-Miles (2011-2015) ..................................... 3
Safety Summary Measures ....................................................................................................................................... 4
Fatalities and Injuries at Work Zone Crashes (2011-2015) .................................................................................. 4
Work Zones (2011-2015) ..................................................................................................................................... 4
Work Zone-Hours (2011-2015) ........................................................................................................................... 5
Work Zone-Miles (2011-2015) ............................................................................................................................ 5
Work Zone-Hour-Miles (2011-2015) ................................................................................................................... 6
All Work Zone Crashes per 1,000 Work Zones (2011-2015) .............................................................................. 6
All Work Zone Crashes per 1,000 Work Zone-Hours (2011-2015) ..................................................................... 7
Fatal and Injury Work Zone Crashes per 1,000 Work Zones (2011-2015) .......................................................... 7
Virginia’s Work Zone Crash Characteristics ................................................................................................................. 8
Statewide Crash Characteristics ................................................................................................................................ 9
Yearly Work Zone Crashes (2011-2015) ............................................................................................................. 9
Quarterly Work Zone Crashes (2011-2015) ......................................................................................................... 9
Five-Year Work Zone Crashes by Quarter (2011-2015) .................................................................................... 10
Five-Year Work Zone Crashes by Month (2011-2015) ..................................................................................... 10
Percentages of Five-Year Work Zone Crashes by Light Condition by Quarter (2011-2015) ............................ 11
Five-Year Work Zone Crashes by Number of Vehicles (2011-2015) ................................................................ 11
Five-Year Work Zone Crashes by Presence of Workers (2011-2015) ............................................................... 12
Five-Year Work Zone Crashes by Crash Severity (2011-2015) ........................................................................ 12
Percentages of Five-Year Work Zone Crashes by District by Crash Severity (2011-2015) .............................. 13
Five-Year Work Zone Crashes by Collision Type (2011-2015) ........................................................................ 13
Five-Year Work Zone Crashes by Road Alignment (2011-2015) ..................................................................... 14
Five-Year Work Zone Crashes by Weather Condition (2011-2015).................................................................. 14
Five-Year Work Zone Crashes by Light Condition (2011-2015) ...................................................................... 15
Percentages of Five-Year Work Zone Crashes by District by Light Condition (2011-2015) ............................ 15
Five-Year Work Zone Crashes by Surface Condition (2011-2015) ................................................................... 16
Percentages of Five-Year Work Zone Crashes by Light Condition by Surface Condition (2011-2015) ........... 16
Table of Contents

2011-2015 Virginia Work Zone Crash Facts iii
Five-Year Work Zone Crashes by Time of Day (2011-2015)............................................................................ 17
Five-Year Work Zone Crashes per Hour by Time of Day (2011-2015) ............................................................ 17
Percentages of Five-Year Work Zone Crashes by Collision Type by Time of Day (2011-2015) ...................... 18
Percentages of Five-Year Work Zone Crashes by Functional Classification by Time of Day (2011-2015) ...... 18
Five-Year Work Zone Crashes by Day of Week (2011-2015) ........................................................................... 19
Percentages of Five-Year Work Zone Crashes by Time of Day by Day of Week (2011-2015) ........................ 19
Percentages of Five-Year Work Zone Crashes by Collision Type by Day of Week (2011-2015) ..................... 20
Five-Year Work Zone Crashes by Functional Classification (2011-2015) ........................................................ 20
Yearly Work Zone Crashes by Functional Classification (2011-2015) ............................................................. 21
Five-Year Work Zone Crashes by Facility Type (2011-2015)........................................................................... 21
Percentages of Five-Year Work Zone Crashes by Collision Type by Facility Type (2011-2015) ..................... 22
Vehicles in Five-Year Work Zone Crashes by Vehicle Type (2011-2015) ....................................................... 22
Vehicles in Yearly Work Zone Crashes by Vehicle Type (2011-2015) ............................................................. 23
Crash Characteristics by District............................................................................................................................. 24
Five-Year Work Zone Crashes by District (2011-2015) .................................................................................... 24
Percentages of Five-Year Work Zone Crashes by Presence of Workers by District (2011-2015) ..................... 24
Percentages of Five-Year Work Zone Crashes by Collision Type by District (2011-2015) .............................. 25
Percentages of Five-Year Work Zone Crashes by Light Condition by District (2011-2015) ............................ 25
Percentages of Five-Year Work Zone Crashes by Time of Day by District (2011-2015) ................................. 26
Percentages of Five-Year Work Zone Crashes by Functional Classification by District (2011-2015) .............. 26
Percentages of Five-Year Work Zone Crashes by Facility Type by District (2011-2015) ................................ 27

2011-2015 Virginia Work Zone Crash Facts iv
Crash severity: The most severe injury to any person involved in a crash, coded using the KABCO scale.
Fatal crash: Crash that results in one or more fatalities.
Fatality: Person who dies as a result of a traffic crash within 30 days of the crash.
Incapacitating injury: Disabling injury.
Injury crash: Crash that results in no fatalities but one or more persons injured.
KABCO scale: Scale classifying injury severity (K: fatal, A: incapacitating injury, B: non-incapacitating
injury, C: possible injury, O: no injury).
Non-incapacitating injury: Evident yet not disabling injury.
Possible injury: Injury that is not a fatal, disabling, or evident injury.
Property damage only (PDO) crash: Crash that results in no fatalities or injuries but there is property
damage of at least $1,500 (The threshold for a PDO crash changed from $1,000 to $1,500 in July 2008.)
Road functional classification: Process by which streets and highways are grouped into classes
according to the character of service they are intended to provide.
Roadway Network System (RNS): System tracking and managing Virginia’s road inventory and
associated assets and attributes.
VDOT district: VDOT divides the state into nine districts, each of which oversees maintenance and
construction on the state-maintained highways, bridges, and tunnels in its area.
1. Bristol: Bland, Buchanan, Dickenson, Grayson, Lee, Russell, Scott, Smyth, Tazewell,
Washington, Wise, and Wythe counties
2. Salem: Bedford, Botetourt, Carroll, Craig, Floyd, Franklin, Giles, Henry, Montgomery, Patrick,
Pulaski, and Roanoke counties
3. Lynchburg: Amherst, Appomattox, Buckingham, Campbell, Charlotte, Cumberland, Halifax,
Nelson, Pittsylvania, and Prince Edward counties
4. Richmond: Amelia, Brunswick, Charles City, Chesterfield, Dinwiddie, Goochland, Hanover,
Henrico, Lunenburg, Mecklenburg, New Kent, Nottoway, Powhatan, and Prince George counties
5. Hampton Roads: Accomack, Greensville, Isle of Wight, James City, Northampton,
Southampton, Surry, Sussex, and York counties; cities of Chesapeake, Emporia, Hampton,
Newport News, Norfolk, Poquoson, Portsmouth, Suffolk, Virginia Beach, and Williamsburg
6. Fredericksburg: Caroline, Essex, Gloucester, King George, King and Queen, King William,
Lancaster, Mathews, Middlesex, Northumberland, Richmond, Spotsylvania, Stafford, and
Westmoreland counties
7. Culpeper: Albemarle, Culpeper, Fauquier, Fluvanna, Greene, Louisa, Madison, Orange, and
Rappahannock counties
8. Staunton: Alleghany, Augusta, Bath, Clarke, Frederick, Highland, Page, Rockbridge,
Rockingham, Shenandoah, and Warren counties
9. Northern Virginia: Arlington, Fairfax, Loudoun, and Prince William counties
Virginia Traffic Information Management System (VaTraffic): Integrated data management platform
for managing a variety of activities that affect the quality of travel including planned events such as
roadway maintenance and unplanned events such as traffic accidents.
Work zone: An area of a highway or roadway with construction, maintenance, or utility work activities.
Glossary
2011-2015 Virginia Work Zone Crash Facts 1
Statewide work zone safety measures are presented in this section. There are two types of safety
measures: performance measures and summary measures. The safety performance measures are
for monitoring and evaluating the statewide safety performance of work zones, and the safety
summary measures are for providing additional insights and understanding on work zones and
work zone safety in general. Please refer to VDOT’s 2016 research report (VTRC 16-R10),
“Work Zone Safety Performance Measures for Virginia,” for details of these safety measures and
their development.
Crash locations are classified into interstate and non-interstate highways based on
TMPD_FUNCTIONAL_CLASS_CD in the RNS crash database. Specifically, a crash with
TMPD_FUNCTIONAL_CLASS_CD = ‘INT’ is classified as a crash occurring on an interstate
highway and a crash with TMPD_FUNCTIONAL_CLASS_CD not equaling ‘INT’ is classified
as a crash occurring on a non-interstate highway. Work zone locations are classified into
interstate and non-interstate highways based on a route number starting with an “I”
corresponding to “interstate” in the VaTraffic database.
Virginia’s Work Zone Safety Measures

2011-2015 Virginia Work Zone Crash Facts 2
Safety Performance Measures
Four safety performance measures of work zones were calculated using 2011-2015 crash data
extracted from the RNS crash database and 2011-2015 exposure data extracted from the
VaTraffic database: (1) all work zone crashes, (2) fatal and injury work zone crashes, (3) all
work zone crashes per million work zone-hour-miles, and (4) fatal and injury work zone crashes
per million work zone-hour-miles.
All Work Zone Crashes (2011-2015)
Fatal and Injury Work Zone Crashes (2011-2015)
2011 2012 2013 2014 2015
All Roads 3,445 3,464 3,404 4,071 2,622
Interstate Highways 1,936 1,867 2,029 2,645 1,031
Non-Interstate Highways 1,509 1,597 1,375 1,426 1,591
0
1,000
2,000
3,000
4,000
5,000
Wo
rk Z
on
e C
rash
es
Year
2011 2012 2013 2014 2015
All Roads 1,229 1,213 1,123 1,232 858
Interstate Highways 643 604 620 732 296
Non-Interstate Highways 586 609 503 500 562
0
200
400
600
800
1,000
1,200
1,400
Fata
l an
d I
nju
ry W
ork
Zon
e C
rash
es
Year

2011-2015 Virginia Work Zone Crash Facts 3
All Work Zone Crashes per Million Work Zone-Hour-Miles (2011-2015)
Fatal and Injury Work Zone Crashes per Million Work Zone-Hour-Miles (2011-2015)
2011 2012 2013 2014 2015
All Roads 1,955 2,147 1,973 2,355 1,333
Interstate Highways 2,452 2,494 2,084 3,054 960
Non-Interstate Highways 1,551 1,846 1,829 1,653 1,780
0
500
1,000
1,500
2,000
2,500
3,000
3,500
Wo
rk Z
on
e C
rash
es
Per
Mil
lio
n W
ork
Zo
ne-H
ou
r-M
iles
Year
2011 2012 2013 2014 2015
All Roads 697 752 651 713 436
Interstate Highways 814 807 637 845 276
Non-Interstate Highways 602 704 669 579 629
0
200
400
600
800
1,000
Fata
l an
d I
nju
ry W
ork
Zon
e C
rash
es
Per
Mil
lion
Work
Zon
e-H
ou
r-M
iles
Year
2011-2015 Virginia Work Zone Crash Facts 4
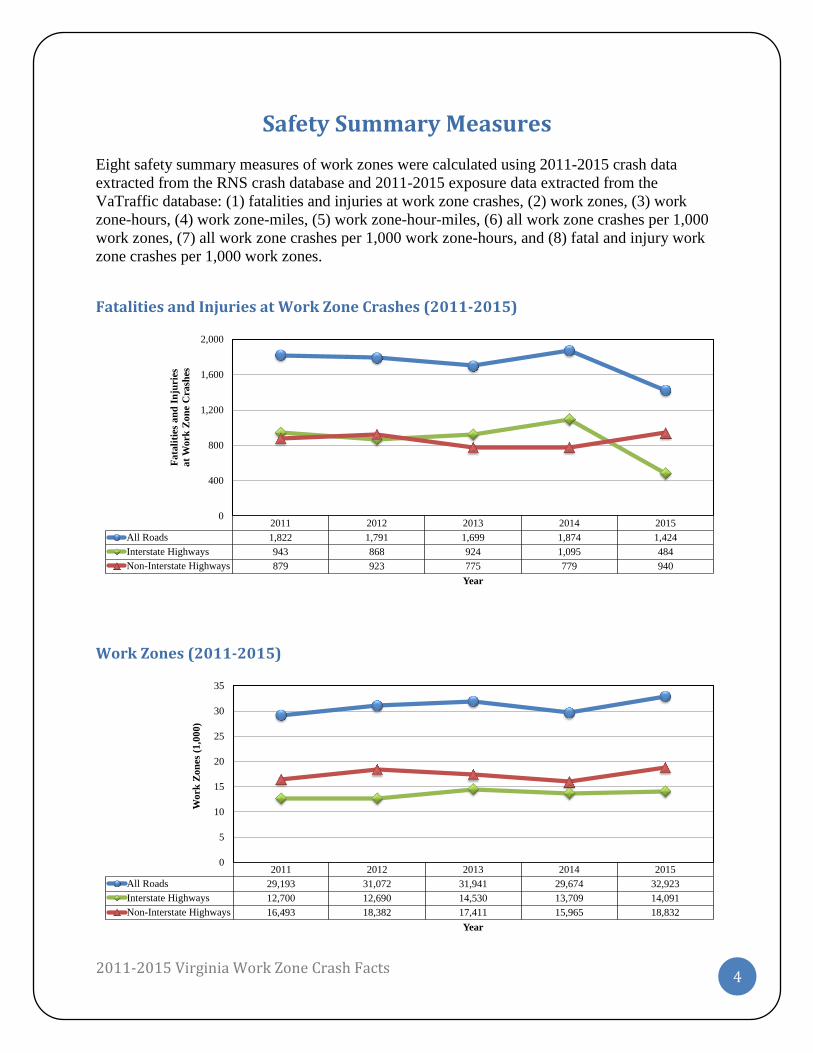
Safety Summary Measures
Eight safety summary measures of work zones were calculated using 2011-2015 crash data
extracted from the RNS crash database and 2011-2015 exposure data extracted from the
VaTraffic database: (1) fatalities and injuries at work zone crashes, (2) work zones, (3) work
zone-hours, (4) work zone-miles, (5) work zone-hour-miles, (6) all work zone crashes per 1,000
work zones, (7) all work zone crashes per 1,000 work zone-hours, and (8) fatal and injury work
zone crashes per 1,000 work zones.
Fatalities and Injuries at Work Zone Crashes (2011-2015)
Work Zones (2011-2015)
2011 2012 2013 2014 2015
All Roads 1,822 1,791 1,699 1,874 1,424
Interstate Highways 943 868 924 1,095 484
Non-Interstate Highways 879 923 775 779 940
0
400
800
1,200
1,600
2,000
Fata
liti
es a
nd
In
juri
es
at
Work
Zon
e C
rash
es
Year
2011 2012 2013 2014 2015
All Roads 29,193 31,072 31,941 29,674 32,923
Interstate Highways 12,700 12,690 14,530 13,709 14,091
Non-Interstate Highways 16,493 18,382 17,411 15,965 18,832
0
5
10
15
20
25
30
35
Wo
rk Z
on
es (
1,0
00
)
Year

2011-2015 Virginia Work Zone Crash Facts 5
Work Zone-Hours (2011-2015)
Work Zone-Miles (2011-2015)
2011 2012 2013 2014 2015
All Roads 1,301,629 1,415,729 1,313,973 1,218,193 1,474,544
Interstate Highways 297,937 290,421 305,003 294,865 406,836
Non-Interstate Highways 1,003,692 1,125,308 1,008,970 923,328 1,067,708
0
200
400
600
800
1,000
1,200
1,400
1,600
Wo
rk Z
on
e-H
ou
rs (
1,0
00
)
Year
2011 2012 2013 2014 2015
All Roads 118,067 107,247 133,810 127,649 124,645
Interstate Highways 79,057 65,289 92,023 88,381 79,383
Non-Interstate Highways 39,010 41,958 41,787 39,268 45,262
0
20
40
60
80
100
120
140
160
Wo
rk Z
on
e-M
iles
(1
,000
)
Year

2011-2015 Virginia Work Zone Crash Facts 6
Work Zone-Hour-Miles (2011-2015)
All Work Zone Crashes per 1,000 Work Zones (2011-2015)
2011 2012 2013 2014 2015
All Roads 1,762,544 1,613,580 1,725,213 1,728,945 1,967,386
Interstate Highways 789,454 748,691 973,620 866,059 1,073,815
Non-Interstate Highways 973,090 864,889 751,594 862,886 893,571
0
500
1,000
1,500
2,000
2,500
Work
Zon
e-H
ou
r-M
iles
(1,0
00)
Year
2011 2012 2013 2014 2015
All Roads 118 111 107 137 80
Interstate Highways 152 147 140 193 73
Non-Interstate Highways 91 87 79 89 84
0
50
100
150
200
250
Wo
rk Z
on
e C
rash
es
Per
1,0
00
Wo
rk Z
on
es
Year

2011-2015 Virginia Work Zone Crash Facts 7
All Work Zone Crashes per 1,000 Work Zone-Hours (2011-2015)
Fatal and Injury Work Zone Crashes per 1,000 Work Zones (2011-2015)
2011 2012 2013 2014 2015
All Roads 3 2 3 3 2
Interstate Highways 6 6 7 9 3
Non-Interstate Highways 2 1 1 2 1
0
2
4
6
8
10
Work
Zon
e C
rash
es
Per
1,0
00 W
ork
Zon
e-H
ou
rs
Year
2011 2012 2013 2014 2015
All Roads 42 39 35 42 26
Interstate Highways 51 48 43 53 21
Non-Interstate Highways 36 33 29 31 30
0
10
20
30
40
50
60
Fa
tal
an
d I
nju
ry W
ork
Zo
ne
Cra
shes
Per
1,0
00
Wo
rk Z
on
es
Year

2011-2015 Virginia Work Zone Crash Facts 8
Work zone crash characteristics are presented in this section. Most characteristics are shown on
a statewide 5-year aggregate basis, and some are shown on an annual or district basis. Road
functional classification is based on TMPD_FUNCTIONAL_CLASS_CD, and facility type is
based on RIM_FACILITY_TYPE_CD in the RNS crash database.
Virginia’s Work Zone Crash Characteristics

2011-2015 Virginia Work Zone Crash Facts 9
Statewide Crash Characteristics
Yearly Work Zone Crashes (2011-2015)
Quarterly Work Zone Crashes (2011-2015)
3,445 3,464 3,404
4,071
2,622
0
1,000
2,000
3,000
4,000
2011 2012 2013 2014 2015
Yea
rly C
rash
es
Year
591
976
881
997
724
986
901853
558
873936
1,037
847
1,0871,0961,041
506
768731
617
0
200
400
600
800
1,000
1,200
Q1 Q2 Q3 Q4 Q1 Q2 Q3 Q4 Q1 Q2 Q3 Q4 Q1 Q2 Q3 Q4 Q1 Q2 Q3 Q4
Qu
art
erly
Cra
shes
Quarter
2011 2012 2013 2014 2015

2011-2015 Virginia Work Zone Crash Facts 10
Five-Year Work Zone Crashes by Quarter (2011-2015)
Five-Year Work Zone Crashes by Month (2011-2015)
Q1
3,226
19%
Q2
4,690
28%Q3
4,545
27%
Q4
4,545
27%
1,015 975
1,236
1,443
1,5781,669
1,5471,602
1,396
1,852
1,459
1,234
0
400
800
1,200
1,600
2,000
1 2 3 4 5 6 7 8 9 10 11 12
5-Y
ear
Cra
shes
Month

2011-2015 Virginia Work Zone Crash Facts 11
Percentages of Five-Year Work Zone Crashes by Light Condition by Quarter (2011-2015)
Note: “Others” include dawn, dusk, unknown, etc.
Five-Year Work Zone Crashes by Number of Vehicles (2011-2015)
Q1 Q2 Q3 Q4
Daylight 66% 75% 71% 62%
Darkness, Road Lighted 17% 13% 14% 19%
Darkness, Road Not Lighted 12% 9% 12% 14%
Others 5% 3% 3% 5%
0%
20%
40%
60%
80%
100%
Co
lum
n P
erce
nt
Quarter
1 Vehicle
2,428
14%
2 Vehicles
11,466
68%
3 Vehicles
2,452
14%4 Vehicles
523
3%
5+ Vehicles
137
1%

2011-2015 Virginia Work Zone Crash Facts 12
Five-Year Work Zone Crashes by Presence of Workers (2011-2015)
Five-Year Work Zone Crashes by Crash Severity (2011-2015)
Note: Crash severity is based on the KABCO severity scale. A “No Injury” crash is also called a property damage
only (PDO) crash.
No Workers
Present
7,522
44%
With Law
Enforcement
2,297
14%With No Law
Enforcement
7,185
42%
Fatal Injury
(K)
58
0.3%Incapacitating
(A)
822
5%Non-Incapacitating
(B)
2,777
16%Possible Injury
(C)
1,998
12%
No Injury
(O)
11,351
67%

2011-2015 Virginia Work Zone Crash Facts 13
Percentages of Five-Year Work Zone Crashes by District by Crash Severity (2011-2015)
Note: Crash severity is based on the KABCO severity scale. A “No Injury” crash is also called a property damage
only (PDO) crash.
Five-Year Work Zone Crashes by Collision Type (2011-2015)
Note: “Others” include head on, fixed object in road, sideswipe in opposite direction, etc.
Fatal Injury
(K)
Incapacitating
(A)
Non-Incapacitating
(B)
Possible Injury
(C)
No Injury
(O)
Bristol 7% 5% 3% 2% 3%
Salem 12% 6% 4% 3% 5%
Lynchburg 2% 1% 1% 3% 2%
Richmond 9% 11% 12% 10% 11%
Hampton Roads 19% 15% 15% 18% 12%
Fredericksburg 2% 8% 6% 5% 7%
Culpeper 2% 2% 3% 2% 2%
Staunton 5% 6% 2% 3% 2%
Northern Virginia 43% 45% 53% 55% 57%
0%
20%
40%
60%
80%
100%C
olu
mn
Per
cen
t
Crash Severity (KABCO Scale)
Rear End
9,329
55%
Angle
2,415
14%
Fixed Object,
Off Road
2,218
13%
Sideswipe,
Same Direction
182
1%
Others
2,862
17%

2011-2015 Virginia Work Zone Crash Facts 14
Five-Year Work Zone Crashes by Road Alignment (2011-2015)
Note: “Others” include straight or curve hillcrest; straight or curve, dip; etc.
Five-Year Work Zone Crashes by Weather Condition (2011-2015)
Note: “Others” include fog, mist, raining, snowing, etc.
Straight, Level
12,934
76%
Straight, Grade
2,183
13%
Curve, Level
663
4%
Curve, Grade
549
3%Others
677
4%
Clear or Cloudy
15,072
89%
Rain
1,459
9%
Others
475
3%

2011-2015 Virginia Work Zone Crash Facts 15
Five-Year Work Zone Crashes by Light Condition (2011-2015)
Note: “Others” include dawn, dusk, unknown, etc.
Percentages of Five-Year Work Zone Crashes by District by Light Condition (2011-2015)
Note: “Others” include dawn, dusk, unknown, etc.
Daylight
11,690
69%
Darkness,
Road Lighted
2,647
16%
Darkness,
Road Not
Lighted
1,981
12%
Others
688
4%
DaylightDarkness,
Road Lighted
Darkness,
Road Not LightedOthers
Bristol 3% 1% 1% 2%
Salem 5% 2% 6% 5%
Lynchburg 2% 1% 1% 1%
Richmond 11% 5% 20% 11%
Hampton Roads 11% 26% 7% 14%
Fredericksburg 7% 1% 12% 4%
Culpeper 3% 1% 3% 3%
Staunton 3% 0% 4% 3%
Northern Virginia 55% 63% 47% 56%
0%
20%
40%
60%
80%
100%
Colu
mn
Per
cen
t
Light Condition

2011-2015 Virginia Work Zone Crash Facts 16
Five-Year Work Zone Crashes by Surface Condition (2011-2015)
Note: “Others” include snowy, icy, muddy, oil or other fluids, etc.
Percentages of Five-Year Work Zone Crashes by Light Condition by Surface Condition (2011-2015)
Note: “Others” include snowy, icy, muddy, oil or other fluids, etc.
Dry
14,739
87%
Wet
1,869
11%
Others
398
2%
Dry Wet Others
Daylight 70% 61% 59%
Darkness, Road Lighted 15% 17% 19%
Darkness, Road Not Lighted 11% 16% 14%
Others 4% 6% 9%
0%
20%
40%
60%
80%
100%
Co
lum
n P
erce
nt
Surface Condition

2011-2015 Virginia Work Zone Crash Facts 17
Five-Year Work Zone Crashes by Time of Day (2011-2015)
Five-Year Work Zone Crashes per Hour by Time of Day (2011-2015)
12AM-6AM
1,629
10%
6AM-9AM
2,189
13%9AM-4PM
7,614
45%
4PM-7PM
2,778
16%
7PM-12AM
2,796
16%
12AM-6AM
272
8%
6AM-9AM
730
20%9AM-4PM
1,088
30%
4PM-7PM
926
26%
7PM-12AM
559
16%

2011-2015 Virginia Work Zone Crash Facts 18
Percentages of Five-Year Work Zone Crashes by Collision Type by Time of Day (2011-2015)
Note: “Others” include head on, fixed object in road, sideswipe in opposite direction, etc.
Percentages of Five-Year Work Zone Crashes by Functional Classification by Time of Day (2011-2015)
Note: “Unknown” includes non–VDOT maintained roads (e.g., roads in cities or towns) or roads that are not
identified because of insufficient or unclear locational information in a police crash report.
12AM-6AM 6AM-9AM 9AM-4PM 4PM-7PM 7PM-12AM
Rear End 37% 55% 57% 62% 51%
Angle 10% 14% 15% 15% 15%
Fixed Object, Off Road 14% 13% 14% 10% 14%
Sideswipe, Same Direction 2% 1% 1% 1% 1%
Others 37% 17% 13% 12% 19%
0%
20%
40%
60%
80%
100%
Colu
mn
Per
cen
t
Time of Day
12AM-6AM 6AM-9AM 9AM-4PM 4PM-7PM 7PM-12AM
Interstate Highways 74% 56% 49% 54% 66%
Arterials 18% 32% 35% 32% 25%
Collectors 1% 3% 3% 3% 1%
Local Roads 0% 1% 1% 1% 1%
Unknown 6% 8% 11% 10% 7%
0%
20%
40%
60%
80%
100%
Colu
mn
Per
cen
t
Time of Day

2011-2015 Virginia Work Zone Crash Facts 19
Five-Year Work Zone Crashes by Day of Week (2011-2015)
Percentages of Five-Year Work Zone Crashes by Time of Day by Day of Week (2011-2015)
Monday
2503
15%
Tuesday
2740
16%
Wednesday
2843
17%
Thursday
3015
18%
Friday
2709
16% Saturday
1734
10%
Sunday
1462
9%
Monday Tuesday Wednesday Thursday Friday Saturday Sunday
12AM-6AM 8% 8% 8% 7% 10% 17% 16%
6AM-9AM 14% 15% 15% 14% 13% 8% 6%
9AM-4PM 48% 44% 44% 46% 46% 45% 37%
4PM-7PM 16% 16% 18% 16% 17% 15% 16%
7PM-12AM 14% 17% 16% 17% 14% 15% 25%
0%
20%
40%
60%
80%
100%
Co
lum
n P
erce
nt
Day of Week

2011-2015 Virginia Work Zone Crash Facts 20
Percentages of Five-Year Work Zone Crashes by Collision Type by Day of Week (2011-2015)
Note: “Others” include head on, fixed object in road, sideswipe in opposite direction, etc.
Five-Year Work Zone Crashes by Functional Classification (2011-2015)
Note: “Unknown” includes non–VDOT maintained roads (e.g., roads in cities or towns) or roads that are not
identified because of insufficient or unclear locational information in a police crash report.
Monday Tuesday Wednesday Thursday Friday Saturday Sunday
Rear End 54% 55% 56% 57% 57% 51% 50%
Angle 14% 15% 14% 15% 14% 15% 12%
Fixed Object, Off Road 13% 13% 14% 13% 14% 12% 10%
Sideswipe, Same Direction 1% 1% 1% 1% 1% 1% 1%
Others 17% 16% 16% 14% 15% 21% 25%
0%
20%
40%
60%
80%
100%
Colu
mn
Per
cen
t
Day of Week
Rural Interstates
869
5%
Rural Routes
833
5%
Urban Interstates
8,435
50%
Urban Routes
5,036
30%
Unknown
1,833
11%

2011-2015 Virginia Work Zone Crash Facts 21
Yearly Work Zone Crashes by Functional Classification (2011-2015)
Note: “Unknown” includes non–VDOT maintained roads (e.g., roads in cities or towns) or roads that are not
identified because of insufficient or unclear locational information in a police crash report.
Five-Year Work Zone Crashes by Facility Type (2011-2015)
Note: “Others” include one-way system, transition, structures (e.g., bridge and tunnel), etc. “Unknown” includes
non–VDOT maintained roads (e.g., roads in cities or towns) or roads that are not identified because of insufficient or
unclear locational information in a police crash report.
155
169
1,7
54
951
416
159
215
1,6
80
1,1
37
273
211
151
1,7
77
950
315
225
114
2,3
48
945
439
119
184
876 1,0
53
390
0
500
1,000
1,500
2,000
2,500
Rural Interstates Rural Routes Urban Interstates Urban Routes Unknown
Yea
rly C
raash
es
Functional Classification
2011
2012
2013
2014
2015
Two-Way
Undivided,
No Control of
Access
1,717
10%
Two-Way
Divided,
No Control of
Access
2,966
17%
Two-Way
Divided,
Partial Control
of Access
494
3%
Two-Way
Divided,
Full Control of
Access
8,773
52%
Others
954
6%
Unknown
2,102
12%

2011-2015 Virginia Work Zone Crash Facts 22
Percentages of Five-Year Work Zone Crashes by Collision Type by Facility Type (2011-2015)
Note: “Others” in facility type include one-way system, transition, structures (e.g., bridge and tunnel), etc.
“Unknown” in facility type includes non–VDOT maintained roads (e.g., roads in cities or towns) or roads that are
not identified because of insufficient or unclear locational information in a police crash report. “Others” in collision
type include head on, fixed object in road, sideswipe in opposite direction, etc.
Vehicles in Five-Year Work Zone Crashes by Vehicle Type (2011-2015)
Note: “Truck” includes a single-unit truck with 2 or more axles and a truck tractor (bobtail–no trailer). “Others”
include recreational vehicle, bus, etc.
Two-Way
Undivided,
No Control
of Access
Two-Way
Divided,
No Control
of Access
Two-Way
Divided,
Partial Control
of Access
Two-Way
Divided,
Full Control
of Access
Others Unknown
Rear End 46% 53% 58% 61% 42% 45%
Angle 25% 25% 19% 7% 9% 22%
Fixed Object, Off Road 7% 10% 9% 16% 14% 10%
Sideswipe, Same Direction 3% 1% 1% 0% 1% 3%
Others 20% 10% 13% 16% 34% 21%
0%
20%
40%
60%
80%
100%
Colu
mn
Per
cen
t
Facility Type
Passenger Car
19,326
54%
SUV
6,335
18%
Pickup Truck
3,691
10%
Truck
3,129
9%
Van
2,118
6%
Others
661
2%
Motorcycle
302
1%

2011-2015 Virginia Work Zone Crash Facts 23
Vehicles in Yearly Work Zone Crashes by Vehicle Type (2011-2015)
Note: “Truck” includes a single-unit truck with 2 or more axles and a truck tractor (bobtail–no trailer). “Others”
include recreational vehicle, bus, etc.
3,9
11
1,2
58
760
633
433
63
143
4,0
72
1,2
34
683
615
483
64
133
3,9
66
1,2
67
732
623
415
70
119
4,4
96
1,5
75
897
768
514
56
139
2,8
81
1,0
01
61
9
490
273
49
127
0
1,000
2,000
3,000
4,000
5,000
6,000
Passenger Car SUV Pickup Truck Truck Van Motorcycle Others
Nu
mb
er o
f V
ehic
les
Vehicle Type
2011
2012
2013
2014
2015

2011-2015 Virginia Work Zone Crash Facts 24
Crash Characteristics by District
Five-Year Work Zone Crashes by District (2011-2015)
Percentages of Five-Year Work Zone Crashes by Presence of Workers by District (2011-2015)
Bristol
467
3%
Salem
759
4%
Lynchburg
289
2% Richmond
1,870
11% Hampton
Roads
2,237
13%
Fredericks-
burg
1,085
6%
Culpeper
392
2%Staunton
442
3%
Northern
Virginia
9,465
56%
Bristol Salem Lynchburg RichmondHampton
Roads
Fredericks-
burgCulpeper Staunton
Northern
Virginia
No Workers Present 25% 41% 45% 29% 44% 36% 39% 37% 50%
With No Law Enforcement 72% 51% 49% 46% 36% 40% 54% 55% 40%
With Law Enforcement 3% 9% 5% 25% 20% 24% 7% 8% 10%
0%
20%
40%
60%
80%
100%
Co
lum
n P
erce
nt
District

2011-2015 Virginia Work Zone Crash Facts 25
Percentages of Five-Year Work Zone Crashes by Collision Type by District (2011-2015)
Note: “Others” include head on, fixed object in road, sideswipe in opposite direction, etc.
Percentages of Five-Year Work Zone Crashes by Light Condition by District (2011-2015)
Note: “Others” include dawn, dusk, unknown, etc.
Bristol Salem Lynchburg RichmondHampton
Roads
Fredericks-
burgCulpeper Staunton
Northern
Virginia
Rear End 53% 49% 51% 51% 54% 59% 56% 48% 56%
Angle 17% 17% 19% 19% 20% 13% 19% 16% 11%
Fixed Object, Off Road 9% 9% 7% 14% 8% 12% 9% 10% 15%
Sideswipe, Same Direction 1% 1% 2% 1% 2% 1% 1% 2% 1%
Others 21% 24% 21% 15% 16% 16% 16% 25% 16%
0%
20%
40%
60%
80%
100%
Colu
mn
Per
cen
t
District
Bristol Salem Lynchburg RichmondHampton
Roads
Fredericks-
burgCulpeper Staunton
Northern
Virginia
Daylight 88% 75% 79% 67% 59% 72% 78% 77% 68%
Darkness, Road Lighted 3% 6% 9% 8% 31% 3% 4% 3% 18%
Darkness, Road Not Lighted 6% 15% 9% 21% 6% 22% 13% 16% 10%
Others 4% 4% 3% 4% 4% 3% 5% 5% 4%
0%
20%
40%
60%
80%
100%
Colu
mn
Per
cen
t
District

2011-2015 Virginia Work Zone Crash Facts 26
Percentages of Five-Year Work Zone Crashes by Time of Day by District (2011-2015)
Percentages of Five-Year Work Zone Crashes by Functional Classification by District (2011-2015)
Note: “Unknown” includes non–VDOT maintained roads (e.g., roads in cities or towns) or roads that are not
identified because of insufficient or unclear locational information in a police crash report.
Bristol Salem Lynchburg RichmondHampton
Roads
Fredericks-
burgCulpeper Staunton
Northern
Virginia
12AM-6AM 3% 7% 6% 8% 9% 11% 5% 8% 11%
6AM-9AM 11% 9% 10% 10% 10% 9% 9% 12% 15%
9AM-4PM 58% 50% 48% 48% 39% 50% 57% 49% 43%
4PM-7PM 20% 21% 26% 13% 14% 16% 17% 17% 17%
7PM-12AM 8% 13% 10% 21% 28% 14% 12% 14% 14%
0%
20%
40%
60%
80%
100%
Colu
mn
Per
cen
t
District
Bristol Salem Lynchburg RichmondHampton
Roads
Fredericks-
burgCulpeper Staunton
Northern
Virginia
Rural Interstates 13% 19% 0% 8% 1% 4% 9% 27% 3%
Rural Routes 25% 14% 24% 5% 3% 9% 24% 16% 1%
Urban Interstates 17% 17% 0% 28% 27% 47% 2% 10% 69%
Urban Routes 16% 31% 46% 46% 51% 26% 46% 26% 21%
Unknown 29% 19% 29% 13% 18% 13% 18% 21% 5%
0%
20%
40%
60%
80%
100%
Co
lum
n P
erce
nt
District

2011-2015 Virginia Work Zone Crash Facts 27
Percentages of Five-Year Work Zone Crashes by Facility Type by District (2011-2015)
Note: “Others” include one-way system, transition, structures (e.g., bridge and tunnel), etc. “Unknown” includes
non–VDOT maintained roads (e.g., roads in cities or towns) or roads that are not identified because of insufficient or
unclear locational information in a police crash report.
Bristol Salem Lynchburg RichmondHampton
Roads
Fredericks-
burgCulpeper Staunton
Northern
Virginia
Two-Way Undivided, No Control of Access 24% 25% 28% 14% 14% 12% 19% 27% 5%
Two-Way Divided, No Control of Access 12% 15% 20% 28% 32% 22% 26% 12% 12%
Two-Way Divided, Partial Control of Access 1% 2% 11% 2% 3% 0% 8% 0% 3%
Two-Way Divided, Full Control of Access 33% 37% 6% 41% 28% 57% 15% 39% 64%
Others 2% 2% 2% 4% 3% 1% 2% 2% 8%
Unknown 28% 20% 32% 11% 20% 8% 30% 20% 8%
0%
20%
40%
60%
80%
100%
Colu
mn
Per
cen
t
District