Embed Size (px)
Citation preview
global restrictions on religion ii 1
SEPTEMBER 2012
Rising Tide of Restrictions on Religion
300 px
pew–templeton
globalreligiousfutures p
roje
ct

tHis Page intentionallY blanK
rising tiDe oF restrictions on religion
3
About the Pew Forum on Religion & Public Life
This report was produced by the Pew Research Center’s Forum on Religion & Public Life. The Pew Forum
delivers timely, impartial information on issues at the intersection of religion and public affairs. The Pew
Forum is a nonpartisan, nonadvocacy organization and does not take positions on policy debates. Based
in Washington, D.C., the Pew Forum is a project of the Pew Research Center, which is funded by The Pew
Charitable Trusts.
This report is part of the Pew-Templeton Global Religious Futures project, which is jointly and generously
funded by The Pew Charitable Trusts and the John Templeton Foundation. The project analyzes religious
change and its impact on societies around the world.
The report is a collaborative effort based on the input and analysis of the following individuals:
Primary Researcherbrian J. grim, Senior Researcher and Director of Cross-National Data, Pew Forum on Religion & Public Life
Pew Research Centerandrew Kohut, President
Paul taylor, Executive Vice President
elizabeth Mueller gross, Vice President
scott Keeter, Director of Survey Research
Visit http://pewforum.org/Government/Rising-Tide-of-Restrictions.aspx to see the online version of “rising tide of restrictions on religion.”
Pew research center’s Forum on religion & Public life
1615 l st., nW, suite 700 Washington, D.c. 20036-5610 Phone (202) 419-4550 Fax (202) 419-4559
www.pewforum.org
© 2012 Pew research center
Pew Forum luis lugo, Director
Research
alan cooperman, Associate Director, Research
Juan carlos esparza ochoa, Data Manager
chris gao, Database Consultant
anne shi, Research Associate
Peter Henne, Research Analyst Fatima ghani and angelina theodorou, Research Assistants
russell ballard, caroline crouch, timothy Kennedy, Daniel scarborough and catherine Walsh, Coders
Editorial
sandra stencel, Associate Director, Editorial
Diana Yoo, Graphic Designer
tracy Miller, Copy Editor
Hilary ramp, Assistant Editor
Communications and Web Publishing
erin o’connell, Associate Director, Communications
stacy rosenberg, Digital Project Manager
liga Plaveniece and Jemila Woodson, Communications Associates
Joseph liu, Web Associate

tHis Page intentionallY blanK

rising tiDe oF restrictions on religion
5
Table of Contents
Page
Preface 7
summary of Findings 9
changes in government restrictions 12
changes in social Hostilities 13
changes in overall restrictions 14
sidebar: situation in the United states 15
Patterns among specific types of restrictions and Hostilities 19
Harassment of specific groups 22
regions and countries 24
about the study 32
appendix 1: Methodology 35
appendix 2: government restrictions index 52
appendix 3: social Hostilities index 55
appendix 4: religious restriction index scores by region 58
appendix 5: summary of results 65
table oF contents

tHis Page intentionallY blanK

rising tiDe oF restrictions on religion
7
Preface
This is the third in a series of reports by the Pew Research Center’s Forum on Religion & Public Life analyzing the extent to which governments and societies around the world impinge on religious beliefs and practices. These reports have drawn widespread attention to the fact that a substantial portion of the world’s population – 75% as of mid-2010 – lives in countries where governments, social groups or individuals restrict people’s ability to freely practice their faith.The reports also have generated significant interest for how they bring social science research methods to bear on the study of religious restrictions. The methodology used in the reports provides a quantitative framework that those involved in the study of religious freedom can use to monitor changes in restrictions on religion over time, across the world, in specific geo-graphical regions and in individual countries.
The new report looks at the extent and direction of change in religious restrictions from the year ending in mid-2009 to the year ending in mid-2010. Where appropriate, it also compares the situation as of mid-2010 with the situation in the baseline year of the study (mid-2006 to mid-2007).
The Pew Forum’s previous report on religious restrictions, published in August 2011, found that restrictions tended to increase the most in countries that already had high government restrictions on religion or high social hostilities involving religion. In the latest year, however, there were increases in restrictions even in countries that previously had low or moderate levels of restrictions – including the United States, which is examined in a sidebar starting on page 15. As the title of the report suggests, the overall level of restrictions was higher in the lat-est year studied than it was in the previous year.
As we have noted in the two previous reports, it is important to keep in mind some limitations of this study. The indexes of government restrictions and social hostilities that serve as the basis of the study are designed to measure obstacles to religious expression and practice. As a result, the report focuses on the constraints on religion in each country and does not look at the other side of the coin: the amount of free or unhindered religious activity that takes place in particular countries. The study also does not attempt to determine whether restrictions are justified or unjustified, nor does it attempt to analyze the many factors – historical, demo-graphic, cultural, religious, economic and political – that might explain why restrictions have arisen. It simply seeks to measure the restrictions that exist in a quantifiable, transparent and reproducible way, based on published reports from numerous governmental and nongovern-mental organizations.
PreFace

PeW ForUM on religion & PUblic liFe
www.pewforum.org
8
As was the case in the two previous reports, North Korea is not included in this study. The primary sources used in this study indicate that North Korea’s government is among the most repressive in the world, including toward religion. But because independent observers lack regular access to the country, the sources are unable to provide the kind of specific, timely information that formed the basis of this analysis.
The Pew Forum’s work on global restrictions on religion is part of the Pew-Templeton Global Religious Futures project, which analyzes religious change and its impact on societies around the world. Previous reports produced under this initiative, funded by The Pew Charitable Trusts and the John Templeton Foundation, include “The World’s Muslims: Unity and Diver-sity” (August 2012), “Faith on the Move: The Religious Affiliation of International Migrants” (March 2012), “Global Christianity: A Report on the Size and Distribution of the World’s Chris-tian Population” (December 2011), “Rising Restrictions on Religion” (August 2011), “Global Survey of Evangelical Protestant Leaders” (June 2011), “The Future of the Global Muslim Population: Projections for 2010-2030” (January 2011), “Tolerance and Tension: Islam and Christianity in Sub-Saharan Africa” (April 2010), “Global Restrictions on Religion” (December 2009), “Mapping the Global Muslim Population: A Report on the Size and Distribution of the World’s Muslim Population” (October 2009) and “Spirit and Power: A 10-Country Survey of Pentecostals” (October 2006).
The principal researcher for this report was Brian J. Grim, a senior researcher and director of cross-national data at the Pew Forum. He was assisted by Peter Henne, a former Pew Forum research analyst, and by several Georgetown University graduate and undergraduate students. For helping to recruit these very capable students, we are grateful to Georgetown’s Berkley Center for Religion, Peace, and World Affairs and its director, professor Thomas Banchoff.
Luis Lugo, DirectorAlan Cooperman, Associate Director for Research

rising tiDe oF restrictions on religion
9
Summary of Findings
A rising tide of restrictions on religion spread across the world between mid-2009 and mid-2010, according to a new study by the Pew Research Center’s Forum on Religion & Public Life. Restrictions on religion rose in each of the five major regions of the world
– including in the Americas and sub-Saharan Africa, the two regions where overall restrictions previously had been declining.
The share of countries with high or very high restric-tions on religious beliefs and practices rose from 31% in the year ending in mid-2009 to 37% in the year ending in mid-2010. Because some of the most restrictive countries are very populous, three-quarters of the world’s ap-proximately 7 billion people live in countries with high government restrictions on religion or high social hos-tilities involving religion, up from 70% a year earlier.
Restrictions on religion rose not only in countries that began the year with high or very high restrictions or hostilities, such as Indonesia and Nigeria, but also in many countries that began with low or moderate restrictions or
sUMMarY oF FinDings
Overall Restrictions on ReligionPercentage of countries where levels of restrictions are ...
Percentage of global population living where levels of restrictions are ...
Percentages may not add to 100 due to rounding.
Pew research center’s Forum on religion & Public life Rising Tide of Restrictions on Religion, september 2012
0
20
40
60
80
100% 29%
25
46
30%
35
35
31%
25
44
37%
28
35
High orVery High
Moderate
Low
year endingMID-2007
year ending MID-2008
year ending MID-2009
year ending MID-2010
0
20
40
60
80
100% 68%
18
14
67%
27
6
70%
21
10
75%
19
6
High orVery High
Moderate
Low
year endingMID-2007
year ending MID-2008
year ending MID-2009
year ending MID-2010

PeW ForUM on religion & PUblic liFe
www.pewforum.org
10
hostilities, such as Switzerland and the United States. (See sidebar on the U.S. on page 15.)
The rising tide of restrictions in the latest year studied is attributable to a variety of factors, including increases in crimes, malicious acts and violence motivated by religious hatred or bias, as well as increased government inter-ference with worship or other religious practices. For instance, a November 2009 constitutional referendum in Switzerland banned the construction of minarets on mosques in the country. In Indonesia, more than two dozen churches were forced to close due to pressure from Islamist extremists or, in some instances, local officials. And in Nigeria, violence between Christian and Muslim communities, including a series of deadly attacks, escalated throughout the period.
During the latest year covered in the study, there also was an increase in harassment or intimidation of particular religious groups. Indeed, five of the seven major religious groups monitored by the study – Jews, Christians, Buddhists, adherents of folk or traditional religions, and members of other world religions – experienced four-year highs in the number of countries in which they were harassed by national, provincial or local governments, or by individuals or groups in society (for details, see page 22).
This is the third time the Pew Forum has measured restrictions on religion around the globe. The new study scores 197 countries and territories on the same two indexes used in the previ-ous studies: 1
1 Previous reports provided a score for the territory of northern cyprus and therefore included 198 countries and territories. according to the U.s. state Department, only one country – turkey – recognizes the separate status of northern cyprus. thus, future reports will score northern cyprus as part of the republic of cyprus. the exclusion of northern cyprus in this report has a negligible effect on the global and regional findings. in addition, a single index score was recorded for all of sudan for this report because south sudan remained a part of sudan until July 2011, which is after the period studied in this report.
Countries with Very High Government Restrictions on ReligionScores of 6.6 or higher on the 10-point Government Restrictions Index
baseline year, ending MID-2007
latest year, ending MID-2010
saudi arabia egypt
iran Indonesia
burma (Myanmar) Maldives
china saudi arabia
Uzbekistan Afghanistan
brunei iran
egypt Uzbekistan
eritrea Tunisia
turkey eritrea
Vietnam china
Syria
burma (Myanmar)
Russia
Vietnam
Yemen
Azerbaijan
Algeria
Belarus
gray text indicates a country that had very high government restrictions in the year ending in mid-2007 but not in the year ending in mid-2010. bold indicates a country that had very high government restrictions in the year ending in mid-2010 but not in the year ending in mid-2007.
Pew research center’s Forum on religion & Public life Rising Tide of Restrictions on Religion, september 2012

rising tiDe oF restrictions on religion
11
sUMMarY oF FinDings
• The Government Restrictions Index (GRI) measures government laws, policies and actions that restrict religious beliefs or practices. The GRI is comprised of 20 measures of restrictions, including efforts by governments to ban particular faiths, prohibit conversions, limit preaching or give preferential treatment to one or more religious groups.
• The Social Hostilities Index (SHI) measures acts of religious hostility by private individu-als, organizations and social groups. This in-cludes mob or sectarian violence, harassment over attire for religious reasons and other religion-related intimidation or abuse. The SHI includes 13 measures of social hostilities.
Over the four years studied, the number of countries with very high government restric-tions on religion rose from 10 as of mid-2007 to 18 as of mid-2010, as a total of 10 countries (Afghanistan, Algeria, Azerbaijan, Belarus, Indonesia, Maldives, Russia, Syria, Tunisia and Yemen) were added to the “very high” category, while just two (Brunei and Turkey) were removed (see table on page 10). Meanwhile, 94 countries (48%) had low levels of govern-ment restrictions as of mid-2010, down from 117 (59%) in the first year of the study. (For a complete list of all countries in each category, see the Government Restrictions Index table on page 52.)
The number of countries with very high social hostilities also rose, from 10 as of mid-2007 to 15 as of mid-2010, as five countries (Egypt, Nigeria, the Palestinian territories, Russia and Yemen) were added to the “very high” category and none were removed (see table above). Meanwhile, half of the 197 countries in the study (98) had low levels of social hostilities in mid-2010, down from 114 in mid-2007. (For a complete list of all countries in each category, see the Social Hos-tilities Index table on page 55.)
Countries with Very High Social Hostilities Involving Religion Scores of 7.2 or higher on the 10-point Social Hostilities Index
baseline year, ending MID-2007
latest year, ending MID-2010
iraq Pakistan
Pakistan india
india iraq
afghanistan sri lanka
bangladesh bangladesh
indonesia somalia
israel israel
sri lanka Nigeria
somalia Yemen
saudi arabia afghanistan
Palestinian territories
Egypt
Russia
saudi arabia
indonesia
bold indicates a country that had very high social hostilities in the year ending in mid-2010 but not in the year ending in mid-2007. Pew research center’s Forum on religion & Public life Rising Tide of Restrictions on Religion, september 2012

PeW ForUM on religion & PUblic liFe
www.pewforum.org
12
Changes in Government Restrictions
In addition to scoring countries on both indexes, the study looks at the extent and direction of change within each country from the year ending in mid-2009 to the year ending in mid-2010.
Just six countries (3%) had large changes (2.0 points or more) in their scores on the 10-point Gov-ernment Restrictions Index, and all six (Chad, the Democratic Republic of the Congo, Fiji, Ni-caragua, Sri Lanka and Tunisia) were in the direction of higher restrictions. Among countries with modest changes (1.0 to 1.9 points), there were many more increases (30) than decreases (13). And the same was true among countries with small changes (less than 1.0 point): 88 had increases, while 37 had decreases.
Considering all changes, regardless of magnitude, 63% of countries had increases in govern-ment restrictions from mid-2009 to mid-2010, while 25% had decreases. The level of increase in government restrictions during the latest year studied exceeds the increase over the previous three years, when 56% of countries had increases and 31% had decreases.
Changes in Government Restrictions Changes on the Government Restrictions Index (GRI) from the previ-ous year (ending in mid-2009) to the latest year (ending in mid-2010)
POINT CHANGE NUMBER OF COUNTRIES
PERCENTAGE OF COUNTRIES
2.0 or more increase 6 3%
1.0 to 1.9 increase 30 15
0.1 to 0.9 increase 88 45
no change 23 12
0.1 to 0.9 decrease 37 19
1.0 to 1.9 decrease 13 7
2.0 or more decrease 0 0
Total 197 100
Point changes are calculated by comparing gri scores from year to year. Percentages may not add exactly due to rounding.
Pew research center’s Forum on religion & Public life Rising Tide of Restrictions on Religion, september 2012
63%
25%
12%
rising tiDe oF restrictions on religion
13
sUMMarY oF FinDings
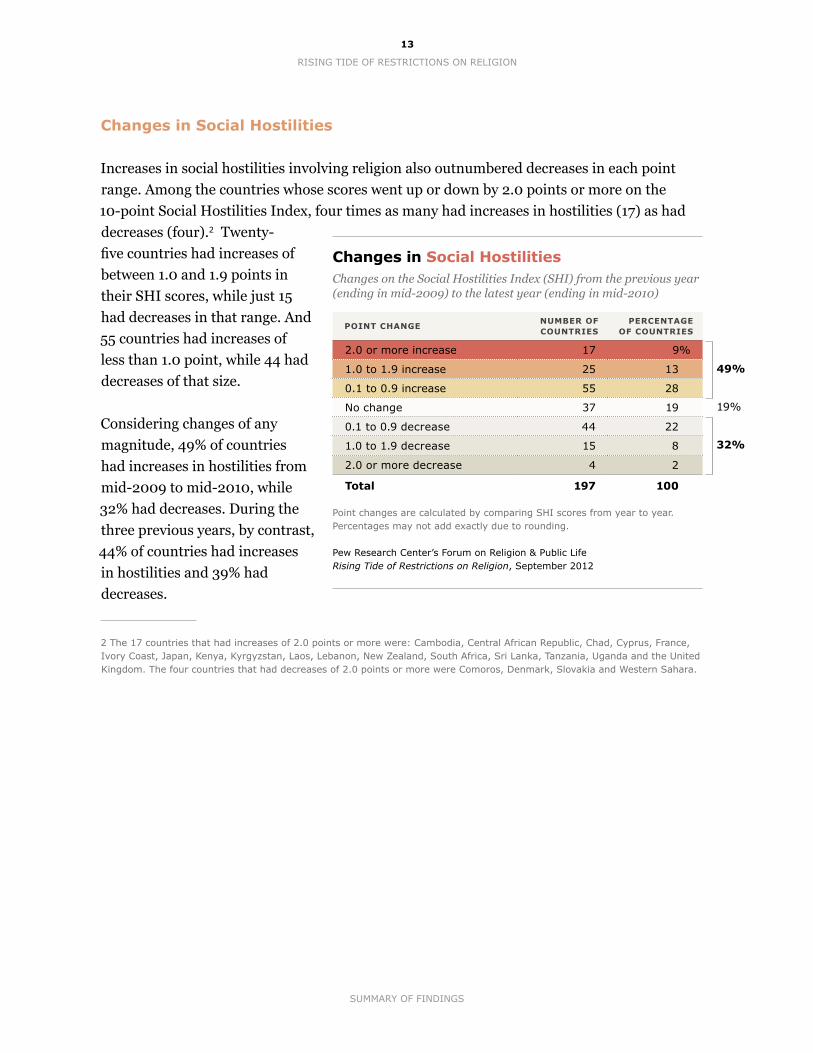
Changes in Social Hostilities Increases in social hostilities involving religion also outnumbered decreases in each point range. Among the countries whose scores went up or down by 2.0 points or more on the 10-point Social Hostilities Index, four times as many had increases in hostilities (17) as had decreases (four).2 Twenty-five countries had increases of between 1.0 and 1.9 points in their SHI scores, while just 15 had decreases in that range. And 55 countries had increases of less than 1.0 point, while 44 had decreases of that size.
Considering changes of any magnitude, 49% of countries had increases in hostilities from mid-2009 to mid-2010, while 32% had decreases. During the three previous years, by contrast, 44% of countries had increases in hostilities and 39% had decreases.
2 the 17 countries that had increases of 2.0 points or more were: cambodia, central african republic, chad, cyprus, France, ivory coast, Japan, Kenya, Kyrgyzstan, laos, lebanon, new Zealand, south africa, sri lanka, tanzania, Uganda and the United Kingdom. the four countries that had decreases of 2.0 points or more were comoros, Denmark, slovakia and Western sahara.
Changes in Social Hostilities Changes on the Social Hostilities Index (SHI) from the previous year (ending in mid-2009) to the latest year (ending in mid-2010)
POINT CHANGE NUMBER OF COUNTRIES
PERCENTAGE OF COUNTRIES
2.0 or more increase 17 9%
1.0 to 1.9 increase 25 13
0.1 to 0.9 increase 55 28
no change 37 19
0.1 to 0.9 decrease 44 22
1.0 to 1.9 decrease 15 8
2.0 or more decrease 4 2
Total 197 100
Point changes are calculated by comparing sHi scores from year to year. Percentages may not add exactly due to rounding.
Pew research center’s Forum on religion & Public life Rising Tide of Restrictions on Religion, september 2012
49%
32%
19%

PeW ForUM on religion & PUblic liFe
www.pewforum.org
14
Changes in Overall Restrictions
Considering government restrictions and social hostilities together, increases outnumbered decreases in each point range from mid-2009 to mid-2010. Among countries whose scores went up or down by 2.0 points or more on either of the indexes after taking into account any offsetting change on the other index, six times as many countries had increases (18) as decreases (three).3
Overall, restrictions increased at least somewhat in 66% of countries and decreased in 28% between mid-2009 and mid-2010. As was the case when the two indexes were considered separately, this exceeds the increase during the preceding three years, when 56% of countries had increases and 39% had decreases.
3 the 18 countries that had an increase of 2.0 points or more were: cambodia, central african republic, chad, the Democratic republic of the congo, cyprus, ivory coast, Japan, Kenya, Kyrgyzstan, lebanon, new Zealand, nicaragua, south africa, sri lanka, tanzania, tunisia, Uganda and the United Kingdom. the three countries that had decreases of 2.0 points or more were comoros, Denmark and slovakia.
Overall Changes in Global Restrictions on ReligionChanges on the Government Restrictions Index (GRI) or Social Hostilities Index (SHI) from the previous year (ending in mid-2009) to the latest year (ending in mid-2010)
POINT CHANGE NUMBER OF COUNTRIES
PERCENTAGE OF COUNTRIES
2.0 or more increase 18 9%
1.0 to 1.9 increase 37 19
0.1 to 0.9 increase 75 38
no change 12 6
0.1 to 0.9 decrease 35 18
1.0 to 1.9 decrease 17 9
2.0 or more decrease 3 2
Total 197 100
categories of overall changes in restrictions are calculated by comparing a country’s unrounded scores on the gri and the sHi from year to year. When a country’s scores on the gri and the sHi changed in the same direction (both increased or both decreased), the greater amount of change determined the category. For instance, if the country’s gri score increased by 0.8 and its sHi score increased by 1.5, the country was put into the “1.0-1.9 increase” category. When a country’s score increased on one index but decreased on the other, the difference between the amounts of change determined the grouping. For example, if the country’s gri score increased by 2.0 and its sHi score decreased by 1.5, the country went into the “0.1-0.9 increase” category. When a country’s score on one index stayed the same, the amount of change on the other index was used to assign the category.
Percentages may not add exactly due to rounding.
Pew research center’s Forum on religion & Public life Rising Tide of Restrictions on Religion, september 2012
66%
28%
6%

rising tiDe oF restrictions on religion
15
siDebar: sitUation in tHe UniteD states
Sidebar: Situation in the United States
the United states was among the 16 countries whose scores on both the government restrictions index and the social Hostilities index increased by one point or more in the year ending in mid-2010.1 this was the first time scores for the U.s. increased on both indexes during the four-year period covered in this study.
Rising Government Restrictions
based on the information in the sources consulted for this study, the U.s. score on the government restrictions index rose from 1.6 in the year ending in mid-2009 to 2.7 in the year ending in mid-2010, moving the U.s. from the low category of restrictions to the moderate category for the first time in the four years studied. (gri scores 2.4 or higher are categorized as moderate by this study, while scores 4.5 or higher are categorized as high.)
During the period from mid-2009 to mid-2010, a number of the sources used in the study reported an increase in the number of incidents at the state and local level in which members of some religious groups faced restrictions on their ability to practice their faith. this included
1 the other countries were angola, brunei, chad, germany, greece, guinea, Japan, Kenya, lebanon, liberia, republic of Macedonia, sri lanka, tanzania, Ukraine and the United Kingdom.
Restrictions on Religion in the United States
Pew research center’s Forum on religion & Public life • Rising Tide of Restrictions on Religion, september 2012
0
2
4
6
1.6 1.6 1.6
3.4
2.72.01.81.9SHI SCORE
GRI SCORE
year endingMID-2007
year ending MID-2008
year ending MID-2009
year ending MID-2010

PeW ForUM on religion & PUblic liFe
www.pewforum.org
16
incidents in which individuals were prevented from wearing certain religious attire or symbols, including beards, in some judicial settings or in prisons, penitentiaries or other correctional facilities. For instance, the U.s. Department of Justice reported that it was pursuing a lawsuit in federal court against the california Department of corrections and rehabilitation and various california officials on behalf of a sikh prison inmate who, in March 2010, had been ordered to trim his facial hair in violation of his religious beliefs. the Justice Department said the state’s inmate grooming policy “imposed a substantial burden” on the man’s ability to exercise his faith.2
some religious groups in the U.s. also faced difficulties in obtaining zoning permits to build or expand houses of worship, religious schools or other religious institutions. For instance, in May 2010, the 10th U.s. circuit court of appeals upheld a lower court ruling that the boulder county commissioners had discriminated against the rocky Mountain christian church by denying it permits to expand its school and worship facilities even though the commissioners had issued permits to a nearby secular school for a similar expansion.3 the appeals court agreed with the lower court that the commissioners’ actions violated the religious land Use and institutionalized Persons act of 2000 (rlUiPa), which protects individuals and institutions from religious discrimination in land-use decisions and protects the religious rights of prisoners and other persons confined to institutions.4 the Justice Department — in a report marking the 10th anniversary of the passage of rlUiPa — noted that 31 of its 51 land-use investigations from 2000-2010 involved christian groups; most of the remaining 20 investigations involved religious minorities, including Muslims (seven investigations), Jews (six), buddhists (three) and Hindus (one).5
From mid-2009 to mid-2010, at least one state sought to restrict the application of islamic or sharia law. in the spring of 2010, oklahoma legislators proposed an amendment to the state
2 For more information, see U.s. Department of Justice, civil rights Division. March 2011. “DoJ Files rlUiPa suit on be-half of sikh inmate.” religious Freedom in Focus, vol. 45. http://www.justice.gov/crt/spec_topics/religiousdiscrimination/newsletter/focus_45.html#1. also see complaint in intervention Pursuant to the religious land Use and institutionalized Persons act, 42 U.s.c. § 2000cc (civil rights), no. cVii-01676 sVW (FMox). http://www.justice.gov/crt/spec_topics/religiousdiscrimination/basra_comp.pdf.
3 For more information, see the decision in rocky Mountain christian church v. board of county commissioners of boulder county colorado at http://www.jdsupra.com/post/documentViewer.aspx?fid=88c64fbf-17ea-432d-8e66-1ac6b663709b. boulder county appealed the decision to the U.s. supreme court. the supreme court refused to hear the case, leaving intact the 10th circuit’s decision that boulder county had unfairly discriminated against the church. For more information, see the “Proceedings and orders” on the supreme court’s website at http://www.supremecourt.gov/search.aspx?filename=/docketfiles/10-521.htm.
4 For more information on the land-use provisions in rlUiPa, see the Pew Forum’s october 2008 report, “brutalism is in the eye of the beholder: a congregation sues D.c. for Making its church building a Historic landmark,” http://www.pew-forum.org/church-state-law/brutalism-is-in-the-eye-of-the-beholder-a-congregation-sues-Dc-for-Making-its-church-building-a-Historic-landmark.aspx.
5 see page 6 of the Justice Department’s september 2010 report, “report on the tenth anniversary of the religious land Use and institutionalized Persons act,” http://www.justice.gov/crt/rluipa_report_092210.pdf.

rising tiDe oF restrictions on religion
17
constitution that would have banned state courts from considering sharia law or international law in their decisions.6 (the constitutional change was later approved in a statewide vote, but a federal appeals court struck down the amendment in January 2012, saying it violated the First amendment to the U.s. constitution.7)
and, for the first time, one of the primary sources used in this study reported that some level of government in the U.s. had imposed limits on conversion. a report by the United nations special rapporteur on Freedom of religion or belief mentions an incident at the southport correctional Facility, an ultra-maximum security prison near elmira, n.Y., in which a prisoner was denied the right to change his religious designation to Muslim. the inmate complained that he could not participate in ramadan observances without an official change to his religious designation in the new York Department of correctional services’ records.8
Rising Social Hostilities Involving Religion
the U.s. score on the social Hostilities index also rose, from 2.0 as of mid-2009 to 3.4 as of mid-2010, moving the U.s. from the lower end of the moderate range of hostilities to the upper end of the moderate range. (social Hostilities index scores 3.6 or higher are categorized as high by this study.)
a key factor behind the increase in the U.s. score on the social Hostilities index was a spike in religion-related terrorist attacks in the United states in the year ending in mid-2010. in november 2009, for instance, U.s. army Major nidal Hasan – allegedly inspired by the U.s.-born radical cleric anwar al-awlaki – gunned down and killed 13 people and wounded 32 others at a military base in Fort Hood, texas.9 in December 2009, Umar Farouk abdulmutallab, a nigerian national, attempted to set off a bomb hidden in his underwear
6 For more information, see schlachtenhaufen, Mark. June 4, 2010. “sharia law, courts likely on 2010 ballot.” the edmond sun. http://www.edmondsun.com/local/x1996914371/sharia-law-courts-likely-on-2010-ballot.
7 For more information, see ceasar, stephen. Jan. 10, 2012. “appeals court affirms order blocking oklahoma sharia law ban.” los angeles times. http://articles.latimes.com/2012/jan/10/nation/la-na-oklahoma-sharia-20120111.
8 the n.Y. Department of correctional services’ Directive 4202 allows inmates to apply for changes to their religious designation but limits when and how often such changes are permitted once an inmate is confined. see http://www.doccs.ny.gov/directives/4202.pdf. For more information on this case, see U.n. Human rights council. Feb. 14, 2011. “report of the special rapporteur on freedom of religion or belief, Heiner bielefeldt, addendum: summary of cases transmitted to governments and replies received.” Doc. a/Hrc /16/53/add.1. http://unispal.un.org/UnisPal.nsF/0/ee945aeF270c0F538525783a005365cF.
9 For more information, see the new York times. sept. 7, 2012. “times topics: nidal Malik Hasan.” http://topics.nytimes.com/top/reference/timestopics/people/h/nidal_malik_hasan/index.html. in august 2012 (outside the period covered in this study), Hasan’s trial was put on hold while a military court considered his objections to being forced to shave his beard, which he says would violate his Muslim faith. on sept. 6, 2012, a military judge ruled that forcible shaving would not violate Hasan’s right to freely exercise his faith. Hasan’s lawyers were expected to appeal the ruling, and the case remained on hold. see Fernandez, Manny. sept. 6, 2012. “Fort Hood shooting suspect’s beard Must be shaved, Military Judge rules.” the new York times. http://www.nytimes.com/2012/09/07/us/judge-in-fort-hood-case-orders-maj-nidal-malik-hasans-beard-shaved.html.
siDebar: sitUation in tHe UniteD states

PeW ForUM on religion & PUblic liFe
www.pewforum.org
18
while aboard a Detroit-bound aircraft.10 and in May 2010, Faisal shahzad, a Pakistani-born resident of bridgeport, conn., attempted to set off a bomb in new York’s times square.11
other forms of social hostilities involving religion also increased in the U.s. during the most recent year studied. in Murfreesboro, tenn., for example, some county residents attempted to block the construction of a mosque in the spring of 2010 by claiming, as reported by the Justice Department, that islam is a “political ideology rather than a religion” and that “mosques are political rather than religious in nature.”12 (the mosque officially opened in august 2012, but opponents are still challenging the mosque in federal court.13)
the increase in social hostilities in the U.s. also reflects a rise in the number of reported religion-related workplace discrimination complaints. the number of such complaints filed with the U.s. equal employment opportunity commission (eeoc) rose from 3,386 in the fiscal year ending on sept. 30, 2009, to 3,790 in the year ending on sept. 30, 2010.14 the number of cases that the eeoc determined had “reasonable cause” rose from 136 to 314 during this period.
10 For more information, see the new York times. Feb. 16, 2012. “times topics: Umar Farouk abdulmutallab.” http://topics.nytimes.com/top/reference/timestopics/people/a/umar_farouk_abdulmutallab/index.html.
11 For more information, see the new York times. Feb. 16, 2012. “times topics: Faisal shahzad.” http://topics.nytimes.com/top/reference/timestopics/people/s/faisal_shahzad/index.html?8qa.
12 see U.s. Department of Justice, civil rights Division. December 2010. “court rejects neighbors’ challenge that Mosque is not a Place of Worship.” religious Freedom in Focus, vol. 44. http://www.justice.gov/crt/spec_topics/reli-giousdiscrimination/newsletter/focus_44.html#2.
13 on aug. 30, 2012 (outside the period covered in this study), county residents who oppose the mosque were granted permission to have a say in a federal lawsuit involving the mosque. see loller, travis. aug. 30, 2012. “Federal judge allows Murfreesboro mosque opponents to intervene.” the associated Press. http://www.tennessean.com/view-art/20120830/neWs01/308300046/Federal-judge-allows-Murfreesboro-mosque-opponents-intervene.
14 see U.s. equal employment opportunity commission. “religion-based charges: FY 1997 - FY 2011.” http://www.eeoc.gov/eeoc/statistics/enforcement/religion.cfm.

rising tiDe oF restrictions on religion
19
Patterns among Specific Types of Restrictions and Hostilities
As noted in previous Pew Forum studies on religious restrictions, higher scores on the Government Restrictions Index are associated with higher scores on the Social Hostilities Index and vice versa. This means that, in general, it is rare for countries that score high on one index to be low on the other.
The new study finds that some government restrictions have a stronger association with social hostilities than others. Government policies or actions that clearly favor one religion over others have the strongest association with social hostilities involving religion. The average level of social hostilities among the countries with very high levels of government favoritism (SHI = 4.8) is much higher than the average level of social hostilities among countries with low levels of government favoritism (1.3), as shown in the chart on page 20. Other government actions that are strongly associated with social hostilities involving religion are (in descending order): the use of force against religious groups; failing to intervene to stop religious discrimination; and limiting conversion from one religion to another.4
As the chart on page 20 shows, social hostilities involving religion were lowest among countries where governments do not harass or intimidate religious groups; national laws and policies protect religious freedom; governments do not interfere with religious worship or practices; and governments do not use force against religious groups.
4 ordering is based on second decimal places when scores are tied.
sUMMarY oF FinDings

PeW ForUM on religion & PUblic liFe
www.pewforum.org
20
Likewise, certain types of social hostilities involving religion are more likely to be associated with higher government restrictions on religion. Sectarian or communal violence between religious groups has the strongest association with government restrictions on religion. The average level of government restrictions among the countries with sectarian violence (GRI = 5.0) is much higher than among countries without such violence (2.4), as shown in the chart on page 21. Other social hostilities that are strongly associated with government restrictions
Countries With Government Restrictions Exhibit Higher Social HostilitiesOn average, social hostilities involving religion (as measured by the Social Hostilities Index) tend to be higher in countries with each type of government restriction on religion than in countries without the government restric-tions. The government restrictions at the top of the list are most closely associated with higher social hostilities.
SPECIFIC TYPE OF GOVERNMENT RESTRICTION
average sHi scorein countries WITH the specific type of government restriction
average sHi scorein countries WITHOUT the specific type of government restriction
Very high government favoritism of religion 4.8 1.3
More than 200 cases of government force toward religious groups 4.7 1.0
no national government intervention in religious discrimination cases 4.7 1.3
government limits on religious conversion 4.1 1.6
Widespread government intimidation of religious groups 3.8 0.7
government prohibits worship or certain religious practices 3.8 0.9
national government bans certain religious groups 3.8 1.7
national government does not respect religious freedom in practice 3.7 0.8
national government violence toward minority religious groups 3.7 1.5
national government attempts to eliminate a religious group 3.7 1.9
government limits on wearing religious symbols 3.4 1.7
coercive government organization manages religious affairs 3.3 1.4
government limits on proselytizing 3.3 1.4
national government denunciation of religious groups as "sects" 3.2 1.9
government limits on public preaching 3.1 1.6
government limits on religious literature or broadcasting 3.1 1.3
government limits on foreign missionaries 3.1 1.3
constitution does not provide for religious freedom 3.0 1.7
Discriminatory registration requirements for religious groups 2.7 1.9
constitution contradicts concept of religious freedom 2.5 1.6
the specific types of government restrictions on religion are ordered by how strongly they are associated with the average social Hostilities index (sHi) score. (ordering is based on second decimal places when sHi scores are tied.) scores shown are the aver-age level of social hostilities between mid-2006 and mid-2010 in countries with the specific government restrictions compared with countries without the specific restrictions. For more information, see the Methodology.
the government restrictions index (gri) question numbers for the restrictions, as ordered above, are: gri.Q.20, 19, 13, 7, 11, 4, 16, 3, 12, 17, 10, 14, 6, 15, 5, 8, 9, 1, 18 and 2. see summary of results for full question wording.
Pew research center’s Forum on religion & Public life • Rising Tide of Restrictions on Religion, september 2012

rising tiDe oF restrictions on religion
21
are (in descending order): hostilities over conversion from one religion to another; violence or the threat of violence to enforce religious norms; religion-related terrorist violence; and groups coercively dominating public life with their perspective on religion.5
As shown in the chart below, government restrictions are, on average, lowest in countries where there are no violent acts resulting from tensions between religious groups; there are no crimes or malicious acts motivated by religious hatred; there are no groups dominating public life with their perspective on religion; and there are no incidents of violence stemming from hostility over conversions.
5 ordering is based on second decimal places when scores are tied.
sUMMarY oF FinDings
Countries With Social Hostilities Have Higher Government RestrictionsOn average, government restrictions on religion (as measured by the Government Restrictions Index) tend to be higher in countries with each type of social hostility involving religion than in countries without the social hostilities. The social hostilities at the top of the list are most closely associated with higher government restrictions.
SPECIFIC TYPE OF SOCIAL HOSTILITY
average gri score in countries WITH the specific type of social hostility
average gri score in countries WITHOUT the specific type of social hostility
acts of sectarian or communal violence between religious groups 5.0 2.4
incidents of hostility over conversions from one religion to another 4.9 1.9
Violence or threat of violence to enforce religious norms 4.8 2.2
religion-related terrorist violence with 10 or more casualties 4.8 1.9
groups dominate national public life with their perspective on religion 4.8 1.8
Mob violence related to religion 4.6 2.3
Multiple types of crimes and malicious acts motivated by religious hatred 4.6 1.6
numerous cases of violence resulting from tensions between religious groups 4.5 1.4
Harassment of women for violating religious dress codes 4.5 2.4
incidents of hostility over proselytizing 4.2 2.1
abuse of religious minorities for acts perceived offensive to majority 4.1 2.1
religious groups prevent other religious groups from being able to operate 4.1 2.0
religion-related war or armed conflict 4.0 2.5
the specific types of social hostilities involving religion are ordered by how strongly they are associated with the average government restrictions index (gri) score. (ordering is based on second decimal places when gri scores are tied.) scores shown are the aver-age level of government restrictions between mid-2006 and mid-2010 in countries with the specific social hostilities compared with countries without the specific hostilities. For more information, see the Methodology.
the social Hostilities index (sHi) question numbers for the hostilities, as ordered above, are: sHi.Q.3, 13, 9, 4, 7, 2, 1, 6,11, 12, 10, 8 and 5. see summary of results for full question wording.
Pew research center’s Forum on religion & Public life • Rising Tide of Restrictions on Religion, september 2012

PeW ForUM on religion & PUblic liFe
www.pewforum.org
22
Harassment of Specific Groups
The Government Restrictions Index and Social Hostilities Index each include a question about the harassment of specific religious groups (GRI Q.11 and SHI Q.1a). Harassment and intimidation by governments or social groups take many forms, including physical assaults, arrests and detentions, the desecration of holy sites and discrimination against religious groups in employment, education and housing. Harassment and intimidation also include such things as verbal assaults on members of one religious group by other groups or individuals.
The number of countries where harassment or intimidation of specific religious groups took place rose from 147 as of mid-2009 to 160 as of mid-2010. Moreover, five of the seven major religious groups included in this study
– Christians, Jews, Buddhists, adherents of folk or traditional religions, and members of other world religions – experienced four-year highs with respect to the number of countries in which they were harassed by some level of government or by individuals or groups in society.
In the year ending in mid-2010, government or social harassment of Christians was reported in 111 countries; the previous high was 107 countries in the first year of the study. Government or social harassment of Jews was reported in 68 countries in the year ending in mid-2010, a figure that had been steadily rising across all four years of the study. Incidents of harassment involving members of other world religions – including Sikhs, ancient faiths such as Zoroastrianism, and newer faiths such as Baha’is and Rastafarians – occurred in 52 countries in the year ending in mid-2010, up from 39 countries the previous year. Members of groups that practice folk or traditional religions (including African traditional religions, Chinese folk religions, Native American religions and Australian aboriginal religions) faced harassment in 26 countries, compared with 24 in the previous year. Buddhists were harassed in 15 countries in the latest year studied; although this is far fewer than most other major religious groups, it represents a four-year high for this group. In the latest year of the study,
Number of Countries Where Religious Groups Were Harassed, by Year
year ending in mid- ...2007 2008 2009 2010
christians 107 95 97 111
Muslims 96 91 82 90
Jews 51 53 63 68
others* 33 34 39 52
Folk religionists** 24 19 24 26
Hindus 21 18 11 16
buddhists 10 11 7 15
Any of the above 152 135 147 160
* includes sikhs, members of ancient faiths such as Zoroas-trianism, members of newer faiths such as baha’is and other religious groups. ** includes a variety of groups that practice traditional or folk religions.this measure does not assess the severity of the harass-ment. numbers do not add to total because multiple reli-gious groups can be harassed in a single country.
Pew research center’s Forum on religion & Public life Rising Tide of Restrictions on Religion, september 2012

rising tiDe oF restrictions on religion
23
Muslims were harassed in 90 countries and Hindus faced harassment in 16 countries – also more countries than in the previous year, though not four-year highs.
Overall, across the four years of this study, religious groups were harassed in a total of 184 countries at one time or another. Adherents of the world’s two largest religious groups, Christians and Muslims – who together comprise more than half of the global population – were harassed in the largest number of countries.6 Jews, who comprise less than 1% of the world’s population, experienced harassment in a total of 85 countries, while members of other world faiths were harassed in a total of 72 countries.
Some religious groups were more likely to be harassed by governments, while others were more likely to be harassed by individuals or groups in society. Christians, for example, were harassed by government officials or organizations in 95 countries in the year ending in mid-2010 and by social groups or individuals in 77 countries. Muslims also were more likely to be harassed by governments (74 countries) than by social groups or individuals (64 countries). Jews, by contrast, experienced social harassment in many more countries (64) than they faced government harassment (21).
6 For estimates of the size of the global christian population, see the Pew Forum’s 2011 report, “global christianity: a report on the size and Distribution of the World’s christian Population.” For estimates of the size of the global Muslim population, see the Pew Forum’s 2011 report, “the Future of the global Muslim Population.”
sUMMarY oF FinDings
Number of Countries Where Religious Groups Were Harassed, Across All YearsAny time between mid-2006 and mid-2010
christians 139
Muslims 121
Jews 85
others* 72
Folk religionists** 43
Hindus 30
buddhists 21
Any of the above 184
* includes sikhs, members of ancient faiths such as Zoroastrianism, members of newer faiths such as baha’is and other religious groups. ** includes a variety of groups that practice traditional or folk religions. this measure does not assess the severity of the harassment. numbers do not add to total because multiple religious groups can be harassed in a single country.
Pew research center’s Forum on religion & Public life Rising Tide of Restrictions on Religion, september 2012

PeW ForUM on religion & PUblic liFe
www.pewforum.org
24
Regions and Countries
Government restrictions on religion and/or social hostilities involving religion increased in each of the five major regions of the world between mid-2009 and mid-2010. In three regions – Europe, the Middle East-North Africa and sub-Saharan Africa – the median level of restrictions and hostilities both increased. In the Americas, the median level of government restrictions increased, while in the Asia-Pacific region, the median level of social hostilities increased.
Looking at the extent and direction of change on the Government Restrictions Index and the Social Hostilities Index together, increases of one point or more outnumbered decreases of that magnitude in all five regions, as shown in the chart on page 25. Sub-Saharan Africa had the largest share of countries with increases of one point or more (36%). Europe and the Americas had the lowest proportion of countries where overall restrictions increased by one point or more (22% and 23%, respectively).
Number of Countries Where Religious Groups Were Harassed, by Type of HarrassmentGovernment harassment in the year ending in mid- … Social harassment in the year ending in mid- ...
2007 2008 2009 2010 2007 2008 2009 2010
christians 79 80 71 95 christians 74 72 70 77
Muslims 77 74 58 74 Muslims 64 53 58 64
Jews 11 16 14 21 Jews 46 48 60 64
others* 25 28 29 40 others* 15 13 19 28
Folk religionists** 13 10 9 10 Folk religionists** 16 13 19 20
Hindus 12 11 9 13 Hindus 12 9 8 10
buddhists 7 7 6 11 buddhists 4 4 4 7
any of the above 118 112 103 124 any of the above 127 110 124 135
* includes sikhs, members of ancient faiths such as Zoroastrianism, members of newer faiths such as baha’is and other religious groups. ** includes a variety of groups that practice traditional or folk religions. this measure does not assess the severity of the harassment. numbers do not add to total because multiple religious groups can be harassed in a single country.
Pew research center’s Forum on religion & Public life • Rising Tide of Restrictions on Religion, september 2012

rising tiDe oF restrictions on religion
25
sUMMarY oF FinDings
Overall Changes in Restrictions on Religion by RegionChanges on the Government Restrictions Index (GRI) or Social Hostilities Index (SHI) from the year ending in mid-2009 to the year ending in mid-2010
AMERICAS ASIA-PACIFIC EUROPEMIDDLE EAST- NORTH AFRICA
SUB-SAHARAN AFRICA
POINT CHANGE No. % No. % No. % No. % No. %
2.0 or more increase 1 3% 6 12% 1 2% 2 10% 8 17%
1.0 to 1.9 increase 7 20 9 18 9 20 3 15 9 19
0.1 to 0.9 increase 13 37 17 34 19 42 7 35 19 40
no change 5 14 3 6 2 4 0 0 2 4
0.1 to 0.9 decrease 7 20 7 14 8 18 5 25 8 17
1.0 to 1.9 decrease 2 6 8 16 4 9 3 15 0 0
2.0 or more decrease 0 0 0 0 2 4 1 5 1 2
Total 35 100 50 100 45 100 20 100 47 100
categories of overall changes in restrictions are calculated by comparing a country’s scores on the gri and the sHi from year to year. When a country’s scores on the gri and the sHi changed in the same direction (both increased or both decreased), the greater amount of change determined the category. For instance, if the country’s gri score increased by 0.8 and its sHi score increased by 1.5, the country was put into the “1.0-1.9 increase” category. When a country’s score increased on one index but decreased on the other, the difference between the amounts of change determined the grouping. For example, if the country’s gri score increased by 2.0 and its sHi score decreased by 1.5, the country went into the “0.1-0.9 increase” category. When a country’s score on one index stayed the same, the amount of change on the other index was used to assign the category.
Percentages may not add exactly due to rounding.
Pew research center’s Forum on religion & Public life • Rising Tide of Restrictions on Religion, september 2012

PeW ForUM on religion & PUblic liFe
www.pewforum.org
26
Government Restrictions by Region
The median level of government restrictions on religion increased in four of the five regions demarcated in this study (the Middle East and North Africa, Europe, sub-Saharan Africa and the Americas); it stayed roughly the same in the Asia-Pacific region. In the latest year studied, government restrictions were highest in the Middle East and North Africa. The median score on the Government Restrictions Index for the 20 countries in the region (5.8 as of mid-2010) was up from the previous year (5.2).
As of mid-2010, government restrictions on religion were high or very high in most of the countries that experienced the political uprisings known as the Arab Spring in late 2010 and early 2011. In Tunisia – where the uprisings began
– government restrictions increased from the high category as of mid-2009 to the very high category as of mid-2010 (an increase of more than two points). In Egypt – where the violence spread shortly after – government restrictions already were in the very high category; still, the country’s score on the Government Restrictions Index edged slightly higher, from 8.6 in mid-2009 to 8.7 in mid-2010. And in Yemen
– where violence erupted almost simultaneously with the uprising in Egypt – government restrictions on religion rose from the high category (6.4) as of mid-2009 to the very high category (7.0) as of mid-2010.
Government Restrictions on Religion, by RegionBars represent the range of index scores in the region, and squares represent the median score
Pew research center’s Forum on religion & Public life Rising Tide of Restrictions on Religion, september 2012
latest year, ending MID-2010previous year, ending MID-2009
100 2 4 6 8
Number ofcountries
Median score
Index Score
MORE GOVERNMENT RESTRICTIONS
Americas 35
Sub-SaharanAfrica 47
Europe 45
Asia-Pacific 50
Middle East-North Africa 20
5.2
5.8
3.4
2.3
1.9
1.2
1.8
1.4
1.1
3.4

rising tiDe oF restrictions on religion
27
sUMMarY oF FinDings
The 50 countries in the Asia-Pacific region had a median GRI score in the middle range (3.4) as of mid-2010, the same as the previous year. However, half of the 18 countries worldwide with very high government restrictions on religion are located in the region: Indonesia, Maldives, Afghanistan, Iran, Uzbekistan, China, Burma (Myanmar), Vietnam and Azerbaijan.
Median scores on the Government Restrictions Index for countries in Europe, sub-Saharan Africa and the Americas rose slightly from mid-2009 to mid-2010. Although the median level of government restrictions in the Americas was relatively low (1.2 as of mid-2010), one country, Cuba, had high restrictions. Eight other countries in the region, including the United States, were in the moderate category. (See sidebar on the Situation in the United States on page 15.)
Government Restrictions Around the WorldLevel of government restrictions in each country as of mid-2010
Pew research center’s Forum on religion & Public life • Rising Tide of Restrictions on Religion, september 2012
HIGH VERY HIGHMODERATELOW No Data
Levels of government restrictions on religion

PeW ForUM on religion & PUblic liFe
www.pewforum.org
28
Social Hostilities by Region
The median level of social hostilities involving religion also increased in four of the five regions (the Middle East and North Africa, Asia and the Pacific, Europe and sub-Saharan Africa); it stayed roughly the same in the Americas.
As with government restrictions, social hostilities involving religion were highest in the Middle East and North Africa. However, the region’s median score on the Social Hostilities Index rose only slightly, from 4.2 as of mid-2009 to 4.3 as of mid-2010.
The median level of social hostilities in the Americas remained low, unchanged from mid-2009 to mid-2010. Only one of the 35 countries in the region – Mexico – had high social hostilities, and 29 (83%) had low hostilities. Five countries in the region (United States, Brazil, Colombia, Haiti and Chile) were in the moderate category; however, all but one of these countries, Colombia, had increases of one point or more on the Social Hostilities Index. Columbia’s score decreased by 0.2. (See sidebar on the Situation in the United States on page 15.)
Social Hostilities Involving Religion, by RegionBars represent the range of index scores in the region, and squares represent the median score
Pew research center’s Forum on religion & Public life Rising Tide of Restrictions on Religion, september 2012
100 2 4 6 8
Number ofcountries
Median score
Index Score
MORE HOSTILITIES
Americas 35
Sub-SaharanAfrica 47
Europe 45
Asia-Pacific 50
Middle East-North Africa 20
4.2
4.3
2.2
2.1
1.0
0.4
1.7
0.6
0.4
1.8
latest year, ending MID-2010previous year, ending MID-2009

rising tiDe oF restrictions on religion
29
sUMMarY oF FinDings
Social Hostilities Around the WorldLevel of social hostilities in each country as of mid-2010
Pew research center’s Forum on religion & Public life • Rising Tide of Restrictions on Religion, september 2012
HIGH VERY HIGHMODERATELOW No Data
Levels of social hostilities involving religion

PeW ForUM on religion & PUblic liFe
www.pewforum.org
30
Restrictions and Hostilities in the Most Populous Countries
Among the world’s 25 most populous countries, Egypt, Indonesia, Russia, Burma (Myanmar), Iran, Vietnam, Pakistan, India, Bangladesh and Nigeria stand out as having the most restric-tions on religion as of mid-2010 when government restrictions and social hostilities both are taken into account. Brazil, Japan, Italy, the United States and the Democratic Republic of the Congo have the least restrictions and hostilities.
None of the 25 most populous countries had low social hostilities involving religion as of mid-2010, while four had low government restrictions on religion: South Africa, Brazil, Philippines and Japan. As discussed in the sidebar on page 15, the United States moved from the low cat-egory of government restrictions in mid-2009 to the moderate category in 2010, based on the information in the sources consulted for this study.
Government restrictions and/or social hostilities increased by one point or more in several European countries from mid-2009 to mid-2010, including Russia, the United Kingdom, Germany and France. (See Government Restrictions Index table on page 52 and Social Hostilities Index table on page 55.) Russia moved from the high category of social hostilities in mid-2009 to the very high category in mid-2010, primarily because of increasing tensions in heavily Muslim areas. Russia already had very high government restrictions. Indeed, Russia was the only European country with very high scores on both the Government Restrictions Index and the Social Hostilities Index in the latest year studied. (To compare scores for each of the 25 most populous countries in all four years covered in this study, see the interactive feature at http://www.pewforum.org/Government/Rising-Tide-of-Restrictions-on-Religion-findings.aspx#interactive.)

rising tiDe oF restrictions on religion
31
Restrictions on Religion among the 25 Most Populous CountriesAmong the world’s 25 most populous countries, Egypt, Indonesia, Russia, Burma (Myanmar), Iran, Vietnam, Pakistan, India, Bangladesh and Nigeria stand out as having the most restrictions on religion as of mid-2010 when government restrictions and social hostilities both are taken into account. (Countries in the upper right of the chart have the most restrictions and hostilities.) Brazil, Japan, Italy, the United States and the Democratic Republic of the Congo have the least restrictions and hostilities. (Countries in the lower left have the least restrictions and hostilities.)
Pew research center’s Forum on religion & Public life • Rising Tide of Restrictions on Religion, september 2012
0
2
0
4
6
8
10
Government Restrictions
Soci
al H
osti
litie
s
VERY HIGHHIGHMODERATELOW
VER
Y H
IGH
HIG
HM
OD
ER
AT
ELO
W
2 4 6 8 10
1billion
500million
100million
50million
Circles are sized proportionally to each country’s population (2010)
Colors are based on each country’s position on the chart.
MORERESTRICTIONS
MO
RE
HO
STIL
ITIE
S
DR Congo
China
Vietnam
Russia
Burma(Myanmar)
TurkeyIran
U.K.
Italy
Bangladesh
Nigeria
Mexico
Ethiopia
Germany
South Africa
Thailand
Brazil
Philippines
Japan
Indonesia
Egypt
Pakistan
France
U.S.
India

PeW ForUM on religion & PUblic liFe
www.pewforum.org
32
About the Study
These are among the key findings of the Pew Forum’s new report on global restrictions on re-ligion. The 197 countries and self-administering territories covered by the study contain more than 99.5% of the world’s population. They include 191 of the 192 member states of the United Nations as of mid-2010 plus six self-administering territories — Kosovo, Hong Kong, Macau, the Palestinian territories, Taiwan and Western Sahara.7 Each country or territory was scored on a total of 33 measures phrased as questions about government restrictions or social hostili-ties involving religion. (For the full question wording, see the Summary of Results on page 65.) The Government Restrictions Index is comprised of 20 questions; there are 13 questions on the Social Hostilities Index.
To answer the questions that make up the indexes, Pew Forum researchers combed through 19 widely cited, publicly available sources of information, including reports by the U.S. State Department, the U.S. Commission on International Religious Freedom, the U.N. Special Rapporteur on Freedom of Religion or Belief, the Council of the European Union, the United Kingdom’s Foreign & Commonwealth Office, Human Rights Watch, the International Crisis Group, Freedom House and Amnesty International. (For the complete list of sources, see the Methodology.)
The researchers involved in this process recorded only concrete reports about specific govern-ment laws, policies and actions, as well as specific incidents of religious violence or intolerance by social groups; they did not rely on the commentaries or opinions of the sources. (For a more detailed explanation of the coding and data verification procedures, see the Methodology.) The goal was to devise a battery of quantifiable, objective measures that could be analyzed individu-ally as well as combined into two comprehensive indexes, the Government Restrictions Index and the Social Hostilities Index.
Some of the increases in religious restrictions noted in this study could reflect the use of more up-to-date or better information sources, but there is no evidence of a general informational bias in the direction of higher restrictions. For instance, the social hostilities sections of the U.S. State Department’s annual reports on International Religious Freedom (one of the 19 primary sources used in this study) in general have gotten shorter in more recent years. Pew Forum staff carefully monitor the impact of source information variability each year. (See the Methodology for more details.)
7 as previously noted, this report does not include scores for the territory of northern cyprus or north Korea.

rising tiDe oF restrictions on religion
33
Readers should note that the categories of very high, high, moderate and low restrictions or hos-tilities are relative – not absolute – rankings based on the overall distribution of index scores in the initial year of this study. As such, they provide a guide for comparing country scores and evaluating their direction of change over time. They also reflect the number and severity of different restrictions or hostilities that occurred in a given year in any part of the country. Ac-cordingly, more populous countries may have a higher likelihood of scoring higher than less populous countries, though in practice, some countries with very high levels of restrictions or hostilities have relatively small populations, such as the Maldives and the Palestinian territories.
Finally, although it is very likely that more restrictions exist than are reported by the 19 primary sources, taken together the sources are sufficiently comprehensive to provide a good estimate of the levels of restrictions in almost all countries. The one major exception is North Korea. The sources clearly indicate that North Korea’s government is among the most repressive in the world with respect to religion as well as other civil and political liberties. (The U.S. State Depart-ment’s 2010 Report on International Religious Freedom, for example, says that “Genuine free-dom of religion does not exist” in North Korea.) But because North Korean society is effectively closed to outsiders and independent observers lack regular access to the country, the sources were unable to provide the kind of specific, timely information that the Pew Forum categorized and counted (“coded,” in social science parlance) for this quantitative study. Therefore, the report does not include scores for North Korea.
sUMMarY oF FinDings

PeW ForUM on religion & PUblic liFe
www.pewforum.org
34

rising tiDe oF restrictions on religion
35
Appendix 1: Methodology
This is the third time the Pew Forum has measured restrictions on religion around the globe.8 This report, which includes data through the year ending in mid-2010, follows the same methodology as the Pew Forum’s December 2009 report, “Global Restrictions on Religion,” and its August 2011 report, “Rising Restrictions on Religion,” with one major difference: Instead of reporting two-year averages, as the previous reports did, this report assesses restrictions on an annual basis. Future studies in this series also will report annual data.
The Pew Forum uses two 10-point indexes – the Government Restrictions Index (GRI) and the Social Hostilities Index (SHI) – to rate 197 countries and self-governing territories on their levels of restrictions.9 The August 2011 report assessed “substantial” changes in restrictions by comparing each country’s average scores for the two-year period from mid-2006 to mid-2008 with its average scores for the overlapping two-year period from mid-2007 to mid-2009.10 Using overlapping two-year periods was a precaution intended to minimize minor, annual fluctuations until the Pew Forum built up data from a sufficient number of years to be able to distinguish important, longer-term trends. That threshold has now been crossed. This report analyzes changes in restrictions on an annual basis, looking at four years, ending in mid-2007, mid-2008, mid-2009 and mid-2010. It categorizes the amount of change in each country’s scores in two ways, numerically and by percentile.
First, countries are grouped into categories depending on the size of the numeric change in their scores from year to year on the two indexes: changes of two points or more in either direction; changes of at least one point but less than two
8 see the methodology of the Pew Forum’s 2009 report, “global restrictions on religion,” for a discussion of the conceptual basis for measuring restrictions on religion.
9 Previous reports provided a score for the territory of northern cyprus and therefore included 198 countries and territories. according to the U.s. state Department, only one country – turkey – recognizes the separate status of northern cyprus. thus, future reports will score northern cyprus as part of the republic of cyprus. the exclusion of northern cyprus in this report has a negligible effect on the global and regional findings.
10 the 2011 report referred to a change in a country’s score as “substantial” only if it was at least 1.5 standard deviations above or below the mean amount of change among all countries and territories. the change also had to be in the same direction, mean-ing that it had to rise or fall both in the period from mid-2006 to mid-2008 and in the overlapping period from mid-2007 to mid-2009. see the methodology in the Pew Forum’s august 2001 report “rising restrictions on religion” for more details.
MetHoDologY
Index Point Change Categories for assessing index score changes between years
2.0 or more increase
1.0 to 1.9 increase
0.1 to 0.9 increase
no change
0.1 to 0.9 decrease
1.0 to 1.9 decrease
2.0 or more decrease
Pew research center’s Forum on religion & Public life Rising Tide of Restrictions on Religion, september 2012

PeW ForUM on religion & PUblic liFe
www.pewforum.org
36
points; changes of less than one point; or no change at all. (See chart at right and charts on pages 12, 13 and 14 of the report.) Changes in overall levels of restrictions are calculated for each country by comparing its scores on both indexes (the GRI and the SHI) from year to year. When a country’s scores on the GRI and the SHI changed in the same direction (both increased or both decreased), the greater amount of change determined the category. For instance, if the country’s GRI score increased by 0.8 and its SHI score increased by 1.5, the country was put into the overall “1.0-1.9 increase” category. When a country’s score increased on one index but decreased on the other, the difference between the amounts of change determined the grouping. For example, if the country’s GRI score increased by 2.0 and its SHI score decreased by 1.5, the country went into the overall “0.1-0.9 increase” category. When a country’s score on one index stayed the same, the amount of change on the other index was used to assign the category.
Second, this report categorizes the levels of government restrictions and social hostilities in each country by percentiles. As the benchmark, it uses the results from the baseline year (the year ending in mid-2007). Scores in the top 5% on each index in mid-2007 were categorized as “very high.” The next highest 15% of scores were categorized as “high,” and the following 20% were categorized as “moderate.” The bottom 60% of scores were categorized as “low.” See the table above for the index score thresholds as determined from the mid-2007 data. These thresholds are applied to all subsequent years of data.
Overview of Procedures
The methodology used by the Pew Forum to assess and compare restrictions on religion was developed by senior researcher and director of cross-national data Brian J. Grim in consultation with other members of the Pew Research Center staff, building on a methodology that Grim and professor Roger Finke developed while at Penn State University’s Association of Religion Data Archives.11 The goal was to devise quantifiable, objective and transparent measures of the extent to which governments and societal groups impinge on the practice of
11 see grim, brian J. and roger Finke. 2006. “international religion indexes: government regulation, government Favoritism, and social regulation of religion.” interdisciplinary Journal of research on religion, vol. 2, article 1.
Levels of Restrictions on ReligionGOVERNMENT RESTRICTIONS INDEX SCORES
SOCIAL HOSTILITIES INDEX SCORES
Very High 6.6 to 10.0 7.2 to 10.0
High 4.5 to 6.5 3.6 to 7.1
Moderate 2.4 to 4.4 1.5 to 3.5
low 0.0 to 2.3 0.0 to 1.4
based on distribution of index scores in the baseline year, ending mid-2007.
Pew research center’s Forum on religion & Public life Rising Tide of Restrictions on Religion, september 2012
rising tiDe oF restrictions on religion
37
religion. The findings were used to rate 197 countries and self-governing territories on two indexes that are reproducible and can be periodically updated. This research goes beyond previous efforts to assess restrictions on religion in several ways. First, the Pew Forum coded (categorized and counted) data from 19 published cross-national sources, providing a high degree of confidence in the findings. The Pew Forum coders looked to the sources for only specific, well-documented facts, not opinions or commentary.Second, the Pew Forum staff used extensive data-verification checks that reflect generally accepted best practices for such studies, such as double-blind coding (coders do not see each other’s ratings), inter-rater reliability assessments (checking for consistency among coders) and carefully monitored protocols to reconcile discrepancies among coders.
Third, the Pew Forum coding took into account whether the perpetrators of religion-related violence were government or private actors. The coding also identified how widespread and intensive the restrictions were in each country.
Fourth, one of the most valuable contributions of the indexes and the questions used to construct them (see the section on “The Coding Instrument” on page 40) is their ability to chart change over time.
Countries and Territories
The 197 countries and self-administering territories covered by the study contain more than 99.5% of the world’s population. They include 191 of the 192 member states of the United Nations as of mid-2010 plus six self-administering territories – Kosovo, Hong Kong, Macau, the Palestinian territories, Taiwan and Western Sahara.12 Reporting on these territories does not imply any position on what their international political status should be, only recognition that the de facto situations in these territories require separate analysis.
Although the 197 countries and territories vary widely in size, population, wealth, ethnic diversity, religious makeup and form of government, the study does not attempt to adjust for such differences. Poor countries are not scored differently on the indexes than wealthy ones. Countries with diverse ethnic and religious populations are not “expected” to have more social hostilities than countries with more homogeneous populations. And democracies are not
12 the one member state of the United nations not included in the study is north Korea. the sources clearly indicate that north Korea’s government is among the most repressive in the world with respect to religion as well as other civil and political liber-ties. (the U.s. state Department’s 2010 report on international religious Freedom, for example, says that “genuine freedom of religion does not exist” in north Korea.) but because north Korean society is effectively closed to outsiders and independent observers lack regular access to the country, the sources were unable to provide the kind of specific, timely information that the Pew Forum categorized and counted (“coded,” in social science parlance) for this quantitative study. therefore, the report does not include scores for north Korea.
MetHoDologY

PeW ForUM on religion & PUblic liFe
www.pewforum.org
38
assessed more leniently or harshly than authoritarian regimes.
Information Sources
The Pew Forum identified 19 widely available, frequently cited sources of information on government restrictions and social hostilities involving religion around the world. This study includes four sources that were not used in the baseline report on religious restrictions. (See page 39 for more details on the new information sources.)
The primary sources, which are listed below, include reports from U.S. government agencies, several independent, nongovernmental organizations and a variety of European and United Nations bodies. Although most of these organizations are based in Western countries, many of them depend on local staff to collect information across the globe. As previously noted, the Pew Forum did not use the commentaries, opinions or normative judgments of the sources; the sources were combed only for factual information on specific policies and actions.
Primary Sources
1. Country constitutions
2. U.S. State Department annual reports on International Religious Freedom
3. U.S. Commission on International Religious Freedom annual reports
4. U.N. Special Rapporteur on Freedom of Religion or Belief reports
5. Human Rights First reports in first and second years of coding; Freedom House reports in
third and fourth years of coding
6. Hudson Institute publication: “Religious Freedom in the World” (Paul Marshall)
7. Human Rights Watch topical reports
8. International Crisis Group country reports
9. United Kingdom Foreign & Commonwealth Office annual report on human rights
10. Council of the European Union annual report on human rights
11. Amnesty International reports
12. European Network Against Racism Shadow Reports
13. United Nations High Commissioner for Refugees reports
14. U.S. State Department annual Country Reports on Terrorism

rising tiDe oF restrictions on religion
39
15. Anti-Defamation League reports
16. U.S. State Department Country Reports on Human Rights Practices
17. U.S. National Counterterrorism Center’s Worldwide Incident Tracking System
18. Uppsala University’s Uppsala Conflict Data Program, Armed Conflict Database
19. Human Rights Without Frontiers “Freedom of Religion or Belief” newsletters
U.S. government reports with information on the situation in the United States
20. U.S. Department of Justice “Religious Freedom in Focus” newsletters and reports
21. FBI Hate Crime Reports
As noted, this study includes four sources that were not included in the Pew Forum’s first report on global restrictions on religion: Freedom House reports; Uppsala University’s Armed Conflict Database; the “Freedom of Religion or Belief” newsletters of Human Rights Without Frontiers; and the U.S. government’s Worldwide Incident Tracking System (WITS).
The Freedom House reports have replaced Human Rights First reports, which have not been updated since mid-2008. The Uppsala Armed Conflict Database provides information on the number of people affected by religion-related armed conflicts, supplementing other sources. The Human Rights Without Frontiers “Freedom of Religion or Belief” newsletters have partially replaced the Hudson Institute publication, “Religious Freedom in the World” (by Paul Marshall), which has not been updated since its release in 2008. Human Rights Without Frontiers is a nongovernmental organization based in Brussels, with affiliated offices throughout the world. The Hudson Institute publication still offers useful background on certain standing laws but no longer provides information on new or changing restrictions. The U.S. government’s WITS database has provided greater detail on the number of people affected by religion-related terrorism than either the State Department’s International Religious Freedom reports or the State Department’s annual Country Reports on Terrorism. Until May 2012, WITS was a publicly available database maintained by the U.S. National Counterterrorism Center, a government organization that is part of the Office of the Director of National Intelligence; it is no longer available online.
While some of the increases in religious restrictions noted in this study could reflect the use of more up-to-date and/or better information sources, Pew Forum staff monitor the impact of source information variability each year and have found no evidence of overall informational bias. (For additional discussion, see the “Potential Biases” section on page 50.)
MetHoDologY

PeW ForUM on religion & PUblic liFe
www.pewforum.org
40
The Coding Instrument
As explained in more detail below, Pew Forum staff developed a battery of questions similar to a survey questionnaire. Coders consulted the primary sources in order to answer the questions separately for each country. While the State Department’s annual reports on International Religious Freedom generally contained the most comprehensive information, the other sources provided additional factual detail that was used to settle ambiguities, resolve contradictions and help in the proper scoring of each question.
The questionnaire, or coding instrument, generated a set of numerical measures on restrictions in each country. It also made it possible to see how government restrictions intersect with broader social tensions and incidents of violence or intimidation by private actors. The coding instrument with the list of questions used for this report is shown in the Summary of Results.
The coding process required the coders to check all the sources for each country. Coders determined whether each source provided information critical to assigning a score; had supporting information but did not result in new facts; or had no available information on that particular country. Multiple sources of information were available for all countries and self-administering territories with populations greater than 1 million. More than three-in-four of the countries and territories analyzed by the Pew Forum were multi-sourced; only small, predominantly island, countries had a single source, namely, the State Department reports.
Coding the United States presented a special problem since it is not included in the State Department’s annual reports on International Religious Freedom. Accordingly, Pew Forum coders also looked at reports from the U.S. Department of Justice and the FBI on violations of religious freedom in the United States, in addition to consulting all the primary sources, including reports by the United Nations, Human Rights Watch, Freedom House, the International Crisis Group and the U.K. Foreign & Commonwealth Office, many of which contain data on the United States.
The Coding Process
The Pew Forum employed strict training and rigorous coding protocols to make its coding as objective and reproducible as possible. Coders worked directly under a senior researcher’s supervision, with additional direction and support provided by other Pew Forum researchers. The coders underwent an intensive training period that included a thorough overview of the
rising tiDe oF restrictions on religion
41
research objectives, information sources and methodology.
Countries were double-blind coded by two coders (coders did not see each other’s ratings), and the initial ratings were entered into an electronic survey with details on each incident cataloged in Microsoft Excel spreadsheets. The coders began by filling out the coding instrument for each country using the information source that had the most comprehensive information, typically the State Department reports. The protocol for each coder was to answer every question on which information was available in the initial source. Once a coder had completed that process, he or she then turned to the other sources. As new information was found, this was also coded and the source duly noted. Whenever ambiguities or contradictions arose, the source providing the most detailed, clearly documented evidence was used.
After two coders had separately completed the coding instrument for a particular country, their scores were compared by a senior researcher. Areas of discrepancy were discussed at length with the coders and were reconciled in order to arrive at a single score on each question for each country. The data for each country were then combined into a master file, which was imported into a relational database.
Throughout this process, the coding instrument itself was continually monitored for possible defects. The questions were designed to be precise, comprehensive and objective so that, based on the same data and definitions, the coding could be reliably reproduced by others with the same results.
Pew Forum staff generally found few cases in which one source contradicted another. When contradictions did arise – such as when sources provided differing estimates of the number of people displaced due to religion-related violence – the source that cited the most specific documentation was used. The coders were instructed to disregard broad, unsubstantiated generalizations regarding abuses and to focus on reports that contained clear, precise documentation and factual details, such as names, dates and places where incidents occurred.
Inter-rater reliability statistics were computed by comparing the coders’ independent, blind ratings. The Pew Forum took scores from one coder for the 197 countries and compared them with another coder’s scores for the same questions, computing the degree to which the scores matched. These measures were very high, with an average score of 0.8 or above on the key variables. Scores above 0.8 on a zero-to-one scale are generally considered very good, and scores around 0.7 are generally acceptable. The Pew Forum’s overall inter-rater reliability average across all the variables coded was greater than 0.8 for each year.
MetHoDologY

PeW ForUM on religion & PUblic liFe
www.pewforum.org
42
The data-verification procedures went beyond the inter-rater reliability statistics. They also involved comparing the answers on the main measures for each country with other closely related questions in the data set. This provided a practical way to test the internal reliability of the data.
Pew Forum staff also checked the reliability of the coded data by comparing them with similar, though more limited, religious restrictions data sets. In particular, published government and social regulation of religion index scores are available from the Association of Religion Data Archives (for three years of data) and the Hudson Institute (for one year of data), which makes them ideal measures for cross-validation. The review process found very few significant discrepancies in the coded data; changes were made only if warranted by a further review of the primary sources.
Restriction of Religion Indexes
The Government Restrictions Index is based on 20 indicators of ways that national and local governments restrict religion, including through coercion and force. The Social Hostilities Index is based on 13 indicators of ways in which private individuals and social groups infringe on religious beliefs and practices, including religiously biased crimes, mob violence and efforts to stop particular religious groups from growing or operating. The study also counted the number and types of documented incidents of religion-related violence, including terrorism and armed conflict.
Government Restrictions Index
Coding multiple indicators makes it possible to construct a Government Restrictions Index of sufficient gradation to allow for meaningful cross-national comparisons. An additional advantage of using multiple indicators is that it helps mitigate the effects of measurement error in any one variable, providing greater confidence in the overall measure.
The Pew Forum coded 20 indicators of government restrictions on religion (see the Summary of Results). These 20 items were added together to create the GRI. In two cases, these items represent an aggregation of several closely related questions: Measures of five types of physical abuses are combined into a single variable (GRI Q.19); and seven questions measuring aspects of government favoritism are combined into an overall favoritism scale (GRI Q.20 is a summary variable showing whether a country received the maximum score on one or more of the seven questions).

rising tiDe oF restrictions on religion
43
A test of whether the 20 items were statistically reliable as a single index produced a scale reliability coefficient greater than 0.9 for each year. Since coefficients of 0.7 or higher are generally considered acceptable, it was appropriate to combine these 20 items into a single index.
The GRI is a fine-grained measure created by adding the 20 items on a 0-to-10 metric, with zero indicating very low government restrictions on religion and 10 indicating extremely high restrictions. This involved two general calculations. First, the 20 questions that form the GRI were standardized so that each variable had an identical maximum value of one point, while gradations among the answers allowed for partial points to be given for lesser degrees of the particular government restriction being measured. Second, the overall value of the index was proportionally adjusted – so that it had a maximum value of 10 and a possible range of zero to 10 – by dividing the sum of the variables by two.
Social Hostilities Index
In addition to government restrictions, violence and intimidation in societies also can limit religious beliefs and practices. Accordingly, Pew Forum staff tracked more than a dozen indicators of social impediments on religion. Once again, coding multiple indicators made it possible to construct an index that shows gradations of severity or intensity and allows for comparisons among countries. The Summary of Results contains the 13 items used by Pew Forum staff to create the Social Hostilities Index.
As with the Government Restrictions Index, various types of violence and intimidation were combined. A test of whether these 13 items were statistically reliable as a single index produced a scale reliability coefficient of 0.9 or higher for each year. Since coefficients of 0.7 or higher are generally considered acceptable, it was statistically appropriate to combine these items into a single index.
The SHI was constructed by adding together the 13 indicators based on a 0-to-10 metric, with zero indicating very low social impediments to religious beliefs and practices and 10 indicating extremely high impediments. This involved two general calculations. First, the various questions that form the index were standardized so that each variable had an identical maximum value of one point, while gradations among the answers allowed for partial points to be given for lesser degrees of the particular hostilities being measured. Second, the indicators were added together and set to have a possible range of zero to 10 by dividing the sum of the variables by 1.3.
MetHoDologY

PeW ForUM on religion & PUblic liFe
www.pewforum.org
44
Notes on Fluctuations in Certain Results
Some fluctuations on individual measures have resulted from minor variations in coding procedures and are not as significant as they may appear. This was especially the case for GRI Q.3 and SHI Q.4.
As shown in the Summary of Results for GRI Q.3 (“Taken together, how do the constitution/basic law and other national laws and policies affect religious freedom?”), the number of countries with a score of zero on that question (indicating no restrictions) increased from 63 in the year ending in mid-2007 to 96 in the year ending in mid-2009. It then dropped to 75 countries in the year ending in mid-2010. However, these fluctuations may be largely attributable to variations in the coding procedures across the years. Retrospective analysis indicates that during the first year coded (year ending in mid-2007), the coders were more likely to give countries a partial score (0.33) on this question than in subsequent years. Some recalibration in the most recent year brought the coding closer to the criteria used in the initial year. The retrospective analysis suggests that in the year ending in mid-2009, the coders had a higher bar for assigning a score of 0.33 (they considered restrictive laws or policies alone to be insufficient; there had to be clear harassment or abuses of religious groups or individuals). In the most recent year (year ending in mid-2010), coders assigned 0.33 if there were restrictive laws or policies only at the local level, which is consistent with the intent of the question. The effect of these variations in coding criteria is relatively small: A difference of 0.33 from year to year on this question produces a change of just 0.17 on the Government Restrictions Index because each question on the GRI is worth a half point (0.33/2 = 0.17).
As noted earlier in the methodology, some of the increase in religion-related terrorism (SHI Q.4) found in this study could reflect the use of new source material that provided greater detail on terrorist activities than the sources used in the baseline report. Specifically, in coding terrorist activities that occurred from mid-2008 to mid-2009 and from mid-2009 to mid-2010, coders used the Worldwide Incidents Tracking System (WITS), the U.S. National Counterterrorism Center’s database of terrorist incidents. Because the same sources were used for both periods, these are the most appropriate years to compare.
Finally, it is important to note that situations within countries may have changed since the end of the periods studied. For instance, the Arab Spring uprisings in the Middle East and North Africa occurred in late 2010 and 2011, after the period covered by this study. Also, the formal division of Sudan into two separate countries took place in 2011. Subsequent Pew Forum

rising tiDe oF restrictions on religion
45
reports on global restrictions on religion will assess Sudan and South Sudan separately, but this report covers the formerly undivided country.Note on New Analysis in this Report
An analysis of government restrictions and social hostilities confirms a pattern initially discussed in the baseline report of this study. When all 197 countries and self-administering territories are plotted on a chart comparing their average scores on the Government Restrictions Index and the Social Hostilities Index for the four-year period from mid-2006 to mid-2010, it is apparent that the two measures tend to move together. Running through the graph is the so-called regression line, which plots how scores on one index are related to scores on the other index.
As in the baseline report, the upward slope of the line indicates that higher scores on one index generally are associated with higher scores on the other. Many countries are clustered in the lower left corner, showing that they are low on both types of restrictions. Though the remaining countries are fairly dispersed, most still follow the direction taken by the regression line, and very few are located in the upper left or lower right corners of the graph. This means that, in general, it is rare for countries that are high in social hostilities to be low on government restrictions, or for those that are high on government restrictions to be low in social hostilities.
The association between government restrictions and social hostilities is also visible when comparing how each question on the indexes relates to the overall level of restrictions or hostilities. As shown in the chart on page 20 of the report, the average level of social hostilities involving religion for the four-year period from mid-2006 to mid-2010 tends to be higher in countries with each type of government restriction on religion than in countries without the government restrictions. The average level of social hostilities among the countries with very high levels of government favoritism toward a particular religion or religions (SHI = 4.8) is much higher than the average level of social hostilities among countries without high levels of government favoritism (1.3). Other government actions that are strongly associated with social hostilities involving religion are the use of force against religious groups (SHI = 4.7), failing to intervene to stop religious discrimination (4.7) and limiting conversion from one religion to another (4.1).13 This same pattern is present to varying degrees for all 20 GRI questions. (See further discussion on GRI Q.20 on page 47-48.)
The chart also provides information on situations where social hostilities are lowest.
13 ordering is based on second decimal place when scores are tied.
MetHoDologY

PeW ForUM on religion & PUblic liFe
www.pewforum.org
46
Restrictions on Religion in 197 Countries and TerritoriesEach dot represents one of the world’s 197 countries and territories and is plotted according to that country’s Government Restrictions Index score and Social Hostilities Index score.
Correlation = .621 (p<.001, two-tailed); r-square = .39
Pew research center’s Forum on religion & Public life • Rising Tide of Restrictions on Religion, september 2012
Government Restrictions Index
Soci
al H
ost
ilit
ies
Index
VERY HIGHHIGHMODERATELOW
VERY H
IGH
HIG
HM
OD
ER
ATE
LOW
0 2 4 6 8 10
2
4
6
8
10

rising tiDe oF restrictions on religion
47
Specifically, the right-hand column shows that social hostilities were lowest among countries where governments do not harass or intimidate religious groups (SHI = 0.7), national laws and policies protect religious freedom (0.8), governments do not interfere with religious worship or practices (0.9) and governments do not use force against religious groups (1.0).
Likewise, certain types of social hostilities involving religion are more likely to be associated with higher government restrictions on religion. Sectarian or communal violence between religious groups has the strongest association with government restrictions on religion. The average level of government restrictions among the countries with sectarian violence (GRI = 5.0) is much higher than among countries without such violence (2.4), as shown in the chart on page 21. Other social hostilities that are strongly associated with government restrictions are hostilities over conversion from one religion to another (GRI = 4.9), violence or the threat of violence to enforce religious norms (4.8), religion-related terrorist violence (4.8) and groups coercively dominating public life with their perspective on religion (4.8).14
This chart also provides information on situations where government restrictions are lowest. Specifically, the right-hand column of the chart shows that government restrictions are, on average, lowest in countries where there are no violent acts resulting from tensions between religious groups (GRI = 1.4), no crimes or malicious acts motivated by religious hatred (1.6), no groups dominating public life with their perspective on religion (1.8) and no incidents of violence stemming from hostility over religious conversion (1.9).
These charts show that the presence of any of the 20 types of government restrictions on religion is, on average, associated with higher overall social hostilities involving religion. Likewise, the presence of any of the 13 types of social hostilities is, on average, associated with higher overall government restrictions. Given the general association between government restrictions and social hostilities discussed at the beginning of this section, some association between the different types of government restrictions and social hostilities was expected. But it was not necessarily expected to find such a consistent pattern among all the questions. This does not necessarily mean that increased government restrictions cause social hostilities or that increased hostilities cause government restrictions. It may be that increases in government restrictions trigger social hostilities, and that increases in social hostilities trigger government restrictions.15
14 ordering is based on second decimal place when scores are tied.
15 For a more advanced statistical analysis of the association between government restrictions and social hostilities, see grim, brian J. and roger Finke. 2011. “the Price of Freedom Denied: religious Persecution and conflict in the 21st century.” new York: cambridge University Press, and their related 2007 article, “religious Persecution in cross-national context: clashing civilizations or regulated economies?” american sociological review, vol. 72, no. 3: 633-658.
MetHoDologY

PeW ForUM on religion & PUblic liFe
www.pewforum.org
48
As part of this new analysis, the study also introduces a new way of analyzing GRI Q.20, which is an overall government favoritism scale created by combining seven questions measuring aspects of government favoritism of religion. Since GRI Q.20 is a scale with many possible values rather than a single question with distinct categories, it is not possible to conduct the types of comparisons described in this section unless the scale is converted into categories. Following the example of putting GRI and SHI into categorical levels, GRI Q.20 is also treated as a Government Favoritism Index. Accordingly, the study categorizes the levels of government favoritism by percentiles. For this analysis, countries with average scores across the four years of the study in the top 5% on GRI Q.20 (11 countries) were categorized as “very high.” The next highest 15% of scores (30 countries) were categorized as “high,” and the following 20% were categorized as “moderate” (39 countries). The bottom 60% of scores were categorized as “low”
(188 countries). This categorization permits the same analysis of this question as for the other component questions of the indexes, as shown in the following chart. Note on the Effects of Consolidating to a New Database
For all four years of this study, information on the number, types and locations of incidents of government force and social violence toward religious groups as well as deference to religious authorities in matters of law were coded at the province level. (See example of data coding on pages 45-48 of the December 2009 baseline report.) Each year, the province numbers were summed and put into separate country-level files. Since the publication of the August 2011 report, Pew Forum staff have created a database that integrates all four years of province- and country-level data on religious restrictions. During this process, Pew Forum staff reviewed any discrepancies between province files and the sums that had been transferred to the country
Countries With Government Favoritism Exhibit Higher Social HostilitiesOn average, social hostilities involving religion (as measured by the Social Hostilities Index) tend to be higher in countries with very high favoritism of religion than in countries with lower levels of government favoritism.
GOVERNMENT RESTRICTION:
average sHi scorein countries with VERY HIGH government favoritism
average sHi scorein countries with HIGH government favoritism
average sHi score in countries with MODERATE govern-ment favoritism
average sHi score in countries with LOW government favoritism
government favoritism of religion* 4.8 3.8 2.2 1.3
scores shown are the average level of social hostilities between mid-2006 and mid-2010 in countries with very high government favoritism compared with countries that have high, moderate and low government favoritism. * government restrictions index (gri) question Q.20
Pew research center’s Forum on religion & Public life • Rising Tide of Restrictions on Religion, september 2012

rising tiDe oF restrictions on religion
49
files and made appropriate corrections. The adjustments made were relatively minor and had small effects on index scores for countries, on average less than 0.005 points on the 10-point indexes. Consolidating the four years of data into a database also entailed a review of the data on harassment of religious groups. In particular, instances of harassment from the year ending in mid-2007 were stored as open-ended questions, and in a few cases they were recoded to match the categories used in the subsequent years.
Additional Analysis in the Study
As in the 2011 report, this study reports a further summary of the number of countries where specific religious groups faced government or social harassment. This is essentially a cross-tabulation of GRI Q.11 (“Was there harassment or intimidation of religious groups by any level of government?”) and the first type of religious hatred or bias measured in SHI Q.1a. (“Did individuals face harassment or intimidation motivated by religious hatred or bias?”). For purposes of this study, the definition of harassment includes any mention in the primary sources of an offense against an individual or group based on religious identity. Such offenses may range from physical attacks and direct coercion to more subtle forms of discrimination. But prejudicial opinions or attitudes, in and of themselves, do not constitute harassment unless they are acted upon in a palpable way.
As noted above, this study provides data on the number of countries in which different religious groups are harassed or intimidated. But the study does not assess either the severity or the frequency of the harassment in each country. Therefore, the results should not be interpreted as gauging which religious group faces the most harassment or persecution around the world.
Religion-Related Terrorism and Armed Conflict
Terrorism and war can have huge direct and indirect effects on religious groups, including destroying religious sites, displacing whole communities and inflaming sectarian passions. Accordingly, the Pew Forum tallied the number, location and consequences of religion-related terrorism and armed conflict around the world, as reported in the same primary sources used to document other forms of intimidation and violence. However, war and terrorism are sufficiently complex that it is not always possible to determine the degree to which they are religiously motivated or state sponsored. Out of an abundance of caution, this study does not include them in the Government Restrictions Index. They are factored instead into the index of social hostilities involving religion, which includes one question specifically about religion-related terrorism and one question specifically about religion-related war or armed conflict.
MetHoDologY

PeW ForUM on religion & PUblic liFe
www.pewforum.org
50
In addition, other measures in both indexes are likely to pick up spillover effects of war and terrorism on the level of religious tensions in society. For example, hate crimes, mob violence and sectarian fighting that occur in the aftermath of a terrorist attack or in the context of a religion-related war would be counted in the Social Hostilities Index, and laws or policies that clearly discriminate against a particular religious group would be registered on the Government Restrictions Index.
For the purposes of this study, the term “religion-related terrorism” is defined as premeditated, politically motivated violence perpetrated against noncombatant targets by subnational groups or clandestine agents that have some identifiable religious ideology or religious motivation. It also includes acts carried out by groups that have a nonreligious identity but target religious personnel, such as clergy. Readers should note that it is the political character and motivation of the groups, not solely the type of violence, that is at issue here. For instance, a bombing would not be classified as religion-related terrorism if there was no clearly discernible religious ideology or bias behind it unless it was directed at religious personnel. Religion-related war or armed conflict is defined as armed conflict (a conflict that involves sustained casualties over time or more than 1,000 battle deaths) in which religious rhetoric is commonly used to justify the use of force, or in which one or more of the combatants primarily identifies itself or the opposing side by religion.
Potential Biases
As noted earlier, the primary sources indicate that the North Korean government is among the most repressive in the world, including toward religion. Because of independent observers’ lack of regular access to North Korea, however, the sources are unable to provide the kind of specific, timely information that forms the basis of this report. Therefore, North Korea is not included on either index.
This raises two important issues concerning potential information bias in the sources. The first is whether other countries that limit outsiders’ access and that may seek to obscure or distort their record on religious restrictions were adequately covered by the sources. Countries with relatively limited access have multiple primary sources of information that the Pew Forum used for its coding. Each is also covered by other secondary quantitative data sets on religious restrictions that have used a similar coding scheme, including earlier years of coded State Department report data produced by Grim at Penn State’s Association of Religion Data Archives (ARDA) project (three data sets); independent coding by experts at the Hudson Institute’s Center for Religious Liberty using indexes also available from ARDA (one data set); and content analysis of country constitutions conducted by the Becket Fund for Religious Liberty (one data set). Pew Forum staff used these for cross-validation. Thus, contrary to what

rising tiDe oF restrictions on religion
51
one might expect, even most countries that limit access to information tend to receive fairly extensive coverage by groups that monitor religious restrictions. The second key question – the flipside of the first – is whether countries that provide freer access to information receive worse scores simply because more information is available on them. As described more fully in the methodology in the baseline report, Pew Forum staff compared the length of State Department reports on freer-access countries with those of less-free-access countries. The comparison found that the median number of words was approximately three times as large for the limited-access countries as for the open-access countries. This suggests that problems in freer-access countries are generally not overreported in the State Department reports.
Only when it comes to religion-related violence and intimidation in society do the sources report more problems in the freer-access countries than in the limited-access ones. However, the Social Hostilities Index includes several measures – such as SHI Q.8 (“Did religious groups themselves attempt to prevent other religious groups from being able to operate?”) and SHI Q. 11 (“Were women harassed for violating religious dress codes?”) – that are less susceptible to such reporting bias because they capture general social trends or attitudes as well as specific incidents. With these limitations in mind, it appears that the coded information on social hostilities is a fair gauge of the situation in the vast majority of countries and a valuable complement to the information on government restrictions.
Data on social impediments to religious practice can more confidently be used to make comparisons among countries with sufficient openness, which includes more than nine-in-ten countries covered in the coding. An analysis by Grim and Richard Wike, associate director of the Pew Research Center’s Global Attitudes Project, tested the reliability of the State Department reports on social impediments to religious practice by comparing public opinion data with data coded from the reports in previous years by Grim and experts at Penn State. They concluded that “the understanding of social religious intolerance embodied in the State Department reports is comparable with the results of population surveys and individual expert opinion.”16
16 see grim, brian J. and richard Wike. 2010. “cross-Validating Measures of global religious intolerance: comparing coded state Department reports with survey Data and expert opinion.” Politics and religion, vol. 3, issue 1: 102-129.
MetHoDologY

PeW ForUM on religion & PUblic liFe
www.pewforum.org
52
SCORES 6.6 AND HIGHER
Egypt
Indonesia
Maldives
Saudi Arabia
Afghanistan
Iran
Uzbekistan
Tunisia
Eritrea
China
Syria
Burma (Myanmar)
Russia
Vietnam
Yemen
Azerbaijan
Algeria
Belarus
SCORES FROM 4.5 TO 6.5
Kyrgyzstan
Tajikistan
Brunei
Jordan
Malaysia
Pakistan
Morocco
Mauritania
Israel
Sri Lanka
Chad
Western Sahara
Libya
Turkey
Nigeria
Laos
Kazakhstan
Qatar
Turkmenistan
Bangladesh
Greece
Sudan
Oman
India
Somalia*
Singapore
Cuba
Moldova
Armenia
Kenya
Kuwait
Iraq
Zimbabwe
United Arab Emirates
United Kingdom
Ethiopia
Bahrain
France
Germany
Ukraine
Tanzania
Rwanda
Lebanon
Angola
Belgium
Bhutan
Comoros
Mexico
Serbia
Palestinian territories**
Venezuela
Thailand
Mongolia
Uganda
Denmark
Nepal
Bulgaria
Madagascar
Austria
Nicaragua
Bahamas
Niger
Fiji
High
Very High
Denotes an increase of one point or more from mid-2009 to mid-2010. Denotes a decrease of one point or more from mid-2009 to mid-2010.
Moderate
SCORES FROM 2.4 TO 4.4
Central African Republic
Romania
Government Restrictions Index
The following table shows all 197 countries and territories in descending order of their scores on the Pew Forum’s index of government restrictions on religion as of mid-2010. The Pew Forum has not attached numerical rankings to the countries because there are numerous tie scores and the differences between the scores of countries that are close to each other on this table are not necessarily meaningful. This is particularly the case at the low end of the scale: The range of scores among the 50 countries in the Very High and High categories is greater than the range of scores among the 94 countries in the Low category.

rising tiDe oF restrictions on religion
53
goVernMent restrictions inDeX
Georgia
Guinea
Tuvalu
Democratic Rep. of the Congo
Iceland
Colombia
Cyprus
Republic of Macedonia
Spain
United States
Cambodia
Croatia
Slovakia
Peru
Costa Rica
Italy
Zambia
Swaziland
Equatorial Guinea
Norway
SCORES FROM 0.0 TO 2.3
Switzerland
Djibouti
Guyana
Latvia
Bosnia-Herzegovina
Ivory Coast
Japan
Gabon
South Korea
Tonga
Monaco
Gambia
Poland
Australia
Malta
Liberia
Kosovo
Honduras
Canada
Lithuania
Argentina
Senegal
Sweden
El Salvador
Jamaica
Estonia
Liechtenstein
Samoa
Togo
Albania
Burkina Faso
Chile
Netherlands
St. Lucia
Seychelles
Luxembourg
Botswana
Antigua and Barbuda
Mauritius
Philippines
Hong Kong
Papua New Guinea
Mozambique
Nauru
Czech Republic
Panama
Finland
Paraguay
Taiwan
Bolivia
Guatemala
Republic of the Congo
Brazil
Vanuatu
Slovenia
Low
Government Restrictions Index (cont.)
Please see page 54 for notes on north Korea, somalia and the Palestinian territories.
Ghana
Malawi
Solomon Islands
Suriname
Trinidad and Tobago
Mali
Dominica
Ecuador
Belize
Portugal
Barbados
Haiti
Grenada
Hungary
Andorra
Burundi
St. Vincent and the Grenadines
South Africa
St. Kitts and Nevis
Namibia
Lesotho
New Zealand
Ireland
Dominican Republic
Macau
Cameroon
Benin
Timor-Leste
Kiribati
Montenegro
Uruguay
Guinea Bissau
Cape Verde
Palau
Federated States of Micronesia
Marshall Islands
Sao Tome and Principe
San Marino
Sierra Leone

PeW ForUM on religion & PUblic liFe
www.pewforum.org
54
note: increases or decreases of one point or more between mid-2009 and mid-2010 are indicated with an arrow.
NORTH KOREA: the sources used for this study clearly indicate that the government of north Korea is among the most repressive in the world with respect to religion as well as other civil liberties. but because north Korean society is effectively closed to outsiders, the sources are unable to provide the kind of specific and timely information that the Pew Forum coded in this quantitative study. therefore, the report does not include a score for north Korea on either index.
* SOMALIA: the level of government restrictions in somalia is difficult to assess due to the lack of a functioning national government; the social hostilities index may be a more reliable indicator of the situation in somalia.
** PALESTINIAN TERRITORIES: the Palestinian territories’ score on government restrictions reflects the policies of the Palestinian authority government (headed by Mahmoud abbas and headquartered in the West bank) rather than the actions of Hamas in gaza (which is not recognized by most of the sources for this report as a legitimate government).

rising tiDe oF restrictions on religion
55
social Hostilities inDeX
High
Very High
SCORES 7.2 AND HIGHER
Pakistan
India
Sri Lanka
Iraq
Bangladesh
Somalia
Israel
Nigeria
Yemen
Afghanistan
Palestinian territories
Egypt
Russia
Saudi Arabia
Indonesia
SCORES FROM 3.6 TO 7.1
Kenya
United Kingdom
Burma (Myanmar)
Uganda
Nepal
Thailand
Algeria
Germany
Jordan
France
Tanzania
Kyrgyzstan
Iran
Sudan
Ethiopia
Turkey
Lebanon
Serbia
Central African Republic
South Africa
Armenia
Greece
Georgia
Vietnam
Romania
Ukraine
Philippines
Cyprus
Ivory Coast
Bahrain
Kosovo
Mexico
Laos
Colombia
Republic of Macedonia
Moldova
Democratic Rep. of the Congo
Timor-Leste
Switzerland
Mauritius
Hungary
Maldives
New Zealand
Chad
Ghana
Bosnia-Herzegovina
Montenegro
Sweden
Tajikistan
Angola
Croatia
Zambia
Uzbekistan
Malaysia
Cambodia
Zimbabwe
Belgium
Azerbaijan
Bulgaria
Haiti
Burundi
Spain
Denmark
Australia
Moderate
Social Hostilities Index
The following table shows all 197 countries and territories in descending order of their scores on the Pew Forum’s index of social hostilities involving religion as of mid-2010. The Pew Forum has not attached numerical rankings to the countries because there are numerous tie scores and the differences between the scores of countries that are close to each other on this table are not necessarily meaningful. This is particularly the case at the low end of the scale: The range of scores among the 47 countries in the Very High and High categories is greater than the range of scores among the 98 countries in the Low category.
Denotes an increase of one point or more from mid-2009 to mid-2010. Denotes a decrease of one point or more from mid-2009 to mid-2010.
SCORES FROM 1.5 TO 3.5
Papua New Guinea
United States
Italy
Syria
Brazil
Japan
Brunei

PeW ForUM on religion & PUblic liFe
www.pewforum.org
56
SCORES FROM 0.0 TO 1.4
Belarus
Mali
Czech Republic
Kazakhstan
Morocco
Turkmenistan
Mongolia
Iceland
Liechtenstein
Trinidad and Tobago
Guinea Bissau
Canada
Comoros
Slovakia
Tunisia
Niger
Cuba
Fiji
United Arab Emirates
Rwanda
Venezuela
Costa Rica
China
Guinea
Austria
Liberia
Chile
Kuwait
Norway
Tuvalu
Poland
Netherlands
Lithuania
Burkina Faso
Mauritania
Low
Latvia
Gabon
Honduras
Estonia
Paraguay
Grenada
Kiribati
Marshall Islands
Nicaragua
Eritrea
Oman
Gambia
Swaziland
Djibouti
Argentina
Sierra Leone
Qatar
Madagascar
Jamaica
St. Lucia
Antigua and Barbuda
Vanuatu
Slovenia
Malawi
Suriname
Dominica
Barbados
St. Vincent and the Grenadines
St. Kitts and Nevis
Lesotho
Cameroon
Benin
Togo
Mozambique
Bolivia
Guatemala
Portugal
Libya
Singapore
Senegal
Albania
Western Sahara
Bhutan
Bahamas
Peru
Equatorial Guinea
Guyana
South Korea
Tonga
Monaco
Malta
El Salvador
Samoa
Seychelles
Luxembourg
Botswana
Hong Kong
Nauru
Panama
Finland
Taiwan
Republic of the Congo
Solomon Islands
Ecuador
Belize
Andorra
Namibia
Ireland
Dominican Republic
Macau
Uruguay
Cape Verde
Palau
Federated States of Micronesia
Sao Tome and Principe
San Marino
Social Hostilities Index (cont.)
Please see page 57 for a note on north Korea.

rising tiDe oF restrictions on religion
57
note: increases or decreases of one point or more between mid-2009 and mid-2010 are indicated with an arrow.
NORTH KOREA: the sources used for this study clearly indicate that the government of north Korea is among the most repressive in the world with respect to religion as well as other civil liberties. but because north Korean society is effectively closed to outsiders, the sources are unable to provide the kind of specific and timely information that the Pew Forum coded in this quantitative study. therefore, the report does not include a score for north Korea on either index.
social Hostilities inDeX

PeW ForUM on religion & PUblic liFe
www.pewforum.org
58
Religious Restriction Index Scores by Region
Scores in the table below express the levels of religious restrictions according to the Pew Forum’s Government Restrictions Index (GRI) and Social Hostilities Index (SHI).
year, ending MID-2007
year, ending MID-2009
year, ending MID-2010
COUNTRY GRI SHI GRI SHI GRI SHI
Antigua and Barbuda 1.1 0.3 1.4 0.6 1.2 0.4
Argentina 1.7 0.6 2.5 1.0 1.6 0.5
Bahamas 1.4 0.5 2.3 0.0 3.0 0.0
Barbados 0.8 0.3 0.8 0.4 0.8 0.4
Belize 1.3 0.0 0.7 0.0 0.8 0.0
Bolivia 1.0 0.0 0.7 0.4 1.0 0.3
Brazil 0.4 0.8 1.1 1.7 1.0 3.3
Canada 1.0 1.2 1.3 1.5 1.6 1.1
Chile 1.2 0.4 1.3 0.8 1.3 1.8
Colombia 1.8 3.3 1.6 3.3 2.8 3.1
Costa Rica 1.0 0.0 2.1 0.5 2.6 0.8
Cuba 4.5 0.0 4.0 1.3 4.8 0.9
Dominica 0.8 0.3 1.0 0.4 0.9 0.4
Dominican Republic 0.6 0.0 1.0 0.0 0.6 0.0
Ecuador 1.1 0.6 0.7 0.0 0.8 0.0
El Salvador 0.6 0.4 1.4 0.0 1.4 0.0
Grenada 0.5 0.0 0.5 0.0 0.8 0.8
Guatemala 1.2 1.0 0.9 1.2 1.0 0.3
Guyana 0.7 0.0 0.5 0.0 2.1 0.0
Haiti 1.8 0.6 0.8 0.4 0.8 2.2
Honduras 1.3 0.3 2.7 0.3 1.6 0.8
Jamaica 1.0 0.0 1.3 0.0 1.4 0.4
Mexico 4.7 5.5 4.2 5.1 3.5 3.6
Nicaragua 2.0 0.5 1.1 0.1 3.1 0.6
Panama 0.7 0.0 1.1 0.0 1.1 0.0
Paraguay 0.6 0.7 1.2 0.0 1.0 0.8
Peru 1.8 0.0 1.5 0.0 2.6 0.0
St. Kitts and Nevis 0.6 0.3 0.5 0.6 0.7 0.4
St. Lucia 0.6 0.3 0.9 0.8 1.3 0.4
St. Vincent and the Grenadines 0.6 0.3 0.5 0.4 0.7 0.4
Suriname 0.0 0.0 0.7 0.0 0.9 0.4
Americas 35 countries baseline previous latest

rising tiDe oF restrictions on religion
59
Americas 35 countries (cont.)year, ending MID-2007
year, ending MID-2009
year, ending MID-2010
COUNTRY GRI SHI GRI SHI GRI SHI
Trinidad and Tobago 0.3 0.6 0.6 0.9 0.9 1.2
United States 1.6 1.9 1.6 2.0 2.7 3.4
Uruguay 0.3 0.6 0.3 0.0 0.3 0.0
Venezuela 3.6 0.8 2.5 1.2 3.5 0.8
year, ending MID-2007
year, ending MID-2009
year, ending MID-2010
COUNTRY GRI SHI GRI SHI GRI SHI
Afghanistan 5.3 8.5 6.5 8.6 8.0 7.7
Armenia 3.4 2.7 4.2 3.2 4.7 4.3
Australia 1.3 1.8 0.7 1.8 1.7 2.1
Azerbaijan 5.0 2.9 5.1 2.8 6.9 2.2
Bangladesh 4.0 8.3 5.1 8.3 5.6 8.2
Bhutan 4.4 1.9 5.0 0.5 3.6 0.0
Brunei 7.2 4.2 5.4 1.8 6.5 3.1
Burma (Myanmar) 7.9 4.9 7.9 4.9 7.3 5.8
Cambodia 2.9 0.8 2.4 0.0 2.7 2.2
China 7.8 0.9 8.2 3.3 7.5 2.0
Cyprus 1.2 0.9 1.9 1.1 2.8 3.8
Federated States of Micronesia 0.2 0.0 0.2 0.0 0.2 0.0
Fiji 0.9 2.6 0.9 1.2 3.0 0.9
Hong Kong 1.0 0.8 2.4 0.0 1.2 0.0
India 4.8 8.8 5.0 8.8 5.3 9.0
Indonesia 6.2 8.3 7.0 8.1 8.6 7.2
Iran 7.9 6.0 8.0 6.7 7.9 5.0
Japan 0.2 0.4 0.2 0.4 2.0 3.1
Kazakhstan 5.6 3.1 5.0 2.0 5.7 1.2
Kiribati 0.3 0.8 0.8 1.0 0.5 0.8
Kyrgyzstan 3.9 5.5 5.6 2.5 6.5 5.1
Laos 6.3 1.0 7.1 0.6 5.7 3.1
Macau 1.3 0.3 1.9 0.0 0.6 0.0
Malaysia 6.4 1.0 8.1 1.3 6.4 2.2
Asia-Pacific 50 countries
Religious Restriction Index Scores by Region (cont.)
inDeX scores bY region
baseline
baseline
previous
previous
current
latest

PeW ForUM on religion & PUblic liFe
www.pewforum.org
60
year, ending MID-2007
year, ending MID-2009
year, ending MID-2010
COUNTRY GRI SHI GRI SHI GRI SHI
Maldives 6.5 2.6 7.3 1.9 8.6 2.7
Marshall Islands 0.2 0.0 0.2 0.0 0.2 0.8
Mongolia 1.9 0.6 2.7 2.9 3.4 1.2
Nauru 2.0 0.3 0.7 0.0 1.1 0.0
Nepal 3.4 4.2 3.5 5.3 3.3 5.6
New Zealand 0.3 0.4 0.4 0.3 0.6 2.7
Pakistan 5.8 8.9 7.0 9.8 6.3 9.0
Palau 0.6 0.3 0.6 0.4 0.2 0.0
Papua New Guinea 0.8 0.0 1.4 1.5 1.1 3.5
Philippines 1.6 3.7 0.8 3.0 1.2 3.9
Samoa 0.8 0.4 0.9 0.3 1.4 0.0
Singapore 4.6 0.2 4.0 0.2 5.0 0.2
Solomon Islands 0.6 0.4 0.6 0.3 0.9 0.0
South Korea 1.6 0.0 1.2 0.0 1.9 0.0
Sri Lanka 4.0 7.8 3.7 6.2 6.0 8.3
Taiwan 0.5 0.0 0.8 0.0 1.0 0.0
Tajikistan 4.5 2.2 7.0 2.2 6.5 2.3
Thailand 2.6 2.6 3.4 4.6 3.5 5.5
Timor-Leste 0.9 4.2 0.0 4.2 0.5 2.9
Tonga 2.0 0.0 1.6 0.0 1.8 0.0
Turkey 6.6 4.7 6.4 4.4 5.8 4.9
Turkmenistan 5.6 1.5 6.7 1.2 5.6 1.2
Tuvalu 1.8 2.1 2.9 2.8 2.9 1.7
Uzbekistan 7.7 3.3 8.2 1.7 7.9 2.2
Vanuatu 1.0 1.0 1.0 0.0 1.0 0.4
Vietnam 6.6 1.2 6.3 5.0 7.0 4.0
Religious Restriction Index Scores by Region (cont.)
Asia-Pacific 50 countries (cont.) baseline previous latest

rising tiDe oF restrictions on religion
61
year, ending MID-2007
year, ending MID-2009
year, ending MID-2010
COUNTRY GRI SHI GRI SHI GRI SHI
Albania 0.8 0.2 0.7 0.0 1.3 0.2
Andorra 0.9 0.0 0.7 0.0 0.7 0.0
Austria 2.6 1.1 3.3 1.7 3.2 1.9
Belarus 5.9 1.4 6.4 3.1 6.8 1.4
Belgium 4.0 0.9 3.5 1.7 3.7 2.2
Bosnia-Herzegovina 1.5 2.4 1.6 3.1 2.0 2.6
Bulgaria 4.0 2.2 4.0 4.0 3.3 2.2
Croatia 0.7 2.0 1.8 1.3 2.7 2.3
Czech Republic 1.0 1.2 2.2 1.3 1.1 1.3
Denmark 2.5 1.2 3.0 4.6 3.4 2.1
Estonia 1.1 0.8 0.9 0.3 1.4 0.8
Finland 0.6 0.8 1.3 0.4 1.1 0.0
France 3.3 3.4 5.3 3.0 4.1 5.1
Georgia 2.2 4.7 2.4 2.6 2.9 4.1
Germany 3.1 2.1 3.0 3.7 4.0 5.3
Greece 5.2 4.4 4.0 3.1 5.5 4.1
Hungary 0.3 1.0 0.6 1.2 0.8 2.8
Iceland 2.6 0.4 1.8 1.3 2.8 1.2
Ireland 0.6 0.4 0.6 0.6 0.6 0.0
Italy 2.0 1.9 2.1 2.4 2.6 3.3
Kosovo 1.9 2.4 1.5 2.8 1.7 3.7
Latvia 2.3 1.4 2.0 0.6 2.0 0.8
Liechtenstein 1.3 0.1 1.3 1.2 1.4 1.2
Lithuania 1.6 0.8 2.5 0.8 1.6 1.5
Luxembourg 0.8 0.0 0.6 0.4 1.2 0.0
Malta 1.2 0.4 1.3 0.0 1.7 0.0
Moldova 4.2 3.8 4.7 4.2 4.8 2.9
Monaco 2.5 0.0 2.5 0.0 1.8 0.0
Montenegro 0.9 2.4 0.9 1.5 0.4 2.4
Netherlands 0.4 1.0 1.0 1.2 1.3 1.6
Norway 1.5 1.0 2.0 1.5 2.4 1.7
Poland 1.0 0.9 1.2 2.3 1.7 1.7
Portugal 0.3 0.0 0.1 0.8 0.8 0.3
Republic of Macedonia 2.2 1.5 1.0 1.5 2.8 3.0
Europe 45 countries
Religious Restriction Index Scores by Region (cont.)
inDeX scores bY region
baseline previous latest

PeW ForUM on religion & PUblic liFe
www.pewforum.org
62
Religious Restriction Index Scores by Region (cont.)
year, ending MID-2007
year, ending MID-2009
year, ending MID-2010
COUNTRY GRI SHI GRI SHI GRI SHI
Romania 4.8 5.5 3.9 4.1 4.4 4.0
Russia 5.8 3.7 6.7 5.5 7.2 7.3
San Marino 0.1 0.0 0.2 0.0 0.1 0.0
Serbia 3.1 1.5 4.7 3.1 3.5 4.7
Slovakia 2.8 1.9 3.0 3.3 2.6 1.0
Slovenia 0.6 1.0 0.9 0.9 1.0 0.4
Spain 2.0 1.6 1.1 1.9 2.7 2.1
Sweden 1.2 0.7 1.7 3.0 1.5 2.4
Switzerland 1.2 1.7 1.5 2.5 2.3 2.9
Ukraine 2.6 1.9 2.1 2.1 4.0 4.0
United Kingdom 1.6 1.6 2.8 3.8 4.3 6.2
Europe 45 countries (cont.)
year, ending MID-2007
year, ending MID-2009
year, ending MID-2010
COUNTRY GRI SHI GRI SHI GRI SHI
Algeria 5.6 3.6 7.3 5.3 6.9 5.4
Bahrain 4.3 3.0 4.7 3.3 4.2 3.7
Egypt 7.2 6.1 8.6 7.4 8.7 7.6
Iraq 5.1 10.0 5.4 9.2 4.6 8.3
Israel 3.9 7.8 4.3 7.8 6.1 7.9
Jordan 4.6 3.5 4.6 5.0 6.5 5.1
Kuwait 4.8 1.9 5.8 0.4 4.7 1.7
Lebanon 1.4 5.1 2.8 2.6 3.7 4.9
Libya 5.1 1.4 6.9 1.5 5.8 0.2
Morocco 4.9 3.7 5.2 2.6 6.2 1.2
Oman 3.9 0.3 4.7 0.0 5.3 0.6
Palestinian territories 3.3 6.4 3.5 6.9 3.5 7.7
Qatar 3.3 0.3 5.0 0.4 5.6 0.4
Saudi Arabia 8.0 7.2 7.9 6.2 8.6 7.2
Sudan 5.7 6.5 5.3 5.6 5.4 5.0
Syria 4.5 5.3 7.1 5.1 7.3 3.3
Middle East-North Africa 20 countries
baseline
baseline
previous
previous
latest
latest

rising tiDe oF restrictions on religion
63
Religious Restriction Index Scores by Region (cont.)
year, ending MID-2007
year, ending MID-2009
year, ending MID-2010
COUNTRY GRI SHI GRI SHI GRI SHI
Tunisia 4.8 3.8 5.2 1.5 7.7 1.0
United Arab Emirates 3.9 0.1 4.2 0.8 4.3 0.8
Western Sahara 4.8 3.3 5.2 2.6 5.9 0.0
Yemen 4.3 6.2 6.4 7.3 7.0 7.8
year, ending MID-2007
year, ending MID-2009
year, ending MID-2010
COUNTRY GRI SHI GRI SHI GRI SHI
Angola 3.3 3.7 2.4 1.2 3.7 2.3
Benin 0.3 0.0 0.3 0.0 0.5 0.4
Botswana 0.9 0.1 0.6 0.0 1.2 0.0
Burkina Faso 0.3 1.5 0.6 1.3 1.3 1.5
Burundi 0.4 0.9 0.2 0.8 0.7 2.2
Cameroon 1.1 1.4 1.3 0.4 0.6 0.4
Cape Verde 0.3 0.1 0.3 0.0 0.3 0.0
Central African Republic 3.7 3.3 4.6 2.3 4.4 4.5
Chad 4.2 3.3 3.8 0.3 6.0 2.6
Comoros 5.4 6.2 4.3 4.9 3.6 1.0
Democratic Republic of the Congo 1.3 2.6 0.7 3.1 2.8 2.9
Djibouti 2.4 1.8 1.6 1.3 2.1 0.5
Equatorial Guinea 2.6 0.0 1.7 0.0 2.4 0.0
Eritrea 7.0 0.4 7.9 0.6 7.7 0.6
Ethiopia 2.6 5.3 3.5 5.1 4.3 4.9
Gabon 1.7 0.1 1.8 0.3 1.9 0.8
Gambia 0.5 0.8 1.1 0.3 1.8 0.5
Ghana 1.2 4.9 0.8 3.5 1.0 2.6
Guinea 1.5 1.7 1.6 0.0 2.9 1.9
Guinea Bissau 1.5 0.0 0.3 0.0 0.3 1.2
Ivory Coast 1.9 3.1 2.0 0.8 2.0 3.7
Kenya 2.9 2.4 3.8 3.0 4.7 6.7
Lesotho 0.4 0.0 0.5 0.0 0.6 0.4
Liberia 1.7 3.8 0.5 0.5 1.7 1.8
Sub-Saharan Africa 47 countries
Middle East-North Africa 20 countries (cont.)
inDeX scores bY region
baseline
baseline
previous
previous
latest
latest
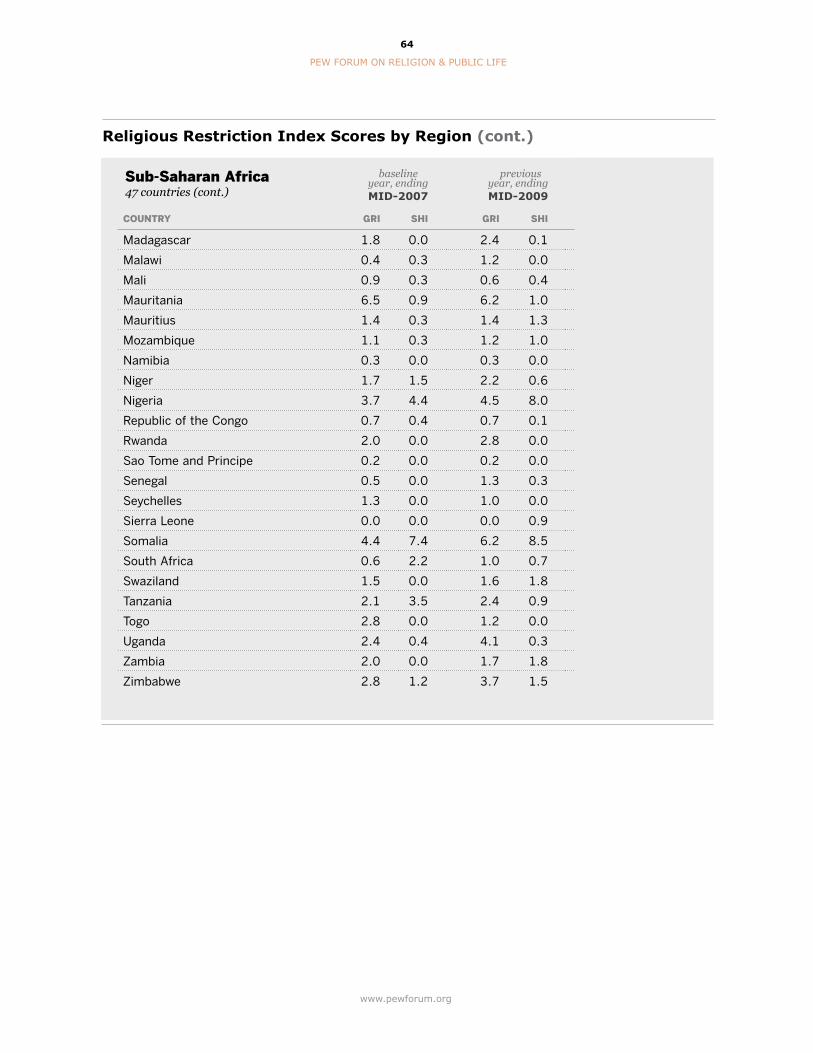
PeW ForUM on religion & PUblic liFe
www.pewforum.org
64
year, ending MID-2007
year, ending MID-2009
year, ending MID-2010
COUNTRY GRI SHI GRI SHI GRI SHI
Madagascar 1.8 0.0 2.4 0.1 3.3 0.4
Malawi 0.4 0.3 1.2 0.0 1.0 0.4
Mali 0.9 0.3 0.6 0.4 0.9 1.3
Mauritania 6.5 0.9 6.2 1.0 6.2 1.5
Mauritius 1.4 0.3 1.4 1.3 1.2 2.8
Mozambique 1.1 0.3 1.2 1.0 1.1 0.3
Namibia 0.3 0.0 0.3 0.0 0.7 0.0
Niger 1.7 1.5 2.2 0.6 3.0 1.0
Nigeria 3.7 4.4 4.5 8.0 5.8 7.8
Republic of the Congo 0.7 0.4 0.7 0.1 1.0 0.0
Rwanda 2.0 0.0 2.8 0.0 3.8 0.8
Sao Tome and Principe 0.2 0.0 0.2 0.0 0.2 0.0
Senegal 0.5 0.0 1.3 0.3 1.6 0.2
Seychelles 1.3 0.0 1.0 0.0 1.3 0.0
Sierra Leone 0.0 0.0 0.0 0.9 0.0 0.5
Somalia 4.4 7.4 6.2 8.5 5.2 8.1
South Africa 0.6 2.2 1.0 0.7 0.7 4.4
Swaziland 1.5 0.0 1.6 1.8 2.4 0.5
Tanzania 2.1 3.5 2.4 0.9 3.9 5.1
Togo 2.8 0.0 1.2 0.0 1.4 0.3
Uganda 2.4 0.4 4.1 0.3 3.4 5.8
Zambia 2.0 0.0 1.7 1.8 2.5 2.3
Zimbabwe 2.8 1.2 3.7 1.5 4.4 2.2
Religious Restriction Index Scores by Region (cont.)
Sub-Saharan Africa 47 countries (cont.)
baseline previous latest

rising tiDe oF restrictions on religion
65
Summary of Results
Government Restrictions on Religion
To assess the level of restrictions on religion by governments around the world, the Pew Research Center’s Forum on Religion & Public Life selected the following 20 questions for the Government Restrictions Index (GRI). The Pew Forum’s staff then combed through 19 published sources of information, including reports by the U.S. State Department, the United Nations and various nongovernmental organizations, to answer the questions on a country-by-country basis. (For more details, see the Methodology.)
This summary shows the questions, followed by various possible answers and the number and percentage of countries that fell into each category, according to the multiple sources analyzed by the Pew Forum. For example, on Question No. 5 – “Is public preaching by religious groups limited by any level of government?” – the study found that for the latest year, ending in mid-2010, 137 countries (70%) had no reported limits on preaching, 31 countries (16%) had limits on preaching for some religious groups and 29 countries (15%) had limits on preaching for all religious groups. (Percentages do not total to 100 due to rounding.)
Additionally, the summary shows whether particular religious restrictions occurred during the previous year, ending in mid-2009, or in the study’s baseline year, ending in mid-2007. To see how each country scored on each question, see the Results by Country online.
When comparing these results with the Pew Forum’s previous reports, readers should keep in mind that previous reports showed the number of countries in which particular religious restrictions occurred at any time during two overlapping periods: July 1, 2006, through June 30, 2008, and July 1, 2007, through June 30, 2009. Because this report presents data on an annual basis, the incidents for a single year may be less than when two years were taken into account.
Some differences from year to year might not be as significant as they appear due to minor changes in coding procedures and changes in the amount of information available between years. For example, sources for the most recent period studied sometimes had more information on incidents in a country than sources previously had reported. Such additional information may reflect either an actual increase in restrictions in a country, improved reporting for that country or both.
Percentages may not add to 100 due to rounding.
sUMMarY oF resUlts

PeW ForUM on religion & PUblic liFe
www.pewforum.org
66
1
1 article 18 states: “everyone has the right to freedom of thought, conscience and religion; this right includes freedom to change his religion or belief, and freedom, either alone or in community with others and in public or private, to manifest his religion or belief in teaching, practice, worship and observance.”
GRI.Q.1Does the constitution, or law that functions in the place of a constitution (basic law), specifically provide for “freedom of religion” or include language used in Article 18 of the United Nations Universal Declaration of Human Rights?
baseline year, ending MID-2007
previous year, ending MID-2009
latest year, ending MID-2010
NUMBER OF COUNTRIES
% OF COUNTRIES
NUMBER OF COUNTRIES
% OF COUNTRIES
NUMBER OF COUNTRIES
% OF COUNTRIES
Yes 143 73% 143 73% 144 73%
the constitution or basic law does not specifically provide for freedom of religion but does protect some religious practices
47 24 47 24 46 23
no 7 4 7 4 7 4
197 100 197 100 197 100
GRI.Q.2Does the constitution or basic law include stipulations that appear to qualify or substantially contradict the concept of “religious freedom”?
baseline year, ending MID-2007
previous year, ending MID-2009
latest year, ending MID-2010
NUMBER OF COUNTRIES
% OF COUNTRIES
NUMBER OF COUNTRIES
% OF COUNTRIES
NUMBER OF COUNTRIES
% OF COUNTRIES
no 41 21% 41 21% 40 20%
Yes, there is a qualification 39 20 39 20 40 20
Yes, there is a substantial contra-diction and only some religious practices are protected
110 56 110 56 110 56
religious freedom is not provided in the first place
7 4 7 4 7 4
197 100 197 100 197 100

rising tiDe oF restrictions on religion
67
GRI.Q.3Taken together, how do the constitution/basic law and other national laws and policies affect religious freedom?
baseline year, ending MID-2007
previous year, ending MID-2009
latest year, ending MID-2010
NUMBER OF COUNTRIES
% OF COUNTRIES
NUMBER OF COUNTRIES
% OF COUNTRIES
NUMBER OF COUNTRIES
% OF COUNTRIES
national laws and policies provide for religious freedom, and the national government respects reli-gious freedom in practice
63 32% 96 49% 75 38%
national laws and policies provide for religious freedom, and the national government generally respects religious freedom in prac-tice; but there are some instances (e.g., in certain localities) where religious freedom is not respected in practice
94 48 59 30 76 39
there are limited national legal protections for religious freedom, but the national government does not generally respect religious free-dom in practice
38 19 36 18 36 18
national laws and policies do not provide for religious freedom and the national government does not respect religious freedom in practice
2 1 6 3 10 5
197 100 197 100 197 100
sUMMarY oF resUlts
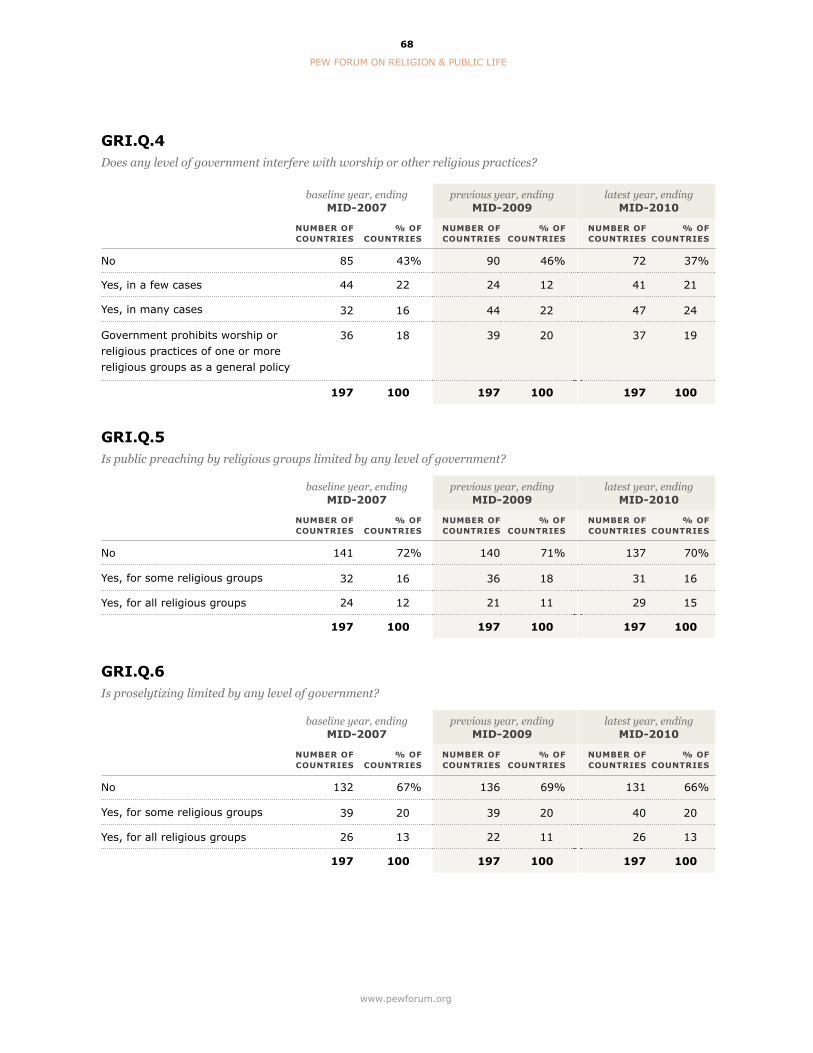
PeW ForUM on religion & PUblic liFe
www.pewforum.org
68
GRI.Q.4Does any level of government interfere with worship or other religious practices?
baseline year, ending MID-2007
previous year, ending MID-2009
latest year, ending MID-2010
NUMBER OF COUNTRIES
% OF COUNTRIES
NUMBER OF COUNTRIES
% OF COUNTRIES
NUMBER OF COUNTRIES
% OF COUNTRIES
no 85 43% 90 46% 72 37%
Yes, in a few cases 44 22 24 12 41 21
Yes, in many cases 32 16 44 22 47 24
government prohibits worship or religious practices of one or more religious groups as a general policy
36 18 39 20 37 19
197 100 197 100 197 100
GRI.Q.5Is public preaching by religious groups limited by any level of government?
baseline year, ending MID-2007
previous year, ending MID-2009
latest year, ending MID-2010
NUMBER OF COUNTRIES
% OF COUNTRIES
NUMBER OF COUNTRIES
% OF COUNTRIES
NUMBER OF COUNTRIES
% OF COUNTRIES
no 141 72% 140 71% 137 70%
Yes, for some religious groups 32 16 36 18 31 16
Yes, for all religious groups 24 12 21 11 29 15
197 100 197 100 197 100
GRI.Q.6Is proselytizing limited by any level of government?
baseline year, ending MID-2007
previous year, ending MID-2009
latest year, ending MID-2010
NUMBER OF COUNTRIES
% OF COUNTRIES
NUMBER OF COUNTRIES
% OF COUNTRIES
NUMBER OF COUNTRIES
% OF COUNTRIES
no 132 67% 136 69% 131 66%
Yes, for some religious groups 39 20 39 20 40 20
Yes, for all religious groups 26 13 22 11 26 13
197 100 197 100 197 100

rising tiDe oF restrictions on religion
69
GRI.Q.7Is converting from one religion to another limited by any level of government?
baseline year, ending MID-2007
previous year, ending MID-2009
latest year, ending MID-2010
NUMBER OF COUNTRIES
% OF COUNTRIES
NUMBER OF COUNTRIES
% OF COUNTRIES
NUMBER OF COUNTRIES
% OF COUNTRIES
no 166 84% 162 82% 158 80%
Yes 31 16 35 18 39 20
197 100 197 100 197 100
GRI.Q.8Is religious literature or broadcasting limited by any level of government?
baseline year, ending MID-2007
previous year, ending MID-2009
latest year, ending MID-2010
NUMBER OF COUNTRIES
% OF COUNTRIES
NUMBER OF COUNTRIES
% OF COUNTRIES
NUMBER OF COUNTRIES
% OF COUNTRIES
no 130 66% 122 62% 111 56%
Yes 67 34 75 38 86 44
197 100 197 100 197 100
GRI.Q.9Are foreign missionaries allowed to operate?
baseline year, ending MID-2007
previous year, ending MID-2009
latest year, ending MID-2010
NUMBER OF COUNTRIES
% OF COUNTRIES
NUMBER OF COUNTRIES
% OF COUNTRIES
NUMBER OF COUNTRIES
% OF COUNTRIES
Yes 117 59% 115 58% 118 60%
Yes, but with restrictions 72 37 69 35 71 36
no 8 4 13 7 8 4
197 100 197 100 197 100
sUMMarY oF resUlts

PeW ForUM on religion & PUblic liFe
www.pewforum.org
70
GRI.Q.10Is the wearing of religious symbols, such as head coverings for women and facial hair for men, regulated by law or by any level of government?
baseline year, ending MID-2007
previous year, ending MID-2009
latest year, ending MID-2010
NUMBER OF COUNTRIES
% OF COUNTRIES
NUMBER OF COUNTRIES
% OF COUNTRIES
NUMBER OF COUNTRIES
% OF COUNTRIES
no 176 89% 152 77% 140 71%
Yes 21 11 45 23 57 29
197 100 197 100 197 100
GRI.Q.11Was there harassment or intimidation of religious groups by any level of government?
baseline year, ending MID-2007
previous year, ending MID-2009
latest year, ending MID-2010
NUMBER OF COUNTRIES
% OF COUNTRIES
NUMBER OF COUNTRIES
% OF COUNTRIES
NUMBER OF COUNTRIES
% OF COUNTRIES
no 79 40% 94 48% 73 37%
Yes, there was limited intimidation 82 42 37 19 38 19
Yes, there was widespread intimidation
36 18 66 34 86 44
197 100 197 100 197 100
GRI.Q.12Did the national government display hostility involving physical violence toward minority or nonapproved religious groups?
baseline year, ending MID-2007
previous year, ending MID-2009
latest year, ending MID-2010
NUMBER OF COUNTRIES
% OF COUNTRIES
NUMBER OF COUNTRIES
% OF COUNTRIES
NUMBER OF COUNTRIES
% OF COUNTRIES
no 152 77% 154 78% 146 74%
Yes 45 23 43 22 51 26
197 100 197 100 197 100
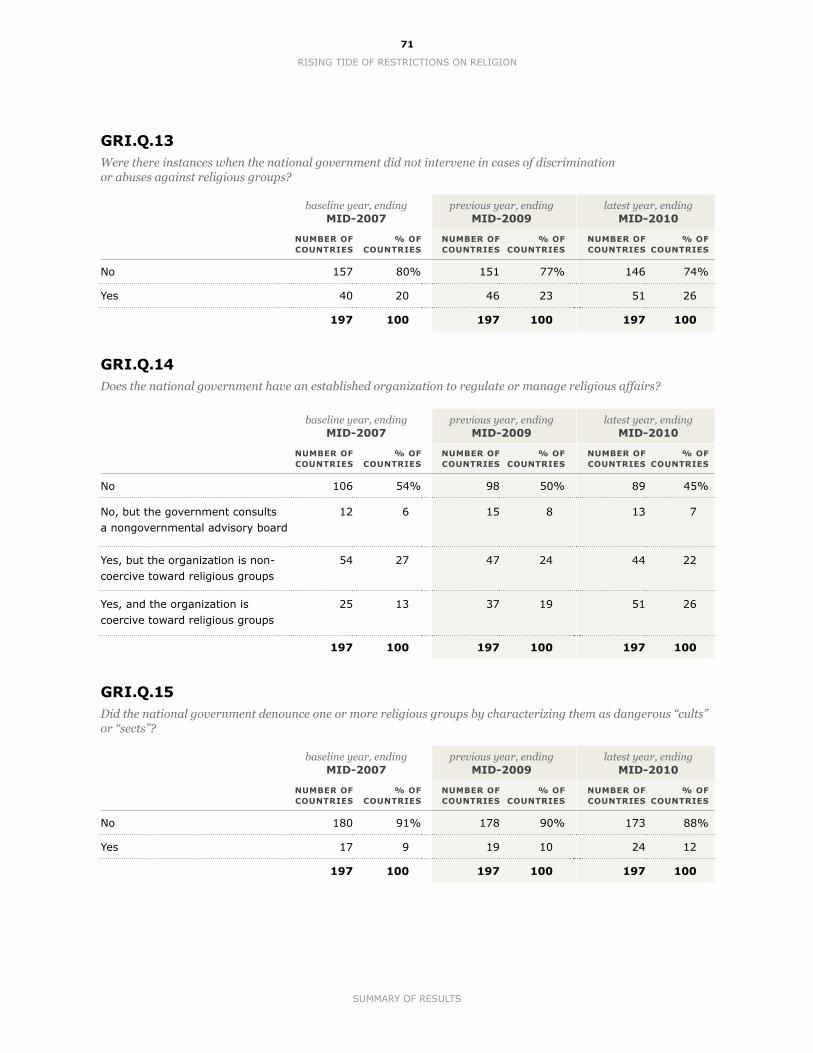
rising tiDe oF restrictions on religion
71
GRI.Q.13Were there instances when the national government did not intervene in cases of discrimination or abuses against religious groups?
baseline year, ending MID-2007
previous year, ending MID-2009
latest year, ending MID-2010
NUMBER OF COUNTRIES
% OF COUNTRIES
NUMBER OF COUNTRIES
% OF COUNTRIES
NUMBER OF COUNTRIES
% OF COUNTRIES
no 157 80% 151 77% 146 74%
Yes 40 20 46 23 51 26
197 100 197 100 197 100
GRI.Q.14Does the national government have an established organization to regulate or manage religious affairs?
baseline year, ending MID-2007
previous year, ending MID-2009
latest year, ending MID-2010
NUMBER OF COUNTRIES
% OF COUNTRIES
NUMBER OF COUNTRIES
% OF COUNTRIES
NUMBER OF COUNTRIES
% OF COUNTRIES
no 106 54% 98 50% 89 45%
no, but the government consults a nongovernmental advisory board
12 6 15 8 13 7
Yes, but the organization is non-coercive toward religious groups
54 27 47 24 44 22
Yes, and the organization is coercive toward religious groups
25 13 37 19 51 26
197 100 197 100 197 100
GRI.Q.15Did the national government denounce one or more religious groups by characterizing them as dangerous “cults” or “sects”?
baseline year, ending MID-2007
previous year, ending MID-2009
latest year, ending MID-2010
NUMBER OF COUNTRIES
% OF COUNTRIES
NUMBER OF COUNTRIES
% OF COUNTRIES
NUMBER OF COUNTRIES
% OF COUNTRIES
no 180 91% 178 90% 173 88%
Yes 17 9 19 10 24 12
197 100 197 100 197 100
sUMMarY oF resUlts

PeW ForUM on religion & PUblic liFe
www.pewforum.org
72
GRI.Q.16Does any level of government formally ban any religious group?
baseline year, ending MID-2007
previous year, ending MID-2009
latest year, ending MID-2010
NUMBER OF COUNTRIES
% OF COUNTRIES
NUMBER OF COUNTRIES
% OF COUNTRIES
NUMBER OF COUNTRIES
% OF COUNTRIES
no 162 82% 159 81% 158 80%
Yes 35 18 38 19 39 20
Security reasons stated as rationale
11 6 14 7 12 6
Nonsecurity reasons stated as rationale
18 9 12 6 19 10
Both security and nonsecurity reasons stated as rationale
6 3 12 6 8 4
197 100 197 100 197 100
GRI.Q.17Were there instances when the national government attempted to eliminate an entire religious group’s presence in the country?
baseline year, ending MID-2007
previous year, ending MID-2009
latest year, ending MID-2010
NUMBER OF COUNTRIES
% OF COUNTRIES
NUMBER OF COUNTRIES
% OF COUNTRIES
NUMBER OF COUNTRIES
% OF COUNTRIES
no 181 92% 174 88% 171 87%
Yes 16 8 23 12 26 13
197 100 197 100 197 100

rising tiDe oF restrictions on religion
73
GRI.Q.18Does any level of government ask religious groups to register for any reason, including to be eligible for benefits such as tax exemption?
baseline year, ending MID-2007
previous year, ending MID-2009
latest year, ending MID-2010
NUMBER OF COUNTRIES
% OF COUNTRIES
NUMBER OF COUNTRIES
% OF COUNTRIES
NUMBER OF COUNTRIES
% OF COUNTRIES
no 38 19% 30 15% 27 14%
Yes, but in a nondiscriminatory way 71 36 80 41 71 36
Yes, and the process adversely affects the ability of some religious groups to operate
34 17 11 6 18 9
Yes, and the process clearly discriminates against some religious groups
54 27 76 39 81 41
197 100 197 100 197 100
GRI.Q.19Did any level of government use force toward religious groups that resulted in individuals being killed, physically abused, imprisoned, detained or displaced from their homes, or having their personal or religious properties dam-aged or destroyed?
baseline year, ending MID-2007
previous year, ending MID-2009
latest year, ending MID-2010
NUMBER OF COUNTRIES
% OF COUNTRIES
NUMBER OF COUNTRIES
% OF COUNTRIES
NUMBER OF COUNTRIES
% OF COUNTRIES
no 136 69% 114 58% 89 45%
Yes 61 31 83 42 108 55
1-9 cases of government force 18 9 30 15 43 22
10-200 cases of government force 35 18 28 14 43 22
201-1,000 cases of government force
4 2 11 6 12 6
1,001-9,999 cases of government force
2 1 8 4 7 4
10,000+ cases of government force
2 1 6 3 3 2
197 100 197 100 197 100
sUMMarY oF resUlts

PeW ForUM on religion & PUblic liFe
www.pewforum.org
74
GRI.Q.19bDid any level of government use force toward religious groups that resulted in individuals being killed, physically abused, imprisoned, detained or displaced from their homes, or having their personal or religious properties damaged or destroyed?
baseline year, ending MID-2007
previous year, ending MID-2009
latest year, ending MID-2010
NUMBER OF COUNTRIES
% OF COUNTRIES
NUMBER OF COUNTRIES
% OF COUNTRIES
NUMBER OF COUNTRIES
% OF COUNTRIES
no 136 69% 114 58% 89 45%
Yes ^ 61 31 83 42 108 55
Property damage 7 4 38 19 61 31
Detentions/abductions 47 24 64 32 79 40
Displacement from homes 20 10 26 13 41 21
Physical assaults 25 13 31 16 46 23
Deaths 15 8 17 9 23 12
197 100 197 100 197 100
Percentages add to more than 100 because countries can have multiple types of cases of government force.^ this line represents the number or percentage of countries in which at least one of the following types of government force occurred.
GRI.Q.20Do some religious groups receive government support or favors, such as funding, official recognition or special access?
baseline year, ending MID-2007
previous year, ending MID-2009
latest year, ending MID-2010
NUMBER OF COUNTRIES
% OF COUNTRIES
NUMBER OF COUNTRIES
% OF COUNTRIES
NUMBER OF COUNTRIES
% OF COUNTRIES
no 18 9% 21 11% 11 6%
Yes, the government provides support to religious groups, but it does so on a more-or-less fair and equal basis
36 18 43 22 44 22
Yes, the government gives preferential support or favors to some religious group(s) and clearly discriminates against others
143 73 133 68 142 72
197 100 197 100 197 100
this is a summary table that puts the restrictions identified in Questions 20.1, 20.2, 20.3a-c, 20.4 and 20.5 into a single measure indicating the level to which a government supports religious groups in the country. government support of a religion or religions is considered restrictive only when preferential treatment of one or more religious groups puts other religious groups at a disadvantage.

rising tiDe oF restrictions on religion
75
GRI.Q.20.1Does the country’s constitution or basic law recognize a favored religion or religions?
baseline year, ending MID-2007
previous year, ending MID-2009
latest year, ending MID-2010
NUMBER OF COUNTRIES
% OF COUNTRIES
NUMBER OF COUNTRIES
% OF COUNTRIES
NUMBER OF COUNTRIES
% OF COUNTRIES
no 141 72% 121 61% 120 61%
Yes 56 28 76 39 77 39
197 100 197 100 197 100
this question is a component of gri.Q.20. For gri.Q.20.1, the differences between the coding periods may not be as significant as they appear due to minor changes in coding procedures.
GRI.Q.20.2Do all religious groups receive the same level of government access and privileges?
baseline year, ending MID-2007
previous year, ending MID-2009
latest year, ending MID-2010
NUMBER OF COUNTRIES
% OF COUNTRIES
NUMBER OF COUNTRIES
% OF COUNTRIES
NUMBER OF COUNTRIES
% OF COUNTRIES
all religious groups are generally treated the same
39 20% 57 29% 38 19%
some religious groups have mini-mal privileges unavailable to other religious groups, limited to things such as inheriting buildings or properties
7 4 14 7 21 11
some religious groups have general privileges or government access unavailable to other religious groups
62 31 37 19 40 20
one religious group has privileges or government access unavailable to other religious groups, but it is not recognized as the country’s official religion
48 24 48 24 55 28
one religious group has privileges or government access unavailable to other religious groups, and it is recognized by the national govern-ment as the official religion
41 21 41 21 43 22
197 100 197 100 197 100
this question is a component of gri.Q.20.
sUMMarY oF resUlts
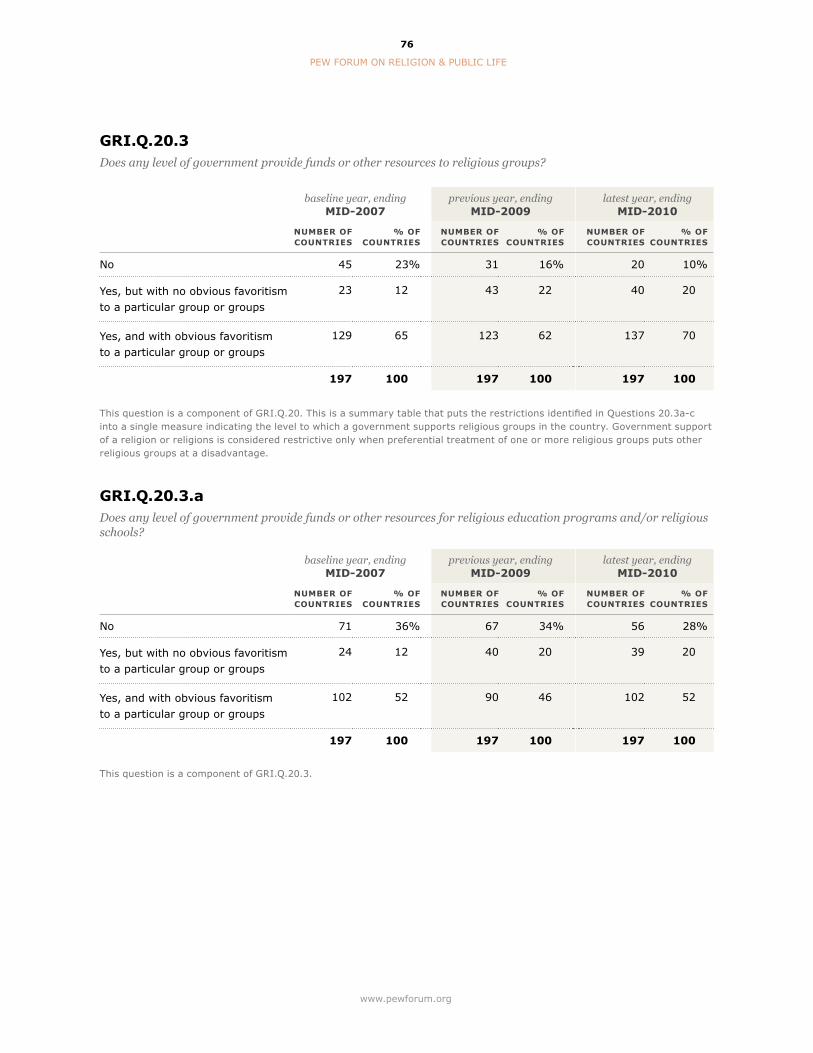
PeW ForUM on religion & PUblic liFe
www.pewforum.org
76
GRI.Q.20.3Does any level of government provide funds or other resources to religious groups?
baseline year, ending MID-2007
previous year, ending MID-2009
latest year, ending MID-2010
NUMBER OF COUNTRIES
% OF COUNTRIES
NUMBER OF COUNTRIES
% OF COUNTRIES
NUMBER OF COUNTRIES
% OF COUNTRIES
no 45 23% 31 16% 20 10%
Yes, but with no obvious favoritism to a particular group or groups
23 12 43 22 40 20
Yes, and with obvious favoritism to a particular group or groups
129 65 123 62 137 70
197 100 197 100 197 100
this question is a component of gri.Q.20. this is a summary table that puts the restrictions identified in Questions 20.3a-c into a single measure indicating the level to which a government supports religious groups in the country. government support of a religion or religions is considered restrictive only when preferential treatment of one or more religious groups puts other religious groups at a disadvantage.
GRI.Q.20.3.aDoes any level of government provide funds or other resources for religious education programs and/or religious schools?
baseline year, ending MID-2007
previous year, ending MID-2009
latest year, ending MID-2010
NUMBER OF COUNTRIES
% OF COUNTRIES
NUMBER OF COUNTRIES
% OF COUNTRIES
NUMBER OF COUNTRIES
% OF COUNTRIES
no 71 36% 67 34% 56 28%
Yes, but with no obvious favoritism to a particular group or groups
24 12 40 20 39 20
Yes, and with obvious favoritism to a particular group or groups
102 52 90 46 102 52
197 100 197 100 197 100
this question is a component of gri.Q.20.3.

rising tiDe oF restrictions on religion
77
GRI.Q.20.3.bDoes any level of government provide funds or other resources for religious property (e.g., buildings, upkeep, repair or land)?
baseline year, ending MID-2007
previous year, ending MID-2009
latest year, ending MID-2010
NUMBER OF COUNTRIES
% OF COUNTRIES
NUMBER OF COUNTRIES
% OF COUNTRIES
NUMBER OF COUNTRIES
% OF COUNTRIES
no 128 65% 105 53% 119 60%
Yes, but with no obvious favoritism to a particular group or groups
10 5 27 14 16 8
Yes, and with obvious favoritism to a particular group or groups
59 30 65 33 62 31
197 100 197 100 197 100
this question is a component of gri.Q.20.3.
GRI.Q.20.3.cDoes any level of government provide funds or other resources for religious activities other than education or property?
baseline year, ending MID-2007
previous year, ending MID-2009
latest year, ending MID-2010
NUMBER OF COUNTRIES
% OF COUNTRIES
NUMBER OF COUNTRIES
% OF COUNTRIES
NUMBER OF COUNTRIES
% OF COUNTRIES
no 106 54% 64 32% 55 28%
Yes, but with no obvious favoritism to a particular group or groups
7 4 41 21 43 22
Yes, and with obvious favoritism to a particular group or groups
84 43 92 47 99 50
197 100 197 100 197 100
this question is a component of gri.Q.20.3.
sUMMarY oF resUlts

PeW ForUM on religion & PUblic liFe
www.pewforum.org
78
GRI.Q.20.4Is religious education required in public schools?
baseline year, ending MID-2007
previous year, ending MID-2009
latest year, ending MID-2010
NUMBER OF COUNTRIES
% OF COUNTRIES
NUMBER OF COUNTRIES
% OF COUNTRIES
NUMBER OF COUNTRIES
% OF COUNTRIES
no 134 68% 130 66% 120 61%
Yes, by at least some local governments
6 3 6 3 13 7
Yes, by the national government 57 29 61 31 64 32
197 100 197 100 197 100
this question is a component of gri.Q.20.
GRI.Q.20.5Does the national government defer in some way to religious authorities, texts or doctrines on legal issues?
baseline year, ending MID-2007
previous year, ending MID-2009
latest year, ending MID-2010
NUMBER OF COUNTRIES
% OF COUNTRIES
NUMBER OF COUNTRIES
% OF COUNTRIES
NUMBER OF COUNTRIES
% OF COUNTRIES
no 150 76% 144 73% 125 63%
Yes 47 24 53 27 72 37
197 100 197 100 197 100
this question is a component of gri.Q.20.

rising tiDe oF restrictions on religion
79
Social Hostilities Involving Religion
To assess the level of social hostilities involving religion around the world, the Pew Research Center’s Forum on Religion & Public Life used the following 13 questions for the Social Hostilities Index (SHI). The Pew Forum’s staff then combed through 19 published sources of information, including reports by the U.S. State Department, the United Nations and various nongovernmental organizations, to answer the questions on a country-by-country basis. (For more details, see the Methodology.) This summary shows the questions, followed by various possible answers and the number and percentage of countries that fell into each category, according to the multiple sources analyzed by the Pew Forum. For example, on Question No. 12 – “Were there incidents of hostility over proselytizing?” – the study found that for the latest year, ending in mid-2010, 161 countries (82%) had no reported incidents of hostility over proselytizing, 17 countries (9%) had incidents that fell short of physical violence and 19 countries (10%) had incidents involving violence. (Percentages do not total to 100 due to rounding.)
Additionally, the summary shows whether particular religious hostilities occurred during the previous year, ending in mid-2009, or in the study’s baseline year, ending in mid-2007. To see how each country scored on each question, see the Results by Country online.
When comparing these results with the Pew Forum’s previous reports, readers should keep in mind that previous reports showed the number of countries in which particular religious hostilities occurred at any time during two overlapping periods: July 1, 2006, through June 30, 2008, and July 1, 2007, through June 30, 2009. Because this report presents data on an annual basis, the incidents for a single year may be less than when two years were taken into account.
Some differences from year to year might not be as significant as they appear due to minor changes in coding procedures and changes in the amount of information available between years. For example, sources for the most recent period studied sometimes had more information on incidents in a country than sources previously had reported. Such additional information may reflect either an actual increase in restrictions in a country, improved reporting for that country or both.
Percentages may not add to 100 due to rounding.
sUMMarY oF resUlts

PeW ForUM on religion & PUblic liFe
www.pewforum.org
80
SHI.Q.1.aWere there crimes, malicious acts or violence motivated by religious hatred or bias?
baseline year, ending MID-2007
previous year, ending MID-2009
latest year, ending MID-2010
NUMBER OF COUNTRIES
% OF COUNTRIES
NUMBER OF COUNTRIES
% OF COUNTRIES
NUMBER OF COUNTRIES
% OF COUNTRIES
no 67 34% 67 34% 51 26%
Yes ^ 130 66 130 66 146 74
Harassment/intimidation 127 64 124 63 135 69
Property damage 40 20 67 34 83 42
Detentions/abductions 12 6 13 7 19 10
Displacement from homes 19 10 16 8 22 11
Physical assaults 55 28 54 27 82 42
Deaths 25 13 28 14 38 19
197 100 197 100 197 100
this is a summary table that captures the types of religious hatred or bias.Percentages add to more than 100 because countries can have multiple types of hostilities.^ this line represents the number or percentage of countries in which at least one of the following hostilities occurred.
SHI.Q.1.bHow many different types of crimes, malicious acts or violence motivated by religious hatred or bias occured? The six different types considered include: harassment/intimidation, property damage, detentions/abductions, displacement from homes, physcal assaults and killings.
baseline year, ending MID-2007
previous year, ending MID-2009
latest year, ending MID-2010
NUMBER OF COUNTRIES
% OF COUNTRIES
NUMBER OF COUNTRIES
% OF COUNTRIES
NUMBER OF COUNTRIES
% OF COUNTRIES
no 67 34% 67 34% 51 26%
Yes: one type 56 28 45 23 38 19
Yes: two types 30 15 38 19 33 17
Yes: three types 25 13 23 12 44 22
Yes: four types 11 6 14 7 17 9
Yes: five types 5 3 4 2 9 5
Yes: six types 3 2 6 3 5 3
197 100 197 100 197 100
this is a summary table that captures the severity of religious hatred or bias.
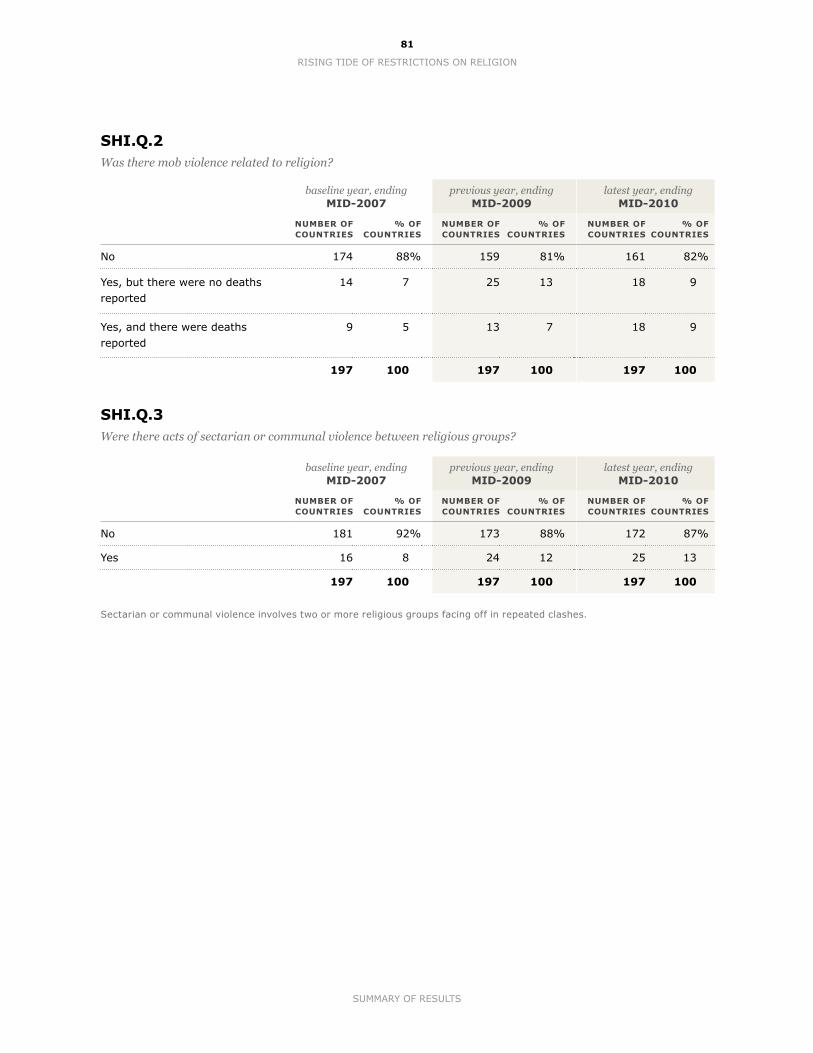
rising tiDe oF restrictions on religion
81
SHI.Q.2Was there mob violence related to religion?
baseline year, ending MID-2007
previous year, ending MID-2009
latest year, ending MID-2010
NUMBER OF COUNTRIES
% OF COUNTRIES
NUMBER OF COUNTRIES
% OF COUNTRIES
NUMBER OF COUNTRIES
% OF COUNTRIES
no 174 88% 159 81% 161 82%
Yes, but there were no deaths reported
14 7 25 13 18 9
Yes, and there were deaths reported
9 5 13 7 18 9
197 100 197 100 197 100
SHI.Q.3Were there acts of sectarian or communal violence between religious groups?
baseline year, ending MID-2007
previous year, ending MID-2009
latest year, ending MID-2010
NUMBER OF COUNTRIES
% OF COUNTRIES
NUMBER OF COUNTRIES
% OF COUNTRIES
NUMBER OF COUNTRIES
% OF COUNTRIES
no 181 92% 173 88% 172 87%
Yes 16 8 24 12 25 13
197 100 197 100 197 100
sectarian or communal violence involves two or more religious groups facing off in repeated clashes.
sUMMarY oF resUlts

PeW ForUM on religion & PUblic liFe
www.pewforum.org
82
SHI.Q.4Were religion-related terrorist groups active in the country?
baseline year, ending MID-2007
previous year, ending MID-2009
latest year, ending MID-2010
NUMBER OF COUNTRIES
% OF COUNTRIES
NUMBER OF COUNTRIES
% OF COUNTRIES
NUMBER OF COUNTRIES
% OF COUNTRIES
no 137 70% 134 68% 124 63%
Yes 60 30 63 32 73 37
Yes, but their activity was limited to recruitment and fundraising
43 22 26 13 33 17
Yes, with violence that resulted in some casualties (1-9 injuries or deaths)
7 4 10 5 12 6
Yes, with violence that resulted in multiple casualties (10-50 injuries or deaths)
2 1 9 5 7 4
Yes, with violence that resulted in many casualties (more than 50 injuries or deaths)
8 4 18 9 21 11
197 100 197 100 197 100
religion-related terrorism is defined as politically motivated violence against noncombatants by subnational groups or clandestine agents with a religious justification or intent.
some of the increase in religion-related terrorism between the year ending in mid-2007 and the year ending in mid-2009 could reflect the use of new source material providing greater detail on terrorist activities than was provided by sources used in the baseline report.

rising tiDe oF restrictions on religion
83
sUMMarY oF resUlts
SHI.Q.5Was there a religion-related war or armed conflict in the country?
baseline year, ending MID-2007
previous year, ending MID-2009
latest year, ending MID-2010
NUMBER OF COUNTRIES
% OF COUNTRIES
NUMBER OF COUNTRIES
% OF COUNTRIES
NUMBER OF COUNTRIES
% OF COUNTRIES
no 176 89% 180 91% 168 85%
Yes 21 11 17 9 29 15
Yes, with fewer than 10,000 casualties or people displaced
9 5 6 3 8 4
Yes, with tens of thousands of casualties or people displaced
6 3 3 2 5 3
Yes, with hundreds of thousands of casualties or people displaced
3 2 4 2 12 6
Yes, with millions of casualties or people displaced
3 2 4 2 4 2
197 100 197 100 197 100
religion-related war is defined as armed conflict (involving sustained casualties over time or more than 1,000 battle deaths) in which religious rhetoric is commonly employed to justify the use of force, or in which one or more of the combatants primarily identifies itself or the opposing side by religion.
some of the increase shown above for the year ending in mid-2010 reflects ongoing displacements that were not coded in pre-vious years, including the religion-related conflicts in such places as nagorno-Karabakh and cyprus.
SHI.Q.6Did violence result from tensions between religious groups?
baseline year, ending MID-2007
previous year, ending MID-2009
latest year, ending MID-2010
NUMBER OF COUNTRIES
% OF COUNTRIES
NUMBER OF COUNTRIES
% OF COUNTRIES
NUMBER OF COUNTRIES
% OF COUNTRIES
no 50 25% 61 31% 45 23%
there were public tensions between religious groups, but they fell short of hostilities involving physical violence
56 28 50 25 76 39
Yes, with physical violence in a few cases
69 35 51 26 45 23
Yes, with physical violence in numerous cases
22 11 35 18 31 16
197 100 197 100 197 100
the data for each year also takes into account information from the two previous years.

PeW ForUM on religion & PUblic liFe
www.pewforum.org
84
SHI.Q.7Did organized groups use force or coercion in an attempt to dominate public life with their perspective on religion, including preventing some religious groups from operating in the country?
baseline year, ending MID-2007
previous year, ending MID-2009
latest year, ending MID-2010
NUMBER OF COUNTRIES
% OF COUNTRIES
NUMBER OF COUNTRIES
% OF COUNTRIES
NUMBER OF COUNTRIES
% OF COUNTRIES
no 113 57% 142 72% 128 65%
Yes 84 43 55 28 69 35
At the local level 22 11 12 6 18 9
At the regional level 31 16 12 6 11 6
At the national level 31 16 31 16 40 20
197 100 197 100 197 100
the data for each year also takes into account information from the two previous years.
SHI.Q.8Did religious groups themselves attempt to prevent other religious groups from being able to operate?
baseline year, ending MID-2007
previous year, ending MID-2009
latest year, ending MID-2010
NUMBER OF COUNTRIES
% OF COUNTRIES
NUMBER OF COUNTRIES
% OF COUNTRIES
NUMBER OF COUNTRIES
% OF COUNTRIES
no 130 66% 153 78% 148 75%
Yes 67 34 44 22 49 25
197 100 197 100 197 100
the data for each year also takes into account information from the two previous years.
SHI.Q.9Did individuals or groups use violence or the threat of violence, including so-called honor killings, to try to enforce religious norms?
baseline year, ending MID-2007
previous year, ending MID-2009
latest year, ending MID-2010
NUMBER OF COUNTRIES
% OF COUNTRIES
NUMBER OF COUNTRIES
% OF COUNTRIES
NUMBER OF COUNTRIES
% OF COUNTRIES
no 162 82% 166 84% 147 75%
Yes 35 18 31 16 50 25
197 100 197 100 197 100
the data for each year also takes into account information from the two previous years.
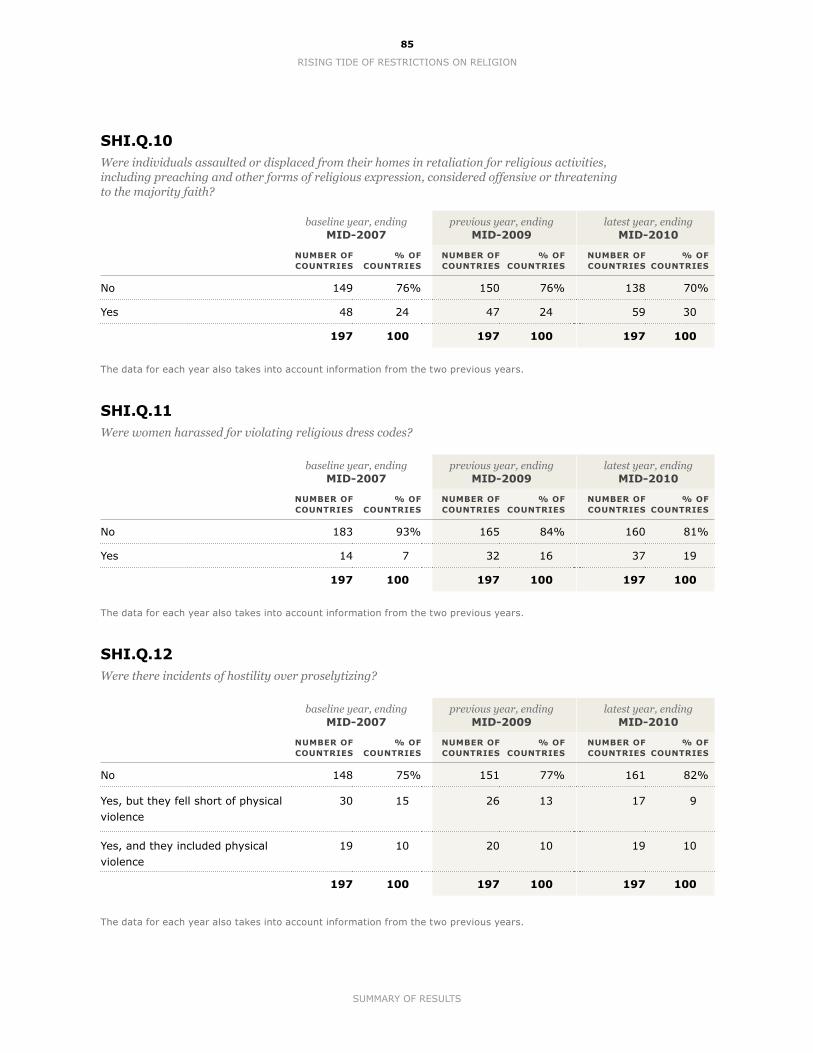
rising tiDe oF restrictions on religion
85
sUMMarY oF resUlts
SHI.Q.10Were individuals assaulted or displaced from their homes in retaliation for religious activities, including preaching and other forms of religious expression, considered offensive or threatening to the majority faith?
baseline year, ending MID-2007
previous year, ending MID-2009
latest year, ending MID-2010
NUMBER OF COUNTRIES
% OF COUNTRIES
NUMBER OF COUNTRIES
% OF COUNTRIES
NUMBER OF COUNTRIES
% OF COUNTRIES
no 149 76% 150 76% 138 70%
Yes 48 24 47 24 59 30
197 100 197 100 197 100
the data for each year also takes into account information from the two previous years.
SHI.Q.11Were women harassed for violating religious dress codes?
baseline year, ending MID-2007
previous year, ending MID-2009
latest year, ending MID-2010
NUMBER OF COUNTRIES
% OF COUNTRIES
NUMBER OF COUNTRIES
% OF COUNTRIES
NUMBER OF COUNTRIES
% OF COUNTRIES
no 183 93% 165 84% 160 81%
Yes 14 7 32 16 37 19
197 100 197 100 197 100
the data for each year also takes into account information from the two previous years.
SHI.Q.12Were there incidents of hostility over proselytizing?
baseline year, ending MID-2007
previous year, ending MID-2009
latest year, ending MID-2010
NUMBER OF COUNTRIES
% OF COUNTRIES
NUMBER OF COUNTRIES
% OF COUNTRIES
NUMBER OF COUNTRIES
% OF COUNTRIES
no 148 75% 151 77% 161 82%
Yes, but they fell short of physical violence
30 15 26 13 17 9
Yes, and they included physical violence
19 10 20 10 19 10
197 100 197 100 197 100
the data for each year also takes into account information from the two previous years.

PeW ForUM on religion & PUblic liFe
www.pewforum.org
86
SHI.Q.13Were there incidents of hostility over conversions from one religion to another?
baseline year, ending MID-2007
previous year, ending MID-2009
latest year, ending MID-2010
NUMBER OF COUNTRIES
% OF COUNTRIES
NUMBER OF COUNTRIES
% OF COUNTRIES
NUMBER OF COUNTRIES
% OF COUNTRIES
no 153 78% 155 79% 150 76%
Yes, but they fell short of physical violence
23 12 20 10 26 13
Yes, and they included physical violence
21 11 22 11 21 11
197 100 197 100 197 100
the data for each year also takes into account information from the two previous years.