Embed Size (px)
Citation preview
September 2008
Ethan Harris
An “L”-Shaped Recovery
Confidential Presentation
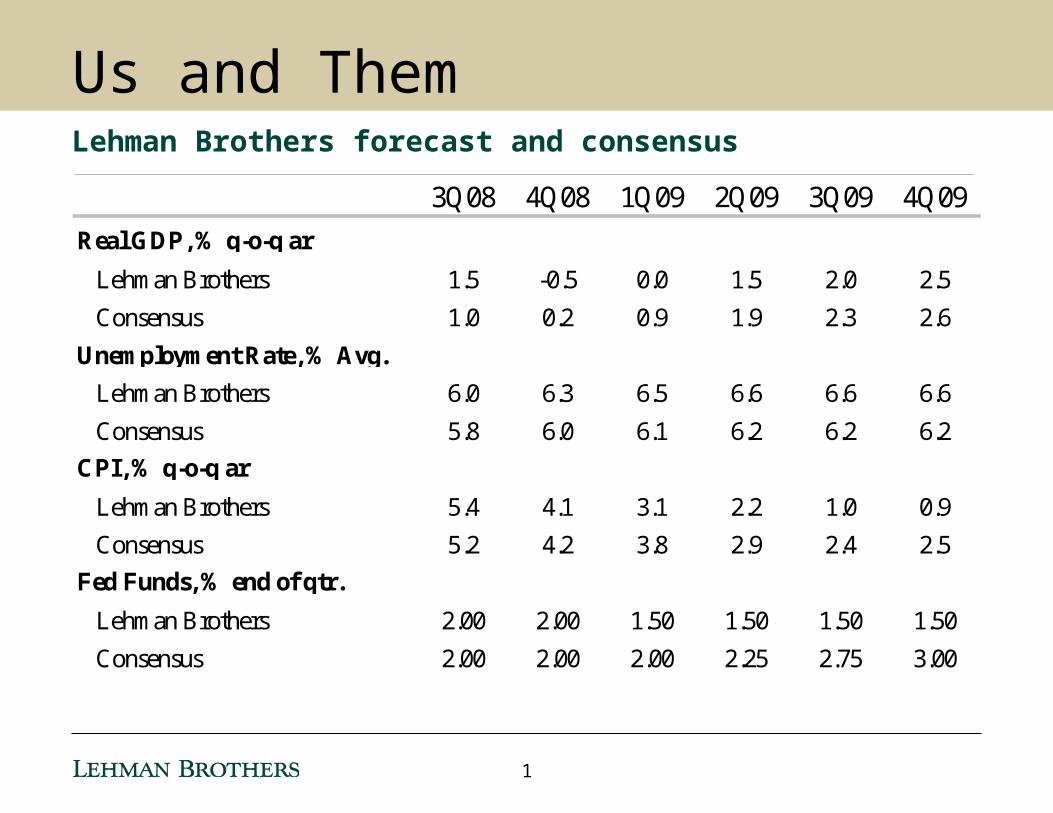
Us and ThemLehman Brothers forecast and consensus
3Q08 4Q08 1Q09 2Q09 3Q09 4Q09
Real GDP, % q-o-q ar
Lehman Brothers 1.5 -0.5 0.0 1.5 2.0 2.5
Consensus 1.0 0.2 0.9 1.9 2.3 2.6
Lehman Brothers 6.0 6.3 6.5 6.6 6.6 6.6
Consensus 5.8 6.0 6.1 6.2 6.2 6.2
CPI, % q-o-q ar
Lehman Brothers 5.4 4.1 3.1 2.2 1.0 0.9
Consensus 5.2 4.2 3.8 2.9 2.4 2.5
Fed Funds, % end of qtr.
Lehman Brothers 2.00 2.00 1.50 1.50 1.50 1.50
Consensus 2.00 2.00 2.00 2.25 2.75 3.00
Unemployment Rate, % Avg.
1
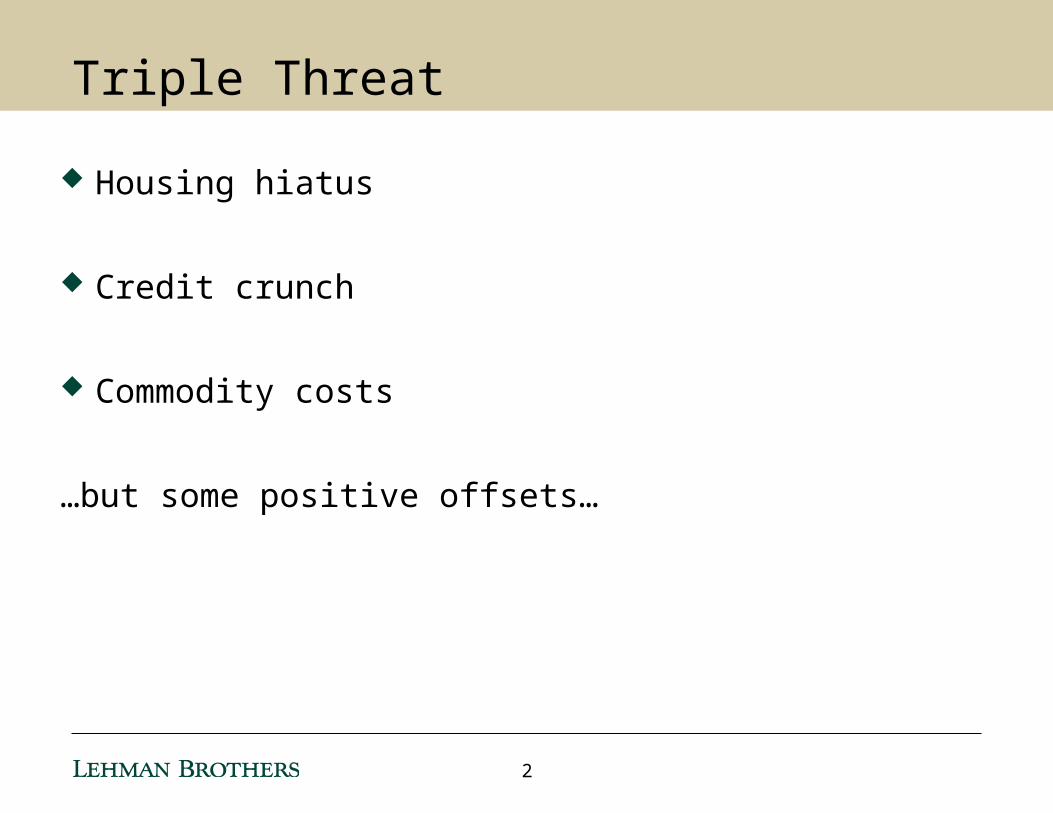
Triple Threat
Housing hiatus
Credit crunch
Commodity costs
…but some positive offsets…
2
0.10
0.20
0.30
0.40
0.50
0.60
Mar-95 Mar-97 Mar-99 Mar-01 Mar-03 Mar-05 Mar-07 Mar-09
m, ar
0.2
0.4
0.6
0.8
1.0
1.2
1.4
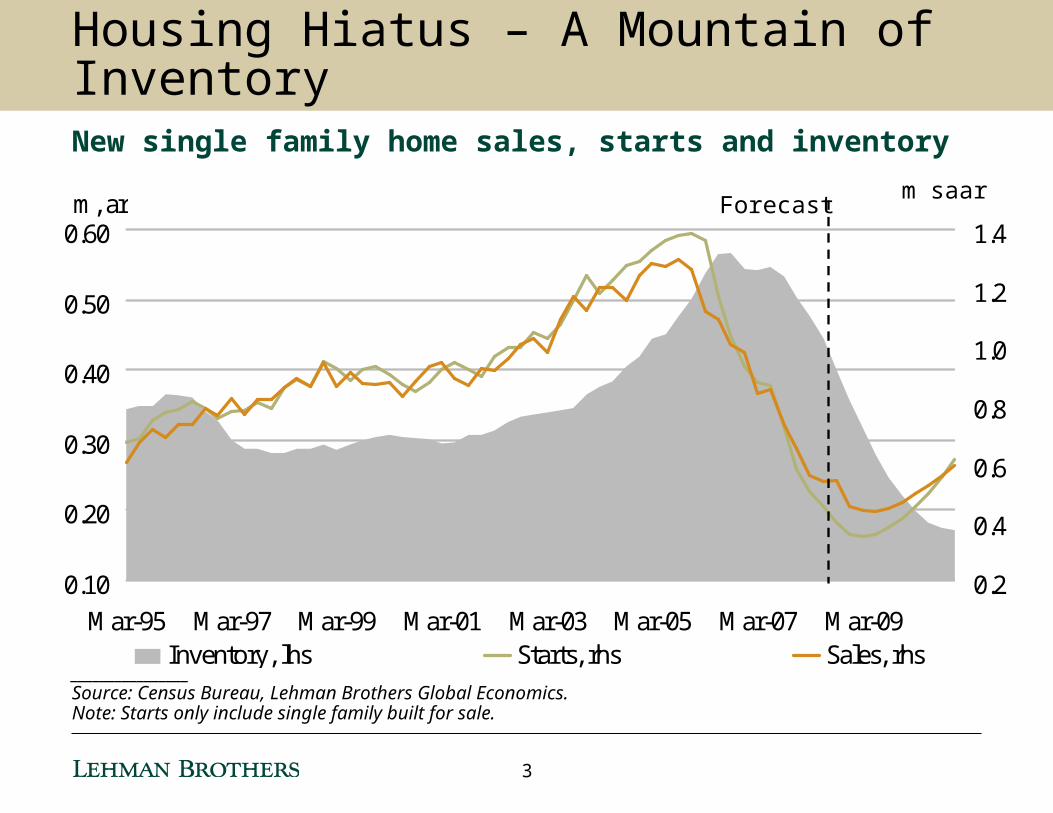
Inventory, lhs Starts, rhs Sales, rhs
m saar
________________Source: Census Bureau, Lehman Brothers Global Economics.Note: Starts only include single family built for sale.
Forecast
Housing Hiatus – A Mountain of InventoryNew single family home sales, starts and inventory
3
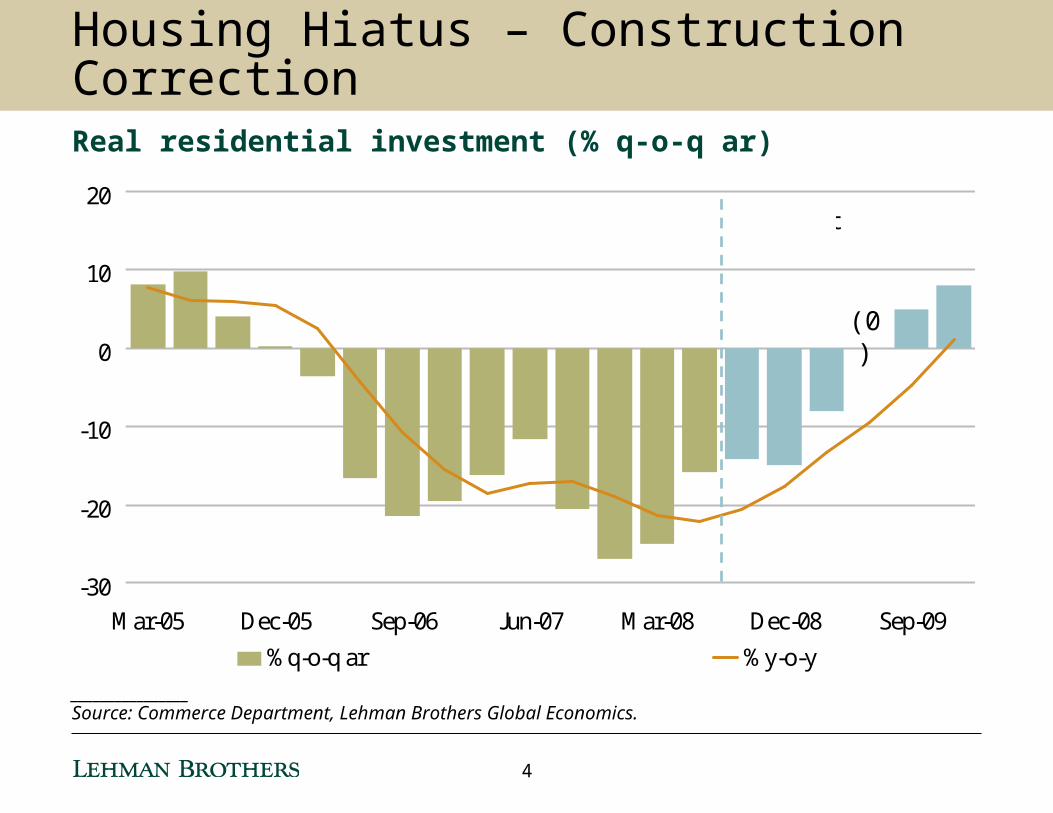
________________Source: Commerce Department, Lehman Brothers Global Economics.
-30
-20
-10
0
10
20
Mar-05 Dec-05 Sep-06 Jun-07 Mar-08 Dec-08 Sep-09
%q-o-q ar %y-o-y
Forecast
Housing Hiatus – Construction CorrectionReal residential investment (% q-o-q ar)
(0)
4
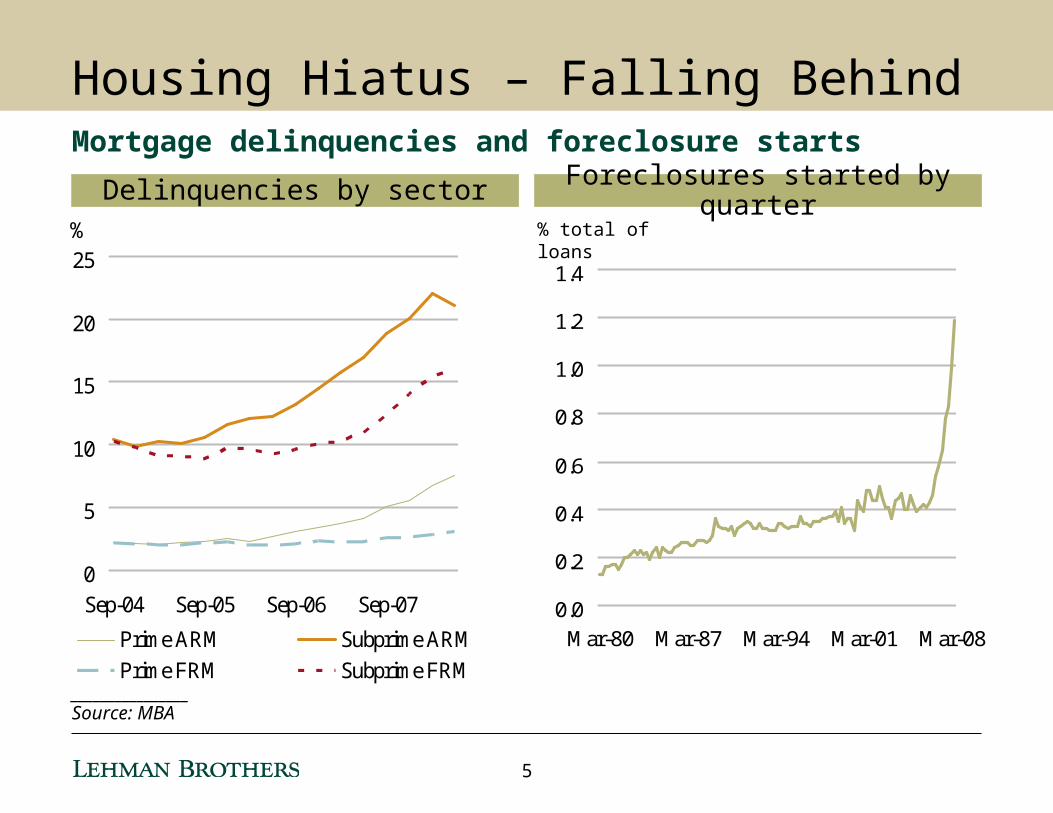
Housing Hiatus – Falling BehindMortgage delinquencies and foreclosure starts
Delinquencies by sector
0
5
10
15
20
25
Sep-04 Sep-05 Sep-06 Sep-07
%
Prime ARM Subprime ARM
Prime FRM Subprime FRM
Foreclosures started by quarter% total of loans
0.0
0.2
0.4
0.6
0.8
1.0
1.2
1.4
Mar-80 Mar-87 Mar-94 Mar-01 Mar-08
________________Source: MBA
5
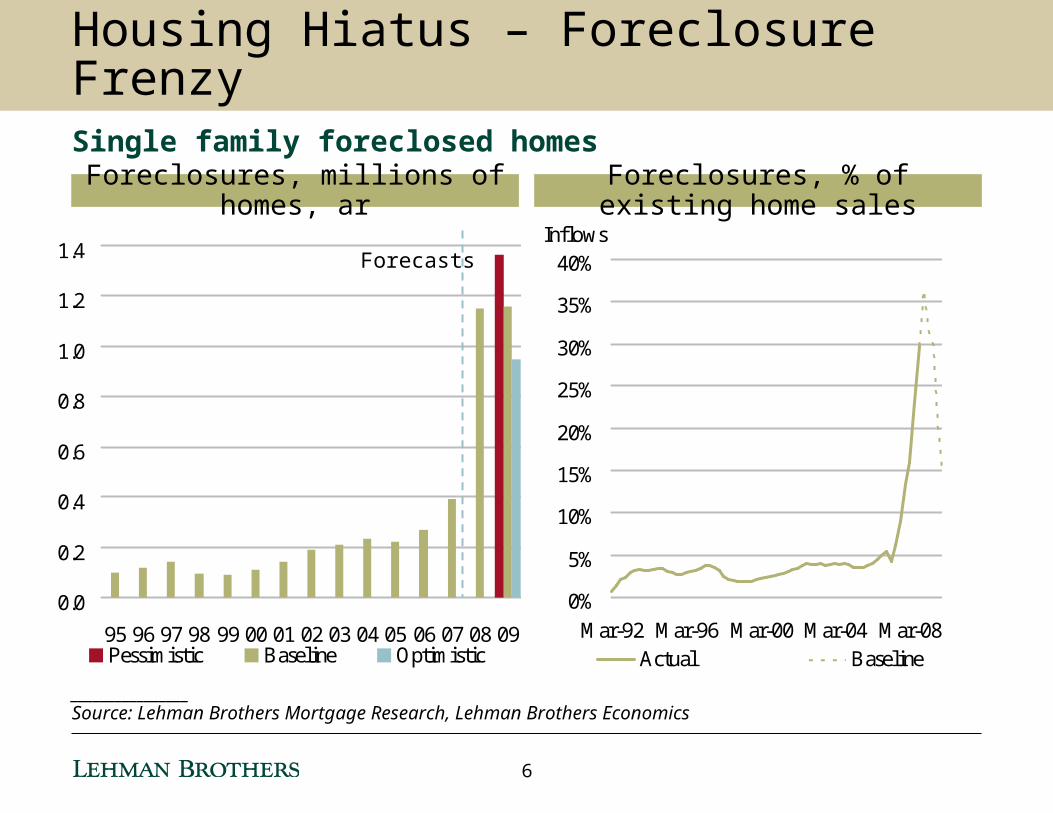
Housing Hiatus – Foreclosure FrenzySingle family foreclosed homes
Foreclosures, millions of homes, ar
0.0
0.2
0.4
0.6
0.8
1.0
1.2
1.4
95 96 97 98 99 00 01 02 03 04 05 06 07 08 09Pessimistic Baseline Optimistic
0%
5%
10%
15%
20%
25%
30%
35%
40%
Mar-92 Mar-96 Mar-00 Mar-04 Mar-08
Inflows
Actual Baseline
Foreclosures, % of existing home sales
________________Source: Lehman Brothers Mortgage Research, Lehman Brothers Economics
Forecasts
6
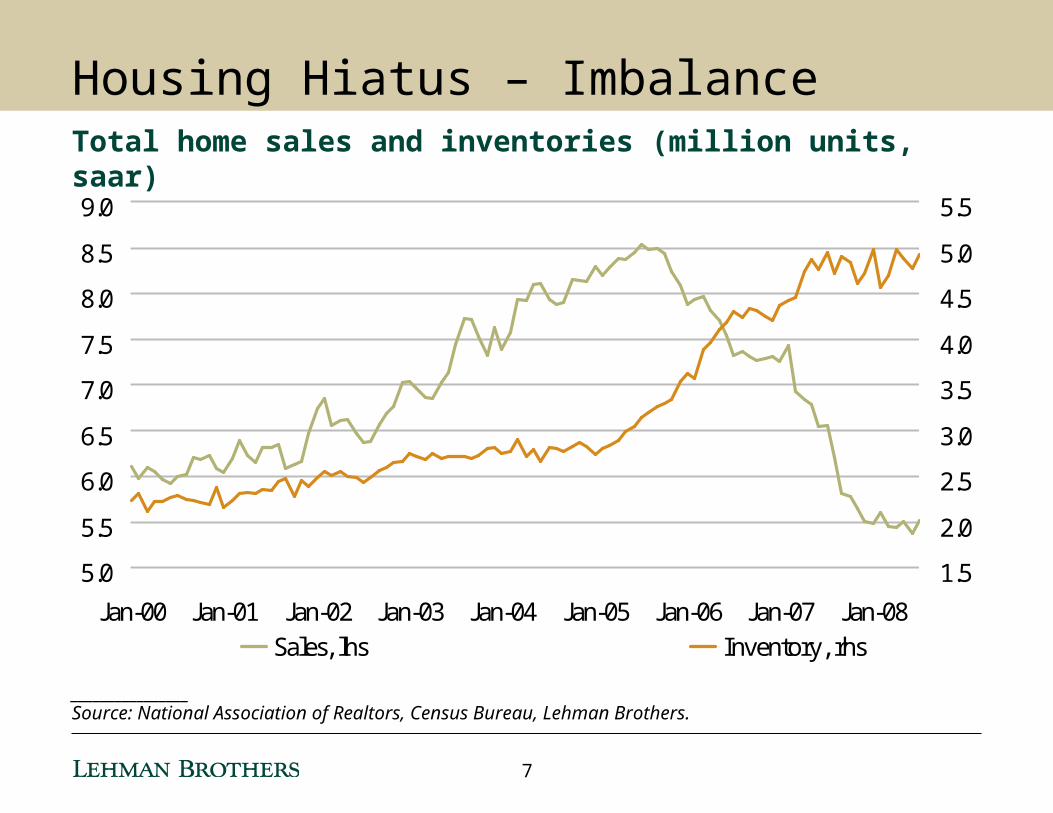
________________Source: National Association of Realtors, Census Bureau, Lehman Brothers.
5.0
5.5
6.0
6.5
7.0
7.5
8.0
8.5
9.0
Jan-00 Jan-01 Jan-02 Jan-03 Jan-04 Jan-05 Jan-06 Jan-07 Jan-08
1.5
2.0
2.5
3.0
3.5
4.0
4.5
5.0
5.5
Sales, lhs Inventory, rhs
Housing Hiatus – ImbalanceTotal home sales and inventories (million units, saar)
7
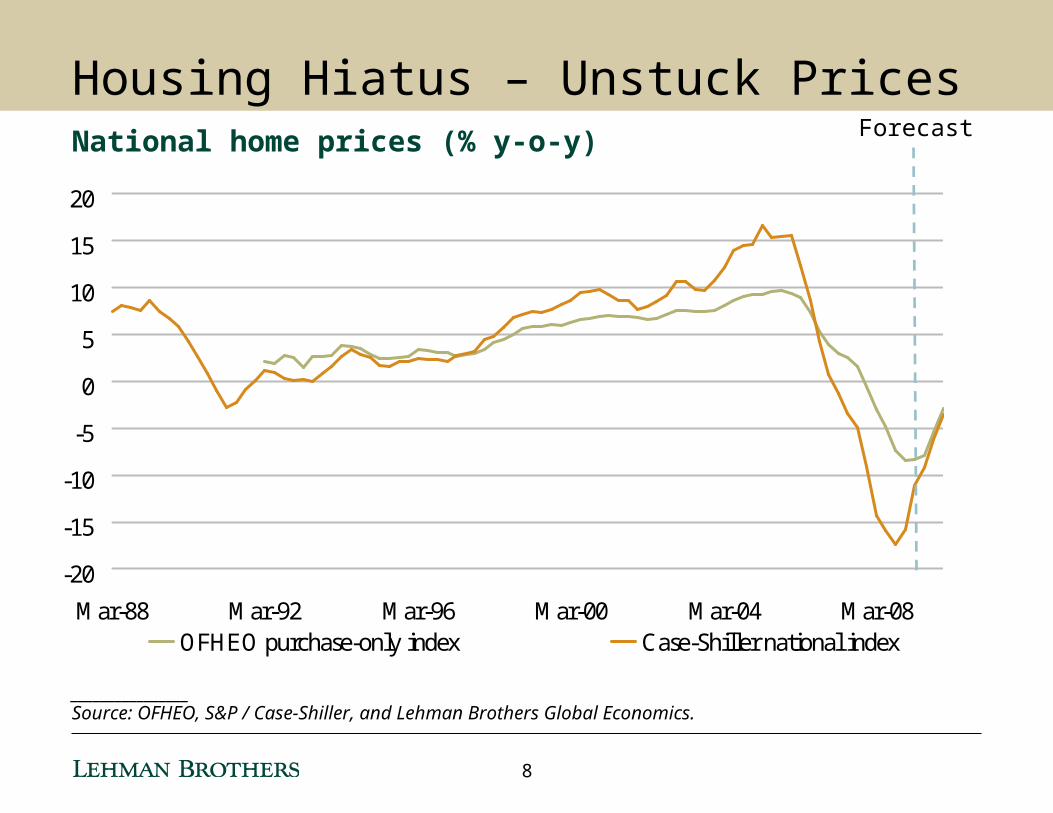
________________Source: OFHEO, S&P / Case-Shiller, and Lehman Brothers Global Economics.
Housing Hiatus – Unstuck PricesNational home prices (% y-o-y)
-20
-15
-10
-5
0
5
10
15
20
Mar-88 Mar-92 Mar-96 Mar-00 Mar-04 Mar-08
OFHEO purchase-only index Case-Shiller national index
Forecast
8
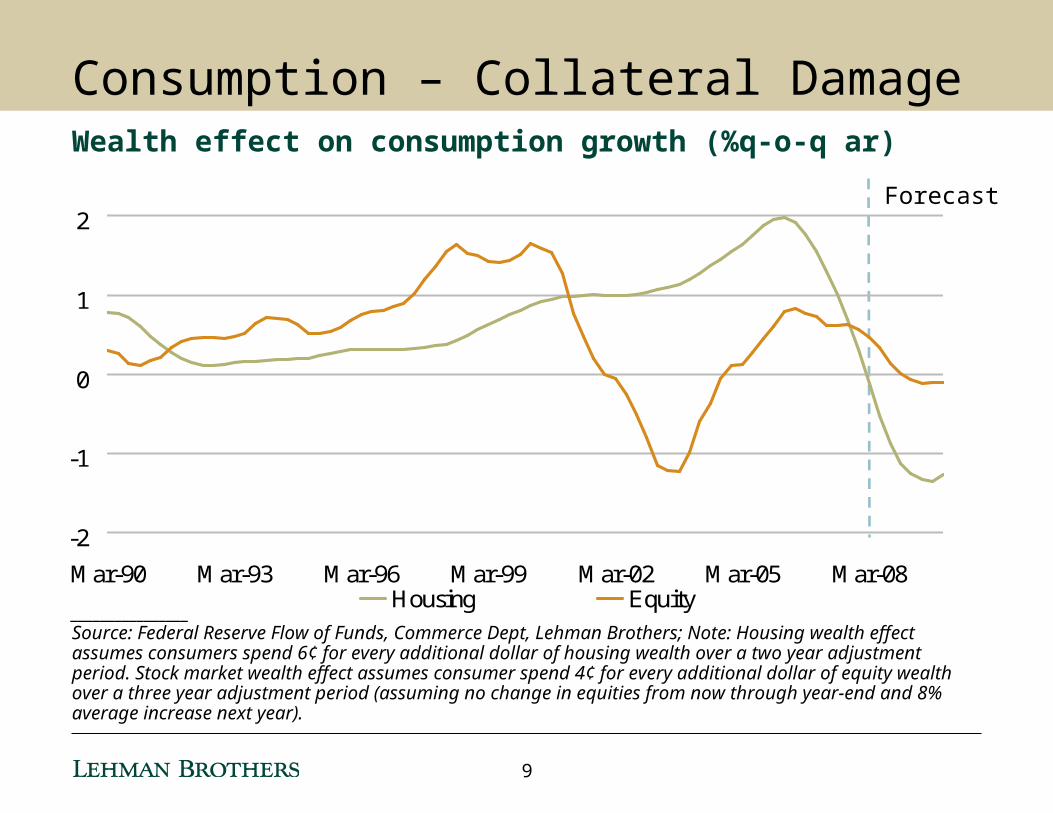
________________Source: Federal Reserve Flow of Funds, Commerce Dept, Lehman Brothers; Note: Housing wealth effect assumes consumers spend 6¢ for every additional dollar of housing wealth over a two year adjustment period. Stock market wealth effect assumes consumer spend 4¢ for every additional dollar of equity wealth over a three year adjustment period (assuming no change in equities from now through year-end and 8% average increase next year).
Forecast
Consumption – Collateral DamageWealth effect on consumption growth (%q-o-q ar)
-2
-1
0
1
2
Mar-90 Mar-93 Mar-96 Mar-99 Mar-02 Mar-05 Mar-08Housing Equity
9
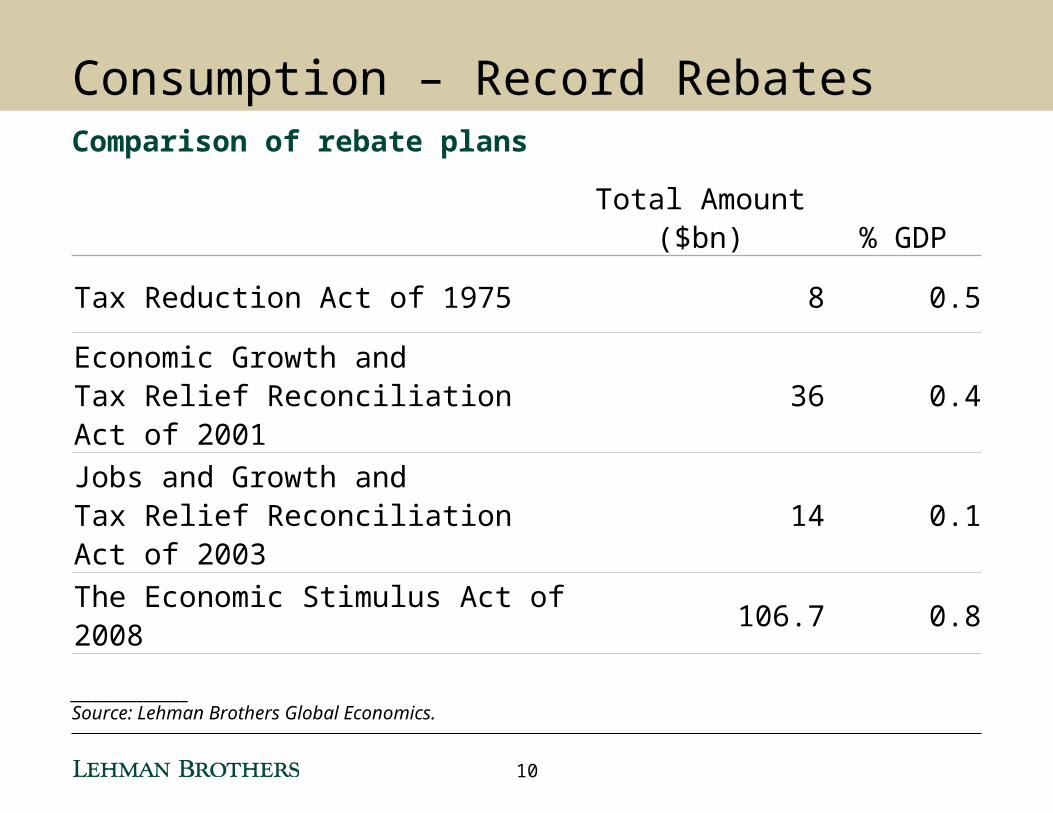
________________Source: Lehman Brothers Global Economics.
Consumption – Record RebatesComparison of rebate plans
Total Amount ($bn) % GDP
Tax Reduction Act of 1975 8 0.5
Economic Growth andTax Relief Reconciliation Act of 2001
36 0.4
Jobs and Growth andTax Relief Reconciliation Act of 2003
14 0.1
The Economic Stimulus Act of 2008 106.7 0.8
10
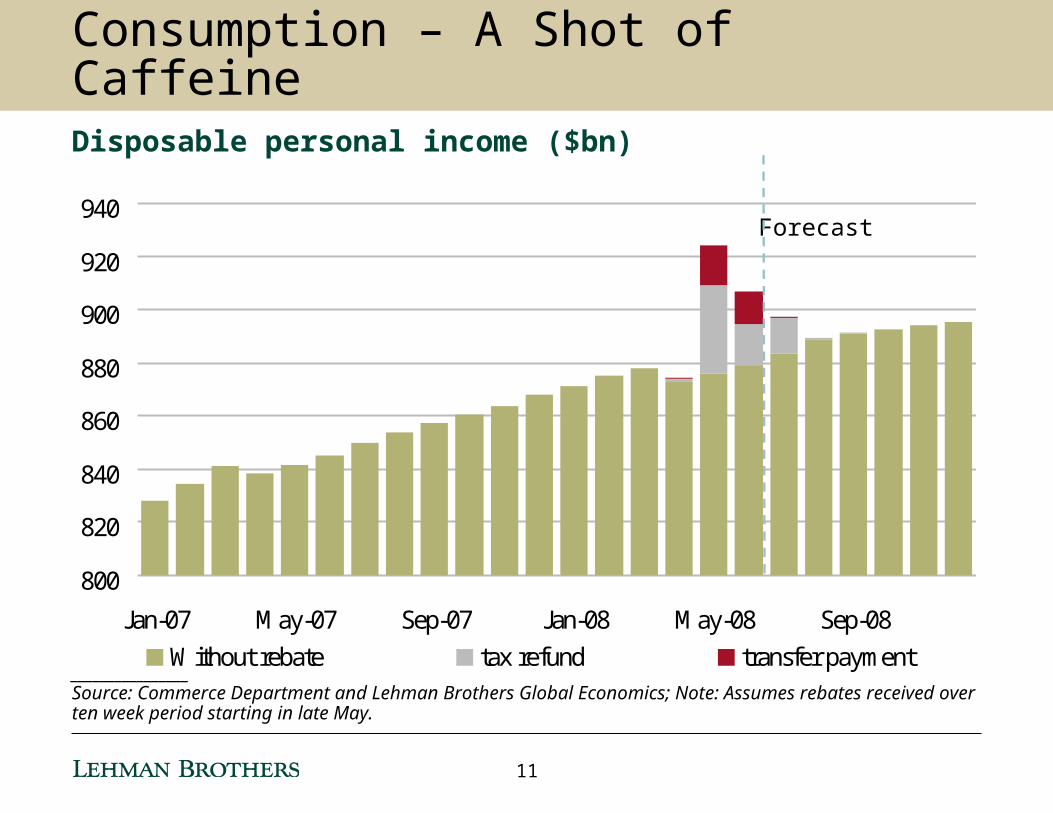
800
820
840
860
880
900
920
940
Jan-07 May-07 Sep-07 Jan-08 May-08 Sep-08
Without rebate tax refund transfer payment
Forecast
________________Source: Commerce Department and Lehman Brothers Global Economics; Note: Assumes rebates received over ten week period starting in late May.
Consumption – A Shot of CaffeineDisposable personal income ($bn)
11
________________Source: BEA and Lehman Brothers Global Economics.
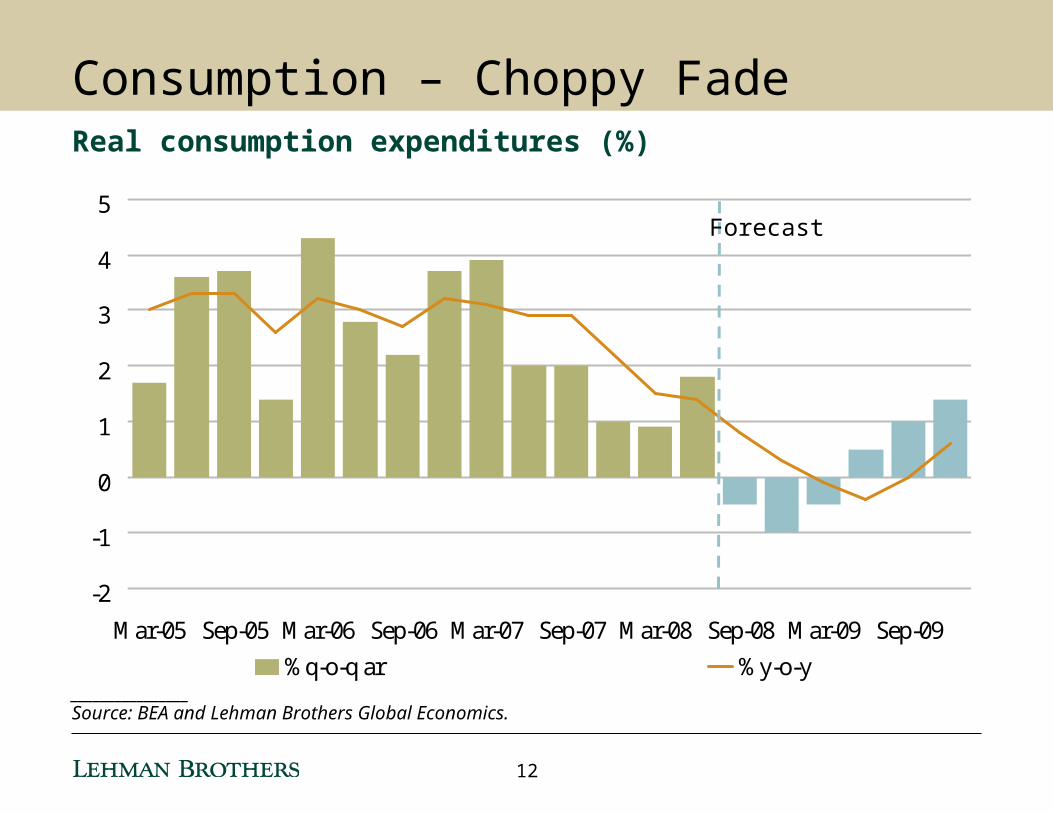
-2
-1
0
1
2
3
4
5
Mar-05 Sep-05 Mar-06 Sep-06 Mar-07 Sep-07 Mar-08 Sep-08 Mar-09 Sep-09
%q-o-q ar %y-o-y
Forecast
Consumption – Choppy FadeReal consumption expenditures (%)
12
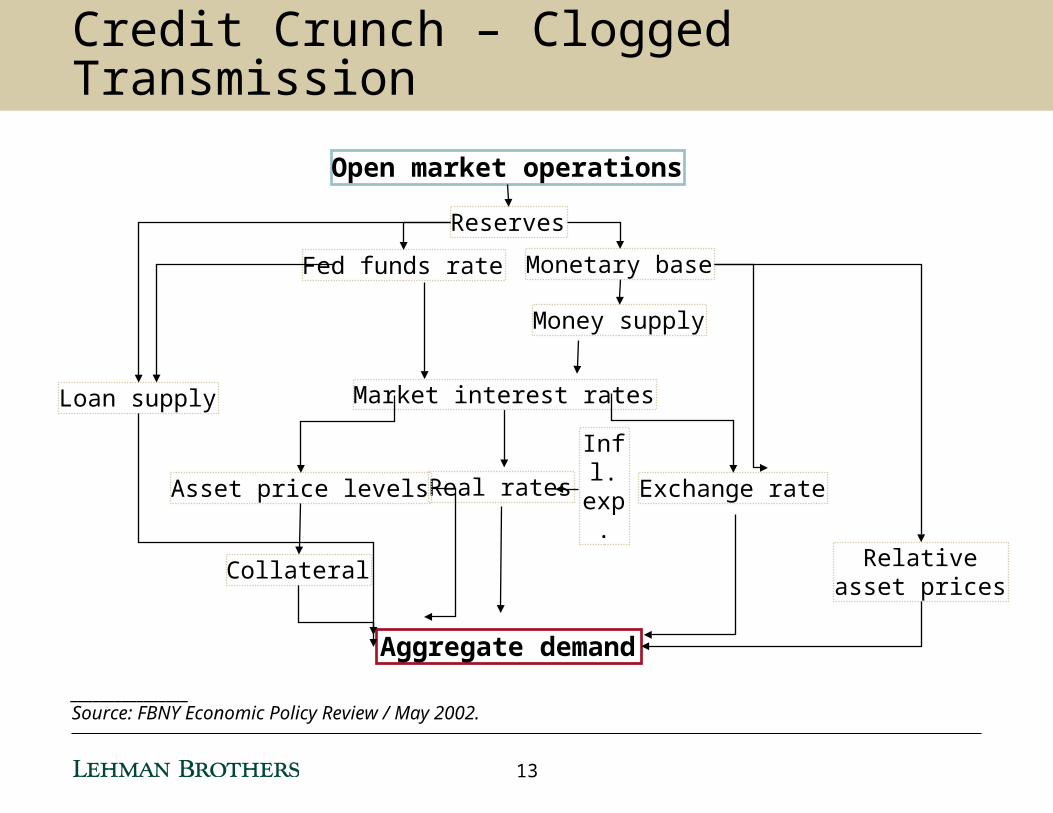
Credit Crunch – Clogged Transmission
________________Source: FBNY Economic Policy Review / May 2002.
Fed funds rate
Open market operations
Reserves
Monetary base
Money supply
Market interest rates
Exchange rateReal ratesAsset price levels
Loan supply
Infl. exp.
Collateral Relativeasset prices
Aggregate demand
13
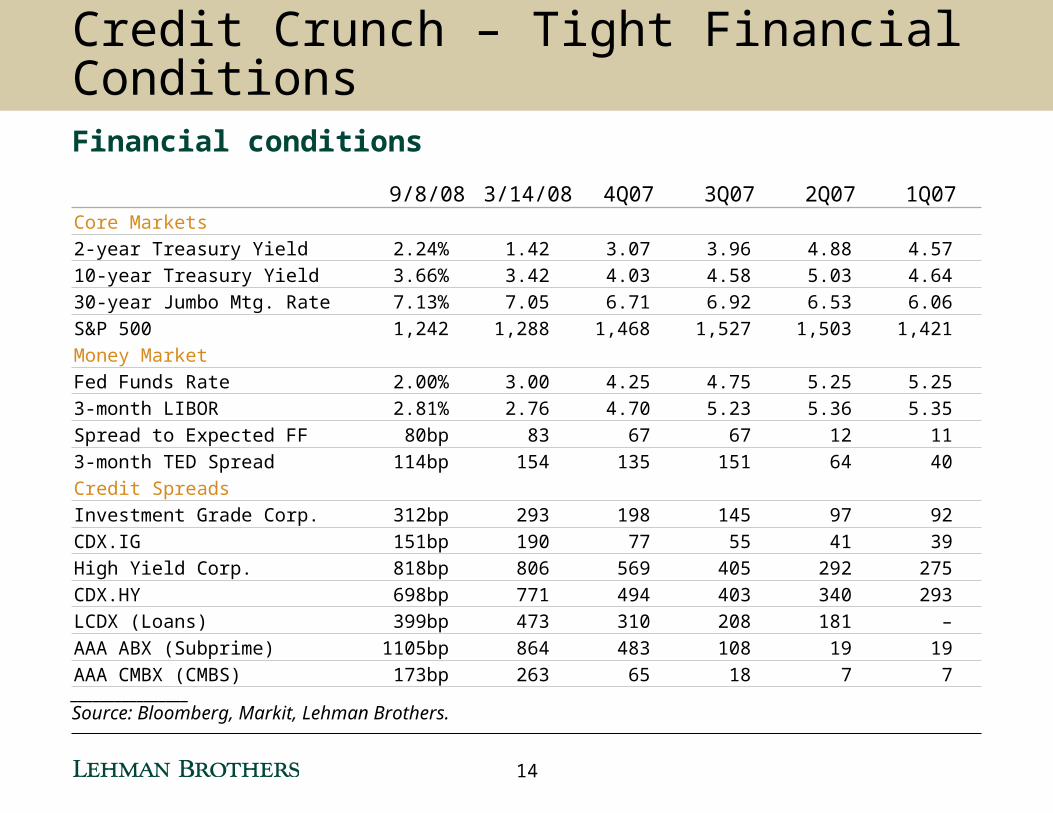
________________Source: Bloomberg, Markit, Lehman Brothers.
Credit Crunch – Tight Financial ConditionsFinancial conditions
9/8/08 3/14/08 4Q07 3Q07 2Q07 1Q07Core Markets
2-year Treasury Yield 2.24% 1.42 3.07 3.96 4.88 4.57
10-year Treasury Yield 3.66% 3.42 4.03 4.58 5.03 4.64
30-year Jumbo Mtg. Rate 7.13% 7.05 6.71 6.92 6.53 6.06
S&P 500 1,242 1,288 1,468 1,527 1,503 1,421
Money Market
Fed Funds Rate 2.00% 3.00 4.25 4.75 5.25 5.25
3-month LIBOR 2.81% 2.76 4.70 5.23 5.36 5.35
Spread to Expected FF 80bp 83 67 67 12 11
3-month TED Spread 114bp 154 135 151 64 40
Credit Spreads
Investment Grade Corp. 312bp 293 198 145 97 92
CDX.IG 151bp 190 77 55 41 39
High Yield Corp. 818bp 806 569 405 292 275
CDX.HY 698bp 771 494 403 340 293
LCDX (Loans) 399bp 473 310 208 181 –
AAA ABX (Subprime) 1105bp 864 483 108 19 19
AAA CMBX (CMBS) 173bp 263 65 18 7 7
14
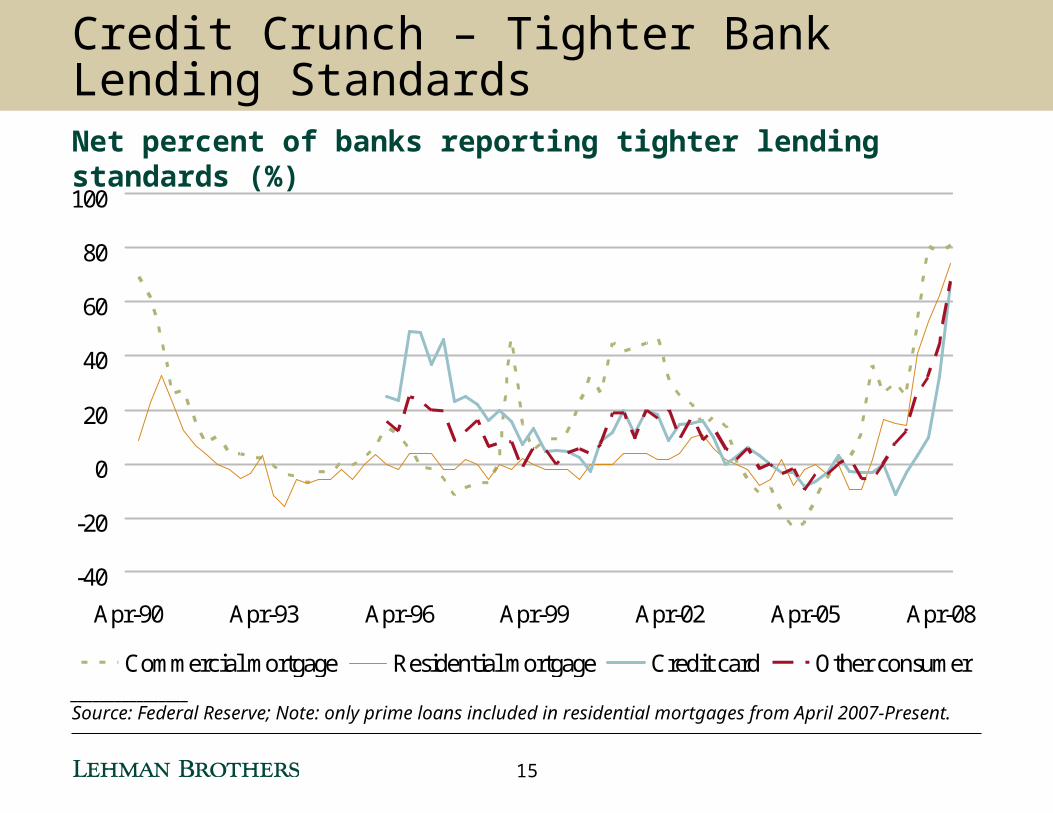
Credit Crunch – Tighter Bank Lending Standards
-40
-20
0
20
40
60
80
100
Apr-90 Apr-93 Apr-96 Apr-99 Apr-02 Apr-05 Apr-08
Commercial mortgage Residential mortgage Credit card Other consumer________________Source: Federal Reserve; Note: only prime loans included in residential mortgages from April 2007-Present.
Net percent of banks reporting tighter lending standards (%)
15
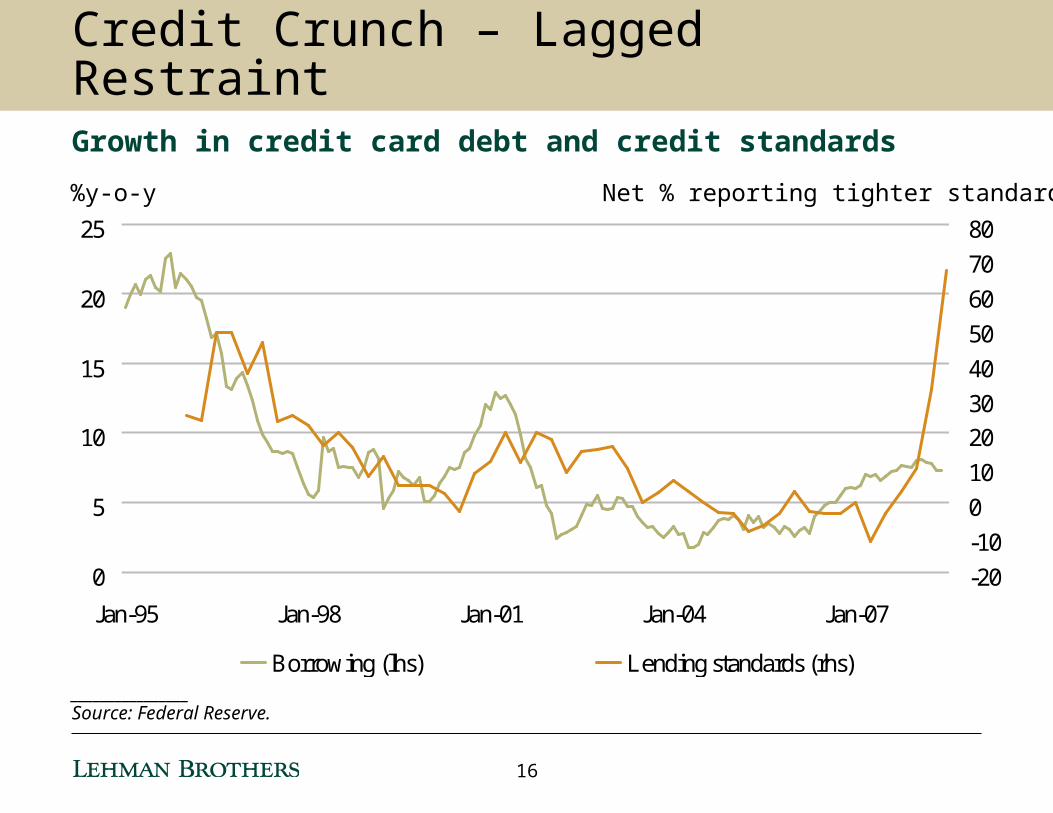
Credit Crunch – Lagged RestraintGrowth in credit card debt and credit standards
0
5
10
15
20
25
Jan-95 Jan-98 Jan-01 Jan-04 Jan-07
-20
-10
0
10
20
30
40
50
60
70
80
Borrowing (lhs) Lending standards (rhs)
%y-o-y Net % reporting tighter standards
________________Source: Federal Reserve.
16
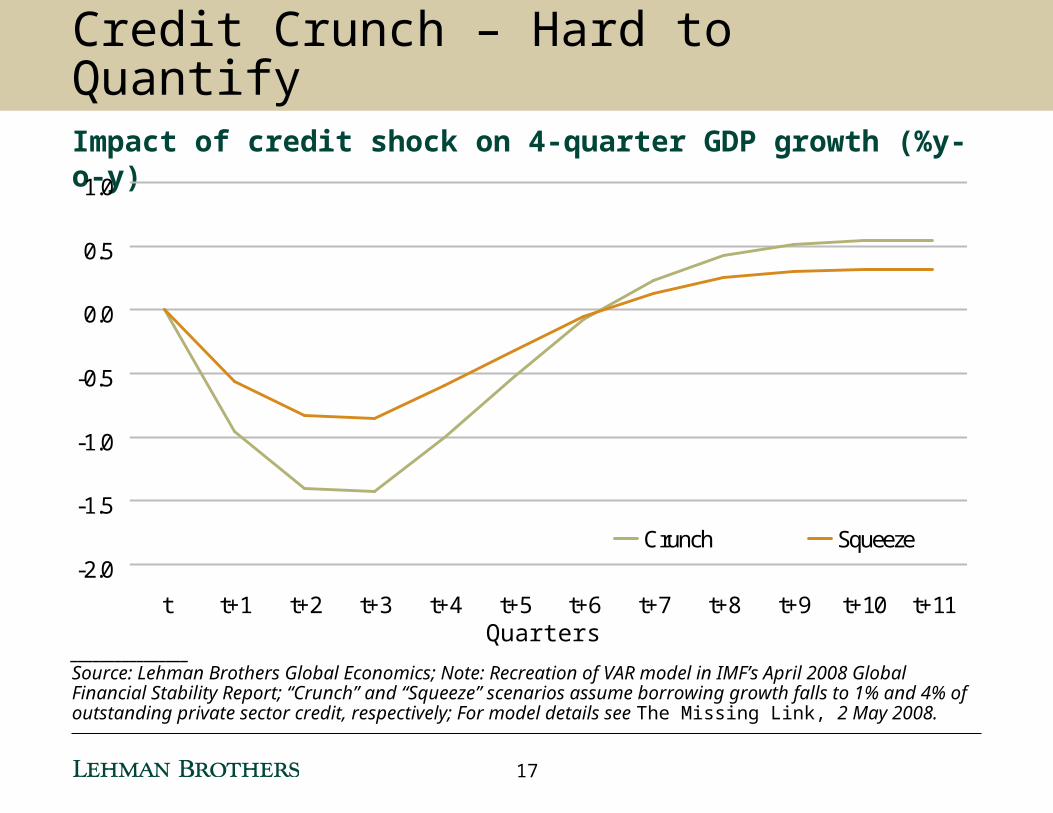
Credit Crunch – Hard to QuantifyImpact of credit shock on 4-quarter GDP growth (%y-o-y)
-2.0
-1.5
-1.0
-0.5
0.0
0.5
1.0
t t+1 t+2 t+3 t+4 t+5 t+6 t+7 t+8 t+9 t+10 t+11
Crunch Squeeze
Quarters________________Source: Lehman Brothers Global Economics; Note: Recreation of VAR model in IMF’s April 2008 Global Financial Stability Report; “Crunch” and “Squeeze” scenarios assume borrowing growth falls to 1% and 4% of outstanding private sector credit, respectively; For model details see The Missing Link, 2 May 2008.
17
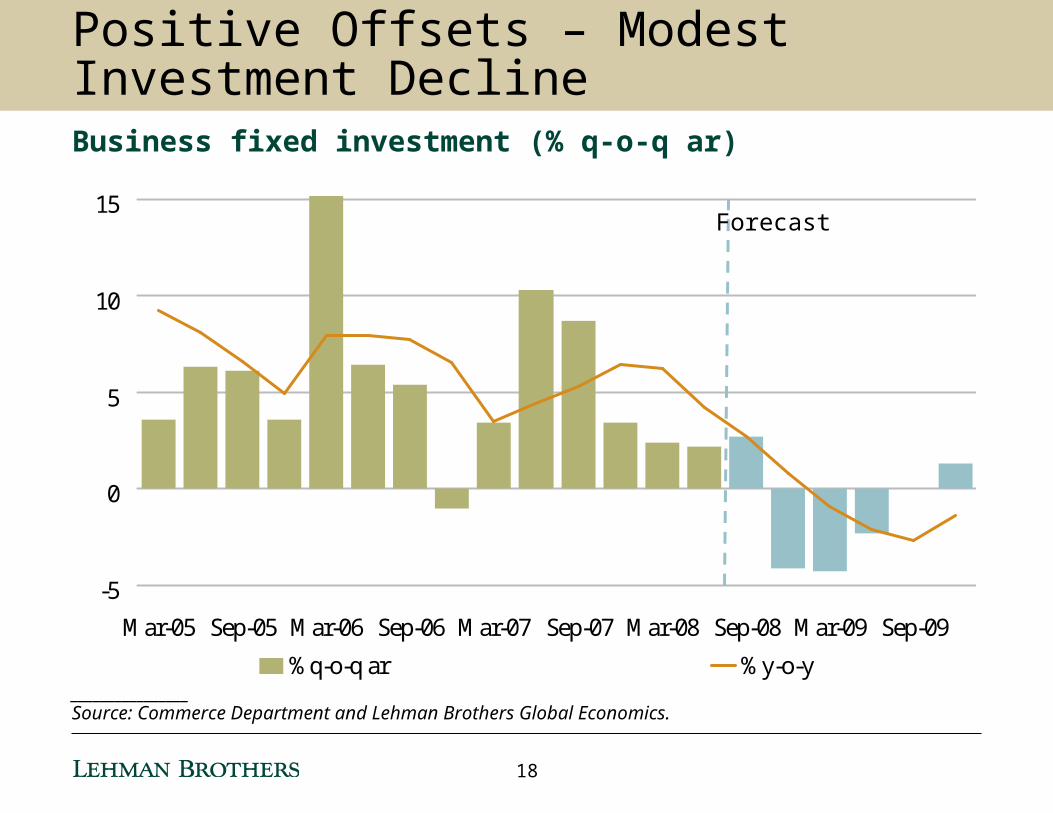
________________Source: Commerce Department and Lehman Brothers Global Economics.
-5
0
5
10
15
Mar-05 Sep-05 Mar-06 Sep-06 Mar-07 Sep-07 Mar-08 Sep-08 Mar-09 Sep-09
%q-o-q ar %y-o-y
Forecast
Positive Offsets – Modest Investment DeclineBusiness fixed investment (% q-o-q ar)
18
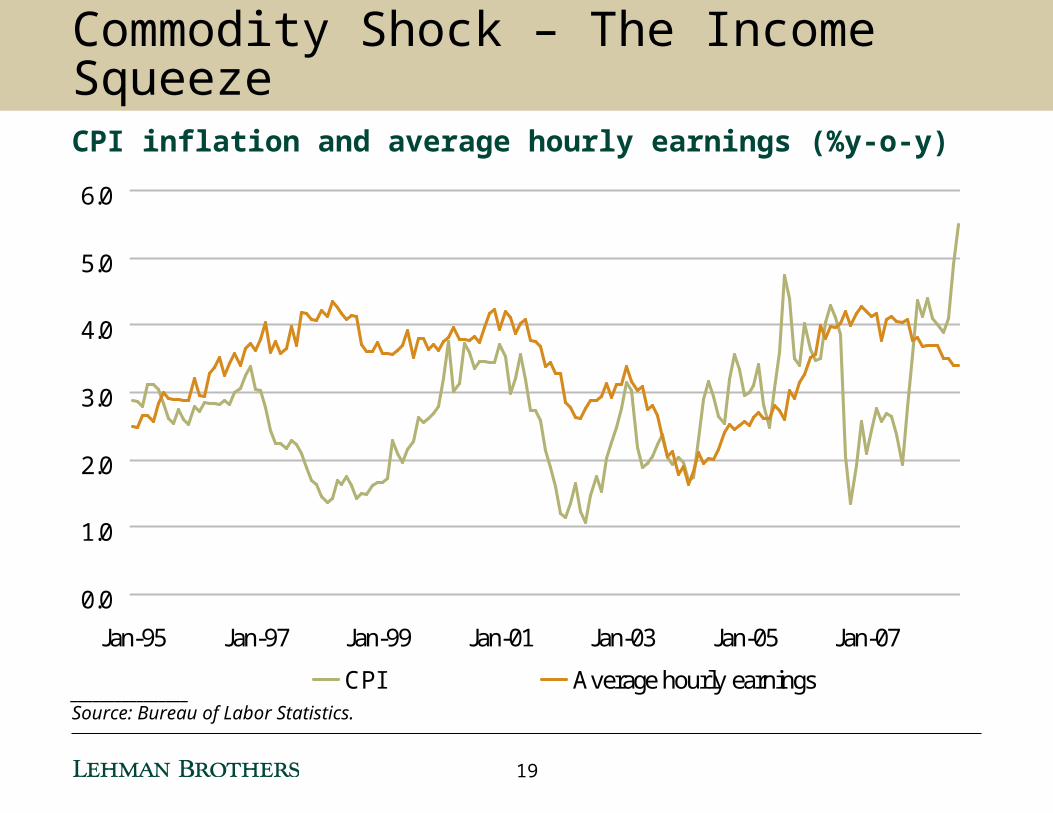
Commodity Shock – The Income SqueezeCPI inflation and average hourly earnings (%y-o-y)
0.0
1.0
2.0
3.0
4.0
5.0
6.0
Jan-95 Jan-97 Jan-99 Jan-01 Jan-03 Jan-05 Jan-07
CPI Average hourly earnings________________Source: Bureau of Labor Statistics.
19
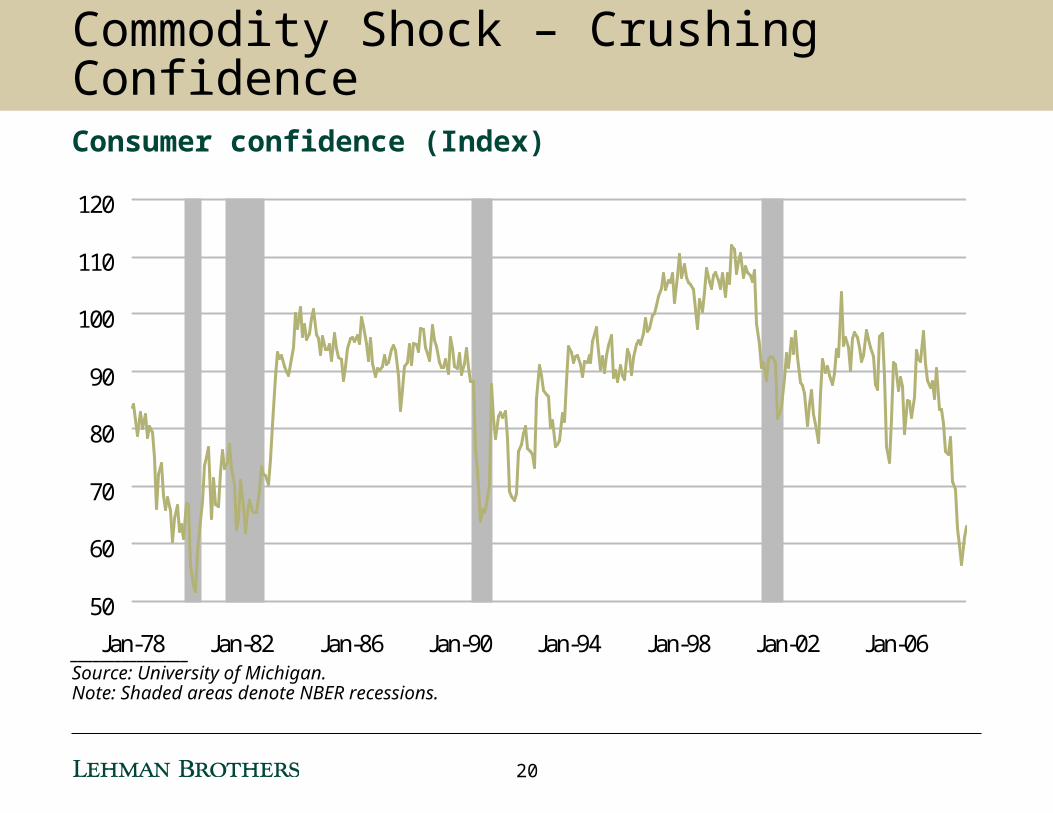
Commodity Shock – Crushing ConfidenceConsumer confidence (Index)
________________Source: University of Michigan.Note: Shaded areas denote NBER recessions.
50
60
70
80
90
100
110
120
Jan-78 Jan-82 Jan-86 Jan-90 Jan-94 Jan-98 Jan-02 Jan-06
20
-15
-10
-5
0
5
10
15
Mar-85 Mar-88 Mar-91 Mar-94 Mar-97 Mar-00 Mar-03 Mar-06 Mar-09
-4
-2
0
2
4
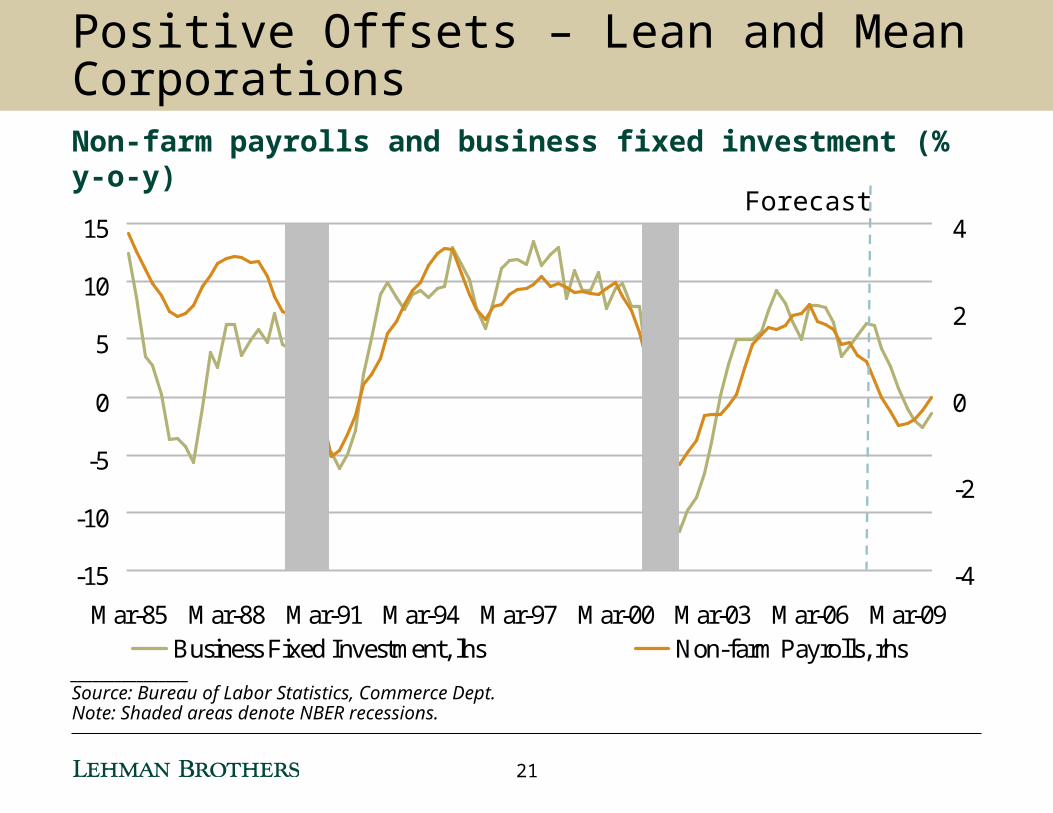
Business Fixed Investment, lhs Non-farm Payrolls, rhs________________Source: Bureau of Labor Statistics, Commerce Dept.Note: Shaded areas denote NBER recessions.
Forecast
Positive Offsets – Lean and Mean CorporationsNon-farm payrolls and business fixed investment (% y-o-y)
21
-200
-100
0
100
200
300
400
Jan-04 Jan-05 Jan-06 Jan-07 Jan-08 Jan-09
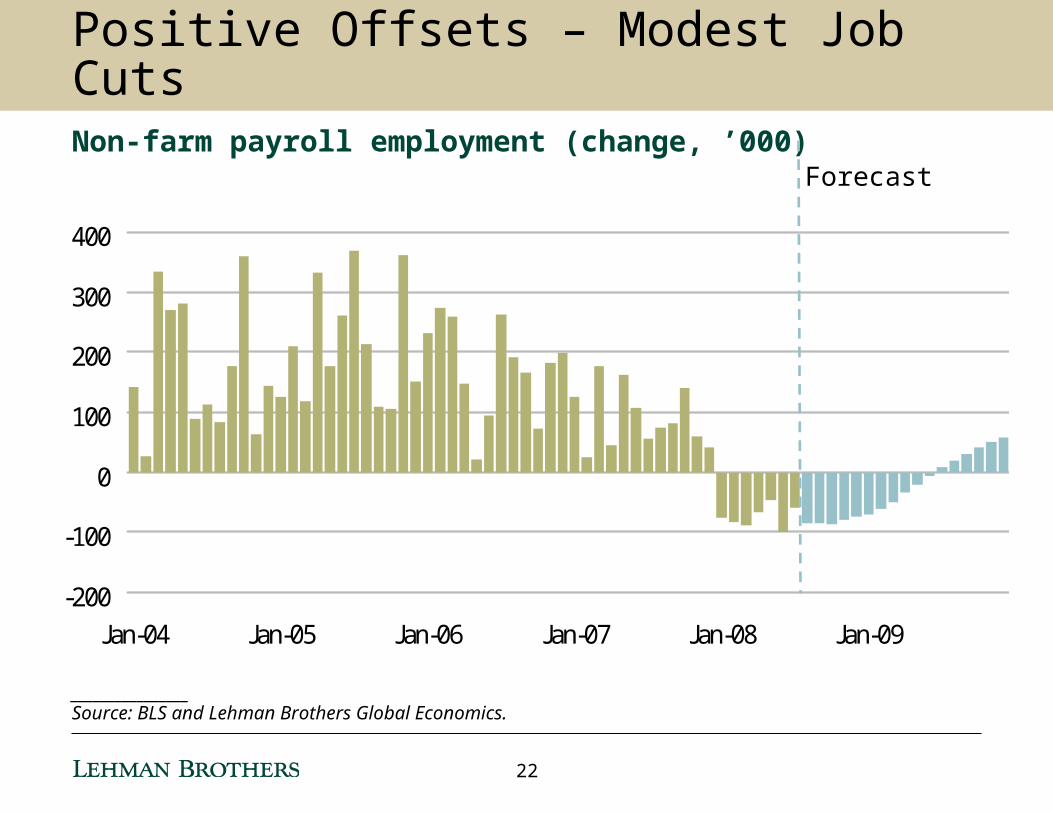
________________Source: BLS and Lehman Brothers Global Economics.
Forecast
Positive Offsets – Modest Job CutsNon-farm payroll employment (change, ’000)
22
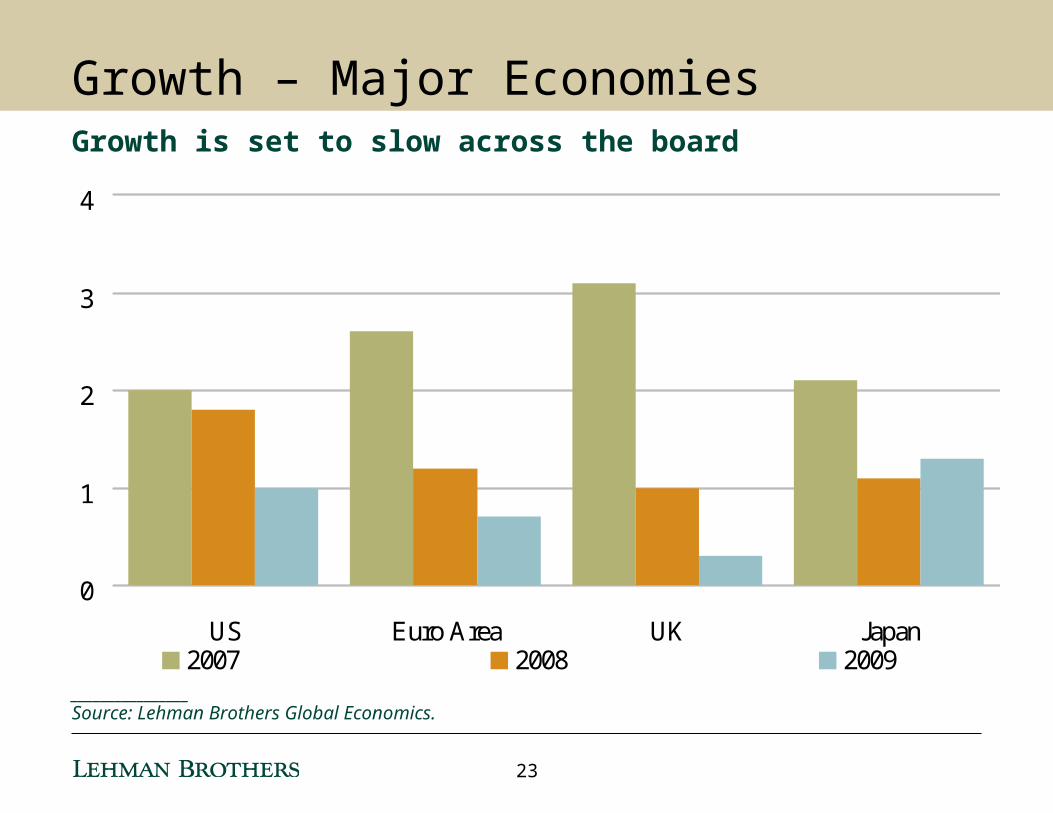
Growth – Major EconomiesGrowth is set to slow across the board
0
1
2
3
4
US Euro Area UK Japan2007 2008 2009
________________Source: Lehman Brothers Global Economics.
23
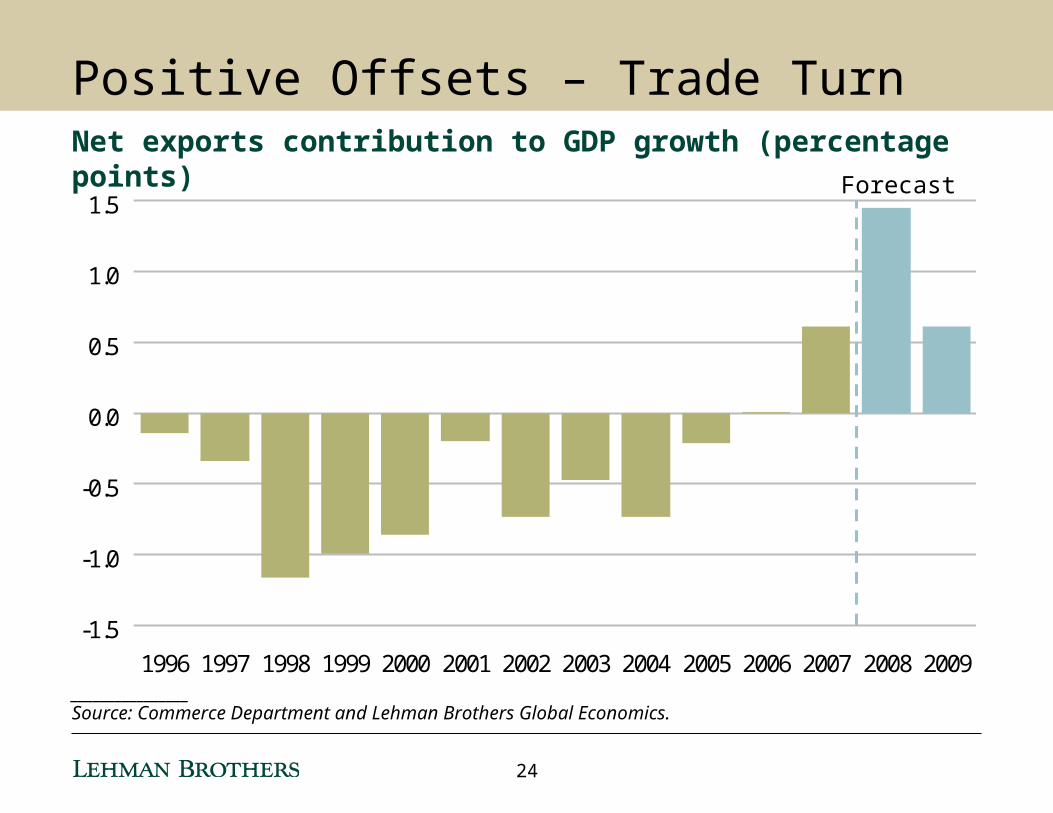
-1.5
-1.0
-0.5
0.0
0.5
1.0
1.5
1996 1997 1998 1999 2000 2001 2002 2003 2004 2005 2006 2007 2008 2009________________Source: Commerce Department and Lehman Brothers Global Economics.
Forecast
Positive Offsets – Trade TurnNet exports contribution to GDP growth (percentage points)
24
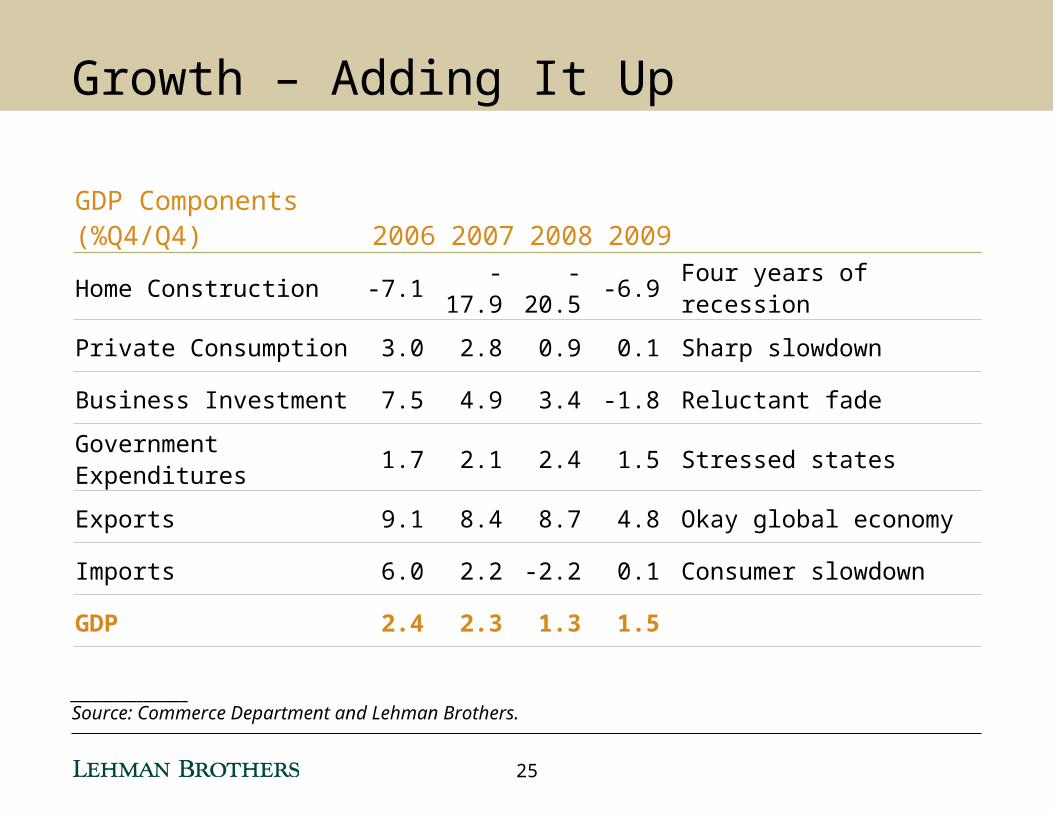
________________Source: Commerce Department and Lehman Brothers.
GDP Components (%Q4/Q4) 2006 2007 2008 2009
Home Construction -7.1 -17.9 -20.5 -6.9 Four years of recession
Private Consumption 3.0 2.8 0.9 0.1 Sharp slowdown
Business Investment 7.5 4.9 3.4 -1.8 Reluctant fade
Government Expenditures 1.7 2.1 2.4 1.5 Stressed states
Exports 9.1 8.4 8.7 4.8 Okay global economy
Imports 6.0 2.2 -2.2 0.1 Consumer slowdown
GDP 2.4 2.3 1.3 1.5
Growth – Adding It Up
25
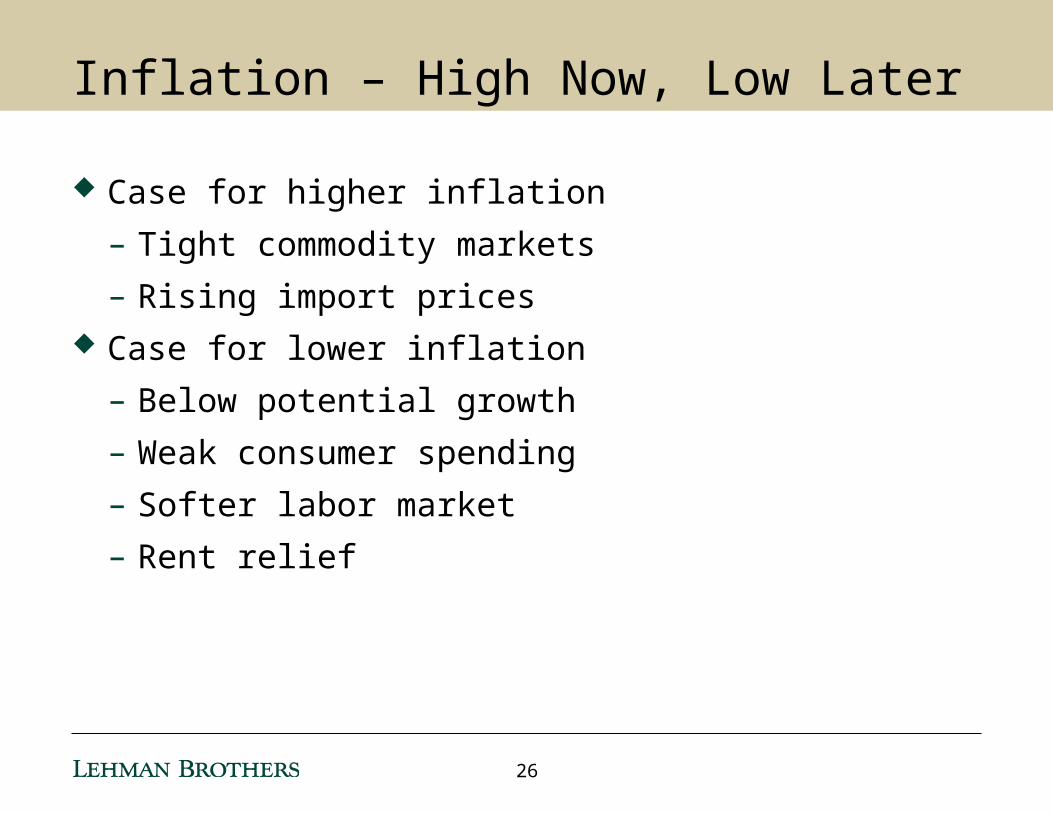
Case for higher inflation
– Tight commodity markets
– Rising import prices Case for lower inflation
– Below potential growth
– Weak consumer spending
– Softer labor market
– Rent relief
Inflation – High Now, Low Later
26
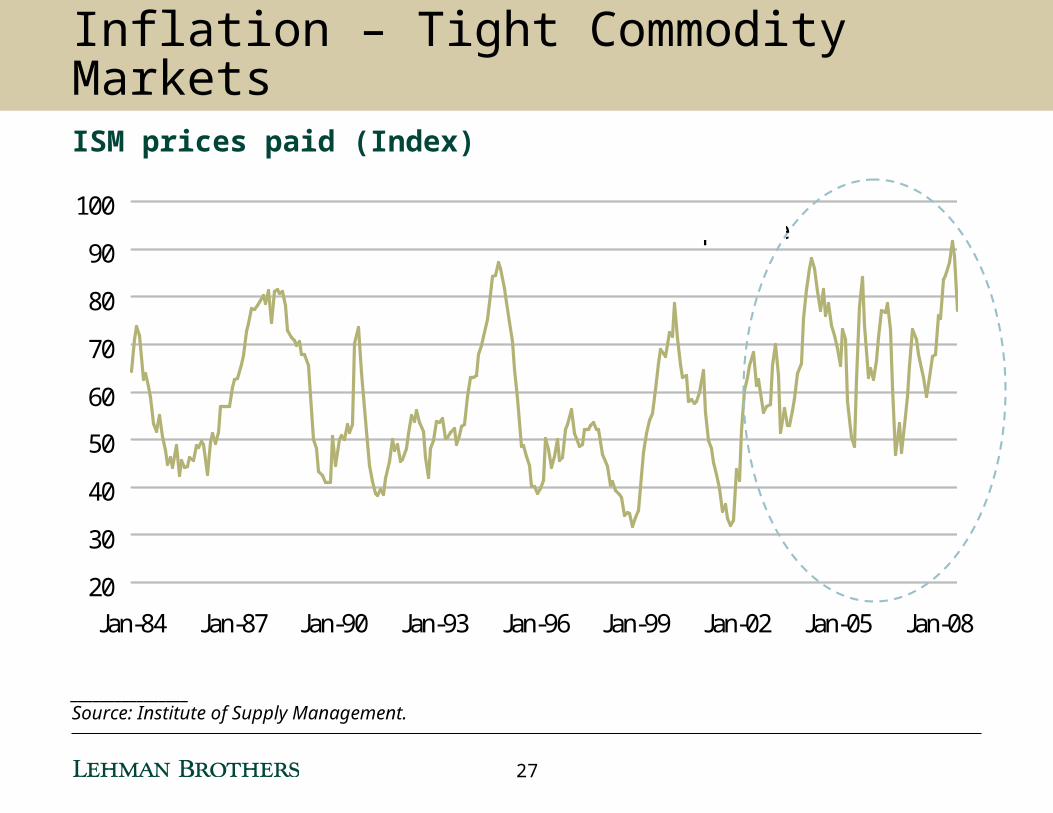
________________Source: Institute of Supply Management.
Inflation – Tight Commodity MarketsISM prices paid (Index)
20
30
40
50
60
70
80
90
100
Jan-84 Jan-87 Jan-90 Jan-93 Jan-96 Jan-99 Jan-02 Jan-05 Jan-08
Cumulative pressure
27
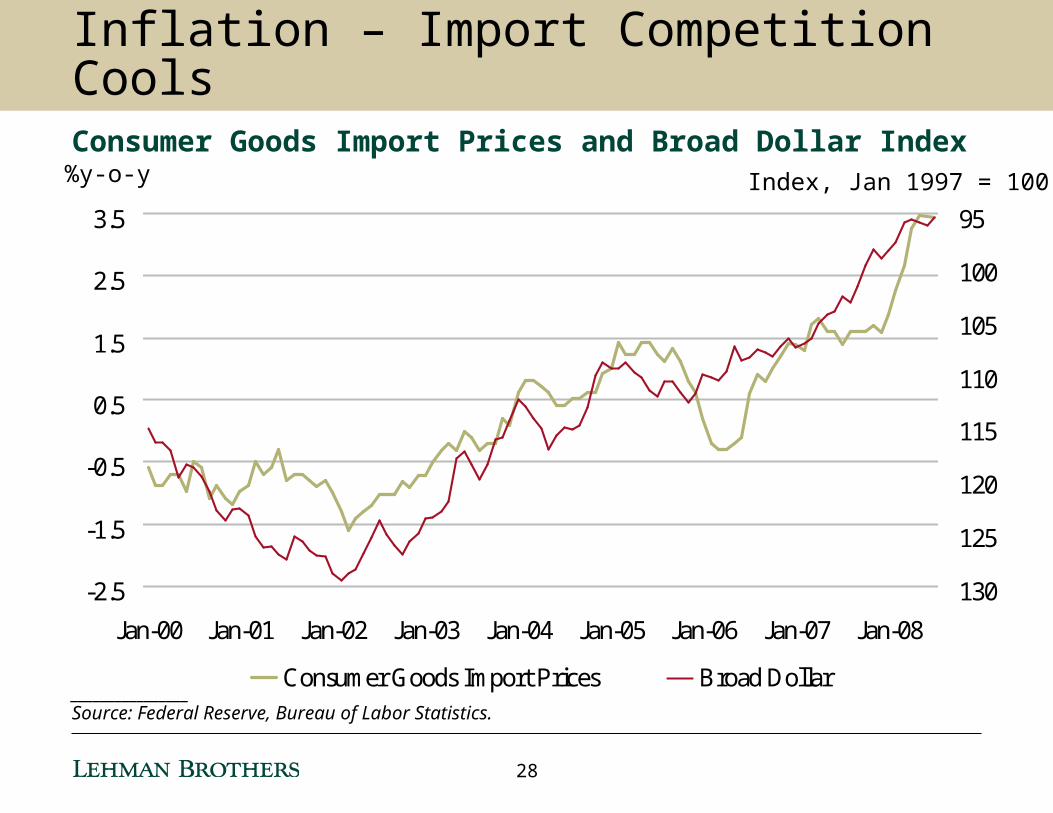
________________Source: Federal Reserve, Bureau of Labor Statistics.
Inflation – Import Competition CoolsConsumer Goods Import Prices and Broad Dollar Index
-2.5
-1.5
-0.5
0.5
1.5
2.5
3.5
Jan-00 Jan-01 Jan-02 Jan-03 Jan-04 Jan-05 Jan-06 Jan-07 Jan-08
95
100
105
110
115
120
125
130
Consumer Goods Import Prices Broad Dollar
%y-o-y Index, Jan 1997 = 100
28
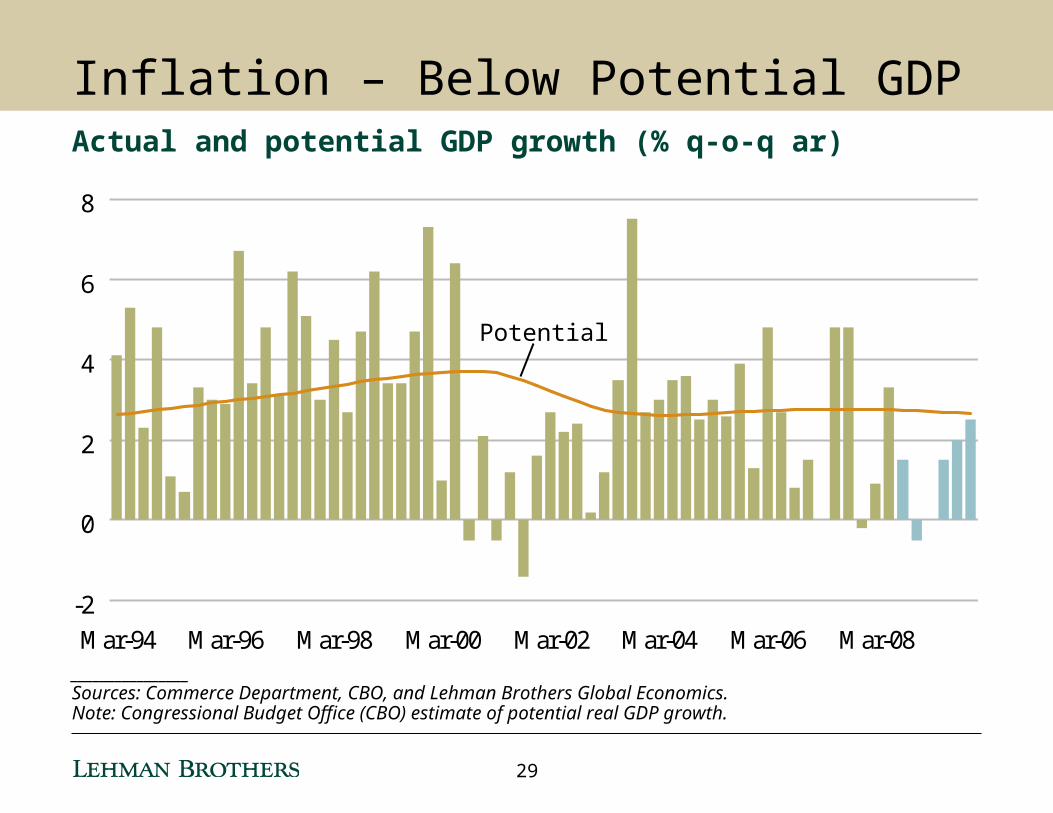
________________Sources: Commerce Department, CBO, and Lehman Brothers Global Economics.Note: Congressional Budget Office (CBO) estimate of potential real GDP growth.
-2
0
2
4
6
8
Mar-94 Mar-96 Mar-98 Mar-00 Mar-02 Mar-04 Mar-06 Mar-08
Potential
Inflation – Below Potential GDPActual and potential GDP growth (% q-o-q ar)
29
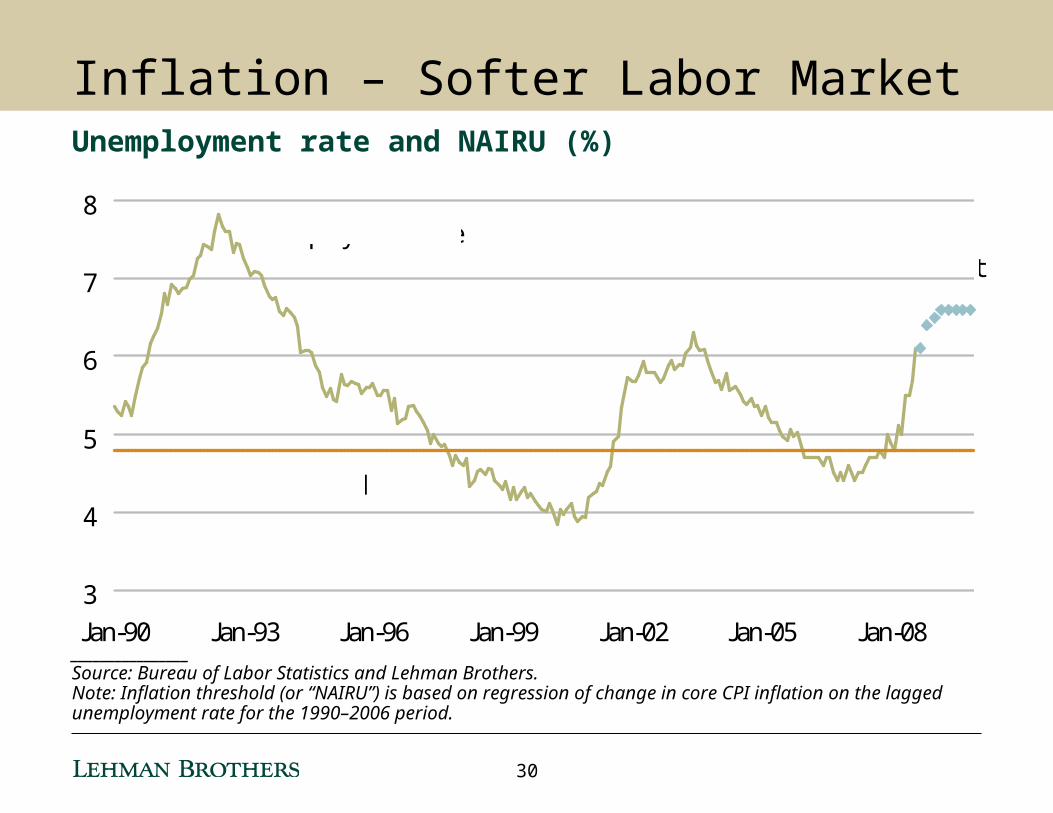
________________Source: Bureau of Labor Statistics and Lehman Brothers.Note: Inflation threshold (or “NAIRU”) is based on regression of change in core CPI inflation on the lagged unemployment rate for the 1990–2006 period.
3
4
5
6
7
8
Jan-90 Jan-93 Jan-96 Jan-99 Jan-02 Jan-05 Jan-08
Forecast
Inflation Threshold
Unemployment Rate
Inflation – Softer Labor MarketUnemployment rate and NAIRU (%)
30
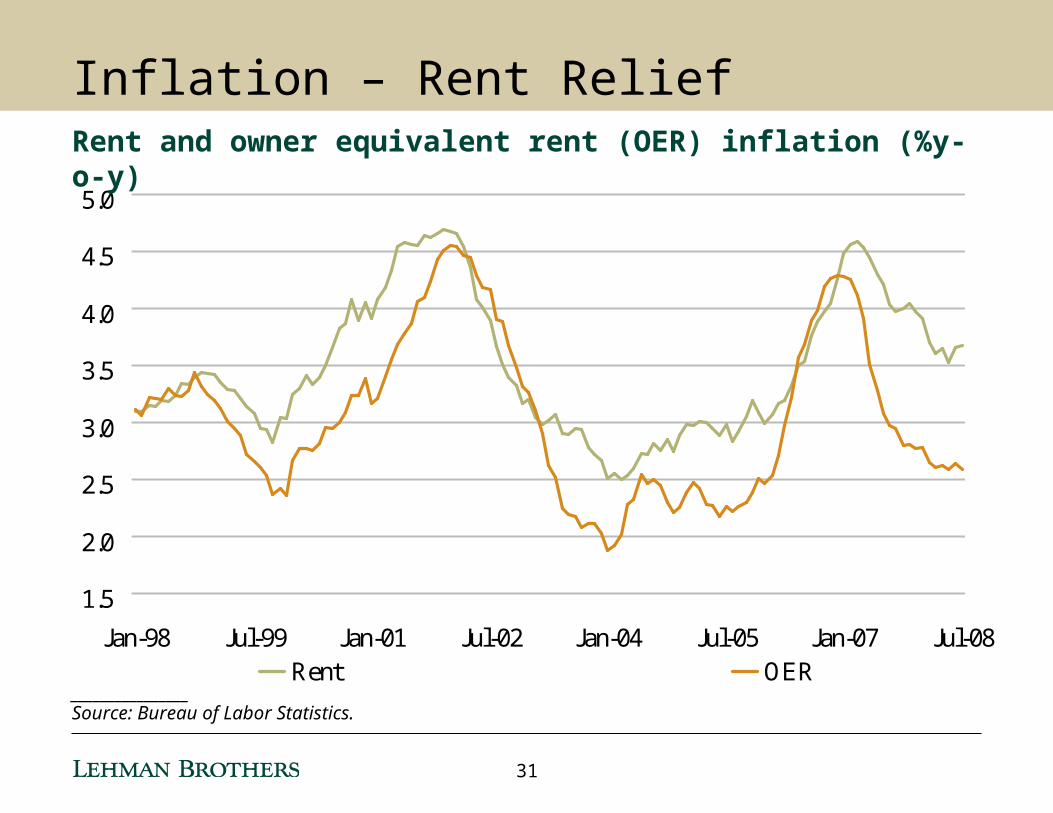
________________Source: Bureau of Labor Statistics.
1.5
2.0
2.5
3.0
3.5
4.0
4.5
5.0
Jan-98 Jul-99 Jan-01 Jul-02 Jan-04 Jul-05 Jan-07 Jul-08
Rent OER
Inflation – Rent ReliefRent and owner equivalent rent (OER) inflation (%y-o-y)
31
0
2
4
6
8
10
12
14
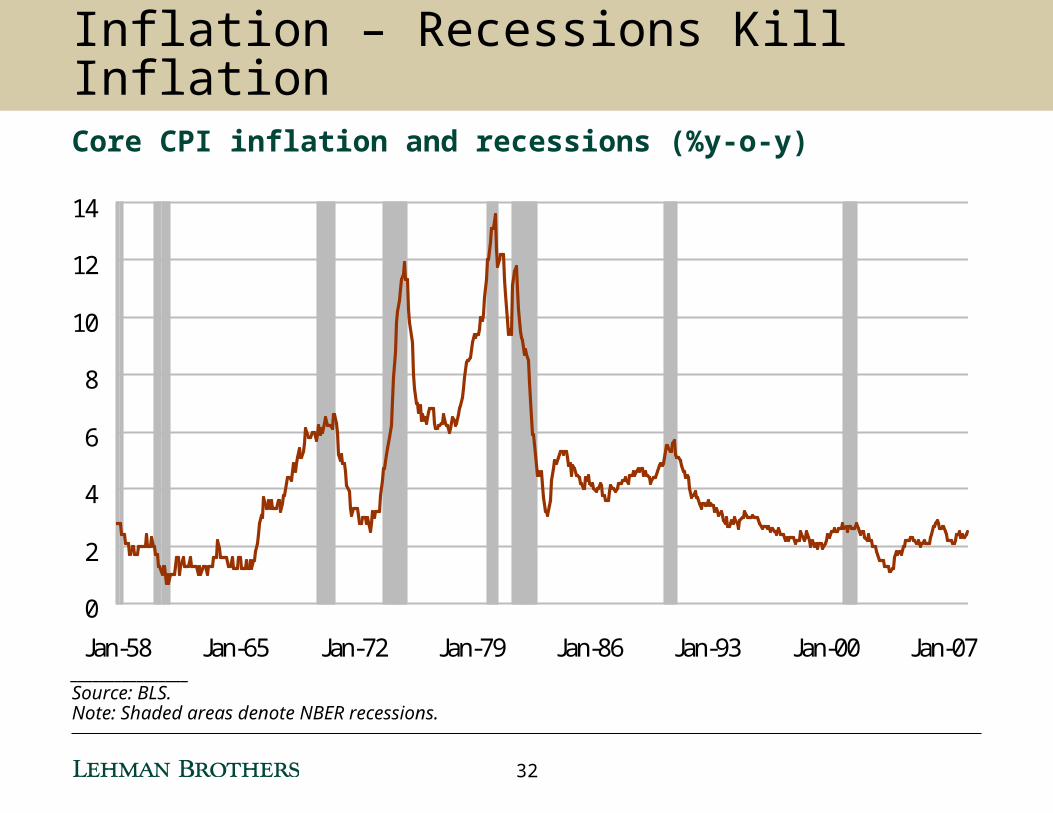
Jan-58 Jan-65 Jan-72 Jan-79 Jan-86 Jan-93 Jan-00 Jan-07________________Source: BLS.Note: Shaded areas denote NBER recessions.
Inflation – Recessions Kill InflationCore CPI inflation and recessions (%y-o-y)
32
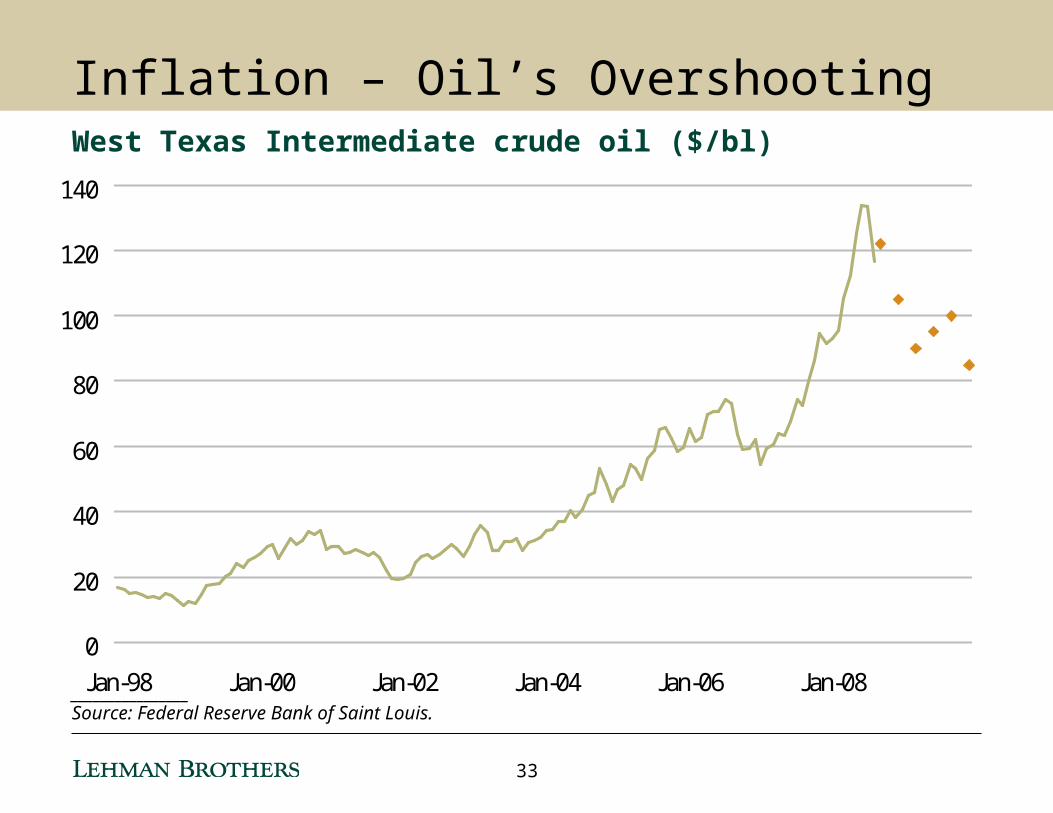
Inflation – Oil’s Overshooting
0
20
40
60
80
100
120
140
Jan-98 Jan-00 Jan-02 Jan-04 Jan-06 Jan-08
West Texas Intermediate crude oil ($/bl)
________________Source: Federal Reserve Bank of Saint Louis.
33
0
1
2
3
4
5
6
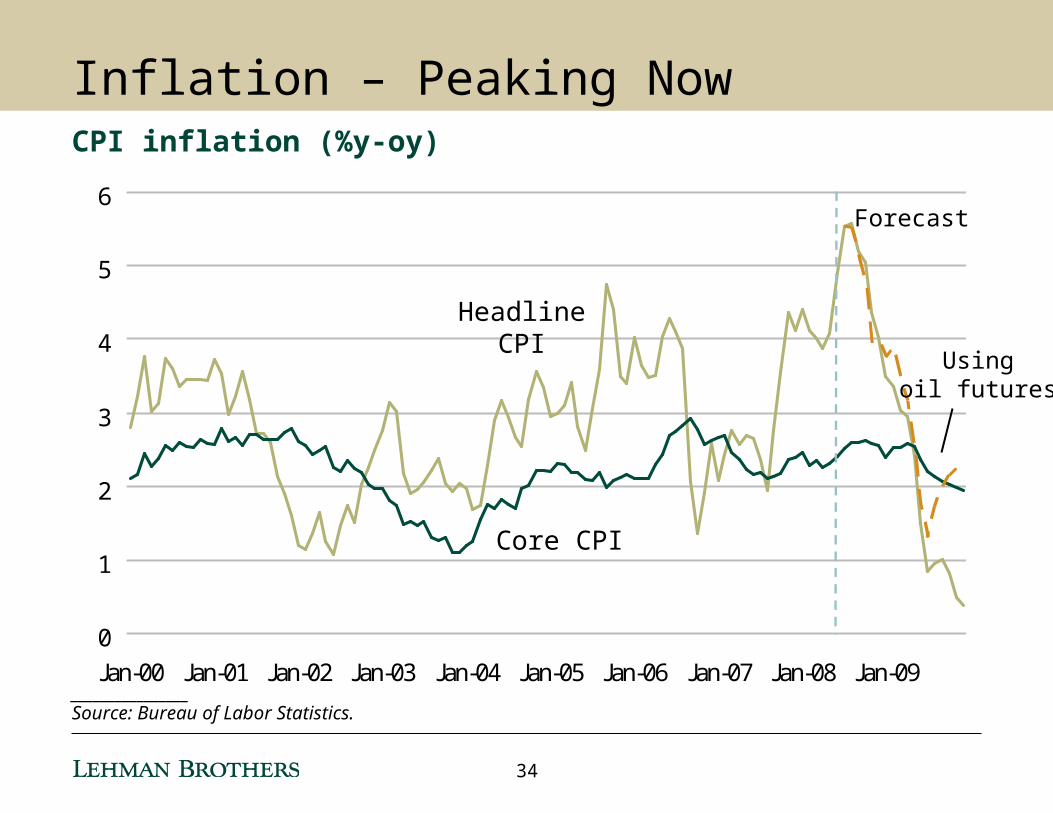
Jan-00 Jan-01 Jan-02 Jan-03 Jan-04 Jan-05 Jan-06 Jan-07 Jan-08 Jan-09________________Source: Bureau of Labor Statistics.
Inflation – Peaking NowCPI inflation (%y-oy)
Forecast
Usingoil futures
Headline CPI
Core CPI
34
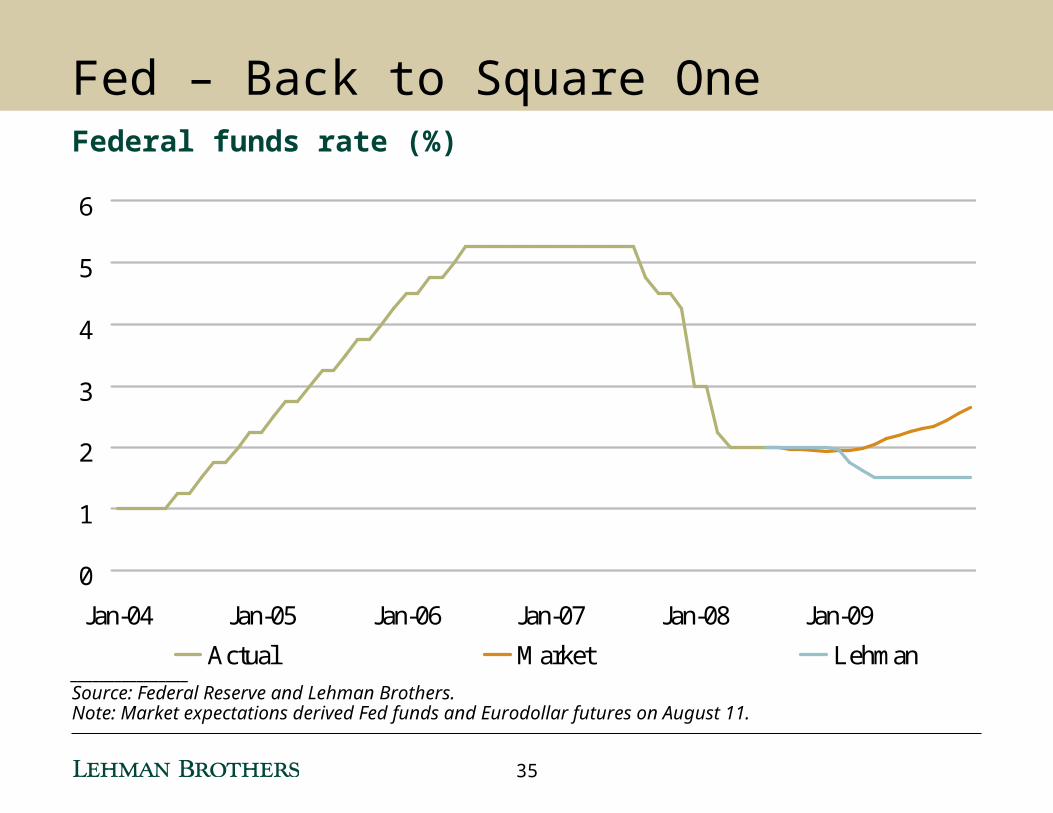
________________Source: Federal Reserve and Lehman Brothers.Note: Market expectations derived Fed funds and Eurodollar futures on August 11.
0
1
2
3
4
5
6
Jan-04 Jan-05 Jan-06 Jan-07 Jan-08 Jan-09
Actual Market Lehman
Fed – Back to Square OneFederal funds rate (%)
35
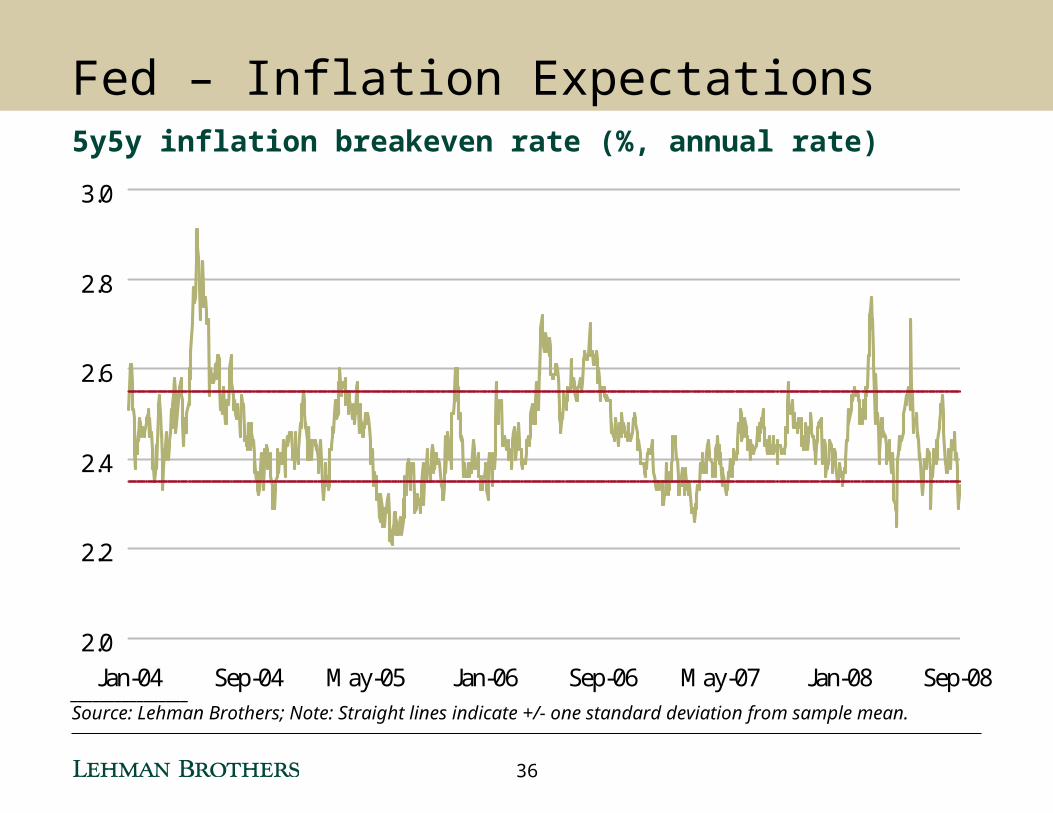
Fed – Inflation Expectations5y5y inflation breakeven rate (%, annual rate)
________________Source: Lehman Brothers; Note: Straight lines indicate +/- one standard deviation from sample mean.
2.0
2.2
2.4
2.6
2.8
3.0
Jan-04 Sep-04 May-05 Jan-06 Sep-06 May-07 Jan-08 Sep-08
36
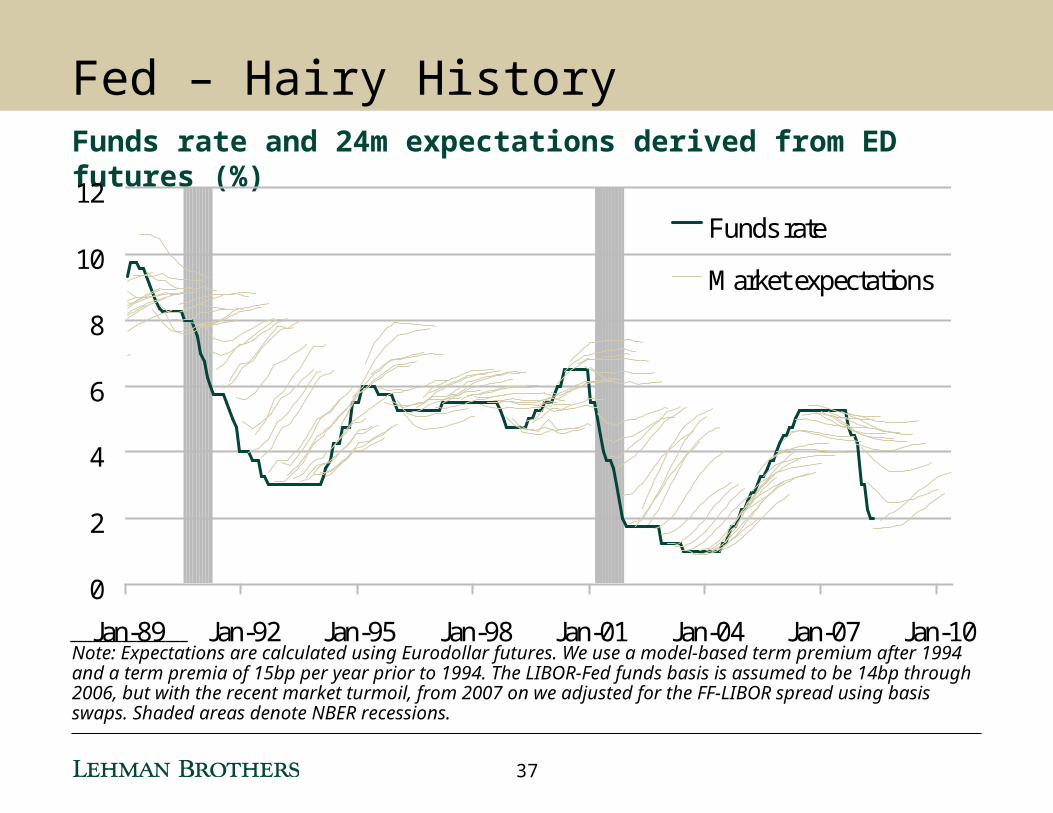
________________Note: Expectations are calculated using Eurodollar futures. We use a model-based term premium after 1994 and a term premia of 15bp per year prior to 1994. The LIBOR-Fed funds basis is assumed to be 14bp through 2006, but with the recent market turmoil, from 2007 on we adjusted for the FF-LIBOR spread using basis swaps. Shaded areas denote NBER recessions.
Fed – Hairy HistoryFunds rate and 24m expectations derived from ED futures (%)
0
2
4
6
8
10
12
Jan-89 Jan-92 Jan-95 Jan-98 Jan-01 Jan-04 Jan-07 Jan-10
Funds rate
Market expectations
37
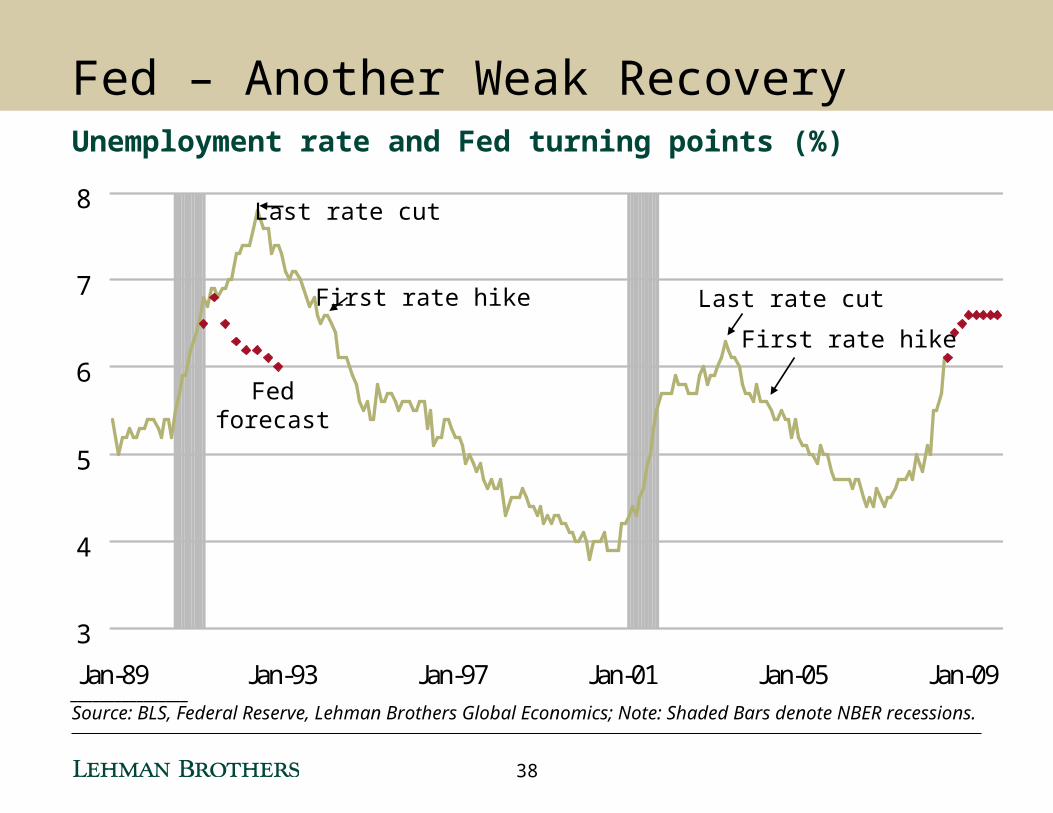
Fed – Another Weak RecoveryUnemployment rate and Fed turning points (%)
3
4
5
6
7
8
Jan-89 Jan-93 Jan-97 Jan-01 Jan-05 Jan-09
Last rate cut
First rate hike Last rate cut
First rate hike
Fedforecast
________________Source: BLS, Federal Reserve, Lehman Brothers Global Economics; Note: Shaded Bars denote NBER recessions.
38
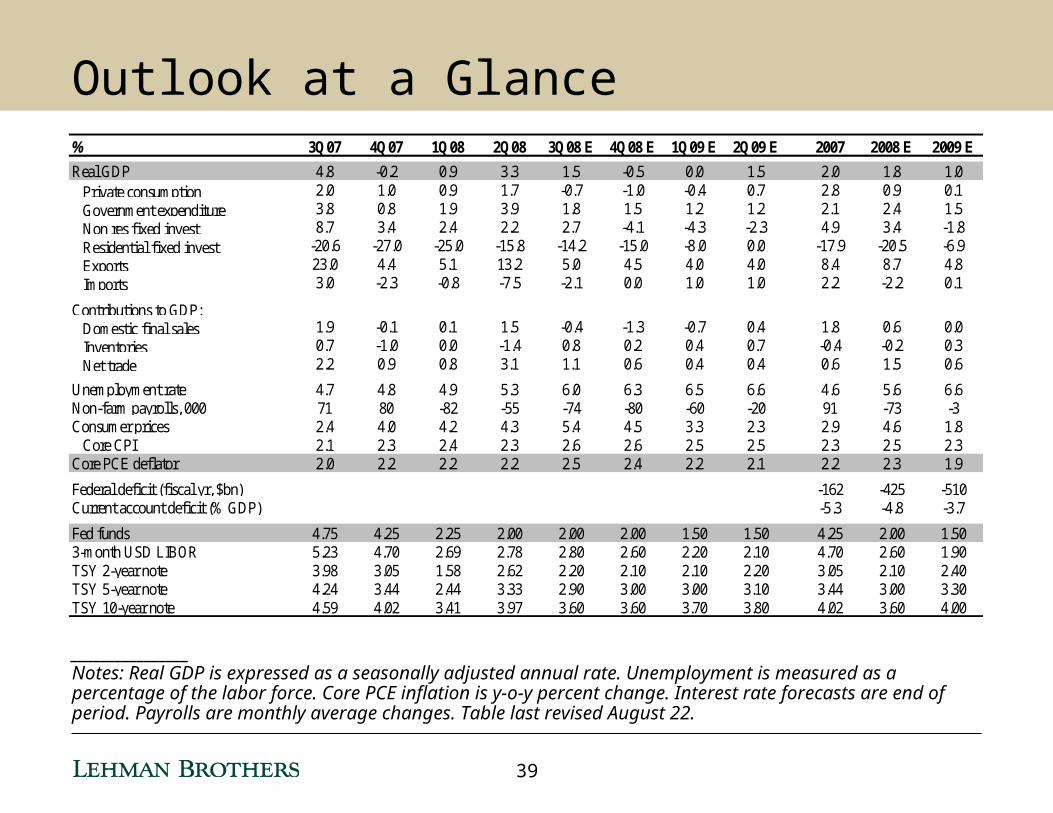
Outlook at a Glance
________________Notes: Real GDP is expressed as a seasonally adjusted annual rate. Unemployment is measured as a percentage of the labor force. Core PCE inflation is y-o-y percent change. Interest rate forecasts are end of period. Payrolls are monthly average changes. Table last revised August 22.
% 3Q07 4Q07 1Q08 2Q08 3Q08 E 4Q08 E 1Q09 E 2Q09 E 2007 2008 E 2009 E
Real GDP 4.8 -0.2 0.9 3.3 1.5 -0.5 0.0 1.5 2.0 1.8 1.0 Private consumption 2.0 1.0 0.9 1.7 -0.7 -1.0 -0.4 0.7 2.8 0.9 0.1 Government expenditure 3.8 0.8 1.9 3.9 1.8 1.5 1.2 1.2 2.1 2.4 1.5 Non res fixed invest 8.7 3.4 2.4 2.2 2.7 -4.1 -4.3 -2.3 4.9 3.4 -1.8 Residential fixed invest -20.6 -27.0 -25.0 -15.8 -14.2 -15.0 -8.0 0.0 -17.9 -20.5 -6.9 Exports 23.0 4.4 5.1 13.2 5.0 4.5 4.0 4.0 8.4 8.7 4.8 Imports 3.0 -2.3 -0.8 -7.5 -2.1 0.0 1.0 1.0 2.2 -2.2 0.1
Contributions to GDP: Domestic final sales 1.9 -0.1 0.1 1.5 -0.4 -1.3 -0.7 0.4 1.8 0.6 0.0 Inventories 0.7 -1.0 0.0 -1.4 0.8 0.2 0.4 0.7 -0.4 -0.2 0.3 Net trade 2.2 0.9 0.8 3.1 1.1 0.6 0.4 0.4 0.6 1.5 0.6
Unemployment rate 4.7 4.8 4.9 5.3 6.0 6.3 6.5 6.6 4.6 5.6 6.6Non-farm payrolls, 000 71 80 -82 -55 -74 -80 -60 -20 91 -73 -3Consumer prices 2.4 4.0 4.2 4.3 5.4 4.5 3.3 2.3 2.9 4.6 1.8 Core CPI 2.1 2.3 2.4 2.3 2.6 2.6 2.5 2.5 2.3 2.5 2.3Core PCE deflator 2.0 2.2 2.2 2.2 2.5 2.4 2.2 2.1 2.2 2.3 1.9
Federal deficit (fiscal yr, $bn) -162 -425 -510Current account deficit (% GDP) -5.3 -4.8 -3.7
Fed funds 4.75 4.25 2.25 2.00 2.00 2.00 1.50 1.50 4.25 2.00 1.503-month USD LIBOR 5.23 4.70 2.69 2.78 2.80 2.60 2.20 2.10 4.70 2.60 1.90TSY 2-year note 3.98 3.05 1.58 2.62 2.20 2.10 2.10 2.20 3.05 2.10 2.40TSY 5-year note 4.24 3.44 2.44 3.33 2.90 3.00 3.00 3.10 3.44 3.00 3.30TSY 10-year note 4.59 4.02 3.41 3.97 3.60 3.60 3.70 3.80 4.02 3.60 4.00
39
Appendix
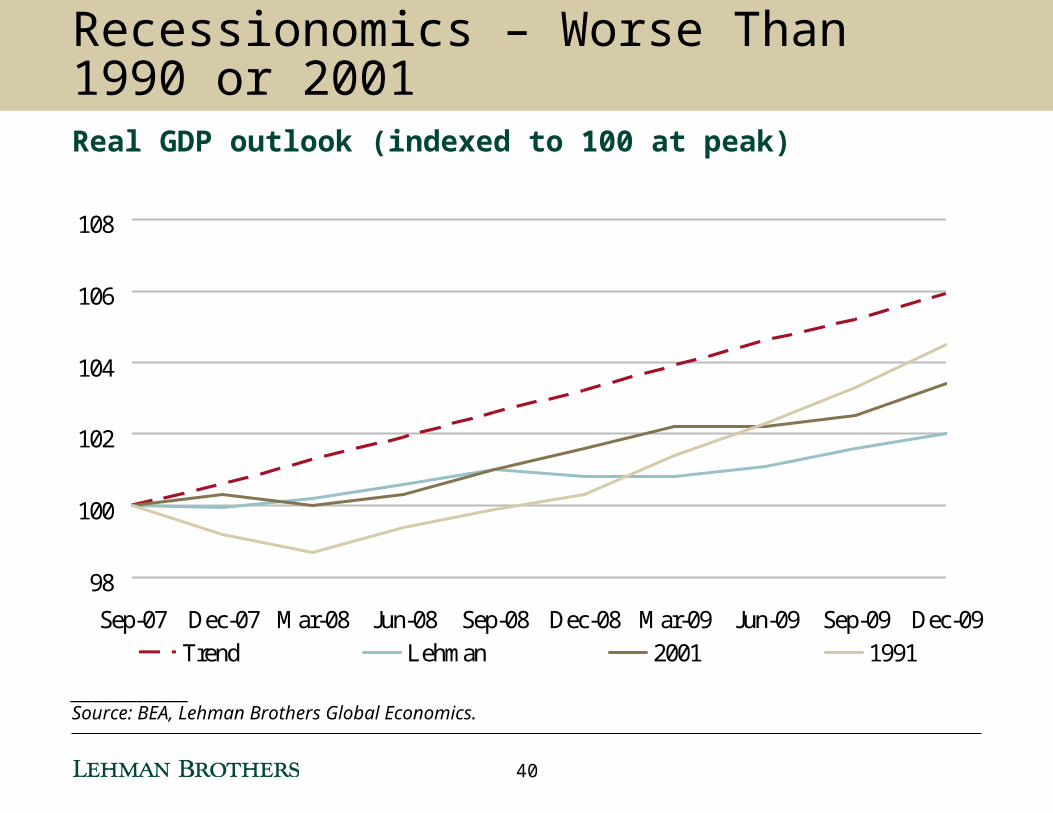
98
100
102
104
106
108
Sep-07 Dec-07 Mar-08 Jun-08 Sep-08 Dec-08 Mar-09 Jun-09 Sep-09 Dec-09
Trend Lehman 2001 1991
________________Source: BEA, Lehman Brothers Global Economics.
Recessionomics – Worse Than 1990 or 2001Real GDP outlook (indexed to 100 at peak)
40
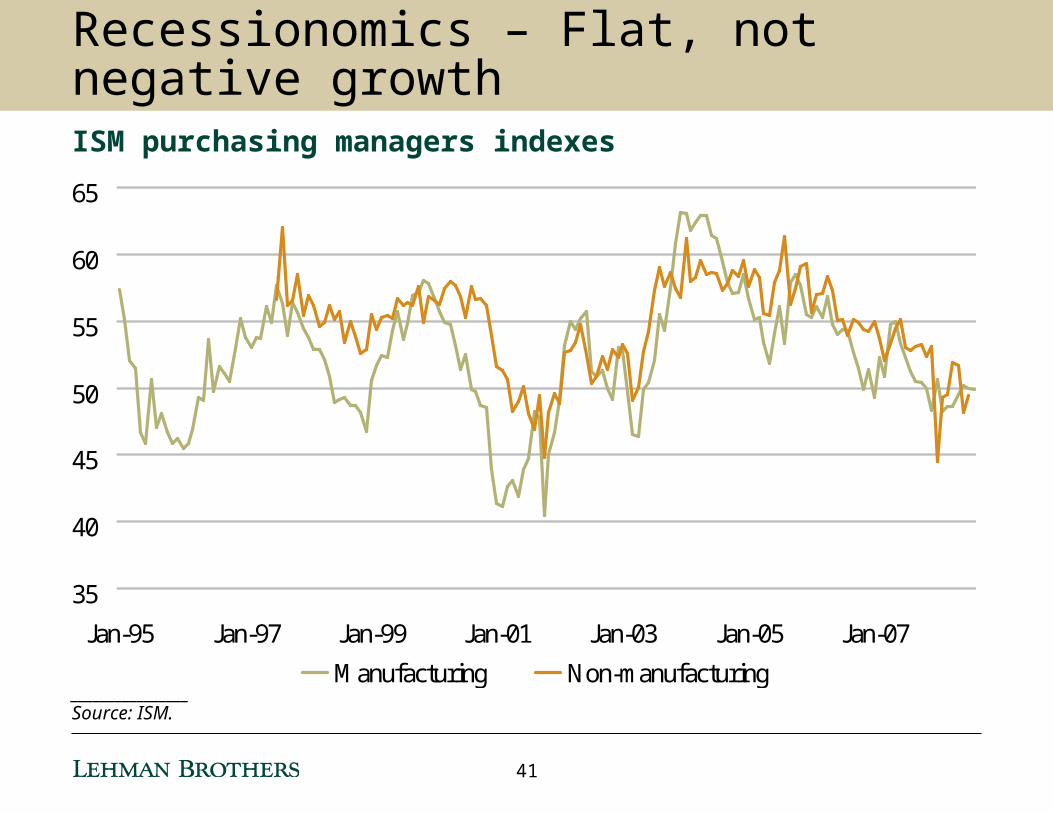
________________Source: ISM.
Recessionomics – Flat, not negative growthISM purchasing managers indexes
35
40
45
50
55
60
65
Jan-95 Jan-97 Jan-99 Jan-01 Jan-03 Jan-05 Jan-07
Manufacturing Non-manufacturing
41
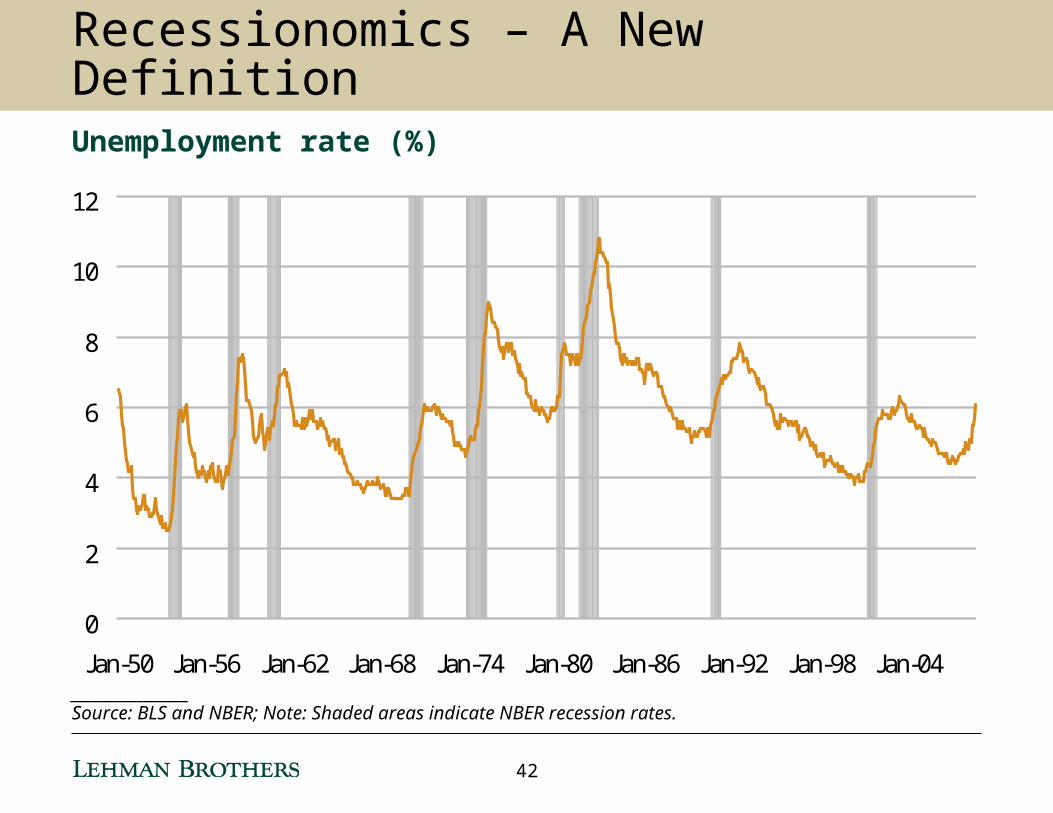
________________Source: BLS and NBER; Note: Shaded areas indicate NBER recession rates.
Recessionomics – A New DefinitionUnemployment rate (%)
0
2
4
6
8
10
12
Jan-50 Jan-56 Jan-62 Jan-68 Jan-74 Jan-80 Jan-86 Jan-92 Jan-98 Jan-04
42

Analyst CertificationThe views expressed in this report accurately reflect the personal views of Ethan Harris, the primary analyst responsible for this report, about the subject securities or issuers referred to herein, and no part of such analyst's compensation was, is or will be directly or indirectly related to the specific recommendations or views expressed herein.
Important Disclosures Lehman Brothers Inc. and/or an affiliate thereof (the "firm") regularly trades, generally deals as principal and generally provides liquidity (as market maker or otherwise) in the fixed income securities that are the subject of this research report (and related derivatives thereof). The firm's trading desks may have either a long and / or short position in such securities and / or derivative instruments, which may pose a potential conflict with the interests of investing customers. Where permitted and subject to appropriate information barrier restrictions, the firm's fixed income research analysts regularly interact with its trading desk personnel to determine current prices of fixed income securities. The firm's fixed income research analyst(s) receive compensation based on various factors including, but not limited to, the quality of their work, the overall performance of the firm (including the profitability of the investment banking department), the profitability and revenues of the Fixed Income Division and the outstanding principal amount and trading value of, the profitability of, and the potential interest of the firm’s investing clients in research with respect to, the asset class covered by the analyst.Lehman Brothers generally does and seeks to do investment banking and other business with the companies discussed in its research reports. As a result, investors should be aware that the firm may have a potential conflict of interest.To the extent that any historical pricing information was obtained from Lehman Brothers trading desks, the firm makes no representation that it is accurate or complete. All levels, prices and spreads are historical and do not represent current market levels, prices or spreads, some or all of which may have changed since the publication of this document.Lehman Brothers' global policy for managing conflicts of interest in connection with investment research is available at www.lehman.com/researchconflictspolicy.To obtain copies of fixed income research reports published by Lehman Brothers please contact Valerie Monchi ([email protected]; 212-526-3173) or clients may go to https://live.lehman.com/
Legal DisclaimerThis material has been prepared and/or issued by Lehman Brothers Inc., member SIPC, and/or one of its affiliates ("Lehman Brothers"). Lehman Brothers Inc. accepts responsibility for the content of this material in connection with its distribution in the United States. This material has been approved by Lehman Brothers International (Europe), authorised and regulated by the Financial Services Authority, in connection with its distribution in the European Economic Area. This material is distributed in Japan by Lehman Brothers Japan Inc., and in Hong Kong by Lehman Brothers Asia Limited. This material is distributed in Australia by Lehman Brothers Australia Pty Limited, and in Singapore by Lehman Brothers Inc., Singapore Branch ("LBIS"). Where this material is distributed by LBIS, please note that it is intended for general circulation only and the recommendations contained herein do not take into account the specific investment objectives, financial situation or particular needs of any particular person. An investor should consult his Lehman Brothers' representative regarding the suitability of the product and take into account his specific investment objectives, financial situation or particular needs before he makes a commitment to purchase the investment product. This material is distributed in Korea by Lehman Brothers International (Europe) Seoul Branch. Any U.S. person who receives this material and places an order as result of information contained herein should do so only through Lehman Brothers Inc. This document is for information purposes only and it should not be regarded as an offer to sell or as a solicitation of an offer to buy the securities or other instruments mentioned in it. No part of this document may be reproduced in any manner without the written permission of Lehman Brothers. With exception of the disclosures relating to Lehman Brothers, this report is based on current public information that Lehman Brothers considers reliable, but we do not represent that this information, including any third party information, is accurate or complete and it should not be relied upon as such. It is provided with the understanding that Lehman Brothers is not acting in a fiduciary capacity. Opinions expressed herein reflect the opinion of Lehman Brothers' Fixed Income Research Department and are subject to change without notice. The products mentioned in this document may not be eligible for sale in some states or countries, and they may not be suitable for all types of investors. If an investor has any doubts about product suitability, he should consult his Lehman Brothers representative. The value of and the income produced by products may fluctuate, so that an investor may get back less than he invested. Value and income may be adversely affected by exchange rates, interest rates, or other factors. Past performance is not necessarily indicative of future results. If a product is income producing, part of the capital invested may be used to pay that income. Lehman Brothers may, from time to time, perform investment banking or other services for, or solicit investment banking or other business from any company mentioned in this document. No part of this document may be reproduced in any manner without the written permission of Lehman Brothers. © 2008 Lehman Brothers. All rights reserved. Additional information is available on request. Please contact a Lehman Brothers' entity in your home jurisdiction.
43