Embed Size (px)
Citation preview
Vaccine Supply: Effects of Regulation and Competition
DRAFT
September 13, 2010
Patricia M. Danzon
The Wharton School, University of Pennsylvania
Nuno Sousa Pereira
Universidade do Porto, Portugal and CEF.UP
Patricia Danzon Celia Moh Professor The Wharton School University of Pennsylvania. 3641 Locust Walk, Philadelphia, PA 19104 [email protected] Nuno Sousa Pereira Dean, Business School University of Porto Rua de Salazares 4200-464 Porto, Portugal [email protected]
2
Abstract
In US vaccine markets, competing producers with high fixed, sunk costs face relatively
concentrated demand. The resulting price and quality competition leads to the exit of all but one or very
few producers per vaccine. Our empirical analysis of exits from US vaccine markets supports the
hypothesis that high fixed costs and both price and quality competition contribute to vaccine exits. We
find no evidence that government purchasing has a significant effect, possibly because government
purchase tends to increase volume but lower price, with offsetting effects. Evidence from the flu vaccine
market confirms that government purchasing is not a necessary condition for exits and the existence of
few suppliers of vaccines in the US.
3
I. Introduction
Vaccines provide an extremely cost-effective technology for dealing with infectious diseases,
saving lives and averting millions of dollars of potential health expenditures. But the supply of pediatric
vaccines in the US appears precarious, with a declining number of producers and products. In 1967 there
were 26 licensed manufacturers, but only 12 in 2002. Five firms produce almost all routine childhood
vaccines, with a sole supplier for five of the eight recommended pediatric vaccines.1 When key suppliers
experience manufacturing problems, supply interruptions and vaccine shortages interrupt immunization
schedules, sometimes leading to children not being immunized. For flu vaccine, supply shortages during
the narrow annual window for effective administration have posed risks to vulnerable populations.
Not all is gloom and doom in the vaccine business, however. Historically, entry of firms and
products has been rapid when scientific advance creates new opportunities. Global vaccine sales doubled
during the 1990s, from $2.9b. in 1992 to over $6b. in 2000, 2 although global sales of basic vaccines
dropped 40% over the same period.3 Global vaccine sales increased 16 percent from 2008-2009, reaching
$22.1b.4 This growth reflects new pediatric products, including varicella, rotovirus and childhood
pneumococcal vaccines, in addition to travel and adult vaccines, including cervical cancer, and new
combinations. Vaccine manufacturers spend about 16 percent of sales on R&D, a comparable ratio to the
pharmaceutical industry. Some large pharmaceutical companies have recently entered the vaccine
industry through acquisition (for example, Pfizer’s $68b. purchase of Wyeth was partly for its vaccine
business; Novartis acquired Chiron, Abbott purchased Solvay), and several biotech firms have entered in
the US and other countries. Thus precarious supply of existing vaccines co-exists with healthy entry to
produce new vaccines
The industrial organization literature has proposed general models of entry and exit to an industry
(Caves, 1998). Entry has been modeled to reflect such factors as entry barriers, whether set-up costs are
retrievable or “sunk”, potential entry and exit of competitors, the extent of product substitutability etc.
Theories of withdrawal from markets include some of the same but also from different explanations, such
as intrafirm cannibalization or interfirm competition in multiproduct competition settings (Ruebeck,
1 Institute of Medicine (2003) 2 S. Jarrett, “Procurement Strategies for Drugs and Vaccines,” Wharton Impact Conference on Pharmaceutical Innovation in a Global Economy (4-5 October 2002). 3 Mercer Management Consulting (2002), http://www.vaccinealliance.org/Support_to_Country/vpp/index.php. 4 USAToday 8/13/2010. http://www.usatoday.com/money/industries/health/2010-08-13-vaccines_N.htm (last accessed 9/13/2010).
4
2005), declining demand (Ghemawat and Nalebuff 1985, 1990), age of the firm, firm size, and industry-
specific characteristics, such as the extent of scale economies, the dynamics of the demand and
knowledge conditions. Entry and exit have also been modeled as interrelated phenomena, with authors
finding a high correlation between average entry and exit rates, across time and within industries,
supporting the incorporation of entry as a determinant of exit and vice-versa (Carree and Thurik, 1996;
Disney et al., 2003; Dunne et al., 1988). The dynamic processes governing an industry’s structure include
learning effects, both by producers (Jovanovic, 1982) and consumers, replacement and displacement
effects (Carree and Thurik, 1996), and the emergence of a dominant design. Studies also examine levels
of market concentration and its consequences for welfare. For example, industries with a low flow of
entry and exit may be have limited innovativeness and some form of formal or tacit collusion (Geroski
and Jacquemin, 1985); on the other hand, a continuous change of competitors may be socially inefficient,
particularly in activities with significant investment of capital, time and knowledge.
This paper focuses on exit from (and to a lesser extent entry to) the vaccine industry from 1903 to
2005. We draw on some of the factors considered in the general IO literature but also factors specific to
vaccines. Compared to most industries (but similar to other pharmaceuticals), this industry is highly
R&D intensive and heavily regulated, in the US by the Food and Drug Administration (FDA) and by
similar authorities in other countries, with high regulatory costs of entry and continued operations.
However, unlike most other pharmaceuticals in the US, vaccines also face government as a significant
customer, at least for the pediatric vaccines that are purchased by the CDC. Previous economic analyses
of the vaccine industry have focused on the role of government procurement in general -- and
government price setting in particular -- in making vaccine markets less attractive than markets for other
pharmaceuticals.
We posit that exogenous advances in basic science create the potential to produce new and/or
improved vaccines against specific diseases such as hepatitis B, rotovirus etc. Following such a
knowledge shock, several firms may engage in R&D to apply this knowledge to produce a vaccine
product. This R&D race may result in several, slightly differentiated products that meet regulatory
requirements for safety and efficacy entering the market at different times. Even if one product has been
approved, other firms may rationally continue with their clinical trials, given the ex ante risks associated
with regulatory approval and market acceptance and the fact that significant research costs may already
be sunk. We document but do not model this entry process.
5
Our model of vaccine exits posits that, for a given technology, the vaccine production process
is subject to non-increasing returns to scale over a range that may suffice to serve the entire US market. If
multiple firms enter the market with substitutable products and each faces non-increasing costs up to the
scale of the market, non-cooperative pricing implies that prices will fall to marginal cost. This creates
pressures for all but one product to eventually exit. Products that have higher variable costs, shocks to
fixed costs or less desirable safety, efficacy or convenience attributes for consumers are more likely to
exit. Prices for the surviving product(s) may nevertheless be constrained by contestability from foreign or
previous entrants and/or monopsony power of purchasers, with the relative importance of these factors
differing across vaccine types.
In this model, new product entry to a vaccine type usually occurs in waves, following
technological or market changes. Exits are triggered both by price and quality competition, particularly
by dynamic entry of superior products, and by regulatory or other shocks that raise costs of incumbent
firms or reduce demand. In this model, government procurement as practiced by the US Center for
Disease Control and Prevention (CDC) reduces prices primarily by exacerbating competition by design
of the bidding process, not because the government imposes price regulation. On the other hand,
government involvement through vaccine recommendations and mandates increases quantity demanded,
and hence may increase the expected number of products/firms in a market, cet. par. Given these
offsetting effects of government on price and volume, the net effect of government involvement on
number of suppliers or vaccine exit is theoretically ambiguous and must be determined empirically.
Our empirical analysis tests these hypotheses related to vaccine exit using data on vaccine license
terminations between 1901 and 2003. The results confirm that the hazard of exit increases with number
of competitors and is more likely following the entry of new competitors, whereas sole suppliers are less
likely to exit. We find that over time, the vaccine industry has become much more demanding, no doubt
partly due to higher FDA safety requirements. Although we observe a structural change after the CDC
became a major purchaser of vaccines. However, we do not find any support for the common assertion
that price regulation by the CDC or its share of volume purchased has contributed to vaccine exit,
plausibly because these effects are offsetting. This finding, that government purchase on balance has no
negative effect on firms’ willingness to remain in the market, is consistent with the theoretical prediction,
that competitive markets would likely lead to one or very few suppliers in the long run, given the cost
structure of vaccine supply and the relatively small market and limited storability of most vaccines. This
6
finding is also consistent with casual evidence that vaccine producers in fact seek out government
recommendation and purchase of their vaccines.
Section II of the paper describes previous related literature. Section III outlines our model of
vaccine supply and market equilibrium. Section IV describes the data and methods. Section V provides
descriptive evidence on vaccine entry and exits. Section V reports the hazard model estimates of exit for
individual vaccine products and for firms. Section VI presents evidence on vaccine availability in Canada,
France, Portugal and the UK, compared to the US, and Section VII provides a case study of the flu
vaccine market in the US that illustrates the importance of high fixed costs and demand uncertainty.
II. Previous Literature
An extensive previous economic literature describes the institutional structure of vaccine supply
and purchase, the economic case of mandatory vaccination, and appropriate subsidies for vaccine demand
through reimbursement (see IOM, 1985, 2003 and papers therein). A more limited number of papers
examine the effects of CDC procurement on prices and on vaccine shortages (e.g. Salkever and Frank,
1996). Kauf (1999) uses data from 1997-1992 on private catalog and federal contract prices for 3
vaccines (DTP, OPV and MMR) and 1988- 1992 for Hib and Hep B to test empirically whether the
public discount percentage is more consistent with price discrimination or bargaining power. She
concludes that, while it is not possible to eliminate other factors, results favor the bargaining power
hypothesis. This conclusion is based primarily on finding a positive association between the public
discount percent and the public share of volume. She does not explicitly consider the role of competition
and treats number of suppliers as exogenous. She does find that the discount is also positively related to
number of licenses, which she interprets as consistent with the bargaining hypothesis but also with price
discrimination. Both these studies use data that predates CDC’s shift away from winner-take-all
procurement.
Scherer (2007) takes a more general IO approach to vaccine shortages. He considers high
regulatory costs, inadequate profitability and mergers as possible causes of vaccine shortages, and argues
that economies of scale and scope limit the number of vaccine producers. Focusing on the influenza
vaccine and assuming that shortages entail foregone vaccination, he provides rough estimates of benefits
and costs of vaccine shortages and concludes that maintaining additional production sources with surge
capacity would be cost-justified. Scherer’s view of vaccine markets as natural monopolies in some ways
resembles our hypothesis; however, he does not consider the dynamic competition process whereby
7
multiple firms enter and then most exit, and his empirical analysis focuses on simulating welfare costs of
shortages for influenza, not the determinants of firm exit which is the focus of our analysis.
III. Vaccine Market Characteristics
1. Demand
Although vaccines are highly effective at disease prevention, their success is a winner’s curse for
producers: the longer the treatment efficacy, the smaller is the annual volume demanded. For pediatric
vaccines that have lifetime efficacy, potential annual sales volume is limited by the size of the birth
cohort. Moreover, idiosyncratic government vaccination policies result in different pediatric vaccine
requirements across countries. The potential annual demand is therefore lower for most vaccine
formulations than for many therapeutic drugs, especially drugs to treat chronic diseases. For adult
vaccines and travelers vaccines, efficacy lasts for several years, hence booster doses are necessary to
maintain protection, but usage is generally limited to at-risk subpopulations.
Governments in all industrialized countries require and often subsidize vaccination against
major contagious diseases. The rationale is that the social benefits of vaccination exceed private benefits
(due to reduced probability of transmission) and that individuals have incentives to free ride on
vaccination of others which reduces contagion risk and may assure herd immunity. In the US, the ACIP
is an advisory body comprised of medical experts who recommend vaccination schedules for specific
subpopulations. For some pediatric vaccines, compliance with these recommendations is required for
school attendance, which makes the recommendations essentially a mandate. Government
recommendations and mandates presumably increase total volume sold for recommended vaccines,
compared to unconstrained voluntary market demand. But government recommendation or procurement
may also concentrate demand on preferred products and, conversely, reduce demand for competing, non-
recommended products.
The effect of government’s role on vaccine prices depends on whether and how the government
actually procures vaccines, and its market share. In the US, the CDC began purchasing vaccines for low
income children in 1966. During the 1980s, CDC’s share increased, varying across years and across
vaccines from around 30-40 percent for diphtheria, tetanus and pertussus (DTP) and polio, to 40-50
percent and higher for measles, mumps and rubella (MMR). In 1993 the Vaccines for Children (VFC)
program increased the public share of childhood vaccines to over 50 percent. Procurement strategies
have varied over time, as purchasers learned about the effects of their strategies on long term supply.
8
Prior to 1993, the CDC applied a winner-take-all strategy, awarding all sales to the lowest bidder. This
resulted in low prices and great volume uncertainty for suppliers. Since 1998, the CDC solicits bids
annually but does not directly purchase vaccines. Rather, the CDC solicits and posts bid prices of
potential suppliers and negotiates broad supply contracts, usually with a near-zero minimum and a
negotiated maximum quantity. These bid prices can be adjusted quarterly. State and local recipients of
federal funds for vaccine purchase under the VFC program choose which approved supplier to use. States
that participate in the universal purchase program use their own funds to purchase vaccines for non-VFC-
eligible patients at CDC prices.
In the private sector, vaccines are purchased by individual physicians, hospitals and other
institutions that administer vaccines, often using group purchasing organization to negotiate prices with
vaccine suppliers. These private purchasers are highly price sensitive because they usually face a fixed
reimbursement per vaccine type from third party payers. Since they capture any margin, positive or
negative, between the reimbursement and their acquisition cost for the vaccine, their cross-price demand
elasticity between competing products is likely to be high. In such contexts, suppliers generally compete
for market share by offering discounts below the reimbursement price.
The global vaccine market similarly consists of large concentrated purchasers, each with somewhat
specific requirements. In most industrialized countries, national governments play a dominant role in
defining vaccination schedules, vaccine procurement and price setting. Vaccine purchase for Latin
America is largely managed by the Pan American Health Organization (PAHO), but each individual
country decides which vaccines to purchase. Procurement and price negotiations are coordinated through
PAHO, using competitive bidding. For developing countries, including purchases financed through
GAVI, UNICEF serves as the procurement agency. For basic pediatric vaccines, UNICEF accounts for
40% of global volume but only 5% of market value. Between 1992 and 2002, the number of
manufacturers offering UNICEF its key DTP, BCG, TT and measles vaccines dwindled to 3 or 4 for each
vaccine.5 UNICEF has switched from winner-take-all procurement to spreading its demand across several
suppliers, in order to keep them in the market and protect against supply interruptions. Most of the supply
to UNICEF is now from Indian and other emerging market suppliers, with only small shares from the
large multinational companies that supply the industrialized countries. This partly reflects differentiation
of products, as the industrialized countries, especially the US, have moved towards newer, more costly
5 Jarrett, “Procurement Strategies for Drugs and Vaccines.”
9
combinations of basic vaccines, acellular pertussis, IPV, and thimerosal-free products, whereas UNICEF
purchases older, cheaper formulations.
2. Supply
Cost Structure Bringing a new vaccine to market entails high fixed investments in R&D
(research, compound formulation and clinical development), manufacturing capacity and batch costs,
each of which is subject to regulatory requirements. R&D cost for vaccines is estimated to be comparable
to other drugs (Grabowski, 2005). Vaccine production requires unusually high investments in quality
assurance, as a condition of licensure. Fixed costs have been estimated at 60% of total production costs.6
The batch process required for vaccines also entails fixed costs per batch. A batch may take 6-18 months
to produce, depending on the type of vaccine and production methods. Thus production is characterized
by very high fixed, sunk costs and low marginal cost per unit within each batch up to the capacity limit
defined by the maximum number of batches for the manufacturing plant. Changing production
technology to meet changed regulatory standards or expand scale takes years and millions of dollars, and
requires FDA approval for the new plant. Such costs may only be worth incurring if they can be recouped
over several years of sales.
Costs related to regulatory compliance have increased over time to meet rising quality standards.
In addition, several explicit shocks have necessitated major new investments. In particular, the 1972
requirement that all vaccines demonstrate efficacy imposed new costs on pre-1962 vaccines that had been
grandfathered under the 1962 FDA Amendments. The 1989 requirement to remove thimerosal required
product and plant redesign and reapproval of manufacturing processes and facilities. The removal of
thimerosal, which is a preservative, may have exacerbated the short shelf life problem of vaccines, at
least until new technologies could be developed and built into new plants.
Patents and generic entry Patent barriers to entry of competitors are weak for some vaccines, often
relying on propriety strains of the virus and sometimes process patents. These do not preclude other firms
from using different strains to supply competing products during the life of any patents. However,
because vaccines are biologics, generics have not been able to use the abbreviated new drug application
(ANDA) process which enables generic equivalents of chemical drugs to get approval by showing
bioequivalence to the originator product. Thus follow-on versions of existing vaccines are treated as
6 Mercer Management Consulting, “Lessons Learned: New Procurement Strategies for Vaccines.”
10
originators and must undertake de novo clinical trials to demonstrate safety and efficacy. They would not
necessarily be viewed by consumers as a perfect substitute due to differences in vaccine strain.
Dynamic Competition Although originator vaccines do not face generic competitors, their
economic value is continually open to challenge by new improved products. For example, acellular
pertussis replaced whole cell pertussis; inactivated polio replaced oral polio; and combination products
have replaced single product forms for most pediatric vaccines. Anticipation of improved technologies
undermines incentives to invest in new variants of older technologies or plants, particularly given the
long lead times required by such investments. The tendency for dynamic entry of new, improved
technologies to displace old technologies may be exacerbated by government recommendation of the new
over the older product, and concentrated public and private purchasing.
Liability risks Tort liability has sometimes been a more severe risk for vaccines than
for most therapeutic drugs, because vaccines treat large numbers of healthy individuals, usually children,
and risks are correlated. Following exits of several manufacturers, in 1986 the Vaccine Injury
Compensation Fund (VCF) was established to provide no-fault compensation to children injured as a
result of pediatric vaccines. Influenza vaccine is also covered by the VCF, and other vaccines may apply.
Vaccine manufacturers may still occasionally face tort claims – for example, recent claims related to
thimerosal argued that this was a preservative, not intrinsic to the vaccine. Although these claims have so
far generally not succeeded, the legal costs of defending against claims and the risk that some may
eventually succeed may act as a disincentive for vaccine entry. However, this risk is probably modest, at
least for pediatric vaccines that are covered by the VCF.
3. Market Equilibrium High fixed costs of regulation and production are not a barrier to entry if
these costs can, with reasonable certainty, be recouped over large volume and/or high margins. But the
interaction of high fixed costs with relatively low, concentrated and unpredictable demand and perishable
supply is likely to result in a market equilibrium that supports only one or few suppliers in most vaccine
markets at any point in time. If multiple firms initially enter and each faces non-increasing cost per unit,
the equilibrium non-cooperative price is equal to marginal cost. The intuition is simple: once regulatory,
capacity and batch costs are sunk, with few alternative customers in the current period and limited
storage potential for future use, any excess of price above marginal cost contributes to covering the sunk
costs, whereas if a firm loses a contract to a competitor, the product is likely to go to waste. If such
pricing is anticipated, all but one firm will eventually exit and new entry is unlikely, unless the new
11
product has superior quality or lower cost than the incumbent. The likelihood of a sole supplier
equilibrium is greater, the smaller the market relative to minimum efficient scale of production; the
shorter the shelf-life of the product; and the more uniform are consumer preferences over product quality.
Market dominance and survival in vaccines thus tends to be related to product superiority for the majority
of patients, not to first mover advantage in a class.
Multiple products may coexist if they differ in efficacy or safety for different patient groups – for
example, if some patients cannot tolerate one component of a combination, a variant that excludes that
component may survive, as in the case of DTP and DT.7 Even then, a single firm is likely to dominate in
supplying these differentiated products if it has economies of scope from producing both the combination
and the component products. By contrast, in many on-patent pharmaceutical classes multiple products
coexist because each product works best for some patients; markets are generally larger; customers are
mostly atomistic purchasers, are price-insensitive due to insurance, and are not driven by government
recommendation; and the greater potential for storage enables manufacturers to inventory excess output
for future sale.
With a sole supplier of a mandated childhood vaccine, the government share of the market
becomes a bilateral monopoly: the government has significant monopsony power because the
manufacturer has incurred significant sunk costs and has no other purchasers of comparable size, but the
government also has no alternative suppliers. Given the declining number of producers, it is unsurprising
that the CDC discounts decreased over time, from an average of 75 percent off the supplier’s catalog
price in 1987 to 50 percent in 1997, and that discounts are less on the newest, single manufacturer
vaccines, such as varicella (9%) and pneumococcal conjugate (22%).8
In summary, the role of government purchasing in US vaccine markets has been to define
procurement rules for required vaccines that are eligible for government subsidy. Prior to 1998, this
involved competitive tendering and centralized purchasing. Since 1998, the CDC simple solicits bids
from willing suppliers and purchasing is devolved to the states. The only direct price regulation is a
ceiling on price increases, set at the growth in the consumer price index (CPI), for vaccines that had
federal contracts in 1993. This regulation created incentives for suppliers to develop new formulations of
7 The pertussis component is usually not given to adults because whooping cough is less severe in older people while the vaccine side effects may be more severe. Patients also receive diphtheria and tetanus boosters every ten years. Nidus Information Services Inc., “What are the Vaccines for Diphtheria, Tetanus, and Pertussis?” http://www.nym.org/healthinfo/docs/090/doc90diphtheria.html (15 November 2004). 8 Institute of Medicine (2003).
12
the price-constrained products – such as combinations – which are not subject to the CPI price cap. Of
the 48 vaccine licenses in existence in the US in 2004, 17 were issued after 1993 (see Danzon et al. 2005,
Exhibit 1). Moreover, the fact that supplier exit and supply disruptions have occurred for flu vaccine, for
which the government is a minor purchaser and does not set price, suggests that government purchase is
not a necessary condition of firm exits (see below).
The conventional wisdom, that government purchase and “price controls” are the major
contributors to lack of vaccine profitability, predicts that vaccine exit would be positively related to the
quantity purchased by the government and inversely related to the government price. By contrast, our
model predicts that exit is triggered by static and dynamic competition, due to the high fixed costs and
concentrated market demand. This model predicts that vaccine exit is positively related to the number of
competitors and is more likely following entry of competitor vaccines that have some clear technological
superiority, particularly if this superiority is reinforced by government recommendations. Similarly, entry
of combination products is likely to displace the single components or smaller combinations.
In addition to withdrawal of vaccine products, the number of vaccine manufacturers has also been
reduced through mergers, including the acquisition of Connaught Laboratories by the Mérieux Institute in
1989 and Chiron’s purchase of Sclavo in 1998 and Powderject in 2003. Merger of firms need not
necessarily lead to exit of products; for example, if the merger is motivated by economies of scope across
vaccine types, the range of combination products offered following a merger might increase. But if being
acquired by another vaccine manufacturer is the least cost way of absorbing the excess production
capacity for a product that has become obsolete, then an acquired product would be more likely to exit. In
that case the merger would be a symptom rather than the underlying cause of the exit of the obsolete
product.
IV. Data and Methods
Data
We collected data on the dates of grant and withdrawal of all vaccine licenses authorized by the
FDA for the period 1901 to 2003. For most of our analysis, the unit of observation is a vaccine product
license, which authorizes a specific product and plant to manufacture that product. For vaccines that are
used both alone and in various combinations, each component vaccine and each combination has a
separate license and counts a a separate observation. For example, diphtheria vaccine exists alone and has
13
been used in seven combinations, tetanus exists alone and has been used in eight combinations. During
our time period, 241 licenses were granted, of which 179 were withdrawn and 62 survived as of 2003.
We also report some analysis of exit at the firm level, using the FDA data on the firm holding the
license. Thirty nine firms held at least one license during our time period; of these, 10 were acquired and
12 exited from the vaccine business (as measured by no subsequent vaccine licenses).
We obtained quantities purchased and prices paid by CDC, by vaccine, for all years for which data
were available. Where data were missing for a few years, we imputed missing values by extrapolating
between adjacent values.
Methods, Variable Definitions and Hypotheses
Because we have interval censored data, we estimate a hazard model of vaccine exit, using a
complementary log log function with time varying values of co-variates:
Hjt= h{Cj,t-1, Rj,t-1,Zt-1, Xt-1 } (1)
In equation (1), Hjt is the hazard of exit of product j in period t, conditional on being licensed in
period t-1. Explanatory variables include various measures of competition, C; measures of CDC
purchase and other regulatory influence, R; other product-specific or firm-specific characteristics, Z; and
other factors, X. These variables and related hypotheses are defined below.
Competition Since many vaccines exist both as single products and in combination with
other products (e.g. diphtheria + tetanus +pertussis (DTaP); measles, mumps, rubella (MMR)), there is no
unique measure of number of competitors for each vaccine. We considered three alternative measures of
number of competitor products: Direct Competitors is the number of variants of a specific vaccine (e.g.
diphtheria alone) produced by all firms, and Indirect Competitors includes all combinations that include
the specific vaccine (e.g. all combinations that include diphtheria); and All Competitors is the sum of
Direct and Indirect Competitors. Exit is expected to be positively related to both direct and indirect
competition. Greater effects are predicted for Direct Competitors (same vaccine) if substitutability is the
only issue; however, if patients prefer combination products over single vaccines (due to the greater
convenience, lower time costs and perhaps lower out-of-pocket cost), then Indirect Competitors is
expected to have a larger effect on exit hazards than Direct Competitors. We also include an indicator
variable, Single, for products that are the sole source of a particular vaccine. Single products are less
likely to exit, assuming that sole suppliers face higher mean and lower variance of expected revenue than
producers that face competitors.
14
To test for effects of dynamic quality competition, we include the number of New Products of
exactly the same vaccine type between years t and t+1. New product entry is expected to be increase the
likelihood of exit of established products, if newer entrants on average have superior attributes compared
to existing products. We also tested measures of entry defined over t-2 to t+2. The measure reported here,
based on entrants in t to t+1, was consistently the most significant, suggesting that exit responds to
anticipated as well as actual entry. This variable includes new vaccines introduced by each vaccine’s
parent firm, so it reflects a firm’s own strategy as well as response to competitors. We also include a
binary variable, Input that takes the value 1 if product i is also an input for combinations produced by the
same firm in period t.
Government Recommendation, Procurement and Other Policy Variables Universal
Recommendation is a binary indicator of whether the vaccine was recommended for universal purchase
by the ACIP; it is expected to be negatively related to the product exit hazard, if ACIP recommendation
increases demand for a vaccine. 9
Government procurement is predicted to have a negative effect on price but possibly a positive
effect on volume, with uncertain net effect on exit hazards. To test these hypotheses, we include two
possible measures of the quantity of CDC purchase: total doses of each vaccine type that was purchased
by CDC in t-1 (CDC Quantity) and the expected number of doses purchased by CDC per licensee
(CDCQ/licensee) assuming that the total government purchase were allocated equally among supplier.
These proxies for expected volume are expected to be negatively related to exit hazard, if CDC
procurement increases expected demand for a vaccine. The price per dose paid by CDC for each vaccine
type in t-1 (CDCPrice) is expected to be inversely related to the exit hazard. A binary variable indicates
the years before 1966, the first year of any CDC procurement (Pre CDC) and another binary variable
indicates if a vaccine type was not purchased by CDC in t-1 (No CDC).10 If the net effect of government
procurement is to increase the likelihood of vaccine exit, the coefficient of No CDC should be negative.
A similar prediction applies tentatively to Pre-CDC; however, since other factors also changed between
the pre-1966 and post-1966 environment, including many more potential competitors in the market, the
interpretation of this variable is ambiguous and it is included mainly as a control.
A binary variable, Vaccine Compensation Fund it-1, indicates that the vaccine was covered by the
VCF in year t-1; the coefficient is expected to be negative if, by reducing expected liability costs, the
9 We also tested for effects of partial recommendation, but it was not significant. 10 The correlation between Pre CDC and No CDC is only 0.3, because many vaccines were not purchased by CDC, even after 1966.
15
VCF significantly increased manufacturers’ incentives to remain in the market. We also include an
indicator Thimerosal, which indicates vaccines that contained thimerosal in years after 1998; it is
expected to be positive, if the requirement to remove thimerosal imposed in early 1999 contributed to
vaccine exit. OBRA is an indicator for vaccines that were subject to the CPI cap on price increases; it is
expected to be positive if this constraint was binding.
Product and Firm-Specific Factors Age is the number of years since the product license was
first granted; it is expected to be positive if new products offer superior quality and hence tend to displace
older products. Year of Entry measures the vaccine’s year of launch. Acquired is a binary indicator for
vaccines that have been acquired from the original licensee; the coefficient is expected to be positive if
acquisition is a means to exit the market and transfer production capacity to other uses. Foreign is a
binary indicator for non-US firms. If economies of scope across vaccine types are significant, due to
spreading fixed costs of human or physical capital, risk diversification or potential for product
combination, then exit is less likely for diversified firms. To test whether vaccines are less likely to be
withdrawn if the manufacturer has a large or diversified vaccine portfolio across which to spread firm-
specific fixed costs, we include a Hirfindahl index of concentration of each manufacturer’s products over
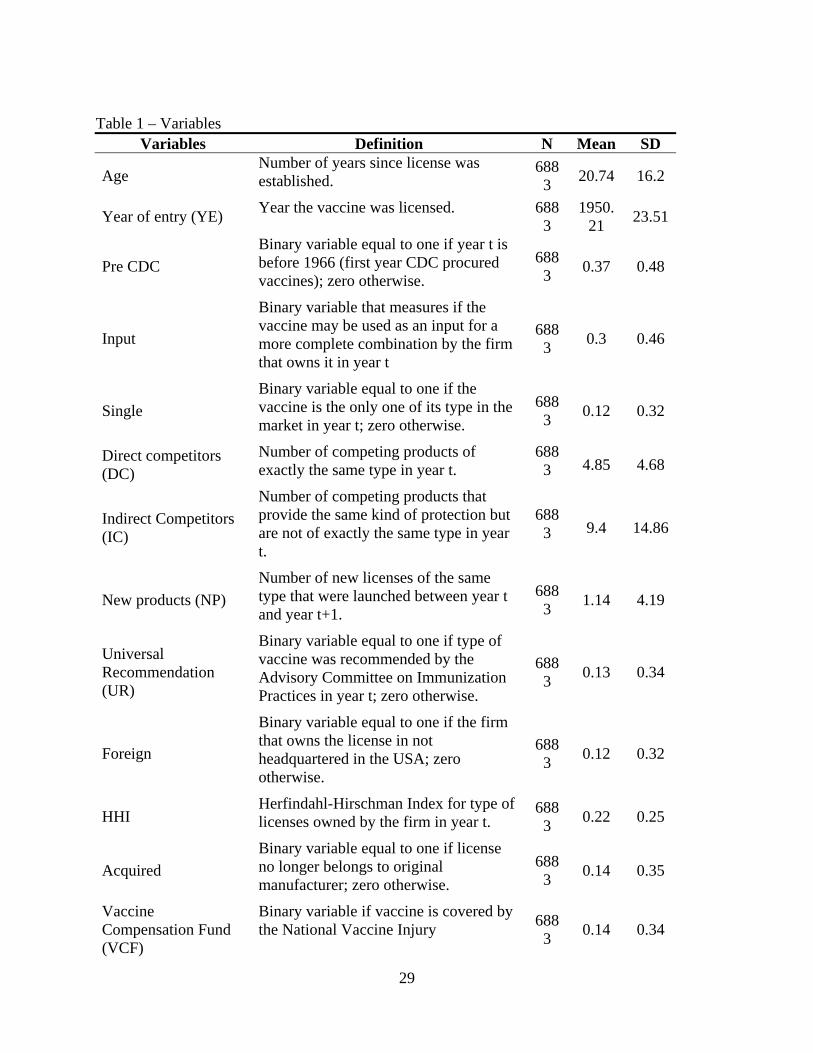
vaccine types.11 Appendix Table 1 lists variable definitions with means and standard deviations.
IV. Descriptive Evidence
There were 241 vaccine product licenses granted between 1901 and 2003, of which 179 were
withdrawn and 62 survived as of 2003. There are a total of 45 producers in the market this period,
including several government and academic suppliers. Of these, 18 remained as of 2003.
Figure 1 shows the number of entries, exits and total number of licenses by year, for the period
1901-2003. There are few vaccines in the first three decades, with products for polio (1901), smallpox
(1903), rabies (1915) and typhoid (1916). Entry occurs steadily from the mid1930s onward, with spikes
around 1952, 1963 and 1970 reflecting entry of 13, 11 and 39 new licenses, respectively.
Exits are rare initially, with only 3 prior to 1970. In 1970, 12 exits occur, of which 11 are due to
the exit of a single manufacturer (Miles Inc.). Another large spurt of exits occurs in 1977 through 1981,
possibly related to the mid-70s liability “crisis” which raised the price and reduced availability of product
liability insurance. This large exit flow again reflects multiple products of a few manufacturers, in
11 We also considered a measure of the number of vaccines licenses held by that manufacturer in t-1. This was highly correlated with the Hirfindahl, and was therefore dropped.

16
particular: Eli Lilly withdrew 14 products; Dow Chemical withdrew 11 products and exited totally in
1978; the Texas Department of Health Resources withdrew 7 products and exited totally in 1979; Pfizer
withdrew 4 oral polio products and exited totally in 1979; and Parke Davis withdrew 16 products and
exited totally in 1981. These products that were withdrawn between 1970 and 1981 represent several
different vaccine types, but many were variants of diphtheria and tetanus, which had become very
crowded markets. Partly in response to this exodus of manufacturers from the vaccine market, the
Vaccine Compensation Fund was established in 1986. Whether for this or other reasons, no more
manufacturer exits occurred until 1988, when Eli Lilly withdrew its last product and exited, followed by
Wellcome in 1994 and Parkedale in 2001. The spike of product exits in 2000-2003 includes 5 by Bioport,
4 by Aventis Pasteur and 14 by Wyeth.
To illustrate the life-cycle of competitive entry, Figure 2 plots the mean number of products of
given vaccine type, by year from the date of first launch of that type. The predicting equation is a simple
regression of number of competitors on an intercept and a quadratic in years since launch, all of which
are significant at the 1% level. Separate estimates are made for Direct Competitors (same product) and
for Indirect Competitors (combinations that include this product). Interestingly, entry occurs mainly in
Indirect Competitors. The predicted number of Direct Competitors increases slowly from launch to reach
a maximum of about 4 and then declines slowly. By contrast, the predicted number of Indirect
Competitors increases more sharply and peaks at roughly fourteen.12 Note that within the average pattern
of life-cycle entry shown in Figure 3, the experience varies across different vaccine types. In particular,
some of the mandated pediatric vaccines, especially diphtheria, tetanus and pertussis, were in numerous
combinations in the 1970s and then were combined with Hib, Hepatitis B and inactivated polio more
recently. At the other extreme, vaccines such as smallpox, rabies, cholera, lyme disease, have had only
one or two suppliers throughout their life-cycles and have never been combined with other vaccines. We
report the multivariate analysis of product exit based on the full sample; however, results were essentially
the same and significance increased slightly when we excluded those vaccines that had only a single
producer over the entire period.
12 The predicted median survival of these products is thirty years, with 25th and 75th percentiles at 17 and 49 years, respectively, and a mean of 33.8 years. These predicted values are from a Kaplan-Meier survival estimator applied to the censored observations.
17
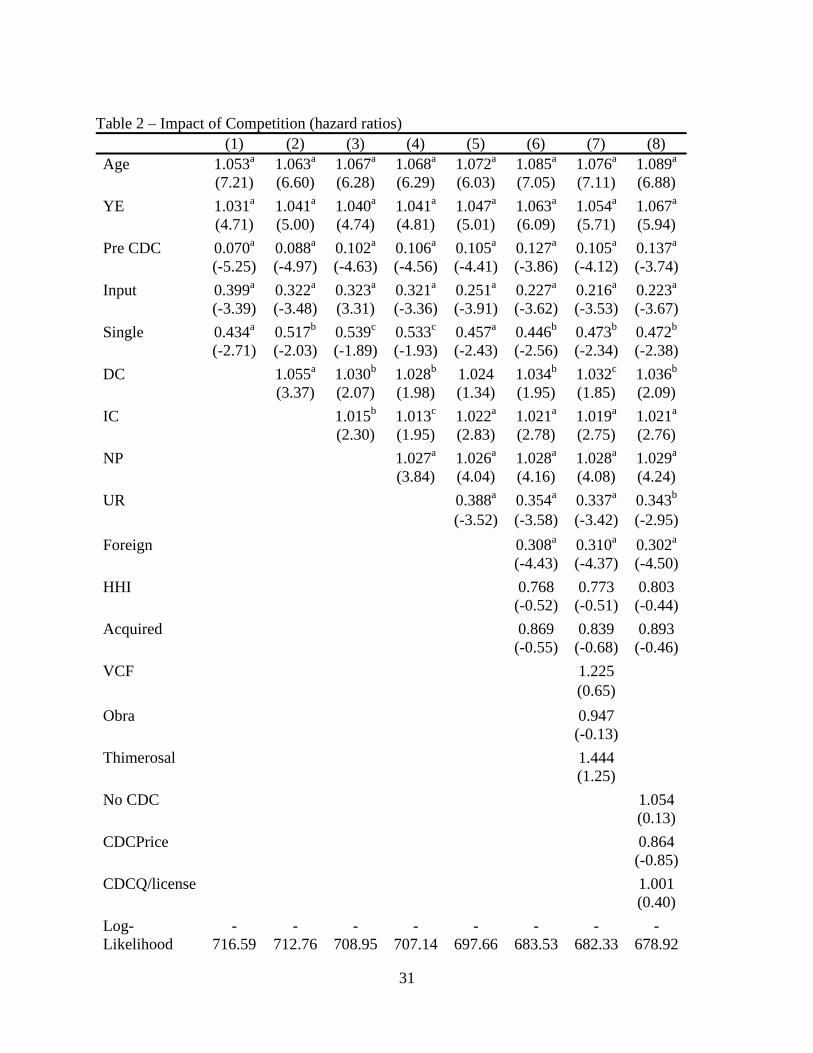
V. Hazard Function Analysis of Vaccine Exit
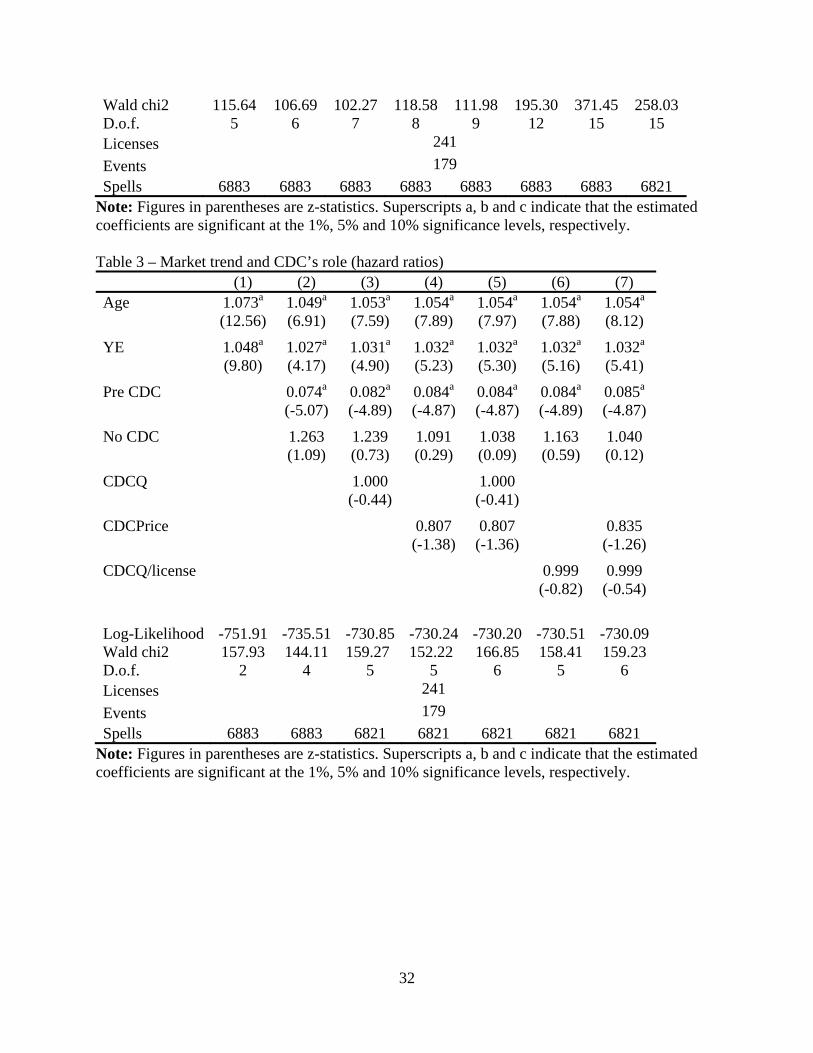
Table 2 reports hazard ratios from the hazard function analysis of vaccine exit, including measures
of competition, regulation, product and firm characteristics. Table 3 reports alternative specifications to
estimate the effects of CDC purchase, controlling only for product age and year of entry.
In Table 2, the first equation includes only basic product characteristics and a control for the pre-
CDC time period. Successive specifications then add various measures of competition, firm
characteristics and regulation. The hazard rate of exit increases between 5 and 9 percent for each year the
vaccine is on the market. However, this rate also increases around 3 to 6 percent with year of entry,
implying that newer vintage vaccines are at higher risk of exit. These estimates are robust to the addition
of measures of competition, regulation and other characteristics. The pre-CDC indicator is strongly
negative, implying that vaccine exit risk was much lower in the pre-CDC era. The estimated effect of the
pre-CDC indicator declines but remains significantly negative in specifications that control for measures
of competition, and CDC prices and quantities.
Controlling for these basic product and time period characteristics, each additional Direct
Competitor increases the exit hazard rate by close to 3 percent, and each additional Indirect Competitor
increases exit hazard rate by 2 percent. Controlling for number of competitors in year t, the entry of new
competitors in year t to t+1 increases the exit hazard of established firms by 2 percent, consistent with the
dynamic competition hypothesis, that new entrants are typically superior products and therefore tend to
accelerate the exit of established firms. Vaccines that are monopoly suppliers (Single) see their hazard
rate decrease by 40 percent than vaccines that have competitors. This supports the hypothesis that
competition contributes to low prices and hence that sole supplier products are more able to achieve
prices necessary to cover long run costs. Vaccines that are inputs to combinations are exiting the market
at a rate that is 70 percent lower than other vaccines, as expected if these core input vaccine tend to
complement rather than substitute for the combination vaccines to which they contribute.
The effects of policy variables are mixed. Vaccines that are recommended for Universal Purchase
exit the market at a rate that is 60 percent lower. Controlling for Universal Purchase, we find no
significant effect of whether or not the CDC is a purchaser of the vaccine, the volume of units purchased
by the CDC purchase or the CDC price. Similarly, we find no significant effect of eligibility for the
Vaccine Compensation Fund or the indicator that a vaccine was subject to the OBRA price control.
Following the adverse publicity over thimerosal in 1998 and requirement to eliminate it in early 1999,
18
products that contained thimerosal have an exit hazard that is 44 percent higher. Although this coefficient
is not significant at conventional levels, this may reflect the very small number of products involved.
Vaccines that have been acquired are less likely to exit than vaccines that are still owned by their
originator firm, but this result is not significant. This evidence suggests that merger of firms has not been
a major contributor to exit of vaccine products, although it has of course reduced the number of vaccine
suppliers. Rather, the evidence here tentatively supports the theory of merger as a market for corporate
control, in which vaccines are acquired in order to enhance their market potential, not as a means to
eliminate excess capacity. The Hirfindahl measure of a firm’s vaccine portfolio is not significant.
However, vaccines produced by foreign firms are less likely to exit, exhibiting a hazard rate that is close
to 70 percent lower than US firms. This could suggest that foreign firms face higher regulatory and other
costs of entry, such that foreign firms only launch in the US the subset of their products that have
atypically high potential value and survival potential.
Table 3 reports more detailed attempts to estimate the effects of CDC purchasing. Controlling for a
vaccines age and cohort, the indicator for the pre-CDC time period is strongly negative, implying
increased exit risk in the post-CDC time period. Controlling for these factors, the coefficient on the
indicator for no CDC purchase is positive but not significant. The measures of CDC quantity are negative
but never approoach significance. The CDC price is negative, consistent with the expectation that a lower
price should increase the exit hazard, but the coefficient is not significant at conventional levels. Our
CDC price and quantity variables may be measured with error, which may create bias towards finding no
significant effects. We lack data on private sector list or transactions prices and hence are unable to
normalize the CDC price by the private sector price.13 Overall, these results based on the universe of
vaccines for the entire industry lifetime seem to suggest that having a Universal Purchase
recommendation significantly reduces the probability of exit, consistent with the prediction that universal
purchase increases demand for a vaccine. However, the volume and price of CDC purchase do not appear
to have significant effects, possibly because the negative effect of government purchase on price is offset
by the positive effect on volume, leading to no significant net effect.
We also analyzed the causes behind firms exiting the vaccine business overall. Even though there
are firm-specific factors underling each firm’s decision to exit the vaccines market, it is possible to find
some common features across those decisions. Table 4 presents the hazard rates from the survival
13 Even if list prices to private purchasers were available, these would not measure transactions prices which are often significantly discounted.
19
analysis of firms in the vaccine market. We also ran regressions separating whether the exit was due to
the closing or acquisition of the firm.
The hazard rate of exit increases around 10 percent for each year the firm has been in the
market, which is consistent with the hypothesis that increasing costs of regulatory compliance as
technologies become obsolete may contribute to the exit of several firms. At the same time, firms that
entered the market later are less likely to stay in the market and are more likely to be acquired,
presumably because these are small firms formed to develop newer technologies that become desirable
to established firms. Although having recently obtained a new license does not affect the likelihood of
exit, it decreases the likelihood of a firm being acquired.
VI. Evidence from Other Industrialized Countries
High fixed costs would be most widely spread if each vaccine were distributed globally. In fact,
the diffusion of vaccines appears to be more limited than for many drugs, even across industrialized
countries. Table 5 lists the licensed producers of each of the major pediatric vaccines and several adult
vaccines in Canada, France, Portugal, the UK, and the US.
These data are broadly consistent with hypotheses outlined here, that vaccine production entails
high country-specific fixed costs and concentrated demand, such that each market supports at most a few
producers. As predicted, each country has few producers of each vaccine. However, for several vaccine
types, the US has fewer producers than these other countries which all have smaller potential volumes
and more dominant government purchase.14 The fact that several firms have products available in these
countries that are not available in the US suggests that entry into the US is not attractive, given the fixed
costs of entry combined with price and volume uncertainty of competing with established products.
The number of licenses per manufacturer and vaccine is also often higher in Canada and Europe
than in the US. This suggests that the cost of compliance with more stringent regulatory requirements
may contribute to fewer licensed products being maintained in the US. Note that in Exhibit 1 the US
licenses include some that are inactive and some for further manufacturing only, hence this count of
licenses overstates the number of active producers in the US compared to, say, Canada. These data also
indicate that, although national immunization plans are similar across developed countries, the specific
vaccines recommended within each category still vary, for example, in the use of combination vaccines.
14 Although we were unable to obtain reliable price data, the limited data available to us indicate that foreign prices are no higher and usually lower than in the US.
20
Country-specific requirements limit the potential for manufacturing economies of scale and may require
the development of country-specific products.
VII. Flu Vaccine – A Case Study
A brief history of the supply of flu vaccine in the US illustrates how fixed costs, dynamic
competition and preemptive effects of superior products can lead to few suppliers, despite a limited role
for government purchase. Influenza is an extreme case of limited storability. The influenza virus has two
strains: Type A, which has several subtypes, and Type B. Because these types undergo antigenic “drift”,
the influenza vaccine must be reconstituted each year to match the circulating strains. Since 1998, the
World Health Organization has issued separate recommendations in February and September for the
Northern and Southern Hemispheres, respectively.15 In the US, the vaccine composition for the upcoming
flu season is determined between February and March. Since the peak flu season is November-March,
manufacturers must supply the vaccine by October to early November.
The injectable vaccine is traditionally cultured on embryonic eggs, then sterilized, monovalent
concentrates are produced and combined into the trivalent form, with comprehensive quality control at
each step in the process. This time consuming process requires that supply be estimated almost a year in
advance and quick ramp up of production is impossible. A newer method of culturing the viruses using
mammalian cells is not yet approved in the US.
There has been a significant increase in flu vaccine production since the approximately 20 million
doses distributed annually in the mid-1980’s.16 In 1993, flu vaccine was covered under Medicaid and
Medicare Part B. Prior to 2000, the ACIP recommended vaccination primarily of seniors and other high
risk individuals. In 2000, the ACIP recommendation was extended to people aged 50 to 65 and to infants
aged 6-23 months in 2002. In 2003, pediatric vaccination was approved for use of VFC funds. By 2009,
the number of doses per year had increased to 113 million (Table 8). Actual uptake has increased but
remained unpredictable at less than 50% of the recommended population. In 2001, only 87.7M of the
recommended 152M people were vaccinated.17 In 2003, although recommended recipients increased to
15 D. Lavanchy, WHO Influenza Surveillance, Geneva, Switzerland (5 January 2001). 16 U.S. Food and Drug Administration, Center for Biologics Evaluation and Research, “Availability of Influenza Virus Vaccine 1999,” http://www.fda.gov/cber/infosheets/flu092999.htm (15 November 2004). 17 Dr. Bridges, “General Influenza,” Current Issues in Immunization, Net Conference, 8 July 2004, http://www.cdc.gov/nip/ed/ciinc/nc_July_08.htm (15 November 2004).
21
182M, manufacturers distributed only 83M doses.18
In 1999, there were four manufacturers in the US producing a total of 77.9M doses: Aventis
Pasteur, Wyeth, Parkedale (owned by King Pharmaceuticals), and Powderject (acquired by Chiron, now
part of Novartis). In October 1999, Parkedale was cited by the FDA for cGMP violations. Six months
later, Parkedale was ordered to halt production and distribution because it remained out of compliance.
On September 27, 2000 the FDA again ordered operations halted, giving the company 30 days to
implement changes. But given the short window for effective vaccination, it was unlikely that the
necessary changes could be completed for that year’s season. Instead, Parkedale announced its
withdrawal from flu vaccine production, writing off some $45M rather than incurring the costs of
upgrading. Wyeth had produced influenza vaccine for the US market for over two decades. In October of
2000, Wyeth was fined $30M for cGMP violations and an additional $15,000 per day out of compliance
(capped at $5M).19 In November 2002, Wyeth announced that it would exit, which left only 2
manufacturers of injectible influenza vaccine.20
In December 2002, shortly after Wyeth’s exit, Aventis pledged $80 million investment to increase
filling and formulation capacity, in addition to significant capital investments in 2001 to increase its
capacity by 20%.21 In early 2003, Chiron acquired its Liverpool plant from Powderject and began
aggressive expansion to serve the expected growth in US demand. Chiron produced 25.6M doses in 2002,
and 35.6M in 2003. Before being shut down by the UK regulatory authorities just weeks before the 2004
influenza season, Chiron estimated it would produce 46-48M doses for the US. It has been suggested this
rapid expansion at an aging factory contributed to the contamination problems that occurred.22 About $75
million has been spent to upgrade the factory in the last five years. In addition, Chiron committed to
spending another $100 million to replace part of the plant.23
In July 2003, FluMist, an intranasally administered, live attenuated influenza vaccine (LAIV), 18 W.A. Orenstein, “Background/Overview/Meeting Objectives” (Conference Presentation) National Influenza Summit, 22-23 May 2002, http://www.ama-assn.org (15 November 2004). 19 “Weakened Immunity: How the Food and Drug Administration Caused Recent Vaccine-Supply Problems,” The Lighthouse 9, no. 1 (Summer 2004). 20 D. Brown, “How U.S. Got Down to Two Makers Of Flu Vaccine,” Washington Post, 17 October 2004: A01. 21 Aventis Pasteur, “Aventis Pasteur Announces Plans to Meet U.S. Demand for Influenza Vaccine” Press Release, 2 December 2002, www.us.aventispasteur.com (15 November 2004). 22 "The problem was they really stressed the system this year to get to that 50, 52 million doses," said Geoffrey C. Porges, an analyst at Sanford C. Bernstein & Company who formerly worked in the vaccines business at Merck. 23 G. Frankel and G. Cooper, “Britain: U.S. Told Of Vaccine Shortage: Flu Shot Records Contradict FDA” Washington Post Foreign Service, 9 October 2004, A01.
22
produced by MedImmune was approved. But because of its restricted indications (initially, for use in
healthy people aged 5 – 50) and its relatively high price, FluMist captured only a small share of the
expanding market. More generally, LAIV products are unlikely to alleviate vaccine shortages because
they are restricted to low risk individuals and they rely on the same embryonic egg based process. For
2004-2005, MedImmune planned to make only 2M doses, despite a capacity to make 20M doses.24
This shrinkage of the number of flu vaccine suppliers cannot be blamed on government purchase
and price controls. Less than 20% is publicly purchased.25 Medicare reimbursement for flu vaccine is at
95 percent of Average Wholesale Price (AWP), which is a list price set by manufacturers.26 Although
provider reimbursement is at 95% of AWP, manufacturer prices are determined by competitive bids for
sales to physicians, hospitals and others who dispense flu vaccine. Thus manufacturer prices for flu
vaccines reflect competition rather than regulation. Given the high fixed costs and low marginal costs and
total absence of storability of flu vaccine, it is not surprising that competition leads to low prices. Faced
with low prices and volatile demand, manufacturers have chosen to exit rather than incur the significant
costs of bringing manufacturing capacity up to the high standards required. Unpredictability resulting
from the production technology and the very short demand window are also critical. Despite the reality of
repeated shortages, millions of doses are wasted each year, because of overall demand uncertainty and
mismatch of supply to meet the narrow demand window (see Table 6).
But the US flu market also illustrates the importance of threat of dynamic competition from
superior products in vaccine investment decisions. While manufacturers are reluctant to invest additional
capacity based on current embryonic egg based methods, several companies are developing mammalian
cell-based vaccines. Mammalian cell-derived vaccines are expected to provide equivalent or better
efficacy, with lower contamination risk, less wastage and shorter production time (see Table 7).27
In 2003, Solvay's Influvac TC (cell culture) product was approved in the Netherlands, and since
24 U.S. Centers for Disease Control and Prevention, “Using Live, Attenuated Influenza Vaccine for Prevention and Control of Influenza: Supplemental Recommendations of the Advisory Committee on Immunization Practices (ACIP),” 52(RR13) (26 September 2003): 1-8, http://www.cdc.gov/mmwr/preview/mmwrhtml/Table%201 (15 November 2004). 25 P. Hosbach, “Aventis Pasteur Perspective,” National Influenza Summit (20-22 May 2003), http://www.ama-assn.org (15 November 2004). 26 Although Medicare reimbursement for other Part B drugs changed in 2004 to average selling price (ASP) plus 6 percent, reimbursement for flu, pneumoccocal and Hepatitis B vaccines remains at 95% of AWP. 27 “Comparison of large-scale mammalian cell culture systems with egg culture for the production of influenza virus A vaccine strains” Vaccines 19, no. 25-26 (14 May 2001): 3444-3450.
23
then has been approved in over 60 countries. 28 No cell culture influenza vaccine is yet approved in the
US but several are in clinical trials.29 Given the potential superiority of cell-based products, egg-based
products are likely to become obsolete, hence further investment in egg-based capacity is not worthwhile
without government subsidy. In November 2009, Novartis inaugurated the US’s first large scale flu cell
culture vaccine manufacturing facility, that is planned to be running at full scale commercial production
in 2013. 30 But at the same time, an FDA advisory panel rejected approval of the US’s first cell-based
influenza vaccine developed by Protein Sciences Corporation.31
The global supply of flu vaccines (Table 8) shows a lack of global diffusion similar to other
vaccines in Table 5. There are over 30 manufacturers of flu vaccine worldwide but many operate in a
limited number of countries.32 Solvay (now part of Abbott Laboratories), one of the EU’s largest
suppliers and the leader in the new cell-based methods, does not have a product approved in the US.
Despite potential for growth in the US market and lack of government price controls, there was little
incentive for other companies to enter or expand using the old technology, although entry was anticipated
and is now occurring with newer technologies that will likely eventually render the old technology
obsolete. The 2004-2005 Influenza Vaccine Shortage, together with the need to develop resources to
address a potential pandemic outbreak, including the avian influenza in 2005 and the H1N1 swine flu in
2009, therefore led the US government to award grants to help companies expand their influenza vaccine
capacity and develop faster and more reliable processes to manufacture the vaccine than the traditional
egg culture vaccines.
Furthermore, the recommendation for the annual influenza vaccination by the CDC’s Advisory
Committee on Immunization Practices has been enlarged to cover around 300 million people compared
to 200 million in 2004.33 These changes stimulated an increase in the number of producers from three in
2004 to five in 2010.
28 Solvay Pharmaceuticals was acquired by Abbott in September 2009 http://www.abbott.com/global/url/pressRelease/en_US/60.5:5/Press_Release_0781.htm 29 These include small new entrants to the flu vaccine business, such as Protein Sciences, BioDiem, and Vaxin Technology, some with funding from NIH, as well as Sanofi-Aventis and GlaxoSmithKline. Chiron's influenza cell-culture research program has completed Phase II clinical trials in Europe. 30 http://www.novartis.com/newsroom/media-releases/en/2009/1356789.shtml 31 http://www.medpagetoday.com/InfectiousDisease/URItheFlu/17128 32 World Health Organization, “Influenza Vaccine Manufacturers,” http://www.who.int/csr/disease/influenza/manulist/en/ (15 November 2004).
33 http://www.cdc.gov/flu/professionals/vaccination/pdf/influenza_vaccine_target_populations.pdf
24
Nevertheless, and even though the market for seasonal influenza vaccines across the seven major
markets (United States, Japan, France, Germany, Italy, Spain and UK), has had a strong compound
annual growth rate of 12.6% since 2005, in fact the US market is still dominated by a small number of
firms, with Sanofi-Pasteur, GSK and Novartis (formerly Chiron) producing more than 90% of the
vaccines. 34 Since this demand growth will likely flatten off, further consolidation of this market may be
likely.
Conclusions
This analysis suggests that US vaccine markets are likely to reach equilibrium with only one or at
most a few suppliers of each vaccine type. This reflects the interaction of high fixed costs with
concentrated, price-sensitive demand and dynamic quality competition in which product superiority is
reinforced by government recommendation. In such conditions, there is no incentive to introduce “me-
too” vaccines, which could not plausibly compete with established firms unless they offer some clear
quality or cost advantage. Consequently, new vaccine R&D targets improved technologies for existing
vaccines or new vaccine categories. Entry of superior products in turn leads to exit of the now obsolete
inferior products. Many vaccines that are approved in other industrialized markets have not applied to
enter the US, presumably due in part to high costs of regulatory approval and manufacturing compliance,
combined with limited and risky demand, with both price and volume uncertainty if multiple firms are
competing for the business. The flu vaccine illustrates the contribution to supply problems of high
regulatory hurdles, fixed costs, demand uncertainty and the threat of dynamic competition. Pediatric
vaccines face similar regulatory, cost and dynamic competitive conditions; pricing may be more
controlled, due to the large market share purchased by the CDC, but volume is more predictable,
provided that there are only one or two suppliers in the market.
These economic realities pose difficult policy challenges. Harmonization of country-specific
regulatory requirements might increase the diffusion of products across the industrialized markets,
particularly between the EU, Canada and the US. However, given the importance of vaccine policy to
public health, national health authorities are unlikely to delegate autonomy on vaccine recommendations
and schedules. Perhaps the best hope comes from scientific advances that may improve the storability of
vaccines or reduce the lead time required for production. Such improvements would mitigate temporary
34 http://www.tradingmarkets.com/news/stock-alert/abt_abbott-calls-off-sale-of-flu-vaccine-business-in-europe-1149378.html

25
supply disruptions. Although stockpiles would not protect against withdrawal of a sole supplier, both
theory and our empirical evidence show that a sole supplier is much less likely to exit, unless a superior
product enters the market. But while new technologies are our best hope in the long run, in the short run
new technologies may exacerbate supply shortages, by undermining incentives to invest in older plants
that are destined to become obsolete.
26
References
Arnould, R. and L. De Brock. 1996. “The Application of Economic Theory to the Vaccine Market.” In Supplying Vaccines: An Economic Analysis of Critical Issues. Edited by M.V. Pauly, C.A. Robinson, S. Sepe, M. Sing, and M.K. Willan, Amsterdam:IOS Press.
Aventis Pasteur. 2002. “Aventis Pasteur Announces Plans to Meet U.S. Demand for Influenza
Vaccine.” Press Release, 2 December 2002, www.us.aventispasteur.com.
Aventis Pasteur, 2004 Bridges Dr. 2004. “General Influenza.” Current Issues in Immunization, Net Conference, 8 July
2004, http://www.cdc.gov/nip/ed/ciinc/nc_July_08.htm (15 November 2004). Brown, D. 2004. “How U.S. Got Down to Two Makers Of Flu Vaccine.” Washington Post, 17
October 2004: A01. Carree, Martin and A. Roy Thurik. 1996. “Entry and exit in retailing: incentives, barriers,
displacement and replacement”. Review of Industrial 11: 155-172. Caves, Richard E.. 1998. “Industrial organization and new finding s on turnover and
mobility of firms”. Journal of Economic Literature 36(4): 1947-1982.
Danzon, P., N. Pereira and S, Tejwani. 2005.”Vaccine Supply: A Cross-National Perspective” Health Affairs 24(3): 706-717.
DeBrock, L.M. and H. Grabowski. 1985. “Economic Aspects of Vaccine Innovation and
Manufacturing.” In Vaccine Supply and Innovation, Institute of Medicine. Washington D.D.: National Academy Press.
Disney, Richard, Jonathan Haskel and Ylda Heden. 2003. “Entry, exit and establishment
survival in UK manufacturing”. The Journal of Industrial Economics 51(1): 91-112. Dunne, T., M. J. Roberts, and L. Samuelson. 1988. “Patterns of Firm Entry and Exit in US
Manufacturing Industries”. RAND Journal of Economics 19(4): 495-515. Foulkes, Arthur E. 2004. “Weakened Immunity: How the Food and Drug Administration Caused
Recent Vaccine-Supply Problems.” The Lighthouse 9, no. 1 (Summer 2004). Frankel G. and G. Cooper. 2004. “Britain: U.S. Told Of Vaccine Shortage: Flu Shot Records
Contradict FDA.” Washington Post Foreign Service, 9 October 2004, A01.
Geroski and Jacquemin, 1985
27
Ghemawat, Pankaj and Barry Nalebuff. 1985. “Exit”. RAND Journal of Economics 16(2): 184-194.
Ghemawat, Pankaj and Barry Nalebuff. 1990. “The Devolution of Declining Industries”.
Quarterly Journal of Economics 105(1): 167-186.
Grabowski, Henry. 2005. “Encouraging The Development Of New Vaccines”. Health Affairs 24(3): 697-700
Hosbach P. 2004. “Aventis Pasteur Perspective.” National Influenza Summit (20-22 May 2003),
http://www.ama-assn.org (15 November 2004). Institute of Medicine. 2003. “Financing Vaccines in the 21st Century: Assuring Access and
Availability.” Washington, DC: IOM. Jarrett S. 2002. “Procurement Strategies for Drugs and Vaccines.” Wharton Impact Conference on
Pharmaceutical Innovation in a Global Economy. Philadelphia: 4-5 October 2002. Jovanovic, Boyan, 1992. "Selection and the Evolution of Industry". Econometrica, Econometric
Society, vol. 50(3): 649-670 Kauf, T.L. 1999. “Price Discrimination and Bargaining Power in the U.S. Vaccine Market:
Implications for Childhood Immunization Policy.” Quarterly Review of Economics and Finance 39:249-265.
Klepper, Steven. 1996. “Entry, exit, growth, and innovation over the product life cycle”.
American Economic Review 86(3): 562-583. Klepper, Steven and John H. Miller. 1995. “Entry, exit, and shakeouts in the United States in
new manufactures products”. International Journal of Industrial Organization 12: 567-591. Lavanchy D. 2001. WHO Influenza Surveillance. Geneva, Switzerland (5 January 2001). Mercer Management Consulting. 2002. “Lessons Learned: New Procurement Strategies for
Vaccines.” Final Report to the GAVI Board. http://www.vaccinealliance.org/Support_to_Country/vpp/index.php.
Miles Inc. Nidus Information Services Inc. 2004. “What are the Vaccines for Diphtheria, Tetanus, and
Pertussis?” http://www.nym.org/healthinfo/docs/090/doc90diphtheria.html (15 November 2004). Orenstein W.A. 2002. “Background/Overview/Meeting Objectives” (Conference Presentation).
National Influenza Summit, 22-23 May 2002, http://www.ama-assn.org (15 November 2004).
28
Ruebeck, Christopher S. 2005. “Model exit in a vertically differentiated market: interfirm competition versus intrafirm cannibalization in the computer hard disk drive industry”. Review of Industrial Organization 26: 27-59.
Salkever,D. and R. Frank. 1996. “Economic Issues in Vaccine Purchase Arrangements.” In
Supplying Vaccines: An Economic Analysis of Critical Issues. Edited by M.V. Pauly, C.A. Robinson, S. Sepe, M. Sing, and M.K. Willan, Amsterdam:IOS Press.
Scherer, F.M. 2007. “An Industrial Organization Perspective on the Influenza Vaccine Shortage.”
Managerial and Decision Economics. 28:393-405. Thurik, A. Roy and David B. Audretsch. 1996. “The Dynamics of Industrial Organization”.
Review of Industrial Organization 11: 149-153. Tree, Julia A., Catherine Richardson Anthony R. Fook, J. Christopher Clegga and Denis Loobya.
2001. “Comparison of large-scale mammalian cell culture systems with egg culture for the production of influenza virus A vaccine strains.” Vaccines 19, no. 25-26 (14 May 2001): 3444-3450.
U.S. Centers for Disease Control and Prevention. 2003. “Using Live, Attenuated Influenza
Vaccine for Prevention and Control of Influenza: Supplemental Recommendations of the Advisory Committee on Immunization Practices (ACIP).” 52(RR13) (26 September 2003): 1-8, http://www.cdc.gov/mmwr/preview/mmwrhtml/Table%201
U.S. Centers for Disease Control and Prevention, 2004 U.S. Food and Drug Administration, Center for Biologics Evaluation and Research. 2004.
“Availability of Influenza Virus Vaccine 1999,” http://www.fda.gov/cber/infosheets/flu092999.htm (15 November 2004).
U.S. Government Accounting Office. 2002. “Childhood Vaccines: Ensuring and Adequate Supply
Poses Continuing Challenges.” Washington: GAO. World Health Organization. 2004. “Influenza Vaccine Manufacturers,”
http://www.who.int/csr/disease/influenza/manulist/en/ (15 November 2004).
29
Table 1 – Variables
Variables Definition N Mean SD
Age Number of years since license was established.
6883
20.74 16.2
Year of entry (YE) Year the vaccine was licensed. 688
3 1950.
21 23.51
Pre CDC
Binary variable equal to one if year t is before 1966 (first year CDC procured vaccines); zero otherwise.
6883
0.37 0.48
Input
Binary variable that measures if the vaccine may be used as an input for a more complete combination by the firm that owns it in year t
6883
0.3 0.46
Single
Binary variable equal to one if the vaccine is the only one of its type in the market in year t; zero otherwise.
6883
0.12 0.32
Direct competitors (DC)
Number of competing products of exactly the same type in year t.
6883 4.85 4.68
Indirect Competitors (IC)
Number of competing products that provide the same kind of protection but are not of exactly the same type in year t.
6883 9.4 14.86
New products (NP)
Number of new licenses of the same type that were launched between year t and year t+1.
6883
1.14 4.19
Universal Recommendation (UR)
Binary variable equal to one if type of vaccine was recommended by the Advisory Committee on Immunization Practices in year t; zero otherwise.
6883
0.13 0.34
Foreign
Binary variable equal to one if the firm that owns the license in not headquartered in the USA; zero otherwise.
6883
0.12 0.32
HHI Herfindahl-Hirschman Index for type of licenses owned by the firm in year t.
6883
0.22 0.25
Acquired
Binary variable equal to one if license no longer belongs to original manufacturer; zero otherwise.
6883
0.14 0.35
Vaccine Compensation Fund (VCF)
Binary variable if vaccine is covered by the National Vaccine Injury
6883
0.14 0.34
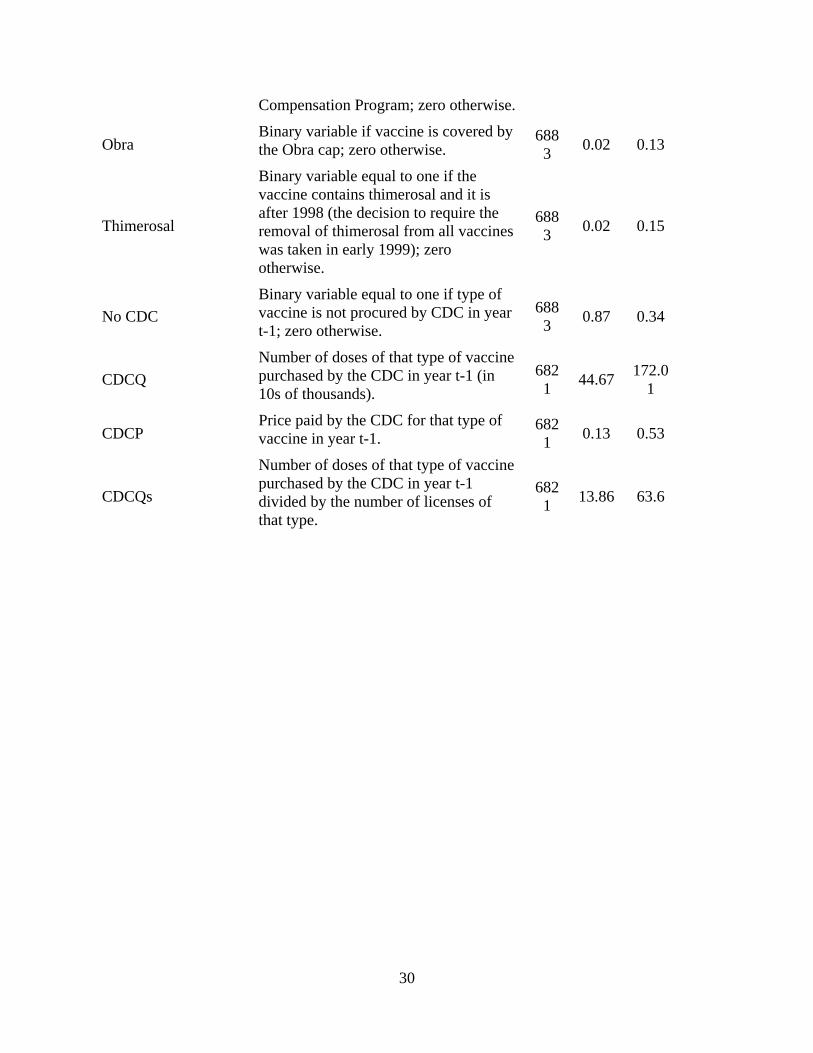
30
Compensation Program; zero otherwise.
Obra Binary variable if vaccine is covered by the Obra cap; zero otherwise.
6883
0.02 0.13
Thimerosal
Binary variable equal to one if the vaccine contains thimerosal and it is after 1998 (the decision to require the removal of thimerosal from all vaccines was taken in early 1999); zero otherwise.
6883
0.02 0.15
No CDC
Binary variable equal to one if type of vaccine is not procured by CDC in year t-1; zero otherwise.
6883
0.87 0.34
CDCQ
Number of doses of that type of vaccine purchased by the CDC in year t-1 (in 10s of thousands).
6821
44.67 172.0
1
CDCP Price paid by the CDC for that type of vaccine in year t-1.
6821
0.13 0.53
CDCQs
Number of doses of that type of vaccine purchased by the CDC in year t-1 divided by the number of licenses of that type.
6821
13.86 63.6
31
Table 2 – Impact of Competition (hazard ratios) (1) (2) (3) (4) (5) (6) (7) (8) Age 1.053a 1.063a 1.067a 1.068a 1.072a 1.085a 1.076a 1.089a
(7.21) (6.60) (6.28) (6.29) (6.03) (7.05) (7.11) (6.88)
YE 1.031a 1.041a 1.040a 1.041a 1.047a 1.063a 1.054a 1.067a (4.71) (5.00) (4.74) (4.81) (5.01) (6.09) (5.71) (5.94)
Pre CDC 0.070a 0.088a 0.102a 0.106a 0.105a 0.127a 0.105a 0.137a (-5.25) (-4.97) (-4.63) (-4.56) (-4.41) (-3.86) (-4.12) (-3.74)
Input 0.399a 0.322a 0.323a 0.321a 0.251a 0.227a 0.216a 0.223a (-3.39) (-3.48) (3.31) (-3.36) (-3.91) (-3.62) (-3.53) (-3.67)
Single 0.434a 0.517b 0.539c 0.533c 0.457a 0.446b 0.473b 0.472b (-2.71) (-2.03) (-1.89) (-1.93) (-2.43) (-2.56) (-2.34) (-2.38)
DC 1.055a 1.030b 1.028b 1.024 1.034b 1.032c 1.036b (3.37) (2.07) (1.98) (1.34) (1.95) (1.85) (2.09)
IC 1.015b 1.013c 1.022a 1.021a 1.019a 1.021a (2.30) (1.95) (2.83) (2.78) (2.75) (2.76)
NP 1.027a 1.026a 1.028a 1.028a 1.029a (3.84) (4.04) (4.16) (4.08) (4.24)
UR 0.388a 0.354a 0.337a 0.343b (-3.52) (-3.58) (-3.42) (-2.95)
Foreign 0.308a 0.310a 0.302a (-4.43) (-4.37) (-4.50)
HHI 0.768 0.773 0.803 (-0.52) (-0.51) (-0.44)
Acquired 0.869 0.839 0.893 (-0.55) (-0.68) (-0.46)
VCF 1.225 (0.65)
Obra 0.947 (-0.13)
Thimerosal 1.444 (1.25)
No CDC 1.054 (0.13)
CDCPrice 0.864 (-0.85)
CDCQ/license 1.001 (0.40)
Log-Likelihood
-716.59
-712.76
-708.95
-707.14
-697.66
-683.53
-682.33
-678.92
32
Wald chi2 115.64 106.69 102.27 118.58 111.98 195.30 371.45 258.03 D.o.f. 5 6 7 8 9 12 15 15 Licenses 241
Events 179
Spells 6883 6883 6883 6883 6883 6883 6883 6821 Note: Figures in parentheses are z-statistics. Superscripts a, b and c indicate that the estimated coefficients are significant at the 1%, 5% and 10% significance levels, respectively. Table 3 – Market trend and CDC’s role (hazard ratios) (1) (2) (3) (4) (5) (6) (7) Age 1.073a 1.049a 1.053a 1.054a 1.054a 1.054a 1.054a (12.56) (6.91) (7.59) (7.89) (7.97) (7.88) (8.12)
YE 1.048a 1.027a 1.031a 1.032a 1.032a 1.032a 1.032a (9.80) (4.17) (4.90) (5.23) (5.30) (5.16) (5.41)
Pre CDC 0.074a 0.082a 0.084a 0.084a 0.084a 0.085a (-5.07) (-4.89) (-4.87) (-4.87) (-4.89) (-4.87)
No CDC 1.263 1.239 1.091 1.038 1.163 1.040 (1.09) (0.73) (0.29) (0.09) (0.59) (0.12)
CDCQ 1.000 1.000 (-0.44) (-0.41)
CDCPrice 0.807 0.807 0.835 (-1.38) (-1.36) (-1.26)
CDCQ/license 0.999 0.999 (-0.82) (-0.54)
Log-Likelihood -751.91 -735.51 -730.85 -730.24 -730.20 -730.51 -730.09 Wald chi2 157.93 144.11 159.27 152.22 166.85 158.41 159.23 D.o.f. 2 4 5 5 6 5 6 Licenses 241
Events 179
Spells 6883 6883 6821 6821 6821 6821 6821 Note: Figures in parentheses are z-statistics. Superscripts a, b and c indicate that the estimated coefficients are significant at the 1%, 5% and 10% significance levels, respectively.
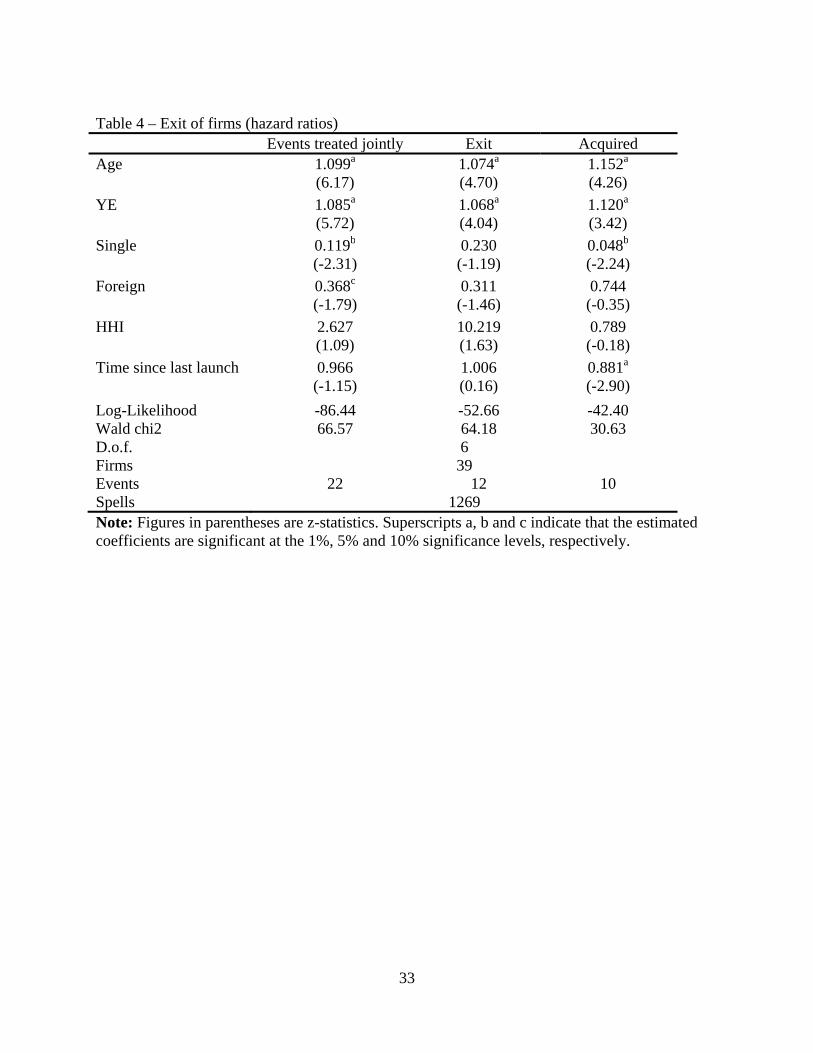
33
Table 4 – Exit of firms (hazard ratios)
Events treated jointly Exit Acquired Age 1.099a 1.074a 1.152a (6.17) (4.70) (4.26)
YE 1.085a 1.068a 1.120a (5.72) (4.04) (3.42)
Single 0.119b 0.230 0.048b (-2.31) (-1.19) (-2.24)
Foreign 0.368c 0.311 0.744 (-1.79) (-1.46) (-0.35)
HHI 2.627 10.219 0.789 (1.09) (1.63) (-0.18)
Time since last launch 0.966 1.006 0.881a (-1.15) (0.16) (-2.90)
Log-Likelihood -86.44 -52.66 -42.40 Wald chi2 66.57 64.18 30.63 D.o.f. 6 Firms 39 Events 22 12 10 Spells 1269 Note: Figures in parentheses are z-statistics. Superscripts a, b and c indicate that the estimated coefficients are significant at the 1%, 5% and 10% significance levels, respectively.
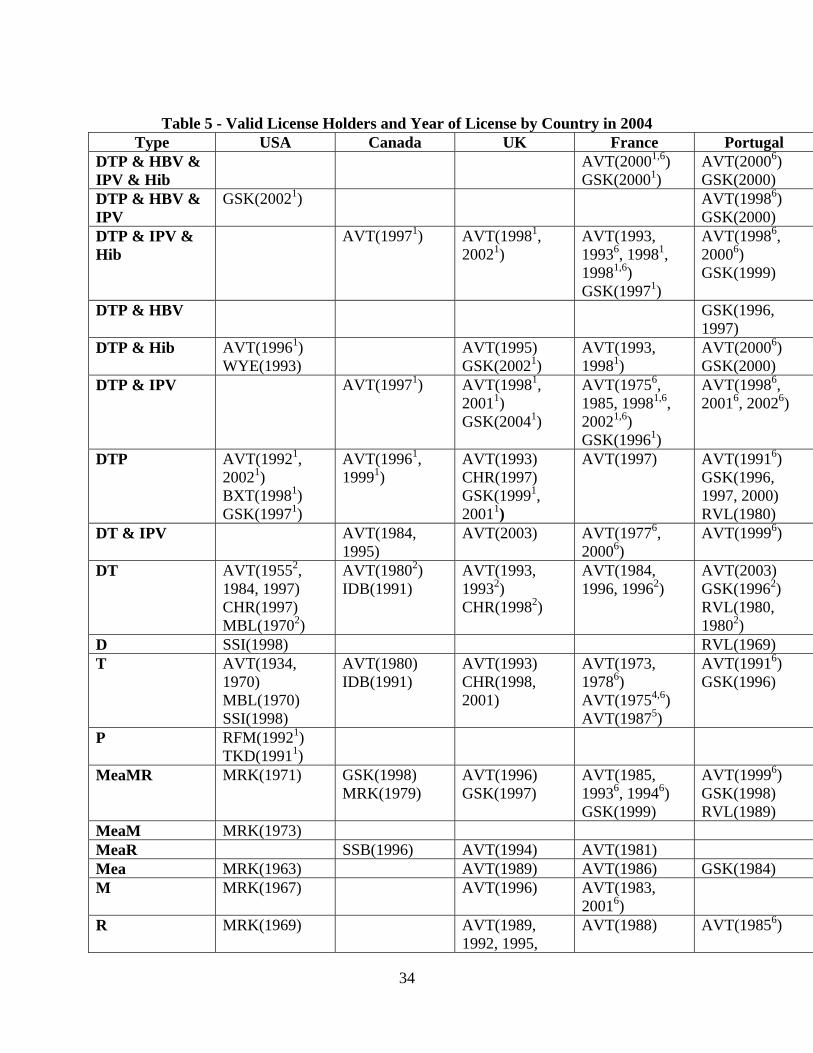
34
Table 5 - Valid License Holders and Year of License by Country in 2004
Type USA Canada UK France Portugal DTP & HBV & IPV & Hib
AVT(20001,6) GSK(20001)
AVT(20006) GSK(2000)
DTP & HBV & IPV
GSK(20021) AVT(19986) GSK(2000)
DTP & IPV & Hib
AVT(19971) AVT(19981, 20021)
AVT(1993, 19936, 19981, 19981,6) GSK(19971)
AVT(19986, 20006) GSK(1999)
DTP & HBV GSK(1996, 1997)
DTP & Hib AVT(19961)
WYE(1993) AVT(1995)
GSK(20021) AVT(1993, 19981)
AVT(20006) GSK(2000)
DTP & IPV AVT(19971) AVT(19981, 20011) GSK(20041)
AVT(19756, 1985, 19981,6, 20021,6) GSK(19961)
AVT(19986, 20016, 20026)
DTP AVT(19921, 20021) BXT(19981) GSK(19971)
AVT(19961, 19991)
AVT(1993) CHR(1997) GSK(19991, 20011)
AVT(1997) AVT(19916) GSK(1996, 1997, 2000) RVL(1980)
DT & IPV AVT(1984, 1995)
AVT(2003) AVT(19776, 20006)
AVT(19996)
DT AVT(19552, 1984, 1997) CHR(1997) MBL(19702)
AVT(19802)IDB(1991)
AVT(1993, 19932) CHR(19982)
AVT(1984, 1996, 19962)
AVT(2003) GSK(19962) RVL(1980, 19802)
D SSI(1998) RVL(1969) T AVT(1934,
1970) MBL(1970) SSI(1998)
AVT(1980) IDB(1991)
AVT(1993) CHR(1998, 2001)
AVT(1973, 19786) AVT(19754,6) AVT(19875)
AVT(19916) GSK(1996)
P RFM(19921) TKD(19911)
MeaMR MRK(1971) GSK(1998) MRK(1979)
AVT(1996) GSK(1997)
AVT(1985, 19936, 19946) GSK(1999)
AVT(19996) GSK(1998) RVL(1989)
MeaM MRK(1973) MeaR SSB(1996) AVT(1994) AVT(1981) Mea MRK(1963) AVT(1989) AVT(1986) GSK(1984) M MRK(1967) AVT(1996) AVT(1983,
20016)
R MRK(1969) AVT(1989, 1992, 1995,
AVT(1988) AVT(19856)
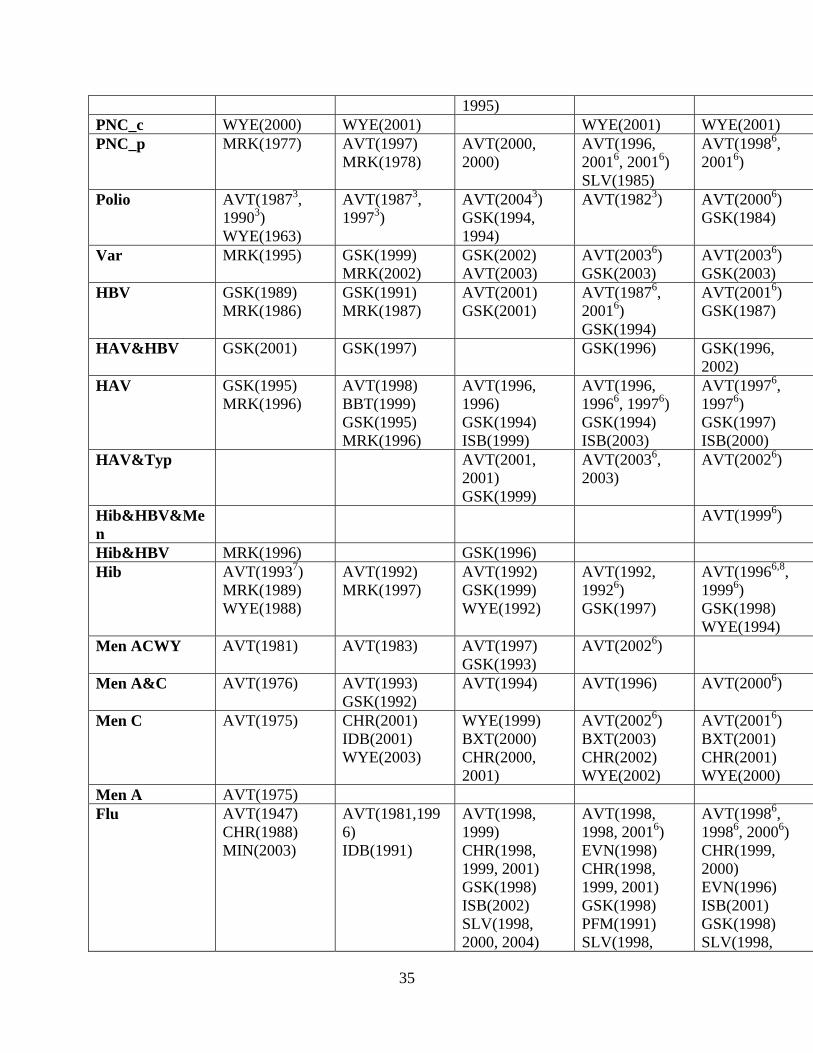
35
1995) PNC_c WYE(2000) WYE(2001) WYE(2001) WYE(2001) PNC_p MRK(1977) AVT(1997)
MRK(1978) AVT(2000, 2000)
AVT(1996, 20016, 20016) SLV(1985)
AVT(19986, 20016)
Polio AVT(19873, 19903) WYE(1963)
AVT(19873, 19973)
AVT(20043) GSK(1994, 1994)
AVT(19823) AVT(20006) GSK(1984)
Var MRK(1995) GSK(1999) MRK(2002)
GSK(2002) AVT(2003)
AVT(20036) GSK(2003)
AVT(20036) GSK(2003)
HBV GSK(1989) MRK(1986)
GSK(1991) MRK(1987)
AVT(2001) GSK(2001)
AVT(19876, 20016) GSK(1994)
AVT(20016) GSK(1987)
HAV&HBV GSK(2001) GSK(1997) GSK(1996) GSK(1996, 2002)
HAV GSK(1995) MRK(1996)
AVT(1998) BBT(1999) GSK(1995) MRK(1996)
AVT(1996, 1996) GSK(1994) ISB(1999)
AVT(1996, 19966, 19976) GSK(1994) ISB(2003)
AVT(19976, 19976) GSK(1997) ISB(2000)
HAV&Typ AVT(2001, 2001) GSK(1999)
AVT(20036, 2003)
AVT(20026)
Hib&HBV&Men
AVT(19996)
Hib&HBV MRK(1996) GSK(1996) Hib AVT(19937)
MRK(1989) WYE(1988)
AVT(1992) MRK(1997)
AVT(1992) GSK(1999) WYE(1992)
AVT(1992, 19926) GSK(1997)
AVT(19966,8, 19996) GSK(1998) WYE(1994)
Men ACWY AVT(1981) AVT(1983) AVT(1997) GSK(1993)
AVT(20026)
Men A&C AVT(1976) AVT(1993) GSK(1992)
AVT(1994) AVT(1996) AVT(20006)
Men C AVT(1975) CHR(2001) IDB(2001) WYE(2003)
WYE(1999) BXT(2000) CHR(2000, 2001)
AVT(20026) BXT(2003) CHR(2002) WYE(2002)
AVT(20016) BXT(2001) CHR(2001) WYE(2000)
Men A AVT(1975) Flu
AVT(1947) CHR(1988) MIN(2003)
AVT(1981,1996) IDB(1991)
AVT(1998, 1999) CHR(1998, 1999, 2001) GSK(1998) ISB(2002) SLV(1998, 2000, 2004)
AVT(1998, 1998, 20016) EVN(1998) CHR(1998, 1999, 2001) GSK(1998) PFM(1991) SLV(1998,
AVT(19986, 19986, 20006) CHR(1999, 2000) EVN(1996) ISB(2001) GSK(1998) SLV(1998,
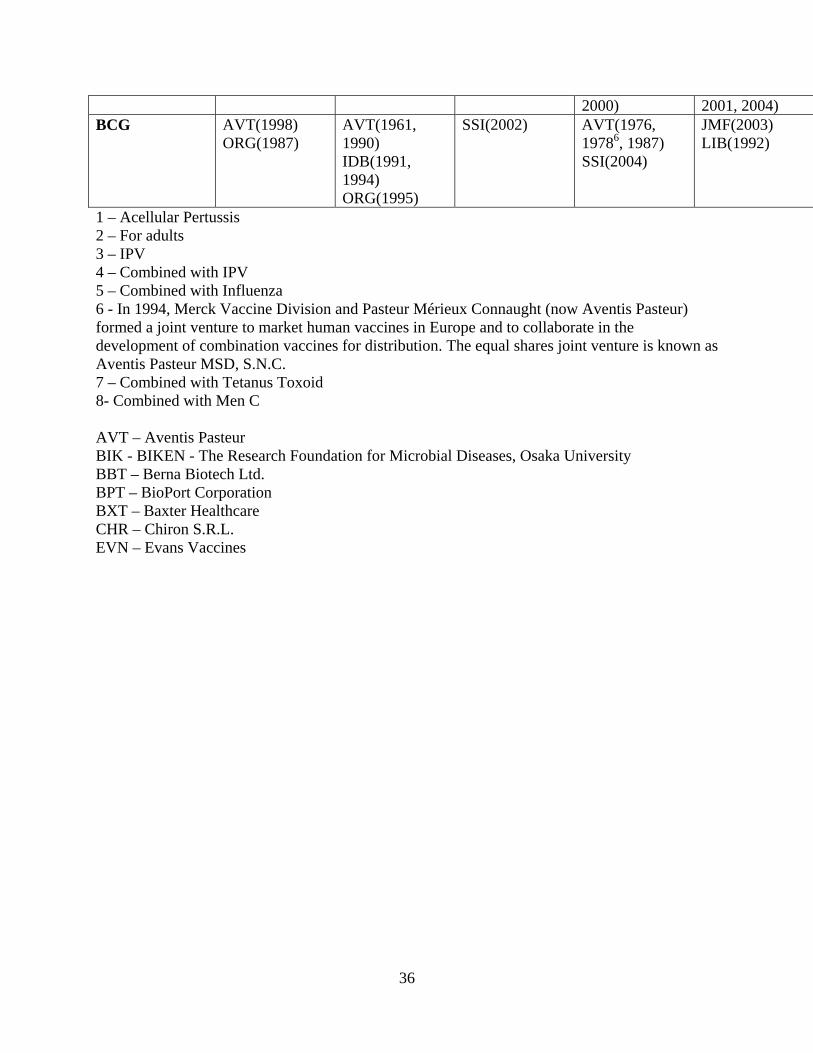
36
2000) 2001, 2004) BCG AVT(1998)
ORG(1987) AVT(1961, 1990) IDB(1991, 1994) ORG(1995)
SSI(2002) AVT(1976, 19786, 1987) SSI(2004)
JMF(2003) LIB(1992)
1 – Acellular Pertussis 2 – For adults 3 – IPV 4 – Combined with IPV 5 – Combined with Influenza 6 - In 1994, Merck Vaccine Division and Pasteur Mérieux Connaught (now Aventis Pasteur) formed a joint venture to market human vaccines in Europe and to collaborate in the development of combination vaccines for distribution. The equal shares joint venture is known as Aventis Pasteur MSD, S.N.C. 7 – Combined with Tetanus Toxoid 8- Combined with Men C AVT – Aventis Pasteur BIK - BIKEN - The Research Foundation for Microbial Diseases, Osaka University BBT – Berna Biotech Ltd. BPT – BioPort Corporation BXT – Baxter Healthcare CHR – Chiron S.R.L. EVN – Evans Vaccines
9/14/2010
GOV – United Kingdom Department of Health GSK – GlaxoSmithkline Inc. IDB - ID Biomedical Corporation ISB - Istituto Sieroterapico Berna, S.r. l. JMF - J. M. Farmacêutica, Lda. LIB – Laboratorios Inibsa, S.A. MBL - Massachusetts Biologic Laboratories MIN - MedImmune Vaccines, Inc MRK - Merck&Co, Inc ORG – Organon Teknika Corporation PFM – Pierre Fabre Medicament RVL - Raúl Vieira, Lda. SBL – SBL Vaccine AB SLV – Solvay Pharma SSB - Swiss Serum and Vaccine Institute Berne SSI - Staten Serum Institute TKD - Takeda Chemical Industries, Ltd. WYE - Wyeth Lederle Vaccines SA

1
Table 6 – Total Doses of Flu Vaccine Produced and Distributed, by Manufacturer:
US 2000-2009
Flu
Seaso
n
Total #
Doses
Produced
Total #
Doses
Distributed
Supplier Product Doses
Produced
% of Total
US Doses
Distributed
2000-
2001
77.9M 70.4M Aventis
Pasteur
Fluzone 35MA 45%
Wyeth Flusheild
Pnu-Immune
24M 31%
MedevaB Fluvirin 20M 26%
Parkedale Fluogen 0MC 0%
2001-
2002
87.7M 77.7M Aventis
Pasteur
Fluzone 50M 57%
Wyeth Flushield
Pnu-Immune
21M 24%
Powderject Fluvirin 17M 19%
2002-
2003
95.0M 83.0M Aventis
Pasteur
Fluzone 43ME 45%
Wyeth Flushield
Pnu-Immune
21M 22%
PowderjectD Fluvirin 26M 27%
2003-
2004
86.9M 83.1M Aventis
Pasteur
Fluzone 43M 49%
Chiron Fluvirin 39M 45%
MedImmune/
Wyeth
FluMist 5MF 6%
2004-
2005
61MG 57.0 M Aventis
Pasteur
Fluzone 58MH
95%
Chiron Fluvirin 0MI 0%
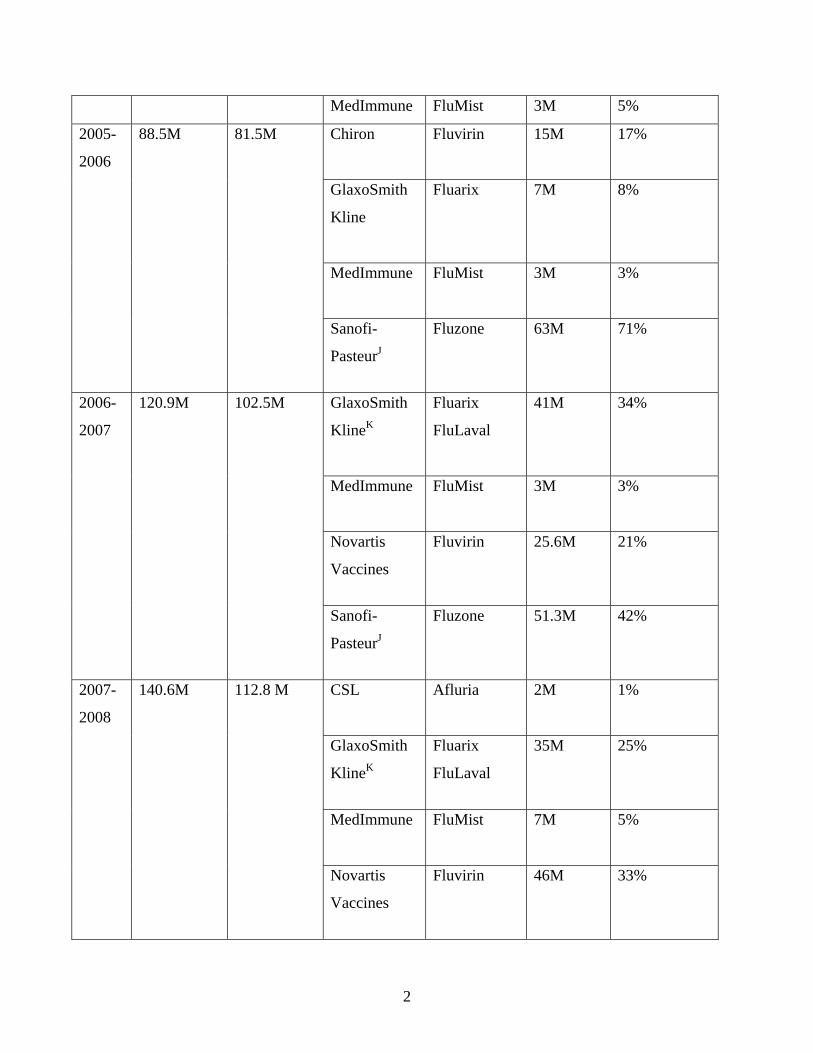
2
MedImmune FluMist 3M 5%
2005-
2006
88.5M 81.5M Chiron Fluvirin 15M
17%
GlaxoSmith
Kline
Fluarix 7M
8%
MedImmune
FluMist 3M
3%
Sanofi-
PasteurJ
Fluzone 63M
71%
2006-
2007
120.9M 102.5M GlaxoSmith
KlineK
Fluarix
FluLaval
41M
34%
MedImmune
FluMist 3M
3%
Novartis
Vaccines
Fluvirin 25.6M
21%
Sanofi-
PasteurJ
Fluzone 51.3M
42%
2007-
2008
140.6M 112.8 M CSL
Afluria 2M
1%
GlaxoSmith
KlineK
Fluarix
FluLaval
35M
25%
MedImmune
FluMist 7M
5%
Novartis
Vaccines
Fluvirin 46M
33%
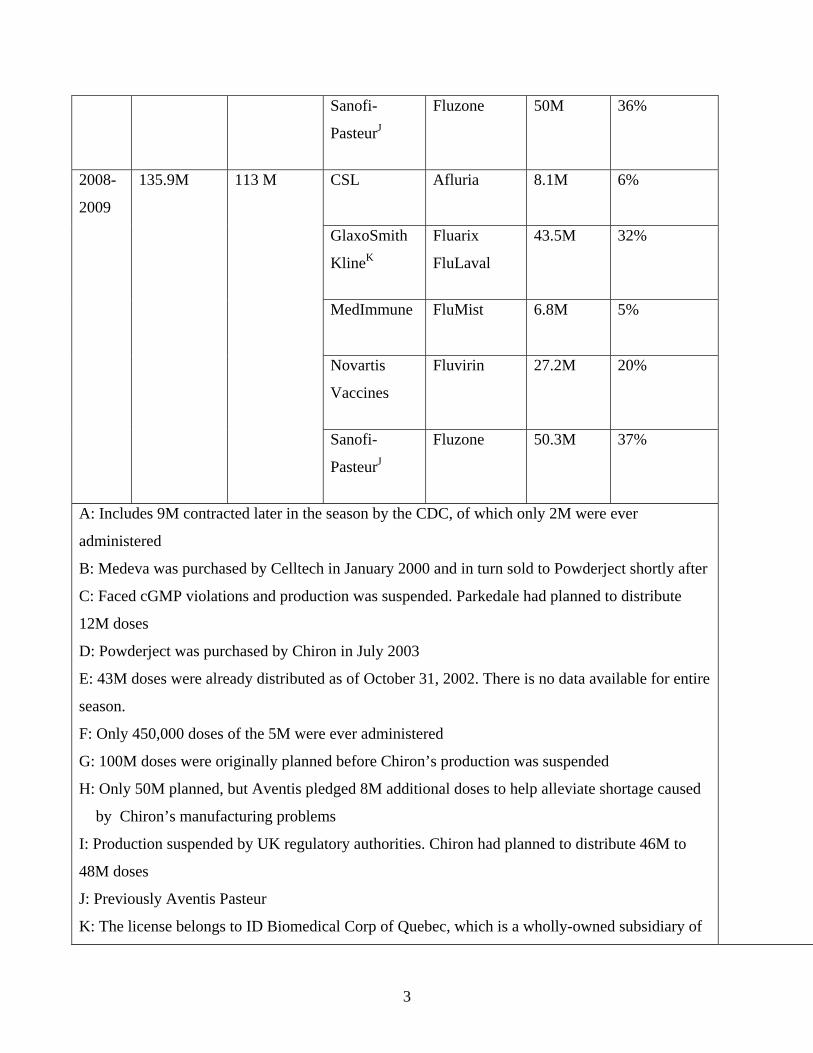
3
Sanofi-
PasteurJ
Fluzone 50M
36%
2008-
2009
135.9M 113 M CSL
Afluria 8.1M
6%
GlaxoSmith
KlineK
Fluarix
FluLaval
43.5M
32%
MedImmune
FluMist 6.8M
5%
Novartis
Vaccines
Fluvirin 27.2M
20%
Sanofi-
PasteurJ
Fluzone 50.3M
37%
A: Includes 9M contracted later in the season by the CDC, of which only 2M were ever
administered
B: Medeva was purchased by Celltech in January 2000 and in turn sold to Powderject shortly after
C: Faced cGMP violations and production was suspended. Parkedale had planned to distribute
12M doses
D: Powderject was purchased by Chiron in July 2003
E: 43M doses were already distributed as of October 31, 2002. There is no data available for entire
season.
F: Only 450,000 doses of the 5M were ever administered
G: 100M doses were originally planned before Chiron’s production was suspended
H: Only 50M planned, but Aventis pledged 8M additional doses to help alleviate shortage caused
by Chiron’s manufacturing problems
I: Production suspended by UK regulatory authorities. Chiron had planned to distribute 46M to
48M doses
J: Previously Aventis Pasteur
K: The license belongs to ID Biomedical Corp of Quebec, which is a wholly-owned subsidiary of
4
GlaxoSmithKline.
* Individual manufacturer production values may not add up to total production values due to
rounding
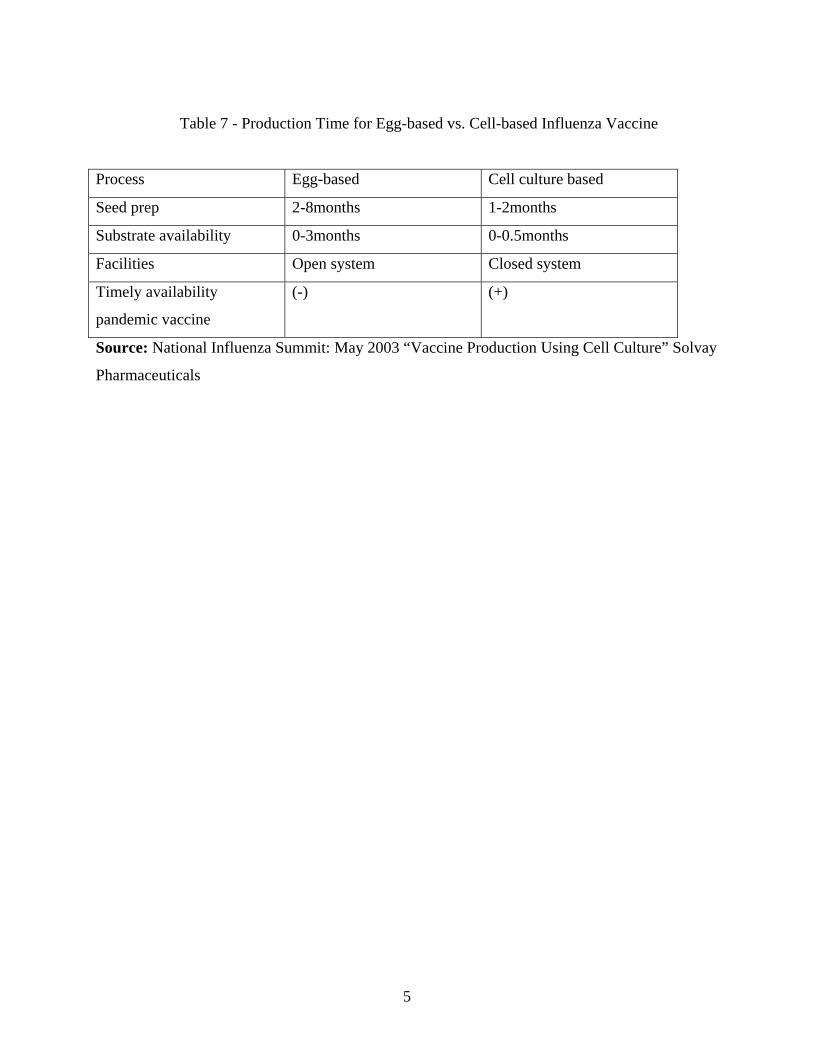
5
Table 7 - Production Time for Egg-based vs. Cell-based Influenza Vaccine
Process Egg-based Cell culture based
Seed prep 2-8months 1-2months
Substrate availability 0-3months 0-0.5months
Facilities Open system Closed system
Timely availability
pandemic vaccine
(-) (+)
Source: National Influenza Summit: May 2003 “Vaccine Production Using Cell Culture” Solvay
Pharmaceuticals
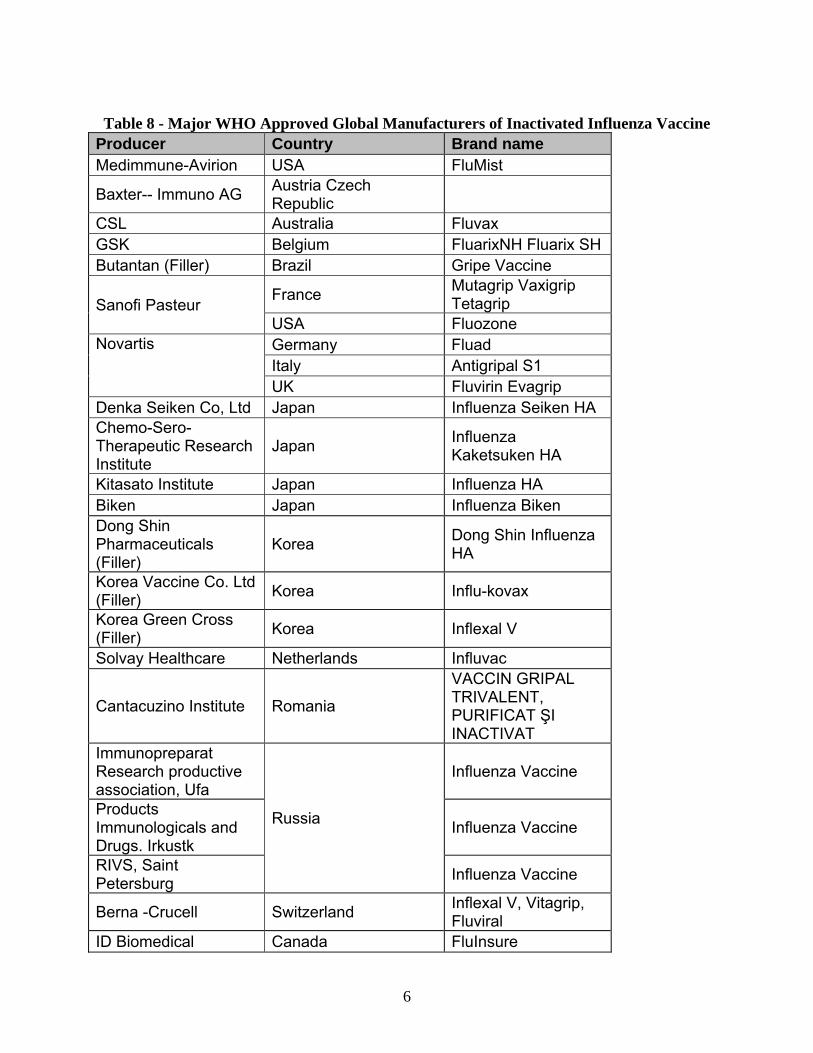
6
Table 8 - Major WHO Approved Global Manufacturers of Inactivated Influenza Vaccine
Producer Country Brand name Medimmune-Avirion USA FluMist
Baxter-- Immuno AG Austria Czech Republic
CSL Australia Fluvax GSK Belgium FluarixNH Fluarix SH Butantan (Filler) Brazil Gripe Vaccine
Sanofi Pasteur France
Mutagrip Vaxigrip Tetagrip
USA Fluozone Novartis Germany Fluad
Italy Antigripal S1 UK Fluvirin Evagrip
Denka Seiken Co, Ltd Japan Influenza Seiken HA Chemo-Sero-Therapeutic Research Institute
Japan Influenza Kaketsuken HA
Kitasato Institute Japan Influenza HA Biken Japan Influenza Biken Dong Shin Pharmaceuticals (Filler)
Korea Dong Shin Influenza HA
Korea Vaccine Co. Ltd (Filler)
Korea Influ-kovax
Korea Green Cross (Filler)
Korea Inflexal V
Solvay Healthcare Netherlands Influvac
Cantacuzino Institute Romania
VACCIN GRIPAL TRIVALENT, PURIFICAT ŞI INACTIVAT
Immunopreparat Research productive association, Ufa
Russia
Influenza Vaccine
Products Immunologicals and Drugs. Irkustk
Influenza Vaccine
RIVS, Saint Petersburg
Influenza Vaccine
Berna -Crucell Switzerland Inflexal V, Vitagrip, Fluviral
ID Biomedical Canada FluInsure
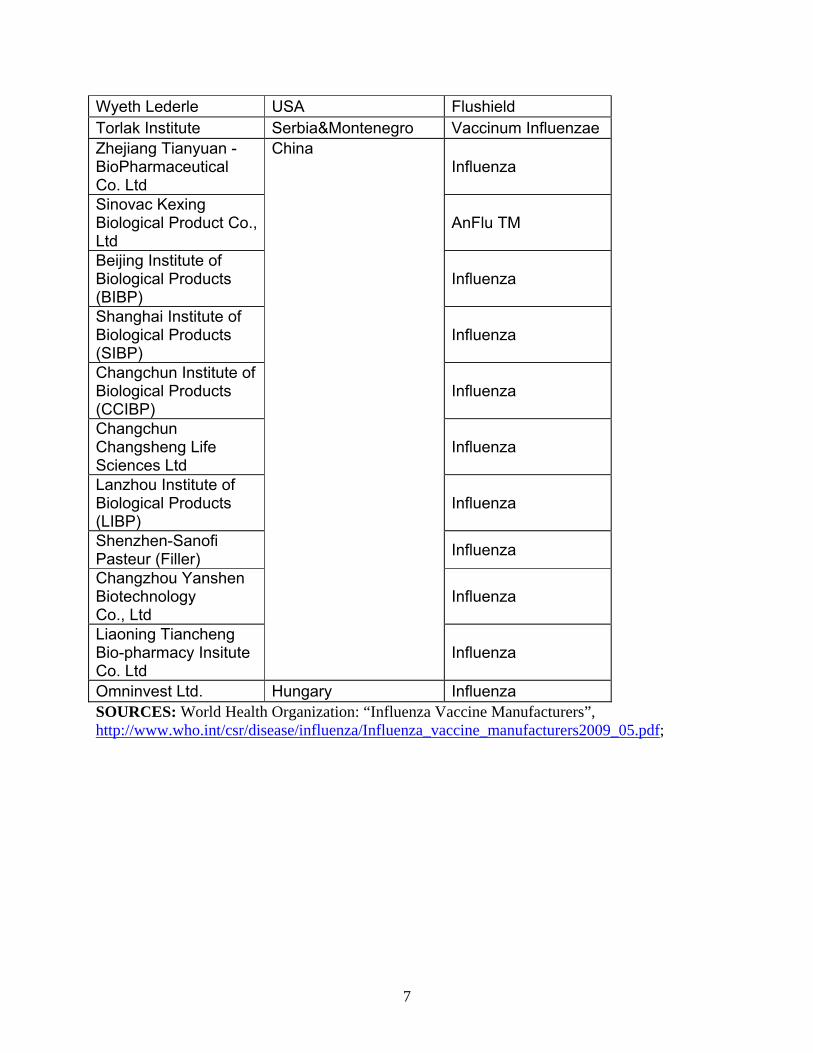
7
Wyeth Lederle USA Flushield Torlak Institute Serbia&Montenegro Vaccinum Influenzae Zhejiang Tianyuan - BioPharmaceutical Co. Ltd
China Influenza
Sinovac Kexing Biological Product Co., Ltd
AnFlu TM
Beijing Institute of Biological Products (BIBP)
Influenza
Shanghai Institute of Biological Products (SIBP)
Influenza
Changchun Institute of Biological Products (CCIBP)
Influenza
Changchun Changsheng Life Sciences Ltd
Influenza
Lanzhou Institute of Biological Products (LIBP)
Influenza
Shenzhen-Sanofi Pasteur (Filler)
Influenza
Changzhou Yanshen Biotechnology Co., Ltd
Influenza
Liaoning Tiancheng Bio-pharmacy Insitute Co. Ltd
Influenza
Omninvest Ltd. Hungary Influenza SOURCES: World Health Organization: “Influenza Vaccine Manufacturers”, http://www.who.int/csr/disease/influenza/Influenza_vaccine_manufacturers2009_05.pdf;
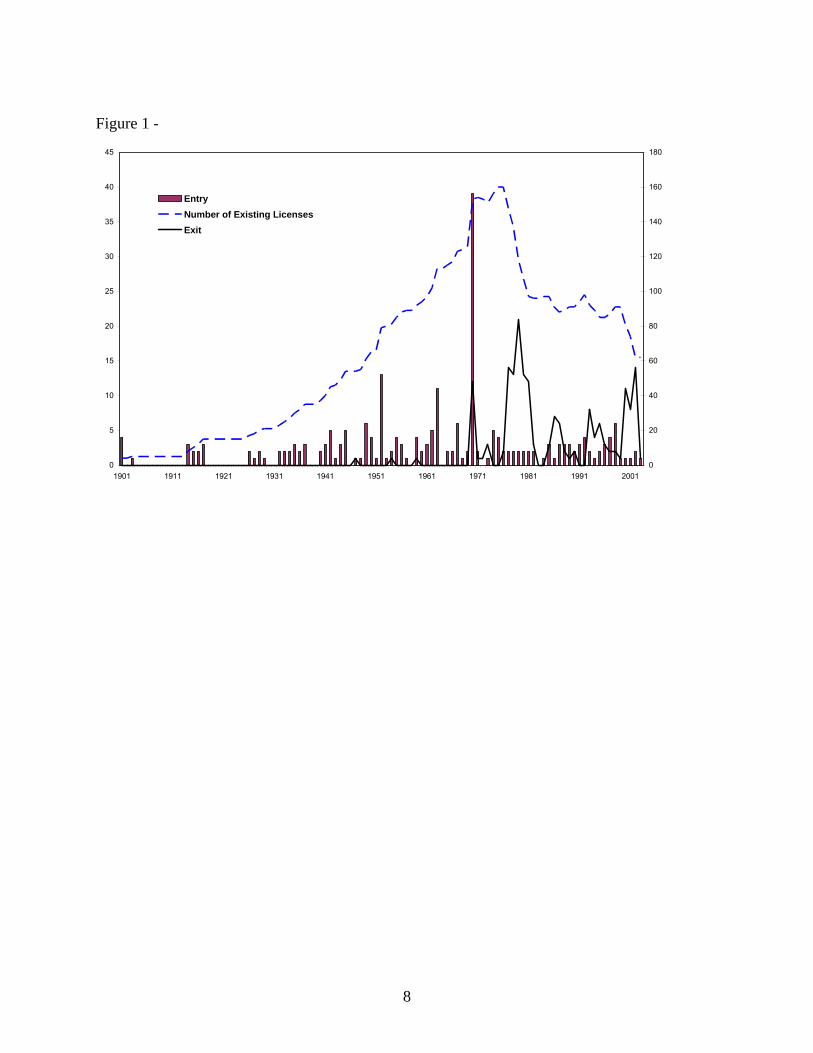
8
Figure 1 -
0
5
10
15
20
25
30
35
40
45
1901 1911 1921 1931 1941 1951 1961 1971 1981 1991 2001
0
20
40
60
80
100
120
140
160
180
Entry
Number of Existing Licenses
Exit
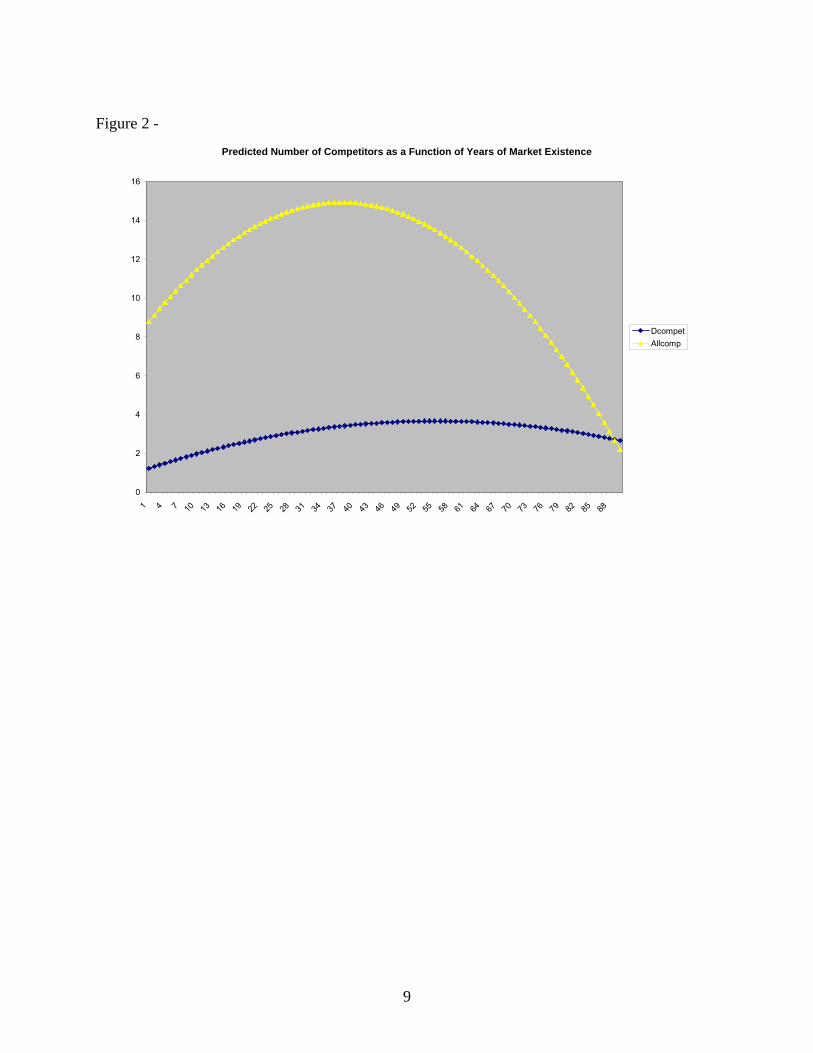
9
Figure 2 -
Predicted Number of Competitors as a Function of Years of Market Existence
0
2
4
6
8
10
12
14
16
1 4 7 10 13 16 19 22 25 28 31 34 37 40 43 46 49 52 55 58 61 64 67 70 73 76 79 82 85 88
Dcompet
Allcomp