Embed Size (px)
Citation preview
Decarbonizing the Belt and RoadA GREEN FINANCE ROADMAP
IN ASSOCIATION WITH
S E P T 2 0 1 9
ABOUT THIS REPORTDecarbonizing the Belt and Road: A Green Finance Roadmap provides a world-first view of potential carbon scenarios across the 126 countries involved in China’s Belt and Road Initiative, currently accounting for almost a quarter of global GDP. The report highlights the imperative of urgent action to drastically reduce future carbon trajectories if there is to be any likelihood of achieving the Paris Agreement on climate, and sets out a roadmap of how to do that focused on leveraging financial flows and related policies and business communities.
Decarbonizing the Belt and Road: A Green Finance Roadmap is a collaboration between the Tsinghua University Center for Finance and Development, Vivid Economics and the Climateworks Foundation.
Comments and requests can be sent to either of the lead authors. For more information please visit:
www.vivideconomics.com/publications/decarbonizing-the-belt-and-road-initiative-a-green-finance-roadmap
www.pbcsf.tsinghua.edu.cn/
Dr. Ma Jun is Director of the Center for Finance and Development at Tsinghua University.
He is also Special Advisor to the Governor of the People’s Bank of China, a Member of the PBOC Monetary Policy Committee, Chairman of China Green Finance Committee, and Chair of the NGFS WS1, Co-chair of G20 GFSG. Before joining Tsinghua, he was Chief Economist at the PBOC from 2014-17. Prior to that, he worked for 13 years at Deutsche Bank, where he was Managing Director, Chief Economist for Greater China, and Head of China and Hong Kong Strategy. From 1992-2000, he worked as a public policy specialist, economist and senior economist at the IMF and World Bank. He received his Ph.D. in Economics from Georgetown University in 1994.
Ma Jun can be reached at [email protected].
Dr. Simon Zadek is a Senior Visiting Fellow at the Center for Finance and Development at Tsinghua University.
He is also a Principal at the United Nations Development Program. He was Senior Advisor on sustainable finance at the Executive Office of the UN Secretary General, co-Director of the UNEP Inquiry into Design Options for a Sustainable Financial System, and founder and CEO of the international think-tank, AccountAbility. He has held positions at JF Kennedy School of Government at Harvard University, the Singapore Management University and the Copenhagen Business School, and advised businesses worldwide on sustainability strategies. He received his Ph.D. in Economics from the University of London in 1991.
Simon Zadek can be reached at [email protected].
CONTRIBUTING AUTHORS Tsinghua University: Tianyin Sun (Research Fellow) Shouqing Zhu (Visiting Research Fellow) and Lin Cheng (Research Fellow)
Vivid Economics: Jason Eis (Executive Director) Thomas Nielsen (Engagement Manager) David Ren (Economist)
Climateworks Foundation: Ilmi Granoff (Director, Sustainable Finance Program) Tim Stumhofer (Associate Director, Sustainable Finance Program)
ACKNOWLEDGEMENTSThe authors and partner organisations acknowledge and thank the many individuals and organisations that have informed the development and communication of this research. This includes Yi Shen, Jing Wu, Yunhan Chen, Yangyang Liu, Wenhong Xie, Xing Qi, Mingxuan Wang from Tsinghua University, Yujun Liu from Syntao, Shuling Rao from CBEE, and Tao Wang from Climateworks.
Thanks also to Nick Robbins and Mahenau Agha and the team of the UNEP Inquiry on Design Options for a Sustainable Financial System, and to Eric Usher and his colleagues at the UNEP Finance Initiative; and also to partners and collaborators of the Financing Climate Futures initiative led by the OECD, UNEP, and the World Bank Group, and Tom Brookes and his colleagues at the European Climate Foundation.
Opinions expressed in the report are those of the authors and do not necessarily reflect the views of the partner institutions or any other organisations with which the authors are involved. Any errors and omissions are the sole responsibility of the authors.
LEAD AUTHORS
DECARBONIZING THE BELT AND ROAD - A GREEN FINANCE ROADMAP
2
CONTENTS1. Executive Summary: Decarbonizing The Belt and Road
- A Green Finance Roadmap 4
2. Belt and Road - Carbon Scenarios 9
2.1 METHODOLOGY 112.1.1 Identifying the Scale of B&R Investment and How it will Drive Growth 11
2.1.2 Mapping Possible Carbon Pathways for B&RCs 13
2.1.3 Determining the Investment Implications for the B&RCs 15
2.2 RESULTS 182.2.1 Scale of BRI and Growth Projections 18
2.2.2 Possible Carbon Pathways 19
2.2.3 Investment Implications for B&RCs 21
2.3 CONCLUSIONS 22
3. Green Finance in the B&RCs 24
3.1 MOMENTUM CREATED THROUGH MULTILATERAL COLLABORATIVE FRAMEWORK 24
3.2 NATIONAL STRATEGIES & POLICIES ON GREEN FINANCE 26
3.3 MARKET PREPAREDNESS FOR GREEN FINANCE 28
3.4 CHALLENGES FOR DEVELOPING GREEN FINANCE POLICIES AND MARKETS 32
4. Emerging Options for Greening Investment in the Belt & Road 35
4.1 GREEN INVESTMENT PRINCIPLES FOR THE BELT AND ROAD 35
4.2 RAISING AWARENESS AND BUILDING CAPACITY ON GREEN FINANCE FOR BELT AND ROAD COUNTRIES 37
4.3 INTERNATIONAL COLLABORATION OF ALL STAKEHOLDERS 39
5. Recommendations 40
5.1 URGENCY OF THE CHALLENGES 405.1.1 ‘Business as Usual’ scenario for B&RCs could result in global
emissions double 2DS levels by 2050 40
5.1.2 The potential carbon ‘lock-in’ arising from BRI investments calls for immediate action 40
5.1.3 Investor awareness alone will be insufficient - further incentives for green investments are required 41
5.1.4. Capacity of the B&R financial system to deliver green investment is weak 41
5.1.5 Policy frameworks for green finance are emerging but still inadequate in most B&RCs 41
5.1.6 B&RCs are facing a number of common challenges in developing green finance 42
5.2 RECOMMENDATIONS 43
Appendix 46
Selected Bibliography 52
Endnotes 53
DECARBONIZING THE BELT AND ROAD - A GREEN FINANCE ROADMAP
3
1. Executive Summary: Decarbonizing the Belt and Road - A Green Finance RoadmapMost of the world’s focus has rightly been on today’s major emitting countries when it comes to fighting the battle with climate change.
From a forward-looking perspective, however, the biggest climate risk and opportunity lies in our ability to support a low carbon development pathway for the group of more than 120 nations (countries that have signed the B&R MOU with China as of April 2019) that have signed up to China’s Belt and Road Initiative (‘BRI’).
The BRI was proposed by China in 2013, focusing mainly on mobilizing capital for infrastructure investments and improving economic connectivity of these nations, most of which are still relatively low-income, developing countries.
The 126 countries involved in the BRI (‘B&RCs’), excluding China, currently account for about 23% of the world’s GDP and about 28% of global carbon emissions. If their current carbon-intensive growth model continues, these percentages are likely to grow dramatically over the next two decades.
Aggregated growth and carbon scenarios for B&RCs have been analysed for the first time by the authors of this report, drawing extensively from the work and wisdom of many others.
The results indicate that, based on historical infrastructure investment patterns and growth projections, key B&RCs are currently on track to generate emissions well above 2-Degree Scenario (‘2DS’) levels, the upper limit of the Paris Agreement’s temperature increase target.
Our estimates show that failure to rein in the growth of carbon emissions by these countries could be enough to result in a nearly 3 degrees of warming pathway to 2050, even if all other countries follow a 2DS pathway.
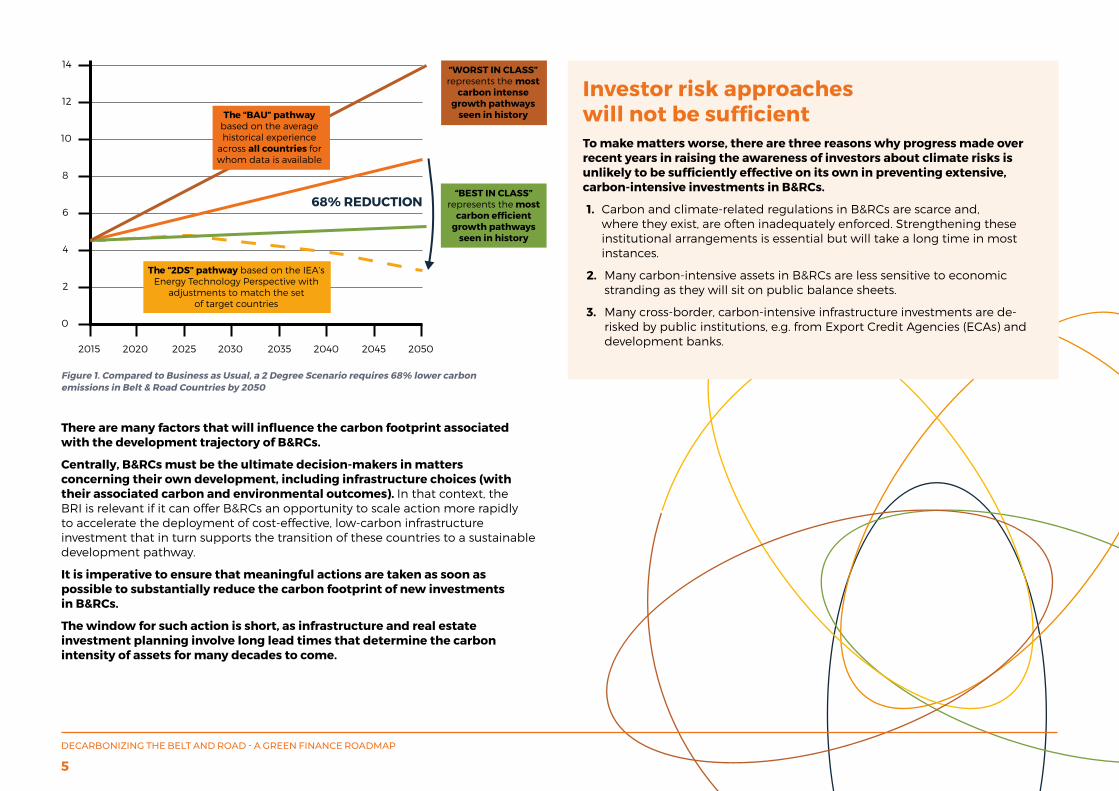
• The 126 B&RCs accounted for just 28% of emissions in 2015. If they follow the conventional growth pathways (BAU) seen historically and the rest of the world follows 2DS, they could account for 66% of global emissions by 2050 and result in global carbon emissions double the 2DS level.
• If B&RCs follow historical carbon-intense growth patterns (‘Worst in Class’ growth), it may be enough to result in a 2.7 degree path even if the rest of the world adheres to 2DS levels of emissions.
• Annual emissions for the 126 B&RCs could be 39% lower in 2050 than business-as-usual levels, if B&RCs achieved ‘commensurate historical best practices’ (i.e. effectively deploying leading-edge green technologies already in use, at a pace commensurate with their stage of development measured by income per capita).
• However, a best in class growth scenario would still fall short of the reduction required to align with a 2DS, resulting in their carbon emissions still exceeding the aggregate 2DS budget by a huge margin, 17%, or 25Gt, by 2050.
DECARBONIZING THE BELT AND ROAD - A GREEN FINANCE ROADMAP
4
There are many factors that will influence the carbon footprint associated with the development trajectory of B&RCs.
Centrally, B&RCs must be the ultimate decision-makers in matters concerning their own development, including infrastructure choices (with their associated carbon and environmental outcomes). In that context, the BRI is relevant if it can offer B&RCs an opportunity to scale action more rapidly to accelerate the deployment of cost-effective, low-carbon infrastructure investment that in turn supports the transition of these countries to a sustainable development pathway.
It is imperative to ensure that meaningful actions are taken as soon as possible to substantially reduce the carbon footprint of new investments in B&RCs.
The window for such action is short, as infrastructure and real estate investment planning involve long lead times that determine the carbon intensity of assets for many decades to come.
Investor risk approaches will not be sufficientTo make matters worse, there are three reasons why progress made over recent years in raising the awareness of investors about climate risks is unlikely to be sufficiently effective on its own in preventing extensive, carbon-intensive investments in B&RCs.
1. Carbon and climate-related regulations in B&RCs are scarce and, where they exist, are often inadequately enforced. Strengthening these institutional arrangements is essential but will take a long time in most instances.
2. Many carbon-intensive assets in B&RCs are less sensitive to economic stranding as they will sit on public balance sheets.
3. Many cross-border, carbon-intensive infrastructure investments are de-risked by public institutions, e.g. from Export Credit Agencies (ECAs) and development banks.
68% REDUCTION
2015
0
2
4
6
8
10
12
14
2020 2025 2030 2035 2040 2045 2050
The “2DS” pathway based on the IEA’s Energy Technology Perspective with
adjustments to match the set of target countries
The “BAU” pathway based on the average historical experience
across all countries for whom data is available
“WORST IN CLASS” represents the most
carbon intense growth pathways
seen in history
Figure 1. Compared to Business as Usual, a 2 Degree Scenario requires 68% lower carbon emissions in Belt & Road Countries by 2050
DECARBONIZING THE BELT AND ROAD - A GREEN FINANCE ROADMAP
5
The BRI itself provides an important opportunity to initiate such actions, given its focus on infrastructure investment and the potential it offers to support low-carbon development by combining policy, finance, expertise and technology resources from the international community.
Report Methodology Decarbonizing the Belt and Road is a first of its kind quantitative projection of the potential carbon emission trajectories of Belt and Road countries.
Tsinghua CFD defined the set of 17 B&RCs for analysis, estimated the Chinese BRI investment into those countries and predicted future GDP growth patterns. Vivid Economics then used these GDP projections as input for energy demand and carbon emission modelling to illustrate different carbon pathways for the B&RCs up to 2050 and the scale of the 2DS challenge. The 2DS pathway is based on the International Energy Agency’s Energy Technology Pathways scenarios for future energy use and emissions. Finally, Vivid Economics estimated the physical investment requirements along different pathways to assess where financing gaps may emerge in the future. A detailed explainer of the methodology is available in the full report.
Inve
stm
en
t N
ee
ds
($ B
illio
n)
BRI 126 2DS Investment (Annual Average 2016-2030)
BNEF - Global Clean Energy Investment in Power Only (2018)
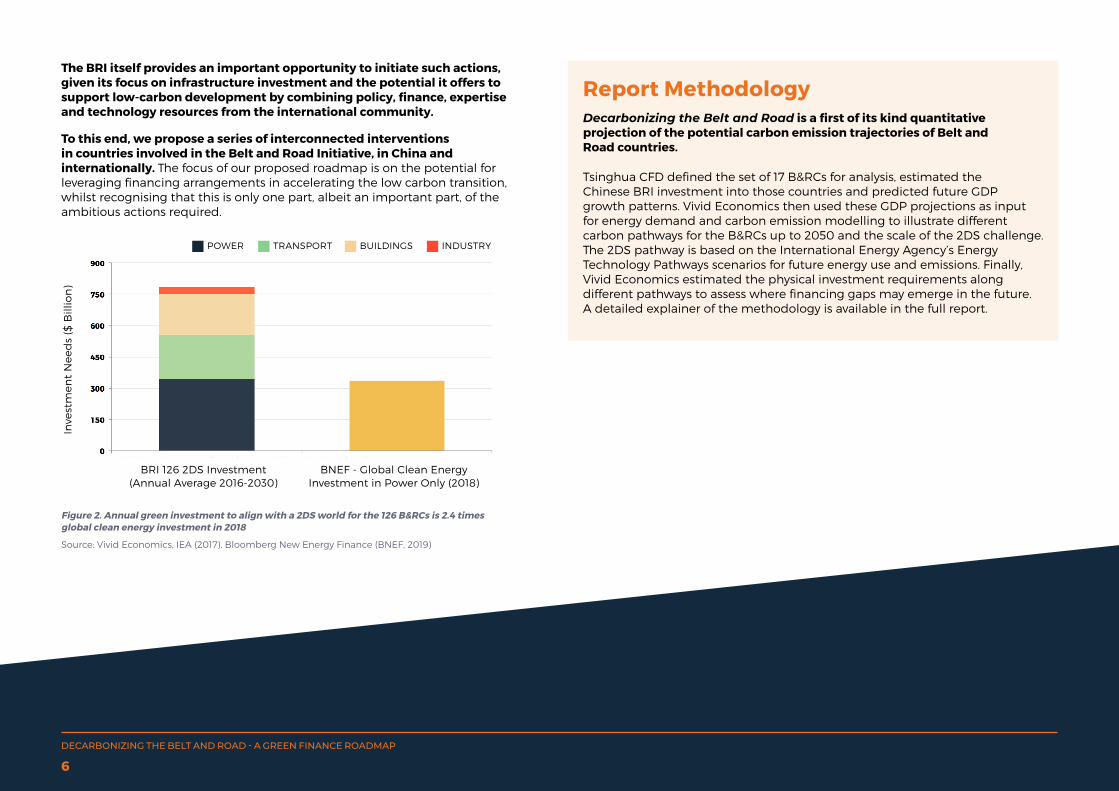
POWER BUILDINGS INDUSTRYTRANSPORT
Figure 2. Annual green investment to align with a 2DS world for the 126 B&RCs is 2.4 times global clean energy investment in 2018
Source: Vivid Economics, IEA (2017), Bloomberg New Energy Finance (BNEF, 2019)
To this end, we propose a series of interconnected interventions in countries involved in the Belt and Road Initiative, in China and internationally. The focus of our proposed roadmap is on the potential for leveraging financing arrangements in accelerating the low carbon transition, whilst recognising that this is only one part, albeit an important part, of the ambitious actions required.
DECARBONIZING THE BELT AND ROAD - A GREEN FINANCE ROADMAP
6
DECARBONIZING THE BELT AND ROAD - A GREEN FINANCE ROADMAP
7
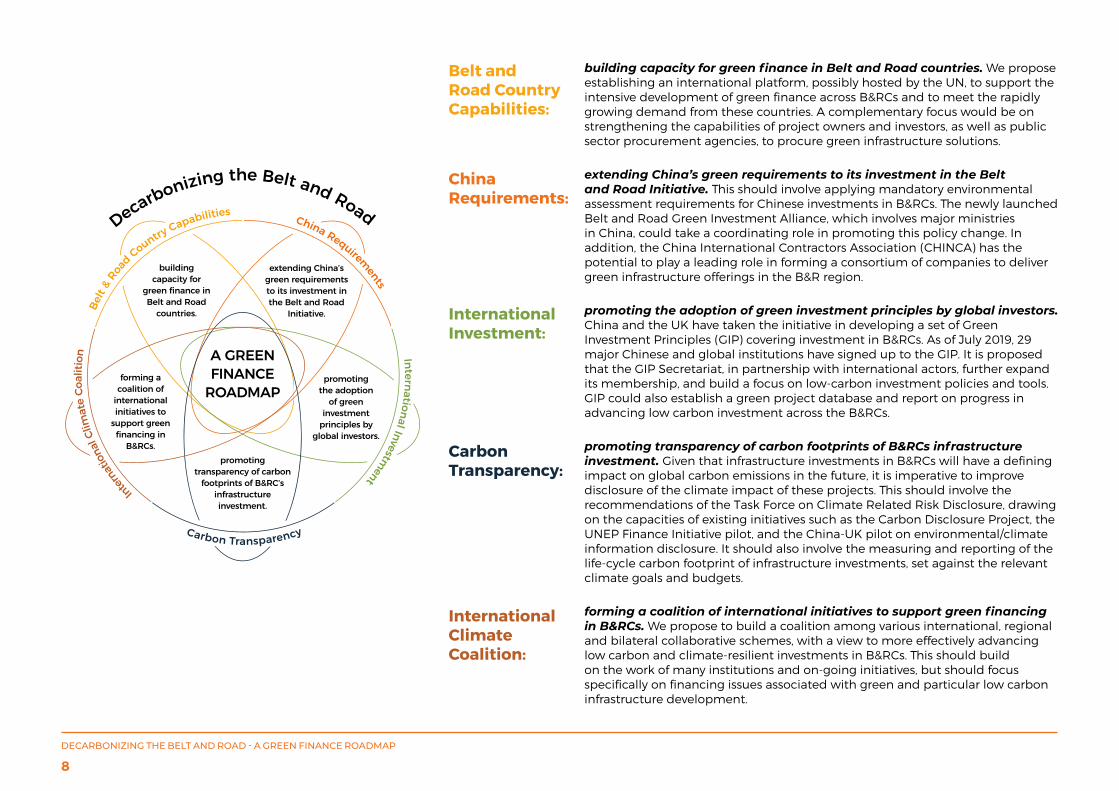
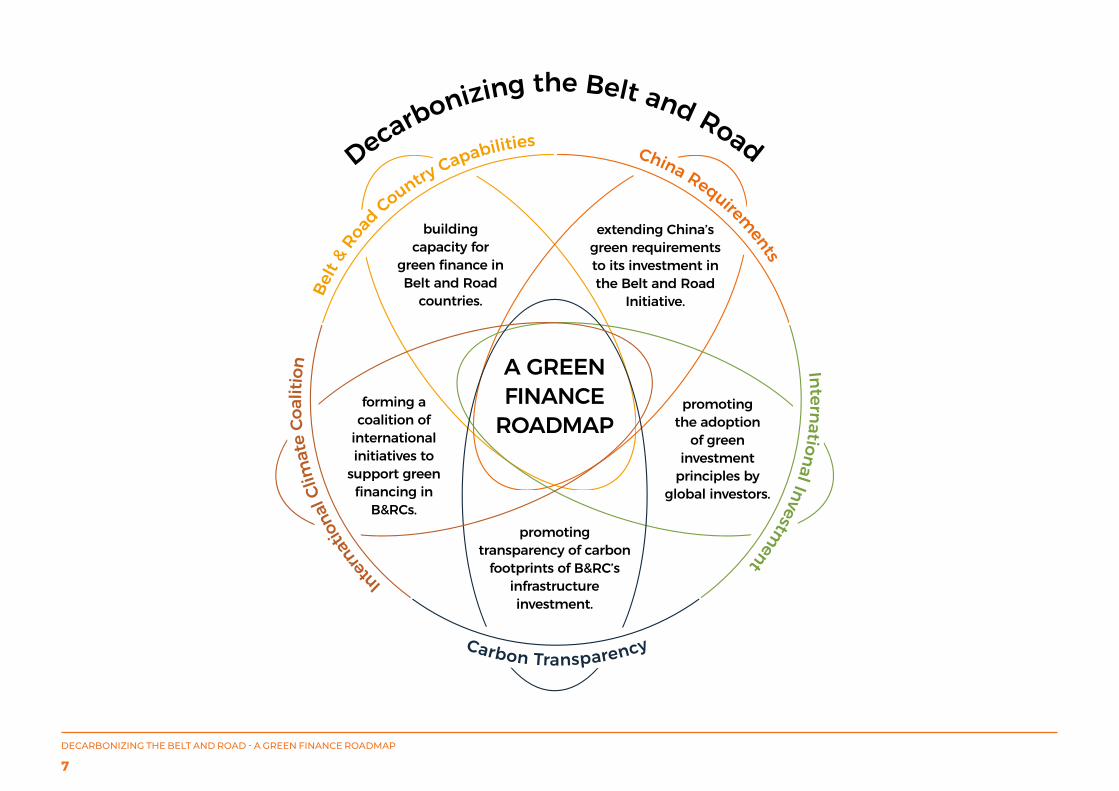
building capacity for green finance in Belt and Road countries. We propose establishing an international platform, possibly hosted by the UN, to support the intensive development of green finance across B&RCs and to meet the rapidly growing demand from these countries. A complementary focus would be on strengthening the capabilities of project owners and investors, as well as public sector procurement agencies, to procure green infrastructure solutions.
extending China’s green requirements to its investment in the Belt and Road Initiative. This should involve applying mandatory environmental assessment requirements for Chinese investments in B&RCs. The newly launched Belt and Road Green Investment Alliance, which involves major ministries in China, could take a coordinating role in promoting this policy change. In addition, the China International Contractors Association (CHINCA) has the potential to play a leading role in forming a consortium of companies to deliver green infrastructure offerings in the B&R region.
promoting the adoption of green investment principles by global investors. China and the UK have taken the initiative in developing a set of Green Investment Principles (GIP) covering investment in B&RCs. As of July 2019, 29 major Chinese and global institutions have signed up to the GIP. It is proposed that the GIP Secretariat, in partnership with international actors, further expand its membership, and build a focus on low-carbon investment policies and tools. GIP could also establish a green project database and report on progress in advancing low carbon investment across the B&RCs.
promoting transparency of carbon footprints of B&RCs infrastructure investment. Given that infrastructure investments in B&RCs will have a defining impact on global carbon emissions in the future, it is imperative to improve disclosure of the climate impact of these projects. This should involve the recommendations of the Task Force on Climate Related Risk Disclosure, drawing on the capacities of existing initiatives such as the Carbon Disclosure Project, the UNEP Finance Initiative pilot, and the China-UK pilot on environmental/climate information disclosure. It should also involve the measuring and reporting of the life-cycle carbon footprint of infrastructure investments, set against the relevant climate goals and budgets.
forming a coalition of international initiatives to support green financing in B&RCs. We propose to build a coalition among various international, regional and bilateral collaborative schemes, with a view to more effectively advancing low carbon and climate-resilient investments in B&RCs. This should build on the work of many institutions and on-going initiatives, but should focus specifically on financing issues associated with green and particular low carbon infrastructure development.
Belt and Road Country Capabilities:
China Requirements:
International Investment:
Carbon Transparency:
International Climate Coalition:
DECARBONIZING THE BELT AND ROAD - A GREEN FINANCE ROADMAP
8
2. Belt and Road - Carbon ScenariosThis quantitative work aims to illustrate the future carbon challenge of the Belt and Road Initiative (BRI) and provide evidence to help determine how it could aid the low-carbon transition. With concentrated infrastructure investments, the BRI is widely considered to be a key determiner of future emission pathways. However, there is little knowledge of how significant the BRI is and what the potential carbon trajectories associated with different investment approaches might be. Against this backdrop and with the aim of identifying key policy options to encourage greening of the B&RCs, the Tsinghua Center for Finance and Development (Tsinghua-CFD), in association with Vivid Economics and the ClimateWorks Foundation, set out to answer the following questions:
1) WHAT IS THE SCALE OF BRI INVESTMENT AND HOW WILL IT DRIVE GROWTH?
a) What is total investment?b) How significant is the investment across B&R countries?
2) WHAT ARE POSSIBLE CARBON PATHWAYS FOR B&R COUNTRIES?
a) What is the likely total emission gap to a 2DS world for the B&R countries?b) What carbon reductions can be achieved by encouraging greener growth trajectories?
3) WHAT ARE THE INVESTMENT IMPLICATIONS FOR THE B&R?
a) Is the B&R aligned with a low carbon growth path?b) What are the investment needs in the B&R countries for a 2DS?
Answering these questions is the first step to assessing the green policy and financing needs of B&R countries and formulating solutions to help the B&R deliver green sustainable investments.
BRI investment from China is estimated to total $651.8 billion by 2030 in the 17 key B&RCs74 – 2% of all annual Gross Capital Formation in these countries – but leverage (crowding in investments from other sources and countries) can increase this to $2.45 trillion (7.8% of total GCF). Although the direct GDP growth effects of BRI investment are expected to be very modest (increasing annual economic growth in the chosen B&RCs by roughly 0.24 percentage points per annum to 2030), this set of countries is still expected to experience high base growth up to 2030. Rapid growth will come with large investment needs and carbon implications - the BRI can be a catalyst to help steer future investment and ensure greener growth pathways by setting best practices and guidelines.
Adopting historical growth patterns across all B&RCs75 can drive dangerous temperature increases, potentially enough to induce nearly 3 degrees of warming even if the rest of the world takes 2-degree compliant action. In 2015, the full set of 126 B&RCs (excluding China) only accounted for 28% of global emissions. However, this share could grow to 66%76 by 2050 if the rest of the world decarbonises but the B&RCs achieve commensurate historical growth patterns77. This repeat of history in the B&RCs would lead to annual global emissions of almost double what scientists believe to be required to remain below 2 degrees, despite action in the rest of the world. The global challenge is even larger if B&RCs follow the most carbon intense growth paths observed in history. In this case, the 126 B&RCs could put global emissions on a pathway to a nearly 3-degree scenario even if the rest of the world adheres to 2DS levels of emissions. Hence encouraging greener growth and alternative development pathways in the B&RCs is essential for avoiding dangerous levels of warming in the future.
126 B&R countries (excluding China) only accounted for 28% of global emissions.
DECARBONIZING THE BELT AND ROAD - A GREEN FINANCE ROADMAP
9
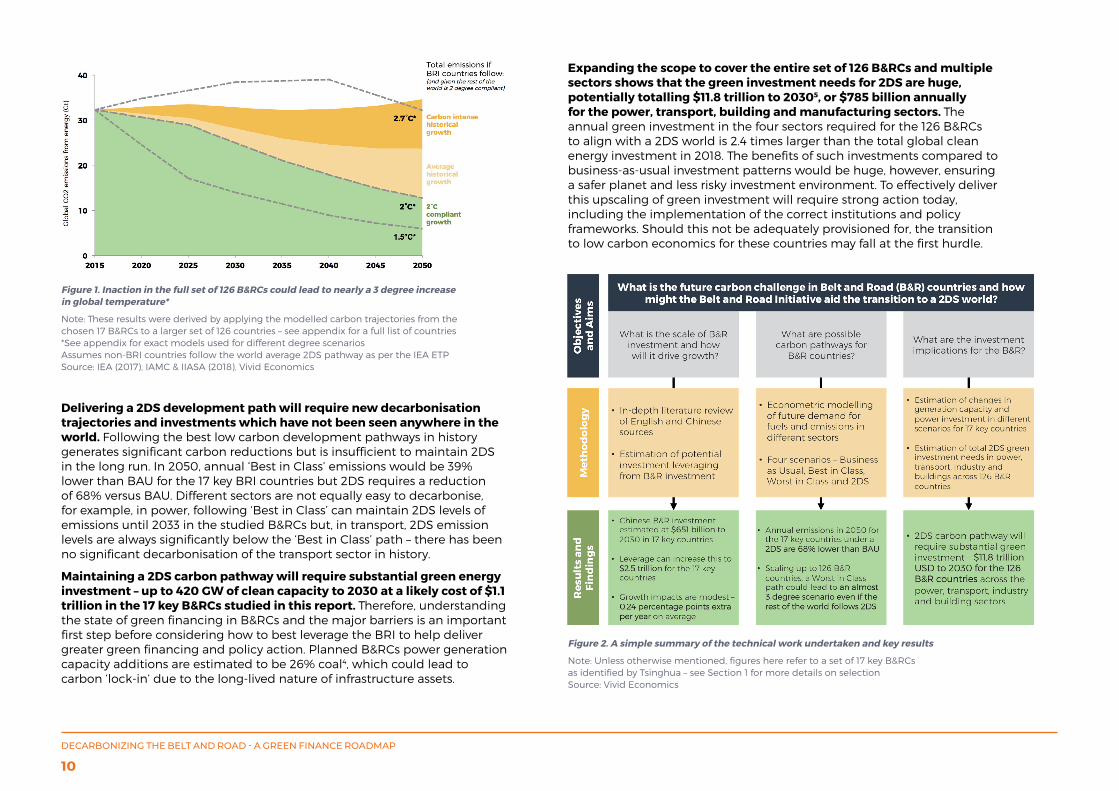
Figure 1. Inaction in the full set of 126 B&RCs could lead to nearly a 3 degree increase in global temperature*
Note: These results were derived by applying the modelled carbon trajectories from the chosen 17 B&RCs to a larger set of 126 countries – see appendix for a full list of countries*See appendix for exact models used for different degree scenariosAssumes non-BRI countries follow the world average 2DS pathway as per the IEA ETPSource: IEA (2017), IAMC & IIASA (2018), Vivid Economics
Delivering a 2DS development path will require new decarbonisation trajectories and investments which have not been seen anywhere in the world. Following the best low carbon development pathways in history generates significant carbon reductions but is insufficient to maintain 2DS in the long run. In 2050, annual ‘Best in Class’ emissions would be 39% lower than BAU for the 17 key BRI countries but 2DS requires a reduction of 68% versus BAU. Different sectors are not equally easy to decarbonise, for example, in power, following ‘Best in Class’ can maintain 2DS levels of emissions until 2033 in the studied B&RCs but, in transport, 2DS emission levels are always significantly below the ‘Best in Class’ path – there has been no significant decarbonisation of the transport sector in history.
Maintaining a 2DS carbon pathway will require substantial green energy investment – up to 420 GW of clean capacity to 2030 at a likely cost of $1.1 trillion in the 17 key B&RCs studied in this report. Therefore, understanding the state of green financing in B&RCs and the major barriers is an important first step before considering how to best leverage the BRI to help deliver greater green financing and policy action. Planned B&RCs power generation capacity additions are estimated to be 26% coal4, which could lead to carbon ‘lock-in’ due to the long-lived nature of infrastructure assets.
Expanding the scope to cover the entire set of 126 B&RCs and multiple sectors shows that the green investment needs for 2DS are huge, potentially totalling $11.8 trillion to 20305, or $785 billion annually for the power, transport, building and manufacturing sectors. The annual green investment in the four sectors required for the 126 B&RCs to align with a 2DS world is 2.4 times larger than the total global clean energy investment in 2018. The benefits of such investments compared to business-as-usual investment patterns would be huge, however, ensuring a safer planet and less risky investment environment. To effectively deliver this upscaling of green investment will require strong action today, including the implementation of the correct institutions and policy frameworks. Should this not be adequately provisioned for, the transition to low carbon economics for these countries may fall at the first hurdle.
Figure 2. A simple summary of the technical work undertaken and key results
Note: Unless otherwise mentioned, figures here refer to a set of 17 key B&RCs as identified by Tsinghua – see Section 1 for more details on selectionSource: Vivid Economics
DECARBONIZING THE BELT AND ROAD - A GREEN FINANCE ROADMAP
10
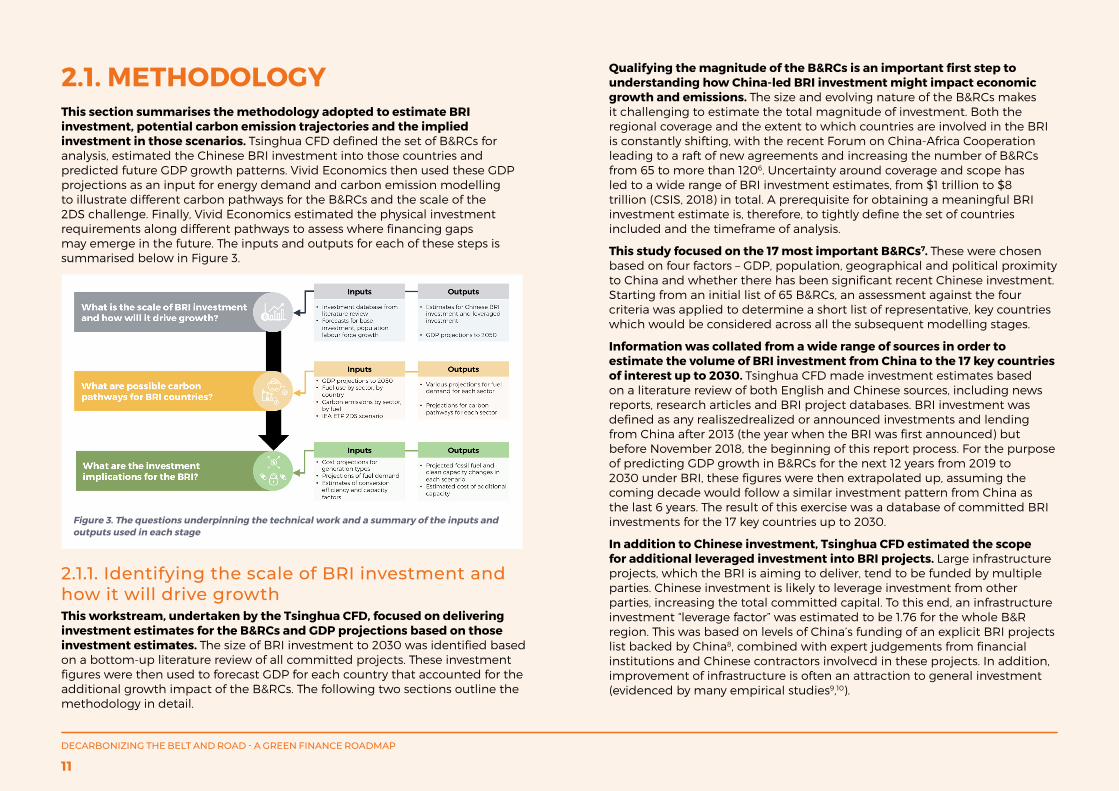
2.1. METHODOLOGYThis section summarises the methodology adopted to estimate BRI investment, potential carbon emission trajectories and the implied investment in those scenarios. Tsinghua CFD defined the set of B&RCs for analysis, estimated the Chinese BRI investment into those countries and predicted future GDP growth patterns. Vivid Economics then used these GDP projections as an input for energy demand and carbon emission modelling to illustrate different carbon pathways for the B&RCs and the scale of the 2DS challenge. Finally, Vivid Economics estimated the physical investment requirements along different pathways to assess where financing gaps may emerge in the future. The inputs and outputs for each of these steps is summarised below in Figure 3.
Figure 3. The questions underpinning the technical work and a summary of the inputs and outputs used in each stage
2.1.1. Identifying the scale of BRI investment and how it will drive growthThis workstream, undertaken by the Tsinghua CFD, focused on delivering investment estimates for the B&RCs and GDP projections based on those investment estimates. The size of BRI investment to 2030 was identified based on a bottom-up literature review of all committed projects. These investment figures were then used to forecast GDP for each country that accounted for the additional growth impact of the B&RCs. The following two sections outline the methodology in detail.
Qualifying the magnitude of the B&RCs is an important first step to understanding how China-led BRI investment might impact economic growth and emissions. The size and evolving nature of the B&RCs makes it challenging to estimate the total magnitude of investment. Both the regional coverage and the extent to which countries are involved in the BRI is constantly shifting, with the recent Forum on China-Africa Cooperation leading to a raft of new agreements and increasing the number of B&RCs from 65 to more than 1206. Uncertainty around coverage and scope has led to a wide range of BRI investment estimates, from $1 trillion to $8 trillion (CSIS, 2018) in total. A prerequisite for obtaining a meaningful BRI investment estimate is, therefore, to tightly define the set of countries included and the timeframe of analysis.
This study focused on the 17 most important B&RCs7. These were chosen based on four factors – GDP, population, geographical and political proximity to China and whether there has been significant recent Chinese investment. Starting from an initial list of 65 B&RCs, an assessment against the four criteria was applied to determine a short list of representative, key countries which would be considered across all the subsequent modelling stages.
Information was collated from a wide range of sources in order to estimate the volume of BRI investment from China to the 17 key countries of interest up to 2030. Tsinghua CFD made investment estimates based on a literature review of both English and Chinese sources, including news reports, research articles and BRI project databases. BRI investment was defined as any realiszedrealized or announced investments and lending from China after 2013 (the year when the BRI was first announced) but before November 2018, the beginning of this report process. For the purpose of predicting GDP growth in B&RCs for the next 12 years from 2019 to 2030 under BRI, these figures were then extrapolated up, assuming the coming decade would follow a similar investment pattern from China as the last 6 years. The result of this exercise was a database of committed BRI investments for the 17 key countries up to 2030.
In addition to Chinese investment, Tsinghua CFD estimated the scope for additional leveraged investment into BRI projects. Large infrastructure projects, which the BRI is aiming to deliver, tend to be funded by multiple parties. Chinese investment is likely to leverage investment from other parties, increasing the total committed capital. To this end, an infrastructure investment “leverage factor” was estimated to be 1.76 for the whole B&R region. This was based on levels of China’s funding of an explicit BRI projects list backed by China8, combined with expert judgements from financial institutions and Chinese contractors involvecd in these projects. In addition, improvement of infrastructure is often an attraction to general investment (evidenced by many empirical studies9,10).
DECARBONIZING THE BELT AND ROAD - A GREEN FINANCE ROADMAP
11
Therefore, a secondary “leverage factor” addressing the leverage effect of increased infrastructure on general investment was estimated to be 2.25 according to a literature review11.
The outcome of this exercise was estimates for Chinese BRI investment for the 17 countries of interest, as well as leveraging factors representing all the leveraged sources of investment. These were used to both illustrate the significance of the BRI across the chosen countries and as inputs in the GDP growth modelling, presented in the following section.
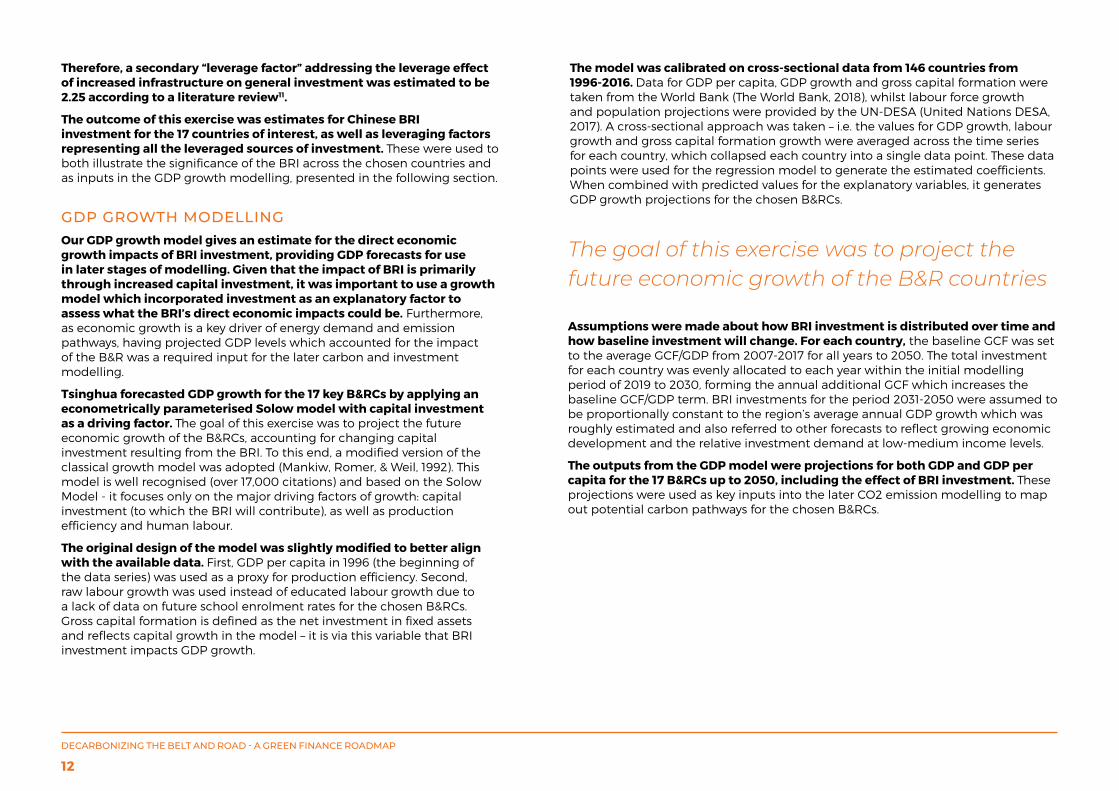
GDP GROWTH MODELLINGOur GDP growth model gives an estimate for the direct economic growth impacts of BRI investment, providing GDP forecasts for use in later stages of modelling. Given that the impact of BRI is primarily through increased capital investment, it was important to use a growth model which incorporated investment as an explanatory factor to assess what the BRI’s direct economic impacts could be. Furthermore, as economic growth is a key driver of energy demand and emission pathways, having projected GDP levels which accounted for the impact of the B&R was a required input for the later carbon and investment modelling.
Tsinghua forecasted GDP growth for the 17 key B&RCs by applying an econometrically parameterised Solow model with capital investment as a driving factor. The goal of this exercise was to project the future economic growth of the B&RCs, accounting for changing capital investment resulting from the BRI. To this end, a modified version of the classical growth model was adopted (Mankiw, Romer, & Weil, 1992). This model is well recognised (over 17,000 citations) and based on the Solow Model - it focuses only on the major driving factors of growth: capital investment (to which the BRI will contribute), as well as production efficiency and human labour.
The original design of the model was slightly modified to better align with the available data. First, GDP per capita in 1996 (the beginning of the data series) was used as a proxy for production efficiency. Second, raw labour growth was used instead of educated labour growth due to a lack of data on future school enrolment rates for the chosen B&RCs. Gross capital formation is defined as the net investment in fixed assets and reflects capital growth in the model – it is via this variable that BRI investment impacts GDP growth.
The model was calibrated on cross-sectional data from 146 countries from 1996-2016. Data for GDP per capita, GDP growth and gross capital formation were taken from the World Bank (The World Bank, 2018), whilst labour force growth and population projections were provided by the UN-DESA (United Nations DESA, 2017). A cross-sectional approach was taken – i.e. the values for GDP growth, labour growth and gross capital formation growth were averaged across the time series for each country, which collapsed each country into a single data point. These data points were used for the regression model to generate the estimated coefficients. When combined with predicted values for the explanatory variables, it generates GDP growth projections for the chosen B&RCs.
The goal of this exercise was to project the future economic growth of the B&R countries
Assumptions were made about how BRI investment is distributed over time and how baseline investment will change. For each country, the baseline GCF was set to the average GCF/GDP from 2007-2017 for all years to 2050. The total investment for each country was evenly allocated to each year within the initial modelling period of 2019 to 2030, forming the annual additional GCF which increases the baseline GCF/GDP term. BRI investments for the period 2031-2050 were assumed to be proportionally constant to the region’s average annual GDP growth which was roughly estimated and also referred to other forecasts to reflect growing economic development and the relative investment demand at low-medium income levels.
The outputs from the GDP model were projections for both GDP and GDP per capita for the 17 B&RCs up to 2050, including the effect of BRI investment. These projections were used as key inputs into the later CO2 emission modelling to map out potential carbon pathways for the chosen B&RCs.
DECARBONIZING THE BELT AND ROAD - A GREEN FINANCE ROADMAP
12
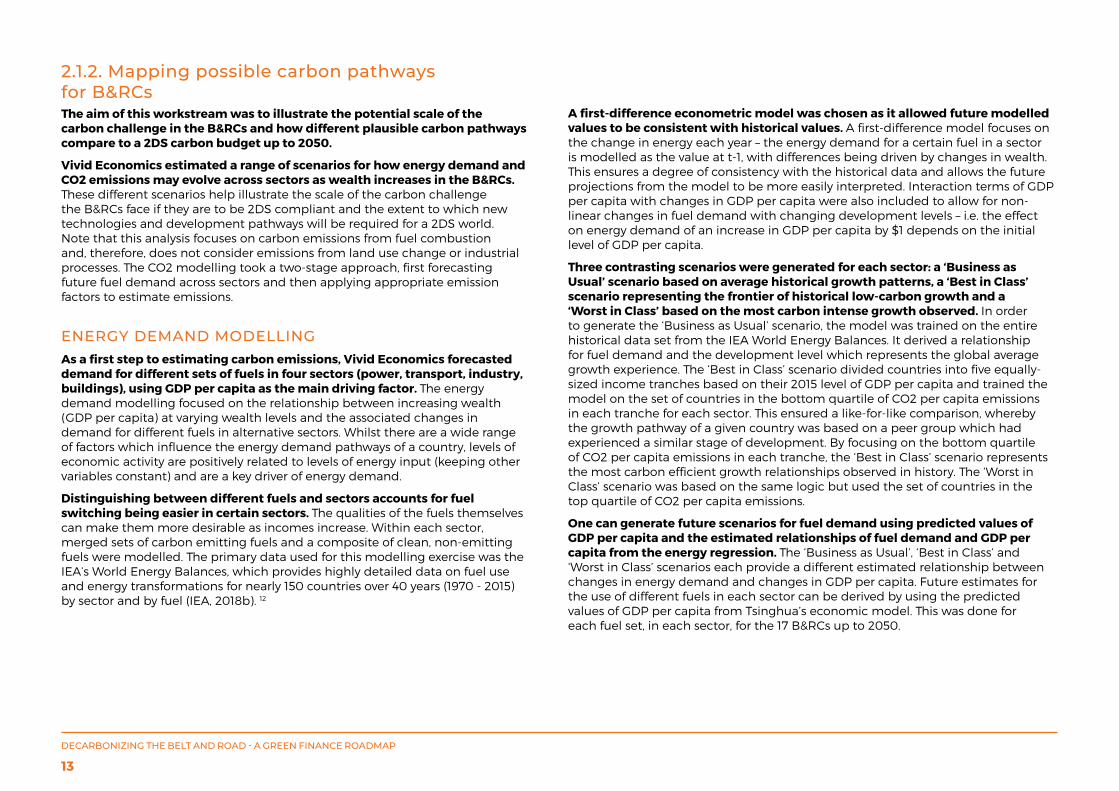
2.1.2. Mapping possible carbon pathways for B&RCsThe aim of this workstream was to illustrate the potential scale of the carbon challenge in the B&RCs and how different plausible carbon pathways compare to a 2DS carbon budget up to 2050.
Vivid Economics estimated a range of scenarios for how energy demand and CO2 emissions may evolve across sectors as wealth increases in the B&RCs. These different scenarios help illustrate the scale of the carbon challenge the B&RCs face if they are to be 2DS compliant and the extent to which new technologies and development pathways will be required for a 2DS world. Note that this analysis focuses on carbon emissions from fuel combustion and, therefore, does not consider emissions from land use change or industrial processes. The CO2 modelling took a two-stage approach, first forecasting future fuel demand across sectors and then applying appropriate emission factors to estimate emissions.
ENERGY DEMAND MODELLINGAs a first step to estimating carbon emissions, Vivid Economics forecasted demand for different sets of fuels in four sectors (power, transport, industry, buildings), using GDP per capita as the main driving factor. The energy demand modelling focused on the relationship between increasing wealth (GDP per capita) at varying wealth levels and the associated changes in demand for different fuels in alternative sectors. Whilst there are a wide range of factors which influence the energy demand pathways of a country, levels of economic activity are positively related to levels of energy input (keeping other variables constant) and are a key driver of energy demand.
Distinguishing between different fuels and sectors accounts for fuel switching being easier in certain sectors. The qualities of the fuels themselves can make them more desirable as incomes increase. Within each sector, merged sets of carbon emitting fuels and a composite of clean, non-emitting fuels were modelled. The primary data used for this modelling exercise was the IEA’s World Energy Balances, which provides highly detailed data on fuel use and energy transformations for nearly 150 countries over 40 years (1970 - 2015) by sector and by fuel (IEA, 2018b). 12
A first-difference econometric model was chosen as it allowed future modelled values to be consistent with historical values. A first-difference model focuses on the change in energy each year – the energy demand for a certain fuel in a sector is modelled as the value at t-1, with differences being driven by changes in wealth. This ensures a degree of consistency with the historical data and allows the future projections from the model to be more easily interpreted. Interaction terms of GDP per capita with changes in GDP per capita were also included to allow for non-linear changes in fuel demand with changing development levels – i.e. the effect on energy demand of an increase in GDP per capita by $1 depends on the initial level of GDP per capita.
Three contrasting scenarios were generated for each sector: a ‘Business as Usual’ scenario based on average historical growth patterns, a ‘Best in Class’ scenario representing the frontier of historical low-carbon growth and a ‘Worst in Class’ based on the most carbon intense growth observed. In order to generate the ‘Business as Usual’ scenario, the model was trained on the entire historical data set from the IEA World Energy Balances. It derived a relationship for fuel demand and the development level which represents the global average growth experience. The ‘Best in Class’ scenario divided countries into five equally-sized income tranches based on their 2015 level of GDP per capita and trained the model on the set of countries in the bottom quartile of CO2 per capita emissions in each tranche for each sector. This ensured a like-for-like comparison, whereby the growth pathway of a given country was based on a peer group which had experienced a similar stage of development. By focusing on the bottom quartile of CO2 per capita emissions in each tranche, the ‘Best in Class’ scenario represents the most carbon efficient growth relationships observed in history. The ‘Worst in Class’ scenario was based on the same logic but used the set of countries in the top quartile of CO2 per capita emissions.
One can generate future scenarios for fuel demand using predicted values of GDP per capita and the estimated relationships of fuel demand and GDP per capita from the energy regression. The ‘Business as Usual’, ‘Best in Class’ and ‘Worst in Class’ scenarios each provide a different estimated relationship between changes in energy demand and changes in GDP per capita. Future estimates for the use of different fuels in each sector can be derived by using the predicted values of GDP per capita from Tsinghua’s economic model. This was done for each fuel set, in each sector, for the 17 B&RCs up to 2050.
DECARBONIZING THE BELT AND ROAD - A GREEN FINANCE ROADMAP
13
BELT AND ROAD - CARBON SCENARIOS
14
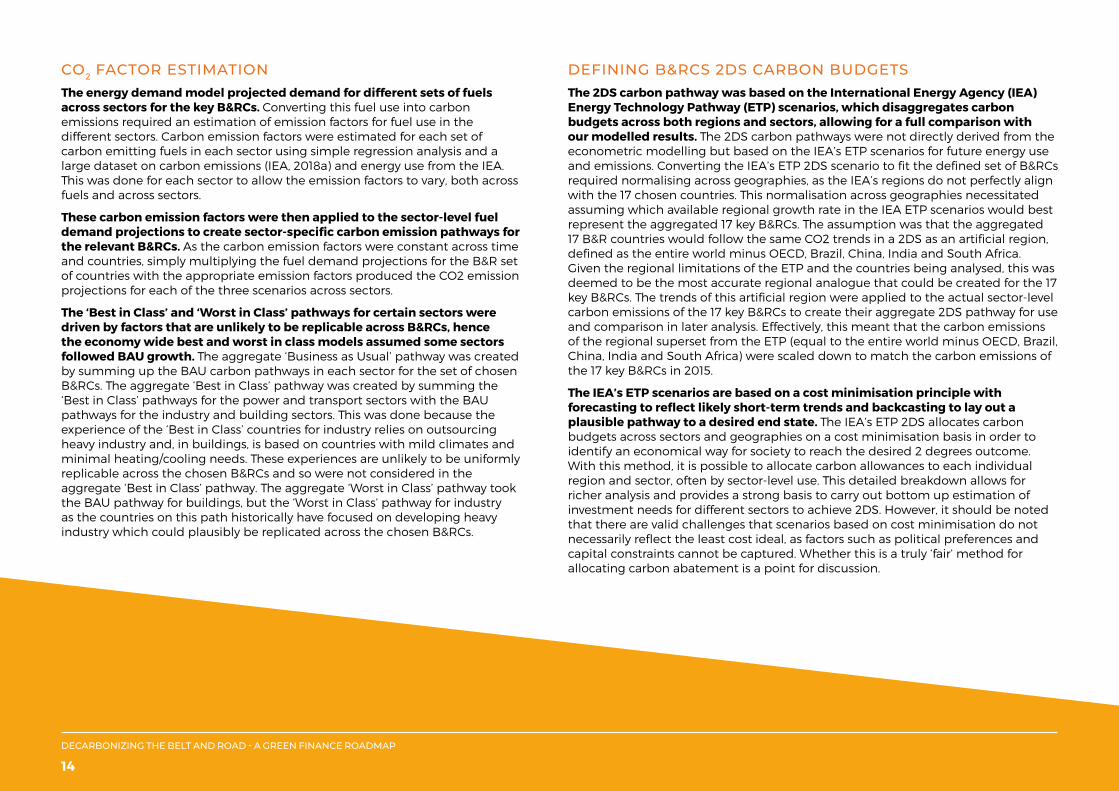
CO2 FACTOR ESTIMATIONThe energy demand model projected demand for different sets of fuels across sectors for the key B&RCs. Converting this fuel use into carbon emissions required an estimation of emission factors for fuel use in the different sectors. Carbon emission factors were estimated for each set of carbon emitting fuels in each sector using simple regression analysis and a large dataset on carbon emissions (IEA, 2018a) and energy use from the IEA. This was done for each sector to allow the emission factors to vary, both across fuels and across sectors.
These carbon emission factors were then applied to the sector-level fuel demand projections to create sector-specific carbon emission pathways for the relevant B&RCs. As the carbon emission factors were constant across time and countries, simply multiplying the fuel demand projections for the B&R set of countries with the appropriate emission factors produced the CO2 emission projections for each of the three scenarios across sectors.
The ‘Best in Class’ and ‘Worst in Class’ pathways for certain sectors were driven by factors that are unlikely to be replicable across B&RCs, hence the economy wide best and worst in class models assumed some sectors followed BAU growth. The aggregate ‘Business as Usual’ pathway was created by summing up the BAU carbon pathways in each sector for the set of chosen B&RCs. The aggregate ‘Best in Class’ pathway was created by summing the ‘Best in Class’ pathways for the power and transport sectors with the BAU pathways for the industry and building sectors. This was done because the experience of the ‘Best in Class’ countries for industry relies on outsourcing heavy industry and, in buildings, is based on countries with mild climates and minimal heating/cooling needs. These experiences are unlikely to be uniformly replicable across the chosen B&RCs and so were not considered in the aggregate ‘Best in Class’ pathway. The aggregate ‘Worst in Class’ pathway took the BAU pathway for buildings, but the ‘Worst in Class’ pathway for industry as the countries on this path historically have focused on developing heavy industry which could plausibly be replicated across the chosen B&RCs.
DEFINING B&RCS 2DS CARBON BUDGETSThe 2DS carbon pathway was based on the International Energy Agency (IEA) Energy Technology Pathway (ETP) scenarios, which disaggregates carbon budgets across both regions and sectors, allowing for a full comparison with our modelled results. The 2DS carbon pathways were not directly derived from the econometric modelling but based on the IEA’s ETP scenarios for future energy use and emissions. Converting the IEA’s ETP 2DS scenario to fit the defined set of B&RCs required normalising across geographies, as the IEA’s regions do not perfectly align with the 17 chosen countries. This normalisation across geographies necessitated assuming which available regional growth rate in the IEA ETP scenarios would best represent the aggregated 17 key B&RCs. The assumption was that the aggregated 17 B&R countries would follow the same CO2 trends in a 2DS as an artificial region, defined as the entire world minus OECD, Brazil, China, India and South Africa. Given the regional limitations of the ETP and the countries being analysed, this was deemed to be the most accurate regional analogue that could be created for the 17 key B&RCs. The trends of this artificial region were applied to the actual sector-level carbon emissions of the 17 key B&RCs to create their aggregate 2DS pathway for use and comparison in later analysis. Effectively, this meant that the carbon emissions of the regional superset from the ETP (equal to the entire world minus OECD, Brazil, China, India and South Africa) were scaled down to match the carbon emissions of the 17 key B&RCs in 2015.
The IEA’s ETP scenarios are based on a cost minimisation principle with forecasting to reflect likely short-term trends and backcasting to lay out a plausible pathway to a desired end state. The IEA’s ETP 2DS allocates carbon budgets across sectors and geographies on a cost minimisation basis in order to identify an economical way for society to reach the desired 2 degrees outcome. With this method, it is possible to allocate carbon allowances to each individual region and sector, often by sector-level use. This detailed breakdown allows for richer analysis and provides a strong basis to carry out bottom up estimation of investment needs for different sectors to achieve 2DS. However, it should be noted that there are valid challenges that scenarios based on cost minimisation do not necessarily reflect the least cost ideal, as factors such as political preferences and capital constraints cannot be captured. Whether this is a truly ‘fair’ method for allocating carbon abatement is a point for discussion.
DECARBONIZING THE BELT AND ROAD - A GREEN FINANCE ROADMAP
14
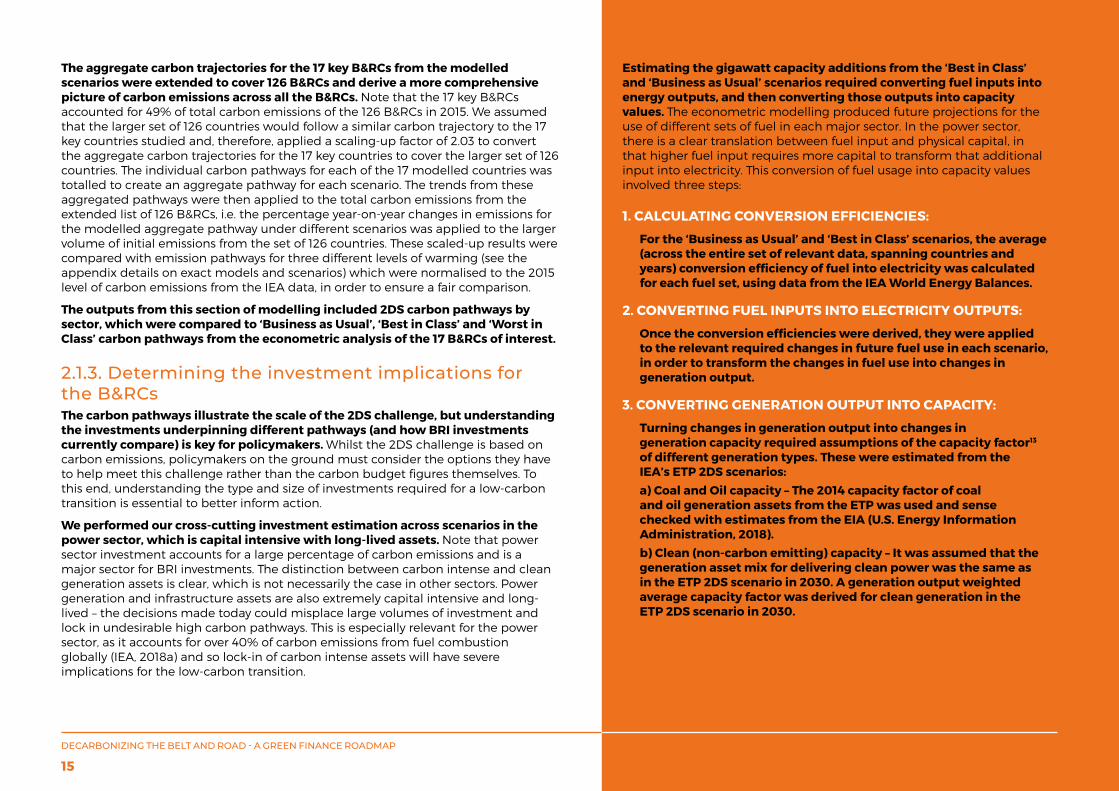
The aggregate carbon trajectories for the 17 key B&RCs from the modelled scenarios were extended to cover 126 B&RCs and derive a more comprehensive picture of carbon emissions across all the B&RCs. Note that the 17 key B&RCs accounted for 49% of total carbon emissions of the 126 B&RCs in 2015. We assumed that the larger set of 126 countries would follow a similar carbon trajectory to the 17 key countries studied and, therefore, applied a scaling-up factor of 2.03 to convert the aggregate carbon trajectories for the 17 key countries to cover the larger set of 126 countries. The individual carbon pathways for each of the 17 modelled countries was totalled to create an aggregate pathway for each scenario. The trends from these aggregated pathways were then applied to the total carbon emissions from the extended list of 126 B&RCs, i.e. the percentage year-on-year changes in emissions for the modelled aggregate pathway under different scenarios was applied to the larger volume of initial emissions from the set of 126 countries. These scaled-up results were compared with emission pathways for three different levels of warming (see the appendix details on exact models and scenarios) which were normalised to the 2015 level of carbon emissions from the IEA data, in order to ensure a fair comparison.
The outputs from this section of modelling included 2DS carbon pathways by sector, which were compared to ‘Business as Usual’, ‘Best in Class’ and ‘Worst in Class’ carbon pathways from the econometric analysis of the 17 B&RCs of interest.
2.1.3. Determining the investment implications for the B&RCsThe carbon pathways illustrate the scale of the 2DS challenge, but understanding the investments underpinning different pathways (and how BRI investments currently compare) is key for policymakers. Whilst the 2DS challenge is based on carbon emissions, policymakers on the ground must consider the options they have to help meet this challenge rather than the carbon budget figures themselves. To this end, understanding the type and size of investments required for a low-carbon transition is essential to better inform action.
We performed our cross-cutting investment estimation across scenarios in the power sector, which is capital intensive with long-lived assets. Note that power sector investment accounts for a large percentage of carbon emissions and is a major sector for BRI investments. The distinction between carbon intense and clean generation assets is clear, which is not necessarily the case in other sectors. Power generation and infrastructure assets are also extremely capital intensive and long-lived – the decisions made today could misplace large volumes of investment and lock in undesirable high carbon pathways. This is especially relevant for the power sector, as it accounts for over 40% of carbon emissions from fuel combustion globally (IEA, 2018a) and so lock-in of carbon intense assets will have severe implications for the low-carbon transition.
Estimating the gigawatt capacity additions from the ‘Best in Class’ and ‘Business as Usual’ scenarios required converting fuel inputs into energy outputs, and then converting those outputs into capacity values. The econometric modelling produced future projections for the use of different sets of fuel in each major sector. In the power sector, there is a clear translation between fuel input and physical capital, in that higher fuel input requires more capital to transform that additional input into electricity. This conversion of fuel usage into capacity values involved three steps:
1. CALCULATING CONVERSION EFFICIENCIES:
For the ‘Business as Usual’ and ‘Best in Class’ scenarios, the average (across the entire set of relevant data, spanning countries and years) conversion efficiency of fuel into electricity was calculated for each fuel set, using data from the IEA World Energy Balances.
2. CONVERTING FUEL INPUTS INTO ELECTRICITY OUTPUTS:
Once the conversion efficiencies were derived, they were applied to the relevant required changes in future fuel use in each scenario, in order to transform the changes in fuel use into changes in generation output.
3. CONVERTING GENERATION OUTPUT INTO CAPACITY:
Turning changes in generation output into changes in generation capacity required assumptions of the capacity factor13 of different generation types. These were estimated from the IEA’s ETP 2DS scenarios: a) Coal and Oil capacity – The 2014 capacity factor of coal and oil generation assets from the ETP was used and sense checked with estimates from the EIA (U.S. Energy Information Administration, 2018). b) Clean (non-carbon emitting) capacity – It was assumed that the generation asset mix for delivering clean power was the same as in the ETP 2DS scenario in 2030. A generation output weighted average capacity factor was derived for clean generation in the ETP 2DS scenario in 2030.
DECARBONIZING THE BELT AND ROAD - A GREEN FINANCE ROADMAP
15
The IEA ETP 2DS generation output figures were adjusted to better fit the set of modelled B&RCs and then the same conversion method was applied to convert power output to capacity additions. In order to have a fair comparison of capacity changes between the BAU and ‘Best in Class’ scenarios and the ETP scenarios, the methodology of converting generation outputs into capacity changes (Step 3 above) was also applied to the ETP scenarios, in order to provide the most consistent and comparable estimates for capacity changes.
Estimates of the capital cost of different generation technologies and cost reductions over time were taken from IEA and CSIRO reports and applied to the capacity numbers to arrive at investment values. The capital costs were taken from either the IEA’s report on the Projected Costs of Generating Electricity (IEA, 2015) or CSIRO’s Electricity Technology Cost Projections report (Hayward & Graham, 2017). It was assumed that the generation assets were built out in three equal stages in 2020, 2025 and 2030, allowing for a degree of technological cost reduction.
Current BRI power capacity investments were collated from international organisations and corroborated by Tsinghua CFD’s own research and discussion with local experts. A range of estimates for new capacity under already announced BRI investments were gathered from available studies and compared with Tsinghua’s own estimates, before being sense checked with senior policymakers.
The output from this modelling exercise was a comparison of the capacity additions for coal and oil generation and clean generation under different scenarios up to 2030 and estimates for the dollar value of those investments.
ESTIMATING THE TOTAL GREEN INVESTMENT NEEDS FOR B&RCSFully appreciating the scale of the future green investment challenge requires estimating investment needs across all 126 B&RCs, as well as all major sectors. The power sector investments across scenarios is aimed at showing the need for a radical change in development pathways, as even the best low-carbon development seen in history will not be enough for a 2DS. However, this power sector investment in zero-carbon generation only represents a small total of the infrastructure investment that will be required for the B&RCs to adhere to a 2DS pathway. Better understanding of the size of future green investment requires scaling up of countries (from the 17 key countries to a larger set of 126) and sectors (from the power sector alone to power, transport, industry and buildings).
Total green 2DS power investment includes not only zero-carbon generation, but also gas capacity investments and maintenance costs. Zero-carbon generation is an obvious green investment for the power sector – this was estimated for the B&R 126 countries (with OECD countries in the B&RCs set following the OECD growth rates from the ETP and non-OECD countries following non-OECD rates) as well as India and China separately for the 2DS scenario for comparison, as previously described in the methodology. Given the key role it is expected to play as a bridging technology to greater renewable generation for many countries, gas capacity generation was also considered as a green investment despite not being net zero carbon. The capacity additions for gas generation followed a similar method as that used for estimating zero-carbon generation additions – the modelling provided additional energy inputs into gas generation for different scenarios, which were then converted into electricity output and capacity additions by assuming a certain conversion efficiency and capacity factor. Estimates were primarily based on the ETP 2DS scenarios, with OECD countries in the B&R 126 following the ETP OECD trend rates and non-OECD countries therein following the non-OECD trend rates. Maintenance costs assumed that gas and zero-carbon capacity in 2015 would depreciate at a rate of 2% per year and need to be replaced at the same unit cost as for new capacity. Maintenance costs were not considered for new capacity additions, as they will only require maintaining near the end of their capital lifespan, which should be well beyond 2030.
Transport green investment considered the investment into new railways and electric vehicles required in order to deliver 2DS levels of decarbonization in transport. Investment needs were based on the ETP figures for energy use, and carbon emissions and service levels for passenger rail and light road transport up to 2030.
Rail investment requirements were estimated by quantifying the infrastructure costs associated with additional rail passenger-km in the ETP scenarios. The first step to this was estimating the additional rail passenger-km for the B&R 126 countries to 2030. The ETP provides estimates for additional rail passenger-km to 2030 for the OECD and non-OECD countries in aggregate, but these needed to be scaled down to fit the B&R 126 countries. This scaling factor was derived by separately comparing the 2015 total rail energy use of OECD and non-OECD countries with the OECD and non-OECD countries within the B&R 126 countries. This produced two scaling factors, which were applied to the additional rail passenger-km to 2030 for the OECD and non-OECD countries in aggregate from the ETP to arrive at a figure for additional rail passenger-km for the B&R 126 countries to 2030. Estimates from the literature on the usage rates (passenger km per km of railway (European Commission, 2015)) and costs of rail transport per km (UIC, 2015) were then applied to arrive at a cost of rail infrastructure required to deliver the additional passenger-km (as predicted by the scaled ETP 2DS scenario).
DECARBONIZING THE BELT AND ROAD - A GREEN FINANCE ROADMAP
16
Deriving the required additional number of electric vehicles to 2030 involved several steps: firstly, an assumption was made that the ETP reference scenario represented a ‘Business as Usual’ improvement in car emission efficiency and, secondly, it was assumed that the remaining carbon emissions ‘gap’ to 2DS in light road passenger transport needed to be delivered by electric vehicles. Electric vehicles were assumed to be zero-carbon. Additional assumptions were made on the passenger loading levels (EEA, 2010) and usage rates of cars (US FHWA, 2018). With this method, it was possible to estimate the yearly saving in carbon emissions from running a single electric car. This unit estimate can then be applied to the yearly required carbon reductions in light road transport to meet 2DS to derive a figure for the additional number of electric cars needed annually to 2030 to deliver that carbon reduction. Electric vehicles were assumed to have a lifespan of 10 years and replacement costs were considered in later years. This was done separately for the OECD and non-OECD regions (assumptions such as loading levels differed for each) and the projections were then scaled down according to the energy use in road transport in 2015 for the OECD and non-OECD regions, relative to the energy use in road transport in 2015 for the OECD and non-OECD components of the B&R 126 countries. Summing these components created an estimate of the number of EVs the B&R 126 countries would require up to 2030 to achieve 2DS in light road transport. Applying this to forecasts for future
EV prices from the literature (BNEF, 2015) provided the costs for new EVs up to 2030 for a 2DS. The charging infrastructure needed to support these new EVs was also considered: high-level estimates for charge-point use density and costs were taken from detailed studies (ICCT, 2017) and applied to our figures for the new number of electric vehicles required.
Green investment needs to 2030 for the buildings and industry sectors are difficult to assess in a bottom-up fashion – estimates from the IEA’s World Energy Outlook (WEO) New Policies Scenario were adopted and scaled according to energy use to match the regions of interest. The IEA WEO provides global estimates for the energy efficiency investments needed in the building and industry sectors up to 2040 for their New Policies Scenario, which aims to achieve the Paris Agreement Targets. These estimates were scaled down to cover just the time period up to 2030 and allocated to regions based on the investment shares for industry and buildings from the IEA’s ETP scenario (which considers all investment needs, not just green investment). The ETP only splits investment needs into major countries and regions (which includes China and India) so the investment needs for the B&R 126 countries were based on their share of global energy use in these sectors in 2015. In general, a bottom-up approach for estimating investment needs in these sectors is not practical given the range of technologies and use cases involved, as well as the lack of reliable data on the costs and benefits of those different technologies. Hence adopting this more top-down approach was a more sensible option.
Total green 2DS power investment includes not only zero-carbon generation, but also gas capacity investments and maintenance costs.
DECARBONIZING THE BELT AND ROAD - A GREEN FINANCE ROADMAP
17
2.2 RESULTSThe B&RC list is always evolving, with a shifting geographical scope – for the purposes of the technical modeling, 17 countries representing the majority of B&RC’s GDP, investment and population were chosen for deep analysis. The exact steps taken to arrive at this set of 17 B&RCs is described in more detail in the previous technical methodology section.
There is deep uncertainty surrounding long-run projections and care should be taken when interpreting them. One must acknowledge the existence of critical uncertainties when interpreting model results. Critical uncertainties have the potential to drive structural shifts and alter how climate change and green financing issues are addressed. The UN report ‘Shifting the Lens’ (UNEP, 2018) highlights some of these critical uncertainties such as the impact of ‘mega-events’ driving unprecedented international cooperation and new innovations allowing for profitable and rapid decarbonization of certain sectors.
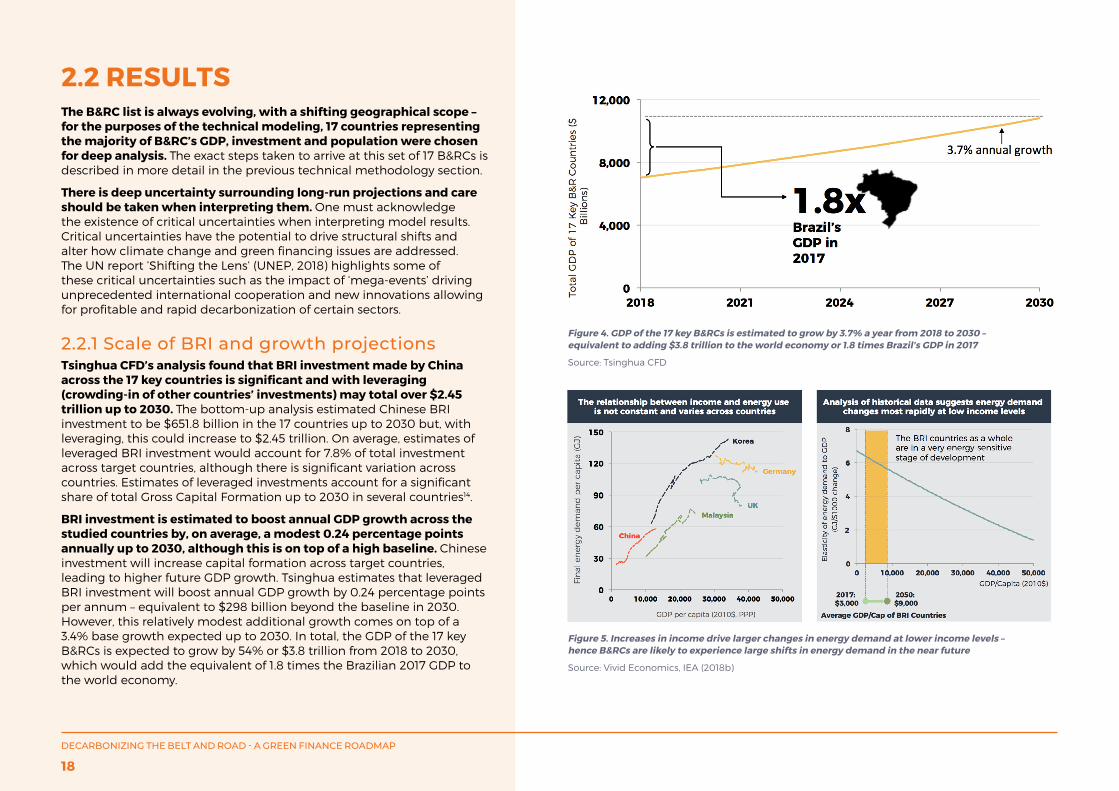
2.2.1 Scale of BRI and growth projectionsTsinghua CFD’s analysis found that BRI investment made by China across the 17 key countries is significant and with leveraging (crowding-in of other countries’ investments) may total over $2.45 trillion up to 2030. The bottom-up analysis estimated Chinese BRI investment to be $651.8 billion in the 17 countries up to 2030 but, with leveraging, this could increase to $2.45 trillion. On average, estimates of leveraged BRI investment would account for 7.8% of total investment across target countries, although there is significant variation across countries. Estimates of leveraged investments account for a significant share of total Gross Capital Formation up to 2030 in several countries14.
BRI investment is estimated to boost annual GDP growth across the studied countries by, on average, a modest 0.24 percentage points annually up to 2030, although this is on top of a high baseline. Chinese investment will increase capital formation across target countries, leading to higher future GDP growth. Tsinghua estimates that leveraged BRI investment will boost annual GDP growth by 0.24 percentage points per annum – equivalent to $298 billion beyond the baseline in 2030. However, this relatively modest additional growth comes on top of a 3.4% base growth expected up to 2030. In total, the GDP of the 17 key B&RCs is expected to grow by 54% or $3.8 trillion from 2018 to 2030, which would add the equivalent of 1.8 times the Brazilian 2017 GDP to the world economy.
Figure 4. GDP of the 17 key B&RCs is estimated to grow by 3.7% a year from 2018 to 2030 – equivalent to adding $3.8 trillion to the world economy or 1.8 times Brazil’s GDP in 2017
Source: Tsinghua CFD
Figure 5. Increases in income drive larger changes in energy demand at lower income levels – hence B&RCs are likely to experience large shifts in energy demand in the near future
Source: Vivid Economics, IEA (2018b)
DECARBONIZING THE BELT AND ROAD - A GREEN FINANCE ROADMAP
18
Despite relatively modest GDP implications, the B&R has significant potential to steer future emission pathways, as investments are concentrated in power and transport infrastructure. As shown in Figure 5, B&RCs are entering a stage of development characterised by intense energy demand growth. How (or whether) this translates into emissions growth depends largely on the types of infrastructure investments made over the next decade. For example, building coal power stations today can lock electricity systems into a high carbon trajectory unless plants are decommissioned before natural retirement. The same applies to the transport sector, where roads, harbours and railroads shape what energy carriers can be used to move people and goods for many years to come. Most large BRI investments are concentrated in transport and power infrastructure which have these system characteristics. Implementing carbon conscious guidelines for investments today, therefore, has the potential to significantly change the emission trajectory of B&RCs in the future.
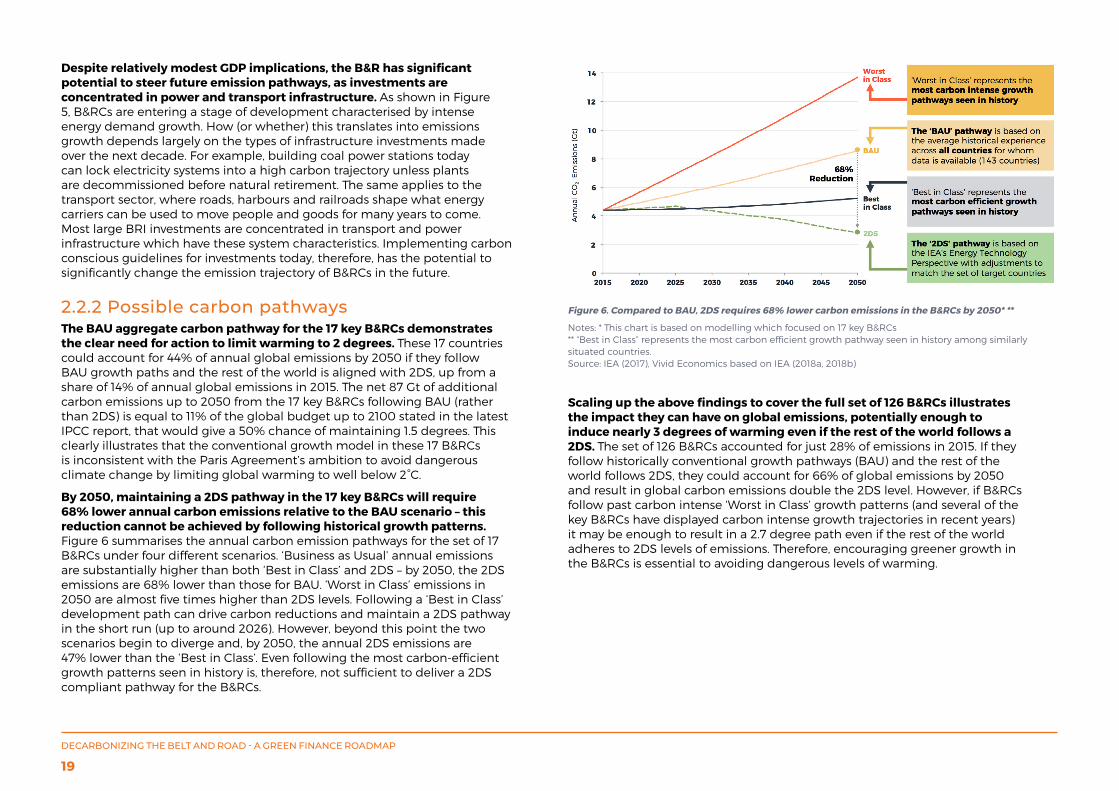
2.2.2 Possible carbon pathwaysThe BAU aggregate carbon pathway for the 17 key B&RCs demonstrates the clear need for action to limit warming to 2 degrees. These 17 countries could account for 44% of annual global emissions by 2050 if they follow BAU growth paths and the rest of the world is aligned with 2DS, up from a share of 14% of annual global emissions in 2015. The net 87 Gt of additional carbon emissions up to 2050 from the 17 key B&RCs following BAU (rather than 2DS) is equal to 11% of the global budget up to 2100 stated in the latest IPCC report, that would give a 50% chance of maintaining 1.5 degrees. This clearly illustrates that the conventional growth model in these 17 B&RCs is inconsistent with the Paris Agreement’s ambition to avoid dangerous climate change by limiting global warming to well below 2°C.
By 2050, maintaining a 2DS pathway in the 17 key B&RCs will require 68% lower annual carbon emissions relative to the BAU scenario – this reduction cannot be achieved by following historical growth patterns. Figure 6 summarises the annual carbon emission pathways for the set of 17 B&RCs under four different scenarios. ‘Business as Usual’ annual emissions are substantially higher than both ‘Best in Class’ and 2DS – by 2050, the 2DS emissions are 68% lower than those for BAU. ‘Worst in Class’ emissions in 2050 are almost five times higher than 2DS levels. Following a ‘Best in Class’ development path can drive carbon reductions and maintain a 2DS pathway in the short run (up to around 2026). However, beyond this point the two scenarios begin to diverge and, by 2050, the annual 2DS emissions are 47% lower than the ‘Best in Class’. Even following the most carbon-efficient growth patterns seen in history is, therefore, not sufficient to deliver a 2DS compliant pathway for the B&RCs.
Scaling up the above findings to cover the full set of 126 B&RCs illustrates the impact they can have on global emissions, potentially enough to induce nearly 3 degrees of warming even if the rest of the world follows a 2DS. The set of 126 B&RCs accounted for just 28% of emissions in 2015. If they follow historically conventional growth pathways (BAU) and the rest of the world follows 2DS, they could account for 66% of global emissions by 2050 and result in global carbon emissions double the 2DS level. However, if B&RCs follow past carbon intense ‘Worst in Class’ growth patterns (and several of the key B&RCs have displayed carbon intense growth trajectories in recent years) it may be enough to result in a 2.7 degree path even if the rest of the world adheres to 2DS levels of emissions. Therefore, encouraging greener growth in the B&RCs is essential to avoiding dangerous levels of warming.
Figure 6. Compared to BAU, 2DS requires 68% lower carbon emissions in the B&RCs by 2050* **
Notes: * This chart is based on modelling which focused on 17 key B&RCs** “Best in Class” represents the most carbon efficient growth pathway seen in history among similarly situated countries.Source: IEA (2017), Vivid Economics based on IEA (2018a, 2018b)
DECARBONIZING THE BELT AND ROAD - A GREEN FINANCE ROADMAP
19
SECTOR LEVEL IMPACTSThe sector level 2DS carbon budgets were derived from the IEA’s ETP scenarios, which apply a cost minimisation principle to be able to allocate carbon budgets to individual sectors and regions. As mentioned previously in section 2.1.2, the IEA’s ETP 2DS allocates carbon budgets across sectors and geographies on a cost minimisation basis in order to identify an economical way for society to reach the desired 2 degrees outcome. With this method, it is possible to allocate carbon allowances to each individual region and sector. This detailed breakdown allows for more granular analysis of the scale of the 2DS challenge in individual sectors, but it should be noted that scenarios based on cost minimisation do not necessarily reflect the least cost ideal, as factors such as political preferences and capital constraints cannot be captured. Whether this is a truly ‘fair’ method for allocating carbon abatement is a point for discussion.
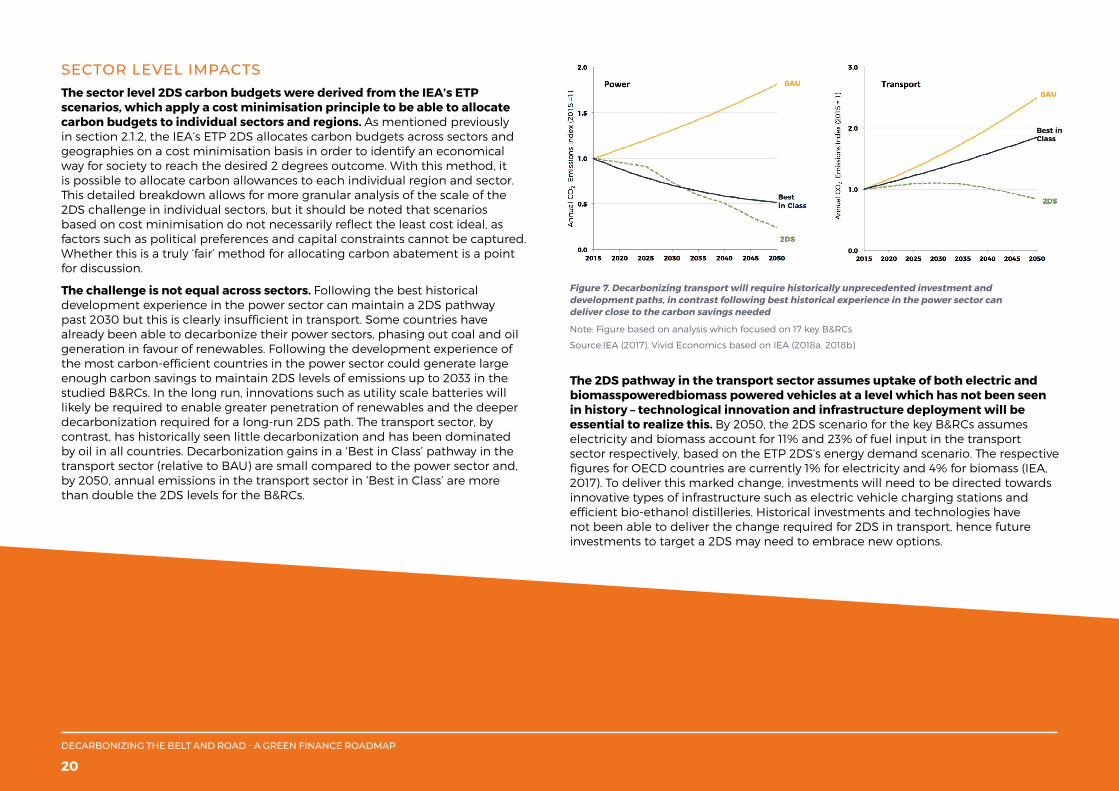
The challenge is not equal across sectors. Following the best historical development experience in the power sector can maintain a 2DS pathway past 2030 but this is clearly insufficient in transport. Some countries have already been able to decarbonize their power sectors, phasing out coal and oil generation in favour of renewables. Following the development experience of the most carbon-efficient countries in the power sector could generate large enough carbon savings to maintain 2DS levels of emissions up to 2033 in the studied B&RCs. In the long run, innovations such as utility scale batteries will likely be required to enable greater penetration of renewables and the deeper decarbonization required for a long-run 2DS path. The transport sector, by contrast, has historically seen little decarbonization and has been dominated by oil in all countries. Decarbonization gains in a ‘Best in Class’ pathway in the transport sector (relative to BAU) are small compared to the power sector and, by 2050, annual emissions in the transport sector in ‘Best in Class’ are more than double the 2DS levels for the B&RCs.
The 2DS pathway in the transport sector assumes uptake of both electric and biomasspoweredbiomass powered vehicles at a level which has not been seen in history – technological innovation and infrastructure deployment will be essential to realize this. By 2050, the 2DS scenario for the key B&RCs assumes electricity and biomass account for 11% and 23% of fuel input in the transport sector respectively, based on the ETP 2DS’s energy demand scenario. The respective figures for OECD countries are currently 1% for electricity and 4% for biomass (IEA, 2017). To deliver this marked change, investments will need to be directed towards innovative types of infrastructure such as electric vehicle charging stations and efficient bio-ethanol distilleries. Historical investments and technologies have not been able to deliver the change required for 2DS in transport, hence future investments to target a 2DS may need to embrace new options.
Figure 7. Decarbonizing transport will require historically unprecedented investment and development paths, in contrast following best historical experience in the power sector can deliver close to the carbon savings needed
Note: Figure based on analysis which focused on 17 key B&RCs
Source:IEA (2017), Vivid Economics based on IEA (2018a, 2018b)
DECARBONIZING THE BELT AND ROAD - A GREEN FINANCE ROADMAP
20
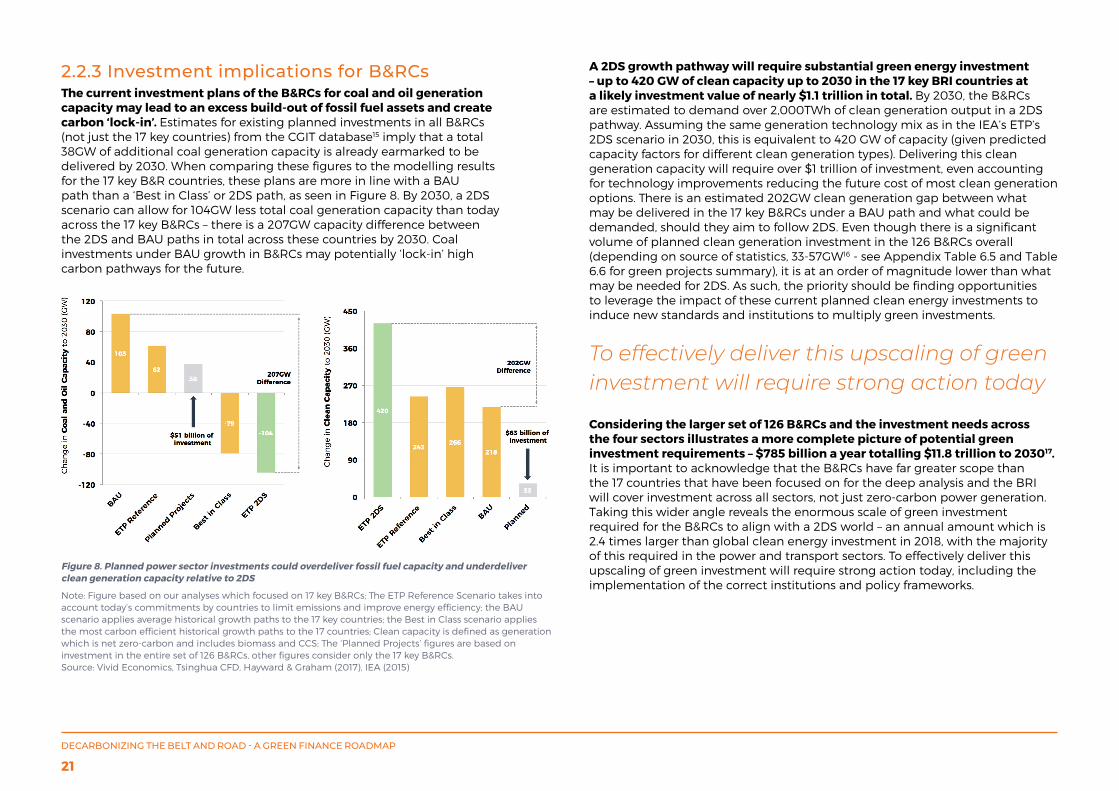
2.2.3 Investment implications for B&RCsThe current investment plans of the B&RCs for coal and oil generation capacity may lead to an excess build-out of fossil fuel assets and create carbon ‘lock-in’. Estimates for existing planned investments in all B&RCs (not just the 17 key countries) from the CGIT database15 imply that a total 38GW of additional coal generation capacity is already earmarked to be delivered by 2030. When comparing these figures to the modelling results for the 17 key B&R countries, these plans are more in line with a BAU path than a ‘Best in Class’ or 2DS path, as seen in Figure 8. By 2030, a 2DS scenario can allow for 104GW less total coal generation capacity than today across the 17 key B&RCs – there is a 207GW capacity difference between the 2DS and BAU paths in total across these countries by 2030. Coal investments under BAU growth in B&RCs may potentially ‘lock-in’ high carbon pathways for the future.
Figure 8. Planned power sector investments could overdeliver fossil fuel capacity and underdeliver clean generation capacity relative to 2DS
Note: Figure based on our analyses which focused on 17 key B&RCs; The ETP Reference Scenario takes into account today’s commitments by countries to limit emissions and improve energy efficiency; the BAU scenario applies average historical growth paths to the 17 key countries; the Best in Class scenario applies the most carbon efficient historical growth paths to the 17 countries; Clean capacity is defined as generation which is net zero-carbon and includes biomass and CCS; The ‘Planned Projects’ figures are based on investment in the entire set of 126 B&RCs, other figures consider only the 17 key B&RCs.Source: Vivid Economics, Tsinghua CFD, Hayward & Graham (2017), IEA (2015)
A 2DS growth pathway will require substantial green energy investment – up to 420 GW of clean capacity up to 2030 in the 17 key BRI countries at a likely investment value of nearly $1.1 trillion in total. By 2030, the B&RCs are estimated to demand over 2,000TWh of clean generation output in a 2DS pathway. Assuming the same generation technology mix as in the IEA’s ETP’s 2DS scenario in 2030, this is equivalent to 420 GW of capacity (given predicted capacity factors for different clean generation types). Delivering this clean generation capacity will require over $1 trillion of investment, even accounting for technology improvements reducing the future cost of most clean generation options. There is an estimated 202GW clean generation gap between what may be delivered in the 17 key B&RCs under a BAU path and what could be demanded, should they aim to follow 2DS. Even though there is a significant volume of planned clean generation investment in the 126 B&RCs overall (depending on source of statistics, 33-57GW16 - see Appendix Table 6.5 and Table 6.6 for green projects summary), it is at an order of magnitude lower than what may be needed for 2DS. As such, the priority should be finding opportunities to leverage the impact of these current planned clean energy investments to induce new standards and institutions to multiply green investments.
To effectively deliver this upscaling of green investment will require strong action today
Considering the larger set of 126 B&RCs and the investment needs across the four sectors illustrates a more complete picture of potential green investment requirements – $785 billion a year totalling $11.8 trillion to 203017. It is important to acknowledge that the B&RCs have far greater scope than the 17 countries that have been focused on for the deep analysis and the BRI will cover investment across all sectors, not just zero-carbon power generation. Taking this wider angle reveals the enormous scale of green investment required for the B&RCs to align with a 2DS world – an annual amount which is 2.4 times larger than global clean energy investment in 2018, with the majority of this required in the power and transport sectors. To effectively deliver this upscaling of green investment will require strong action today, including the implementation of the correct institutions and policy frameworks.
DECARBONIZING THE BELT AND ROAD - A GREEN FINANCE ROADMAP
21
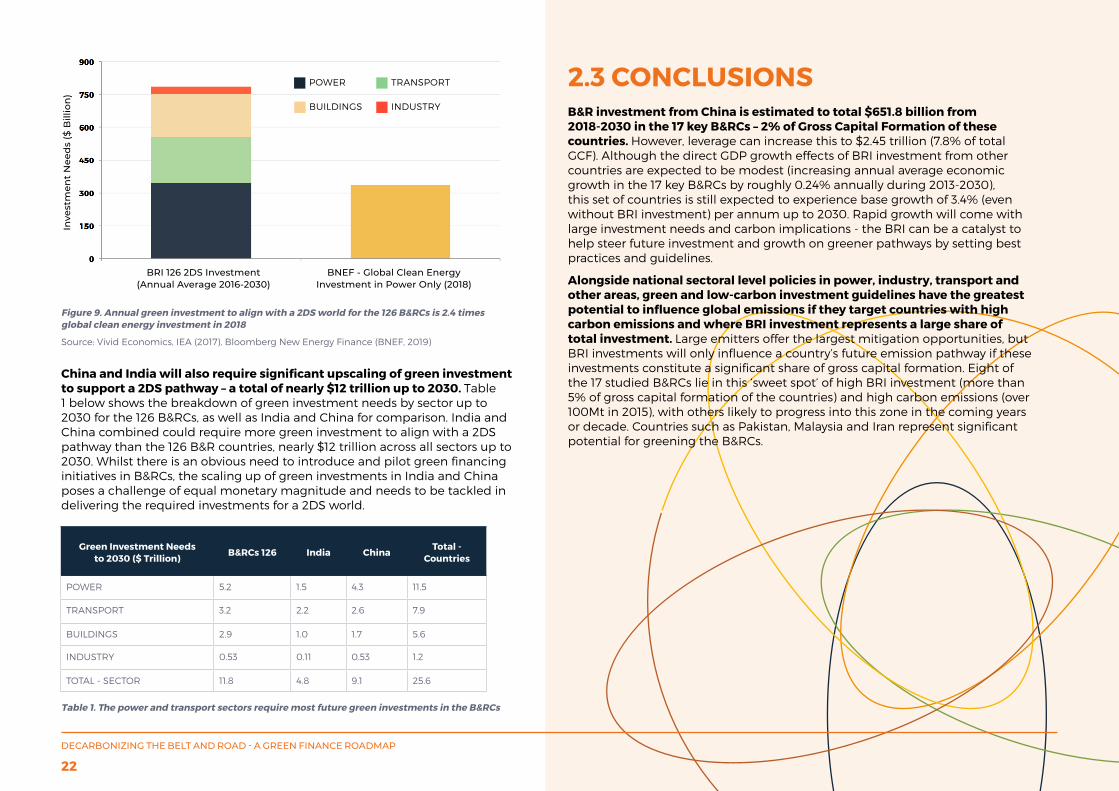
Figure 9. Annual green investment to align with a 2DS world for the 126 B&RCs is 2.4 times global clean energy investment in 2018
Source: Vivid Economics, IEA (2017), Bloomberg New Energy Finance (BNEF, 2019)
China and India will also require significant upscaling of green investment to support a 2DS pathway – a total of nearly $12 trillion up to 2030. Table 1 below shows the breakdown of green investment needs by sector up to 2030 for the 126 B&RCs, as well as India and China for comparison. India and China combined could require more green investment to align with a 2DS pathway than the 126 B&R countries, nearly $12 trillion across all sectors up to 2030. Whilst there is an obvious need to introduce and pilot green financing initiatives in B&RCs, the scaling up of green investments in India and China poses a challenge of equal monetary magnitude and needs to be tackled in delivering the required investments for a 2DS world.
Green Investment Needs to 2030 ($ Trillion)
B&RCs 126 India ChinaTotal -
Countries
POWER 5.2 1.5 4.3 11.5
TRANSPORT 3.2 2.2 2.6 7.9
BUILDINGS 2.9 1.0 1.7 5.6
INDUSTRY 0.53 0.11 0.53 1.2
TOTAL - SECTOR 11.8 4.8 9.1 25.6
Table 1. The power and transport sectors require most future green investments in the B&RCs
Inve
stm
ent
Nee
ds
($ B
illio
n)
BRI 126 2DS Investment (Annual Average 2016-2030)
BNEF - Global Clean Energy Investment in Power Only (2018)
POWER
BUILDINGS INDUSTRY
TRANSPORT 2.3 CONCLUSIONSB&R investment from China is estimated to total $651.8 billion from 2018-2030 in the 17 key B&RCs – 2% of Gross Capital Formation of these countries. However, leverage can increase this to $2.45 trillion (7.8% of total GCF). Although the direct GDP growth effects of BRI investment from other countries are expected to be modest (increasing annual average economic growth in the 17 key B&RCs by roughly 0.24% annually during 2013-2030), this set of countries is still expected to experience base growth of 3.4% (even without BRI investment) per annum up to 2030. Rapid growth will come with large investment needs and carbon implications - the BRI can be a catalyst to help steer future investment and growth on greener pathways by setting best practices and guidelines.
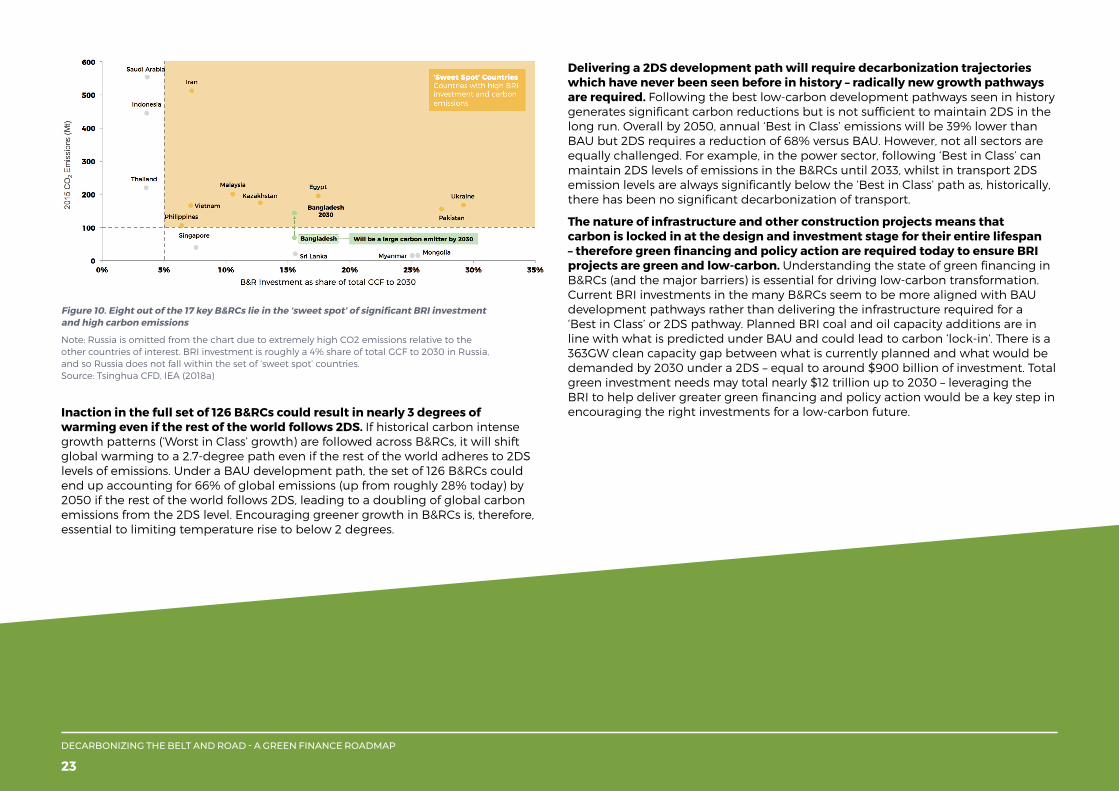
Alongside national sectoral level policies in power, industry, transport and other areas, green and low-carbon investment guidelines have the greatest potential to influence global emissions if they target countries with high carbon emissions and where BRI investment represents a large share of total investment. Large emitters offer the largest mitigation opportunities, but BRI investments will only influence a country’s future emission pathway if these investments constitute a significant share of gross capital formation. Eight of the 17 studied B&RCs lie in this ‘sweet spot’ of high BRI investment (more than 5% of gross capital formation of the countries) and high carbon emissions (over 100Mt in 2015), with others likely to progress into this zone in the coming years or decade. Countries such as Pakistan, Malaysia and Iran represent significant potential for greening the B&RCs.
DECARBONIZING THE BELT AND ROAD - A GREEN FINANCE ROADMAP
22
Inaction in the full set of 126 B&RCs could result in nearly 3 degrees of warming even if the rest of the world follows 2DS. If historical carbon intense growth patterns (‘Worst in Class’ growth) are followed across B&RCs, it will shift global warming to a 2.7-degree path even if the rest of the world adheres to 2DS levels of emissions. Under a BAU development path, the set of 126 B&RCs could end up accounting for 66% of global emissions (up from roughly 28% today) by 2050 if the rest of the world follows 2DS, leading to a doubling of global carbon emissions from the 2DS level. Encouraging greener growth in B&RCs is, therefore, essential to limiting temperature rise to below 2 degrees.
Delivering a 2DS development path will require decarbonization trajectories which have never been seen before in history – radically new growth pathways are required. Following the best low-carbon development pathways seen in history generates significant carbon reductions but is not sufficient to maintain 2DS in the long run. Overall by 2050, annual ‘Best in Class’ emissions will be 39% lower than BAU but 2DS requires a reduction of 68% versus BAU. However, not all sectors are equally challenged. For example, in the power sector, following ‘Best in Class’ can maintain 2DS levels of emissions in the B&RCs until 2033, whilst in transport 2DS emission levels are always significantly below the ‘Best in Class’ path as, historically, there has been no significant decarbonization of transport.
The nature of infrastructure and other construction projects means that carbon is locked in at the design and investment stage for their entire lifespan – therefore green financing and policy action are required today to ensure BRI projects are green and low-carbon. Understanding the state of green financing in B&RCs (and the major barriers) is essential for driving low-carbon transformation. Current BRI investments in the many B&RCs seem to be more aligned with BAU development pathways rather than delivering the infrastructure required for a ‘Best in Class’ or 2DS pathway. Planned BRI coal and oil capacity additions are in line with what is predicted under BAU and could lead to carbon ‘lock-in’. There is a 363GW clean capacity gap between what is currently planned and what would be demanded by 2030 under a 2DS – equal to around $900 billion of investment. Total green investment needs may total nearly $12 trillion up to 2030 – leveraging the BRI to help deliver greater green financing and policy action would be a key step in encouraging the right investments for a low-carbon future.
Figure 10. Eight out of the 17 key B&RCs lie in the ‘sweet spot’ of significant BRI investment and high carbon emissions
Note: Russia is omitted from the chart due to extremely high CO2 emissions relative to the other countries of interest. BRI investment is roughly a 4% share of total GCF to 2030 in Russia, and so Russia does not fall within the set of ‘sweet spot’ countries.Source: Tsinghua CFD, IEA (2018a)
DECARBONIZING THE BELT AND ROAD - A GREEN FINANCE ROADMAP
23
3 Green Finance in the B&RCsAs of February 2017, 132 countries representing 82% of global emissions had ratified the Paris Agreement.18 Among the 126 countries that have signed bilateral MOUs with China in recognizing the Belt and Road Initiative (BRI) as of April 2019, 106 have indicated country-level National Determined Contributions (NDCs) targeting aggressive steps in climate action.19 Many of the B&RCs have also announced their sustainable development strategies in association with respective NDC targets.
As pointed out in the previous sections, mobilizing green and low-carbon investment will be critical to ensure B&RCs embark on a growth trajectory that will be aligned to the requirement of the Paris Agreement. Just in the area of clean energy, we estimate that USD1.1trillion will be needed by 2030 for the 17 key B&RCs. The total green investment demand for 126 B&RCs, in sectors including energy, transport, buildings, and manufacturing, could amount to USD 0.785 trillion per year.
However, most B&RCs are middle and low-income developing countries, and their average per capita GDP level is only about USD 4,000 in 2017, about half of China’s level and about 1/10 of OECD average (USD38 200). These B&RCs have very limited fiscal capacity to invest or subsidize green projects. Most of the green investments in these countries will have to be financed by private capital. Therefore, their financial systems – consisting of banks, securities firms, institutional investors, and securities exchanges – will need to play a key role in mobilizing such green capital.
Through a stock-taking exercise, the authors found that BRI mobilization of sufficient financing toward the green and sustainable sectors remains one of the most critical missing links in moving from climate commitment to implementation. This chapter consists of four sections. Section 1 introduces the momentum in green finance promotion through multilateral collaborative frameworks, such as the G20, SBN, NGFS, etc. Section 2 takes stock of national strategies and policies on green finance in B&RCs. Section 3 looks at the preparedness of green financial market products and mechanisms, including green loans, green bonds, green insurance and others. Section 4 summarizes challenges and barriers for B&RCs to develop and implement local green finance policies and markets.
3.1 MOMENTUM CREATED THROUGH MULTILATERAL COLLABORATIVE FRAMEWORKSIn addition to the mandates built around the UN SDGs and the Paris Agreement, the G20, international organizations (IOs) and other multilateral initiatives also play a pivotal role in forming global and regional consensus on addressing climate change and promoting green and sustainable finance.
The majority of the international initiatives and frameworks fall into two categories - some frameworks are organized by the G20 or international bodies and are represented by state authorities such as the Ministry of Finance, central banks, financial regulators and/or other relevant governmental agencies. For example, during the Chinese presidency of the G20 in 2016, the G20 Green Finance Study Group (GFSG) was launched, and the seven options on “scaling up green finance” developed by GFSG were adopted by the G20 Leaders’ Communique. In 2017 and 2018, this study group (which was renamed to the Sustainable Finance Study Group) developed a few more recommendations on encouraging environmental risk analysis by financial firms, the securitization of sustainable assets, developing sustainable PE and VC funds, etc. These G20 recommendations have inspired many countries to develop their domestic green and sustainable finance roadmaps as well as product innovations. Partly as a spilloverspill over of the G20 work, at the end of 2017, eight countries’ central banks and financial supervisors (including those from France, China, the UK, Germany, Netherlands, Mexico, Singapore, and Sweden) launched the Central Banks and Supervisors’ Network for Greening the Financial System (NGFS). This has now expanded to cover over 40 members representing more than 30 countries. The NGFS aims to develop specific recommendations for central banks and regulators on scaling up green finance and managing environmental and climate risks. However, only 14 institutions (highlighted) from 12 B&RCs (excluding China) are represented on the NGFS, representing 30% of the membership countries as of April 2019.
Most of the green investments in these countries will have to be financed by private capital.
DECARBONIZING THE BELT AND ROAD - A GREEN FINANCE ROADMAP
24
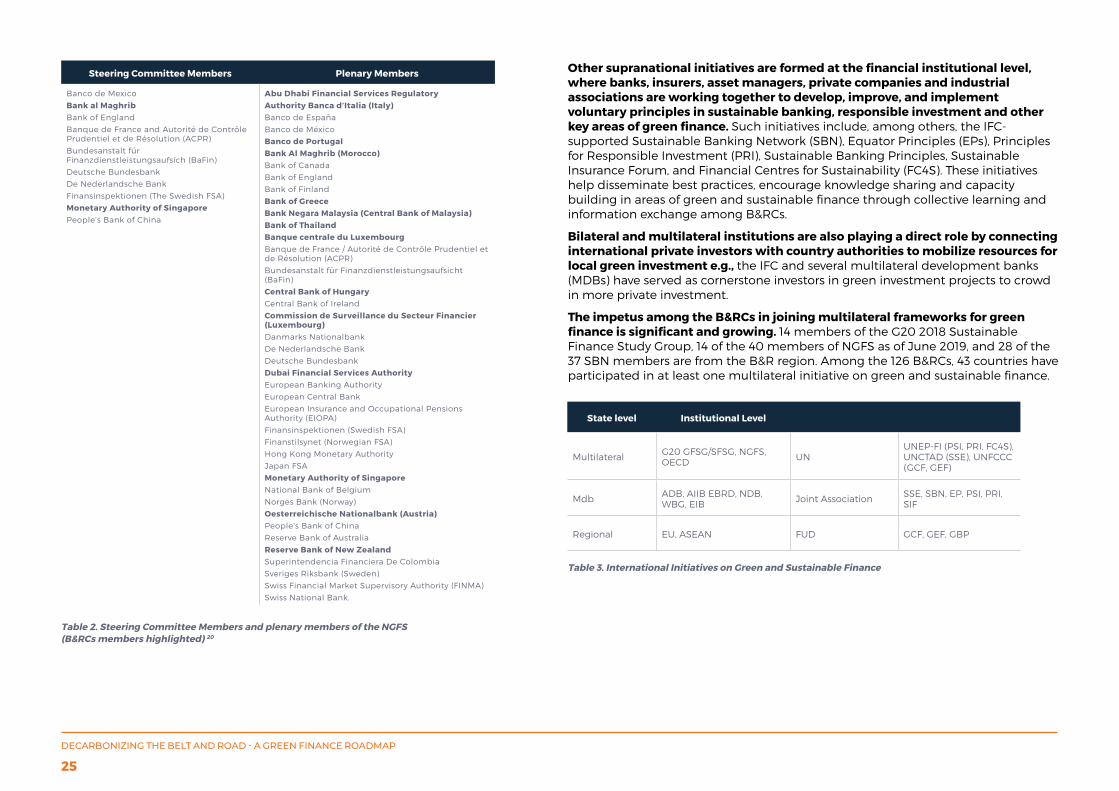
Other supranational initiatives are formed at the financial institutional level, where banks, insurers, asset managers, private companies and industrial associations are working together to develop, improve, and implement voluntary principles in sustainable banking, responsible investment and other key areas of green finance. Such initiatives include, among others, the IFC-supported Sustainable Banking Network (SBN), Equator Principles (EPs), Principles for Responsible Investment (PRI), Sustainable Banking Principles, Sustainable Insurance Forum, and Financial Centres for Sustainability (FC4S). These initiatives help disseminate best practices, encourage knowledge sharing and capacity building in areas of green and sustainable finance through collective learning and information exchange among B&RCs.
Bilateral and multilateral institutions are also playing a direct role by connecting international private investors with country authorities to mobilize resources for local green investment e.g., the IFC and several multilateral development banks (MDBs) have served as cornerstone investors in green investment projects to crowd in more private investment.
The impetus among the B&RCs in joining multilateral frameworks for green finance is significant and growing. 14 members of the G20 2018 Sustainable Finance Study Group, 14 of the 40 members of NGFS as of June 2019, and 28 of the 37 SBN members are from the B&R region. Among the 126 B&RCs, 43 countries have participated in at least one multilateral initiative on green and sustainable finance.
Steering Committee Members Plenary Members
Banco de Mexico
Bank al MaghribBank of England
Banque de France and Autorité de Contrôle Prudentiel et de Résolution (ACPR)
Bundesanstalt für Finanzdienstleistungsaufsich (BaFin)
Deutsche Bundesbank
De Nederlandsche Bank
Finansinspektionen (The Swedish FSA)
Monetary Authority of SingaporePeople’s Bank of China
Abu Dhabi Financial Services RegulatoryAuthority Banca d’Italia (Italy)Banco de España
Banco de México
Banco de PortugalBank Al Maghrib (Morocco)Bank of Canada
Bank of England
Bank of Finland
Bank of GreeceBank Negara Malaysia (Central Bank of Malaysia)Bank of ThailandBanque centrale du LuxembourgBanque de France / Autorité de Contrôle Prudentiel et de Résolution (ACPR)
Bundesanstalt für Finanzdienstleistungsaufsicht (BaFin)
Central Bank of HungaryCentral Bank of Ireland
Commission de Surveillance du Secteur Financier (Luxembourg)Danmarks Nationalbank
De Nederlandsche Bank
Deutsche Bundesbank
Dubai Financial Services AuthorityEuropean Banking Authority
European Central Bank
European Insurance and Occupational Pensions Authority (EIOPA)
Finansinspektionen (Swedish FSA)
Finanstilsynet (Norwegian FSA)
Hong Kong Monetary Authority
Japan FSA
Monetary Authority of SingaporeNational Bank of Belgium
Norges Bank (Norway)
Oesterreichische Nationalbank (Austria)People’s Bank of China
Reserve Bank of Australia
Reserve Bank of New ZealandSuperintendencia Financiera De Colombia
Sveriges Riksbank (Sweden)
Swiss Financial Market Supervisory Authority (FINMA)
Swiss National Bank.
Table 3. International Initiatives on Green and Sustainable Finance
State level Institutional Level
Multilateral G20 GFSG/SFSG, NGFS, OECD UN
UNEP-FI (PSI, PRI, FC4S), UNCTAD (SSE), UNFCCC (GCF, GEF)
Mdb ADB, AIIB EBRD, NDB, WBG, EIB Joint Association SSE, SBN, EP, PSI, PRI,
SIF
Regional EU, ASEAN FUD GCF, GEF, GBP
Table 2. Steering Committee Members and plenary members of the NGFS (B&RCs members highlighted) 20
DECARBONIZING THE BELT AND ROAD - A GREEN FINANCE ROADMAP
25
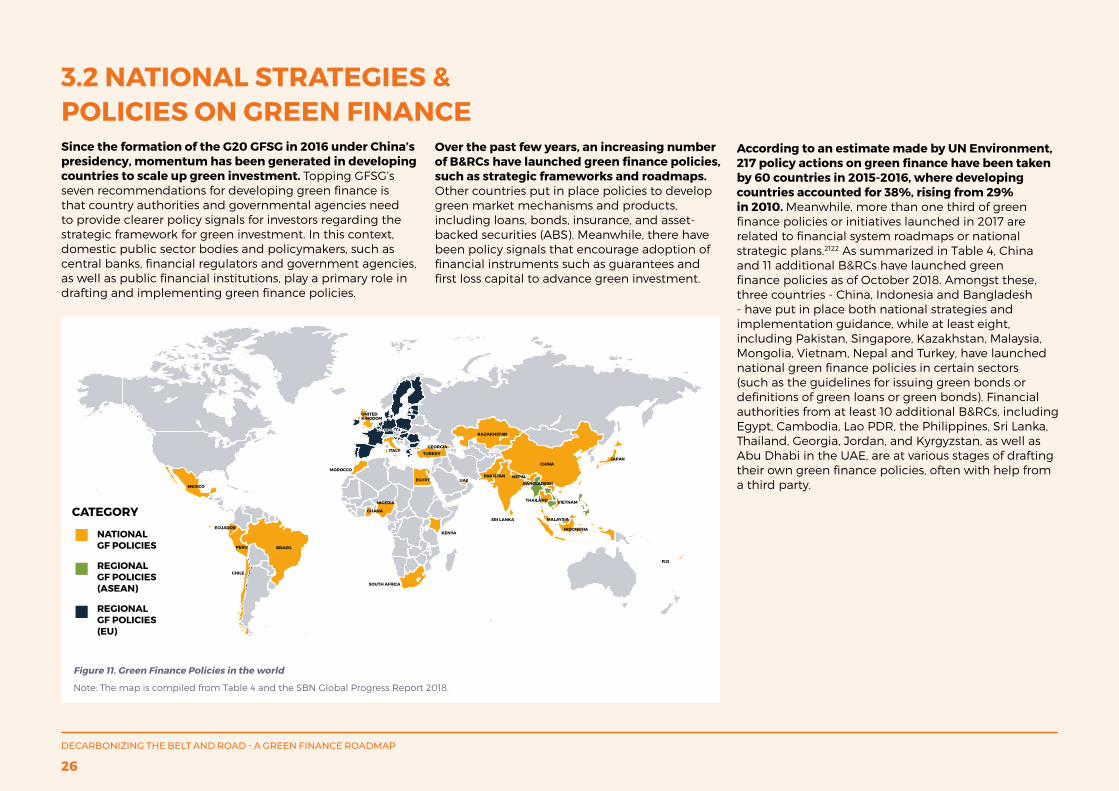
3.2 NATIONAL STRATEGIES & POLICIES ON GREEN FINANCE
SOUTH AFRICA
KENYA
EGYPT
NIGERIA
GHANA
MOROCCO
LUXEMBOURG
ITALY
UNITEDKINGDOM
TURKEY
GEORGIA
SRI LANKA
CHINA
NEPAL
BANGLADESH
PAKISTAN
KAZAKHSTAN
UAE
THAILAND VIETNAM
INDONESIA
JAPAN
MALAYSIA
FIJI
CHILE
PERU BRAZIL
ECUADOR
MEXICO
CATEGORY
NATIONAL GF POLICIES
REGIONAL GF POLICIES
(ASEAN)
REGIONAL
GF POLICIES(EU)
According to an estimate made by UN Environment, 217 policy actions on green finance have been taken by 60 countries in 2015-2016, where developing countries accounted for 38%, rising from 29% in 2010. Meanwhile, more than one third of green finance policies or initiatives launched in 2017 are related to financial system roadmaps or national strategic plans.2122 As summarized in Table 4, China and 11 additional B&RCs have launched green finance policies as of October 2018. Amongst these, three countries - China, Indonesia and Bangladesh - have put in place both national strategies and implementation guidance, while at least eight, including Pakistan, Singapore, Kazakhstan, Malaysia, Mongolia, Vietnam, Nepal and Turkey, have launched national green finance policies in certain sectors (such as the guidelines for issuing green bonds or definitions of green loans or green bonds). Financial authorities from at least 10 additional B&RCs, including Egypt, Cambodia, Lao PDR, the Philippines, Sri Lanka, Thailand, Georgia, Jordan, and Kyrgyzstan, as well as Abu Dhabi in the UAE, are at various stages of drafting their own green finance policies, often with help from a third party.
Since the formation of the G20 GFSG in 2016 under China’s presidency, momentum has been generated in developing countries to scale up green investment. Topping GFSG’s seven recommendations for developing green finance is that country authorities and governmental agencies need to provide clearer policy signals for investors regarding the strategic framework for green investment. In this context, domestic public sector bodies and policymakers, such as central banks, financial regulators and government agencies, as well as public financial institutions, play a primary role in drafting and implementing green finance policies.
Over the past few years, an increasing number of B&RCs have launched green finance policies, such as strategic frameworks and roadmaps. Other countries put in place policies to develop green market mechanisms and products, including loans, bonds, insurance, and asset-backed securities (ABS). Meanwhile, there have been policy signals that encourage adoption of financial instruments such as guarantees and first loss capital to advance green investment.
Figure 11. Green Finance Policies in the world
Note: The map is compiled from Table 4 and the SBN Global Progress Report 2018.
DECARBONIZING THE BELT AND ROAD - A GREEN FINANCE ROADMAP
26
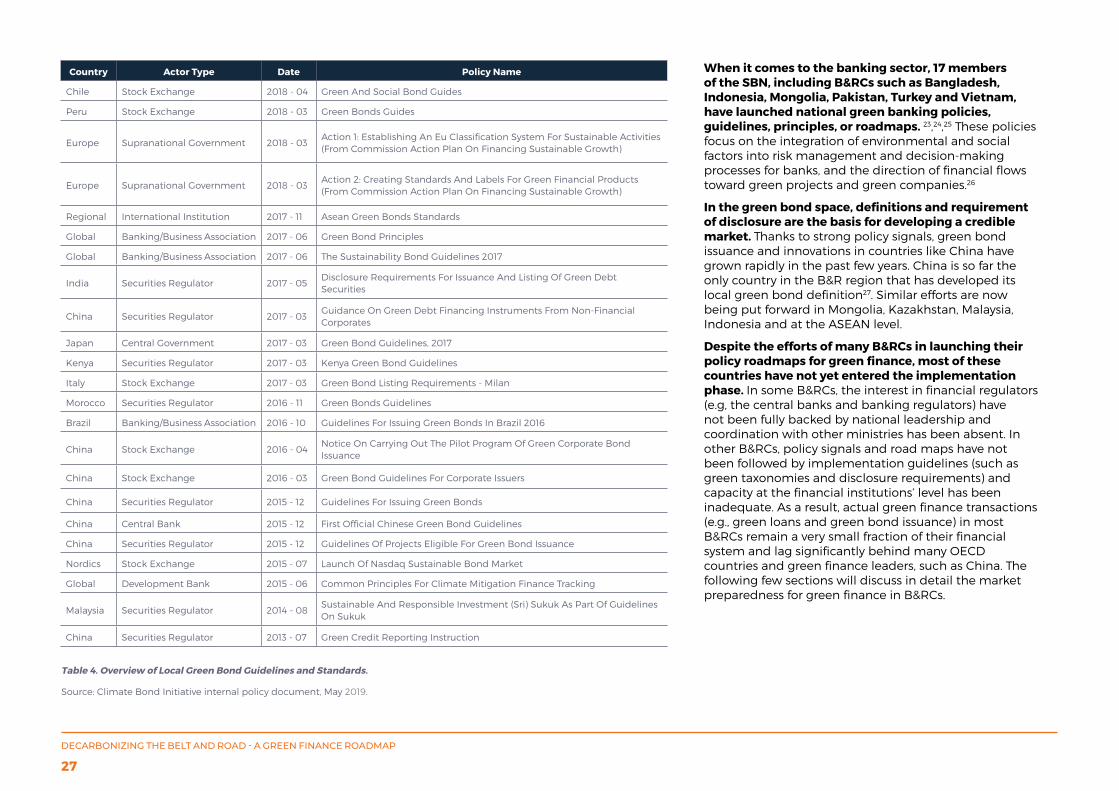
When it comes to the banking sector, 17 members of the SBN, including B&RCs such as Bangladesh, Indonesia, Mongolia, Pakistan, Turkey and Vietnam, have launched national green banking policies, guidelines, principles, or roadmaps. 23,24,25 These policies focus on the integration of environmental and social factors into risk management and decision-making processes for banks, and the direction of financial flows toward green projects and green companies.26
In the green bond space, definitions and requirement of disclosure are the basis for developing a credible market. Thanks to strong policy signals, green bond issuance and innovations in countries like China have grown rapidly in the past few years. China is so far the only country in the B&R region that has developed its local green bond definition27. Similar efforts are now being put forward in Mongolia, Kazakhstan, Malaysia, Indonesia and at the ASEAN level.
Despite the efforts of many B&RCs in launching their policy roadmaps for green finance, most of these countries have not yet entered the implementation phase. In some B&RCs, the interest in financial regulators (e.g, the central banks and banking regulators) have not been fully backed by national leadership and coordination with other ministries has been absent. In other B&RCs, policy signals and road maps have not been followed by implementation guidelines (such as green taxonomies and disclosure requirements) and capacity at the financial institutions’ level has been inadequate. As a result, actual green finance transactions (e.g., green loans and green bond issuance) in most B&RCs remain a very small fraction of their financial system and lag significantly behind many OECD countries and green finance leaders, such as China. The following few sections will discuss in detail the market preparedness for green finance in B&RCs.
Table 4. Overview of Local Green Bond Guidelines and Standards.
Source: Climate Bond Initiative internal policy document, May 2019.
Country Actor Type Date Policy Name
Chile Stock Exchange 2018 - 04 Green And Social Bond Guides
Peru Stock Exchange 2018 - 03 Green Bonds Guides
Europe Supranational Government 2018 - 03Action 1: Establishing An Eu Classification System For Sustainable Activities (From Commission Action Plan On Financing Sustainable Growth)
Europe Supranational Government 2018 - 03Action 2: Creating Standards And Labels For Green Financial Products (From Commission Action Plan On Financing Sustainable Growth)
Regional International Institution 2017 - 11 Asean Green Bonds Standards
Global Banking/Business Association 2017 - 06 Green Bond Principles
Global Banking/Business Association 2017 - 06 The Sustainability Bond Guidelines 2017
India Securities Regulator 2017 - 05Disclosure Requirements For Issuance And Listing Of Green Debt Securities
China Securities Regulator 2017 - 03Guidance On Green Debt Financing Instruments From Non-Financial Corporates
Japan Central Government 2017 - 03 Green Bond Guidelines, 2017
Kenya Securities Regulator 2017 - 03 Kenya Green Bond Guidelines
Italy Stock Exchange 2017 - 03 Green Bond Listing Requirements - Milan
Morocco Securities Regulator 2016 - 11 Green Bonds Guidelines
Brazil Banking/Business Association 2016 - 10 Guidelines For Issuing Green Bonds In Brazil 2016
China Stock Exchange 2016 - 04Notice On Carrying Out The Pilot Program Of Green Corporate Bond Issuance
China Stock Exchange 2016 - 03 Green Bond Guidelines For Corporate Issuers
China Securities Regulator 2015 - 12 Guidelines For Issuing Green Bonds
China Central Bank 2015 - 12 First Official Chinese Green Bond Guidelines
China Securities Regulator 2015 - 12 Guidelines Of Projects Eligible For Green Bond Issuance
Nordics Stock Exchange 2015 - 07 Launch Of Nasdaq Sustainable Bond Market
Global Development Bank 2015 - 06 Common Principles For Climate Mitigation Finance Tracking
Malaysia Securities Regulator 2014 - 08Sustainable And Responsible Investment (Sri) Sukuk As Part Of Guidelines On Sukuk
China Securities Regulator 2013 - 07 Green Credit Reporting Instruction
DECARBONIZING THE BELT AND ROAD - A GREEN FINANCE ROADMAP
27
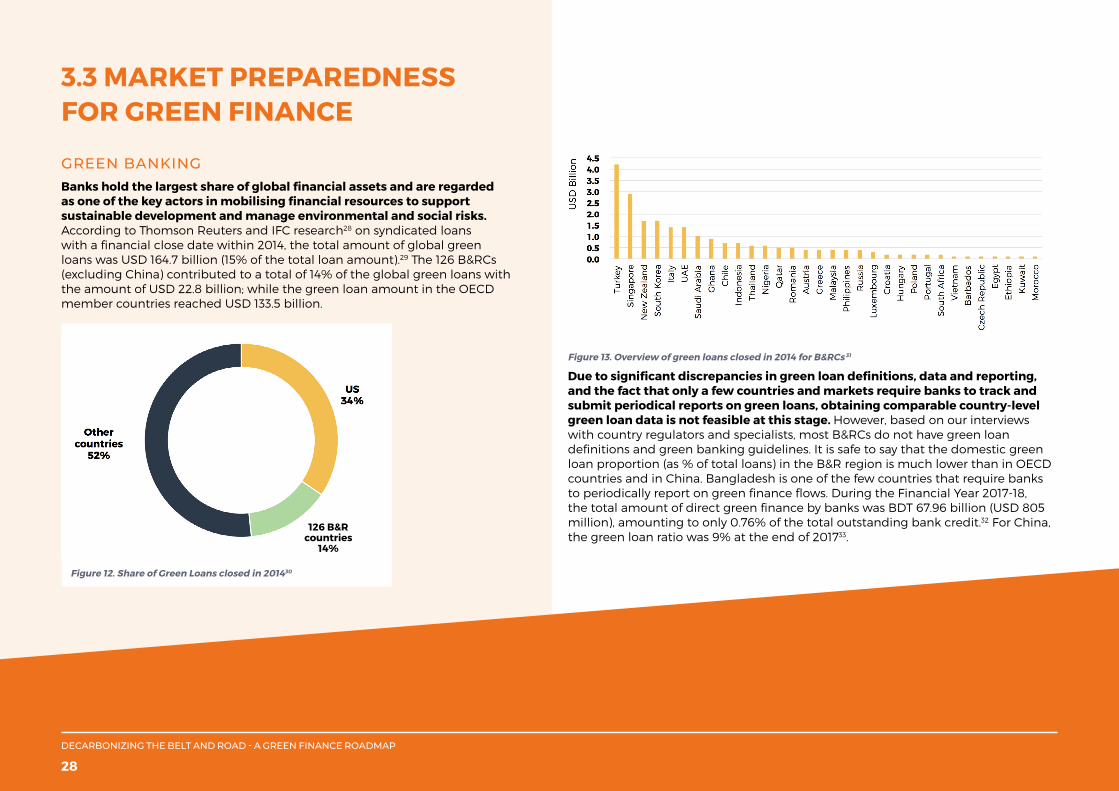
3.3 MARKET PREPAREDNESS FOR GREEN FINANCE
GREEN BANKINGBanks hold the largest share of global financial assets and are regarded as one of the key actors in mobilising financial resources to support sustainable development and manage environmental and social risks. According to Thomson Reuters and IFC research28 on syndicated loans with a financial close date within 2014, the total amount of global green loans was USD 164.7 billion (15% of the total loan amount).29 The 126 B&RCs (excluding China) contributed to a total of 14% of the global green loans with the amount of USD 22.8 billion; while the green loan amount in the OECD member countries reached USD 133.5 billion.
Figure 13. Overview of green loans closed in 2014 for B&RCs 31
Due to significant discrepancies in green loan definitions, data and reporting, and the fact that only a few countries and markets require banks to track and submit periodical reports on green loans, obtaining comparable country-level green loan data is not feasible at this stage. However, based on our interviews with country regulators and specialists, most B&RCs do not have green loan definitions and green banking guidelines. It is safe to say that the domestic green loan proportion (as % of total loans) in the B&R region is much lower than in OECD countries and in China. Bangladesh is one of the few countries that require banks to periodically report on green finance flows. During the Financial Year 2017-18, the total amount of direct green finance by banks was BDT 67.96 billion (USD 805 million), amounting to only 0.76% of the total outstanding bank credit.32 For China, the green loan ratio was 9% at the end of 201733.
Figure 12. Share of Green Loans closed in 201430
126 B&R countries
14%
DECARBONIZING THE BELT AND ROAD - A GREEN FINANCE ROADMAP
28
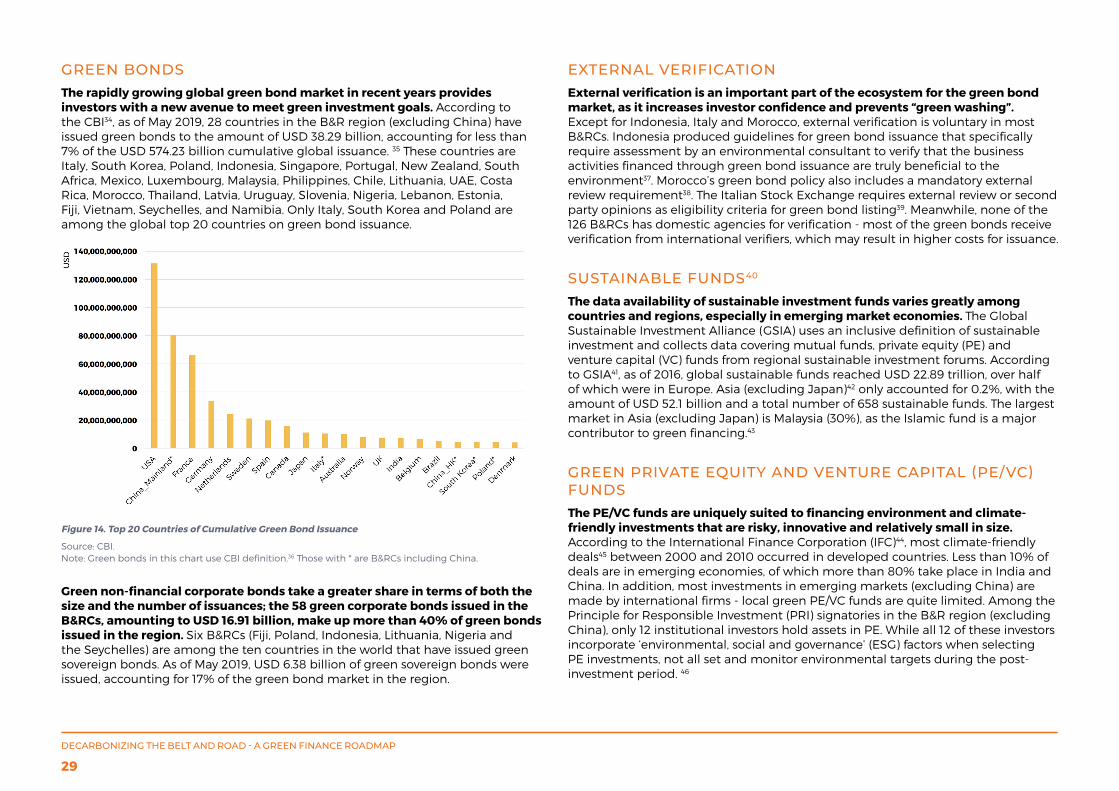
GREEN BONDSThe rapidly growing global green bond market in recent years provides investors with a new avenue to meet green investment goals. According to the CBI34, as of May 2019, 28 countries in the B&R region (excluding China) have issued green bonds to the amount of USD 38.29 billion, accounting for less than 7% of the USD 574.23 billion cumulative global issuance. 35 These countries are Italy, South Korea, Poland, Indonesia, Singapore, Portugal, New Zealand, South Africa, Mexico, Luxembourg, Malaysia, Philippines, Chile, Lithuania, UAE, Costa Rica, Morocco, Thailand, Latvia, Uruguay, Slovenia, Nigeria, Lebanon, Estonia, Fiji, Vietnam, Seychelles, and Namibia. Only Italy, South Korea and Poland are among the global top 20 countries on green bond issuance.
Figure 14. Top 20 Countries of Cumulative Green Bond Issuance
Source: CBI.Note: Green bonds in this chart use CBI definition.36 Those with * are B&RCs including China.
Green non-financial corporate bonds take a greater share in terms of both the size and the number of issuances; the 58 green corporate bonds issued in the B&RCs, amounting to USD 16.91 billion, make up more than 40% of green bonds issued in the region. Six B&RCs (Fiji, Poland, Indonesia, Lithuania, Nigeria and the Seychelles) are among the ten countries in the world that have issued green sovereign bonds. As of May 2019, USD 6.38 billion of green sovereign bonds were issued, accounting for 17% of the green bond market in the region.
EXTERNAL VERIFICATIONExternal verification is an important part of the ecosystem for the green bond market, as it increases investor confidence and prevents “green washing”. Except for Indonesia, Italy and Morocco, external verification is voluntary in most B&RCs. Indonesia produced guidelines for green bond issuance that specifically require assessment by an environmental consultant to verify that the business activities financed through green bond issuance are truly beneficial to the environment37. Morocco’s green bond policy also includes a mandatory external review requirement38. The Italian Stock Exchange requires external review or second party opinions as eligibility criteria for green bond listing39. Meanwhile, none of the 126 B&RCs has domestic agencies for verification - most of the green bonds receive verification from international verifiers, which may result in higher costs for issuance.
SUSTAINABLE FUNDS40
The data availability of sustainable investment funds varies greatly among countries and regions, especially in emerging market economies. The Global Sustainable Investment Alliance (GSIA) uses an inclusive definition of sustainable investment and collects data covering mutual funds, private equity (PE) and venture capital (VC) funds from regional sustainable investment forums. According to GSIA41, as of 2016, global sustainable funds reached USD 22.89 trillion, over half of which were in Europe. Asia (excluding Japan)42 only accounted for 0.2%, with the amount of USD 52.1 billion and a total number of 658 sustainable funds. The largest market in Asia (excluding Japan) is Malaysia (30%), as the Islamic fund is a major contributor to green financing.43
GREEN PRIVATE EQUITY AND VENTURE CAPITAL (PE/VC) FUNDSThe PE/VC funds are uniquely suited to financing environment and climate-friendly investments that are risky, innovative and relatively small in size. According to the International Finance Corporation (IFC)44, most climate-friendly deals45 between 2000 and 2010 occurred in developed countries. Less than 10% of deals are in emerging economies, of which more than 80% take place in India and China. In addition, most investments in emerging markets (excluding China) are made by international firms - local green PE/VC funds are quite limited. Among the Principle for Responsible Investment (PRI) signatories in the B&R region (excluding China), only 12 institutional investors hold assets in PE. While all 12 of these investors incorporate ‘environmental, social and governance’ (ESG) factors when selecting PE investments, not all set and monitor environmental targets during the post-investment period. 46
DECARBONIZING THE BELT AND ROAD - A GREEN FINANCE ROADMAP
29
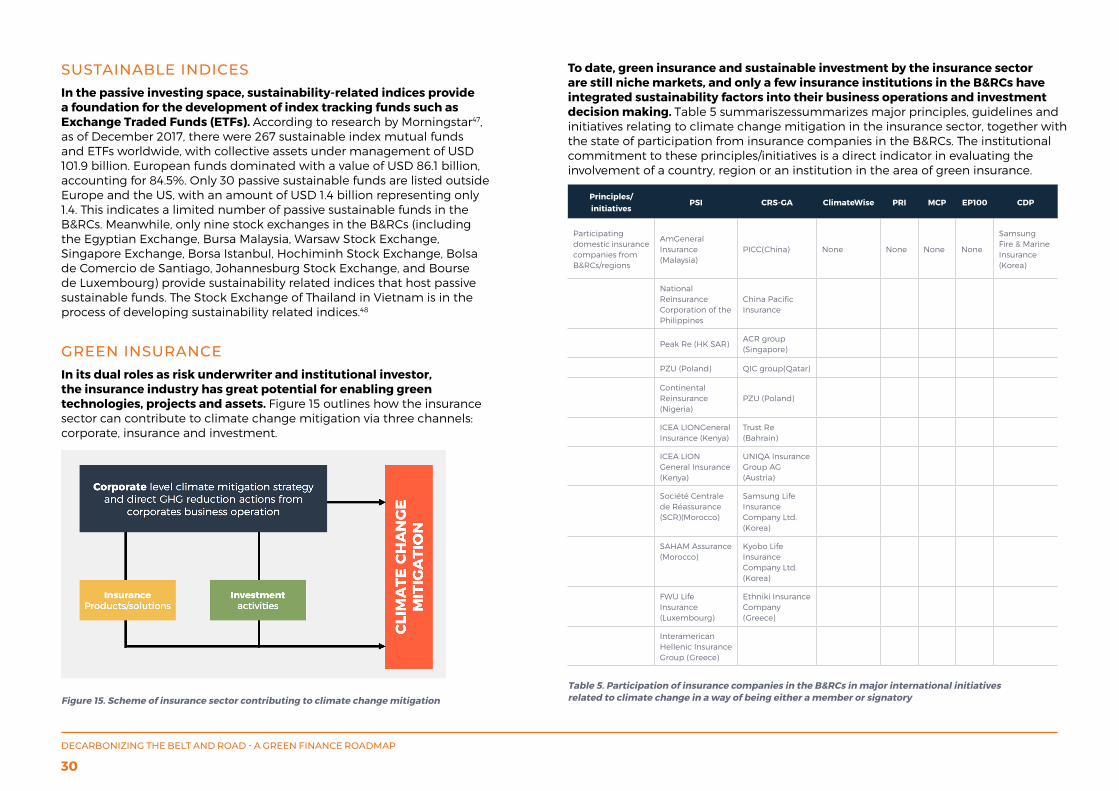
SUSTAINABLE INDICESIn the passive investing space, sustainability-related indices provide a foundation for the development of index tracking funds such as Exchange Traded Funds (ETFs). According to research by Morningstar47, as of December 2017, there were 267 sustainable index mutual funds and ETFs worldwide, with collective assets under management of USD 101.9 billion. European funds dominated with a value of USD 86.1 billion, accounting for 84.5%. Only 30 passive sustainable funds are listed outside Europe and the US, with an amount of USD 1.4 billion representing only 1.4. This indicates a limited number of passive sustainable funds in the B&RCs. Meanwhile, only nine stock exchanges in the B&RCs (including the Egyptian Exchange, Bursa Malaysia, Warsaw Stock Exchange, Singapore Exchange, Borsa Istanbul, Hochiminh Stock Exchange, Bolsa de Comercio de Santiago, Johannesburg Stock Exchange, and Bourse de Luxembourg) provide sustainability related indices that host passive sustainable funds. The Stock Exchange of Thailand in Vietnam is in the process of developing sustainability related indices.48
GREEN INSURANCEIn its dual roles as risk underwriter and institutional investor, the insurance industry has great potential for enabling green technologies, projects and assets. Figure 15 outlines how the insurance sector can contribute to climate change mitigation via three channels: corporate, insurance and investment.
To date, green insurance and sustainable investment by the insurance sector are still niche markets, and only a few insurance institutions in the B&RCs have integrated sustainability factors into their business operations and investment decision making. Table 5 summariszessummarizes major principles, guidelines and initiatives relating to climate change mitigation in the insurance sector, together with the state of participation from insurance companies in the B&RCs. The institutional commitment to these principles/initiatives is a direct indicator in evaluating the involvement of a country, region or an institution in the area of green insurance.
Figure 15. Scheme of insurance sector contributing to climate change mitigation
Principles/ initiatives
PSI CRS-GA ClimateWise PRI MCP EP100 CDP
Participating domestic insurance companies from B&RCs/regions
AmGeneral Insurance (Malaysia)
PICC(China) None None None None
Samsung Fire & Marine Insurance (Korea)
National Reinsurance Corporation of the Philippines
China Pacific Insurance
Peak Re (HK SAR)ACR group (Singapore)
PZU (Poland) QIC group(Qatar)
Continental Reinsurance (Nigeria)
PZU (Poland)
ICEA LIONGeneral Insurance (Kenya)
Trust Re (Bahrain)
ICEA LION General Insurance (Kenya)
UNIQA Insurance Group AG (Austria)
Société Centrale de Réassurance (SCR)(Morocco)
Samsung Life Insurance Company Ltd. (Korea)
SAHAM Assurance (Morocco)
Kyobo Life Insurance Company Ltd.(Korea)
FWU Life Insurance (Luxembourg)
Ethniki Insurance Company (Greece)
Interamerican Hellenic Insurance Group (Greece)
Table 5. Participation of insurance companies in the B&RCs in major international initiatives related to climate change in a way of being either a member or signatory
DECARBONIZING THE BELT AND ROAD - A GREEN FINANCE ROADMAP
30
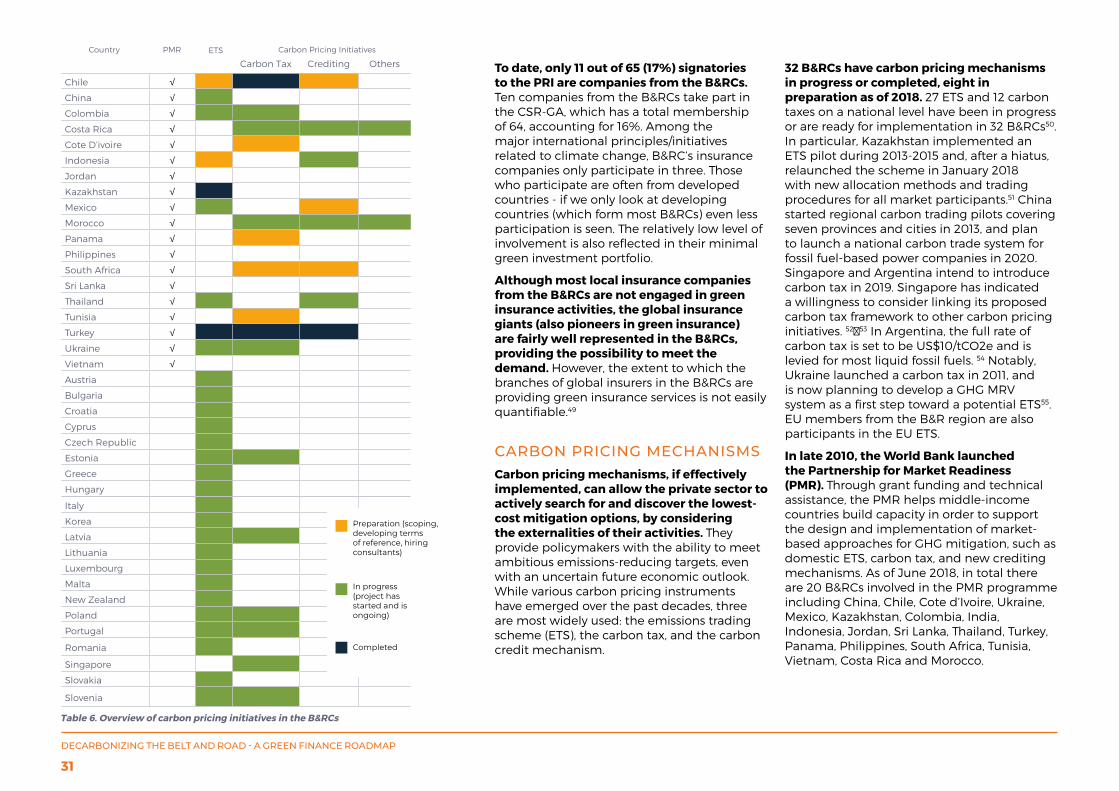
To date, only 11 out of 65 (17%) signatories to the PRI are companies from the B&RCs. Ten companies from the B&RCs take part in the CSR-GA, which has a total membership of 64, accounting for 16%. Among the major international principles/initiatives related to climate change, B&RC’s insurance companies only participate in three. Those who participate are often from developed countries - if we only look at developing countries (which form most B&RCs) even less participation is seen. The relatively low level of involvement is also reflected in their minimal green investment portfolio.
Although most local insurance companies from the B&RCs are not engaged in green insurance activities, the global insurance giants (also pioneers in green insurance) are fairly well represented in the B&RCs, providing the possibility to meet the demand. However, the extent to which the branches of global insurers in the B&RCs are providing green insurance services is not easily quantifiable.49
CARBON PRICING MECHANISMS Carbon pricing mechanisms, if effectively implemented, can allow the private sector to actively search for and discover the lowest-cost mitigation options, by considering the externalities of their activities. They provide policymakers with the ability to meet ambitious emissions-reducing targets, even with an uncertain future economic outlook. While various carbon pricing instruments have emerged over the past decades, three are most widely used: the emissions trading scheme (ETS), the carbon tax, and the carbon credit mechanism.
Carbon Tax Crediting Others
Chile √
China √
Colombia √
Costa Rica √
Cote D’ivoire √
Indonesia √
Jordan √
Kazakhstan √
Mexico √
Morocco √
Panama √
Philippines √
South Africa √
Sri Lanka √
Thailand √
Tunisia √
Turkey √
Ukraine √
Vietnam √
Austria
Bulgaria
Croatia
Cyprus
Czech Republic
Estonia
Greece
Hungary
Italy
Korea
Latvia
Lithuania
Luxembourg
Malta
New Zealand
Poland
Portugal
Romania
Singapore
Slovakia
Slovenia
Carbon Pricing InitiativesPMRCountry ETS
Table 6. Overview of carbon pricing initiatives in the B&RCs
32 B&RCs have carbon pricing mechanisms in progress or completed, eight in preparation as of 2018. 27 ETS and 12 carbon taxes on a national level have been in progress or are ready for implementation in 32 B&RCs50. In particular, Kazakhstan implemented an ETS pilot during 2013-2015 and, after a hiatus, relaunched the scheme in January 2018 with new allocation methods and trading procedures for all market participants.51 China started regional carbon trading pilots covering seven provinces and cities in 2013, and plan to launch a national carbon trade system for fossil fuel-based power companies in 2020. Singapore and Argentina intend to introduce carbon tax in 2019. Singapore has indicated a willingness to consider linking its proposed carbon tax framework to other carbon pricing initiatives. 52,53 In Argentina, the full rate of carbon tax is set to be US$10/tCO2e and is levied for most liquid fossil fuels. 54 Notably, Ukraine launched a carbon tax in 2011, and is now planning to develop a GHG MRV system as a first step toward a potential ETS55. EU members from the B&R region are also participants in the EU ETS.
In late 2010, the World Bank launched the Partnership for Market Readiness (PMR). Through grant funding and technical assistance, the PMR helps middle-income countries build capacity in order to support the design and implementation of market-based approaches for GHG mitigation, such as domestic ETS, carbon tax, and new crediting mechanisms. As of June 2018, in total there are 20 B&RCs involved in the PMR programme including China, Chile, Cote d’Ivoire, Ukraine, Mexico, Kazakhstan, Colombia, India, Indonesia, Jordan, Sri Lanka, Thailand, Turkey, Panama, Philippines, South Africa, Tunisia, Vietnam, Costa Rica and Morocco.
Preparation (scoping, developing terms of reference, hiring consultants)
In progress (project has started and is ongoing)
Completed
DECARBONIZING THE BELT AND ROAD - A GREEN FINANCE ROADMAP
31
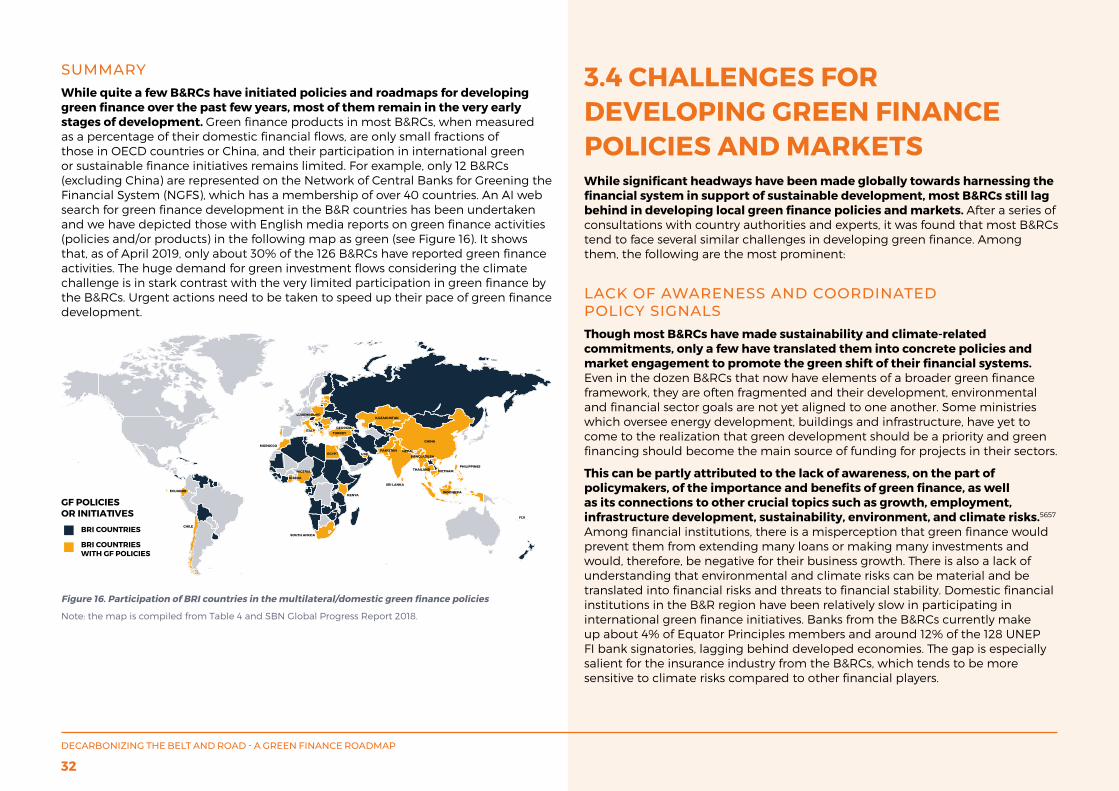
SUMMARYWhile quite a few B&RCs have initiated policies and roadmaps for developing green finance over the past few years, most of them remain in the very early stages of development. Green finance products in most B&RCs, when measured as a percentage of their domestic financial flows, are only small fractions of those in OECD countries or China, and their participation in international green or sustainable finance initiatives remains limited. For example, only 12 B&RCs (excluding China) are represented on the Network of Central Banks for Greening the Financial System (NGFS), which has a membership of over 40 countries. An AI web search for green finance development in the B&R countries has been undertaken and we have depicted those with English media reports on green finance activities (policies and/or products) in the following map as green (see Figure 16). It shows that, as of April 2019, only about 30% of the 126 B&RCs have reported green finance activities. The huge demand for green investment flows considering the climate challenge is in stark contrast with the very limited participation in green finance by the B&RCs. Urgent actions need to be taken to speed up their pace of green finance development.
Figure 16. Participation of BRI countries in the multilateral/domestic green finance policies
Note: the map is compiled from Table 4 and SBN Global Progress Report 2018.
3.4 CHALLENGES FOR DEVELOPING GREEN FINANCE POLICIES AND MARKETSWhile significant headways have been made globally towards harnessing the financial system in support of sustainable development, most B&RCs still lag behind in developing local green finance policies and markets. After a series of consultations with country authorities and experts, it was found that most B&RCs tend to face several similar challenges in developing green finance. Among them, the following are the most prominent:
LACK OF AWARENESS AND COORDINATED POLICY SIGNALSThough most B&RCs have made sustainability and climate-related commitments, only a few have translated them into concrete policies and market engagement to promote the green shift of their financial systems. Even in the dozen B&RCs that now have elements of a broader green finance framework, they are often fragmented and their development, environmental and financial sector goals are not yet aligned to one another. Some ministries which oversee energy development, buildings and infrastructure, have yet to come to the realization that green development should be a priority and green financing should become the main source of funding for projects in their sectors.
This can be partly attributed to the lack of awareness, on the part of policymakers, of the importance and benefits of green finance, as well as its connections to other crucial topics such as growth, employment, infrastructure development, sustainability, environment, and climate risks.5657 Among financial institutions, there is a misperception that green finance would prevent them from extending many loans or making many investments and would, therefore, be negative for their business growth. There is also a lack of understanding that environmental and climate risks can be material and be translated into financial risks and threats to financial stability. Domestic financial institutions in the B&R region have been relatively slow in participating in international green finance initiatives. Banks from the B&RCs currently make up about 4% of Equator Principles members and around 12% of the 128 UNEP FI bank signatories, lagging behind developed economies. The gap is especially salient for the insurance industry from the B&RCs, which tends to be more sensitive to climate risks compared to other financial players.
SOUTH AFRICA
KENYA
EGYPT
NIGERIA
GHANA
MOROCCO
LUXEMBOURG
ITALYTURKEY
GEORGIA
SRI LANKA
CHINA
NEPAL
BANGLADESH
PAKISTAN
KAZAKHSTAN
UAE
PHILIPPINES
BRI COUNTRIES
BRI COUNTRIES WITH GF POLICIES
GF POLICIES OR INITIATIVES
THAILAND VIETNAM
INDONESIA
FIJI
CHILE
ECUADOR
DECARBONIZING THE BELT AND ROAD - A GREEN FINANCE ROADMAP
32
LACK OF CAPACITY AND RESOURCES As national circumstances and development priorities of the B&RCs vary considerably, each country may decide to take a unique blend of policy-led, market-led and cross-sectoral initiatives in order to scale up green finance and facilitate the low-carbon transition. However, the existing policy frameworks for green finance in many B&RCs are usually high-level principles or initiatives, which are difficult to implement without detailed instructions tailored to specific sectoral demands, or comprehensive policies that require smooth coordination amongst key government agencies. China’s Guidelines for Establishing a Green Financial System, for example, which covers all financial products (e.g. green credit, green bonds, green ABS, green funds, etc), financial regulations, disclosure requirements and incentive policies, requires a high degree of capacity and fiscal resources to implement. The Chinese Guidelines issued in 2016 were later supplemented by over 20 detailed implementation rules from various regulators on specific products, incentives, verification and disclosure requirements. Such comprehensive guidelines are rare in other B&RCs. There is a general lack of capacity and resources among the B&RCs to draft and implement green finance policies at the regulatory level.
This is coupled with a lack of expertise and capacity amongst financial institutions and third-party service providers to operationalize green finance products. In the banking sector, despite a growing number of B&RCs having drafted green banking guidelines, on-lending banks are often unfamiliar with clean technologies and environmental risk management tools to implement the guidelines. Other FIs also struggle to undertake ESG integration in a robust manner and seize opportunities to develop green finance products. According to 2017 WWF research on 34 ASEAN listed banks58, only one bank reported having a dedicated ESG team, whilst just 11 banks reported that they conduct ESG training for staff. As for the sustainable PE/VC space, most commercial investors prefer to cooperate with fund managers that have long track records. These are generally lacking in B&RCs.
LACK OF CLEAR TAXONOMY OF GREEN ASSETSThe absence of a clear green finance taxonomy at international, regional or country level is one of the biggest challenges for developing green finance around the world. As of now, China is the only country that has developed a set of national level green taxonomies – one for green loans (2013), one for green bonds (2015), and one for green projects (2019). The EU has recently released its own taxonomy. The taxonomies, which are mostly used by international green bond issuers and investors, include verifiers’ interpretations of the Green Bond Principles and the Climate Bond Standard, which are voluntary in nature. Most developing countries that are interested in developing their domestic green finance taxonomies have yet to assemble the capacity to do so on their own. Tsinghua CDF has assisted Mongolia in developing a draft green taxonomy and is in discussion with the Kazakhstan’s authorities on a similar TA project.
The lack of clear taxonomy on what a green project is, makes it difficult for banks, institutional investors and other key stakeholders to identify eligible green projects and then allocate capital to them. A study on the green ASEAN finance opportunities concluded that the lack of clear definitions and clarification of “green” in the region increases search costs for banks looking to invest.59 The absence of green taxonomies could also lead to green washing. Without a clearly drawn green finance taxonomy, it is difficult to develop policy incentives, as the government authorities cannot easily tell green assets from brown ones.
DECARBONIZING THE BELT AND ROAD - A GREEN FINANCE ROADMAP
33
So far, there has not been a global consensus on green taxonomy. Nevertheless, four globally recognized principles and standards for green bonds are currently in use, including the Green Bond Principles (GBP), the Climate Bond Initiative Taxonomy, China’s Green Bond Endorsed Project Catalogue, and the Common Principles for Climate Mitigation Finance Tracking, developed by a joint climate finance group of MDBs and the International Development Finance Club (IDFC). Developing a local green taxonomy requires a significant amount of expertise and resources, and international assistance to B&RCs will be in high demand.
LACK OF INCENTIVES Financial institutions in most B&RCs are reluctant to offer green finance products and services as they believe it would incur additional costs. According to an IFC survey in 25 countries, since green lending practices require more careful due diligence and stricter selection of clients and projects to finance, there is a perception amongst banks that green lending could have a potentially higher business cost60. Potential green bond issuers also perceive an additional layer of costs and complexity in issuing green bonds, while receiving returns comparable to conventional bonds. Such additional costs and complexity include additional expense and administrative burden due to external verification, managing and monitoring the proceeds, and meeting reporting requirements. Higher costs brought by new and early stage sustainable technologies and business models in developing countries are one of the main reasons that PE/VC funds are less willing to participate. If positive incentives (e.g., interest subsidies or guarantees) for green finance activities or negative incentives for brown activities (e.g., disclosure requirements on emissions) are not in place to offset the above-mentioned costs, green finance will remain depressed in B&RCs.
LACK OF OPERATIONAL TOOLSThere is a shortage of operational tools for green project identification and ESG risk management in B&RCs. When it comes to risk management, the Equator Principles, for example, only apply to project financing of over USD10 million, which accounts for a small part of banking activities in B&RCs. Most financial institutions operating in the B&R region struggle to utilize ESRM tools that fit transactions of a smaller ticket size. In a
survey conducted among 68 of Indonesia’s commercial banks in 2013, 77% acknowledged they lacked the necessary tools to assess environmental risks61, including the methodologies to calculate the environmental impact of their projects (e.g., CO2 and SO2 emissions) and an IT system for managing the green lending process.
LACK OF ESG DATAESG data is a fundamental of green finance. However, most B&RCs have not yet undertaken ESG disclosure initiatives, such as guidelines for environmental and climate information disclosure by listed companies. Access to ESG data remains a significant challenge for green investment in these countries. Limited disclosure from companies and financial institutions in a comparable format makes it difficult to assess the materiality of ESG risks involved in their investment. 41% of global institutional investors believe that lack of transparency and reported data is a major barrier when allocating resources to sustainable investment.62
Developing a local green taxonomy requires a significant amount
of expertise and resources, and international assistance to B&RCs
will be in high demand.
DECARBONIZING THE BELT AND ROAD - A GREEN FINANCE ROADMAP
34
4 Emerging Options for Greening Investment in the Belt & RoadThe Belt and Road Initiative offers both opportunities and challenges for the region. It offers opportunities because the B&R is intended to catalyze additional investments to address infrastructure bottlenecks that have been hindering economic and social development and, in doing so, assist the achievement of the UN SDGs. It offers challenges because these investments could possibly put the region on a high-carbon path if they are not designed to be green and low carbon. Most of the countries along the Belt and Road are developing (or less developed) economies. Depending on the nature of the new infrastructure built in the coming decades, these countries represent great potential in GHG reductions or increases.
Currently there is no system in place to incentivize environmentally and socially responsible investments, or to penalize investments that damage the environment and negatively affect communities along the BRI. The scale and diversity of B&RCs calls for holistic solutions and collective actions. Financial institutions and corporations need to work together to address the environmental and social issues related to infrastructure projects. Local capacities in developing policies and instruments need to be built up in the Belt and Road countries, so that “country and corporate systems” are conducive to sustainable development. A piecemeal approach does not work anymore. What we need is an all-of-government and all-of-society approach to sustainability.
4.1 GREEN INVESTMENT PRINCIPLES FOR THE BELT AND ROAD
EXISTING ENVIRONMENTAL AND SOCIAL SAFEGUARDSEnvironmental and social safeguards are standards, rules and procedures that protect the environment and communities from the potential negative impacts of investment projects. All multilateral financial institutions, many industrial associations, and some UN-sponsored agencies and NGOs have developed their own safeguards. Though different in composition and content, these safeguards share common principles in areas such as environmental protection, ecological conservation, climate change mitigation, heritage preservation, and stakeholder communication.
Some of these safeguards have been developed for internal use by the member institutions (such as those for MDBs). Some of them are focused on one type of investment (e.g. project financing), and some of them are mainly for investors investing in the secondary market. These safeguards are typically led by OECD countries, and the participation of Chinese and B&RCs’ financial institutions remain limited. While all of these existing safeguards are relevant to the B &R, they are not specifically packaged for greening the BRI, which has a very distinct geographical focus, is infrastructure heavy, and has extensive Chinese participation and a huge need for capacity building.
DECARBONIZING THE BELT AND ROAD - A GREEN FINANCE ROADMAP
35
GREEN INVESTMENT PRINCIPLES (GIP) FOR THE BELT AND ROADWe believe that the BRI needs its own green investment principles, which should draw extensively from existing best practices but, also, focus on addressing the specific challenges for the B&RCs. Firstly, the principles should target the B&RCs, which consists of many low-income countries with relatively weak ESG awareness and capacity for green finance and low-carbon investment. Note that many financial institutions from the B&RCs are not yet signatories of initiatives such as the Equator Principles or Principles for Responsible Investment. Secondly, the principles should take into account the fact that most projects that require financing in the B&RCs are green field projects with limited participation of the secondary market. Thirdly, many of the BRI projects are initiated by or have co-investment from China, especially its large banks and corporates, which are not members of the Equator Principles or Principles for Responsible Investment.
Launched in November 2018, the Green Investment Principles (GIP) for the Belt and Road was developed by a coalition led by the Green Finance Committee of China Society for Finance and Development and the City of London Green Finance Initiative. A number of international organizations also participated, such as the Principles for Responsible Investment, the Sustainable Banking Network, the Belt and Road Bankers Roundtable, the Green Belt and Road Investors Alliance, the Word Economic Forum, and the Paulson Institute. The GIP not only addresses ESG issues but also aims to build up capacity in green finance policy design, instrument development and application, with a special focus on the B&RCs and mobilizing participation by developing country players. The seven principles included in the GIP are set out in Figure 17.
Since its formal launch in late November 2018 in London, the GIP has received strong backing from the global financial industry, including commercial banks, development banks, institutional investors, stock exchanges and other stakeholders that will invest or help in mobilizing investment in the Belt and Road. The 28 institutions that signed up to the GIP as of April 25th2019, 2019 include (in alphabetical order):
Agricultural Bank of China, Agricultural Development Bank of China, Al Hilal Bank, Astana International Exchange, Bank of China, Bank of East Asia, China Construction Bank, China Development Bank, China International Contractors Association, China International Capital Corporation, Crédit Agricole-CIB, DBS Bank, Deutsche Bank, Export-Import Bank of China, First Abu Dhabi Bank, Habib Bank of Pakistan, Hong Kong Exchanges and Clearing, HSBC, Industrial and Commercial Bank of China, Industrial Bank, Khan Bank, Luxembourg Stock Exchange, Mizuho Bank, Natixis Bank, Silk Road Fund, Standard Chartered Bank, Trade and Development Bank of Mongolia, and UBS Group.
These signatories include all major Chinese banks and Chinese investors in the B&RCs, and some of the largest financial institutions from the UK, Germany, France, Singapore, Hong Kong, Pakistan, Mongolia, Kazakhstan, and United Arab Emirates. Several MDBs and service providers, including the International Finance Corporation, Asia Infrastructure Investment Bank, Asian Development Bank, European Bank for Reconstruction and Development, New Development Bank, E&Y, Deloitte, KPMG and PWC, have also expressed their support for the GIP. Along with this list of global signatories, it was also announced that a GIP Secretariat will be established to work on expanding the GIP membership, the development of implementation tools and case studies and the green project database for the BRI, as well as compiling the progress report.
DECARBONIZING THE BELT AND ROAD - A GREEN FINANCE ROADMAP
36
4.2 RAISING AWARENESS AND BUILDING CAPACITY ON GREEN FINANCE FOR BELT AND ROAD COUNTRIESWhile many infrastructure projects in the B&RCs are currently funded by international capital, in order to meet the multi-trillion investment demand annually in the future, most investments in B&RCs will need to be financed by local financial markets in the future. For example, in Pakistan, where China has already committed to investing more than US$60bn, the external investment will only account for about 10 percent of the total demand, according to the estimates by Tsinghua University and Vivid Economics. The efforts to mobilize green investments from other sources may only help reduce carbon emissions in B&RCs by several percentage points. More needs to be done, including efforts to green the local financial system, which involves capacity building for policymakers, financial regulators and market participants in most developing countries along the B&R.
Case studies from China and many other B&RCs tell us that it is most important for policymakers to fully understand the risks from environmental pollution and climate change, e.g. the life expectancy of people living in heavily-polluted environments are estimated to be shortened by as much as six years, and public expenditure on health care will increase significantly due to worsened heath conditions. Policymakers also need to be confident that the efforts to address these risks in developing green finance and pursuing sustainable development will not curtail the growth of the real economy but, instead, could bring opportunities to the fast growing green segments of the economy, such as job creation through the development of renewable energies, green buildings, and sustainable agriculture. What policymakers need to do is to send policy signals that country authorities are determined to take actions to address environmental issues and mitigate climate change. This could include the announcement of adhering to the targets of the UN SDGs and Paris Agreement, the development of national policies or a roadmap for sustainable development, the introduction of policies to promote green finance, or efforts to enhance environment regulations and enforcement.
For policymakers and financial regulators, the most urgent task is to realiszerealize and fully understand that the risks from environmental pollution and climate change, such as physical and transition risks, could be translated into material political, economic and financial risks. In 2014, a study cited by a People’s Bank of China (PBOC) report estimated that the life expectancy of residents in Northern China was shortened by 5.5 years due to air pollution caused
by coal burning63. A WHO report estimated that 12 million people die prematurely due to pollution every year globally64. A World Bank study showed that the economic cost of air pollution could amount to 7.5% of annual GDP in Asia.65 Nick Stern’s report on the economics of climate change suggested that climate change may have an annual cost of 5 to 20 % of the world’s GDP.66 Case studies from the UK on the influence of climate change on the insurance sector show that it could significantly increase the risks on both the asset and liability side of major insurance companies.67 To better understand the potential transition risks, DNB, the central bank of the Netherlands, analyszed financial institutions’ exposure to transition-sensitive sectors in the Waterproof Report 2017.68 A survey conducted amongst the largest financial institutions (representing about 75% of the total balance sheet of the Dutch financial sector) showed that Dutch financial institutions have significant exposure in sectors with increased transition risks.69 For banks, 11% of their balance sheet is tied to carbon-intensive sectors. The corresponding percentage for pension funds is 12.4%. It is essential that financial regulators have an early understanding of the material financial risks from environment and climate change, and adequate capacity to address them.
THE NEED FOR CAPACITY BUILDINGAs suggested by the G20 Green Finance Synthesis Report in 201670, one of the seven options for country authorities to develop green finance is to send strategic policy signals. Since then, many countries have made progress, including publishing green finance roadmaps, or joining international initiatives for green and sustainable finance. However, as indicated in the stocktaking part of this report, most of these economies have not developed specific guidelines on green finance products, and most countries do not even have a green taxonomy that defines green products. This reflects the lack of capacity in both the public and private sectors in the economies of these countries. Considering that over 90% of their investments will have to be financed domestically in the Belt and Road region, efforts taken so far within the B&RCs are far from enough to ensure the support of a green economy and contain the average temperature rise within 2 degrees. That implies an urgent and vast demand in the Belt and Road for green finance capacity building.
A World Bank study showed that the economic cost of air pollution could amount to 7.5% of annual GDP in Asia.78
DECARBONIZING THE BELT AND ROAD - A GREEN FINANCE ROADMAP
37
For the public sector, the lack of capacity has constrained the development of green finance policies, including policies that could internaliszeinternalize the externalities of green projects and mobiliszemobilize private capital for green investment. For example, one participant from a B&R country to the Global Green Finance Leadership Program (GFLP) in 2018 thought that green finance was about financing agriculture because most agriculture products are “green”. This is a very typical sign of the lack of understanding within the public sector, indicating there is a long way to go for thousands of local governments and regulators in about 100 developing countries in order for them to be fully engaged in green finance.
For the private sector, the lack of capacity constrains the development of green financial products. For example, most financial firms in the Belt & Road region do not yet know how to incorporate green finance policies and principles, if they have any, into their operations, including a green lending and investment process, labelling of green assets, measuring environmental impacts of green projects, pricing green assets, monitoring green investment performance and disclosing ESG information. In addition, without policy frameworks and guidelines for green finance, financial firms (especially commercial banks) may not be fully aware of financial risks coming from the physical and transition risks of their environmental and climate exposures. The case is even worse for insurance companies that might be affected on both the asset and the liability side, e.g. much coastal real estate held by insurance companies and other institutional investors might be stranded due to sea levels rising.
GREEN FINANCE LEADERSHIP PROGRAM (GFLP) AND THE BELT AND ROADThere are many capacity building platforms on green finance and the management of environmental and social risks for both the public and private sectors, e.g. those organized by UNEP FI and the PRI. But none of these specifically focus on B&RCs or target B&R activities. In May 2018, Tsinghua University and SBN launched the Global Green Finance Leadership Program (GFLP), in joint efforts with the China Council for International Cooperation on Environment and Development (CCICED). The GFLP focuses on knowledge sharing of best practices on green and sustainable finance for the countries of the B&R. It builds on the global momentum created by the Paris Agreement and other initiatives.
The two capacity building events organiszedorganized by the GFLP Program in May and November 2018, were attended by 250 participants from 48 B&RCs who were keen to learn from global experiences to advance sustainable and green finance development in their home market. Discussions included ways in which financial market policies could help create reform momentum, incentivize private sector participation, reduce perceived risks for green investment, and put in place consistent standards across the market. Global practices on green finance taxonomies, disclosure of environmental and climate information, green supporting factors, and green finance products were discussed and debated extensively, and several working groups were set up among members of the GFLP to explore the most pressing issues on taxonomy, capacity building, and financing green agriculture.
After these two events, GLFP organizers received specific requests from Mongolia, Pakistan, Kazakhstan, UAE and some Asian countries to assist them on developing green taxonomies and specific green finance guidelines. A draft version of the green taxonomy was developed for Mongolia by an expert team organized by GFLP, in collaboration with Mongolia Sustainable Finance Association. The GFLP has planned at least three capacity building events in Morocco (targeting an African audience), Kazakhstan (targeting a Central Asian audience), and Singapore (targeting an ASEAN audience) in 2019 and will develop a series of user-friendly green finance tools and methodologies for developing countries.
DECARBONIZING THE BELT AND ROAD - A GREEN FINANCE ROADMAP
38
4.3 INTERNATIONAL COLLABORATIONS OF ALL STAKEHOLDERSThe goal of greening BRI investment cannot be met without the joint efforts of all stakeholders and international cooperation, including international organizations like the UN agencies, market associations and country authorities of both investing and host countries, as well as major financial market players that invest in the B&RCs.
The following table summarizes a range of international, regional and bilateral initiatives to promote green and sustainable finance, some of which are focused on the Belt and Road region. Those labelled as “global initiatives” do not target a specific geographic region, but have developed specific principles, guidelines and tools for green and sustainable finance actions for banking, the bond market, institutional investors or for processes of managing environmental and climate risks. Those labelled as “Belt & Road” are initiatives taken for green finance or investment in the Belt & Road region or a subset of the region such as ASEAN or Latin America. The bilateral collaborative initiatives, such as those between China and the UK, and China and France, have launched programs on environmental/climate information disclosure, green tech investment, green securitization and harmoniszationharmonization of green standards.
After taking a closer look at proliferating green finance initiatives, one should wonder whether these efforts and resources could be better coordinated to achieve maximum impact within the Belt and Road region. This region faces the most significant environmental and climate challenges and, therefore, requires the most support on awareness raising and capacity building. As a reminder, we showed in the previous chapter of this report that Belt and Road countries may become the source of most carbon emissions by 2050 if their investments are not greened in the near term. In the next chapter, we will turn to a discussion about developing an action matrix for international coordination.
Table 7. Action Matrix: Initiatives and Coverages
Global Initiatives Initiatives for B&R region Bilateral Initiatives
G20 Green/Sustainable Finance Study Group Central Banks and Supervisors Network for Greening the Financial System (NGFS) Principles for Responsible InvestmentEquator Principles UNEP Finance InitiativeUNEP Principles for Responsible BankingISO Technical Committee on Sustainable Finance (TC322) Sustainable Insurance Forum (SIF)Sustainable Banking Network (SBN)B&R Corporate Forum on Sustainable FinanceGlobal Green Finance Council (GGFC)The Loan Principles (GLP & SLLP)The Green Bond PledgeFSB-TCFDSustainable Stock Exchanges (SSE)Green Bond PrinciplesClimate Bonds InitiativeFinancial Centers for Sustainability (FC4S)OECD Center on Green Finance and InvestmentCCarbon Disclosure Project (CDPGreen Finance Center of Paulson Institute
Green Investment Principles (GIP) for the Belt & RoadGreen Finance Leadership Program (GFLP)Belt and Road Bankers’ Roundtable (BRBR)BRI International Green Development CoalitionThe Green Belt and Road Investor Alliance (GBRIA)Roadmap for Sustainable Capital Markets (ASEAN Capital Markets Forum)ASEAN Green Bond Standards A Framework to Guide Sustainability Across the Project Cycle (IADB) NRDC Green Investment Platform
China-UK Green Finance TaskforceChina-UK Pilot on Environmental and Climate Information Disclosure China-France Green Finance Joint Conference
DECARBONIZING THE BELT AND ROAD - A GREEN FINANCE ROADMAP
39
5 Recommendations5.1 URGENCY OF THE CHALLENGES
5.1.1 ‘Business as Usual’ scenario for B&RCs could result in global emissions double 2DS levels by 2050 B&RCs are expected to generate emissions well above 2-Degree Scenario (“2DS”) levels if a Business Asas Usual (BAU) pathway is followed. Infrastructure and other investments in the countries that are part of the Belt and Road Initiative (“B&RCs”) are estimated to make up 60% of global infrastructure investments in the coming two decades. Without action, these investments will be a major contributing factor to global carbon emissions, 60% of which, on current trends, are accounted for by infrastructure (according to the World Economic Forum).71
Our analysis of future carbon emission suggests that such a BAU pathway could result in B&RCs (only counting the 17 selected countries outlined in our methodology) exceeding their 2DS carbon budget by 11Gt (16%) by 2030 and 87Gt (60%) by 2050. This would be equivalent to setting back the 2DS emission pathway by 12 years by 2050. On that basis, whilst accounting for 28% of global emissions by 126 B&RCs in 2015, our estimates indicate that B&RCs could account for 66% of world total by 2050, if the rest of the world follows a 2DS pathway.
Moreover, even if B&RCs achieve “commensurate historical best practices” (i.e., effectively deploying leading-edge green technologies already in use, particularly in OECD countries, at the pace compatible with income growth in the B&RCs), the resulting emissions scenario (39% lower than BAU) will still be falling short of the reduction required to align with a 2DS (by 68%). This means that carbon emissions may still exceed the 2DS budget by a huge margin (29%) by 2050.
5.1.2 The potential carbon ‘lock-in’ arising from BRI investments calls for immediate actionCarbon emissions are being locked in at the contractual stage, as it establishes technology choice, design and construction. The majority of carbon emissions in B&RCs will result from the build out and use of infrastructure in the coming decades. Infrastructure development planning involves long lead times that pre-determine technology choices which, in turn, shape institutions, behaviour norms and outcomes, including carbon emissions for decades to come. Very little can be done to reduce carbon once the projects are installed.
Consequently, carbon emissions by B&RCs in the next 30 years will be largely determined in the coming decade (when the projects are designed and constructed) leaving limited time for action. Efforts to make sure that carbon reduction is incorporated into the design and construction of all major projects, especially in the infrastructure sector, are thus critical in determining the outlook of global warming for the century.
Infrastructure and other investments in the countries that are part of the Belt and Road Initiative (“B&RCs”) are estimated to make up 60% of global infrastructure investments in the coming two decades.
DECARBONIZING THE BELT AND ROAD - A GREEN FINANCE ROADMAP
40
5.1.3 Investor awareness alone will be insuff icient - further incentives for green investments are required The right incentives for green investments in B&RCs are not yet in place because of regulatory, ownership and institutional constraints.
The nature of the carbon challenge in the B&R means that delivering a 2DS development path will require decarbonisation trajectories which have never been seen before in history. This means we need system-level changes that go far beyond market-based interventions, which are typically centred around investor risks and returns. Specifically, promoting low carbon investments in the B&R requires us to address several structural challenges:
1. CARBON/CLIMATE-RELATED REGULATIONS IN THE BELT & ROAD COUNTRIES ARE SCARCE AND, WHERE THEY EXIST, ARE OFTEN INADEQUATELY ENFORCED. There are very limited incentives among the B&RCs to internalize externalities coming out of carbon intensive sectors - most of these countries do not have a carbon cap or carbon tax, for example. Moreover, whilst many B&RCs have made commitments or established policy frameworks to deal with climate change, notably through their nationally determined contributions, they require strengthening in order to be effective. Given the rapid pace of infrastructure investment commitments, this may take longer than the science allows.
2. MANY CARBON INTENSIVE ASSETS IN B&RCS ARE LESS SENSITIVE TO STRANDING AS THEY SIT ON PUBLIC BALANCE SHEETS. Since a large proportion of carbon intensive assets sit on public balance sheets in the B&R region, the stranded asset argument (i.e., the fear that an asset will become non-performing well ahead of its anticipated lifespan due to climate or environment-related risk factors) has limited application. While public financiers have already expanded their portfolios to include renewable energy, their recognition of the need to re-allocate to the greener sectors remains limited in B&RCs.
3. MANY PROJECTS ARE DE-RISKED THROUGH PUBLIC INSTITUTIONS. Many energy and carbon-intensive infrastructure projects in the Belt & Road Region still receive policy and publicly-funded risk-underwriting support, including from export credit agencies (ECAs) and development banks. Many guaranteed projects to support small and medium-sized businesses (SMEs) are less than green.
5.1.4. Capacity of the B&R f inancial system to deliver green investment is weak Most Belt and Road countries are severely limited in terms of their policy and market preparedness for mobilizing finance into environmentally sustainable and climate resilient sectors. Research on syndicated loans shows that the 126 B&RCs (excluding China) contribute to only 14% of the global green loans. China and Bangladesh are the only countries in the region that have definitions on green loans and require banks to report, making it difficult to collect, track and report green loan data. Similarly, based on data provided by CBI, we estimate that the green bonds issued in the B&R region (excluding China) make up less than 7% of global green bond issuance by May 2019, while the sustainable assets owned by institutional investors in the region are only 0.2% of the world’s total in 201672. As of 2018, 72% of B&RCs’ emissions are not covered by carbon trading mechanisms.
5.1.5 Policy frameworks for green f inance are emerging but still inadequate in most B&RCs Since the G20 has made green finance one of its main focuses in 2016, 11 B&RCs have sent strategic signals by launching green finance policies, among which 3 countries (China, Indonesia and Bangladesh) have put in place national frameworks and implementation guidance. A few other countries have introduced policies and market incentives to develop green market mechanisms and products, including loans and the bond market. However, most of these roadmaps, whilst essential starting points, have not translated into actual green finance flows, due to the lack of taxonomies, green finance product guidelines, and capacity for implementation by financial firms.
DECARBONIZING THE BELT AND ROAD - A GREEN FINANCE ROADMAP
41
5.1.6 B&RCs are facing a number of common challenges in developing green f inance, including inadequate:
1. Public and policy awareness of impacts resulting from environmental and climate changes.
2. Coordinated policy signals, including severe misalignment between development, energy, environment and financial sector goals.
3. Policy incentives to create market and improve risk-adjusted returns for sustainable investment in the B&RCs.
4. Taxonomy of green assets, which makes it difficult for investors to distinguish between green and brown projects.
5. Capacity and resources to implement policy, absence of market tools and products.
6. Disclosure of ESG data, which makes it difficult for investors to assess the materiality of ESG risks.
With climate and carbon in mind, in addition, there is a lack of adequate specificity of many of the emerging green finance policies, instruments and practices. In sum, a much more aggressive “greening” strategy for incoming investment flows, as well as the financial system, in the B&R region is urgently needed for the world to stay closer to the 2-degree scenario.
DECARBONIZING THE BELT AND ROAD - A GREEN FINANCE ROADMAP
42
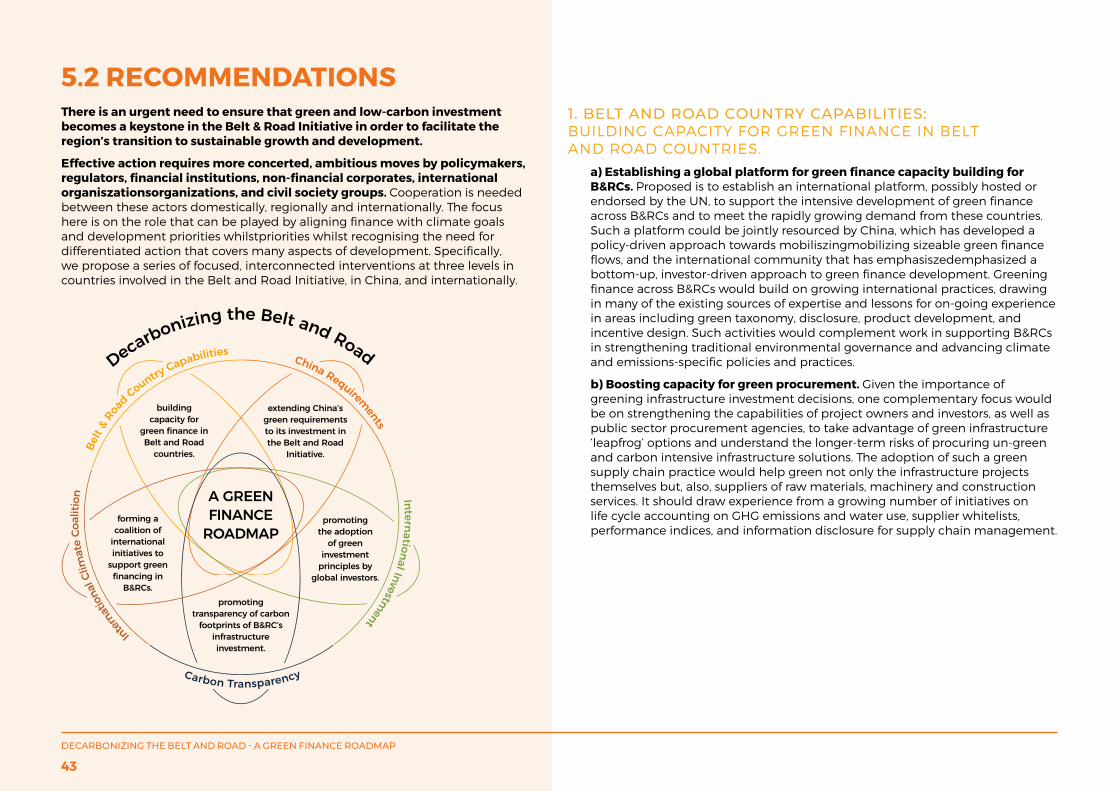
5.2 RECOMMENDATIONS There is an urgent need to ensure that green and low-carbon investment becomes a keystone in the Belt & Road Initiative in order to facilitate the region’s transition to sustainable growth and development.
Effective action requires more concerted, ambitious moves by policymakers, regulators, financial institutions, non-financial corporates, international organiszationsorganizations, and civil society groups. Cooperation is needed between these actors domestically, regionally and internationally. The focus here is on the role that can be played by aligning finance with climate goals and development priorities whilstpriorities whilst recognising the need for differentiated action that covers many aspects of development. Specifically, we propose a series of focused, interconnected interventions at three levels in countries involved in the Belt and Road Initiative, in China, and internationally.
1. BELT AND ROAD COUNTRY CAPABILITIES: BUILDING CAPACITY FOR GREEN FINANCE IN BELT AND ROAD COUNTRIES.
a) Establishing a global platform for green finance capacity building for B&RCs. Proposed is to establish an international platform, possibly hosted or endorsed by the UN, to support the intensive development of green finance across B&RCs and to meet the rapidly growing demand from these countries. Such a platform could be jointly resourced by China, which has developed a policy-driven approach towards mobiliszingmobilizing sizeable green finance flows, and the international community that has emphasiszedemphasized a bottom-up, investor-driven approach to green finance development. Greening finance across B&RCs would build on growing international practices, drawing in many of the existing sources of expertise and lessons for on-going experience in areas including green taxonomy, disclosure, product development, and incentive design. Such activities would complement work in supporting B&RCs in strengthening traditional environmental governance and advancing climate and emissions-specific policies and practices.
b) Boosting capacity for green procurement. Given the importance of greening infrastructure investment decisions, one complementary focus would be on strengthening the capabilities of project owners and investors, as well as public sector procurement agencies, to take advantage of green infrastructure ‘leapfrog’ options and understand the longer-term risks of procuring un-green and carbon intensive infrastructure solutions. The adoption of such a green supply chain practice would help green not only the infrastructure projects themselves but, also, suppliers of raw materials, machinery and construction services. It should draw experience from a growing number of initiatives on life cycle accounting on GHG emissions and water use, supplier whitelists, performance indices, and information disclosure for supply chain management.
DECARBONIZING THE BELT AND ROAD - A GREEN FINANCE ROADMAP
43
2. CHINA REQUIREMENTS: EXTENDING CHINA’S GREEN REQUIREMENTS TO ITS INVESTMENT IN THE BELT AND ROAD INITIATIVE.
Green financing across countries involved in the Belt and Road Initiative should be advanced through policy and collaborative business engagement:
a) Applying a mandatory environmental assessment requirement for Chinese investments in the B&RCs. On policy, a solution is to extend and strengthen China’s existing, domestically-focused green finance and investment policies (initiated by seven ministries and financial regulators) to China’s external investments including those in the Belt and Road region. For example, an environmental impact assessment of major BRI investments by Chinese investors should become a mandatory requirement as part of the approval process. Such an impact assessment should include estimation of carbon emissions of the proposed project, as well as impacts on air, water, soil, biodiversity and community. Consideration should also be given to adopting the recommendations of the Task Force on Climate-Related Financial Disclosure (TCFD) on a mandatory basis for China’s outbound investments. The newly launched Belt and Road Green Investment Alliance, which involves several key ministries in China, could take a coordination role in promoting the above policy changes.
b) Greening operations of Chinese non-financial corporates in the B&RCs. Green finance policies should be complemented by engaging key parts of the non-financial Chinese business community to advance greener project offerings, specifically by the major construction, energy and technology companies that account for a large part of the Chinese business community’s involvement in the B&RCs. China International Contractors Association (CHINCA) has the potential to play a leading role in this initiative, supported by international actors and business coalitions with a green infrastructure focus, and work closely with investors and project owners to develop a green supply chain network in the Belt and Road region.
3. INTERNATIONAL INVESTMENT: PROMOTING THE ADOPTION OF GREEN INVESTMENT PRINCIPLES BY GLOBAL INVESTORS.
Promoting the adoption of green investment principles by global investors. China and the UK have taken the initiative in developing a set of Green Investment Principles (GIP) for the Belt and Road, and more than 25 major Chinese and global institutions (most of which are lenders and investors) signed up to these principles between November 2018 and April 2019. With the rapid pace of GIP membership expansion, it is possible that GIP signatories could soon cover the majority of international financial flows to infrastructure projects in the Belt & Road region.
What is needed is for this membership to expand, and to develop a more specific focus on key aspects of green finance, notably carbon and climate resilience. As part of this, there is significant value to developing a freely available database of all projects in B&RCs, along with their green credentials, or otherwise.
Specific segments of infrastructure investment could be targeted given their particular effects on carbon and climate targets, notably in the energy and transport sectors. In some areas, there is merit in forming alliances between key technology exporting and investing countries to reach agreement on how best to collaborate in accelerating the transition from fossil fuel intensive to clean energy systems.
DECARBONIZING THE BELT AND ROAD - A GREEN FINANCE ROADMAP
44

4. CARBON TRANSPARENCY: PROMOTING TRANSPARENCY OF CARBON FOOTPRINTS OF B&RCS INFRASTRUCTURE INVESTMENT. REPORTING CARBON FOOTPRINTS ON B&R INVESTMENT OF MAJOR INFRASTRUCTURE PROJECTS.
Given that infrastructure investments in B&RCs will have a defining impact on global carbon emissions in the future, it is imperative to improve disclosure of these projects’ climate impact. Applying the TCFD recommendations is one step in that direction but a more comprehensive disclosure of investments’ lifecycle carbon footprint is needed, irrespective of the risk to the specific investors. Existing initiatives, such as the Carbon Disclosure Project, the UNEP FI pilot on TCFD implementation, and the China-UK pilot on environmental/climate information disclosure, could be asked to develop a program to measure/estimate and report on the carbon implication of these projects.
5. INTERNATIONAL CLIMATE COALITION: FORMING A COALITION OF INTERNATIONAL INITIATIVES TO SUPPORT GREEN FINANCING IN B&R.
We propose building a coalition among various international, regional and bilateral collaborative schemes, with a view to more effectively advancing low carbon and climate-resilient investments in B&RCs. This could be built on ongoing initiatives such as the Green Investment Principles (GIP) for the Belt and Road, as well as drawing the work of the UNEP FI, UNDP, PRI, SBN, TCFD, NGFS, FC4S, ISO, AIIB, IADB and others. A key objective of this coalition would be to share existing resources and optimize the allocation to support the most impactful initiatives. A possible next step is for the GIP Secretariat with others to explore how best to develop a collaborative scheme towards this common goal.
DECARBONIZING THE BELT AND ROAD - A GREEN FINANCE ROADMAP
45
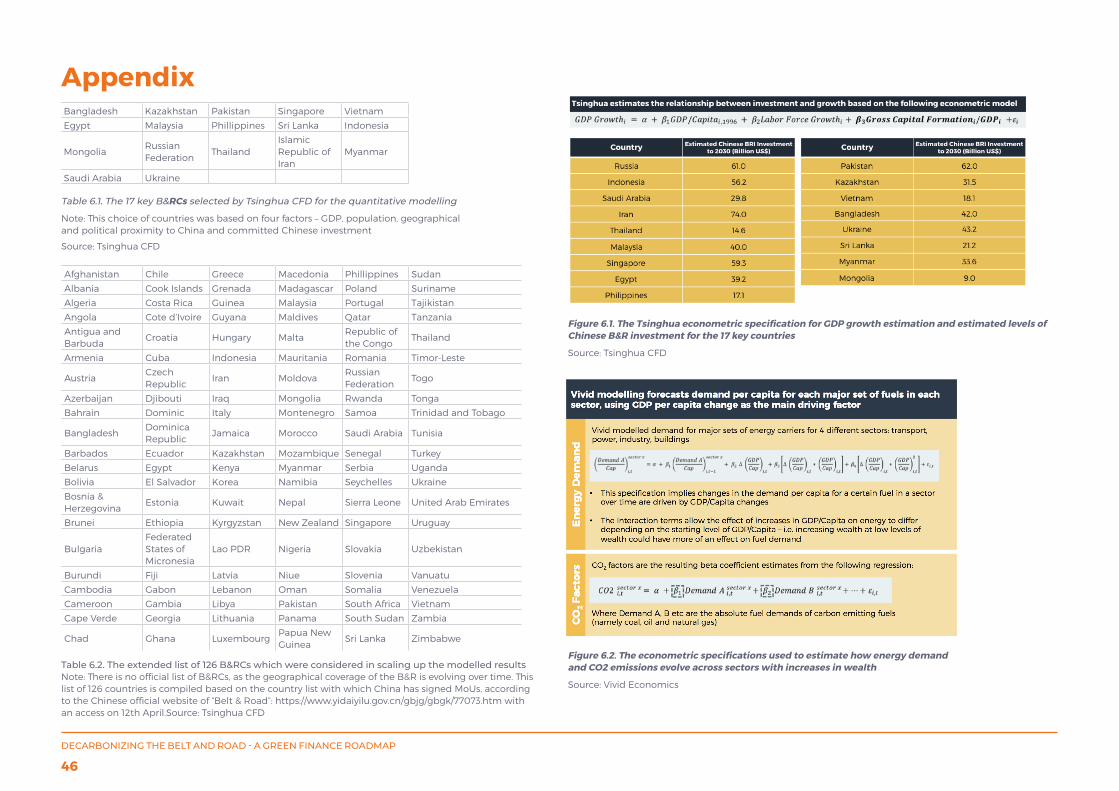
Appendix
Table 6.2. The extended list of 126 B&RCs which were considered in scaling up the modelled resultsNote: There is no official list of B&RCs, as the geographical coverage of the B&R is evolving over time. This list of 126 countries is compiled based on the country list with which China has signed MoUs, according to the Chinese official website of “Belt & Road”: https://www.yidaiyilu.gov.cn/gbjg/gbgk/77073.htm with an access on 12th April.Source: Tsinghua CFD
Bangladesh Kazakhstan Pakistan Singapore Vietnam
Egypt Malaysia Phillippines Sri Lanka Indonesia
MongoliaRussian Federation
ThailandIslamic Republic of Iran
Myanmar
Saudi Arabia Ukraine
Afghanistan Chile Greece Macedonia Phillippines Sudan
Albania Cook Islands Grenada Madagascar Poland Suriname
Algeria Costa Rica Guinea Malaysia Portugal Tajikistan
Angola Cote d’Ivoire Guyana Maldives Qatar Tanzania
Antigua and Barbuda
Croatia Hungary MaltaRepublic of the Congo
Thailand
Armenia Cuba Indonesia Mauritania Romania Timor-Leste
AustriaCzech Republic
Iran MoldovaRussian Federation
Togo
Azerbaijan Djibouti Iraq Mongolia Rwanda Tonga
Bahrain Dominic Italy Montenegro Samoa Trinidad and Tobago
BangladeshDominica Republic
Jamaica Morocco Saudi Arabia Tunisia
Barbados Ecuador Kazakhstan Mozambique Senegal Turkey
Belarus Egypt Kenya Myanmar Serbia Uganda
Bolivia El Salvador Korea Namibia Seychelles Ukraine
Bosnia & Herzegovina
Estonia Kuwait Nepal Sierra Leone United Arab Emirates
Brunei Ethiopia Kyrgyzstan New Zealand Singapore Uruguay
BulgariaFederated States of Micronesia
Lao PDR Nigeria Slovakia Uzbekistan
Burundi Fiji Latvia Niue Slovenia Vanuatu
Cambodia Gabon Lebanon Oman Somalia Venezuela
Cameroon Gambia Libya Pakistan South Africa Vietnam
Cape Verde Georgia Lithuania Panama South Sudan Zambia
Chad Ghana LuxembourgPapua New Guinea
Sri Lanka Zimbabwe
Table 6.1. The 17 key B&RCs selected by Tsinghua CFD for the quantitative modelling
Note: This choice of countries was based on four factors – GDP, population, geographical and political proximity to China and committed Chinese investment
Source: Tsinghua CFD
Figure 6.1. The Tsinghua econometric specification for GDP growth estimation and estimated levels of Chinese B&R investment for the 17 key countries
Source: Tsinghua CFD
Figure 6.2. The econometric specifications used to estimate how energy demand and CO2 emissions evolve across sectors with increases in wealth
Source: Vivid Economics
DECARBONIZING THE BELT AND ROAD - A GREEN FINANCE ROADMAP
46
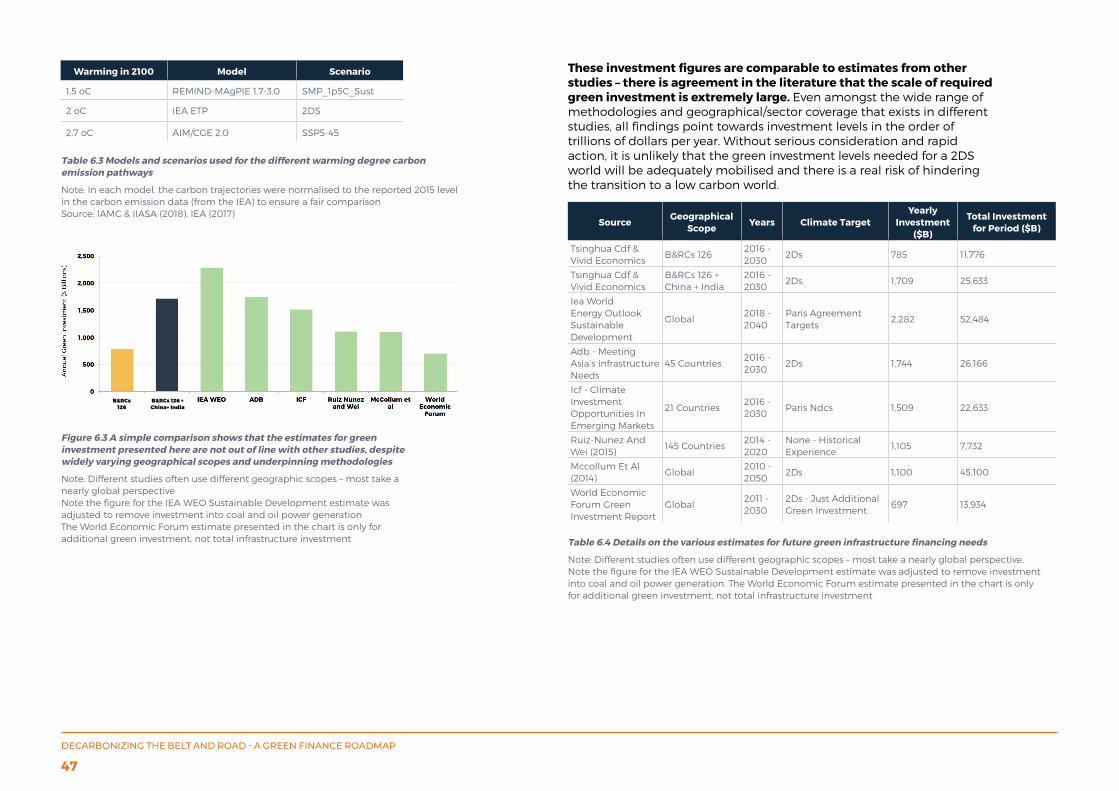
Table 6.3 Models and scenarios used for the different warming degree carbon emission pathways
Note: In each model, the carbon trajectories were normalised to the reported 2015 level in the carbon emission data (from the IEA) to ensure a fair comparisonSource: IAMC & IIASA (2018), IEA (2017)
Figure 6.3 A simple comparison shows that the estimates for green investment presented here are not out of line with other studies, despite widely varying geographical scopes and underpinning methodologies
Note: Different studies often use different geographic scopes – most take a nearly global perspectiveNote the figure for the IEA WEO Sustainable Development estimate was adjusted to remove investment into coal and oil power generationThe World Economic Forum estimate presented in the chart is only for additional green investment, not total infrastructure investment
These investment figures are comparable to estimates from other studies – there is agreement in the literature that the scale of required green investment is extremely large. Even amongst the wide range of methodologies and geographical/sector coverage that exists in different studies, all findings point towards investment levels in the order of trillions of dollars per year. Without serious consideration and rapid action, it is unlikely that the green investment levels needed for a 2DS world will be adequately mobilised and there is a real risk of hindering the transition to a low carbon world.
Table 6.4 Details on the various estimates for future green infrastructure financing needs
Note: Different studies often use different geographic scopes – most take a nearly global perspective. Note the figure for the IEA WEO Sustainable Development estimate was adjusted to remove investment into coal and oil power generation. The World Economic Forum estimate presented in the chart is only for additional green investment, not total infrastructure investment
Warming in 2100 Model Scenario
1.5 oC REMIND-MAgPIE 1.7-3.0 SMP_1p5C_Sust
2 oC IEA ETP 2DS
2.7 oC AIM/CGE 2.0 SSP5-45
SourceGeographical
ScopeYears Climate Target
Yearly Investment
($B)
Total Investment for Period ($B)
Tsinghua Cdf & Vivid Economics
B&RCs 1262016 - 2030
2Ds 785 11,776
Tsinghua Cdf & Vivid Economics
B&RCs 126 + China + India
2016 - 2030
2Ds 1,709 25,633
Iea World Energy Outlook Sustainable Development
Global2018 - 2040
Paris Agreement Targets
2,282 52,484
Adb - Meeting Asia’s Infrastructure Needs
45 Countries2016 - 2030
2Ds 1,744 26,166
Icf - Climate Investment Opportunities In Emerging Markets
21 Countries2016 - 2030
Paris Ndcs 1,509 22,633
Ruiz-Nunez And Wei (2015)
145 Countries2014 - 2020
None - Historical Experience
1,105 7,732
Mccollum Et Al (2014)
Global2010 - 2050
2Ds 1,100 45,100
World Economic Forum Green Investment Report
Global2011 - 2030
2Ds - Just Additional Green Investment
697 13,934
B&RCs 126
B&RCs 126 +China+ India
DECARBONIZING THE BELT AND ROAD - A GREEN FINANCE ROADMAP
47
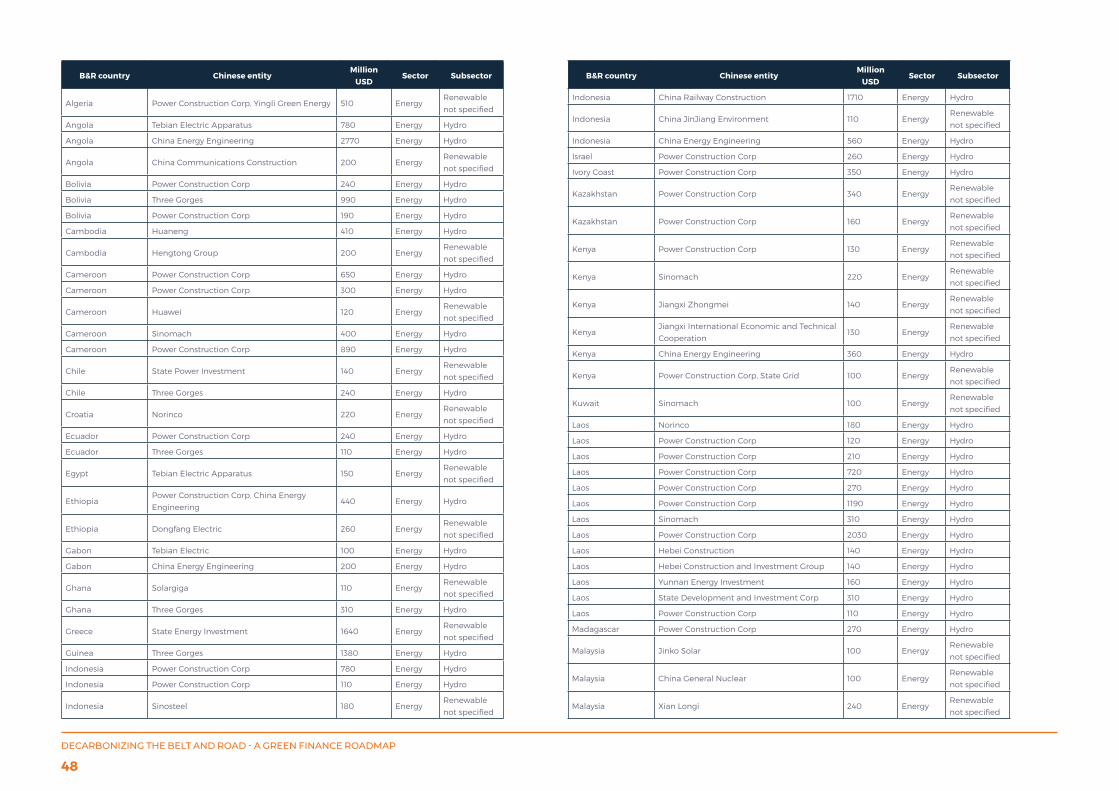
B&R country Chinese entityMillion
USDSector Subsector
Algeria Power Construction Corp, Yingli Green Energy 510 EnergyRenewable
not specified
Angola Tebian Electric Apparatus 780 Energy Hydro
Angola China Energy Engineering 2770 Energy Hydro
Angola China Communications Construction 200 EnergyRenewable
not specified
Bolivia Power Construction Corp 240 Energy Hydro
Bolivia Three Gorges 990 Energy Hydro
Bolivia Power Construction Corp 190 Energy Hydro
Cambodia Huaneng 410 Energy Hydro
Cambodia Hengtong Group 200 EnergyRenewable
not specified
Cameroon Power Construction Corp 650 Energy Hydro
Cameroon Power Construction Corp 300 Energy Hydro
Cameroon Huawei 120 EnergyRenewable
not specified
Cameroon Sinomach 400 Energy Hydro
Cameroon Power Construction Corp 890 Energy Hydro
Chile State Power Investment 140 EnergyRenewable
not specified
Chile Three Gorges 240 Energy Hydro
Croatia Norinco 220 EnergyRenewable
not specified
Ecuador Power Construction Corp 240 Energy Hydro
Ecuador Three Gorges 110 Energy Hydro
Egypt Tebian Electric Apparatus 150 EnergyRenewable
not specified
EthiopiaPower Construction Corp, China Energy
Engineering440 Energy Hydro
Ethiopia Dongfang Electric 260 EnergyRenewable
not specified
Gabon Tebian Electric 100 Energy Hydro
Gabon China Energy Engineering 200 Energy Hydro
Ghana Solargiga 110 EnergyRenewable
not specified
Ghana Three Gorges 310 Energy Hydro
Greece State Energy Investment 1640 EnergyRenewable
not specified
Guinea Three Gorges 1380 Energy Hydro
Indonesia Power Construction Corp 780 Energy Hydro
Indonesia Power Construction Corp 110 Energy Hydro
Indonesia Sinosteel 180 EnergyRenewable
not specified
B&R country Chinese entityMillion
USDSector Subsector
Indonesia China Railway Construction 1710 Energy Hydro
Indonesia China JinJiang Environment 110 EnergyRenewable
not specified
Indonesia China Energy Engineering 560 Energy Hydro
Israel Power Construction Corp 260 Energy Hydro
Ivory Coast Power Construction Corp 350 Energy Hydro
Kazakhstan Power Construction Corp 340 EnergyRenewable
not specified
Kazakhstan Power Construction Corp 160 EnergyRenewable
not specified
Kenya Power Construction Corp 130 EnergyRenewable
not specified
Kenya Sinomach 220 EnergyRenewable
not specified
Kenya Jiangxi Zhongmei 140 EnergyRenewable
not specified
KenyaJiangxi International Economic and Technical
Cooperation130 Energy
Renewable
not specified
Kenya China Energy Engineering 360 Energy Hydro
Kenya Power Construction Corp, State Grid 100 EnergyRenewable
not specified
Kuwait Sinomach 100 EnergyRenewable
not specified
Laos Norinco 180 Energy Hydro
Laos Power Construction Corp 120 Energy Hydro
Laos Power Construction Corp 210 Energy Hydro
Laos Power Construction Corp 720 Energy Hydro
Laos Power Construction Corp 270 Energy Hydro
Laos Power Construction Corp 1190 Energy Hydro
Laos Sinomach 310 Energy Hydro
Laos Power Construction Corp 2030 Energy Hydro
Laos Hebei Construction 140 Energy Hydro
Laos Hebei Construction and Investment Group 140 Energy Hydro
Laos Yunnan Energy Investment 160 Energy Hydro
Laos State Development and Investment Corp 310 Energy Hydro
Laos Power Construction Corp 110 Energy Hydro
Madagascar Power Construction Corp 270 Energy Hydro
Malaysia Jinko Solar 100 EnergyRenewable
not specified
Malaysia China General Nuclear 100 EnergyRenewable
not specified
Malaysia Xian Longi 240 EnergyRenewable
not specified
DECARBONIZING THE BELT AND ROAD - A GREEN FINANCE ROADMAP
48
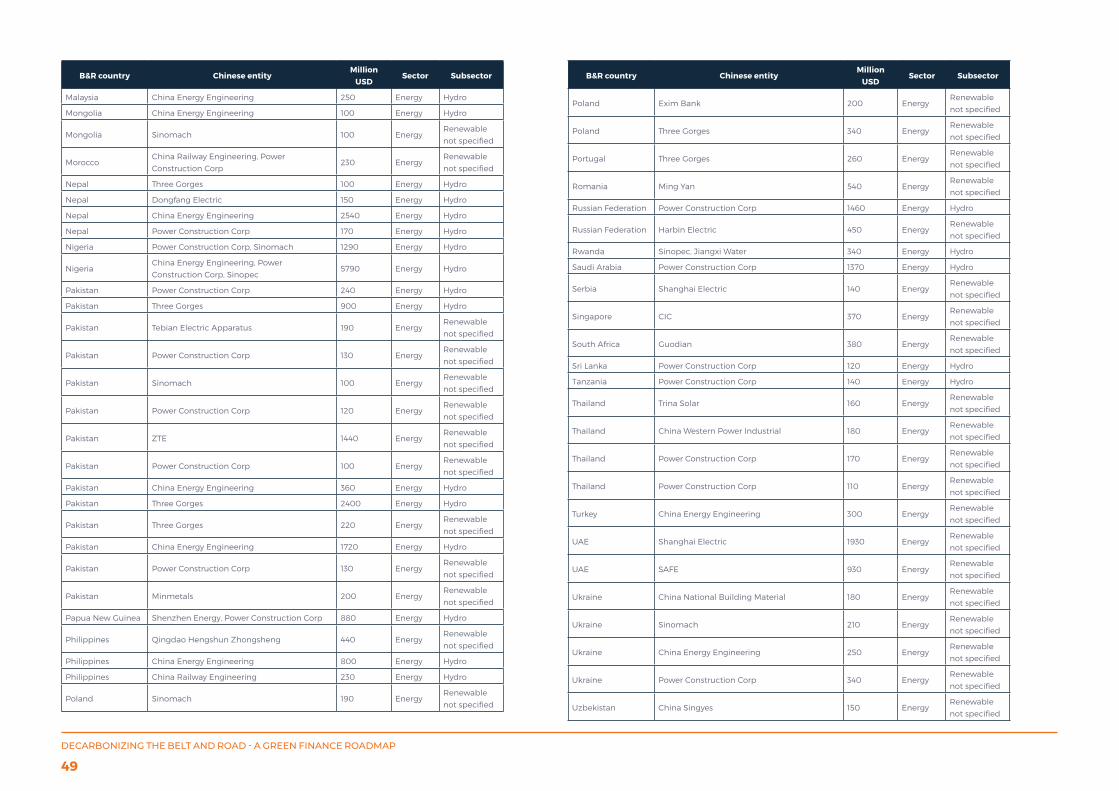
B&R country Chinese entityMillion
USDSector Subsector
Malaysia China Energy Engineering 250 Energy Hydro
Mongolia China Energy Engineering 100 Energy Hydro
Mongolia Sinomach 100 EnergyRenewable
not specified
MoroccoChina Railway Engineering, Power
Construction Corp230 Energy
Renewable
not specified
Nepal Three Gorges 100 Energy Hydro
Nepal Dongfang Electric 150 Energy Hydro
Nepal China Energy Engineering 2540 Energy Hydro
Nepal Power Construction Corp 170 Energy Hydro
Nigeria Power Construction Corp, Sinomach 1290 Energy Hydro
NigeriaChina Energy Engineering, Power
Construction Corp, Sinopec5790 Energy Hydro
Pakistan Power Construction Corp 240 Energy Hydro
Pakistan Three Gorges 900 Energy Hydro
Pakistan Tebian Electric Apparatus 190 EnergyRenewable
not specified
Pakistan Power Construction Corp 130 EnergyRenewable
not specified
Pakistan Sinomach 100 EnergyRenewable
not specified
Pakistan Power Construction Corp 120 EnergyRenewable
not specified
Pakistan ZTE 1440 EnergyRenewable
not specified
Pakistan Power Construction Corp 100 EnergyRenewable
not specified
Pakistan China Energy Engineering 360 Energy Hydro
Pakistan Three Gorges 2400 Energy Hydro
Pakistan Three Gorges 220 EnergyRenewable
not specified
Pakistan China Energy Engineering 1720 Energy Hydro
Pakistan Power Construction Corp 130 EnergyRenewable
not specified
Pakistan Minmetals 200 EnergyRenewable
not specified
Papua New Guinea Shenzhen Energy, Power Construction Corp 880 Energy Hydro
Philippines Qingdao Hengshun Zhongsheng 440 EnergyRenewable
not specified
Philippines China Energy Engineering 800 Energy Hydro
Philippines China Railway Engineering 230 Energy Hydro
Poland Sinomach 190 EnergyRenewable
not specified
B&R country Chinese entityMillion
USDSector Subsector
Poland Exim Bank 200 EnergyRenewable
not specified
Poland Three Gorges 340 EnergyRenewable
not specified
Portugal Three Gorges 260 EnergyRenewable
not specified
Romania Ming Yan 540 EnergyRenewable
not specified
Russian Federation Power Construction Corp 1460 Energy Hydro
Russian Federation Harbin Electric 450 EnergyRenewable
not specified
Rwanda Sinopec, Jiangxi Water 340 Energy Hydro
Saudi Arabia Power Construction Corp 1370 Energy Hydro
Serbia Shanghai Electric 140 EnergyRenewable
not specified
Singapore CIC 370 EnergyRenewable
not specified
South Africa Guodian 380 EnergyRenewable
not specified
Sri Lanka Power Construction Corp 120 Energy Hydro
Tanzania Power Construction Corp 140 Energy Hydro
Thailand Trina Solar 160 EnergyRenewable
not specified
Thailand China Western Power Industrial 180 EnergyRenewable
not specified
Thailand Power Construction Corp 170 EnergyRenewable
not specified
Thailand Power Construction Corp 110 EnergyRenewable
not specified
Turkey China Energy Engineering 300 EnergyRenewable
not specified
UAE Shanghai Electric 1930 EnergyRenewable
not specified
UAE SAFE 930 EnergyRenewable
not specified
Ukraine China National Building Material 180 EnergyRenewable
not specified
Ukraine Sinomach 210 EnergyRenewable
not specified
Ukraine China Energy Engineering 250 EnergyRenewable
not specified
Ukraine Power Construction Corp 340 EnergyRenewable
not specified
Uzbekistan China Singyes 150 EnergyRenewable
not specified
DECARBONIZING THE BELT AND ROAD - A GREEN FINANCE ROADMAP
49
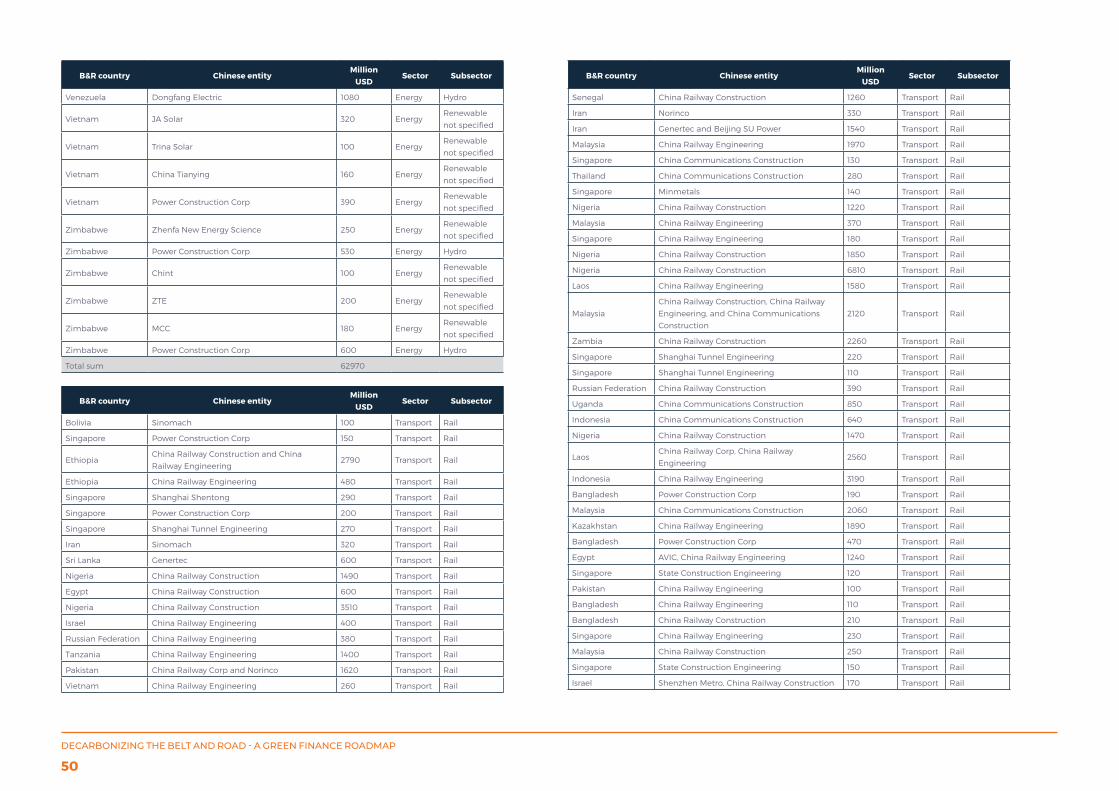
B&R country Chinese entityMillion
USDSector Subsector
Venezuela Dongfang Electric 1080 Energy Hydro
Vietnam JA Solar 320 EnergyRenewable
not specified
Vietnam Trina Solar 100 EnergyRenewable
not specified
Vietnam China Tianying 160 EnergyRenewable
not specified
Vietnam Power Construction Corp 390 EnergyRenewable
not specified
Zimbabwe Zhenfa New Energy Science 250 EnergyRenewable
not specified
Zimbabwe Power Construction Corp 530 Energy Hydro
Zimbabwe Chint 100 EnergyRenewable
not specified
Zimbabwe ZTE 200 EnergyRenewable
not specified
Zimbabwe MCC 180 EnergyRenewable
not specified
Zimbabwe Power Construction Corp 600 Energy Hydro
Total sum 62970
B&R country Chinese entityMillion
USDSector Subsector
Bolivia Sinomach 100 Transport Rail
Singapore Power Construction Corp 150 Transport Rail
EthiopiaChina Railway Construction and China
Railway Engineering2790 Transport Rail
Ethiopia China Railway Engineering 480 Transport Rail
Singapore Shanghai Shentong 290 Transport Rail
Singapore Power Construction Corp 200 Transport Rail
Singapore Shanghai Tunnel Engineering 270 Transport Rail
Iran Sinomach 320 Transport Rail
Sri Lanka Genertec 600 Transport Rail
Nigeria China Railway Construction 1490 Transport Rail
Egypt China Railway Construction 600 Transport Rail
Nigeria China Railway Construction 3510 Transport Rail
Israel China Railway Engineering 400 Transport Rail
Russian Federation China Railway Engineering 380 Transport Rail
Tanzania China Railway Engineering 1400 Transport Rail
Pakistan China Railway Corp and Norinco 1620 Transport Rail
Vietnam China Railway Engineering 260 Transport Rail
B&R country Chinese entityMillion
USDSector Subsector
Senegal China Railway Construction 1260 Transport Rail
Iran Norinco 330 Transport Rail
Iran Genertec and Beijing SU Power 1540 Transport Rail
Malaysia China Railway Engineering 1970 Transport Rail
Singapore China Communications Construction 130 Transport Rail
Thailand China Communications Construction 280 Transport Rail
Singapore Minmetals 140 Transport Rail
Nigeria China Railway Construction 1220 Transport Rail
Malaysia China Railway Engineering 370 Transport Rail
Singapore China Railway Engineering 180 Transport Rail
Nigeria China Railway Construction 1850 Transport Rail
Nigeria China Railway Construction 6810 Transport Rail
Laos China Railway Engineering 1580 Transport Rail
Malaysia
China Railway Construction, China Railway
Engineering, and China Communications
Construction
2120 Transport Rail
Zambia China Railway Construction 2260 Transport Rail
Singapore Shanghai Tunnel Engineering 220 Transport Rail
Singapore Shanghai Tunnel Engineering 110 Transport Rail
Russian Federation China Railway Construction 390 Transport Rail
Uganda China Communications Construction 850 Transport Rail
Indonesia China Communications Construction 640 Transport Rail
Nigeria China Railway Construction 1470 Transport Rail
LaosChina Railway Corp, China Railway
Engineering2560 Transport Rail
Indonesia China Railway Engineering 3190 Transport Rail
Bangladesh Power Construction Corp 190 Transport Rail
Malaysia China Communications Construction 2060 Transport Rail
Kazakhstan China Railway Engineering 1890 Transport Rail
Bangladesh Power Construction Corp 470 Transport Rail
Egypt AVIC, China Railway Engineering 1240 Transport Rail
Singapore State Construction Engineering 120 Transport Rail
Pakistan China Railway Engineering 100 Transport Rail
Bangladesh China Railway Engineering 110 Transport Rail
Bangladesh China Railway Construction 210 Transport Rail
Singapore China Railway Engineering 230 Transport Rail
Malaysia China Railway Construction 250 Transport Rail
Singapore State Construction Engineering 150 Transport Rail
Israel Shenzhen Metro, China Railway Construction 170 Transport Rail
DECARBONIZING THE BELT AND ROAD - A GREEN FINANCE ROADMAP
50
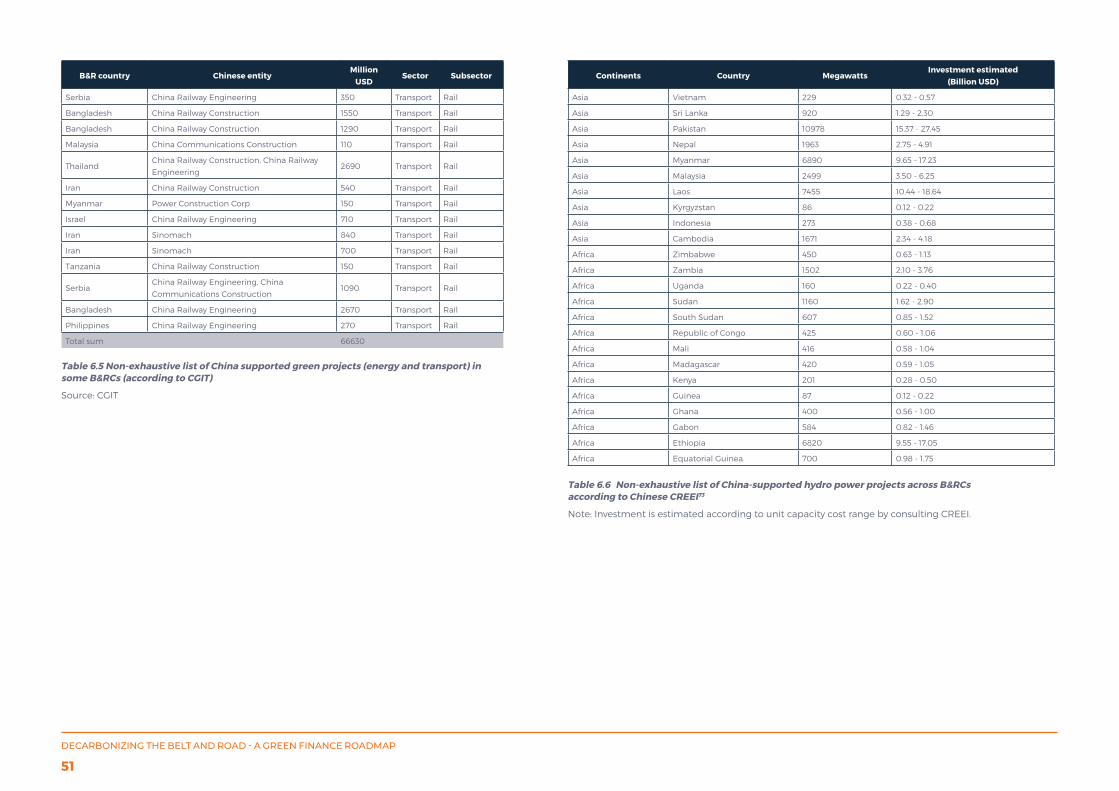
B&R country Chinese entityMillion
USDSector Subsector
Serbia China Railway Engineering 350 Transport Rail
Bangladesh China Railway Construction 1550 Transport Rail
Bangladesh China Railway Construction 1290 Transport Rail
Malaysia China Communications Construction 110 Transport Rail
ThailandChina Railway Construction, China Railway
Engineering2690 Transport Rail
Iran China Railway Construction 540 Transport Rail
Myanmar Power Construction Corp 150 Transport Rail
Israel China Railway Engineering 710 Transport Rail
Iran Sinomach 840 Transport Rail
Iran Sinomach 700 Transport Rail
Tanzania China Railway Construction 150 Transport Rail
SerbiaChina Railway Engineering, China
Communications Construction1090 Transport Rail
Bangladesh China Railway Engineering 2670 Transport Rail
Philippines China Railway Engineering 270 Transport Rail
Total sum 66630
Table 6.6 Non-exhaustive list of China-supported hydro power projects across B&RCs according to Chinese CREEI73
Note: Investment is estimated according to unit capacity cost range by consulting CREEI.
Continents Country MegawattsInvestment estimated
(Billion USD)
Asia Vietnam 229 0.32 - 0.57
Asia Sri Lanka 920 1.29 - 2.30
Asia Pakistan 10978 15.37 - 27.45
Asia Nepal 1963 2.75 - 4.91
Asia Myanmar 6890 9.65 - 17.23
Asia Malaysia 2499 3.50 - 6.25
Asia Laos 7455 10.44 - 18.64
Asia Kyrgyzstan 86 0.12 - 0.22
Asia Indonesia 273 0.38 - 0.68
Asia Cambodia 1671 2.34 - 4.18
Africa Zimbabwe 450 0.63 - 1.13
Africa Zambia 1502 2.10 - 3.76
Africa Uganda 160 0.22 - 0.40
Africa Sudan 1160 1.62 - 2.90
Africa South Sudan 607 0.85 - 1.52
Africa Republic of Congo 425 0.60 - 1.06
Africa Mali 416 0.58 - 1.04
Africa Madagascar 420 0.59 - 1.05
Africa Kenya 201 0.28 - 0.50
Africa Guinea 87 0.12 - 0.22
Africa Ghana 400 0.56 - 1.00
Africa Gabon 584 0.82 - 1.46
Africa Ethiopia 6820 9.55 - 17.05
Africa Equatorial Guinea 700 0.98 - 1.75
Table 6.5 Non-exhaustive list of China supported green projects (energy and transport) in some B&RCs (according to CGIT)
Source: CGIT
DECARBONIZING THE BELT AND ROAD - A GREEN FINANCE ROADMAP
51
SELECTED BIBLIOGRAPHY Bloomberg New Energy Finance (2019). Clean Energy Investment Trends Report. https://about.bnef.com/clean-energy-investment/
Bloomberg New Energy Finance (2017). Electric Cars to Reach Price Parity by 2025. https://about.bnef.com/blog/electric-cars-reach-price-parity-2025/
CSIS. (2018). How Big Is China’s Belt and Road? Retrieved from https://www.csis.org/analysis/how-big-chinas-belt-and-road
EEA (2010). Occupancy rates in passenger transport. https://www.eea.europa.eu/data-and-maps/figures/term29-occupancy-rates-in-passenger-transport
European ComissionCommission (2015). Study on the Cost and Contribution of the Rail Sector https://ec.europa.eu/transport/sites/transport/files/modes/rail/studies/doc/2015-09-study-on-the-cost-and-contribution-of-the-rail-sector.pdf
Hayward, J. A., & Graham, P. W. (2017). Electricity generation technology cost projections 2017-2050. Retrieved from https://publications.csiro.au/rpr/download?pid=csiro:EP178771&dsid=DS2
IAMC & IIASA. (2018). IAMC 1.5°C Scenario Explorer hosted by IIASA (release 1.0). http://doi.org/10.22022/SR15/08-2018.15429
ICCT (2017). Emerging Best Practices for Electric Vehicle Charging Infrastructure. https://www.theicct.org/sites/default/files/publications/EV-charging-best-practices_ICCT-white-paper_04102017_vF.pdf
IEA. (2015). Projected Costs of Generating Electricity 2015 Edition. Retrieved from https://www.oecd-nea.org/ndd/pubs/2015/7057-proj-costs-electricity-2015.pdf
IEA. (2017). Energy Technology Perspectives 2017. Retrieved from https://www.iea.org/etp2017/
IEA. (2018a). CO2 Emissions from Fuel Combustion. Retrieved from https://www.iea.org/statistics/co2emissions/
IEA. (2018b). IEA World Energy Balances. Retrieved from https://www.iea.org/statistics/relateddatabases/worldenergystatisticsandbalances/
Mankiw, N. G., Romer, D., & Weil, D. N. (1992). A Contribution to the Empirics of Economic Growth. The Quarterly Journal of Economics, (May). Retrieved from https://eml.berkeley.edu/~dromer/papers/MRW_QJE1992.pdf
The World Bank. (2018). Gross capital formation (% of GDP). Retrieved from http://data.worldbank.org/indicator/NE.GDI.TOTL.ZS?view=chart
World Bank. The cost of air pollution: strengthening the economic case for action. Washington: World Bank Group, 2016.
International Union of Railways (2015). Analysis of Regional Differences in Global Rail Projects by Cost, Length and Project stage. https://uic.org/IMG/pdf/analysis_of_global_rail_infrastructure_investment.pdf
U.S. Energy Information Administration. (2018). Capacity Factors for Utility Scale Generators Primarily Using Fossil Fuels, January 2013-August 2018. Retrieved from https://www.eia.gov/electricity/monthly/epm_table_grapher.php?t=epmt_6_07_a
US Federal Highway Administration (2018). Annual Average Miles per Driver by Age Group. https://www.fhwa.dot.gov/ohim/onh00/bar8.htm
UNEP. (2018). Shifting the Lens. Retrieved from http://www.oecd.org/environment/cc/climate-futures/interim-briefing-shifting-the-lens-financing-climate-futures-un-environment.pdf
United Nations DESA. (2017). 2017 Revision of World Population Prospects. Retrieved from https://population.un.org/wp
DECARBONIZING THE BELT AND ROAD - A GREEN FINANCE ROADMAP
52
ENDNOTES1 BAU scenario is created by applying the average
historical growth patterns (from the full set of 143 countries we have data for) to the B&RCs – essentially it says what if the B&RCs continue to grow as the world has previously.
2 ‘Worst in class’ growth represents the most carbon intense growth pathways seen in history.
3 ‘Best in class’ growth represents the most carbon efficient growth pathways seen in history.
4 Estimated based on CGIT database.5 Investment timeframe covers 2016 – 2030.6 There is no official list of B&R countries as the
geographical coverage of them is evolving over time – this number considers countries which have signed bilateral agreements, based on publicly available information, with China on collaboration under the BRI.
7 These countries were: Bangladesh, Egypt, Indonesia, Iran, Kazakhstan, Malaysia, Mongolia, Myanmar, Pakistan, Philippines, Russia, Saudi Arabia, Singapore, Sri Lanka, Thailand, Ukraine and Vietnam.
8 CGIT: China Global Investment Tracker -- http://www.aei.org/china-global-investment-tracker/
9 Rehman, C.A., et al., The impact of infrastructure on foreign direct investment: The case of Pakistan. International Journal of Business and Management, 2011. 6(5): p. 268.
10 Ngangue, 2016, Infrastructure factors of foreign direct investment attraction in developing countries.
11 These studies include Ngangue 2016, Rehman et al. 2011, Donaubauer et al., 2016b, Ogunjimi et al.2017, Bakar et al. 2012, Zeb et al. 2014.
12 The IEA provides historical data which we then use to create our model and generate the forecasts for the 17 key countries.
13 The capacity factor is a ratio of the actual electrical output over a given period to the maximum possible electrical energy output over that period. E.g. if a 5MW wind turbine produces 2MWh of power in an hour, then its capacity factor is 40%.
14 List the top six countries with expression of “over 10% of total Gross Capital Formation”.
15 CGIT database is a comprehensive dataset covering China’s global investment and construction, which are documented both separately and together. Inaugurated in 2005, the CGIT now includes 3100 large transactions across energy, transportation, real estate, and other industries. The full list includes the amount, Chinese parent company, host country, and sector. The projects defined as BRI projects are based on two criteria: first, it must have been launched/signed after 2013 (including 2013); second, the projects must be hosted by a B&R country. Link: http://www.aei.org/china-global-investment-tracker/.
16 According to the CGIT dataset and China CREEI (creei.cn/), CREEI’s data only count hydro power plants.
17 Investment timeframe covers 2016 - 203018 http://unepinquiry.org/wp-content/uploads/2017/07/2017_
GFSG_Synthesis_Report_EN.pdf 19 http://ydyl.people.com.cn/n1/2017/0420/c411837-29225243.
html, author’s estimate 20 See NGFS Secretariat, https://www.banque-france.fr/en/
financial-stability/international-role/network-greening-financial-system/about-us#tabs-item-10893
21 UN Environment Inquiry, Green Finance Progress Report 2017 http://unepinquiry.org/wp-content/uploads/2017/07/Green_Finance_Progress_Report_2017.pdf , after South Korea released its National Strategy for Green Growth and Five,Year Plan for Green Growth in 2009, it established the First Climate Change Response Master Plan in December 2016. Among the developing countries, Vietnam’s Green Growth Strategy provides a pathway to achieve its NDC goals. It also recognizes that private investment will play a significant role (70% of total financing needed) in meeting Vietnam’s demand for green growth. Most recently, Mongolia’s National Green Development Policy takes the effort further by clearly linking environmental, economic and social concerns. Cambodia’s National Green Growth Road Map (2009) is an initial attempt to outline the possibilities for greening economic growth.
22 http://unepinquiry.org/wp-content/uploads/2016/09/The_Financial_System_We_Need_From_Momentum_to_Transformation.pdf
23 For example, Bangladesh issued the Environmental and Social Due Diligence Risk Assessment Tool and exclusion lists, whereas Mongolia and Indonesia issued sector guidelines. Reporting and measurement approaches are also introduced in some countries to monitor the implementation results, for example, in Bangladesh, Indonesia, Mongolia and Vietnam.
24 IFC website. Sustainable banking Network -Guidance from SBN Members. Link: https://www.ifc.org/wps/wcm/connect/topics_ext_content/ifc_external_corporate_site/sustainability-at-ifc/company-resources/sustainable-finance/sbn_guidancefrommembers, accessed between 22Jul 2018 and 30 Aug 2018.
25 Countries like Egypt, Jordon, Kyrgyzstan, Laos, Philippines, Sri Lanka, and Thailand are in the process of developing such guidelines.
26 SBN, 2018. Global Progress Report.27 Globally, the most widely accepted standards are Green
Bond Principles (GBP) coordinated by the International Capital Market Association (ICMA), and Climate Bonds Standard (CBS) developed by the Climate Bonds Initiative (CBI).
28 IFC, 2016. Green Finance: A bottom-up approach to track existing flows.
29 According to the IFC report, the difference between the US and other countries may be due to the large size of the US loan market overall and a potential bias in the dataset containing more information about the US than other geographic areas.
30 Data source: IFC, 2016. Green Finance: A bottom-up approach to track existing flows.
31 Data source: IFC, 2016. Green Finance: A bottom-up approach to track existing flows.
32 Bangladesh Bank, 2017. Annual Report.33 https://new.qq.com/omn/20190113/20190113A0GSL2.html34 CBI website, www.climatebonds.net, access between 20
July 2018 and 7 August 2018.35 Green bond here refers to those aligned with CBI
definitions. There are some sustainability bonds or green bonds issued but not included in these figures because their proceeds are used in social sustainability or other green sectors that are not aligned with the CBI definition, for example, bonds issued by Thailand’s TMB Bank and Turkey’s development bank TSKB.
36 ‘Green bond’ here refers to those aligned with CBI definitions. There are some sustainability bonds or green bonds issued but not included in these figures because their proceeds are used in social sustainability or other green sectors that are not aligned with CBI definition, for example, bonds issued by Thailand’s TMB Bank and Turkey’s development bank TSKB.
37 Debtnews.Today, 2018. KEYPOINTS- Indonesia’s new regulation on green bond issuance. Link: http://debtnews.today/index.php/2018/01/09/key-facts-ojk-financial-services-authority-indonesia-introduced-new-regulations-issue-green-bond/, accessed on 19 July 2018.
38 Moroccan Capital Market Authority, 2017. Green Bonds Guidelines.
39 Borsa Italiana website. https://www.borsaitaliana.it/obbligazioni/greenbondsbridge/accediallalista.en.htm. Accessed on 29 April 2019.
40 Due to limited data on environment/climate related funds, this section broadens the range and looks into sustainable funds.
41 GSIA, 2017. 2016 Global Sustainability Investment Review.42 Asia ex Japan includes markets: Bangladesh, China, Hong
Kong, India, Indonesia, Malaysia, Pakistan, Philippines, Singapore, South Korea, Taiwan, Thailand and Vietnam.
43 OJK, 2013. Technical Advisory for Financial Institution on Sustainable Banking through Mobilising Resources, Solution and Tools.
44 IFC, 2011. Public Private Partnerships: Accelerating the growth of climate-related private equity investment.
45 Including PE/VC investment in clean technology development, clean power infrastructure, energy efficiency, land use and forestry, and transport infrastructure, etc.
46 PRI website. Link: www.unpri.org. Accessed between 5 Sep 2018 and 20 Sep 2018.
47 Morningstar, 2018. Passive Sustainable Funds: The Global Landscape.
48 SSE website. Link: http://www.sseinitiative.org. Accessed between 20 Jul 2018 and 12 Sep 2018.
49 Volz, U., Fostering Green Finance for Sustaining Development in Asia. 2018.
50 Source: World Bank, State and Trends of Carbon Pricing 2018.
51 Source: ICAP ETS Map https://icapcarbonaction.com/en/ets-map.
52 Source: Singapore Budget, Budget 2017: Moving Forward Together, February 20, 2017.
53 Source: Government of Singapore, Climate Change Strategy and Carbon Pricing, March 20, 2017.
54 Source: http://ambiente.gob.ar/noticias/argentina-participodel-dialogo-sobre-instrumentos-de-precio-al-carbono-en-las-americas/.
55 Source: PMR Annual report https://www.thepmr.org/content/annual-report.
56 ASrIA, 2014. 2014 Asia Sustainable Investment Review.57 Oliver Wyman & AVPN, 2018. Driving ESG Investing in
Asia.58 WWF, 2017. Sustainable Banking in ASEAN: Addressing
ASEAN’s forests, landscapes, climate, water, societies.59 UNEP Inquiry, 2017. Green Finance Opportunities in
ASEAN.60 SBN, 2017. Greening the Banking System – Experience
from the Sustainable Banking Network.61 UNEP Inquiry, ASrIA & IFC, 2015. Towards a Sustainable
Financial System in Indonesia.
62 Schroders, 2017. Schroders Institutional Investor Study: Institutional Perspective on Sustainable Investing 2017.
63 Chen, Y., et al., Evidence on the impact of sustained exposure to air pollution on life expectancy from China’s Huai River policy. Proceedings of the National Academy of Sciences, 2013. 110(32): p. 12936-12941.
64 WHO website: https://public.wmo.int/en/media/press-release/wmo-and-who-tackle-health-impacts-of-pollution-extreme-weather-climate-change.
65 World Bank, The cost of air pollution: strengthening the economic case for action. Washington: World Bank Group, 2016.
66 Stern, N. and N.H. Stern, The economics of climate change: The Stern review. 2007: Cambridge University press.
67 PRA Bank of England, The impact of climate change on the UK insurance sector. 2015, Bank of England: London.
68 Dutch National Bank, An exploration of climate-related risks for the Dutch financial sector. 2017, Dutch National Bank: Amsterdam.
69 Schellekens, G. and J. van Toor, Value at risk? Sustainability risks and goals in the Dutch financial sector. 2019, DeNederlandscheBank: Amsterdam.
70 See http://unepinquiry.org/wp-content/uploads/2016/09/Synthesis_Report_Full_EN.pdf.
71 WEF: Could infrastructure investment help tackle climate change?,change, link: https://www.weforum.org/agenda/2016/02/could-infrastructure-investment-help-tackle-climate-change/.
72 Estimated on the basis of 2016 Global Sustainable Investment Review.
73 Personal communication with CREEI, link: www.creei.cn.74 These 17 key countries were identified by Tsinghua Center
for Finance and Development (CFD) and the quantitative modelling work was focused on these countries throughout – they are Bangladesh, Egypt, Indonesia, Iran, Kazakhstan, Malaysia, Mongolia, Myanmar, Pakistan, Philippines, Russia, Saudi Arabia, Singapore, Sri Lanka, Thailand, Ukraine and Vietnam – see Section 1 for further details on country selection.
75 There is no official list of B&R countries, as the geographical coverage of the B&RCs is evolving over time. This list of 126 countries is compiled based on the country list with which China has signed MoUs, according to the Chinese official website of “Belt & Road”: https://www.yidaiyilu.gov.cn/gbjg/gbgk/77073.htm with an access on 12th April.
76 This was calculated by applying the BAU carbon emissions trend from the analysis on the 17 key B&R countries to the entire set of carbon emissions from the extended list of 126 BRI countries.
77 The definition of average historical growth patterns is explicitly given in the description of the methodology provided in the technical report supplementary to this main report.
78 World Bank, The cost of air pollution: strengthening the economic case for action. Washington: World Bank Group, 2016.
DECARBONIZING THE BELT AND ROAD - A GREEN FINANCE ROADMAP
53
PARTNER ORGANISATIONS The Center for Finance and Development, led by Dr. Ma Jun and established under Tsinghua National Institute of Financial Research, is dedicated to studying practical issues related to macroeconomy and finance and to providing recommendations for economic and financial policy makers. The Center aims to be an important think tank and play an active role in international dialogues on economic and financial issues. In addition to long-term themes, the Center also works with government agencies, regulators and financial institutions on research projects, and supports the work of the People’s Bank of China (PBoC). Research priorities of the Center for the next few years include, among others, financial risk analysis, monetary policy, green finance, investment and financing mechanisms, and Belt & Road Initiative.
Tsinghua University: www.pbcsf.tsinghua.edu.cn
Vivid Economics generates lasting benefit for business and society by putting economics to good use. Using robust economic tools to tackle critical strategy issues confronting business and government, and working with a variety of clients and partners, they create solutions for the common good. Vivid Economics leverages a suite of analytic tools and broad expertise in macro and sector level modelling and econometrics to measure impact and efficiency of commercial and policy initiatives, analyse investment decisions under uncertain future scenarios and design and implement business and public strategies. Their work synthesises deep and rigorous analysis to draw out lucid answers to complex questions.
Vivid Economics: www.vivideconomics.com
ClimateWorks helps climate leaders and philanthropists come together to be more strategic, efficient, and effective in their response to global climate change. They are a collaborative team of researchers, strategists, and grantmakers committed to the mission of mobilizing philanthropy to solve the climate crisis and ensure a prosperous future. Since 2008, ClimateWorks has provided $1B in grants to organizations around the world focused on solving climate change. For more information about their programs, grantmaking, and partnerships,
Climateworks: www.climateworks.org