Embed Size (px)
Citation preview
APPLIED AND ENVIRONMENTAL MICROBIOLOGY, June 1985, p. 1482-14870099-2240/85/061482-06$02.00/0Copyright C 1985, American Society for Microbiology
Separation and Purification of Bacteria from SoilLARS R. BAKKEN
Department of Microbiology, Agricultural University of Norway, 1432 Aas-NLH, Norway
Received 4 September 1984/Accepted 11 February 1985
Bacteria were released and separated from soil by a simple blending-centrifugation procedure. The percentyield of bacterial cells (microscopic counts) in the supernatants varied over a wide range depending on the soiltype. The superantants contained large amounts of noncellular organic material and clay particles. Furtherpurification of the bacterial cells was obtained by centrifugation in density gradients, whereby the clay particlesand part of the organic materials sedimented. A large proportion of the bacteria also sedimented through thedensity gradient, showing that they had a buoyant density above 1.2 g/ml. Attachment to clay minerals andhumic material may account for this apparently high buoyant density. The percent yield of cells was negativelycorrelated with the clay content of the soils, whereas the purity was positively correlated with it. The cell sizedistribution and the relative frequency of colony-forming cells were similar in the soil homogenate, thesupernatants after blending-centrifugation, and the purified bacterial fraction. In purified bacterial fractionfrom a clay loam, the microscopically measured biomass could account for 20 to 25% of the total C and 30 to40% of the total N as cellular C and N. The amount of cellular C and N may be higher, however, owing to anunderestimation of the cell diameter during fluorescence. A part of the contamination could be ascribed toextracellular structures as well as partly decayed cells, which were not revealed by fluorescence microscopy.
Separation of bacteria from soil has been used previouslyin investigations of bacterial respiratory activity (10), elec-tron microscopic studies (3, 5, 14), DNA studies (18), andfluorescent antibody studies (21). However, the purity ofthese bacterial fractions was not investigated quantitatively.The aim of the work described in this paper was to investi-gate the possibility of separating a representative and essen-tially pure fraction of bacterial cells from a soil sample, thusenabling us to perform experiments with indigenous soilbacteria which would otherwise be precluded by the pres-ence of soil particles. As such, the method has been appliedto electron microscopic studies and experiments on theseparation of soil bacteria according to cell diameter byfiltration through polycarbonate membranes (R. A. Olsenand L. R. Bakken, Abstr. Third Int. Symp. Microb. Ecol., p.64 and 81, 1983). It has also been used to obtain roughestimates of bacterial uptake of labeled C and N added tosoil (L. R. Bakken, Ph.D. thesis, Agricultural University ofNorway, Aas, Norway, 1983).
MATERIALS AND METHODS
Three different soils were collected from two cultivatedfields and a spruce forest near the Agricultural University atAas, Norway. The soil samples were maintained at fieldmoisture content, crushed to pass through a 2-mm-mesh-sizescreen, and stored at 5°C. The soil characteristics are shownin Table 1. The clay loam (CL) was used in all the separationexperiments. The other soils were included in some of theexperiments to obtain information about the general appli-cability of the results.
Cells were released and separated from larger soil parti-cles by repeated blending-centrifugation steps as describedby Faegri et al. (10), with small modifications (Fig. 1). Threedifferent homogenizers were tried during the development ofthe method: the Waring blender (Waring, New Hartford,Conn.) the Braun Melsungen cell homogenizer (no. 853032),and the Ilado X 10/20 homogenizer (In. Labor Gmbh,Ballrechten-Dottingen, Federal Republic of Germany). Thesoil samples were homogenized in a dilution medium (water,
detergent, or buffer solutions at 10 to 15 ml/g of soil). Thedetergents and buffer-salt solutions used were 0.22% sodiumhexametaphosphate buffered to pH 8.5 with Na2CO3 (Calgon)(17), 0.3% sodium pyrophosphate (5), Winogradsky saltsolution (15), 0.2% bromhexinchloride (Bisolvon; Nyco,Oslo, Norway), and 0.5% Tween 80 (6). In one experiment,acidification to pH 3 (with acetic acid and H2SO4) andaddition of CaC12 (16) were tried as methods to selectivelyflocculate clay minerals before sedimentation of the coarseparticles.The soil homogenate was centrifuged for 15 min to sedi-
ment large particles. A swing-out rotor was used, and thecentrifugal force was 630 to 1,060 x g at the top and thebottom of the liquid (depth, 10 cm), respectively. Thetemperature was 10 to 15°C during homogenization andcentrifugation. The first supernatant (S1) was decanted, andthe residue (RS1) was subjected to repeated blending-cen-trifugation steps, resulting in a series of supernatants(S2,S3,. . .,Sn) and a final residue (RSn). The cells in thecombined supernatants were concentrated by centrifugation(10,000 x g for 20 min), resuspended in a small volume, andsaved for density gradient centrifugation.The density gradients were normally prepared from Ludox
HS 40 (Du Pont Co., Wilmington, Del.). A similar gradientmedium, Percoll (Pharmacia Fine Chemicals, Uppsala, Swe-den), was used in experiments which involved plate counting
TABLE 1. Characteristics of the soils
Amt of clay Cm C/NSoil type and plant cover (% [dry wt]) organic C CN pHH20(%[dry ratio
wt])CL from field with barley 23 3.0 10:1 5.5
SL from brown earth under 9 5.5 20:1 4.5spruce
OS from field with wheat 1-2 39 23:1 5.0
1482
Vol. 49, No. 6
on May 29, 2018 by guest
http://aem.asm
.org/D
ownloaded from
SEPARATION OF BACTERIA FROM SOIL 1483
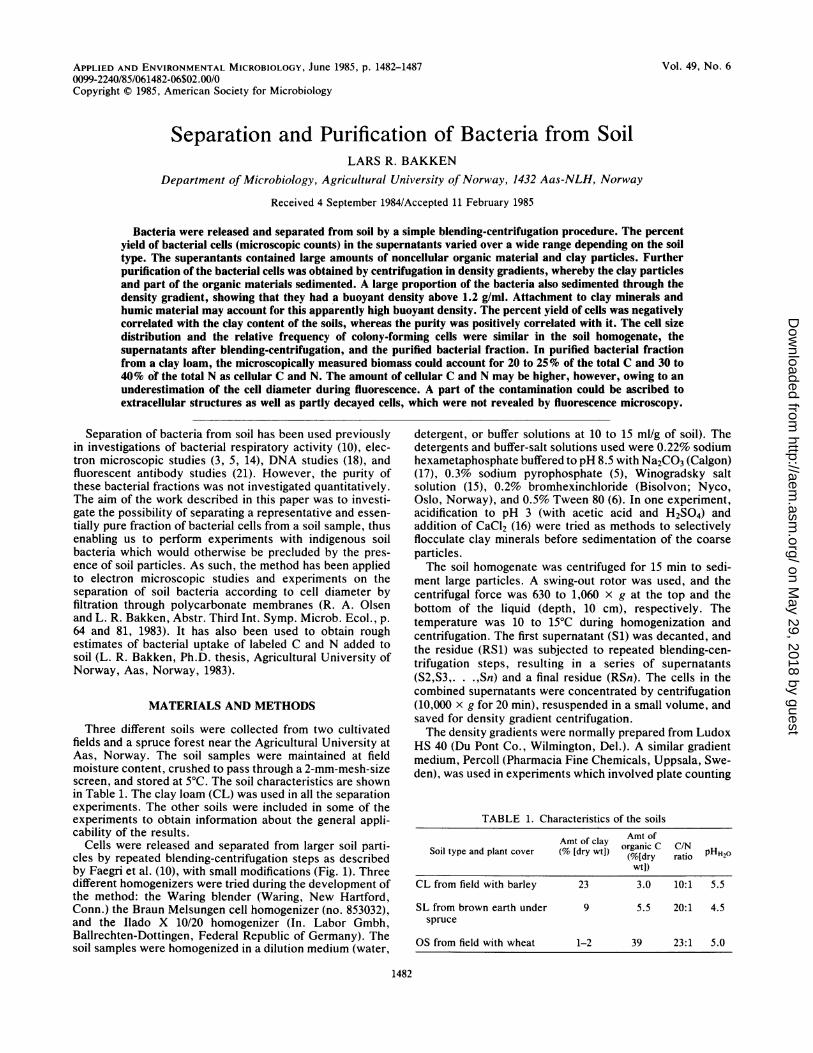
BLENDINGRelease of cels
CENTRIFUGATIONSedimentation of coarse particles
/# 1RESIDUES,RS SUPERNATANTS,S( 1 ),S(2), ...S(N)Blending/centrifugation From repeated blending/centrifugationrepeated
DENSITY CONCENTRATIONGRADIENT Cells sedimented andCENTRIFUGATION resuspended in a small volumePurified bacterial fraction (PBF)obtained by sedimentation ofparticles with high density
FIG. 1. General procedure for the release of cells by repeatedblending-centrifugation steps and purification by density gradientcentrifugation (see text for further explanations).
of bacteria. Both are colloidal silica solutions, but the silicaparticles in Percoll are covered by polyvinylpyrrolidone toremove their alleged toxicity (20). The pH of the silicasolutions was reduced to 7.0 by adding 1 N HCI. Vigorousstirring was necessary during the addition of HCI to avoidprecipitation of the silica particles. The density of thesolutions was regulated to 1.16 g/ml by adding filter-steri-lized distilled water (filtered through a 0.2-pum-pore-sizefilter), and the gradients were formed by centrifugation for30 to 40 min with a centrifugal force of 27,000 x g. Thesegradients were rather steep (from 1.0 to 1.14 g/ml) (Fig. 2).When loaded with bacterial suspension and centrifuged for 1h at 10,000 x g, the cells formed a narrow band in this region(1.0 to 1.14 g/ml), which was easily removed with a pipette.To observe the buoyant density of the cells accurately,gradients were formed from silica solutions with a density of1.07 g/ml, resulting in a broad bacterial band. Comparisonwith parallel gradients loaded with density marker beads(Pharmacia) yielded fairly accurate information about thebuoyant density of the cells (4).As an alternative to the colloidal silica solutions, met-
rizamide (Nyco) was tried as a density medium. The pH ofthe metrizamide solution was regulated to 7.0 by addingsmall amounts of 0.1 N NaOH. The tubes were half filledwith metrizamide solution (density, 1.28 g/ml), loaded withsoil bacterial suspension, and centrifuged for 1 h at 10,000 xg, resulting in a sharp band of bacterial cells at the meniscusbetween the metrizamide and the overlying liquid. To inves-tigate the buoyant density of bacterial cells from purecultures, stepwise gradients were prepared with densitiesranging from 1.05 to 1.30 g/ml.The purified bacterial suspensions recovered from the
density gradients contained density gradient material (silicaparticles or metrizamide) which was removed by dilution1:20 in filter-sterilized (0.2-p.m-pore-size filter) distilled wa-ter followed by sedimentation of the cells by centrifugationfor 20 min at 10,000 x g. The silica particles were only partlyremoved by this washing procedure, but the concentrationwas low enough to permit fluorescence microscopic count-ing (high concentration of silica particles caused clogging offilters and high background fluorescence). Chemical analysiswas only done on bacterial suspensions from Ludox gradi-
ents, because Ludox contained neglegible amounts of or-ganic materials.The yield of cells by the different procedures was investi-
gated by fluorescence microscopic counting (11) and sizemeasurements (13). The yield was also studied with respectto viable cells, counted as CFU on soil extract agar (64 mg ofK2HPO4, 36 mg of NaH2PO4, 10 mg of glucose, 10 mg ofxylose, 10 mg of peptone, 10 mg of yeast extract, 20 g ofagar, 400 ml of soil extract, 600 ml of distilled water).
Total C in bacterial suspensions was measured as CO2with an infrared CO2 analyzer (A. D. C., Hoddesdon,England) after wet-oxidation by the method of Allison et al.(1). Before oxidation, any CO2 present was removed byheating with 2 N H2SO4 containing 5% FeSO4 (2). Total Nwas measured as NH4' after digestion in H2SO4 (8).
Pure cultures of soil bacteria were used to obtain data onthe C and N content of bacterial cells. They were cultivatedin glucose-yeast extract broth, harvested, washed in distilledwater (4), dried at 105°C, and analyzed for total C and N.Protein content was measured as free a-amino acids afteracid hydrolysis. Free a-amino acids were measured as CO2evolution during the ninhydrin reaction.
RESULTSRelease of cells by blending-centrifugation. The different
homogenizers were compared in preliminary blending-cen-trifugation experiments with CL. The Ilado homogenizerwas unsuitable because the bearings were destroyed by thecoarse mineral particles. The Braun Melsungen cell dis-rupter, when operated for 3 min at half speed, gave the samepercent yield of cells in the supernatant as did the Waringblender when run for 3 min intervals. The Waring blenderwas chosen for the rest of the experiments. It was run forthree 1-min intervals with intermittent cooling in an ice bathas described by Faegri et al. (10). The Ilado homogenizerwas used for the resuspension of the bacterial pellet before
Density, g/ml
1p 1.1 1,2
Iw,.
..
m
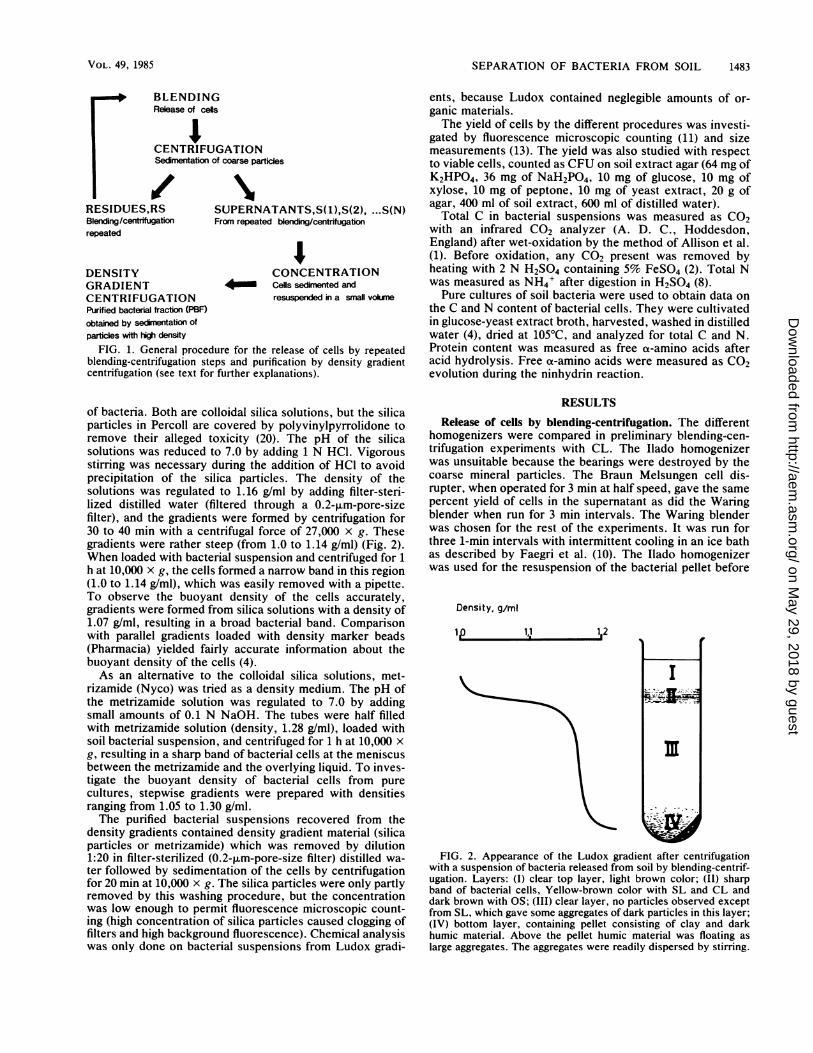
FIG. 2. Appearance of the Ludox gradient after centrifugationwith a suspension of bacteria released from soil by blending-centrif-ugation. Layers: (I) clear top layer, light brown color; (II) sharpband of bacterial cells, Yellow-brown color with SL and CL anddark brown with OS; (III) clear layer, no particles observed exceptfrom SL, which gave some aggregates of dark particles in this layer;(IV) bottom layer, containing pellet consisting of clay and darkhumic material. Above the pellet humic material was floating aslarge aggregates. The aggregates were readily dispersed by stirring.
VOL. 49, 1985
on May 29, 2018 by guest
http://aem.asm
.org/D
ownloaded from
APPL. ENVIRON. MICROBIOL.
density gradient centrifugation, since the Waring blenderwas not sufficiently effective for this purpose.The different dilution media were compared for blending-
centrifugation of CL. They gave nearly identical numbers ofcells in the supernatant (Si), i.e., 12 to 15% of the totalnumber of cells in the soil sample. Distilled water waschosen for further experiments. Flocculation of clay miner-als by acetic acid, H2SO4, or CaCl2 invariably resulted in avery low yield of cells in the supernatants (0.5 to 1.5% oftotal), and the flocculating agents were therefore not used infurther experiments. The amount of water per gram of soil inthe soil homogenate was varied from 10 to 50 ml/g in ablending-centrifugation experiment with CL. The yield in Siwas somewhat higher with 50 than with 10 ml/g (17 and 14%,respectively), but the difference was not statistically signif-icant. Thus, very little was gained by adding more waterthan 10 ml/g.The different soils gave a significantly different percent
yield of cells in the supernatants (Table 2), and the yield waslower in S2 than in Si for all soils.A sample of CL was subjected to eight repeated blending-
centrifugation steps (Table 3). A rough estimate of the sizedistribution of the cells was made by separately counting thenumber of bacteria within three different volume groups.The yield of cells gradually decreased from 1.6 x 10⁹ in Si to0.4 x 109 per g of soil (dry wt) in the last supernatant (S8).The residue contained 23% of the total number of cells in thesoil sample. The yield, if expressed as a percentage of thenumber of cells actually present in the homogenate beforeeach centrifugation, was remarkably constant (16, 12, 15, 17,14, 13, 15, and 13% in Si through S8, respectively).The percentage of the smallest cells (<0.5 ,um) was
slightly higher in Si through S4 than in S5 through S8 andRS8. An opposite trend was observed for the medium-sizedcells (0.5 to 0.8 ,um). The largest cells were counted withinthe same area as the others, and their estimated frequencywas therefore based on the observation of very few cells.Consequently, the estimates are inaccurate and should betreated with reservation.The relative frequency of larger cells was studied in more
detail in another experiment with CL. Seven volume groupswere included, and the counting area was regulated for eachgroup to obtain more reliable estimates of the frequency ofthe largest cells (13). Rods were included in the same sizegroups as cocci by volume. Only one blending-centrifugationstep was run. The previously observed tendency to anincreased frequency of the smallest cells in the supernatantwas not observed in this experiment (Table 4). The relativefrequency of the size groups 1 and 2 was roughly the same inthe supernatant as in the soil homogenate, whereas therelative frequency of size groups 3 and 4 in the supernatantwas about two-thirds that in the soil homogenate.The frequency of cells with diameters between 1.4 and 1.9
p.m was 0.3% in the soil homogenate and 0.03% in the
TABLE 2. Yield of bacteria (microscopic counts) in thesupernatants from repeated blending-centrifugation steps
Total bacterial no. (x 109 per g [dry wt] ofSoil type soil) (%) in supernatanta
S1 S2
CL 1.5 (15) 1.1 (10)SL 3.6 (36) 2.4 (23)OS 11.8 (28) 7.0 (17)
a The standard deviation of each estimate was 10 to 15% of the value.
TABLE 3. Release of cells from CL by repeated blending-centrifugation steps: yield and size distribution (microscopic
count) of cells in the supernatants
Total no. of Size distribution (%) among cocci ofcells in diam6:
Superna- each super- % of totaltant and natant in soilresidue (x109 per g sample <0.5 p.m 0.5-0.8 pum >0.8 ,um
[dry wt] ofsoil)'
Si 1.6 16 68 28 4S2 1.0 10 71 27 2S3 1.1 11 71 26 3S4 1.1 11 72 26 1S5 0.7 7 61 32 6S6 0.6 6 53 36 10S7 0.6 6 60 35 6S8 0.4 4 58 41 1
RS8 2.3 23 59 35 6
a Expressed as numbers per gram (dry weight) of soil applied.b Rods were included by volume.
supernatant. No cells with diameters larger than 1.9 p.mwere observed in the supernatants. These cells seem to becompletely sedimented by the centrifugation. A majority ofthe cells with diameters between 1.4 and 1.9 p.m was alsosedimented.The removal of all the cells with diameters larger than 1.9
p.m indicated that both hyphae and spores of fungi wereremoved by the centrifugation. This was confirmed bycounting the number of viable fungal units on soil extractagar plates with 30 ppm (30 p.g/g) of streptomycin andtetracycline as bacterial inhibitors. Of the viable fungi, 90%were recovered by resuspending the sediment, whereasfewer than 0.4% were recovered in the supernatant.
Distribution of bacterial cells in the density gradients. In anexperiment with all three soil types, the distribution of cellsin the gradient was investigated. The gradients were parti-tioned as shown in Fig. 2, and the bacteria were countedmicroscopically after removal of the Ludox particles.The top layer contained practically no bacterial cells. The
bacterial layer (II) had a very high concentration of bacterialcells: 30, 26, and 70% of the total number of cells wererecovered in this layer from CL, sandy loam (SL), andorganic soil (OS), respectively. The next layer (III), whichcovered a narrow range of buoyant densities, contained veryfew cells; only 4 and 8% of the total were recovered in thislayer from CL and SL, respectively. Of the bacterial cells
TABLE 4. Size distribution of cells in the soil homogenate andsupernatant after centrifugation
Diam Calculated No. of cells per ml (% of total) in:Size limits meangroup for cocci cell vol Soil Si(pm) (p.m3) homogenate
1 <0.5 0.034 6.5 x 10⁸ (65) 1.0 x 10⁸ (66)2 0.5-0.7 0.11 2.5 x 10⁸ (25) 0.42 x 10⁸ (28)3 0.7-1.0 0.32 0.7 x 10⁸ (7) 0.08 x 10⁸ (5)4 1.0-1.4 0.90 0.13 x 10⁸ (1.3) 1.4 x 10⁶ (0.9)5 1.4-1.9 2.35 0.03 x 10⁸ (0.3) 0.05 x 10⁶ (0.03)6 1.9-2.6 5.96 0.01 x 10⁸ (0.1) <0.01 x 10⁶ (<0.01)a7 2.6-3.7 16.40 0.6 x 10⁶ (0.06) <0.01 x 10⁶ (<0.01)a No cells were observed. The upper confidence limit (5%), assuming
binomial distribution, is shown.
1484 BAKKEN
on May 29, 2018 by guest
http://aem.asm
.org/D
ownloaded from
SEPARATION OF BACTERIA FROM SOIL 1485
TABLE 5. Size distribution of bacteria in the PBF compared withthat in supernatants from blending-centrifugation (S1 + S2)
% of total no. within vol groups':Soil Suspen- Cocci Rodstype sion
1b 2 3 4 5' 2 3 4
CL S1 + S2 66 14 3 0.3 0.03 12 3 0.6CL PBF 57 14 4 0.7 0.04 21 2 0.2SL S1 + S2 77 13 4 0.3 0.03 3 1 NDdSL PBF 77 14 2 0.2 0.1 6 1 ND
a Identical to the groups defined in Table 4.b Rods with equivalent volumes included.c The estimated frequency is based on the observation of three to six cells,
and the standard error of the estimate is 40 to 60%.d ND, Not detected.
from CL, 60% were recovered in the bottom layer. Verylittle material from the OS was recovered in the bottomlayer.With CL, several experiments were done by using density
gradients of Ludox and Percoll. The percent recovery in thebacterial layer (II) varied between 30 and 40% with bothLudox and Percoll. The number of blending-centrifugationsteps was varied from one to five without affecting thedistribution of the cells in the density gradients significantly.
Metrizamide could replace collodial silica as a densitymedium. A high density of the metrizamide solution wasnecessary, because the buoyant density of bacterial cells(pure cultures) was found to be higher in metrizamide (1.15to 1.20 g/ml) than in Ludox (1.04 to 1.12 g/ml). The percentrecovery of soil bacteria at the meniscus between themetrizamide solution and the overlying liquid varied overthe same range as the recovery in the bacterial layer fromcolloidal silica gradients, i.e., 30 to 40%.The amount of suspension loaded on the gradient could be
varied within a wide range without affecting the percentrecovery of cells in the bacterial layer. In an experiment with15 ml of Ludox per tube, various amounts of soil-bacterialsuspension (containing 1.2 x 10⁹ cells per ml) was loaded onthe gradients. The yield of cells in the bacterial layer of thegradient was 40, 29, 33, 38, and 42%, with a load of 1, 5, 10,15, and 20 ml, respectively.The size distribution of cells in the density gradient. The
purified bacterial fractions (PBFs) from CL and SL werecompared with the supernatant after blending-centrifugation(S1 + S2) with respect to size distribution of rods and cocci(Table 5). In general, the size distribution was little affectedby the density gradient centrifugation. With both soils, anincreased frequency of the smallest rods was observed in thePBF. The frequency of the smallest cocci was reducedaccordingly for CL, whereas the frequency of this group wasnot changed for SL. Minor differences in frequency can beobserved for the other size groups as well, but they arewithin the experimental error.Comparison of cell dimensions in phase contrast and fluo-
rescence microscopy. A comparison between cell size ob-served in phase contrast and fluorescence microscopy wasmade with cells from the bacterial layer and the bottompellet of a Ludox gradient (CL). The cells were stained withacridine orange (final concentration, 0.1 g/liter), sedimentedby centrifugation, and mounted in 2% agar for immediateobservation, both in phase contrast and during fluorescence.Only cells with diameters larger than 0.4 p.m were recorded,owing to difficulties in observing the smaller cells by phasecontrast microscopy.
Of the cells in the bottom pellet, 50% were larger whenobserved under phase contrast than with fluorescence, andthe calculated average cell volume based on phase contrastobservations was about twice that based on fluorescenceobservations. The cells from the bacterial layer gave a betteragreement between the two microscopic methods: only 30%of the cells were larger in phase contrast than duringfluorescence and the observed differences were smaller,resulting in an average cell volume which was only 25%higher with phase contrast than with fluorescence micros-copy.
Frequency of viable cells in soil homogenate and bacterialfractions. The number of viable cells, measured as CFU(platable cells) on the soil extract agar, was found torepresent 2% of the microscopic counts in the homogenateof CL. The percentage of platable cells measured in thesupernatants from five repeated blending-centrifugation stepsvaried between 2.5 and 5%. About 3% of the total number ofcells in the final residue were platable. PBFs (CL) aftercentrifugation on Percoll gradients have also been investi-gated (R. A. Olsen and L. R. Bakken, Abstr. Third Int.Symp. Microb. Ecol., p. 64, 1983). In these suspensions, theplatable cells varied between 2 and 5% of the total number ofcells.Chemical analysis of cells from pure culture: estimates of
cellular C and N in the bacterial fractions. The cells fromeight different pure cultures previously used in a study of thebuoyant density and dry weight of cells (4) were analyzed fortotal C, total N, and a-amino acid N after acid hydrolysis.The average C and N content of the cellular dry matter
was found to be 44 + 2 and 12 + 2%, respectively. Thesevalues were used to convert the microscopically determinedbiomass into estimates of cell C and cell N. The averagecontent of a-amino acid N after hydrolysis was found to be40% of the total N in the cells. The average cell volume ofthe PBF was calculated from the size distribution of the cells(Table 6). The average cell volume was 0.11 p.m3 in the soilhomogenate and 0.086 p.m3 in the bacterial fraction. Thedifference was due to removal of the largest cells by theblending-centrifugation. The density and dry weight of bac-terial cells have been estimated to be 1.07 g/ml and 30%(wt/wt), respectively (4). Thus, the average dry weight percell in the bacterial fraction would be 2.8 x 10⁻¹⁴ g. With44% C and 12% N in the dry matter, the average C and Ncontent per cell was 1.22 x 10⁻¹⁴ and 0.34 x 10⁻¹⁴ g,respectively. Different values were obtained for the other
TABLE 6. Average volume of the cells in the soil homogenateand the PBF from CL, as calculated from the relative frequency
(Xi) and cell volume of each size group
Mean cell Soil homogenate PBFSize group (i) vol (Vi)
(p.m3) Xi Xi X vi X, Xi X Vi
1 0.034 0.65 0.022 0.57 0.0192 0.113 0.25 0.028 0.35 0.0403 0.322 0.07 0.023 0.06 0.0194 0.905 0.013 0.012 0.009 0.0085 2.35 0.003 0.007 ND" ND6 5.96 0.001 0.006 ND ND7 16.37 0.0006 0.010 ND ND
Avg cell vol 0.11 p.m3 0.086 p.m3(IXi x Vi)a ND, Not detected.
VOL. 49, 1985
on May 29, 2018 by guest
http://aem.asm
.org/D
ownloaded from
APPL. ENVIRON. MICROBIOL.
two soils owing to a different size distribution of the cells(data not shown).
Purity of bacterial fractions. Preliminary experiments hadshown that the purity of the supernatants after blending-cen-trifugation was very low. Large amounts of clay as well asnoncellular organic material were present. Most of the clayand a large part of the noncellular organic material wereremoved by density gradient centrifugation.
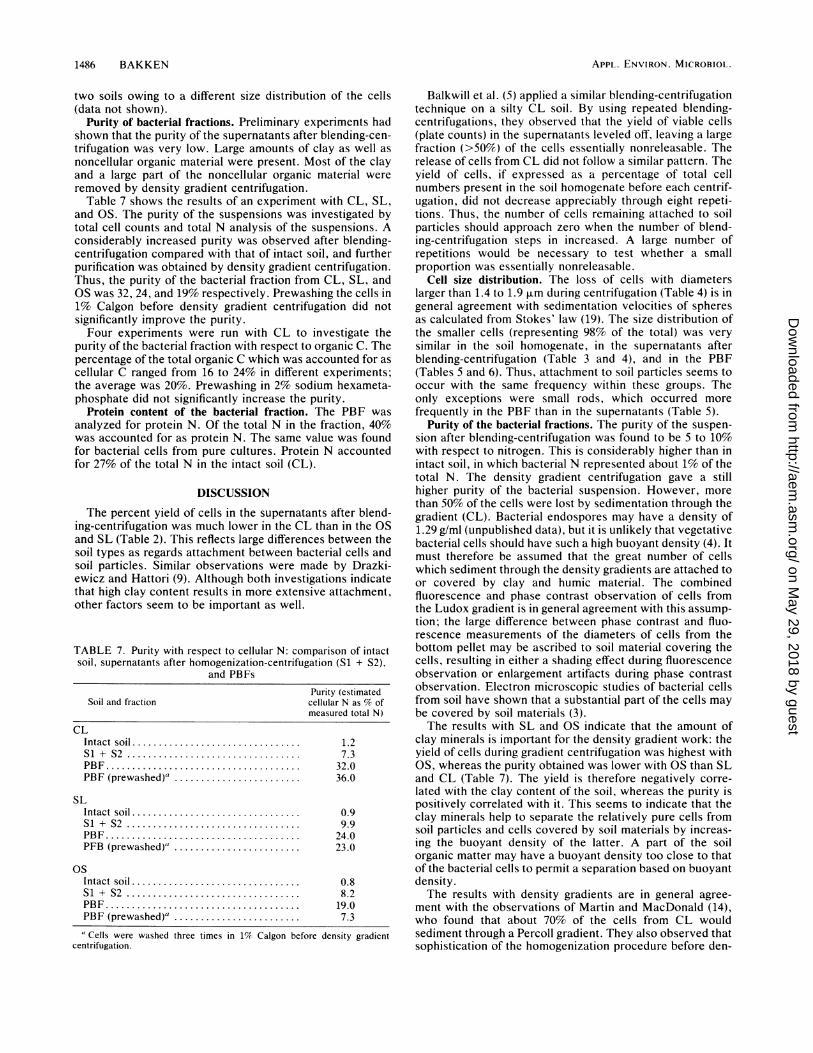
Table 7 shows the results of an experiment with CL, SL,and OS. The purity of the suspensions was investigated bytotal cell counts and total N analysis of the suspensions. Aconsiderably increased purity was observed after blending-centrifugation compared with that of intact soil, and furtherpurification was obtained by density gradient centrifugation.Thus, the purity of the bacterial fraction from CL, SL, andOS was 32, 24, and 19% respectively. Prewashing the cells in1% Calgon before density gradient centrifugation did notsignificantly improve the purity.Four experiments were run with CL to investigate the
purity of the bacterial fraction with respect to organic C. Thepercentage of the total organic C which was accounted for ascellular C ranged from 16 to 24% in different experiments;the average was 20%. Prewashing in 2% sodium hexameta-phosphate did not significantly increase the purity.
Protein content of the bacterial fraction. The PBF wasanalyzed for protein N. Of the total N in the fraction, 40%was accounted for as protein N. The same value was foundfor bacterial cells from pure cultures. Protein N accountedfor 27% of the total N in the intact soil (CL).
DISCUSSION
The percent yield of cells in the supernatants after blend-ing-centrifugation was much lower in the CL than in the OSand SL (Table 2). This reflects large differences between thesoil types as regards attachment between bacterial cells andsoil particles. Similar observations were made by Drazki-ewicz and Hattori (9). Although both investigations indicatethat high clay content results in more extensive attachment,other factors seem to be important as well.
TABLE 7. Purity with respect to cellular N: comparison of intactsoil, supernatants after homogenization-centrifugation (Si + S2),
and PBFs
Purity (estimatedSoil and fraction cellular N as % of
measured total N)
CLIntact soil................................ 1.2S1 + S2 ................................. 7.3PBF..................................... 32.0PBF (prewashed)a .......... .............. 36.0
SLIntact soil ................................ 0.9Sl + S2 ................................. 9.9PBF..................................... 24.0PFB (prewashed)'......................... 23.0
OSIntact soil ................................ 0.8S1 + S2 ................................. 8.2PBF..................................... 19.0PBF (prewashed)a......................... 7.3
a Cells were washed three times in 1% Calgon before density gradientcentrifugation.
Balkwill et al. (5) applied a similar blending-centrifugationtechnique on a silty CL soil. By using repeated blending-centrifugations, they observed that the yield of viable cells(plate counts) in the supernatants leveled off, leaving a largefraction (>50%) of the cells essentially nonreleasable. Therelease of cells from CL did not follow a similar pattern. Theyield of cells, if expressed as a percentage of total cellnumbers present in the soil homogenate before each centrif-ugation, did not decrease appreciably through eight repeti-tions. Thus, the number of cells remaining attached to soilparticles should approach zero when the number of blend-ing-centrifugation steps in increased. A large number ofrepetitions would be necessary to test whether a smallproportion was essentially nonreleasable.
Cell size distribution. The loss of cells with diameterslarger than 1.4 to 1.9 i.m during centrifugation (Table 4) is ingeneral agreement with sedimentation velocities of spheresas calculated from Stokes' law (19). The size distribution ofthe smaller cells (representing 98% of the total) was verysimilar in the soil homogenate, in the supernatants afterblending-centrifugation (Table 3 and 4), and in the PBF(Tables 5 and 6). Thus, attachment to soil particles seems tooccur with the same frequency within these groups. Theonly exceptions were small rods, which occurred morefrequently in the PBF than in the supernatants (Table 5).
Purity of the bacterial fractions. The purity of the suspen-sion after blending-centrifugation was found to be 5 to 10%with respect to nitrogen. This is considerably higher than inintact soil, in which bacterial N represented about 1% of thetotal N. The density gradient centrifugation gave a stillhigher purity of the bacterial suspension. However, morethan 50% of the cells were lost by sedimentation through thegradient (CL). Bacterial endospores may have a density of1.29 g/ml (unpublished data), but it is unlikely that vegetativebacterial cells should have such a high buoyant density (4). Itmust therefore be assumed that the great number of cellswhich sediment through the density gradients are attached toor covered by clay and humic material. The combinedfluorescence and phase contrast observation of cells fromthe Ludox gradient is in general agreement with this assump-tion; the large difference between phase contrast and fluo-rescence measurements of the diameters of cells from thebottom pellet may be ascribed to soil material covering thecells, resulting in either a shading effect during fluorescenceobservation or enlargement artifacts during phase contrastobservation. Electron microscopic studies of bacterial cellsfrom soil have shown that a substantial part of the cells maybe covered by soil materials (3).The results with SL and OS indicate that the amount of
clay minerals is important for the density gradient work: theyield of cells during gradient centrifugation was highest withOS, whereas the purity obtained was lower with OS than SLand CL (Table 7). The yield is therefore negatively corre-lated with the clay content of the soil, whereas the purity ispositively correlated with it. This seems to indicate that theclay minerals help to separate the relatively pure cells fromsoil particles and cells covered by soil materials by increas-ing the buoyant density of the latter. A part of the soilorganic matter may have a buoyant density too close to thatof the bacterial cells to permit a separation based on buoyantdensity.The results with density gradients are in general agree-
ment with the observations of Martin and MacDonald (14),who found that about 70% of the cells from CL wouldsediment through a Percoll gradient. They also observed thatsophistication of the homogenization procedure before den-
1486 BAKKEN
on May 29, 2018 by guest
http://aem.asm
.org/D
ownloaded from

SEPARATION OF BACTERIA FROM SOIL 1487
sity gradient centrifugation did not significantly reduce theloss of cells through the gradient.The purity of the bacterial fraction has been estimated by
converting the biovolume, as estimated from fluorescencemicroscopic counting and size measurement, into biomass Cand N. However, combined fluorescence and phase contrastobservations indicated that the estimated biovolume may be25% higher as a result of incomplete staining of the cells.Thus, the purity of the bacterial fraction from CL may be25% with respect to C and 40 to 45% with respect to N.The purified bacterial fraction from CL has been studied
by transmission electron microscopy of thin sections (R. A.Olsen and L. R. Bakken, Abstr. Third Int. Symp. Microb.Ecol., p. 81, 1983). In addition to the apparently intact cells,the fraction contained partly decayed cells with very littlecytoplasmic material. A large number of the cells were
surrounded by extracellular material, sometimes with a
structure like fimbria (12). In general, the electron micro-scopic study confirmed the measurement of the purity of thebacterial fraction, although some of the contamination couldbe ascribed to extracellular structures and to partly decayedcells which probably could not be recognized during thefluorescence microscopic counting.
Protein content of the bacterial fraction. The protein Nrepresented 27% of the total N in CL. This was increased to40o in the bacterial fraction. A high proportion of protein Nin the bacterial fraction would be expected, since cellular Nwas found to represent a very large proportion of the total N(30 to 40%). The experimental error was very large owing tothe small amounts of material, and the close agreement withthe average value of the bacterial pure cultures may be an
arbitrary result.Frequency of viable cells. If the bacterial fraction is repre-
sentative of the total population in the soil, the frequency ofviable cells as obtained on agar plates (platable cells) shouldbe the same as in soil.The results indicate that the frequency of platable cells
may be somewhat higher in the purified bacterial suspen-sions than in the soil homogenate. However, the platecounts from the soil homogenate may be considerably lowerthan the real number of viable cells, owing to the fact thatseveral cells stick together, giving rise to only one colony(5). The presence of such cell aggregates could easily beobserved during fluorescence microscopic counting of thesoil homogenate, whereas in the bacterial fraction, adher-ence between cells was more rare. Thus, the apparentdifference in the precentage of viable cells between thebacterial fraction and soil homogenate may for a large partbe attributed to this difference in aggregation.
Conclusion. The general aim of this study was only partlyachieved, since the biomass C and N can only account for a
fraction of the total C and N in the PBF. Further studies are
needed to elucidate the origin of the contaminating materi-als. As such, the method has proved useful for a series offiltration experiments, electron microscopic studies, andDNA determinations in soil bacteria (R. A. Olsen and L. R.Bakken, Abstr. Third Int. Symp. Microb. Ecol., p. 64 and81, 1983). New applications will probably be found. It shouldbe stressed, however, that the representativity of the bacte-rial fraction remains a problem for every new application,and it should be checked by other nmethods if possible.
ACKNOWLEDGMENTS
I thank Rolf A. Olsen for many useful discussions during thisstudy.
This study was financed by the Agricultural Research Council ofNorway.
LITERATURE CITED
1. Allison, L. E., W. B. Bollen, and C. D. Moodie. 1965. Totalcarbon, p. 1346-1367. In C. A. Black (ed), Methods of soilanalysis, vol. 2. American Society of Agronomy, Madison, Wis.
2. Allison, L. E., and C. D. Moodie. 1965. Carbonate, p. 1379-1396.In C. A. Black (ed), Methods of soil analysis, vol. 2. AmericanSociety of Agronomy, Madison, Wis.
3. Bae, H. C., E. H. Cota-Robles, and L. E. Casida, Jr. 1972.Microflora of soil as viewed by transmission electron micros-copy. Appl. Microbiol. 23:637-648.
4. Bakken, L. R., and R. A. Olsen. 1983. Buoyant density anddry-matter contents of microorganisms: conversion of a mea-sured biovolume into biomass. Appl. Environ. Microbiol.45:1188-1195.
5. Balkwili, D. L., T. E. Rucinsky, and L. E. Casida. 1977. Releaseof microorganisms from soil with respect to transmission elec-tron microscopy viewing and plate counts. Antonie van Leeu-wenhoeck J. Microbiol. 43:73-87.
6. Bohlool, B. B., and E. L. Schmidt. 1973. A fluoresent antibodytechnique for determination of growth rates of bacteria in soil.Bull. Ecol. Res. Comm. NFR 17:336-338.
7. Bremner, J. M. 1949. Studies on soil organic matter. I. Thechemical nature of soil organic nitrogen. J. Agric. Sci. 39:183-193.
8. Bremner, J. M. 1965. Total nitrogen, p. 1179-1237. In C. A.Black (ed.), Methods of soil analysis, vol. 2. American Societyof Agronomy, Madison, Wis.
9. Drazkiewicz, M., and T. Hattori. 1978. Preliminary studies onadsorption of bacteria by soil particles. Pol. J. Soil Sci.11:133-141.
10. Faegri, A., V. L. Torsvik, and J. Goks0yr. 1977. Bacterial andfungal activities in soil: separation of bacteria and fungi by arapid fractionated centrifugation technique. Soil Biol. Biochem.9:105-112.
11. Hobbie, J. E., R. J. Daley, and S. Jasper. 1977. Use ofNuclepore filters for counting bacteria by fluorescence micros-copy. Appl. Environ. Microbiol. 33:1225-1229.
12. Hodkiss, W., J. A. Short, and P. D. Walker. 1976. Bacterialsurface structure. In R. Fuller and D. W. Lovelock (ed.),Microbial ultrastructure. Soc. Appl. Bacteriol. Tech. Ser.,10:49-71.
13. Jenkinson, D. S., D. S. Powlson, and R. W. M. Wedderburn.1976. The effects of biocidal treatments on metabolism in soil.III. The relationship between soil biovolume, measured byoptical microscopy, and the flush of decomposition caused byfumigation. Soil Biol. Biochem. 8:189-202.
14. Martin, N. J., and R. M. MacDonald. 1981. Separation ofnonfilamentous microorganisms from soil by density gradientcentrifugation in Percoll. J. Appl. Bacteriol. 51:243-251.
15. Pochon, J. 1954. Manuel technique d'analyse microbiologiquede sol. Masson et Cie, Paris.
16. Schmidt, E. L. 1974. Quantitative autecological study of micro-organisms in soil by immunofluorescence. Soil Sci. 118:141-149.
17. Singh-Verma, S. B. 1968. Zum Problem des quantitativenNachweis der Mikroflora des Bodens. I. Dispergierungsmitteln.Zentralbl. Bakt. Parasitenkd. Infektionskr. Hyg. Abt. 2 Orig.122:357-385.
18. Torsvik, V. L., and J. Goks0yr. 1978. Determination of bacterialDNA in soil. Soil. Biol. Biochem. 10:7-17.
19. Wast, R. C. 1977. Handbook of chemistry and physics. CRCPress, Inc., Boca Raton, Fla.
20. Wolff, D. A. 1975. The separation of cells subcellular particlesby colloidal silica density gradient centrifugation. Methods CellBiol. 10:85-104.
21. Wollum, A. G., II, and R. H. Miller. 1980. Density centri-fugation method for recovering Rhizobium spp. from soil forfluorescent-antibody studies. Appl. Environ. Microbiol. 39:466-469.
VOL. 49, 1985
on May 29, 2018 by guest
http://aem.asm
.org/D
ownloaded from