Embed Size (px)
Citation preview

T. PradeepDepartment of Chemistry
Indian Institute of Technology MadrasChennai 600 036
Seoul National University, August 16, 2010
Quantum clusters: Au25, Au23, Au22, Au8, Ag8, Ag9 Molecular surfaces: Low energy ion scattering at ice
Established in 1959
Molecular nanomaterials and surfaces


Department of Science and Technology

N. Sandhyarani and T. Pradeep, Int. Rev. Phys. Chem. 2003
Monolayer Protected Metal NanoparticlesMonolayer Protected Clusters (MPCs)

Au13 Au55
Phosphine Capped Gold Clusters
Au55 [P(C6H5)3]12Cl6 - a gold cluster of unusual size, Schmid, G.; Pfeil, R.; Boese, R.;Brandermann, F.; Meyer, S.; Calis, G. H. M.; Van der Velden.; Jan W. A. ChemischeBerichte 1981, 114, 3634. Synthesis and x-ray structural characterization of the centered icosahedral goldcluster compound [ Au13 (PMe2Ph)10Cl2](PF6)3; the realization of a theoreticalprediction, Briant, C. E.; Theobald, B. R. C.; White, J. W.; Bell, L. K.; Mingos, D. M. P.;Welch, A. J. Chem. Commun. 1981, 5, 201. Synthesis of water-soluble undecagold cluster compounds of potentialimportance in electron microscopic and other studies in biological systems, Bartlett,P. A.; Bauer, B.; Singer, S. J. Am. Chem. Soc. 1978, 100, 5085.

28 kDa Alkanethiolate-Protected Au Clusters Give Analogous SolutionElectrochemistry and STM Coulomb Staircases, Ingram, R. S.; Hostetler, M. J.;Murray, R. W.; Schaaff, T. G.; Khoury, J.; Whetten, R. L.; Bigioni, T. P.; Guthrie, D. K.;First, P. N. J. Am. Chem. Soc. 1997, 119, 9279. Isolation of Smaller Nanocrystal Au Molecules: Robust Quantum Effects inOptical Spectra, Schaaff, T. G.; Shafigullin, M. N.; Khoury, J. T.; Vezmar, I.; Whetten,R. L.; Cullen, W. G.; First, P. N.; Gutierrez-Wing, C.; Ascensio, J.; Jose-Yacaman, M. J.J. Phys. Chem. B 1997, 101, 7885. Optical Absorption Spectra of Nanocrystal Gold Molecules, Alvarez, M. M.;Khoury, J. T.; Schaaff, T. G.; Shafigullin, M. N.; Vezmar, I.; Whetten, R. L.J. Phys. Chem. B 1997, 101, 3706.
Molecular Clusters

Isolation and Selected Properties of a 10.4 kDa Gold:Glutathione ClusterCompound, Schaaff, T. G.; Knight, G.; Shafigullin, M. N.; Borkman, R. F.; Whetten, R. L. J.Phys. Chem. B 1998, 102, 10643. Controlled Etching of Au:SR Cluster Compounds, Schaaff, T. G.; Whetten, R. L. J. Phys. Chem. B 1999, 103, 9394. Giant Gold-Glutathione Cluster Compounds: Intense Optical Activity in Metal-BasedTransitions, Schaaff, T. G.; Whetten, R. L. J. Phys. Chem. B 2000, 104, 2630. Near-Infrared Luminescence from Small Gold Nanocrystals, Bigioni, T. P.; Whetten, R.L.; Dag, O. J. Phys. Chem. B 2000, 104, 6983. Properties of a Ubiquitous 29 kDa Au:SR Cluster Compound. Schaaff, T. G.;Shafigullin, M. N.; Khoury, J. T.; Vezmar, I.; Whetten, R. L. J. Phys. Chem. B 2001, 105,8785. Visible to Infrared Luminescence from a 28-Atom Gold Cluster, Link, S.; Beeby, A.;FitzGerald, S.; El-Sayed, M. A.; Schaaff, T. G.; Whetten, R. L. J. Phys. Chem. B 2002, 106,3410. All-Aromatic, Nanometer-Scale, Gold-Cluster Thiolate Complexes, Price, R. C.;Whetten, R. L. J. Am. Chem. Soc. 2005, 127, 13750.

Au102
Jadzinsky, P. D.; Calero, G.; Ackerson, C. J.; Bushnell, D. A.; Kornberg, R. D. Structure of aThiol Monolayer–Protected Gold Nanoparticle at 1.1 Å Resolution Science 2007, 318,430.
Au102(p-MBA)44

How to make them?

Polyacrylamide gel electrophoresis (PAGE)
Negishi, Y.; Nobusada, K.; and Tsukuda, T. Glutathione-Protected Gold Clusters Revisited: Bridging the Gap between Gold(I)-Thiolate Complexes and Thiolate-Protected Gold Nanocrystals. J. Am. Chem. Soc. 2005, 127, 5261-70.
μg

Au25SG18
Synthesis: Au25 clusters can be preferentially populated by dissociative excitation of larger precursors
Scheme showing the synthesis of Au25SG18 clusters
E. S. Shibu et al. J. Phys. Chem. C. 2008

Characterization of Au25SG18
Optical absorption spectrum with anabsorption maximum at 672 nm.
Photoluminescence profile with excitationand emission maxima at 535 and 700 nm, respectively.
Tsukuda et. al. JACS 2005

FTIR spectrum: The peak at 2526 cm-1 ofglutathione due to –SH stretchingfrequency is absent in IR spectrum of Au25suggesting the ligand binding on clustersurface.
1H NMR spectrum: There is one-to-onecorrespondence between the two spectra, exceptthat the βCH2 resonance (labeled as C) disappearscompletely in the cluster which is expected as it isclose to the cluster surface. All the observedresonances have been broadened in view of theirfaster relaxation and non-uniform distribution ofligands.

F
XPS spectrumTEM image: The clusters are seen only faintly since the size is ~1 nm. Some of the individual clusters are shown by circles. There are also cluster aggregates which upon extended electron beam irradiation fuse to form bigger particles

With Arindam Banerjee
Perumal Ramasamy et al. J. Mater. Chem., 2009, 1 9, 8456.

OONH
OHOOOH
NH2NH
SH(GSH)(MB) OH
HSCH3
CH3
(NAGSH and NFGSH)
OONH
OHOOOH NH
SH
NHR
O
1
1
2
3&4
Ligand Exchange of Au25

400 600 800 10000.0
0.5
1.0
1.5
2.0Ab
sorb
ance
Wavelength(nm)
2 3 4 50.00
27.00k54.00k81.00k
108.00k135.00k
I(E)=A
(W)xW
2
Energy (eV)
Au25SG18Au25-MBAu25-SGANAu25-SGFN
400 600 800 10000.0
0.5
1.0
1.5
2.0Ab
sorb
ance
Wavelength(nm)
2 3 4 50.00
27.00k54.00k81.00k
108.00k135.00k
I(E)=A
(W)xW
2
Energy (eV)
Au25SG18Au25-MBAu25-SGANAu25-SGFN
a b cHOMO
LUMO
sp-band
d-band
Shibu et al. J. Phys. Chem. C 2008

90 87 84 810
10k20k30k40k50k
Au25SG18Au25-MBAu25-SGAN
Inten
sity (
a. u.
)
Binding Energy (eV)
4f5/24f7/2

400 500 600 700 800 9000.00
2.50x10⁷
5.00x10⁷
7.50x10⁷
Energy (eV)1.381.51.82.12.53.1
I(E)=I
(W)xW
2
Wavelength (nm)
Au25SG18Au25-MBAu25-SGANAu25-SGFN

Fluorescence : A comprehensive study betweenorganic dye, gold atoms and molecular clusters of gold
Lecoultrea, S.; Rydlo, A.; F elixb, C.; Harbich, W. Eur. Phys. J. D, 2009 DOI: 10.1140/epjd/e2008-00290-0
1.5 2.0 2.50.0
5.0x10⁶
1.0x10⁷
1.5x10⁷
2.0x10⁷
Inten
sity (
a. u.)
Wavelength (eV)

Cluster Q.Yield
Au10(SG)10Au11(SG)11Au11(SG)11
1*10-4
Au15(SG)13 2*10-4
Au18(SG)14 4*10-3
Au22 (SG)16 4*10-3
Au22(SG)17 2*10-3
Au25(SG)18 1.9*10-3
Au29(SG)20 3*10-3
Au33(SG)22Au35(SG)22
2*10-3
Au38(SG)24,Au39(SG)24
2*10-3
Goldnanoparticles
1*10-10
Cluster Q. Yield
Au22 4.0*10-2
Au23 1.3*10-2
Au31 1.0*10-2
Au8(SG)8 1.5*10-1
1. Nano Res., 1(2008) 333-340.2. Chemistry A European Journal. (2009).3. ACS Applied Materials and Interfaces (2009)
Precursor
Using other ligands
Recently developed clusters using Au25 as precursor

FRET between Au25 and Dansyl Chromophore
Approaches Used for the Functionalization of Dansyl Chromophore on the Au25 Cluster.
Habeeb Muhammmed et al. J. Phys. Chem. C 2008, 1 1 2, 14324.

MPTS OTOT25 oC
55 oC
25 oC
3-mercaptopropyl trimethoxy silane (MPTS)
Au
Glutathione (GSH)
Octane thiol (OT)
AuxOTy
Au25SG18
AuxSGy
AuxMPTSy
Single Phase Etching Bi- Phase Etching
(Aqueous Layer)
(Organic Layer)
Scheme 1. Formation of the three sub-nanoclusters from Au25
SG18
by core etching by two routes. Photographs of the cluster aqueous solutions under UV light are also given.
Habeeb Muhammed et al. Chem. Euro. J. 2009, 15, 10110.
Clusters from clusters

Wavelength (nm)
Abso
rban
ce
300 450 600 750 900
Comparison of the optical absorption features of Au25
SG18
(green trace) with AuxOT
y(grey trace), Au
xSG
y(pink trace) and Au
xMPTS
y(purple
trace). The arrows show the absorption peaks of the clusters due to intra band transitions. The spectra are shifted vertically for clarity. Dotted lines
indicate the threshold of absorption. Inset shows the photographs (under white light) of the water-toluene bi-phasic mixture before (A) and after (B)
reaction at 55 ºC (interfacial etching) for 1 h.

APattern 1
Pattern 2
197229
197229
B
Au23S18-23
Figure 2. A) MALDI-MS of Aux
SGy
which shows bunch of peaks due to Aum
Sn
clusters. B) A group of peaks with m/z spacing of 197 or 229 between the major peaks of the adjacent group of peaks. C) Expanded view of peaks due to Au
23S
18-23.

B. E. (eV)
Inte
nsity
(a. u
.)
9086 8882 84
Comparison of the Au(4f) XPS spectra of Au22, Au23 and Au33 along with parent Au25.
Wavelength (nm)
Inte
nsity
(a. u
.)
500 600 700 800
Comparison of the photoluminescence profiles of Au22, Au23 and Au33 along with parent Au25.Photographs of the aqueous solutions of Au22 and Au23 under white light (A and C, respectively) and UVlight (B and D, respectively) are also given.

0 5 10
Norm
alize
d Inte
nsity
Time (ns)
IRF
Au25
Au33
Au23
Au22
Fluorescence decay pattern of Au25, Au31, Au23, and Au22 collected at 630 nm.

Wavelength (nm)
Inte
nsity
(a. u
.)
700500 600 800
3M
900
2M
1M
.5M
0
Photoluminescene profile of Au23 cluster before (pink trace) and after (orange trace) phase transfer.Emission of the cluster enhances considerably after the phase transfer. Photographs of the aqueous-toluene mixture containing the cluster before and after phase transfer under white light (A and B,respectively) and UV light (C and D, respectively). In C, only the interface is illuminated as the UV isattenuated as the sample was irradiated from the top

A
A B C
47.62 µm
EDC
Streptavidin
EDC :1-Ethyl-3-(3-dimethylaminopropyl)carbodiimide
Au23 Au23
Schematic representation of the conjugation of streptavidin on Au23
SG18
by EDC coupling.
Fluorescence (A), bright field (B) and overlay of fluorescent and bright field images (C) of human hepatoma (HepG2) cells stained with streptavidin conjugated Au
23.

A B
Bright field (A) and fluorescence (B) images of HepG2 cells stained with unconjugated Au23clusters. No fluorescence was observed from the cells after washing

Fluorescent microscopic images showing interaction of Au-BSA-FA NCs with different types of cell lines: a1-a2) FR-ve lung carcinoma A549 after 2 hours of incubation, b1-b2) FR-ve lung carcinoma A549 after 24 hours of incubation, c1-c2) FR+ve KB cells with unconjugated Au clusters, d1-d2) FR+ve KB cells with FA conjugated Au clusters at 2 hrs, e1-e2) 4 hrs and f1-f 2) 24 hrs of incubation [Archana R, Sonali S, Deepthy M et al. Molecular Receptor Specific, Non-toxic, Near-infrared Emitting Au Cluster-Protein Nanoconjugates for Targeted Cancer Imaging. Nanotechnology (2010)].
Archana et al. Nanotechnology 2010

Clusters for metal ion detection
Water soluble red emitting clusters where treated with various metal ions with a finalConcentration of 25 ppm. The emission was shifted to lower wavelength in case of silver ions andquenched completely in case of copper ions. The emission was an altered in case of other ions.
Habeeb Muhammed et al. Chem. Euro. J. 2009, 1 5, 10110.
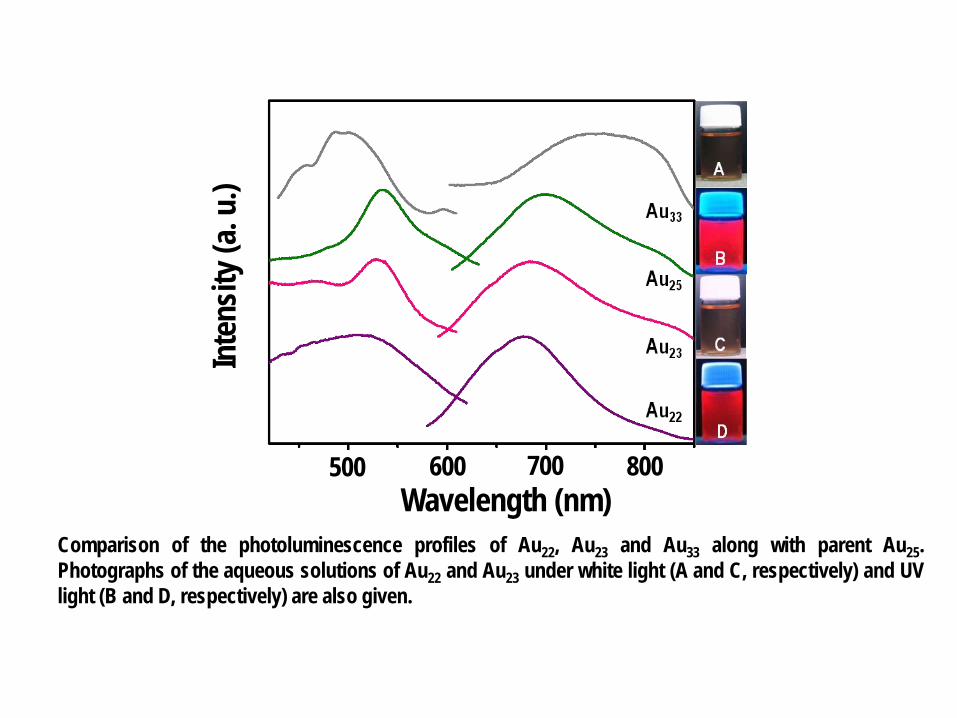
Cluster based patterns
(GSH)
H2TPPOASH
[Au25SG18]aq [Au22(SG)15(H2TPPOAS)2]aq
(H2TPPOASH)Toluene
=
Core reduction/ligand exchange
400 600 800 10000.0
0.5
1.0
1.5
2.0
2.5
Abos
rban
ceWavelength (nm)
Au25SG18Au22H2TPPOASH
450 500 550 600 650 700 7500.0
4.0M
8.0M
12.0M
Au25SG18H2TPPOASHAu22 emissionexcitation
Inten
sity (
cps)
Wavelength (nm)
RT 5 °C
A B
C D
25 °C
5 °C
400 500 600 700 8000.0
5.0M
10.0M
15.0M
20.0M
25.0M
Wavelength (nm)
Inten
sity
excitation emission
500 600 700 800 9000.0
0.2
0.4
0.6
Abos
rban
ce
Wavelength (nm)B
Q
N
N
N
N
H
H
OH1,8-dibromooctaneK2CO3/DMF
OBr
N
N
N
N
H
H
OSH
N
N
N
N
H
H
(Me3Si)2S/TBAF/THF
III
III
N
N
N
N
H
H
OH1,8-dibromooctaneK2CO3/DMF
OBr
N
N
N
N
H
H
OSH
N
N
N
N
H
H
(Me3Si)2S/TBAF/THF
N
N
N
N
H
H
OH
N
N
N
N
H
H
OH1,8-dibromooctaneK2CO3/DMF
OBr
N
N
N
N
H
H
OBr
N
N
N
N
H
H
OSH
N
N
N
N
H
H
OSH
N
N
N
N
H
H
(Me3Si)2S/TBAF/THF
III
III

Au22S17+Au20S15
+Au18S13+Au16S11
+Au14S9+Au12S7
+
(AunSm)+775
4878
821
A
m/z2000 4000 6000600 750 900
8.0 K
20.0 K
0.0 K
Inte
nsity
x 9
550 600 650 700 750 800 850
0
1x10⁶
2x10⁶
3x10⁶
4x10⁶
5x10⁶
Addit
ion of
Cu+2 (m
M)
d (300 µL)c (100 µL)
b (50 µL)a (0 µL)
Wavelength (nm)
Inten
sity (
cps)
1
2
3
4
550 600 650 700 750 800 850
01x106
2x10⁶
3x10⁶
4x10⁶
5x10⁶
6x10⁶
Addit
ion of
Zn+2 (m
M)
d (300 µL)c (150 µL)
b (20 µL)a (0 µL)
Wavelength (nm)
Inten
sity (
cps)
0 50 100 150 200 250 300
1x10⁶
2x10⁶
3x10⁶
4x10⁶
Flu.In
tensit
y at 6
70 nm
Concentration of Zn+2 (µM)
0 50 100 150 200 250 300
0
1x10⁶
2x10⁶
3x10⁶
4x10⁶
Flu. In
tensit
y at 6
70 nm
Concentration of Cu+2 (µM)
A
B
C
D
0 50 100 150 200
1k
10k
Inten
sity
Time (ns)
(IRF)
Cluster
Lifetime (ns) %
H2TPPOASH
Lifetime (ns) %
0.05 86.50 9.15 70.00
1.16 6.60 1.24 30.00
9.59 3.50 - -
141.80 3.40 - -
0 10 20 30 40
10
100
1k
10k
Inten
sity
Time (ns)
(IRF)

I
50 0C
II
III
532 nm
A
B D
C
1 µm 1 µm
0 1 2 3 4 5 6 70
50
100
150
200
Heigh
t (nm)
Distance (µm)
10 µm
0 CCD Cts 4500 CCD Cts600 700 800 9000
200
400
600
800
Inte
nsity
Wavelength (nm)
A C
B
D E
0 3 6 9300.0k
302.0k
304.0k
CCD
coun
ts
Distance (µm)
E. S. Shibu et al. ACS Appl. Mater. 2009, 1, 2199.
With G. U. Kulkarni

Scheme: Au15 was synthesized inside thecyclodextrin (CD) cavity (in situ). Note: CDand GSH are the abbreviations ofcyclodextrin and glutathione,respectively. For our synthesis we have usedall 3 CDs (alpha, beta and gamma)
Au@SG – glutathione (GSH) protected gold nanoparticle
≡
n= 6, 7, 86---alpha CD7---beta CD8---gamma CD
123
4 56a,b
OHOH
Basic unit of CD is 6 membered glucose
OH
n
OO
NHOH
O
OOH
NH2 NHSH
3D image of CD showing the nanometer cavity

350 400 450 600 650 700 7500
1x10⁶
2x10⁶
3x10⁶
Intens
ity (cp
s)
Wavelength (nm)
Au15@αCD Au15@βCD Au15@γCD
300 400 500 600 700
211
1x212
1x213
214
215
216
217
Au15@αCD Au15@βCD Au15@γCD
ln (I=
A(W)
x W2 )
Wavelength (nm)
400 600 8000.0
5.0x10⁴
1.0x10⁵
1.5x10⁵
I= A(W
)x W2
Wavelength (nm)
C
D
E
F
EmissionExcitation
A
B
a1 a2
300 600 9000.0
0.7
1.4
I= A(W
)xW2
Wavelength (nm)
GSH α CD
E. S. Shibu and T. Pradeep. Unpublished

e
H3
e
e
H3
H3
α Au15
A B


A C
B D
F
E
H
*$
1 µm
I
G

A
B
c2
Au Mα
30 µm
c1C
100 nm
c3~ 8 µm

A B C
ED
300 400 500 600 7000
2k
4k
6k ii iii ivi
Inten
sity
Wavelength (nm)
Clusters in proteins - BSA
Habeeb Muhammed et al. Chem. Euro. J. 2010 Online

200 400 600 800 1000
Abso
rban
ce (a
.u.)
Wavelength (nm)
A
1 2.5 5 10 20 25HAuCl4(mM)
UV
Vis
ible
B
Clusters in proteins -Lactoferrin

75k 80k 85k 90k 95k 100k
Inte
nsity
(a.u
.)
m/z
Au25
NLfAuQC@NLfAu13
NLf+
Lourdu Xavier et al. Nanoscale (2010)

Au3+ / NaOH
300 nm
350 nm
650 nm
FRET300 nm
C D
A
Native Lactoferrin
Au cluster
380 nm
510 nm
~ 650 nm
450 nm
i ii
B
NLf
AuQCNLfNLf
AuQCNLf
350 400 450 500 550 600 650 700
Inte
nsity
(a.u
.)Wavelength (nm)
AuQCNLf
AuQCHLfAuQCNLf
B

A
B C
1680 1660 1640 1620 1600
1648
1681
1680
162116271639
1634 16071644
16521677
AuQC@NLf
1615
1607
1651
1686
1685 1615
16771672 1664 1657
1645
1640
1635
1627
1622
166016651672
d2 (%T)
/(dcm
-1)2
Wavelength (cm-1)
NLf
500 1000 1500 2000 2500 3000 3500 400014
50
1400
amide
III
amide
IIam
ide I
AuQC@NLf
34843295
3294
1069 1243688
12411070
2961
2962
1399
1545
15421654
1657700
% A
bsor
banc
e
Wavenumber (cm-1)
NLf
200 210 220 230 240
Ellip
ticity
(mde
g)
Wavelength (nm)
HLF AuQC@HLF

75k 80k 85k 90k 95k 100k
Au25
~ 88.2 kDa
Au23
Au13
~ 86.2 kDa
~ 87.6 kDa
48 h
24 h
12 h
8 h
4 h
0 h
Norm
alized
inten
sity
Lf at pH 12,~ 83 kDa
Mechanism of growth
Kamalesh Choudhari et al. Unpublished

Silver clusters - interfacial etching

550 nm
640 nm
350 nm
550 nm
TUB Rao and T Pradeep, Angew. Chem. Int. Ed. (2010)

A)
300 450 600 750 9000.0
0.2
0.4
0.6
A
λ/nm
Ag@H2MSA 10 min 60 min 360 min 24 h 48 h
200 400 600 800 10000
1
2
A
λ/nm
1st band 2nd band
B)
D)
400 500 600 700 8000
4M
8M
12M
I (a.
u.)
λ/nm
λexi 350 λexi 550
d
d
dd
b

A)
m/z1200 1600 2000 2400 2800
1785 1790 1795 1800
i)ExperimentalTheoretical
[Ag7(HMSA)7]-
2045 2050 2055
i)ExperimentalTheoretical
[Ag8(HMSA)8]-
ii)
X 3
Cluster 1 Ag8(HMSA)8 – nH +nNa
n = 0 1 2 3 4 65
Cluster 2 [Ag7(HMSA)7- nH + nNa]-
n = 0 1 2 3 4 65
ii) X 3

d
600 800 1000 1200 1400 1600
ab c
e f
C
C
Crude
B)g +2(HMSA)-+(HMSA)-
X 3
-(HMSA)- h
X 3
m/z

1020 1050 1080 1110 1140 1170
Na6{Ag4(HMSA)(MSA)3}-
Na5{Ag4(HMSA)2(MSA)2}-
Na4{Ag4(HMSA)3(MSA)}-
Na3{Ag4(HMSA)4}-
Na2{Ag4(H2MSA)(HMSA)3}-
Na{(Ag4(H2MSA)2(HMSA)2}-
{Ag4(H2MSA)3(HMSA)}-
1156.51138.71114.81092.7
1070.6
1048.7
1026.7
m/z

C)
600 1200 1800 2400
I (a.
u.)
m/z
Ag9S5
Ag11S6
Ag13S7
Ag15S8 Ag17S9
Ag7S4
Ag5S4
E)
D) a b c d e
366 369 372 375 378I (
a.u.
)B.E (eV)
abc
dA)
500 550 600 650 700 7500
200k
400k
600k
800k
I (a.u.
)
λ/nm
0 ppm
30 ppm
NH3
B)

White light RT
TUV lightWhite light RT
TUV lightWhite light RT
TUV light

b a VII
450 489
625 886
VI Ag9
10 nm
Ag9Ag9Ag9Ag9
10 nm
VIII
- ) (
(+)
P A G E
V
IV
I II III
g round
NaB H4(s )
g round
AgNO3 + H2MSA(Initially both
are colorless)
Became orange color
Water +[ Ethanol (excess)]
Ag9MSA7
TUB Rao and T Pradeep, JACS, revised

2-
3-
4-
22
22
{Ag4(H2MSA)3}--Ag
1002 1005 1008 10111002 1005 1008 10111002 1005 1008 1011
ii)
{Ag9 (MSA)7 [14-(n+2)]H nNa}2-
i)
1000 1040 1080 1120

Ag9
a
bAg9
a
bAg9Ag9Ag9Ag9
a
b
a
b
a b H2MSA
ppm
Ag(I)MSA
Ag(I)MSA
H2MSA
Ag9(MSA)7
Ag9(MSA)7

a
bcd
{Ag25(SG)18}-
{Ag25(SG)18}q+
T.U.B. Rao and T. Pradeep, unpublished

400 600 800 10001200140016000
6000
m/z
800 1000 1200 1400 1600m/z
[Ag25(SG)18] m/z 8208
[Ag25(SG)18]5-
8208/5 =1642
[Ag25(SG)18]6-
8208/6 =1368
[Ag25(SG)18]7-
8208/7 =1172
[Ag25(SG)18]8-8208/8 =1026
[Ag25(SG)18]10-8208/10 =820
9-


0.1 µm
A
1 nm
7.8 nm
20 nm
B
4.8 nm
1 nm
0.1 µm
A
1 nm
7.8 nm
0.1 µm
A
1 nm
7.8 nm7.8 nm
20 nm
B
4.8 nm
1 nm
20 nm
B
4.8 nm
1 nm1 nm
E. S. Shibu et al. Adv. Mater. 2008; Nano Res. 2009; Chem. Mater. 2009

Fluorescent superlattices
E. S. Shibu et al, Adv. Mater. 2008; Nano Res. 2008, Chem. Mater.; 2009

P. R. Sajanlalal and T. Pradeep – Nano Res. 2009; JPC C 2009; 2010

0 200 400 600 8000
1
2
3
4
Inten
sity
Distance (nm)
Au Ag
AuAg
AuAg
A B
C D
1 µm 1 µm
500 nm 500 nm

0 200 400 600 800
1.2x10⁻⁶
1.8x10⁻⁶
2.4x10⁻⁶
Current Raman Intensity
Time (sec)
Curre
nt (m
A)
100
200
300
400
500
Raman Intensity
B
A
a= particle diameterd= gas molecule diameterl= thickness of monolayer
da
l
z
0.000
Keithley
Power supply
to gas source
Rotary pump
Manometer
0.000.00
0 500 1000 1500 20004.5x10-6
5.0x10⁻⁶
5.5x10⁻⁶
6.0x10⁻⁶
6.5x10⁻⁶
7.0x10⁻⁶
Curre
nt (m
A)
Time (sec)
1.5 volt 100 torr H21.5 volt 500 torr CO21.5 volt 10 torr H2 + 490 torr CO2
New phenomena
E. S. Shibu et al, UnpublishedC. Subramaniam, et al., Phys. Rev. Lett. 2007; JPC C, 2008

Product is marketed nowCartridges are recovered after use
A pesticide test kit has been developed > 25 ppb
Noble metal nanomaterials for water purification

Ongoing field trialsOngoing field trials of fluoride treatment unit (domestic unit) at Kotlapalli, Anantapur, Andhra Pradesh
Date: August 07, 2010
Noble metal nanoparticles for water purification: A critical review, T. Pradeep and Anshup, Invited Feature, Thin Solid Films, 517 (2009) 6441-6478.

Quantum clusters are interesting new materialsThey exhibit new properties and can be used for diverse applicationsCatalysisEnvironmental remediationDiagnosticsSecurity…….

73
Low energy ion scattering (LEIS) ISS, RBS, SIMSEnergy range, resolution
One of the new tools of mass spectrometry used for surface science
1. Low energy ion impact at surfaces and the energy analysis of the scattered ions.2. Energy and mass selected ion impact at surfaces and energy and mass analysis of the scattered ions.
Why is it important?
Ion spends only femtoseconds at the surface, within the interaction region.Ion collision is surface specific. Only the top atomic layer is sampled.Instantaneous surface changes are sampled.Extremely sensitive to specific surface species.Extremely sensitive to surface morphology – Chemical and physical effects
Extreme surface specificity demands UHV conditions.
Low energy ion scattering at molecular solids, Chem. Rev. 2010, to appear

74
JEOL HX-110 CID/SID-TOF
BEEQ
QE-TOF
Q-TOF

75
Reaction product or fragments
Quadrupole Q3
Molecules
EI ionizerSample substrate
Electron multiplier
Quadrupole Q1
Ions
Schematic of the process
QQ instrument, 90o T ≥ 110 K10-11 torrNo energy analysis , post collisionDown to 1 eV kinetic energyPositive ionsOnly with non-condensable gasesNo independent technique for surface analysis. No TPD


77Low energy ion scattering spectrometer

78
More photographs…
10-11 torrOil free

Primary ions < 100 eV
Scattered ions~ eV
Investigating molecular solids

80Pradeep et al. JACS 116 (1994) 8658-8665

Chemistry at ice surfaces

82
Processes at ice surfacesRole of ice particles in the polar stratospheric clouds in the seasonal depletion of the ozone layerM. J. Molina, T.-L. Tso, L. T. Molina, F. C. –Y. Wang, Antarctic stratospheric Chemistry of chlorine nitrate, hydrogen chloride and ice: Release of active chlorine, Science, 1987, 238, 1253-1257.
Possible implication of such processes in troposphere as 10% of the land area is covered by ice/snowV. F. Petrenko and R. W. Whitworth, Physics of Ice, Oxford University Press, Oxford, UK, 1999, Chapters 6 and 10
Generation of active halogen species in arctic troposphere due to sea salt ice or aerosolsL. A. Barrie and U. Plat, Arctic tropospheric chemistry: An overview, Tellus, 1997, 49B, 450-454
Interstellar icy grains contribute to the formation of extraterrestrial organicsSimple molecules transform to complex molecules in icy layers of interstellar clouds J.M. Greenberg, Cosmic dust and our origins, Suf. Sci., 2002, 500, 793-822.Muńoz Caro, G. M., Meierhenrich, U. J., Schutte, W. A. , Barbier, B., Arcones Segovia, A., Rosenbauer, H., Thiemann, W. H.-P., Brack, A., Greenberg, J. M. (2002) Amino acids from ultraviolet irradiation of interstellar ice analogues. Nature, 416, 403.

Bulb with ice and CO2
Glass set-up
MassSpectrometer
Concentration of CO2 over melting ice oscillates

Time / seconds
1000 2000 3000 4000 5000
Inte
nsity
/ arb
. uni
ts
1.00
2.00
3.00
x 10-8
Temp. / K153 213 273 273 303
Inte
nsity
/ arb
. uni
ts2.90
3.10
3.30x 10⁻⁸
3000 3600 4200Time / seconds
S. Usharani et al., Phys. Rev. Lett. 93 (2004) 048304.

85
(a) Chemical sputtering spectra from the Cu surfaceat 110 K and (b) after 5ML coverage of ASW on Cu at110 K.
Surface sensitivity
Surfaces are Contaminated,Sensitive tosub-monolayer coverage

86
Comparison of the intensity of sputtered H3O+ (m/z 19) peakfrom (a) ASW at 110 K and (b) CW at 145 K. CW wasprepared by annealing ASW at 155 K and then cooling backto 145 K to measure the chemical sputtering spectra.
Structure sensitivity
2H2O H3O+ + OH-

87
Chemical sputtering spectra of 50 ML CCl4 at threedifferent collision energies; (a) 3 eV, (b) 30 eV and (c) 60eV. Increase in intensity of the sputtered ions is observedas the collision energy is increased from 30 to 60 eV.
CCl4 is detectable
3 eV
30 eV
60 eV

88
Probing diffusion of CCl4 through ice overlayers. Massspectra corresponding to (a) 30 eV and (b) 40 eV collisionof Ar+ at 50 ML CCl4@50 ML ASW. Only H3O+ ions arepresent in the spectra even at 40 eV collision energy.
CCl4 is absent when ice is deposited

89
Sputtering spectra of 50 ML CHCl3 and 50 ML CHCl3@50 ML ASW at 30 eV collision of Ar+.
But the case is different for CHCl3!

90
Spectra showing the difference in diffusion of CHCl3molecule at two different coverages of ASW. (a) 250 ML and (b) 300 ML.
Even at 250 ML!
300 ML

91
Diffusive mixing of 50 ML CH2Cl2 at varying coverages ofH2O. (a), (b) and (c) are the chemical sputtering spectra atdifferent coverages 300, 600 and 650 ML of ASW,respectively.
Similar case for CH2Cl2

92
Spectra showing the diffusive mixing of H2O molecules throughCCl4 overlayers. (a) and (b) are the spectra from ASW andASW@CCl4, respectively. The presence of H3O+ peak afterdepositing CCl4 shows the transport of H2O through CCl4overlayers. Sputtering spectra from CW and CW@CCl4 aregiven in (c) and (d), respectively.
Water diffusion through CCl4

93
Chemical sputtering spectra collected for different systems (a)CCl4@CHCl3, (b) CCl4@CH2Cl2 and (c) CCl4@C2H2Cl4. Thefeatures of both the layers are present in the spectra.
Mixing

94
Control experiments
Diffusive mixing at varying thickness of ASW
Effect of substrate
Effect of temperature on the mixing process
Chemically similar molecule on chloromethanes
Deposition rate of the molecular solids
From 1 ML to several hundreds ML
Deposited another molecule to cancel the effect of Cu surface
Ramping the temperature at 5 K steps
Chemically similar molecules; D2O and CH3OH
Deposited vapours at 5.0 x 10⁻⁸, 1.0 x 10⁻⁷
& 5.0 x 10⁻⁷ mbar

95
Effect of H2O thickness on the diffusive mixing of 50 ML CCl4deposited on copper substrate. (a) CCl4@1 ML ASW, (b) CCl4@2
ML ASW, (c) CCl4@3 ML ASW at 30 eV collision of Ar+. (d), (e) and (f) represent 60 eV collision of Ar+ at CCl4@3 ML ASW,
CCl4@4 ML ASW and CCl4@5 ML ASW, respectively.
Where does diffusive mixing stop?

96
ASW/CWCu
+1eV
+
20 40 60 80
190 K120 K
110 K
m/z
Inte
nsity
Scattering intensity variation of 1 eV Ar+ collisions at 50 ML ASW(□), 50 ML D2O (■) and 50 ML CW (•). Bare copper is (○). Inset:Ar+ scattering mass spectra of 50 ML ASW for three differenttemperatures and averaged for 50 scans.
Copper
ASW
CW
New structural change at ice

Mass spectrum generated upon the collision of 2 eV H+ on cASW and CW surfaces at125 K. The process is represented in cartoon form in the inset.
Protons on ice make H2+!

0 10 20 30 40 50
D+
D2+
m/z
D+
HD+
Inten
sity
10 20 30 40 50
HD2O+
Inten
sity
H2DO+
H3O+
D3O+
m/z
i) 1 eV – 10 eV D+ for 1.5 h
ii) 50 eV Ar+
100 ML H2O
+ + +
Cu (125 K)
D+
100 ML D2O
+ + +
Cu (125 K)
(a)
(b)
0 10 20 30 40 50
H+
m/z
H+
H2+
Inten
sity
MeOH
EtOH
n-PrOH
n-BuOH
n-PenOH
n-Hexane
100 ML XOH
+H+ +
+
Cu (125 K)X = Me, Et, n-Pr, n-But, n-Pen

Possible channels:
H+ + H2O(ice) → H2+ + HO●(ice)
H+ + H2O(ice) → H3O+(ice)
H3O+(ice) + H+ → H2O+(ice) + H2+
H3O+(ice) → H2O+(ice) + H
H + H+ → H2+
H+ + H2O(ice) → H2O+(ice) (ground state) + H,

10 20 30 400
200
400
600
800
1000CH3
+Int
ensit
y
m/z
ASWCW
100 ML H2O
+2 eV CH3
+
+
+
Cu (125 K & 142 K)
Mass spectrum generated upon the collision of 2 eV CH3+ on ASW and CW surfaces at
125 K. The process is represented in cartoon form in the inset. Clear interactiondifference is observed for two surfaces.
Ion scattering senses surface structure

Usharani, S., Srividhya, J., Gopinathan, M. S., Pradeep, T. (2005) Concentration ofCO2 over melting ice oscillates. Physical Review Letters, 93, 048304.
Cyriac, J., Pradeep, T. (2005) Structural transformation in formic acid on ultra cold ice surfaces. Chemical Physics Letters, 402, 116.
Cyriac, J., Pradeep, T. (2007) Probing difference in diffusivity of chloromethanes through water ice in the temperature range of 110-150 K. Journal of Physical Chemistry C, 111, 8557.
Cyriac, J., Pradeep, T. (2008) Interaction of carboxylic acids and water ice probed by argon ion induced chemical sputtering. Journal of Physical Chemistry C, 112, 1604.
Cyriac, J., Pradeep, T. (2008) Structural reorganization on amorphous ice films below 120 K revealed by near-thermal (~1 eV) argon ion scattering. Journal of Physical Chemistry C, 112, 5129.
Naresh Kumar, G.; Cyriac, J.; Bag, S.; Pradeep, T. (2009) Incomplete diffusive mixing of n-butanol with amorphous solid water in the temperature range of 110-150 K, Journal of Physical Chemistry C 113, 14259 .
Cyriac, J.; Pradeep, T.; Souda, R.; Kang, H.; Cooks, R. G. Low energy ion scattering at molecular solids, Chemical Reviews 2010 (accepted proposal).
Soumabha Bag et al. Ultralow energy collisions of protons with ice surfaces make H2+!,
(Submitted).
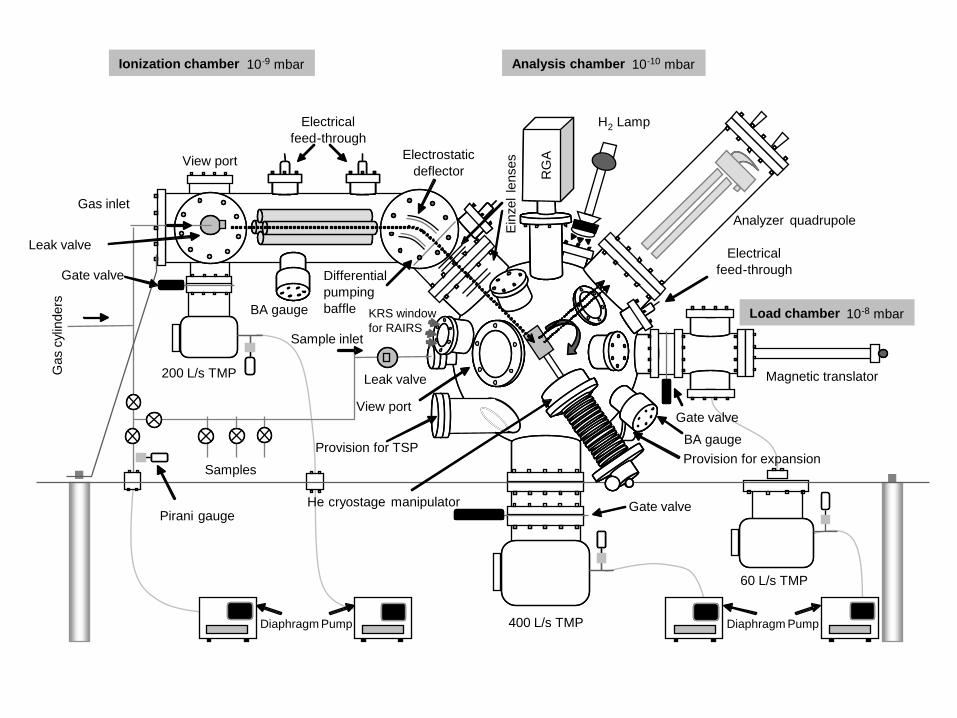
200 L/s TMP
400 L/s TMP
Ionization chamber 10-9 mbar
Electrostaticdeflector
Analyzer quadrupoleEinz
elle
nses
Diaphragm Pump
60 L/s TMP
Diaphragm Pump
Load chamber 10-8 mbar
Magnetic translator
Gate valve
Gas inlet
Sample inlet
BA gauge
Electricalfeed-through
Analysis chamber 10-10 mbar
Electricalfeed-through
BA gaugeProvision for TSP
View port
Samples
View port
RG
A
H2 Lamp
Pirani gauge
Gas
cyl
inde
rs
Leak valve
Leak valve
Differential pumping baffle
Provision for expansion
He cryostage manipulator Gate valve
Gate valve
KRS window for RAIRS

My DST
Thank you all

IIT Madras
Nano Mission, Department of Science and Technology
Thanks!

105
The effect of substrate on the chemical sputteringspectra. (a)10 ML C2H2Cl4 alone, (b) 10 MLC2H2Cl4@50 ML CCl4 and (c) 10 ML C2H2Cl4@50 MLCCl4@10 ML ASW.
Substrate effect

106
The intensities of the CHCl2+ and CHCl3+ peaks are increaseddue to the change in concentration of CHCl3 on the surfacewith raise in temperature. The projectile ion is 30 eV Ar+ andthe system is 50 ML CHCl3@250 ML ASW. With thetemperature rise from 125 K (lower trace) to 130 K (uppertrace), more CHCl3 is diffusing through ice overlayers.
Temperature effect

107
Spectra showing the diffusive mixing of 50 ML of CHCl3with other molecular solids (a) D2O, (b) CCl4 and (d) CH3OH (thickness is 50 ML for each molecular solid).
Chemical similarity

108
(a), (b) and (c) are the Ar+ induced chemical sputtering spectra from the 50 ML CHCl3@50 ML ASW surface where upper ASW layer is prepared at three different deposition pressures.
Rate of deposition