Embed Size (px)
Citation preview
1
Senvion SA
Report March 7, 2016
2
TABLE OF CONTENTS
Page
Forward-Looking Statements ................................................................................................................................... 3
Industry and Market Data ........................................................................................................................................ 4
Certain Definitions ................................................................................................................................................... 6
Summary .................................................................................................................................................................. 8
Risks Related to Our Market and Our Business ..................................................................................................... 33
Management’s Discussion and Analysis of Financial Condition and Results of Operations ................................. 50
Industry Overview ................................................................................................................................................. 81
Business ................................................................................................................................................................. 95
Regulation ............................................................................................................................................................ 111
Description of Certain Financing Arrangements.................................................................................................. 123
3
FORWARD-LOOKING STATEMENTS
This report contains forward-looking statements. A forward-looking statement is any statement that does
not relate to historical facts or events or to facts or events as of the date of this report. This applies, in particular, to
statements in this report containing information on our future earnings capacity, plans and expectations regarding
our business growth and profitability, and the general economic conditions to which we are exposed. Statements
made using words such as “predicts”, “forecasts”, “plans”, “endeavors” or “expects” may be an indication of
forward-looking statements.
The forward-looking statements in this report are subject to risks and uncertainties, as they relate to
future events, and are based on estimates and assessments made to the best of the Senvion’s present knowledge.
These forward-looking statements are based on assumptions, uncertainties and other factors, the occurrence or
non-occurrence of which could cause Senvion’s actual results, including the financial condition and profitability
of the Senvion Group, to differ materially from or fail to meet the expectations expressed or implied in the
forward-looking statements. Even if the Senvion Group’s results meet the expectations expressed herein, they may
not be indicative of the results of any succeeding periods. These expressions can be found in several sections in
this report, particularly in the sections entitled “Risks Related to Our Market and Our Business”, “Industry
Overview”, “Business” and “Regulation”, and wherever information is contained in this report regarding our
intentions, beliefs, or current expectations relating to its future financial condition and results of operations, plans,
liquidity, business outlook, growth, strategy and profitability, as well as the economic and regulatory environment
to which we are subject.
4
INDUSTRY AND MARKET DATA
In this report, we rely on and refer to statistical and other information regarding our business and the
markets in which we operate and compete. The market data and certain economic and industry data and forecasts
used in this report were obtained from market research, governmental and other publicly available information,
independent industry publications and reports prepared by industry consultants. Industry publications and other
third-party surveys and forecasts generally state that the information contained therein has been obtained from
sources believed to be reliable, but that the accuracy and completeness of such information is not guaranteed.
While we have endeavored to accurately extract and reproduce data from such sources, we have not independently
verified such data and cannot guarantee the accuracy or completeness thereof.
Except as otherwise indicated, the information contained in this report on the market environment,
market developments, growth rates, market trends and competition in the markets and segments in which the
Senvion Group operates or which are served by the Senvion Group are based on the Senvion Group’s assessments.
These assessments, in turn, are based in part on internal observations of the markets and on various market
studies.
The following studies were used in the preparation of this report:
American Wind Energy Association (“AMEA”): U.S. Wind Industry Third Quarter 2015 Market
Report (October 2015);
Bloomberg New Energy Finance (“BNEF”): Early Repowering – a second spring for wind projects?
(September 2014) (“BNEF Repowering”);
BNEF: HI 2015 LCOE Wind Update (March 2015) (“BNEF LCOE”);
BNEF: Company Report (July 2015) (“BNEF Company Report”);
BNEF: 2015 Global Wind Turbine Market Shares (February 2016) (“BNEF Market Shares”);
BNEF: Q4 2015 European Policy Outlook (October 2015) (“BNEF Europe Outlook”);
BNEF: Renewable Generation Shares (January 2016) (“BNEF Generation”);
Bundesnetzanzeiger (January 2016);
Finnish Windpower Association (“FWA”) website;
Global Wind Energy Council (“GWEC”): Global Wind Report, Annual Market Update 2008 (April
2009); 2012 (April 2013), 2013 (April 2014), 2014 (April 2015);
International Energy Agency (“IEA”): Wind Energy Outlook 2015 (November 2015) (“IEA
Outlook”);
IEA: Wind 2014 Annual Report (August 2015) (“IEA Wind”);
IEA: Technology Roadmap Energy Storage (March 2014) (“IEA Storage”);
IEA: Ireland 2012 Review (July 2012) (“IEA Ireland”);
MAKE Consulting: Global Wind Power Asset Ownership (October 2014) (“MAKE Consulting
Ownership”);
MAKE Consulting: Latin America Wind Power Outlook (April 2015) (“MAKE Consulting Latin
America”);
5
MAKE Consulting: Global Wind Turbine O&M Sector Report (July 2015) (“MAKE Consulting
O&M Sector Report”);
MAKE Consulting: Global Wind Turbine OEM Market Shares for top-15 Wind Turbine OEM’s
2014, 2013, 2012 and 2011 (July 2015) (“MAKE Consulting Market Shares”);
MAKE Consulting: Evolving IPP Dynamics in India’s Wind Power Market (September 2015)
(“MAKE Consulting India”);
MAKE Consulting: Global Wind Power Asset Ownership (September 2015) (“MAKE Consulting
Ownership”);
MAKE Consulting: Q4/2015 – Global Wind Power Market Outlook Update (November 2015)
(“MAKE Consulting Outlook”);
MAKE Consulting: Global Market Status and Highlights (November 2015) (“MAKE Consulting
Highlights”);
MAKE Consulting: Global Wind Turbine Trends (December 2015) (“MAKE Consulting Trends”);
MAKE Consulting; Global Wind Turbine Supply Chain (December 2015) (“MAKE Consulting
Supply Chain”);
REN21: Renewables 2014 Global Status Report (June 2013) (“REN21, 2014”);
REN21: Renewables 2015 Global Status Report (June 2014) (“REN21, 2015”); and
Renewable Energy World: Germany Inaugurates 5 MW Wind Turbine Prototype (February 2005).
This report also contains estimates of market and other data and information derived from such data that
cannot be obtained from publications by market research institutes or from other independent sources. Such
information is partly based on our own market observations, the evaluation of industry information (from
conferences, sector events, etc.) or internal assessments.
We give no warranty for the accuracy of our own estimates and the information derived from them. They
may differ from estimates made by our competitors or from future studies conducted by market research institutes
or other independent sources.
6
CERTAIN DEFINITIONS
Acquisition Refers to the acquisition by Holding of the entire share capital of Senvion
from AE Rotor Holding B.V., SE Drive Technik GmbH, Suzlon
Windenergie GmbH and RPW Investments, S.A., which was
consummated on April 29, 2015.
Acquisition Agreement The share purchase agreement, dated as of January 22, 2015 and among
Holding, as purchaser, the Sellers, as sellers, and Suzlon Energy Limited
governing the Acquisition, as amended from time to time.
CAGR Compounded Annual Growth Rate; the year-over-year growth rate over a
specified period of time. The compound annual growth rate is calculated
by taking the nth root of the total percentage growth rate, where n is the
number of years in the period being considered.
CCP II CCP II Acquisition Luxco S.à r.l.
CCP III CCP III Acquisition Luxco S.à r.l.
Centerbridge Funds Capital Partners II, L.P., Centerbridge Capital Partners III, L.P. or any
funds controlled by Centerbridge Capital Partners II, L.P. or Centerbridge
Capital Partners III, L.P.
Code The German Corporate Governance Code was adopted in February 2002
and last amended on June 12, 2015.
Company Senvion S.A. (formerly Senvion S.à r.l. and Rapid Acquisition Luxco
S.à r.l.) with its registered office at 25C, boulevard Royal, L-2449
Luxembourg, Grand Duchy of Luxembourg, and registered with the
Luxembourg Register of Commerce and Companies (Registre de
Commerce et des Sociétés, Luxembourg) under number B 186599.
EEA European Economic Area.
Elements Disclosure requirements.
EU The European Union.
Euro, euros, € or EUR The single currency of the Member States of the European Union
participating in the third stage of the economic and monetary union
pursuant to the Treaty on the Functioning of the European Union, as
amended or supplemented from time to time.
Financial year 2012/2013, financial
year 2013/2014, financial year
2014/2015
Financial year ended March 31, 2013, financial year ended March 31,
2014 and financial year ended March 31, 2015, respectively.
GDP Gross domestic product; the gross domestic product refers to the market
value of all final goods and services produced within a country (or region,
city, etc.) in a given period.
Holding Senvion Holding GmbH (formerly Blitz 14-490 GmbH and Rapid
Holding GmbH), registered with the commercial register of the local
court (Amtsgericht) of Munich under registration number HRB 215516.
IFRS International Financial Reporting Standards issued by the International
Accounting Standards Board as adopted by the EU.
L/G Facility The €825.0 million multicurrency revolving letter of guarantee facility, as
further described under “Description of Certain Financing
Arrangements—Revolving Credit and L/G Facilities Agreement”.
Luxembourg The Grand Duchy of Luxembourg.
MidCo Senvion MidCo GmbH (formerly Blitz 14-489 GmbH and Rapid MidCo
GmbH), registered with the commercial register of the local court
(Amtsgericht) of Munich under registration number HRB 215532.
Non-IFRS Measures Measures that are not required by, or presented in accordance with, IFRS
7
or the accounting standards of any other jurisdiction.
PECs Preferred equity certificates issued by the Company, which will be
converted into ordinary shares on or about March 15, 2016.
Revolving Credit and L/G
Facilities Agreement
The agreement governing the Revolving Credit Facility and the L/G
Facility, as amended, restated or otherwise modified from time to time.
Revolving Credit Facility The €125.0 million multicurrency revolving credit facility, as further
described under “Description of Certain Financing Arrangements—
Revolving Credit and L/G Facilities Agreement”.
Sellers AE Rotor Holding B.V., SE Drive Technik GmbH, Suzlon Windenergie
GmbH and RPW Investments, S.A., from whom Holding acquired the
entire share capital of Senvion in the Acquisition.
Senvion Senvion GmbH (formerly Senvion AG, Senvion SE and REpower
Systems SE), a limited liability company (Gesellschaft mit beschränkter
Haftung) incorporated under the laws of Germany, registered in the
commercial register of the local court (Amtsgericht) of Hamburg under
registration number HRB 137187.
Senvion Group Senvion together with its fully consolidated subsidiaries.
Short Financial Year 2015 Short financial year (comprising nine months) ended December 31, 2015.
TopCo Senvion TopCo GmbH (formerly Blitz 14-488 GmbH and Rapid TopCo
GmbH), registered with the commercial register of the local court
(Amtsgericht) of Munich under registration number HRB 215540.
Trademark Act The Act (Markengesetz) governs trademark law in Germany.
UK and United Kingdom United Kingdom of Great Britain and Northern Ireland.
U.S. and United States United States of America.
U.S. dollars, dollars, USD, U.S.$ or
$
The lawful currency of the United States.
We, us, our or the Group The Company together with its fully consolidated subsidiaries, except as
otherwise stated.
WTGs Wind turbine generators or wind turbines.
8
SUMMARY
Senvion S.A. (the “Company”) is the holding company of the Group. The Group’s business is primarily
conducted by the relevant operating subsidiaries. The main operating subsidiary is Senvion GmbH (“Senvion”).
Except as otherwise stated, references in the following section to “we,” “us,” “our” or the “Group” are, to
Senvion and its consolidated subsidiaries. Except as otherwise stated, references in the following section to the
“Company” are to Senvion S.A. and its consolidated subsidiaries. For definitions of certain terms used in this
report, see “Certain Definitions”.
Overview
We are a leading global developer and manufacturer of onshore and offshore wind turbine generators (or
wind turbines, “WTGs”), operating in twenty countries with approximately 13.7 gigwatt (“GW”) of cumulative
installed capacity worldwide as of December 31, 2015. We hold a strong competitive position in our core markets of
Germany, the UK, France, Australia and Canada. We are headquartered in Hamburg, Germany.
In the short financial year ended December 31, 2015, we generated revenues of €1,683.0 million, a 14.8%
increase compared to €1,465.4 million in the nine-month period ended December 31, 2014. In the short financial
year ended December 31, 2015, our Adjusted EBITDA (for a reconciliation of result from operating activities to
EBITDA and from EBITDA to Adjusted EBITDA, see “Summary Other Historical Financial and Operating
Data” below) increased 59.6% to €178.0 million (10.6% Adjusted EBITDA margin) from €111.5 million (7.6%
Adjusted EBITDA margin) in the nine-month period ended December 31, 2014. As of December 31, 2015, our total
order book (net firm orders for WTGs and signed contracts for WTGs), including operations and maintenance
(“O&M”) service contracts, amounted to €5,407.3 million, as compared to €4,900.2 million as of December 31,
2014.
For the year ended December 31, 2015, the Company’s pro forma revenues and adjusted pro forma
EBITDA amounted to €2,139.5 million and €210.4 million, respectively, in the period from January 1, 2015 to
December 31, 2015.
We develop, manufacture, assemble, install and market a competitive range of technologically advanced
WTGs with rated outputs ranging from 2 to 6.2 megawatts (“MW”) and rotor diameters ranging from 82 to 152
meters, covering all wind classes in both onshore and offshore markets for a broad base of customers, including
seven of the top twelve global wind utility companies (excluding Chinese market participants) such as RWE, EDF,
Vattenfall and Enel, large-scale wind farm developers and leading independent producers of renewable power
projects. Our revenues from the sale of onshore and offshore WTGs comprised 89.3% of our revenues for the short
financial year ended December 31, 2015.
In addition to WTG development, manufacturing, assembly and installation, we have a large and fast-
growing service book of O&M service contracts with an average length for our active contracts of approximately 10
years as of December 31, 2015, covering WTGs with a total installed capacity of approximately 10.2 GW
representing 74.5% of our installed fleet as of this date. We offer our customers project-specific solutions in the
fields of transportation and installation as well as individually tailored service and maintenance options. Our O&M
services and other revenues comprised 10.7% of our revenues for the short financial year ended December 31, 2015.
In the wind farm development and operations value chain, we focus primarily on assembly and installation
of the wind turbines as well as the operation and maintenance phase and do not primarily engage in project
development or wind farm ownership. Of the components contained in our WTGs, we produce a portion of our
blades and assemble all of our nacelles internally and source other components from a broad network of more than
1,400 closely integrated suppliers. Our WTGs and blades are designed at our research and development “R&D”
centers in Germany and our newly established R&D center in India and manufactured and assembled at our
production facilities in Germany and Portugal. During the short financial year ended December 31, 2015, our
installations of WTGs amounted to approximately 1.4 GW. As one of the pioneers in the wind industry, we have
gained extensive experience from the assembly and installation of approximately 6,625 WTGs as of December 31,
2015. This experience, in combination with our engineering capabilities, has historically enabled us to develop a
diverse range of WTG technologies and establish our competitive position in the market. For instance, we were a
trend setter in developing and successfully installing larger MW rated WTGs, allowing us to significantly expand
our market share in our core European markets where demand for 3 MW and larger WTGs has been increasing,
partially due to limited land available for wind farms and other environmental constraints.
9
In addition to our German engineering heritage, we have an established geographical presence and
longstanding customer relationships in our other European markets, which, together with Germany, accounted for
approximately 76.5% of our cumulative installed capacity as of December 31, 2015. Over the years we have
successfully entered and expanded our operations into North America, Australia and Asia, which accounted for
approximately 23.5% of our cumulative installed capacity as of December 31, 2015.
We believe our business model is well-positioned to capture future growth in the wind energy sector,
targeting both the onshore and offshore markets. With the introduction of our newest 3.4M140 low wind turbine, we
have a complete portfolio of WTGs that allows us to target all wind classes. We operate in countries such as
Germany, France, Canada and Australia, where the regulatory environment and incentive schemes are expected to
remain supportive. In addition, we have a clear focus on entering and realizing market potential in new markets,
such as India and Turkey, as well as markets in Latin America and Nordic Countries, which offer highly attractive
growth potential and where we believe our products are particularly well suited. Moreover, because increased
demand for WTGs triggers increased demand for WTG-related services, the growth of the WTG product market
drives the growth of the WTG service market. As a provider of WTGs and WTG-related services, we therefore
benefit from the growth of both WTG market segments. Our business model has already proven that it is capable of
capturing growth opportunities. As of December 31, 2015, our installed capacity has reached approximately 13.7
GW representing a 14.2% increase from 12.0 GW as of December 31, 2014.
We have a lean and flexible business model, with an in-house focus on high value added activities, which
is characterized by a high proportion of variable costs and an average depreciation and amortization to revenues
ratio which we believe to be lower than that of our competitors. Our cost structure allows us to adapt quickly to
market dynamics, effectively manage capital commitments and support our cash flow generation in more
challenging market environments. We focus our operations on three core activities: WTG assembly, O&M services
and WTG R&D. We also have substantial control over mission critical components, such as blades, approximately
two-thirds of which were manufactured in-house during the short financial year ended December 31, 2015
compared to approximately 15% in 2010. We maintain our focus on sourcing externally other more standardized
components from a broad range of more than 1,400 suppliers, helping us enhance our lean operating business
model.
We have a proven track record of solid financial performance, characterized by strong operating
profitability even in years of weaker demand for WTGs when most of the sector experienced substantial operating
losses. Our revenue base is diversified due to our geographical diversification in addition to our product split
between revenues from the sale of onshore WTGs, revenues from the sale of offshore WTGs and O&M services
together with other revenues, comprising 85.1%, 4.2% and 10.7%, respectively, of our revenues for the short
financial year ended December 31, 2015. Over the financial years ended March 31, 2013 (“financial year
2012/2013”), March 31, 2014 (“financial year 2013/2014”) and March 31, 2015 (“financial year 2014/2015”) and
the short financial year ended December 31, 2015, we have experienced overall positive Adjusted EBIT and
Adjusted EBITDA trends. Our Adjusted EBIT grew at a CAGR of 36.6% over the financial years 2012/2013,
2013/2014 and 2014/2015 and, during the same period, our Adjusted EBITDA grew at a CAGR of 27.0%. In the
short financial year ended December 31, 2015, our Adjusted EBIT and Adjusted EBITDA amounted to €136.3
million and €178.0 million, respectively, as compared to €72.3 million and €111.5 million, respectively, for the
nine-month period ended December 31, 2014.
Our Competitive Strengths
We believe that we have a number of core competitive strengths that enable us to compete effectively in
our markets, including:
Structural growth industry protected by high barriers to entry
The renewable energy market is characterized by favorable long-term growth trends. Demand for
electricity has increased consistently, with global electricity generation growing at a CAGR of approximately 3%
over the past two decades (Source: IEA Outlook, 2015). Over the next two decades, electricity demand is expected
to continue increasing at a similar rate driven by sustained industrial and household consumption (Source: IEA
Outlook, 2015). Despite fossil fuels and nuclear power still representing a large share of global electricity
generation today, onshore and offshore wind generated electricity is expected to grow strongly at a CAGR of 12.0%
between 2013 and 2020 compared to a CAGR of 10.5% for other renewables (including bioenergy, solar, and
marine) and 0.9% for conventional power (including coal, oil, gas and nuclear) between 2013 and 2020,
respectively (Source: IEA Outlook, 2015). The growth in wind generated energy is driven by several factors
10
including, increased awareness of climate change and global warming, national targets to reduce dependency on
conventional or imported energy sources and diversify away from fossil fuels, and significantly improved relative
cost competitiveness (Source: GWEC, 2015).
In order to reduce CO2 emissions and create a path to sustainable growth, governments in our core markets
have set national and international targets for sourcing energy from renewables. These targets are expected to
support the sale of our products going forward through a combination of FITs or some form of tax incentives. For
instance, the European Union has set targets to increase the share of renewable energy consumption to 20% by
2020. In addition, in 2014, the European Council agreed on new targets for 2030 with the objective of reducing
emissions of greenhouse gases by at least 40% from 1990 levels, improving energy efficiency by increasing the
share of renewable energy to 27% by 2030. Some countries, such as Germany, have set even more ambitious
targets. Other countries outside the European Union, such as Australia, Turkey and India, also have targets, which
we believe will strengthen the demand for our products going forward. In these markets, we believe the penetration
of renewable power generation will increase substantially going forward.
In December 2015, the 2015 United Nations Climate Change Conference (“COP21”) took place in Paris.
COP 21 reached a historic universal agreement (the “Paris Agreement”) of the 196 countries participating,
including all of our core markets, Germany, the UK, France, Canada and Australia and all our potential new
markets, India, Turkey, Japan, Mexico, Norway, Finland, Sweden, Chile, Peru and Uruguay. Among other
measures, the participants intend to hold the increase in global average temperature to below 2°C above pre-
industrial levels by reducing emissions to 40 gigatons or to 1.5°C above pre-industrial levels by reducing emissions
to a level to be identified in a special report to be published in 2018, peak greenhouse gas emissions as soon as
possible and achieve a balance between sources and sinks of greenhouse gasses in the second half of this century,
and provide $100 billion a year in climate finance for developing countries by 2020, with a commitment to
providing further financing in the future. Importantly, from 2020 onwards, countries will be required to update their
greenhouse gas emission targets every five years by submitting new reduction plans. This will prevent a locking in
of current reduction targets and sustain the need for more advanced alternative energy technologies.
In July 2014, the EU and 17 other members of the World Trade Organization, including our core markets,
Germany, the UK, France, Canada and Australia and our potential new markets, Japan, Norway and Turkey, began
negotiating an Environmental Goods Agreement with the goal to remove barriers to trade in environmentally
friendly or “green” goods that are crucial for environmental protection and climate change mitigation. Green goods
include those which generate renewable energy such as wind turbines. The countries involved in the negotiations
account for approximately 90% of world trade in green goods. We believe free trade in green goods will help reduce
the cost of our products and increase demand for our products and the penetration of renewable power generation.
Wind energy has a strong position within renewables due to its proven technology and attractive relative
cost compared to alternative forms of energy, with the current average cost of wind energy in certain areas nearing
the wholesale price of purchasing power from the grid in a relevant country (“grid parity”). Wind energy (onshore
and offshore) is also characterized by low water consumption and is expected to outpace other renewable energy
technologies and account for 51% of total electricity generated from renewables, excluding hydro, by 2020 (Source:
IEA Outlook, 2015). We believe demand for wind energy will be driven by continued new installations as well as,
in more developed wind markets, the replacement of older WTGs with more efficient WTGs, a process known as
repowering. In addition, we expect declining LCoE to further push WTGs towards grid parity and thereby
contribute to sustainable future growth of the industry.
As onshore wind is a mature industry with gradual technological improvements and long development
cycles, potential market entrants face long-term barriers to entry. Technological barriers to entry include the
requirement for significant initial start-up investments to reach critical mass and economies of scale as well as
continuous R&D investments and innovations in order to maintain high quality and price competitive products.
Moreover, significant operational barriers exist. For example, customers favor WTG manufacturers with which they
have existing relationships and experience. Moreover, most of our customers require bank financing to purchase our
WTGs. The ability of customers to obtain such financing depends, in part, on the willingness of banks and other
financing institutions to provide loans, which in turn depends on the track record of the WTG supplier. In addition,
electrical grids have complex technical and regulatory requirements for access to be navigated and managed. All
these barriers to entry have prevented the emergence of a new major WTG manufacturer in the WTG industry over
the past ten years (Source: MAKE Consulting, 2015). They have also enabled the top ten WTG manufacturers to
maintain their combined global market share (excluding China) over the last four years with 93.4% (2014), 92.0%
(2013), 90.4% (2012) and 90.9% (2011) (Source: MAKE Consulting Market Shares, 2015). Our business model is
designed to capture future growth in the wind energy sector, targeting both the onshore and offshore markets and
11
benefit from the supportive underlying sectoral growth trends. We are a well-established market participant with an
established R&D pipeline, proven technologies, long-history of successfully executed projects and a strong and
resilient financial condition. As a result, as of December 31, 2015, our installed capacity has increased by
approximately 1.4 GW (or 15.1%) as compared to 12.0 GW as of December 31, 2014, to reach approximately 13.7
GW.
Established wind turbine manufacturer well positioned to capture tangible growth
We are a leading global developer and manufacturer of onshore and offshore WTGs, operating in twenty
countries with approximately 13.7 GW of cumulative installed capacity worldwide as of December 31, 2015. Our
core markets are Germany, the UK, France, Australia and Canada. Germany is Europe’s largest wind energy
market. Of the 12.9 GW of wind energy installed across Europe in 2014, 41% was installed in Germany (Source:
GWEC, 2015). Our market share in Germany grew 12%, from 11% in 2012 to 14% in 2014 and to 19% in 2015,
making us the third largest WTG manufacturer in Germany (Source: MAKE Consulting Market Shares, 2015;
Bundesnetzanzeiger, 2016). In the short financial year ended December 31, 2015, we installed 494.6 MW in
Germany and as of December 31, 2015, we have a cumulative installed capacity of 4.5 GW in Germany. The UK is
Europe’s second largest wind energy market. Based on recent orders, we expect 2016 to be our best year to date for
installations in the UK and to show significant growth. Our market share in the UK remained stable at 10% from
2012 to 2014 for the onshore segment and we were the sixth largest WTG manufacturer in the UK in 2014 (Source:
MAKE Consulting Market Shares, 2015). In the short financial year ended December 31, 2015, we installed 237.6
MW in the UK and as of December 31, 2015, we have a cumulative installed capacity of 1.5 GW in the UK. France
is Europe’s third largest wind energy market. Our market share in France grew 3%, from 17% in 2012 to 20% in
2014 and we were the third largest WTG manufacturer in 2014 (Source: MAKE Consulting Market Shares, 2015).
As of December 31, 2015, we have a cumulative installed capacity of 1.9 GW in France. We were ranked third
among onshore WTG manufactures in Europe for 2015 (Source: BNEF Market Shares, 2016). In Australia, we have
installed a total of approximately 440 MW across nine wind farms as of December 31, 2105 and our market share in
Australia grew 19% between 2012 to 2014 from no market share in 2012 to 19% in 2014 (Source: MAKE
Consulting Market Shares, 2015). In addition, we are currently developing Australia’s largest wind farm that will
deliver approximately 650 MW through more than 190 of our WTGs. Further, in Canada, North America’s second
largest market, we achieved 1 GW in cumulative installed capacity in just five years. Our market share in Canada
grew 3%, from 8% in 2012 to 11% in 2014 (Source: MAKE Consulting Market Shares, 2015).
We believe that our well-known name and good reputation in the WTG industry provides us with a
significant advantage in winning business. Our R&D focus helps us protect our technological leadership and enables
us to win markets with well-invested technologies. The low wind market is expected to be the dominant wind class
by 2020 and is expected to account for 50% of the market in 2020 compared to 29% in 2014 (Source: MAKE
Consulting Trends, 2014). The introduction of our new 3.4M140, the largest turbine in its class by rotor diameter
and named the most efficient WTG for low wind speeds (Source: MAKE Consulting Trends, 2015), positions us
well to win new market share in this segment. In addition, our change in ownership marked a significant increase in
our new market opportunities and we are well positioned to utilize our experience in entering new markets such as
Canada and Australia to focus on new markets, in particular India, the Nordic Countries, Mexico, Turkey, and
selected other markets, such as the South Cone Countries, Japan and Ireland. With this new market focus, we
believe that our significant advantages in winning business will help us to increase our addressable market reach by
approximately 60% in GW terms. Further, we have implemented various measures that continue to strengthen and
prolong our diverse array of customer relationships including measures designed to help ensure on-time delivery of
WTG projects and our O&M service offering. These operations, together with our customer-oriented product
portfolio, cost-efficiency, innovation, marketing efforts and track record of more than 20 years in onshore and 10
years in offshore WTGs and our ability to help customers secure financing, contribute significantly to the increasing
loyalty of our customers. We believe these are the key reasons why seven out of the top twelve global wind utility
companies (excluding Chinese market participants) are our customers. Moreover, our diverse customer base, which
includes major international utility customers, such as RWE, EDF, Vattenfall and Enel, also gives us the benefit of
having reliable transaction counterparties.
We believe that our strong competitive position and long-standing costumer relationships place us well to
capture future growth in the onshore and offshore markets, which is also evidenced by our significant order backlog.
As of December 31, 2015, we had a WTG order book of approximately €3,435.8 million (equating to approximately
2.04 times the revenues achieved by our WTG sales business in the short financial year ended December 31, 2015),
of which €1,598.4 million were signed contracts and €1,837.4 million were attributable to net firm orders. To
compare, for the short financial year ended December 31, 2015, our backlog to revenues ratio amounted to 2.0x
calculated based on the revenues generated in the short financial year ended December 31, 2015, which was higher
12
than the average of our peer group based on publicly available information. We have a proven track record of
turning signed contracts into net firm orders. For example, of the signed contracts executed in the financial years
2013/2014 and 2014/2015, Senvion GmbH lost less than 6.0% of such signed contracts during the period on average
and expects to convert the remaining signed contracts into net firm orders, subject to any further cancellations.
Technology pioneer with highly competitive portfolio tailored to market demands
We have established strong market positions in the core markets in which we operate through continued
delivery of reliable, technologically advanced and cost-efficient products, and we are convinced that our focus on
WTG research and development is an efficient use of investments, which protects our technology leadership and
competitive advantage. We believe we are one of the best known names in the WTG industry especially for our 3
MW onshore technology, which we first introduced in the market in 2008. In the short financial year ended
December 31, 2015, we won contracts valued at approximately €1.6 billion due in large part to our advanced
technology, owned patents and track record of successful delivery over multiple orders. Our experience in
developing and successfully installing larger MW-rated WTGs has strengthened our relationships with our
customers and improved our competitive position, especially in our core European markets where demand for
3 MW and larger WTGs has been increasing over the past few years due, in part, to limited land available for wind
farms and other environmental constraints.
We have a competitive multi-MW product portfolio, which ranges from 2 to 6.2 MW WTGs optimized for
different wind speeds and locations. Our onshore product portfolio includes a wide range of WTGs, with nominal
power output ranging from 2 to 3.4 MW, rotor diameters ranging from 82 to 140 meters and hub heights of 58.5 to
143 meters. We believe our wide range of products enables us to offer WTGs that are suitable for a particular
location’s specific wind speeds and climatic conditions, thereby providing our customers with higher energy yields
per unit of investment.
We believe we are a front-runner in the development of new WTG technologies across all wind classes,
with particular expertise in WTGs for high and medium wind speeds. Our R&D provides for a strong product
release pipeline. For example, we built our first 2 MW WTG in 2002, our first 5 MW WTG for offshore in 2006 and
our first 3 MW WTG in 2008. In 2013, as a result of our long-term development and operational experience with 2
MW WTGs, we were awarded a contract for 175 WTGs of our MM82 and MM92 type WTGs (350 MW combined)
in Canada, the largest onshore project in our history thus far. In 2014, we were awarded a contract to install forty-
six 3 MW WTGs in Canada (combined 138 MW), which included our new de-icing technology. More recently, in
October 2015, we were awarded a contract for ten 3.4 M104 WTGs and twenty-two 3.4 M114 WTGs (108.8 MW
combined) in the United Kingdom, our largest onshore project in the United Kingdom to date.
Technological advancements in the production of wind energy are expected to be gradual due to the
maturity of the industry. Generally, product cycles last two to five years and we have an established and well-
structured pipeline. Our product portfolio and focus is shifting to our higher energy rated 3.XM platform which is
demonstrated by our sales and order intake. Since September 2014, we introduced three 3.XM variants (3.4M114,
3.4M140 and 3.2M122), highlighting our renewed focus on the low and medium wind segment. The 3.4M140
WTG, our latest addition to the 3.XM series, is designed for a 25-year operational lifetime and our highest yield for
low-wind onshore locations to date through the use of 68 meter blades that provide for a 20% increase in yield, as
compared to the 3.0M122. The 3.4M140 features our NES technology, new aero-acoustic add-ons, to further reduce
sound at all operational levels and a new pitch control system to reduce turbine load. The 3.4M140 is already
available for sale, and a prototype is scheduled for completion in 2017. In addition, we are continuously upgrading
our WTGs, such as the MM100, where we upgraded its wind class from low wind suitability to medium wind speed
markets, thereby adding a new product variant in our portfolio in an established market segment and we are
developing a new MM platform that we expect to be available for sale in the next two to three years. We also
continuously work on upgrading our existing WTGs, such as our new 3.4M114, which generates higher yields
compared to its predecessor 3.2M114 and benefits from, inter alia, lighter blades and a simplified and accelerated
manufacturing process. Moreover, in November 2015, we acquired the RodPack technology, which substitutes the
standard glass fabrics used in the main girder and enables optimized blade design as well as faster and higher
quality blade production. The RodPack technology allows for simpler manufacturing, reduced manufacturing time,
lighter blades which lead to better load profiles and better material properties than high-modulus glass and standard
unidirectional glass. We already use the RodPack technology for our 6.2M152 and we anticipate integrating it into
our future blade designs. The RodPack technology is exclusively available and used in our WTGs.
13
Fast growing services platform with annuity-like revenues and attractive margins
Our large and growing installed base, the bulk of which is located in developed markets, allows us to
establish a profitable and growing services franchise, which has grown significantly over the past years, providing a
resilient income stream with higher margins relative to our turbine business. Furthermore, the multi-year nature of
the O&M service contracts we enter into as part of our growing service business contributes to more stable and
predictable cash flows. We usually enter into these contracts at the point of sale of our WTGs. Once their term
expires, these O&M service contracts tend to be renewed for an additional period. As of December 31, 2015, our
O&M service contract renewal rate was more than 75%. Moreover, the after-sale servicing of our WTGs provides
us with an opportunity to offer our customers various high-margin upgrade solutions.
The average life of our active O&M service contracts has increased over time, from 8.6 years as of March
31, 2012 to 10.2 years, as of December 31, 2015, and ranged generally from two to 20 years, providing attractive
and visible earnings while adding to the barriers to entry facing our potential competition. As of December 31,
2015, we held O&M service contracts for approximately 74.5% of our installed fleet, compared to an average O&M
coverage of approximately 68% of WTGs serviced by their original manufacturers as of December 31, 2014
(Source: MAKE Consulting O&M Sector Report, 2015). Over the financial years 2012/2013, 2013/2014 and
2014/2015, our O&M service revenues grew at a CAGR of 21.9%. In the short financial year ended December 31,
2015, our O&M services revenues amounted to €177.2 million as compared to €138.1 million for the nine-month
period ended December 31, 2014, which corresponds to a 28.3% increase. Moreover, as of December 31, 2015, we
had an order book for our O&M services of approximately €1,971.5 million.
Flexible, asset-light business model focused on high value added activities
Our business has a successful track record of delivering strong financial results with revenues growth and
resilient profitability even in challenging years for the wind energy sector and we believe that our revenue base is
well diversified due to our broad geographical presence in twenty countries globally and our product split between
revenues from the sale of onshore WTGs, revenues from the sale of offshore WTGs and O&M services together
with other revenues, which comprised 85.1%, 4.2%, and 10.7%, respectively, of the Group’s revenues for the short
financial year ended December 31, 2015. Our revenues from the sale of onshore WTGs increased by 8.2%, from
€1,483.0 million in the financial year 2013/2014 to €1,605.5 million in the financial year 2014/2015, a strong
growth trend which we even surpassed in the short financial year ended December 31, 2015, when we achieved
revenues of €1,432.2 million, compared with €1,236.4 million for the nine months ended December 31, 2014,
representing a growth rate of 15.8%. In addition, we further stabilized our business model and operating margins
through a focus on the fast growing and profitable services business. From the financial year 2012/2013 through the
financial year 2014/2015, our revenues from O&M services grew at a CAGR of 21.9% to €194.0 million. During
the short financial year ended December 31, 2015, we generated revenues of €177.2 million from O&M services,
which corresponds to an increase of 28.3% as compared to €138.1 million for the nine-month period ended
December 31, 2014. Over the financial years 2012/2013, 2013/2014 and 2014/2015 and the short financial year
ended December 31, 2015, we have experienced overall positive Adjusted EBIT and Adjusted EBITDA trends. Our
Adjusted EBIT grew at a CAGR of 36.6% over the financial years 2012/2013, 2013/2014 and 2014/2015 and,
during the same period, our Adjusted EBITDA grew at a CAGR of 27.0%. In the short financial year ended
December 31, 2015, our Adjusted EBIT and Adjusted EBITDA amounted to €136.3 million and €178.0 million,
respectively, as compared to €72.3 million and €111.5 million, respectively, for the nine-month period ended
December 31, 2014.
We also benefit from a flexible “asset light” business model with limited vertical integration and a high
proportion of variable costs, which helps us protect profitability and preserve cash flow generation in more
challenging market dynamics. Our operational efficiency is particularly driven by our lean operating model, which
is characterized by a scalable annual production capacity and an effective supply chain based on well-balanced
internal and external sourcing of product components. In the event of increased demand for our products, we can
swiftly scale up our 3 GW production capacity, for instance, through the introduction of additional work shifts, or
switching manufacturing capacity between our 3.XM and 6.XM WTGs. Our operational efficiency is further
supported by a flexible cost structure based on, among other things, a high rate of part-time and outsourced work. In
addition, we recently achieved gains in production capacity in our Bremerhaven blade facility by reducing
manufacturing cycle time and thus increased the capacity from 145 MW to 220 MW. Our production is primarily
based on assembling externally sourced WTG components and also includes the design, assembly and production of
blades. Our own blade production capacity with the offshore blade production facility in Bremerhaven, Germany
and the onshore blade production facility in Vagos, Portugal provides for roughly two-thirds of our annual blade
requirements. Basing our production on the assembly of sourced WTG components provides us with a higher
14
degree of pricing flexibility with respect to our products, enabling us to pass negative effects from a declining
market on to our suppliers, which we see as a competitive advantage.
Following cost savings of approximately €160 million we generated in the financial year 2013/2014 with
our operational improvement program POWER, we launched an operational improvement program called FOCUS
2015, which generated approximately €100 million in cost savings in the financial year 2014/2015, which was €10
million (approximately 11%) ahead of our initial target. We continue to implement efficiency measures targeted at
savings in our supply chain as well as reductions of indirect fixed costs. We closely monitor all of our efficiency
enhancement measures with rigorous internal reporting and we intend to continue improving our operational
efficiency to further contribute to our profitability.
Additionally, under the new ownership structure, we have emphasized our efforts to significantly decrease
our net working capital. In order to achieve this goal, we have implemented a variety of structural changes, such as
rigorous control of inventory levels throughout the production and value chain and the revision of supplier terms.
Through these controls and processes, we achieved a significant reduction in net working capital already in the short
financial year ended December 31, 2015. We were able to reduce our net working capital significantly from €159.6
million as of March 31, 2015 to €92.5 million as of December 31, 2015 and we are committed to identifying further
potential for a sustainable working capital level. Adjusted for an intergroup loan outstanding in the amount of
€177.3 million granted to Holding and the accrued interest thereon in the amount of €6.1 million as of December 31,
2015, our net working capital decreased by €250.5 million from March 31, 2015 to a negative €90.9 million as of
December 31, 2015, reflecting the substantial improvements achieved in net working capital management during the
short financial year 2015.
Our business is able to operate with limited maintenance capital expenditures. As estimated by the Group’s
management, our maintenance capital expenditures represented approximately one third of our total annual capital
expenditures each year over the last three full financial years. Our total cash payments for the purchase of intangible
assets as a percentage of revenues were 1.0%, 1.5%, 2.3% and 2.1% for the financial years 2012/2013, 2013/2014
and 2014/2015 and for the short financial year ended December 31, 2015, respectively, and are expected to grow as
a result of our focus on expansion into new markets. Our intangible capital expenditures primarily related to
capitalized development costs. Our R&D and growth capital expenditure programs allow us to react to market
requirements and changing market conditions. We are generally able to shift parts of planned expenditures from one
year to another without having any material direct impact on our competitive position. Stable margins combined
with modest maintenance capital expenditure requirements support our cash flow generation. Our Adjusted
EBITDA less capital expenditures (including capitalized R&D), was positive over each of the financial years
2013/2014 and 2014/2015 and the short financial year ended December 31, 2015. In addition, over the financial
years 2012/2013, 2013/2014 and 2014/2015 and the short financial year ended December 31, 2015, depreciation of
property, plant and equipment and amortization of intangible assets for the Group averaged 2.4% of revenues,
which we believe is significantly lower than the average of our peer group based on publicly available information.
Proven platform enabling additional growth from offshore market
The offshore market is expected to grow strongly and reach 9 GW of annual offshore installations in 2020
compared to 1.8 GW in 2014 (Source: MAKE Consulting Outlook, 2015). Offshore projects tend to have much
longer development cycles than onshore projects, primarily due to more difficult planning and permitting processes
and the complications of installing WTGs in water, such as connecting to the grid, long lead times for the
installation of underwater tower foundations, underwater cables and the time required to finance projects. As a
result, these operational and technological requirements create high barriers to entry and the market is dominated by
large one-time projects that are difficult to predict.
We believe we are one of three leading players globally that have commercially proven technology in the 5
MW+ segment for the challenging offshore market today and we are the leading player with respect to the offshore
5MW+ market, with a market share of over 50% of commissioned offshore projects in Europe (Source: BNEF
Company Report, 2015). We have installed nearly as many 5 and 6 MW WTGs as all of our competitors combined
(Source: BNEF Company Report, 2015). In 2004, we were the first company to successfully install and connect an
offshore 5 MW WTG to the grid (Source: Renewable Energy World, 2005). Following that success, we have further
set ourselves apart from competitors by developing our 6.XM series. When we launched our 6.2M126 in 2008, it
was the most powerful WTG in the industry as measured by nominal output and it is the largest commercially
available turbine by power rating today. In 2014, we successfully installed and commissioned the prototype of the
6.2M152, which benefits from a larger rotor diameter and a significantly extended lifetime from 20 years to 25
years, resulting in a 20% rise in energy yields. Our cumulative commissioned offshore capacity has increased from
15
50 MW in 2007 to 939 MW in 2015 and as of December 31, 2015, we had installed approximately 108 WTGs of
the 6.XM series. In addition, in 2015, we were awarded a firm contract for eighteen 6.2 MW WTGs for the
Nordergründe offshore wind farm (111 MW combined) and another firm contract for fifty-four 6.2 MW WTGs for
the Nordsee One offshore wind farm (332 MW combined). Our offshore technology is in demand and our offshore
production capacity is fully booked for the next two years.
Experienced management motivated to develop Senvion as an independent company
We benefit from the contribution of a dedicated management team with diverse international backgrounds
and combined energy and technology industry expertise, with the members of the Management Board of the
Company and senior management, comprising the department heads of our core functions, product & technology,
global blades, global nacelles, supply chain, sales, project management, service & quality, legal and human
resources, having an average of more than 20 years of experience. We believe that our management team has
accumulated significant experience in adapting internationally recognized wind energy concepts and practices to
local conditions in the markets where we operate. Our management team seeks to both ensure operational
excellence and maintain close relationships with our key customers to ensure the performance of our business. Their
achievements include our revenue momentum in the financial years 2012/2013, 2013/2014 and 2014/2015 and the
short financial year ended December 31, 2015, in particular due to the continued success of our efficiency
enhancement programs and the substantial decrease in our net working capital. Moreover, our new CEO Dr. Jürgen
M. Geissinger, who joined us in December 2015, is one of Germany’s foremost business leaders and brings with
him an outstanding track record of growing technology-based engineering companies. Dr. Geissinger previously
spent 15 years as the chief executive officer of Schaeffler Group, a German technology provider to the automotive
and industrial sectors, where he played a key role in defining and executing the firm’s growth strategy, including its
highly successful expansion in emerging markets and its key acquisitions and grew Schaeffler Group’s revenues by
approximately €10 billion, from approximately €2 billion in 1998 to approximately €12 billion in 2013. After his
departure from Schaeffler Group, Dr. Geissinger continued to advise a number of German and international
industrial companies and remains active on the supervisory board of MTU Aero Engines and the board of directors
of the Sandvik Group, among others. He has the proven capabilities required to drive exceptional business growth
by creating strategic clarity, driving innovation and quality, while ensuring disciplined execution globally. We
believe that his experience combined with his passion for technology will help ensure that we continue to be an
innovation leader and expand our presence in our existing and several new markets. All members of the
Management Board of the Company have invested, alongside with CCP II, CCP III, Rapid Partners L.P. and other
managers, senior employees and consultants of the Group, in the Company. The investment is made through
Management LP, a partnership organized under the laws of the Cayman Islands that directly holds shares in the
Company.
Our Business Strategy
Based on our key strengths, our strategy focuses on growth in our profitability and is based on the
following pillars:
Win and retain market share in existing markets with country specific strategies and strong entry into the low-
wind segment
To win market share in our existing core markets, we are pursuing strategies tailored to the conditions of
each market. In Germany, we aim to maintain our leadership position and plan to increase our sales coverage for
small customers and provide them with additional support during the project development phase and throughout the
auction process. We also plan to intensify contact with our mid-size and large customers by implementing a key
account management system. In addition, we plan to target the low wind market segment with our new product
offering. In the UK, we aim to leverage our relationships with key developers who have won allocations in CfD
auctions and thus enhance our market leading position. We also aim to support sales by offering co-investment as an
option to our customers and adopting a more collaborative approach and also providing strong sales support for
project delivery in leveraging external agencies in 2016. This strategy will also help us to control our fixed costs. In
France, we target a higher market share and intend to focus on the growing low wind market via ongoing
incremental LCoE improvements to our products through the use of upgrades such as the addition of Vortex
generators (which are aerodynamic devices attached to rotor blades in order to modify wind flow around the blade
and enhance efficiency) to installed WTGs. In Australia, we aim to capture further market share of the expected
market growth underpinned by our development of Australia’s largest wind farm and consolidate our leading
position. Our key focus in Australia is large project delivery through cross-function collaboration, optimization and
aggressive costing. In Canada, we are now focusing on service operations, while leveraging our existing client
16
relationships to win new contracts. We aim to leverage our relationships with current large utilities to capture
additional service market share.
The low wind market is expected to grow from its current 29% share of annual installed capacity to 50%
by 2020 (Source: MAKE Consulting Trends, 2015). The low wind market is growing in our key markets of
Germany, the UK and France and to meet this increasing demand, we developed our highest yield onshore WTG for
low wind locations to date, the 3.4M140, which we presented in September 2015. The 3.4M140 is equipped with a
sound-optimized blade profile and a new pitch control system to reduce turbine load and ensure a cost-efficient
design. Compared with the 3.0M122, the 3.4M140 generates 20% greater yields. The 3.4M140 is named the most
efficient WTG for low wind speeds (Source: MAKE Consulting Trends, 2015) and it achieves 20% higher yield
than our 3.0M122.
Capitalize on opportunities in key targeted new markets as independent company
We have implemented a selective detailed approach to determine which new market opportunities to seize.
This approach includes evaluating the market attractiveness based on market size, market growth, competitor
judgment and commercial attractiveness as well as the market fit based on turbine suitability, portfolio fit, customer
relationships and supply chain competitiveness. We have proven our ability to enter new markets successfully when
we expanded into Australia in 2011 and into Canada in 2007 where we achieved market shares of 11% and 19%,
respectively, by 2014 (Source: MAKE Consulting Market Shares, 2015).
As a result of our evaluation process, we now intend to focus our sales efforts in particular on India,
selected South Cone Countries, the Nordic Countries, and selected other markets, such as Mexico, Turkey, Japan
and Ireland, where we believe that we have a competitive advantage based on our product portfolio. In addition, we
believe that, driven by government targets for wind energy capacity and supportive regulatory regimes, these
markets provide significant potential, with cumulative capacity installations between 2016 and 2020 estimated to
amount to 39.4 GW for these markets (with India accounting for 20.0 GW, the South Cone Countries for 3.2 GW
and the Nordic Countries for 7.8 GW) (Source: MAKE Consulting Outlook, 2015). Our strategy in new markets
also involves close cooperation with key customers to support their market entry and follow them as they enter new
markets. Our growth into the Nordic Countries and Ireland is covered by our EU North sales team. We are
leveraging our existing relationships with large utilities and wind energy production developers in the UK to
continue to supply our products to them as they move into these markets. We are also utilizing this strategy in
Mexico where we are leveraging our global relationships in North America and Europe. In Chile, we also plan to
utilize our existing relationships with global developers and have installed an experienced local Head of Sales in
Chile. This strategy also includes our recent introduction of co-financing as an option for our customers. In the
Nordic Countries, our co-financing strategy played an important role in moving contract negotiations into an
advanced stage and allowing us to achieve a signed contract (with conditions) of around 111 MW. We are
convinced that our co-financing offering will be instrumental to our success, in particular in the Nordic Countries,
the South Cone Countries we are targeting and Mexico.
We have already made progress towards these expansion initiatives. For example, we have established a
local presence in the form of a sales or representative office in Turkey, Japan, Sweden, Chile and India. Our initial
sales and marketing efforts have already resulted in first-time signed orders in some of these markets, including in
Norway and Japan. We believe that we are particularly well positioned to enter the Indian market, which remains
the largest market in the Asia-Pacific region after China (Source: MAKE Consulting Outlook, 2015). In addition,
the Indian market is predominantly served by local players (Source: MAKE Consulting India, 2015). As part of our
strategy to enter the Indian market, we established a fully operational R&D facility in September 2015 and we plan
to build and use a local supply chain to supply, install and service our WTGs for low wind areas in India and we aim
to achieve a significant majority of local sourcing in the medium term. Our strategy to expand in the Indian market
through adapting to the market includes our goal to build an empowered local team and strengthen our local
presence by appointing a CEO for India who has extensive knowledge of the local market. In addition, we have
gained significant insight when we were part of the Suzlon Group prior to the Acquisition, and several members of
our senior management team have operational experience in and strong ties to the country. We also intend to
enlarge our low cost offering in India with a focus on dedicated products and localized production and supply chain.
Currently, we are in the process of developing a new 2MW WTG with a larger diameter specifically targeted at the
Indian market, which is still predominantly a 2MW market. In addition, we aim to quickly transition to offering
turnkey solutions in line with Indian market expectations. We believe that we have the know-how and experience to
adjust quickly to the local requirements and business practices in the new markets we target.
17
Foster technological leadership through continued focus on R&D and LCoE reduction
We are a technology pioneer with an extensive product pipeline across different wind turbine categories,
sizes and wind classes and we are building a pipeline of products to complement our existing products. We have
cultivated extensive engineering know-how over several decades and continuously develop new products to meet
the technical requirements of our customers and geographical markets where we operate. Over the financial years
2012/2013, 2013/2014 and 2014/2015 and the short financial year ended December 31, 2015, we spent €193.2
million in R&D costs, have been granted more than 380 patents and disclosed over 880 inventions.
We aim to further reduce LCoE in our future products. The main drivers for LCoE reduction are increases
in the annual energy production of WTGs and reduction of costs associated with WTGs. We have developed
technological innovations ahead of our competitors that allow us to demonstrate leap reductions in LCoE. For
example, in 2015, we launched our latest 3.XM platform turbine, our 3.4M140 which will be available from 2018.
The 3.4M140 is named the most efficient WTG for low wind speeds (Source: MAKE Consulting Trends, 2015) and
it achieves 20% higher yield than our 3.0M122. With the 3.4M140 we have expanded the WTG service life by five
years to 25 years and the available WTG diameter by eighteen meters to available diameters from 122 to 140
meters. The 3.4M140 will be available in hub heights of 110 meters and 130 meters with 68 meter blades. The
combination of these hub heights and blade length permits higher yields at low-wind locations such as forest and
mountainous areas. The 3.4M140 also features our NES technology, new aeroacoustic add-ons, to further reduce
sound at all operational levels, and a new pitch control system to reduce turbine load.
Our R&D efforts result in a strong product release pipeline and a comprehensive future portfolio. We are
developing WTG models based on each of our product platforms and we expect to start commercialization of new
products in the MM, 3.XM and 6.XM series in the next two to three years, including a 3/4.XM WTG for medium
wind areas. Supplementary to our own R&D, we may also consider appropriate value-added technology
acquisitions, such as our recent acquisition of the RodPack technology.
Enhancement of operational excellence
In furtherance of our aim to reduce LCoE for our customers, we are continuously identifying and
implementing a number of measures for efficiency gains throughout our value chain. In particular, we aim to further
reduce our indirect fixed costs. Our initiatives seek to drive down our costs of materials, for example, through the
use of hybrid towers and high steel towers. Active management of our supply chain also enables us to realize cost
savings. We are continuously seeking and identifying additional and alternative suppliers and renegotiating with
existing suppliers to further reduce our costs. When selecting suppliers, we intend to increasingly utilize the tender
process to identify the lowest cost supplier. We believe that value engineering and the optimization of our internal
design can also help to drive down LCoE. The standardization and modularization of our WTGs minimizes
complexity and maximizes flexibility and allows us to cater to the specific needs of each market. We aim to achieve
that through optimizations of internal designs to increase the percentage of standardized components in our WTGs
and to standardize the installation process, which can reduce the duration and cost of WTG installation. In addition,
project management enhancements and reduction of the installation cycle improve efficiency and reduce LCoE by,
for example, reducing the number of crane rental days required to install a WTG. Our additional levers to reduce
costs include strict operating expenses control, the off-shoring of some of our operations by, for example, shifting
some non-core activities or functions to India, and near-shoring some of our operations by, for example, shifting
support functions to Eastern Europe. Moreover, we intend to phase out more expensive office space, and
consolidate our production facilities and to achieve further productivity gains.
We are also in the process of implementing a local supply chain strategy in our new target markets, in
particular with respect to India and Turkey, not only to enable us to meet local content requirements that trigger
regulatory benefits such as higher FITs in Turkey and reduce costs in India. We intend to source a significant
majority of components required for the Indian market locally in the short term and leverage our local supply chain
in India to create a hub to supply other countries in the long term. In Turkey, we target a majority of local sourcing
in the short term, beginning with towers and then blades, generators and converter cabinets. Globally, we aim to
achieve localization by combining local suppliers and global suppliers who have a local presence. Furthermore, as
part of our efforts to improve our cost base, we aim to increasingly shift our supplier base to low-cost regions such
as Eastern Europe and Asia, where we recently opened an office in Shanghai. We are currently sourcing less than
5% from Asia and expect to reach a double digit sourcing ratio in the long term. Our local supply chain strategy also
involves active management of suppliers and continuous identification of additional and alternative suppliers and
renegotiation of supply contract to achieve costs reductions.
18
References in following section to “we”, “our”, “us”, and the “Group” refer to Senvion S.A. and its consolidated
subsidiaries, taken as a whole.
Recent Developments
The Company was converted into a Luxembourg public limited liability company (société anonyme) on
March 3, 2016. Its Articles of Association were amended at the same extraordinary general shareholders’ meeting
held on March 3, 2016. The Articles of Association will be further amended in the course of the capital increase to
be effected shortly on or about March 15, 2016.
Outlook
In the financial year 2016, we are targeting a high single-digit percentage growth rate of our revenues
taking into account the moderately positive worldwide economic environment, the positive trend for our products in
particular in Germany, United Kingdom and Canada, as evidenced by our order book attributable to such markets,
the execution of two large offshore orders and the strong anticipated growth of our service business. We envisage an
acceleration of this growth rate in the mid-term once our 3.4M140 WTG is available for sale and as we strive to
lever our strong competitive position to outperform the expected development of the low-wind market segment.
Regarding our net result for the period, we strive to achieve moderate growth for the financial year 2016 as
compared to the prior financial year 2015. Despite the expected revenue growth and the anticipated positive effects
of our continued operational efficiency improvements, our EBIT and EBITDA margins in the financial year 2016
are expected to remain at the prior year’s level, largely due to expenses expected to be incurred as a result of our
renewed focus on new markets.
A wide range of factors, many of which are outside our control, may/will affect our actual results,
including those described under “Risks Related to Our Market and Our Business”, such as general economic
conditions, regulatory implications, competition and potential defects affecting our WTGs and their installations.
Our results may differ materially from our estimates or planning scenarios, and because of this our business and our
actual results may differ materially from the information presented above. Our results may not be as favorable as
any of the scenarios described. We do not currently plan to update this information or release similar information in
the future. See “Forward-Looking Statements.”
Summary Historical Financial Information
The Senvion GmbH Audited Consolidated Financial Statements March 31, 2015, 2014 and 2013, the
Senvion GmbH Audited Consolidated Financial Statements December 31, 2015 and the Senvion S.A. Audited
Consolidated Financial Statements (in each case, as defined below) are included elsewhere in this report, and the
following summary historical financial information should be read in conjunction therewith, as well as with the
additional consolidated financial information contained in this report, in particular in the sections “Risk Factors”,
“Business” and “Management’s Discussion and Analysis of Financial Condition and Results of Operations”.
The Company was incorporated on April 4, 2014, its wholly-owned direct subsidiary Senvion TopCo
GmbH (“TopCo”) as well as TopCo’s wholly-owned direct subsidiary Senvion MidCo GmbH (“MidCo”) were
incorporated on December 9, 2014 and MidCo’s wholly-owned direct subsidiary Senvion Holding GmbH
(“Holding”) was incorporated on December 8, 2014. The Company, TopCo, MidCo and Holding were acquired by
Centerbridge Funds for the purpose of facilitating the acquisition of the entire share capital of Senvion SE (which
was transformed into Senvion AG on June 25, 2015 and into Senvion GmbH on June 30, 2015) (“Senvion” and,
together with its fully consolidated subsidiaries, the “Senvion Group”, except as otherwise stated) from affiliates of
Suzlon Energy Limited (the “Acquisition”). The Acquisition was completed on April 29, 2015. Prior to the
completion of the Acquisition, the Company, TopCo, MidCo and Holding did not conduct any business operations
and did not have any material assets or liabilities other than those incurred in connection with their respective
incorporations and the Acquisition.
The operating results of Senvion are included in the Senvion S.A. Audited Consolidated Financial
Statements only as of the date the Acquisition was completed (i.e., on April 29, 2015). In order to be presented with
comprehensive financial information which show the material effects of the Acquisition for the entire financial year
ended December 31, 2015, please refer to the financial information provided under “Pro Forma Consolidated
19
Financial Information of Senvion S.à r.l., Luxembourg, for the period from 1 January 2015 to 31 December 2015”,
the purpose of which is to present the Company’s pro forma consolidated income statement for the financial year
ended December 31, 2015 as if the Acquisition had occurred as of January 1, 2015.
In the fourth calendar quarter of 2015, TopCo, MidCo, Holding, Senvion and certain other of Senvion’s
subsidiaries changed their respective financial year end from March 31 to December 31.
The following tables with selected financial information contain:
consolidated financial information of Senvion (i) as of and for the financial years ended March 31,
2015, March 31, 2014 and March 31, 2013, which has been taken or derived from the audited
consolidated financial statements of Senvion as of and for the financial years ended March 31, 2015,
March 31, 2014 and March 31, 2013 prepared in accordance with International Financial Reporting
Standards as adopted by the European Union (“IFRS”) (the “Senvion GmbH Audited
Consolidated Financial Statements March 31, 2015, 2014 and 2013”), as well as from Senvion
Group’s internal accounting records or management reporting systems and (ii) as of and for the
short financial year (comprising nine months) ended December 31, 2015 and for the nine-month
period ended December 31, 2014 which has been taken or derived from the audited consolidated
financial statements of Senvion as of and for the short financial year (comprising nine months)
ended December 31, 2015 (including comparative financial information as of and for the financial
year ended March 31, 2015 and additional comparative financial information for the nine-month
period ended December 31, 2014), prepared in accordance with IFRS (the “Senvion GmbH
Audited Consolidated Financial Statements December 31, 2015” and, together with the Senvion
GmbH Audited Consolidated Financial Statements March 31, 2015, 2014 and 2013, the “Senvion
GmbH Audited Consolidated Financial Statements”), as well as from Senvion Group’s internal
accounting records or management reporting systems; and
consolidated financial information of the Company as of and for the financial year ended December
31, 2015, which has been taken or derived from the audited consolidated financial statements of the
Company as of and for the financial year ended December 31, 2015 (including immaterial financial
information for the period from April 4, 2014, the date of the Company’s formation, to
December 31, 2014, only disclosed in the notes), prepared in accordance with IFRS (the “Senvion
S.A. Audited Consolidated Financial Statements”), as well as from the Group’s internal
accounting records or management reporting systems; the Senvion S.A. Audited Consolidated
Financial Statements include the operating results of Senvion only since April 29, 2015, the closing
date of the Acquisition.
The Senvion GmbH Audited Consolidated Financial Statements March 31, 2015, 2014 and 2013 included
in this report were prepared on a voluntary basis and reflect the change in the accounting policy for revenue
recognition from the sale of onshore wind turbines retrospectively for all periods presented therein. In addition, the
amounts recognized in the Senvion GmbH Audited Consolidated Financial Statements March 31, 2015, 2014 and
2013 have been adjusted in accordance with International Accounting Standard (“IAS”) 10 Events after the
Reporting Period to reflect adjusting events after the reporting period and until December 18, 2015, when the
Senvion GmbH Audited Consolidated Financial Statements March 31, 2015, 2014 and 2013 were authorized for
issue. Therefore, the Senvion GmbH Audited Consolidated Financial Statements March 31, 2015, 2014 and 2013
differ from the financial information presented in the statutory consolidated financial statements of Senvion each as
of and for the financial years ended March 31, 2015, March 31, 2014 and March 31, 2013 prepared in accordance
with section 315a(1) of the German Commercial Code (Handelsgesetzbuch) in compliance with IFRS separately
published before in the electronic Federal Gazette (Bundesanzeiger).
Where financial information is labeled “audited”, this means that it has been taken from the audited
consolidated financial statements mentioned above. The label “unaudited” is used to indicate financial information
that has not been taken from the audited consolidated financial statements mentioned above but was taken from the
Group’s or Senvion Group’s internal accounting records or management reporting systems, or has been calculated
on the basis of figures taken from the above-mentioned sources, unless otherwise indicated. Unless otherwise
indicated, financial information presented in the text and in the tables is commercially rounded to the nearest whole
number or to one digit after the decimal point. The percentage changes that are stated in the text and the tables have
been commercially rounded to the nearest whole number unless stated otherwise. If the figures that are compared
were rounded, the percentage changes are calculated on the basis of such rounded figures. Due to rounding effects,
aggregated figures in the tables may differ from the totals shown and aggregated percentages may not exactly equal
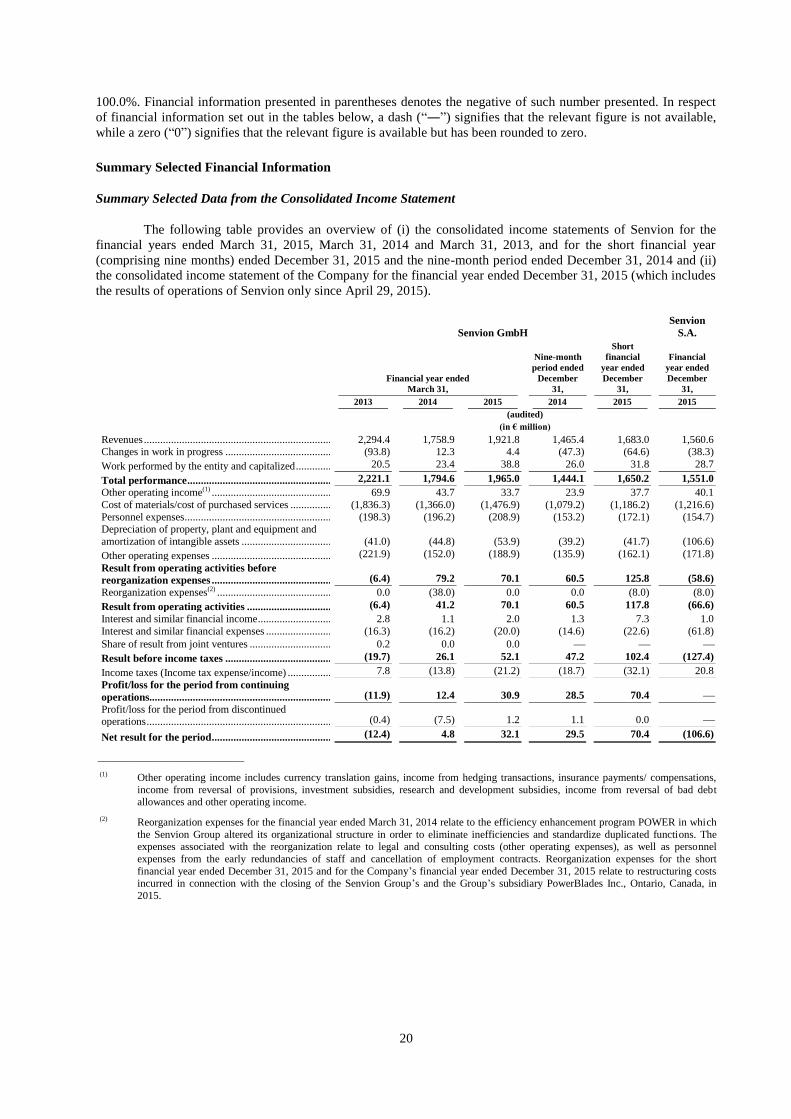
20
100.0%. Financial information presented in parentheses denotes the negative of such number presented. In respect
of financial information set out in the tables below, a dash (“―”) signifies that the relevant figure is not available,
while a zero (“0”) signifies that the relevant figure is available but has been rounded to zero.
Summary Selected Financial Information
Summary Selected Data from the Consolidated Income Statement
The following table provides an overview of (i) the consolidated income statements of Senvion for the
financial years ended March 31, 2015, March 31, 2014 and March 31, 2013, and for the short financial year
(comprising nine months) ended December 31, 2015 and the nine-month period ended December 31, 2014 and (ii)
the consolidated income statement of the Company for the financial year ended December 31, 2015 (which includes
the results of operations of Senvion only since April 29, 2015).
Senvion GmbH
Senvion
S.A.
Financial year ended
March 31,
Nine-month
period ended
December
31,
Short
financial
year ended
December
31,
Financial
year ended
December
31,
2013 2014 2015 2014 2015 2015
(audited)
(in € million)
Revenues ............................................................................................................................... 2,294.4 1,758.9 1,921.8 1,465.4 1,683.0 1,560.6 Changes in work in progress ................................................................................................. (93.8) 12.3 4.4 (47.3) (64.6) (38.3)
Work performed by the entity and capitalized ....................................................................... 20.5 23.4 38.8 26.0 31.8 28.7
Total performance .................................................................................... 2,221.1 1,794.6 1,965.0 1,444.1 1,650.2 1,551.0
Other operating income(1) ...................................................................................................... 69.9 43.7 33.7 23.9 37.7 40.1
Cost of materials/cost of purchased services ......................................................................... (1,836.3) (1,366.0) (1,476.9) (1,079.2) (1,186.2) (1,216.6)
Personnel expenses ................................................................................................................ (198.3) (196.2) (208.9) (153.2) (172.1) (154.7) Depreciation of property, plant and equipment and
amortization of intangible assets ........................................................................................... (41.0) (44.8) (53.9) (39.2) (41.7) (106.6)
Other operating expenses ...................................................................................................... (221.9) (152.0) (188.9) (135.9) (162.1) (171.8)
Result from operating activities before
reorganization expenses ...................................................................................................... (6.4) 79.2 70.1 60.5 125.8 (58.6)
Reorganization expenses(2) .................................................................................................... 0.0 (38.0) 0.0 0.0 (8.0) (8.0)
Result from operating activities .............................................................. (6.4) 41.2 70.1 60.5 117.8 (66.6)
Interest and similar financial income ..................................................................................... 2.8 1.1 2.0 1.3 7.3 1.0
Interest and similar financial expenses .................................................................................. (16.3) (16.2) (20.0) (14.6) (22.6) (61.8)
Share of result from joint ventures ........................................................................................ 0.2 0.0 0.0
Result before income taxes ................................................................................................. (19.7) 26.1 52.1 47.2 102.4 (127.4)
Income taxes (Income tax expense/income) .......................................................................... 7.8 (13.8) (21.2) (18.7) (32.1) 20.8
Profit/loss for the period from continuing
operations.................................................................................................. (11.9) 12.4 30.9 28.5 70.4
Profit/loss for the period from discontinued operations .............................................................................................................................. (0.4) (7.5) 1.2 1.1 0.0
Net result for the period ........................................................................... (12.4) 4.8 32.1 29.5 70.4 (106.6)
___________________________
(1) Other operating income includes currency translation gains, income from hedging transactions, insurance payments/ compensations,
income from reversal of provisions, investment subsidies, research and development subsidies, income from reversal of bad debt allowances and other operating income.
(2) Reorganization expenses for the financial year ended March 31, 2014 relate to the efficiency enhancement program POWER in which
the Senvion Group altered its organizational structure in order to eliminate inefficiencies and standardize duplicated functions. The expenses associated with the reorganization relate to legal and consulting costs (other operating expenses), as well as personnel
expenses from the early redundancies of staff and cancellation of employment contracts. Reorganization expenses for the short
financial year ended December 31, 2015 and for the Company’s financial year ended December 31, 2015 relate to restructuring costs
incurred in connection with the closing of the Senvion Group’s and the Group’s subsidiary PowerBlades Inc., Ontario, Canada, in
2015.
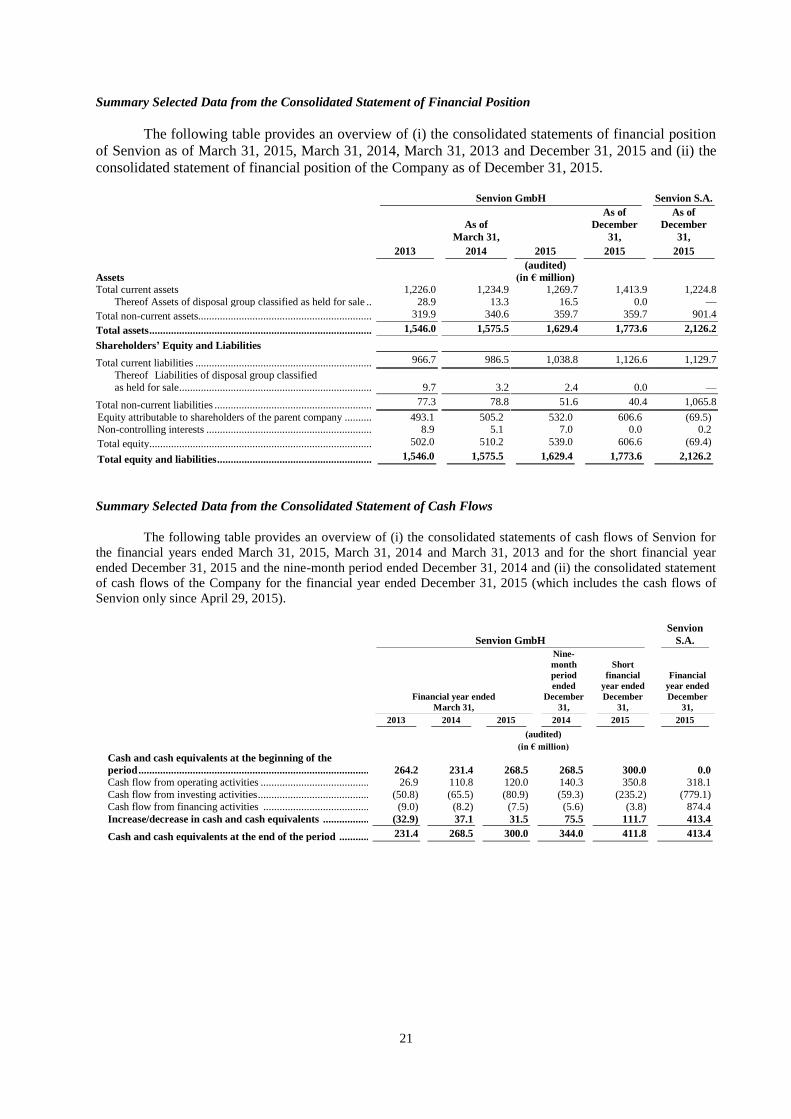
21
Summary Selected Data from the Consolidated Statement of Financial Position
The following table provides an overview of (i) the consolidated statements of financial position
of Senvion as of March 31, 2015, March 31, 2014, March 31, 2013 and December 31, 2015 and (ii) the
consolidated statement of financial position of the Company as of December 31, 2015.
Senvion GmbH Senvion S.A.
As of
March 31,
As of
December
31,
As of
December
31,
2013 2014 2015 2015 2015
(audited)
Assets (in € million)
Total current assets 1,226.0 1,234.9 1,269.7 1,413.9 1,224.8
Thereof Assets of disposal group classified as held for sale ............... 28.9 13.3 16.5 0.0 —
Total non-current assets............................................................................. 319.9 340.6 359.7 359.7 901.4
Total assets ............................................................................................... 1,546.0 1,575.5 1,629.4 1,773.6 2,126.2
Shareholders’ Equity and Liabilities
Total current liabilities .............................................................................. 966.7 986.5 1,038.8 1,126.6 1,129.7
Thereof Liabilities of disposal group classified
as held for sale .................................................................................... 9.7 3.2 2.4 0.0 —
Total non-current liabilities ....................................................................... 77.3 78.8 51.6 40.4 1,065.8
Equity attributable to shareholders of the parent company ........................ 493.1 505.2 532.0 606.6 (69.5) Non-controlling interests ........................................................................... 8.9 5.1 7.0 0.0 0.2
Total equity ................................................................................................ 502.0 510.2 539.0 606.6 (69.4)
Total equity and liabilities ....................................................................... ........................... .................................... 1,546.0 1,575.5 1,629.4 1,773.6 2,126.2
Summary Selected Data from the Consolidated Statement of Cash Flows
The following table provides an overview of (i) the consolidated statements of cash flows of Senvion for
the financial years ended March 31, 2015, March 31, 2014 and March 31, 2013 and for the short financial year
ended December 31, 2015 and the nine-month period ended December 31, 2014 and (ii) the consolidated statement
of cash flows of the Company for the financial year ended December 31, 2015 (which includes the cash flows of
Senvion only since April 29, 2015).
Senvion GmbH
Senvion
S.A.
Financial year ended
March 31,
Nine-
month
period
ended
December
31,
Short
financial
year ended
December
31,
Financial
year ended
December
31,
2013 2014 2015 2014 2015 2015
(audited)
(in € million)
Cash and cash equivalents at the beginning of the
period ................................................................................................... 264.2 231.4 268.5 268.5 300.0 0.0
Cash flow from operating activities ...................................................... 26.9 110.8 120.0 140.3 350.8 318.1
Cash flow from investing activities ....................................................... (50.8) (65.5) (80.9) (59.3) (235.2) (779.1) Cash flow from financing activities ..................................................... (9.0) (8.2) (7.5) (5.6) (3.8) 874.4
Increase/decrease in cash and cash equivalents ............................... (32.9) 37.1 31.5 75.5 111.7 413.4
Cash and cash equivalents at the end of the period ......................... 231.4 268.5 300.0 344.0 411.8 413.4
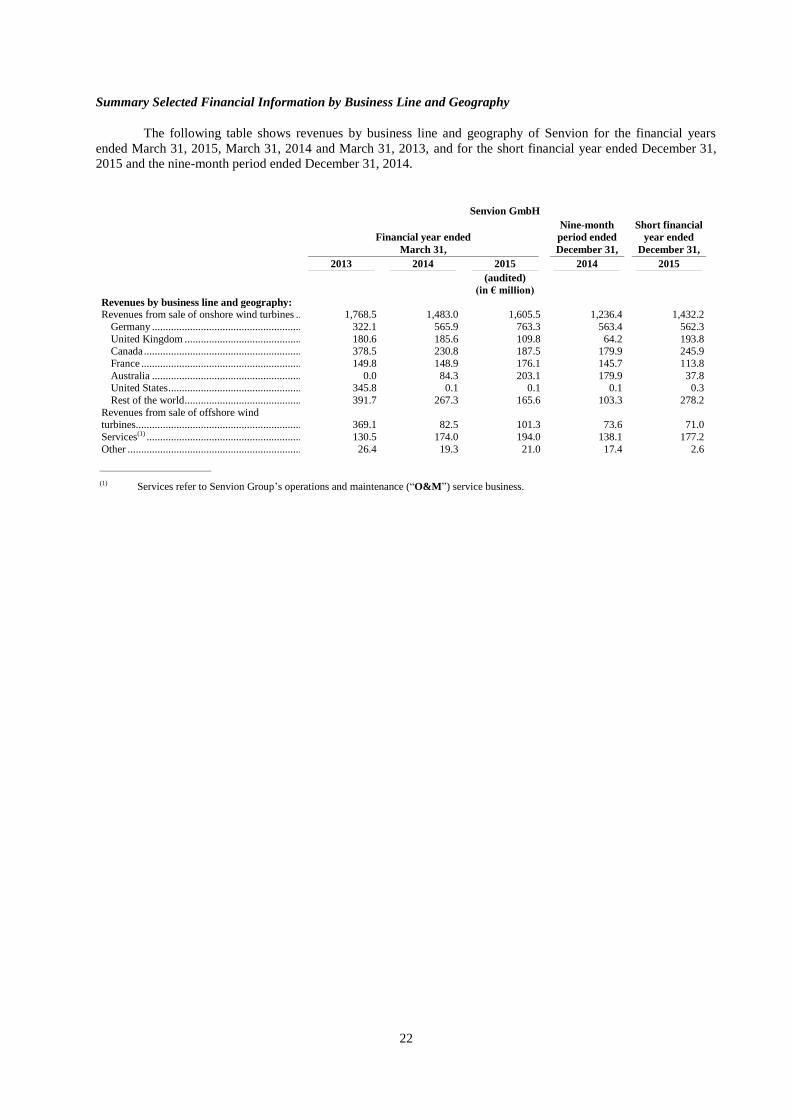
22
Summary Selected Financial Information by Business Line and Geography
The following table shows revenues by business line and geography of Senvion for the financial years
ended March 31, 2015, March 31, 2014 and March 31, 2013, and for the short financial year ended December 31,
2015 and the nine-month period ended December 31, 2014.
Senvion GmbH
Financial year ended
March 31,
Nine-month
period ended
December 31,
Short financial
year ended
December 31,
2013 2014 2015 2014 2015
(audited)
(in € million)
Revenues by business line and geography: Revenues from sale of onshore wind turbines ............................................ 1,768.5 1,483.0 1,605.5 1,236.4 1,432.2
Germany ................................................................................................. 322.1 565.9 763.3 563.4 562.3
United Kingdom ..................................................................................... 180.6 185.6 109.8 64.2 193.8 Canada .................................................................................................... 378.5 230.8 187.5 179.9 245.9
France ..................................................................................................... 149.8 148.9 176.1 145.7 113.8
Australia ................................................................................................. 0.0 84.3 203.1 179.9 37.8 United States ........................................................................................... 345.8 0.1 0.1 0.1 0.3
Rest of the world ..................................................................................... 391.7 267.3 165.6 103.3 278.2
Revenues from sale of offshore wind turbines....................................................................................................... 369.1 82.5 101.3 73.6 71.0
Services(1) ................................................................................................... 130.5 174.0 194.0 138.1 177.2
Other .......................................................................................................... 26.4 19.3 21.0 17.4 2.6
____________________________
(1) Services refer to Senvion Group’s operations and maintenance (“O&M”) service business.
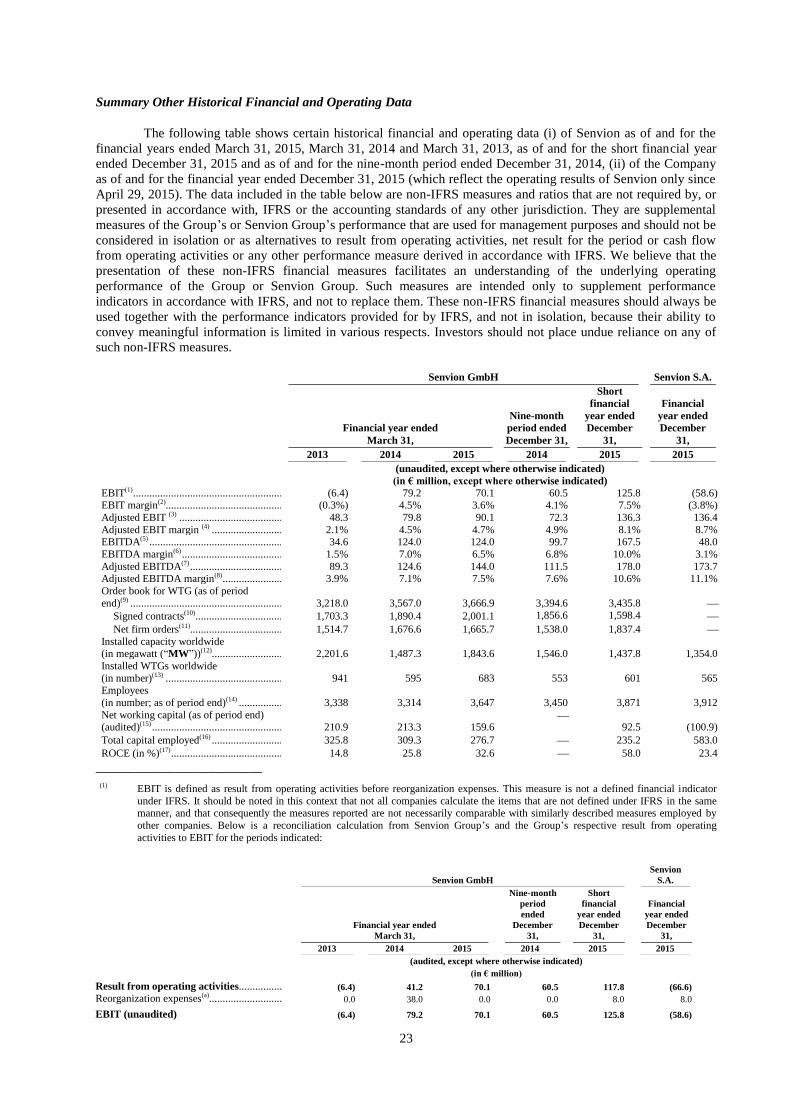
23
Summary Other Historical Financial and Operating Data
The following table shows certain historical financial and operating data (i) of Senvion as of and for the
financial years ended March 31, 2015, March 31, 2014 and March 31, 2013, as of and for the short financial year
ended December 31, 2015 and as of and for the nine-month period ended December 31, 2014, (ii) of the Company
as of and for the financial year ended December 31, 2015 (which reflect the operating results of Senvion only since
April 29, 2015). The data included in the table below are non-IFRS measures and ratios that are not required by, or
presented in accordance with, IFRS or the accounting standards of any other jurisdiction. They are supplemental
measures of the Group’s or Senvion Group’s performance that are used for management purposes and should not be
considered in isolation or as alternatives to result from operating activities, net result for the period or cash flow
from operating activities or any other performance measure derived in accordance with IFRS. We believe that the
presentation of these non-IFRS financial measures facilitates an understanding of the underlying operating
performance of the Group or Senvion Group. Such measures are intended only to supplement performance
indicators in accordance with IFRS, and not to replace them. These non-IFRS financial measures should always be
used together with the performance indicators provided for by IFRS, and not in isolation, because their ability to
convey meaningful information is limited in various respects. Investors should not place undue reliance on any of
such non-IFRS measures.
Senvion GmbH Senvion S.A.
Financial year ended
March 31,
Nine-month
period ended
December 31,
Short
financial
year ended
December
31,
Financial
year ended
December
31,
2013 2014 2015 2014 2015 2015
(unaudited, except where otherwise indicated)
(in € million, except where otherwise indicated)
EBIT(1) ........................................................................................................ (6.4) 79.2 70.1 60.5 125.8 (58.6) EBIT margin(2)............................................................................................ (0.3%) 4.5% 3.6% 4.1% 7.5% (3.8%)
Adjusted EBIT (3) ....................................................................................... 48.3 79.8 90.1 72.3 136.3 136.4
Adjusted EBIT margin (4) ........................................................................... 2.1% 4.5% 4.7% 4.9% 8.1% 8.7% EBITDA(5) .................................................................................................. 34.6 124.0 124.0 99.7 167.5 48.0
EBITDA margin(6) ...................................................................................... 1.5% 7.0% 6.5% 6.8% 10.0% 3.1%
Adjusted EBITDA(7) ................................................................................... 89.3 124.6 144.0 111.5 178.0 173.7 Adjusted EBITDA margin(8) ....................................................................... 3.9% 7.1% 7.5% 7.6% 10.6% 11.1%
Order book for WTG (as of period
end)(9) ......................................................................................................... 3,218.0 3,567.0 3,666.9 3,394.6 3,435.8
Signed contracts(10) ................................................................................. 1,703.3 1,890.4 2,001.1 1,856.6 1,598.4
Net firm orders(11)................................................................................... 1,514.7 1,676.6 1,665.7 1,538.0 1,837.4 Installed capacity worldwide (in megawatt (“MW”))(12)........................................................................... 2,201.6 1,487.3 1,843.6 1,546.0 1,437.8 1,354.0
Installed WTGs worldwide
(in number)(13) ............................................................................................ 941 595 683 553 601 565 Employees
(in number; as of period end)(14) ................................................................. 3,338 3,314 3,647 3,450 3,871 3,912
Net working capital (as of period end) (audited)(15) ................................................................................................. 210.9 213.3 159.6
92.5 (100.9)
Total capital employed(16) ........................................................................... 325.8 309.3 276.7 235.2 583.0
ROCE (in %)(17) .......................................................................................... 14.8 25.8 32.6 58.0 23.4
_________________________
(1) EBIT is defined as result from operating activities before reorganization expenses. This measure is not a defined financial indicator
under IFRS. It should be noted in this context that not all companies calculate the items that are not defined under IFRS in the same manner, and that consequently the measures reported are not necessarily comparable with similarly described measures employed by
other companies. Below is a reconciliation calculation from Senvion Group’s and the Group’s respective result from operating
activities to EBIT for the periods indicated:
Senvion GmbH
Senvion
S.A.
Financial year ended
March 31,
Nine-month
period
ended
December
31,
Short
financial
year ended
December
31,
Financial
year ended
December
31,
2013 2014 2015 2014 2015 2015
(audited, except where otherwise indicated)
(in € million)
Result from operating activities................ (6.4) 41.2 70.1 60.5 117.8 (66.6) Reorganization expenses(a)........................... 0.0 38.0 0.0 0.0 8.0 8.0
EBIT (unaudited) (6.4) 79.2 70.1 60.5 125.8 (58.6)
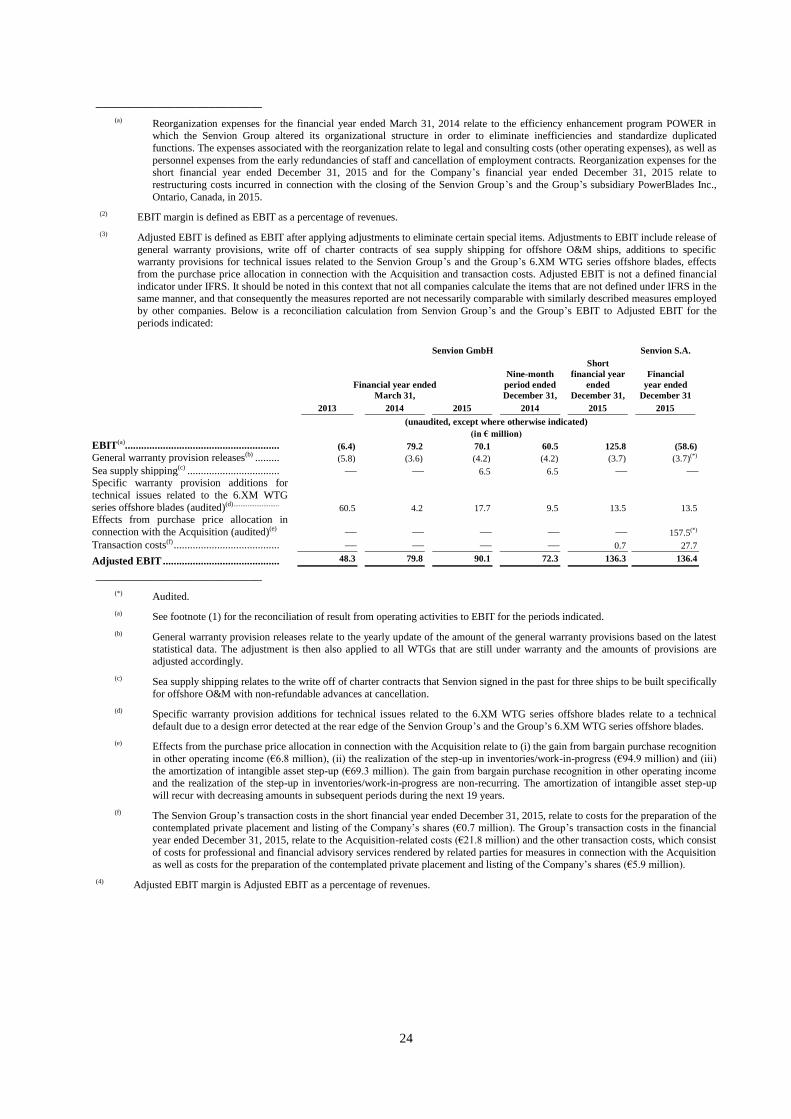
24
_________________________
(a) Reorganization expenses for the financial year ended March 31, 2014 relate to the efficiency enhancement program POWER in which the Senvion Group altered its organizational structure in order to eliminate inefficiencies and standardize duplicated
functions. The expenses associated with the reorganization relate to legal and consulting costs (other operating expenses), as well as
personnel expenses from the early redundancies of staff and cancellation of employment contracts. Reorganization expenses for the short financial year ended December 31, 2015 and for the Company’s financial year ended December 31, 2015 relate to
restructuring costs incurred in connection with the closing of the Senvion Group’s and the Group’s subsidiary PowerBlades Inc.,
Ontario, Canada, in 2015.
(2) EBIT margin is defined as EBIT as a percentage of revenues.
(3) Adjusted EBIT is defined as EBIT after applying adjustments to eliminate certain special items. Adjustments to EBIT include release of
general warranty provisions, write off of charter contracts of sea supply shipping for offshore O&M ships, additions to specific warranty provisions for technical issues related to the Senvion Group’s and the Group’s 6.XM WTG series offshore blades, effects
from the purchase price allocation in connection with the Acquisition and transaction costs. Adjusted EBIT is not a defined financial
indicator under IFRS. It should be noted in this context that not all companies calculate the items that are not defined under IFRS in the same manner, and that consequently the measures reported are not necessarily comparable with similarly described measures employed
by other companies. Below is a reconciliation calculation from Senvion Group’s and the Group’s EBIT to Adjusted EBIT for the
periods indicated:
Senvion GmbH Senvion S.A.
Financial year ended
March 31,
Nine-month
period ended
December 31,
Short
financial year
ended
December 31,
Financial
year ended
December 31
2013 2014 2015 2014 2015 2015
(unaudited, except where otherwise indicated)
(in € million)
EBIT(a)......................................................... (6.4) 79.2 70.1 60.5 125.8 (58.6) General warranty provision releases(b) ......... (5.8) (3.6) (4.2) (4.2) (3.7) (3.7)(*)
Sea supply shipping(c) .................................. 6.5 6.5 Specific warranty provision additions for
technical issues related to the 6.XM WTG
series offshore blades (audited)(d) .......................... 60.5 4.2 17.7 9.5 13.5 13.5 Effects from purchase price allocation in
connection with the Acquisition (audited)(e) 157.5(*)
Transaction costs(f) ....................................... 0.7 27.7
Adjusted EBIT ........................................... 48.3 79.8 90.1 72.3 136.3 136.4
_________________________
(*) Audited.
(a) See footnote (1) for the reconciliation of result from operating activities to EBIT for the periods indicated.
(b) General warranty provision releases relate to the yearly update of the amount of the general warranty provisions based on the latest
statistical data. The adjustment is then also applied to all WTGs that are still under warranty and the amounts of provisions are adjusted accordingly.
(c) Sea supply shipping relates to the write off of charter contracts that Senvion signed in the past for three ships to be built specifically
for offshore O&M with non-refundable advances at cancellation.
(d) Specific warranty provision additions for technical issues related to the 6.XM WTG series offshore blades relate to a technical
default due to a design error detected at the rear edge of the Senvion Group’s and the Group’s 6.XM WTG series offshore blades.
(e) Effects from the purchase price allocation in connection with the Acquisition relate to (i) the gain from bargain purchase recognition
in other operating income (€6.8 million), (ii) the realization of the step-up in inventories/work-in-progress (€94.9 million) and (iii)
the amortization of intangible asset step-up (€69.3 million). The gain from bargain purchase recognition in other operating income and the realization of the step-up in inventories/work-in-progress are non-recurring. The amortization of intangible asset step-up
will recur with decreasing amounts in subsequent periods during the next 19 years.
(f) The Senvion Group’s transaction costs in the short financial year ended December 31, 2015, relate to costs for the preparation of the contemplated private placement and listing of the Company’s shares (€0.7 million). The Group’s transaction costs in the financial
year ended December 31, 2015, relate to the Acquisition-related costs (€21.8 million) and the other transaction costs, which consist
of costs for professional and financial advisory services rendered by related parties for measures in connection with the Acquisition as well as costs for the preparation of the contemplated private placement and listing of the Company’s shares (€5.9 million).
(4) Adjusted EBIT margin is Adjusted EBIT as a percentage of revenues.
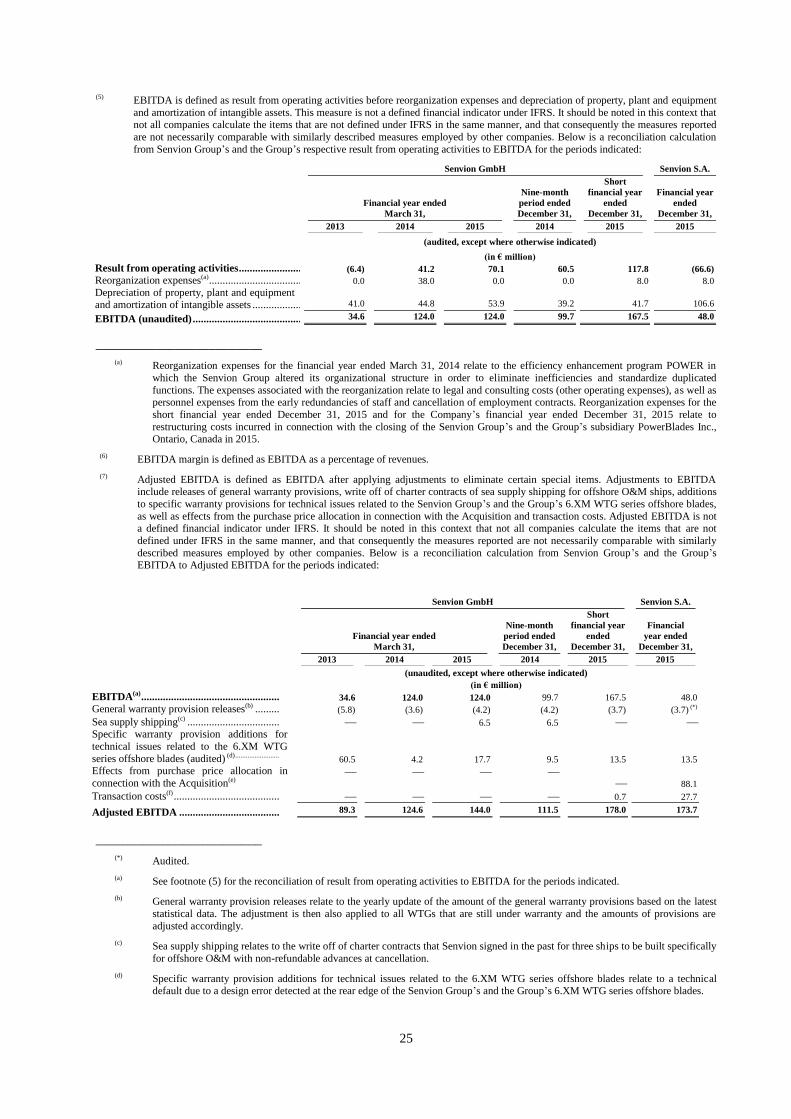
25
(5) EBITDA is defined as result from operating activities before reorganization expenses and depreciation of property, plant and equipment
and amortization of intangible assets. This measure is not a defined financial indicator under IFRS. It should be noted in this context that
not all companies calculate the items that are not defined under IFRS in the same manner, and that consequently the measures reported
are not necessarily comparable with similarly described measures employed by other companies. Below is a reconciliation calculation
from Senvion Group’s and the Group’s respective result from operating activities to EBITDA for the periods indicated:
Senvion GmbH Senvion S.A.
Financial year ended
March 31,
Nine-month
period ended
December 31,
Short
financial year
ended
December 31,
Financial year
ended
December 31,
2013 2014 2015 2014 2015 2015
(audited, except where otherwise indicated)
(in € million)
Result from operating activities ........................... (6.4) 41.2 70.1 60.5 117.8 (66.6) Reorganization expenses(a) ................................................ 0.0 38.0 0.0 0.0 8.0 8.0 Depreciation of property, plant and equipment and amortization of intangible assets ................................ 41.0 44.8 53.9 39.2 41.7 106.6
EBITDA (unaudited) ............................................ 34.6 124.0 124.0 99.7 167.5 48.0
_________________________
(a) Reorganization expenses for the financial year ended March 31, 2014 relate to the efficiency enhancement program POWER in
which the Senvion Group altered its organizational structure in order to eliminate inefficiencies and standardize duplicated
functions. The expenses associated with the reorganization relate to legal and consulting costs (other operating expenses), as well as personnel expenses from the early redundancies of staff and cancellation of employment contracts. Reorganization expenses for the
short financial year ended December 31, 2015 and for the Company’s financial year ended December 31, 2015 relate to
restructuring costs incurred in connection with the closing of the Senvion Group’s and the Group’s subsidiary PowerBlades Inc., Ontario, Canada in 2015.
(6) EBITDA margin is defined as EBITDA as a percentage of revenues.
(7) Adjusted EBITDA is defined as EBITDA after applying adjustments to eliminate certain special items. Adjustments to EBITDA include releases of general warranty provisions, write off of charter contracts of sea supply shipping for offshore O&M ships, additions
to specific warranty provisions for technical issues related to the Senvion Group’s and the Group’s 6.XM WTG series offshore blades,
as well as effects from the purchase price allocation in connection with the Acquisition and transaction costs. Adjusted EBITDA is not a defined financial indicator under IFRS. It should be noted in this context that not all companies calculate the items that are not
defined under IFRS in the same manner, and that consequently the measures reported are not necessarily comparable with similarly
described measures employed by other companies. Below is a reconciliation calculation from Senvion Group’s and the Group’s EBITDA to Adjusted EBITDA for the periods indicated:
Senvion GmbH Senvion S.A.
Financial year ended
March 31,
Nine-month
period ended
December 31,
Short
financial year
ended
December 31,
Financial
year ended
December 31,
2013 2014 2015 2014 2015 2015
(unaudited, except where otherwise indicated)
(in € million)
EBITDA(a) ................................................... 34.6 124.0 124.0 99.7 167.5 48.0 General warranty provision releases(b) ......... (5.8) (3.6) (4.2) (4.2) (3.7) (3.7) (*)
Sea supply shipping(c) .................................. 6.5 6.5 Specific warranty provision additions for
technical issues related to the 6.XM WTG
series offshore blades (audited) (d) ......................... 60.5 4.2 17.7 9.5 13.5 13.5 Effects from purchase price allocation in
connection with the Acquisition(e)
88.1
Transaction costs(f) ....................................... 0.7 27.7
Adjusted EBITDA ..................................... 89.3 124.6 144.0 111.5 178.0 173.7
_________________________
(*) Audited.
(a) See footnote (5) for the reconciliation of result from operating activities to EBITDA for the periods indicated.
(b) General warranty provision releases relate to the yearly update of the amount of the general warranty provisions based on the latest
statistical data. The adjustment is then also applied to all WTGs that are still under warranty and the amounts of provisions are
adjusted accordingly.
(c) Sea supply shipping relates to the write off of charter contracts that Senvion signed in the past for three ships to be built specifically
for offshore O&M with non-refundable advances at cancellation.
(d) Specific warranty provision additions for technical issues related to the 6.XM WTG series offshore blades relate to a technical default due to a design error detected at the rear edge of the Senvion Group’s and the Group’s 6.XM WTG series offshore blades.
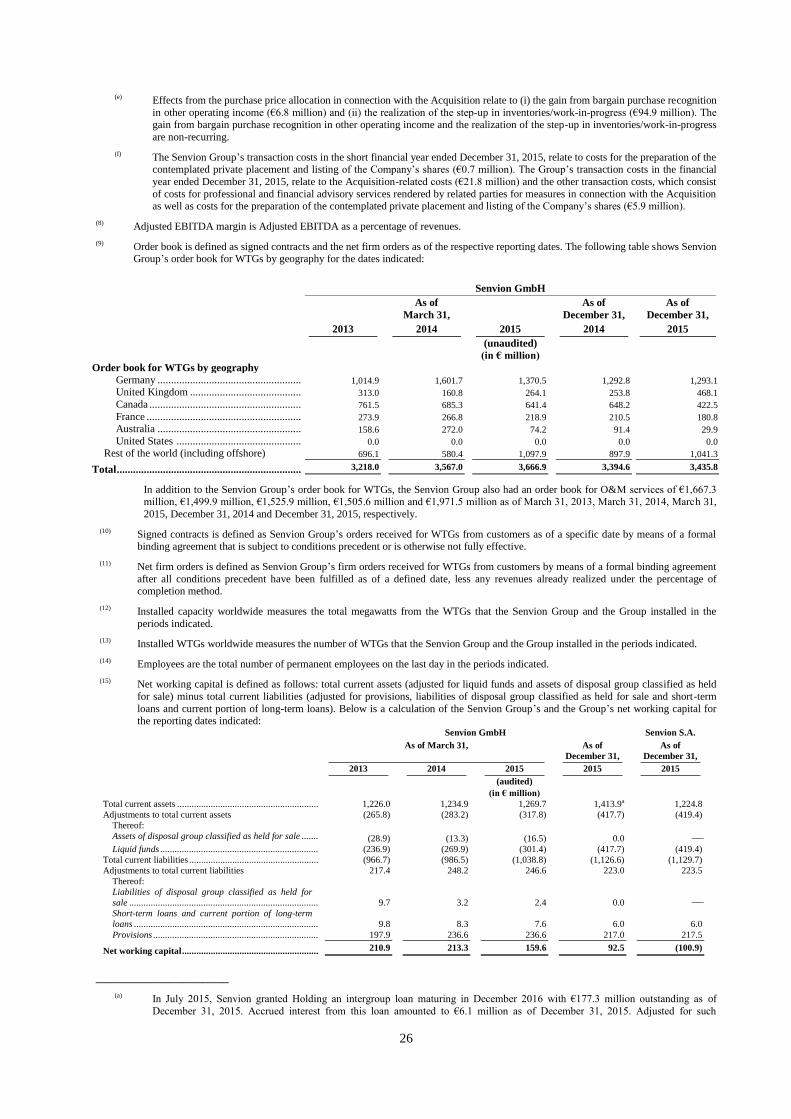
26
(e) Effects from the purchase price allocation in connection with the Acquisition relate to (i) the gain from bargain purchase recognition
in other operating income (€6.8 million) and (ii) the realization of the step-up in inventories/work-in-progress (€94.9 million). The
gain from bargain purchase recognition in other operating income and the realization of the step-up in inventories/work-in-progress
are non-recurring.
(f) The Senvion Group’s transaction costs in the short financial year ended December 31, 2015, relate to costs for the preparation of the contemplated private placement and listing of the Company’s shares (€0.7 million). The Group’s transaction costs in the financial
year ended December 31, 2015, relate to the Acquisition-related costs (€21.8 million) and the other transaction costs, which consist
of costs for professional and financial advisory services rendered by related parties for measures in connection with the Acquisition as well as costs for the preparation of the contemplated private placement and listing of the Company’s shares (€5.9 million).
(8) Adjusted EBITDA margin is Adjusted EBITDA as a percentage of revenues.
(9) Order book is defined as signed contracts and the net firm orders as of the respective reporting dates. The following table shows Senvion Group’s order book for WTGs by geography for the dates indicated:
Senvion GmbH
As of
March 31,
As of
December 31,
As of
December 31,
2013 2014 2015 2014 2015
(unaudited)
(in € million)
Order book for WTGs by geography
Germany ........................................................................................... 1,014.9 1,601.7 1,370.5 1,292.8 1,293.1 United Kingdom ............................................................................... 313.0 160.8 264.1 253.8 468.1 Canada .............................................................................................. 761.5 685.3 641.4 648.2 422.5 France ............................................................................................... 273.9 266.8 218.9 210.5 180.8 Australia ........................................................................................... 158.6 272.0 74.2 91.4 29.9 United States .................................................................................... 0.0 0.0 0.0 0.0 0.0
Rest of the world (including offshore) 696.1 580.4 1,097.9 897.9 1,041.3
Total .......................................................................................................... 3,218.0 3,567.0 3,666.9 3,394.6 3,435.8
In addition to the Senvion Group’s order book for WTGs, the Senvion Group also had an order book for O&M services of €1,667.3 million, €1,499.9 million, €1,525.9 million, €1,505.6 million and €1,971.5 million as of March 31, 2013, March 31, 2014, March 31,
2015, December 31, 2014 and December 31, 2015, respectively.
(10) Signed contracts is defined as Senvion Group’s orders received for WTGs from customers as of a specific date by means of a formal binding agreement that is subject to conditions precedent or is otherwise not fully effective.
(11) Net firm orders is defined as Senvion Group’s firm orders received for WTGs from customers by means of a formal binding agreement
after all conditions precedent have been fulfilled as of a defined date, less any revenues already realized under the percentage of completion method.
(12) Installed capacity worldwide measures the total megawatts from the WTGs that the Senvion Group and the Group installed in the
periods indicated.
(13) Installed WTGs worldwide measures the number of WTGs that the Senvion Group and the Group installed in the periods indicated.
(14) Employees are the total number of permanent employees on the last day in the periods indicated.
(15) Net working capital is defined as follows: total current assets (adjusted for liquid funds and assets of disposal group classified as held
for sale) minus total current liabilities (adjusted for provisions, liabilities of disposal group classified as held for sale and short-term
loans and current portion of long-term loans). Below is a calculation of the Senvion Group’s and the Group’s net working capital for the reporting dates indicated:
Senvion GmbH Senvion S.A.
As of March 31,
As of
December 31,
As of
December 31,
2013 2014 2015 2015 2015
(audited)
(in € million)
Total current assets .......................................................................................................................... 1,226.0 1,234.9 1,269.7 1,413.9a 1,224.8
Adjustments to total current assets (265.8) (283.2) (317.8) (417.7) (419.4)
Thereof:
Assets of disposal group classified as held for sale ...................................................................... (28.9) (13.3) (16.5) 0.0
Liquid funds ................................................................................................................................. (236.9) (269.9) (301.4) (417.7) (419.4)
Total current liabilities ..................................................................................................................... (966.7) (986.5) (1,038.8) (1,126.6) (1,129.7)
Adjustments to total current liabilities 217.4 248.2 246.6 223.0 223.5
Thereof:
Liabilities of disposal group classified as held for
sale .............................................................................................................................................. 9.7 3.2 2.4 0.0
Short-term loans and current portion of long-term
loans ............................................................................................................................................ 9.8 8.3 7.6 6.0 6.0
Provisions .................................................................................................................................... 197.9 236.6 236.6 217.0 217.5
Net working capital ........................................................................................................................ 210.9 213.3 159.6 92.5 (100.9)
____________________
(a) In July 2015, Senvion granted Holding an intergroup loan maturing in December 2016 with €177.3 million outstanding as of
December 31, 2015. Accrued interest from this loan amounted to €6.1 million as of December 31, 2015. Adjusted for such
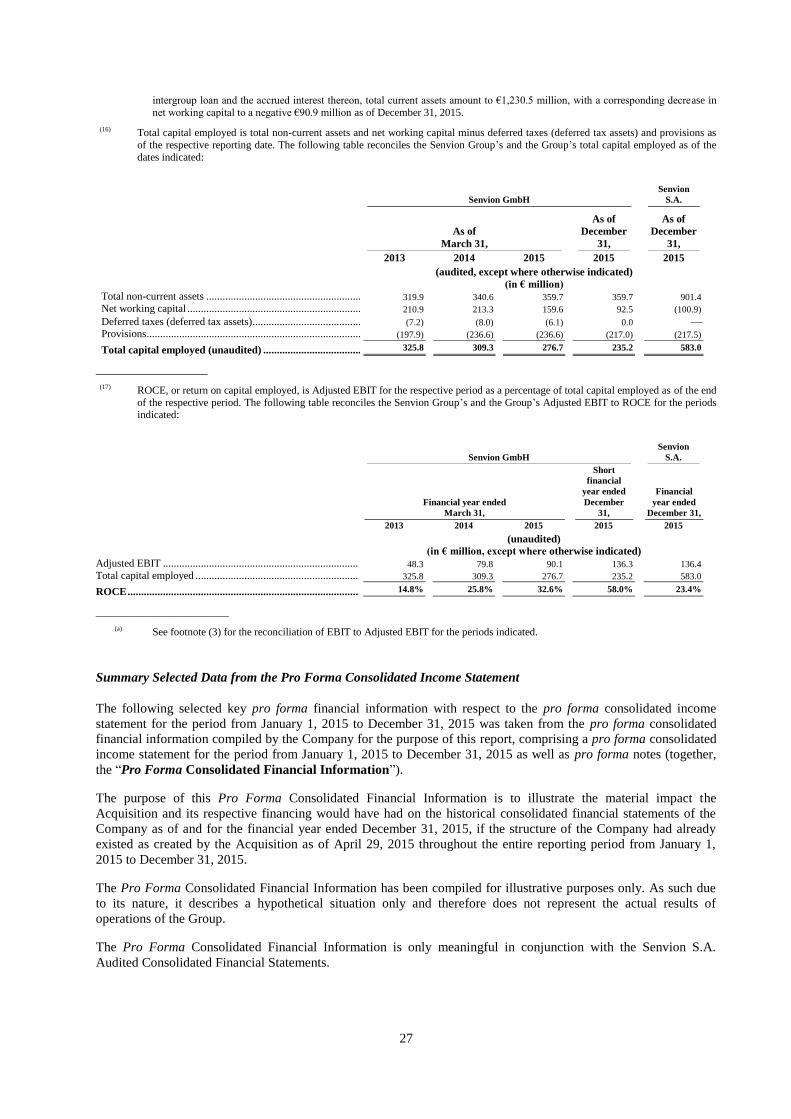
27
intergroup loan and the accrued interest thereon, total current assets amount to €1,230.5 million, with a corresponding decrease in
net working capital to a negative €90.9 million as of December 31, 2015.
(16) Total capital employed is total non-current assets and net working capital minus deferred taxes (deferred tax assets) and provisions as
of the respective reporting date. The following table reconciles the Senvion Group’s and the Group’s total capital employed as of the
dates indicated:
Senvion GmbH
Senvion
S.A.
As of
March 31,
As of
December
31,
As of
December
31,
2013 2014 2015 2015 2015
(audited, except where otherwise indicated)
(in € million)
Total non-current assets .............................................................. 319.9 340.6 359.7 359.7 901.4 Net working capital ..................................................................... 210.9 213.3 159.6 92.5 (100.9)
Deferred taxes (deferred tax assets) ............................................. (7.2) (8.0) (6.1) 0.0 Provisions .................................................................................... (197.9) (236.6) (236.6) (217.0) (217.5)
Total capital employed (unaudited) ........................................................ 325.8 309.3 276.7 235.2 583.0
_____________________
(17) ROCE, or return on capital employed, is Adjusted EBIT for the respective period as a percentage of total capital employed as of the end
of the respective period. The following table reconciles the Senvion Group’s and the Group’s Adjusted EBIT to ROCE for the periods indicated:
Senvion GmbH
Senvion
S.A.
Financial year ended
March 31,
Short
financial
year ended
December
31,
Financial
year ended
December 31,
2013 2014 2015 2015 2015
(unaudited)
(in € million, except where otherwise indicated)
Adjusted EBIT .......................................................................................... 48.3 79.8 90.1 136.3 136.4
Total capital employed .......................................................................................................... 325.8 309.3 276.7 235.2 583.0
ROCE ....................................................................................................... 14.8% 25.8% 32.6% 58.0% 23.4%
_________________________
(a) See footnote (3) for the reconciliation of EBIT to Adjusted EBIT for the periods indicated.
Summary Selected Data from the Pro Forma Consolidated Income Statement
The following selected key pro forma financial information with respect to the pro forma consolidated income
statement for the period from January 1, 2015 to December 31, 2015 was taken from the pro forma consolidated
financial information compiled by the Company for the purpose of this report, comprising a pro forma consolidated
income statement for the period from January 1, 2015 to December 31, 2015 as well as pro forma notes (together,
the “Pro Forma Consolidated Financial Information”).
The purpose of this Pro Forma Consolidated Financial Information is to illustrate the material impact the
Acquisition and its respective financing would have had on the historical consolidated financial statements of the
Company as of and for the financial year ended December 31, 2015, if the structure of the Company had already
existed as created by the Acquisition as of April 29, 2015 throughout the entire reporting period from January 1,
2015 to December 31, 2015.
The Pro Forma Consolidated Financial Information has been compiled for illustrative purposes only. As such due
to its nature, it describes a hypothetical situation only and therefore does not represent the actual results of
operations of the Group.
The Pro Forma Consolidated Financial Information is only meaningful in conjunction with the Senvion S.A.
Audited Consolidated Financial Statements.
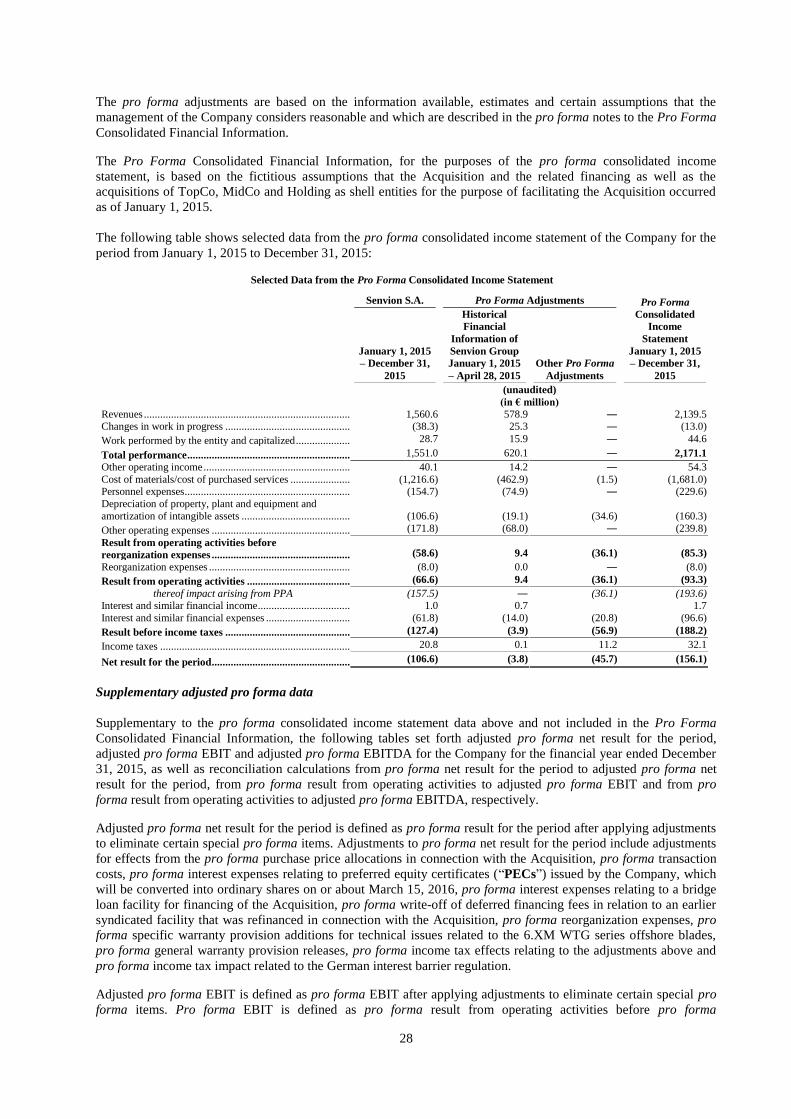
28
The pro forma adjustments are based on the information available, estimates and certain assumptions that the
management of the Company considers reasonable and which are described in the pro forma notes to the Pro Forma
Consolidated Financial Information.
The Pro Forma Consolidated Financial Information, for the purposes of the pro forma consolidated income
statement, is based on the fictitious assumptions that the Acquisition and the related financing as well as the
acquisitions of TopCo, MidCo and Holding as shell entities for the purpose of facilitating the Acquisition occurred
as of January 1, 2015.
The following table shows selected data from the pro forma consolidated income statement of the Company for the
period from January 1, 2015 to December 31, 2015:
Selected Data from the Pro Forma Consolidated Income Statement
Senvion S.A. Pro Forma Adjustments Pro Forma
Consolidated
Income
Statement
January 1, 2015
– December 31,
2015
January 1, 2015
– December 31,
2015
Historical
Financial
Information of
Senvion Group
January 1, 2015
– April 28, 2015
Other Pro Forma
Adjustments (unaudited)
(in € million)
Revenues ............................................................................................................................... 1,560.6 578.9 ― 2,139.5 Changes in work in progress ................................................................................................. (38.3) 25.3 ― (13.0)
Work performed by the entity and capitalized .................................................................28.7 28.7 15.9 ― 44.6
Total performance .................................................................................... 1,551.0 620.1 ― 2,171.1
Other operating income ......................................................................................................... 40.1 14.2 ― 54.3
Cost of materials/cost of purchased services ......................................................................... (1,216.6) (462.9) (1.5) (1,681.0) Personnel expenses ................................................................................................................ (154.7) (74.9) ― (229.6)
Depreciation of property, plant and equipment and
amortization of intangible assets ........................................................................................... (106.6) (19.1) (34.6) (160.3)
Other operating expenses ...................................................................................................... (171.8) (68.0) ― (239.8)
Result from operating activities before
reorganization expenses ...................................................................................................... (58.6) 9.4 (36.1) (85.3)
Reorganization expenses ....................................................................................................... (8.0) 0.0 ― (8.0)
Result from operating activities .............................................................. (66.6) 9.4 (36.1) (93.3)
thereof impact arising from PPA (157.5) ― (36.1) (193.6) Interest and similar financial income ..................................................................................... 1.0 0.7 1.7
Interest and similar financial expenses .................................................................................. (61.8) (14.0) (20.8) (96.6)
Result before income taxes ................................................................................................. (127.4) (3.9) (56.9) (188.2)
Income taxes ......................................................................................................................... 20.8 0.1 11.2 32.1
Net result for the period ........................................................................... (106.6) (3.8) (45.7) (156.1)
Supplementary adjusted pro forma data
Supplementary to the pro forma consolidated income statement data above and not included in the Pro Forma
Consolidated Financial Information, the following tables set forth adjusted pro forma net result for the period,
adjusted pro forma EBIT and adjusted pro forma EBITDA for the Company for the financial year ended December
31, 2015, as well as reconciliation calculations from pro forma net result for the period to adjusted pro forma net
result for the period, from pro forma result from operating activities to adjusted pro forma EBIT and from pro
forma result from operating activities to adjusted pro forma EBITDA, respectively.
Adjusted pro forma net result for the period is defined as pro forma result for the period after applying adjustments
to eliminate certain special pro forma items. Adjustments to pro forma net result for the period include adjustments
for effects from the pro forma purchase price allocations in connection with the Acquisition, pro forma transaction
costs, pro forma interest expenses relating to preferred equity certificates (“PECs”) issued by the Company, which
will be converted into ordinary shares on or about March 15, 2016, pro forma interest expenses relating to a bridge
loan facility for financing of the Acquisition, pro forma write-off of deferred financing fees in relation to an earlier
syndicated facility that was refinanced in connection with the Acquisition, pro forma reorganization expenses, pro
forma specific warranty provision additions for technical issues related to the 6.XM WTG series offshore blades,
pro forma general warranty provision releases, pro forma income tax effects relating to the adjustments above and
pro forma income tax impact related to the German interest barrier regulation.
Adjusted pro forma EBIT is defined as pro forma EBIT after applying adjustments to eliminate certain special pro
forma items. Pro forma EBIT is defined as pro forma result from operating activities before pro forma
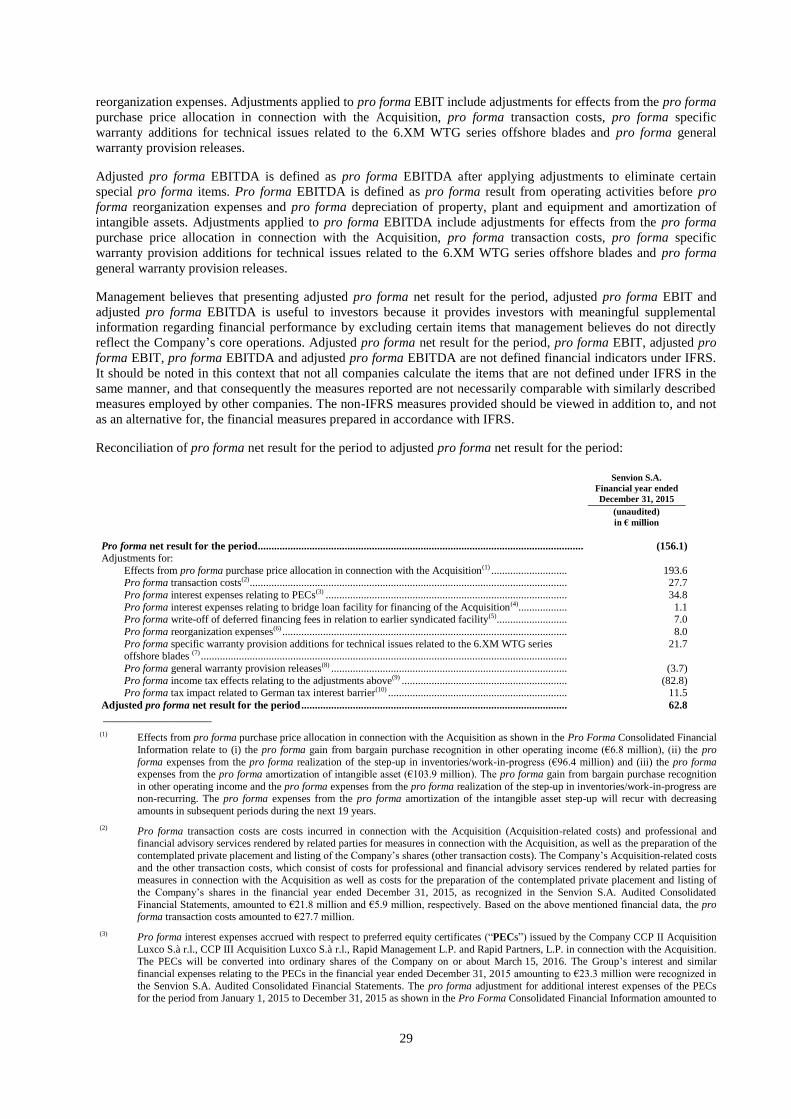
29
reorganization expenses. Adjustments applied to pro forma EBIT include adjustments for effects from the pro forma
purchase price allocation in connection with the Acquisition, pro forma transaction costs, pro forma specific
warranty additions for technical issues related to the 6.XM WTG series offshore blades and pro forma general
warranty provision releases.
Adjusted pro forma EBITDA is defined as pro forma EBITDA after applying adjustments to eliminate certain
special pro forma items. Pro forma EBITDA is defined as pro forma result from operating activities before pro
forma reorganization expenses and pro forma depreciation of property, plant and equipment and amortization of
intangible assets. Adjustments applied to pro forma EBITDA include adjustments for effects from the pro forma
purchase price allocation in connection with the Acquisition, pro forma transaction costs, pro forma specific
warranty provision additions for technical issues related to the 6.XM WTG series offshore blades and pro forma
general warranty provision releases.
Management believes that presenting adjusted pro forma net result for the period, adjusted pro forma EBIT and
adjusted pro forma EBITDA is useful to investors because it provides investors with meaningful supplemental
information regarding financial performance by excluding certain items that management believes do not directly
reflect the Company’s core operations. Adjusted pro forma net result for the period, pro forma EBIT, adjusted pro
forma EBIT, pro forma EBITDA and adjusted pro forma EBITDA are not defined financial indicators under IFRS.
It should be noted in this context that not all companies calculate the items that are not defined under IFRS in the
same manner, and that consequently the measures reported are not necessarily comparable with similarly described
measures employed by other companies. The non-IFRS measures provided should be viewed in addition to, and not
as an alternative for, the financial measures prepared in accordance with IFRS.
Reconciliation of pro forma net result for the period to adjusted pro forma net result for the period:
Senvion S.A.
Financial year ended
December 31, 2015
(unaudited)
in € million
Pro forma net result for the period .......................................................................................................................... (156.1)
Adjustments for:
Effects from pro forma purchase price allocation in connection with the Acquisition(1) ............................ 193.6 Pro forma transaction costs(2) ..................................................................................................................... 27.7
Pro forma interest expenses relating to PECs(3) ......................................................................................... 34.8
Pro forma interest expenses relating to bridge loan facility for financing of the Acquisition(4) .................. 1.1 Pro forma write-off of deferred financing fees in relation to earlier syndicated facility(5) .......................... 7.0
Pro forma reorganization expenses(6) ......................................................................................................... 8.0
Pro forma specific warranty provision additions for technical issues related to the 6.XM WTG series offshore blades (7) .......................................................................................................................................
21.7
Pro forma general warranty provision releases(8) ....................................................................................... (3.7)
Pro forma income tax effects relating to the adjustments above(9) ............................................................. (82.8) Pro forma tax impact related to German tax interest barrier(10) .................................................................. 11.5
Adjusted pro forma net result for the period .................................................................................................. 62.8
____________________
(1) Effects from pro forma purchase price allocation in connection with the Acquisition as shown in the Pro Forma Consolidated Financial
Information relate to (i) the pro forma gain from bargain purchase recognition in other operating income (€6.8 million), (ii) the pro
forma expenses from the pro forma realization of the step-up in inventories/work-in-progress (€96.4 million) and (iii) the pro forma expenses from the pro forma amortization of intangible asset (€103.9 million). The pro forma gain from bargain purchase recognition
in other operating income and the pro forma expenses from the pro forma realization of the step-up in inventories/work-in-progress are non-recurring. The pro forma expenses from the pro forma amortization of the intangible asset step-up will recur with decreasing
amounts in subsequent periods during the next 19 years.
(2) Pro forma transaction costs are costs incurred in connection with the Acquisition (Acquisition-related costs) and professional and financial advisory services rendered by related parties for measures in connection with the Acquisition, as well as the preparation of the
contemplated private placement and listing of the Company’s shares (other transaction costs). The Company’s Acquisition-related costs
and the other transaction costs, which consist of costs for professional and financial advisory services rendered by related parties for
measures in connection with the Acquisition as well as costs for the preparation of the contemplated private placement and listing of
the Company’s shares in the financial year ended December 31, 2015, as recognized in the Senvion S.A. Audited Consolidated
Financial Statements, amounted to €21.8 million and €5.9 million, respectively. Based on the above mentioned financial data, the pro forma transaction costs amounted to €27.7 million.
(3) Pro forma interest expenses accrued with respect to preferred equity certificates (“PECs”) issued by the Company CCP II Acquisition
Luxco S.à r.l., CCP III Acquisition Luxco S.à r.l., Rapid Management L.P. and Rapid Partners, L.P. in connection with the Acquisition. The PECs will be converted into ordinary shares of the Company on or about March 15, 2016. The Group’s interest and similar
financial expenses relating to the PECs in the financial year ended December 31, 2015 amounting to €23.3 million were recognized in
the Senvion S.A. Audited Consolidated Financial Statements. The pro forma adjustment for additional interest expenses of the PECs for the period from January 1, 2015 to December 31, 2015 as shown in the Pro Forma Consolidated Financial Information amounted to
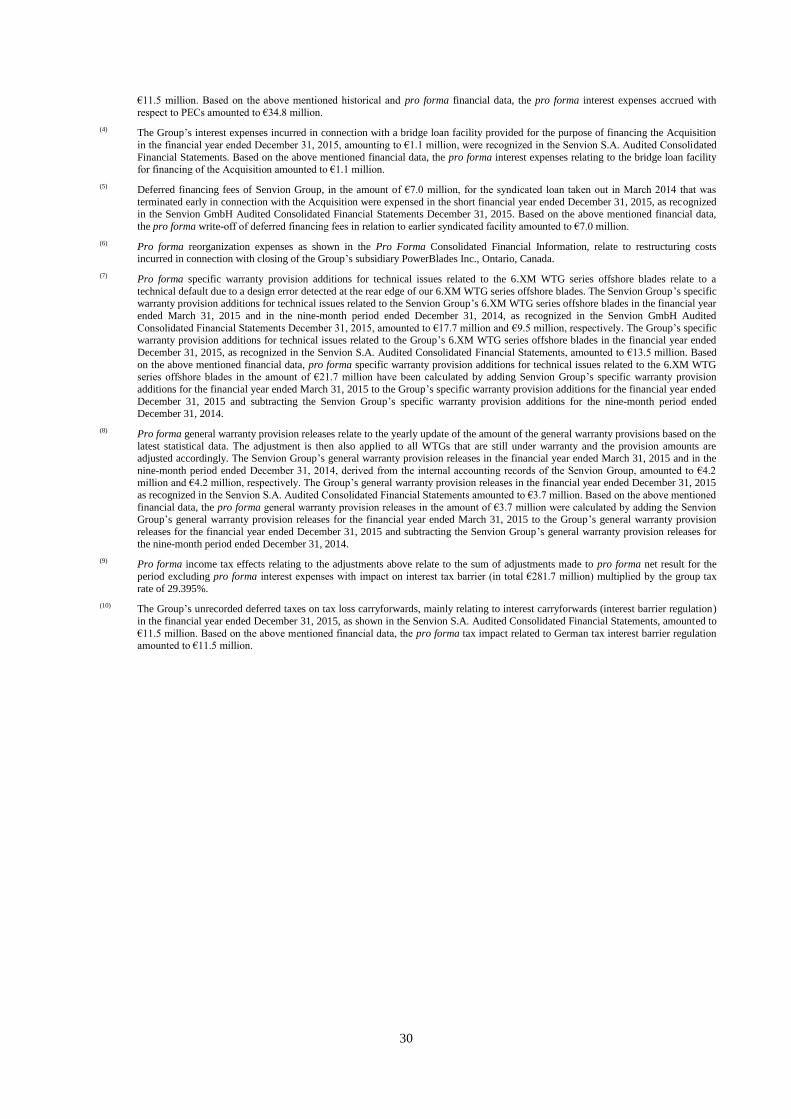
30
€11.5 million. Based on the above mentioned historical and pro forma financial data, the pro forma interest expenses accrued with
respect to PECs amounted to €34.8 million.
(4) The Group’s interest expenses incurred in connection with a bridge loan facility provided for the purpose of financing the Acquisition
in the financial year ended December 31, 2015, amounting to €1.1 million, were recognized in the Senvion S.A. Audited Consolidated
Financial Statements. Based on the above mentioned financial data, the pro forma interest expenses relating to the bridge loan facility for financing of the Acquisition amounted to €1.1 million.
(5) Deferred financing fees of Senvion Group, in the amount of €7.0 million, for the syndicated loan taken out in March 2014 that was
terminated early in connection with the Acquisition were expensed in the short financial year ended December 31, 2015, as recognized in the Senvion GmbH Audited Consolidated Financial Statements December 31, 2015. Based on the above mentioned financial data,
the pro forma write-off of deferred financing fees in relation to earlier syndicated facility amounted to €7.0 million.
(6) Pro forma reorganization expenses as shown in the Pro Forma Consolidated Financial Information, relate to restructuring costs incurred in connection with closing of the Group’s subsidiary PowerBlades Inc., Ontario, Canada.
(7) Pro forma specific warranty provision additions for technical issues related to the 6.XM WTG series offshore blades relate to a
technical default due to a design error detected at the rear edge of our 6.XM WTG series offshore blades. The Senvion Group’s specific warranty provision additions for technical issues related to the Senvion Group’s 6.XM WTG series offshore blades in the financial year
ended March 31, 2015 and in the nine-month period ended December 31, 2014, as recognized in the Senvion GmbH Audited
Consolidated Financial Statements December 31, 2015, amounted to €17.7 million and €9.5 million, respectively. The Group’s specific warranty provision additions for technical issues related to the Group’s 6.XM WTG series offshore blades in the financial year ended
December 31, 2015, as recognized in the Senvion S.A. Audited Consolidated Financial Statements, amounted to €13.5 million. Based
on the above mentioned financial data, pro forma specific warranty provision additions for technical issues related to the 6.XM WTG
series offshore blades in the amount of €21.7 million have been calculated by adding Senvion Group’s specific warranty provision
additions for the financial year ended March 31, 2015 to the Group’s specific warranty provision additions for the financial year ended
December 31, 2015 and subtracting the Senvion Group’s specific warranty provision additions for the nine-month period ended December 31, 2014.
(8) Pro forma general warranty provision releases relate to the yearly update of the amount of the general warranty provisions based on the
latest statistical data. The adjustment is then also applied to all WTGs that are still under warranty and the provision amounts are adjusted accordingly. The Senvion Group’s general warranty provision releases in the financial year ended March 31, 2015 and in the
nine-month period ended December 31, 2014, derived from the internal accounting records of the Senvion Group, amounted to €4.2 million and €4.2 million, respectively. The Group’s general warranty provision releases in the financial year ended December 31, 2015
as recognized in the Senvion S.A. Audited Consolidated Financial Statements amounted to €3.7 million. Based on the above mentioned
financial data, the pro forma general warranty provision releases in the amount of €3.7 million were calculated by adding the Senvion Group’s general warranty provision releases for the financial year ended March 31, 2015 to the Group’s general warranty provision
releases for the financial year ended December 31, 2015 and subtracting the Senvion Group’s general warranty provision releases for
the nine-month period ended December 31, 2014.
(9) Pro forma income tax effects relating to the adjustments above relate to the sum of adjustments made to pro forma net result for the
period excluding pro forma interest expenses with impact on interest tax barrier (in total €281.7 million) multiplied by the group tax
rate of 29.395%.
(10) The Group’s unrecorded deferred taxes on tax loss carryforwards, mainly relating to interest carryforwards (interest barrier regulation)
in the financial year ended December 31, 2015, as shown in the Senvion S.A. Audited Consolidated Financial Statements, amounted to
€11.5 million. Based on the above mentioned financial data, the pro forma tax impact related to German tax interest barrier regulation amounted to €11.5 million.
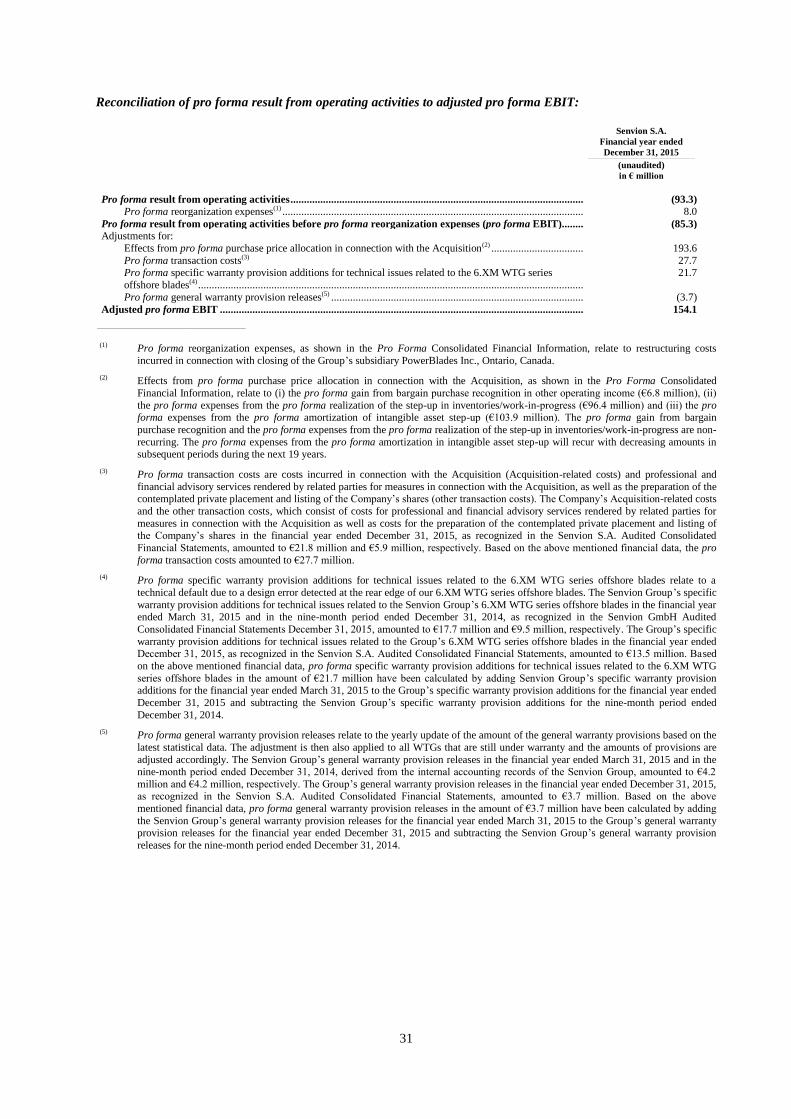
31
Reconciliation of pro forma result from operating activities to adjusted pro forma EBIT:
Senvion S.A.
Financial year ended
December 31, 2015
(unaudited)
in € million
Pro forma result from operating activities .............................................................................................................. (93.3)
Pro forma reorganization expenses(1) ................................................................................................................. 8.0
Pro forma result from operating activities before pro forma reorganization expenses (pro forma EBIT) .......... (85.3)
Adjustments for:
Effects from pro forma purchase price allocation in connection with the Acquisition(2) .................................... 193.6
Pro forma transaction costs(3) 27.7 Pro forma specific warranty provision additions for technical issues related to the 6.XM WTG series
offshore blades(4) ................................................................................................................................................
21.7
Pro forma general warranty provision releases(5) ............................................................................................... (3.7)
Adjusted pro forma EBIT ........................................................................................................................................ 154.1
_________________________________________________
(1) Pro forma reorganization expenses, as shown in the Pro Forma Consolidated Financial Information, relate to restructuring costs
incurred in connection with closing of the Group’s subsidiary PowerBlades Inc., Ontario, Canada.
(2) Effects from pro forma purchase price allocation in connection with the Acquisition, as shown in the Pro Forma Consolidated
Financial Information, relate to (i) the pro forma gain from bargain purchase recognition in other operating income (€6.8 million), (ii)
the pro forma expenses from the pro forma realization of the step-up in inventories/work-in-progress (€96.4 million) and (iii) the pro forma expenses from the pro forma amortization of intangible asset step-up (€103.9 million). The pro forma gain from bargain
purchase recognition and the pro forma expenses from the pro forma realization of the step-up in inventories/work-in-progress are non-
recurring. The pro forma expenses from the pro forma amortization in intangible asset step-up will recur with decreasing amounts in subsequent periods during the next 19 years.
(3) Pro forma transaction costs are costs incurred in connection with the Acquisition (Acquisition-related costs) and professional and
financial advisory services rendered by related parties for measures in connection with the Acquisition, as well as the preparation of the contemplated private placement and listing of the Company’s shares (other transaction costs). The Company’s Acquisition-related costs
and the other transaction costs, which consist of costs for professional and financial advisory services rendered by related parties for
measures in connection with the Acquisition as well as costs for the preparation of the contemplated private placement and listing of the Company’s shares in the financial year ended December 31, 2015, as recognized in the Senvion S.A. Audited Consolidated
Financial Statements, amounted to €21.8 million and €5.9 million, respectively. Based on the above mentioned financial data, the pro
forma transaction costs amounted to €27.7 million.
(4) Pro forma specific warranty provision additions for technical issues related to the 6.XM WTG series offshore blades relate to a
technical default due to a design error detected at the rear edge of our 6.XM WTG series offshore blades. The Senvion Group’s specific
warranty provision additions for technical issues related to the Senvion Group’s 6.XM WTG series offshore blades in the financial year ended March 31, 2015 and in the nine-month period ended December 31, 2014, as recognized in the Senvion GmbH Audited
Consolidated Financial Statements December 31, 2015, amounted to €17.7 million and €9.5 million, respectively. The Group’s specific
warranty provision additions for technical issues related to the Group’s 6.XM WTG series offshore blades in the financial year ended December 31, 2015, as recognized in the Senvion S.A. Audited Consolidated Financial Statements, amounted to €13.5 million. Based
on the above mentioned financial data, pro forma specific warranty provision additions for technical issues related to the 6.XM WTG
series offshore blades in the amount of €21.7 million have been calculated by adding Senvion Group’s specific warranty provision additions for the financial year ended March 31, 2015 to the Group’s specific warranty provision additions for the financial year ended
December 31, 2015 and subtracting the Senvion Group’s specific warranty provision additions for the nine-month period ended
December 31, 2014.
(5) Pro forma general warranty provision releases relate to the yearly update of the amount of the general warranty provisions based on the
latest statistical data. The adjustment is then also applied to all WTGs that are still under warranty and the amounts of provisions are
adjusted accordingly. The Senvion Group’s general warranty provision releases in the financial year ended March 31, 2015 and in the nine-month period ended December 31, 2014, derived from the internal accounting records of the Senvion Group, amounted to €4.2
million and €4.2 million, respectively. The Group’s general warranty provision releases in the financial year ended December 31, 2015, as recognized in the Senvion S.A. Audited Consolidated Financial Statements, amounted to €3.7 million. Based on the above
mentioned financial data, pro forma general warranty provision releases in the amount of €3.7 million have been calculated by adding
the Senvion Group’s general warranty provision releases for the financial year ended March 31, 2015 to the Group’s general warranty provision releases for the financial year ended December 31, 2015 and subtracting the Senvion Group’s general warranty provision
releases for the nine-month period ended December 31, 2014.
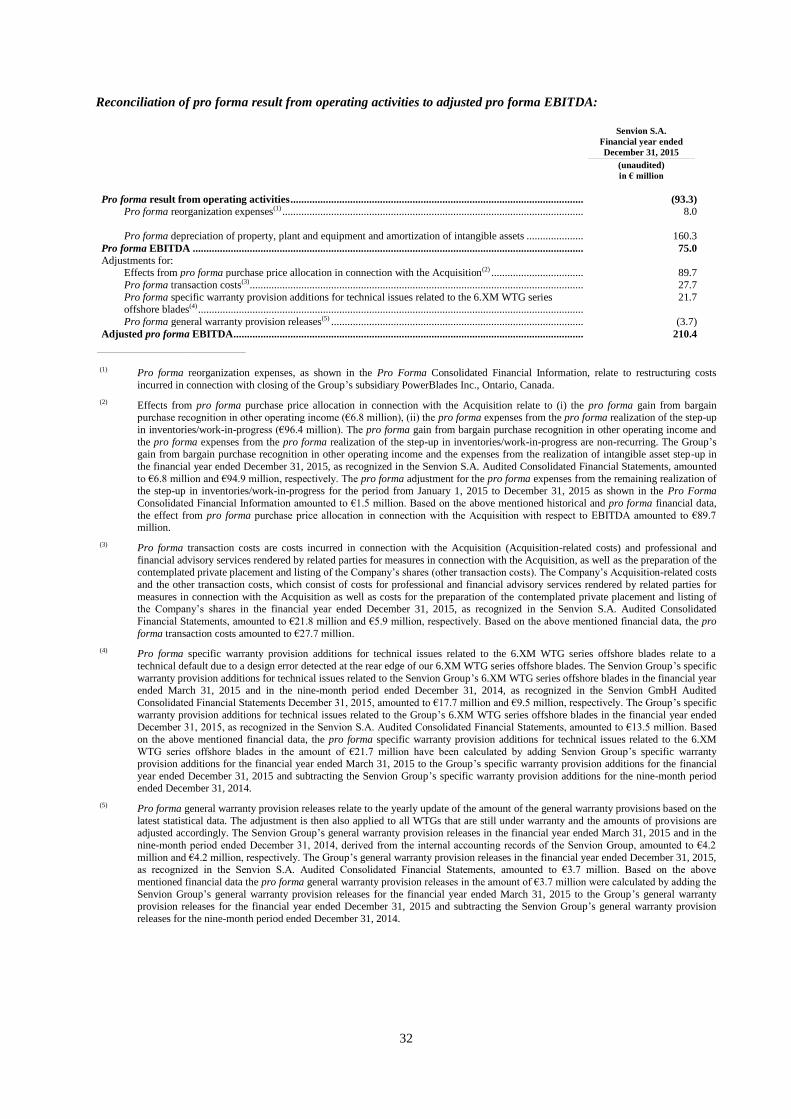
32
Reconciliation of pro forma result from operating activities to adjusted pro forma EBITDA:
Senvion S.A.
Financial year ended
December 31, 2015
(unaudited)
in € million
Pro forma result from operating activities .............................................................................................................. (93.3)
Pro forma reorganization expenses(1) ................................................................................................................. 8.0
Pro forma depreciation of property, plant and equipment and amortization of intangible assets .......................
160.3
Pro forma EBITDA .................................................................................................................................................. 75.0
Adjustments for: Effects from pro forma purchase price allocation in connection with the Acquisition(2) .................................... 89.7
Pro forma transaction costs(3) ............................................................................................................................. 27.7
Pro forma specific warranty provision additions for technical issues related to the 6.XM WTG series offshore blades(4) ................................................................................................................................................
21.7
Pro forma general warranty provision releases(5) ............................................................................................... (3.7)
Adjusted pro forma EBITDA ................................................................................................................................... 210.4
_________________________________________________
(1) Pro forma reorganization expenses, as shown in the Pro Forma Consolidated Financial Information, relate to restructuring costs
incurred in connection with closing of the Group’s subsidiary PowerBlades Inc., Ontario, Canada.
(2) Effects from pro forma purchase price allocation in connection with the Acquisition relate to (i) the pro forma gain from bargain purchase recognition in other operating income (€6.8 million), (ii) the pro forma expenses from the pro forma realization of the step-up
in inventories/work-in-progress (€96.4 million). The pro forma gain from bargain purchase recognition in other operating income and
the pro forma expenses from the pro forma realization of the step-up in inventories/work-in-progress are non-recurring. The Group’s gain from bargain purchase recognition in other operating income and the expenses from the realization of intangible asset step-up in
the financial year ended December 31, 2015, as recognized in the Senvion S.A. Audited Consolidated Financial Statements, amounted
to €6.8 million and €94.9 million, respectively. The pro forma adjustment for the pro forma expenses from the remaining realization of the step-up in inventories/work-in-progress for the period from January 1, 2015 to December 31, 2015 as shown in the Pro Forma
Consolidated Financial Information amounted to €1.5 million. Based on the above mentioned historical and pro forma financial data,
the effect from pro forma purchase price allocation in connection with the Acquisition with respect to EBITDA amounted to €89.7 million.
(3) Pro forma transaction costs are costs incurred in connection with the Acquisition (Acquisition-related costs) and professional and
financial advisory services rendered by related parties for measures in connection with the Acquisition, as well as the preparation of the contemplated private placement and listing of the Company’s shares (other transaction costs). The Company’s Acquisition-related costs
and the other transaction costs, which consist of costs for professional and financial advisory services rendered by related parties for
measures in connection with the Acquisition as well as costs for the preparation of the contemplated private placement and listing of the Company’s shares in the financial year ended December 31, 2015, as recognized in the Senvion S.A. Audited Consolidated
Financial Statements, amounted to €21.8 million and €5.9 million, respectively. Based on the above mentioned financial data, the pro
forma transaction costs amounted to €27.7 million.
(4) Pro forma specific warranty provision additions for technical issues related to the 6.XM WTG series offshore blades relate to a
technical default due to a design error detected at the rear edge of our 6.XM WTG series offshore blades. The Senvion Group’s specific
warranty provision additions for technical issues related to the Senvion Group’s 6.XM WTG series offshore blades in the financial year ended March 31, 2015 and in the nine-month period ended December 31, 2014, as recognized in the Senvion GmbH Audited
Consolidated Financial Statements December 31, 2015, amounted to €17.7 million and €9.5 million, respectively. The Group’s specific
warranty provision additions for technical issues related to the Group’s 6.XM WTG series offshore blades in the financial year ended December 31, 2015, as recognized in the Senvion S.A. Audited Consolidated Financial Statements, amounted to €13.5 million. Based
on the above mentioned financial data, the pro forma specific warranty provision additions for technical issues related to the 6.XM
WTG series offshore blades in the amount of €21.7 million have been calculated by adding Senvion Group’s specific warranty provision additions for the financial year ended March 31, 2015 to the Group’s specific warranty provision additions for the financial
year ended December 31, 2015 and subtracting the Senvion Group’s specific warranty provision additions for the nine-month period ended December 31, 2014.
(5) Pro forma general warranty provision releases relate to the yearly update of the amount of the general warranty provisions based on the
latest statistical data. The adjustment is then also applied to all WTGs that are still under warranty and the amounts of provisions are adjusted accordingly. The Senvion Group’s general warranty provision releases in the financial year ended March 31, 2015 and in the
nine-month period ended December 31, 2014, derived from the internal accounting records of the Senvion Group, amounted to €4.2
million and €4.2 million, respectively. The Group’s general warranty provision releases in the financial year ended December 31, 2015, as recognized in the Senvion S.A. Audited Consolidated Financial Statements, amounted to €3.7 million. Based on the above
mentioned financial data the pro forma general warranty provision releases in the amount of €3.7 million were calculated by adding the
Senvion Group’s general warranty provision releases for the financial year ended March 31, 2015 to the Group’s general warranty provision releases for the financial year ended December 31, 2015 and subtracting the Senvion Group’s general warranty provision
releases for the nine-month period ended December 31, 2014.
33
RISKS RELATED TO OUR MARKET AND OUR BUSINESS
Change in, or elimination of, government initiatives and incentives relating to renewable energy sources, and in
particular to wind energy, could have a material adverse effect on the demand for wind energy.
In recent years, governments in many countries have enacted legislation or established policies that support
the expansion of renewable energy sources, such as wind energy. Such support has been a significant factor in
encouraging our customers to purchase wind turbine generators (or wind turbines, “WTGs”) and participate in wind
farm projects. For example, due to the increasing focus on reducing dependence on fossil fuels and cutting carbon
dioxide emissions, some countries prescribe specified percentages of electricity that utilities must obtain from
renewable energy sources. Additionally, some countries have provided financial incentive schemes or public grants
to the owners of renewable energy systems such as wind energy. Such incentives are often provided through
preferential tariffs or regulated feed-in-tariffs (“FITs”) on power generated by WTGs or tax incentives for
promoting investments in wind energy.
However, faced with high financial deficits and rising levels of public debt, some governments may seek to
scale back or eliminate these government incentives. In the past, the decrease in, or elimination of, direct or indirect
government incentives for renewable energy, including wind energy, has had a negative impact on the market for
wind energy. If government support for wind energy is terminated or reduced in any jurisdiction which is material
for our business, this could have a material adverse effect on our business, our ability to convert signed contracts
into firm orders, financial condition and results of operations. For example, the expiration and curtailment of the
United States Renewable Energy Production Tax Credit (“PTC”) originally scheduled for December 31, 2013,
caused a significant contraction of newly commissioned wind capacity beginning in 2013. As a result, Senvion
GmbH (formerly Senvion AG, Senvion SE and REpower Systems SE) (“Senvion” and, together with its fully
consolidated subsidiaries, the “Senvion Group”) decided not to sell any WTGs in the U.S. market since the
financial year ended March 31, 2014. In December 2014, the PTC was extended retroactively by one year to cover
wind projects commissioned in 2014. Then in December 2015, the PTC was extended through December 2019 for
wind facilities commencing construction, with a phase down beginning for projects commencing construction after
December 31, 2016. The PTC has been extended multiple times and allowed to expire multiple times. Additionally,
the Netzanforderungen (“SDL”) bonus, a German governmental subsidy that lowers the levelized cost of energy
(“LCoE”) for WTGs that were installed during 2014, was eliminated for wind parks commissioned after August 1,
2014. In addition to Germany, the onshore wind policy in the UK has also changed. The Conservative party’s
election manifesto committed to end new subsidies for onshore wind and changed planning laws so that local
communities have the final say on onshore wind farm applications. The Secretary of State for Energy and Climate
Change confirmed in June 2015 that new onshore wind generation projects will no longer be eligible for the current
subsidy system, the Renewables Obligation (“RO”), after April 1, 2016 while most renewable technologies retain
eligibility for an additional year. The RO is being replaced by Contracts for Difference (“CfD”). This same
statement indicated that there may be no budgetary allocation for onshore wind subsidies in future CfD rounds.
These developments may have a negative impact on the onshore wind market in the UK. Canada’s energy market is
primarily regulated provincially, and various provinces are moving towards an auction system, which means higher
competition in the future. For example, Ontario has announced it is working on a cap-and-trade proposal, and
Quebec has announced plans to release a new ten year energy plan for 2016-2025.
Furthermore, governments may seek to alter the ways in which their incentives are provided. Currently, in
many countries the subsidies paid to renewable energy are funded by taxes or surcharges levied on the consumer’s
energy bill (as is the case in Germany regarding the German Renewable Energy Act, as amended (“EEG”)
surcharges, for example). This has increased pressure on policymakers to restructure support for the renewable
energy sector. As a result, governments are moving away from the more generous fixed support regimes towards
market-based auction models where competing developers bid each other down and the one willing to accept the
lowest level of incentives will be awarded a project. For example, the German incentive system will be moving
from the preferential fixed feed-in tariff (“FIT”) system to an auction-based system from 2017 onwards and is
currently conducting pilot rounds for solar power to gain experience with this policy. This is likely to reduce
margins and returns for our customers and might therefore further intensify price pressure and competition for our
industry. Similar auction systems already implemented in other markets have led to WTG projects becoming larger
but fewer in those markets. We might be subject to the resulting risk of market volatility on order intake, production
volume and revenues and a potential decrease in the number of overall WTG projects should our customers fail to
compete successfully were an auction-based system to be introduced in any of the markets in which we operate. In
addition, there is a risk that government policies could change in a manner that makes it less attractive for investors
to establish community-led energy projects, and wind energy projects in particular. Governments may also cap the
total wind capacity additions over a particular period similar to a cap recently enacted in Germany. Furthermore, as
34
a result of continuing fiscal concerns, some governments in our satellite markets (including those in Romania) have
applied retrospective tariff measures in the renewable energy sector, which have negatively affected the level of
wind power installations. If the type of government support offered for wind energy is altered in any jurisdiction in
which we operate, this could have a material adverse effect on our business, financial condition, cash flows and
results of operations.
Changes in regulations could lead to a period of uncertainty regarding the application, in practice, of any
new rules. This uncertainty could potentially negatively affect our order intake and order book, for example, due to
reluctance of customers to invest in new wind projects or participate in tenders. Changes in the regulatory
framework could also adversely affect projects for which contracts have already been signed with a customer,
potentially requiring renegotiation of signed contracts or resulting in cancellation of contracts, and could affect our
order intake pipeline, which is the basis for our forecast. In addition, changes in the regulatory framework might
cause our market share to decline in the various markets in which we operate or are planning to enter.
These risks are enhanced by the fact that wind energy is not the only available renewable energy source.
There are various other types of renewable energy sources, including modern bioenergy/biomass, geothermal, tidal,
biofuels and nuclear power, all of which compete for such governmental incentives. If governments provide more
attractive support to other sources of renewable energy, such as solar or bioenergy/biomass, they could make
producing electricity from wind energy less competitive. For example, Germany recently reduced the incentivizing
FITs available for wind energy. Competition from alternative renewable energy sources could lead to similar
reductions in governmental support, diverting the allocation of subsidies to alternative forms of renewable energy,
which could have a material adverse effect on our business, financial condition, cash flows and results of operations.
For example, the Indian government has announced much higher targets for solar energy than wind energy and, as a
result, the activity in solar has increased substantially, thus decreasing the overall electricity price from solar sources
and lowering the gap significantly between wind and solar electricity generation prices.
This is especially significant in the immature offshore wind industry where grid extension and grid
connectivity, related cost sharing mechanisms and support for ancillary industries are particularly critical and often
require government subsidies. Any delay in implementing policies in relation to any of these may affect the growth
of the offshore wind sector, which is an important growth driver for us. For example, recent delays in resolving grid
connectivity issues in the UK and Germany have delayed the development of multiple offshore wind farms by
several years. Any delays such as these could have a material adverse effect on our business, financial condition,
cash flows and results of operations. In particular in Germany, the discussion about grid extension issues, such as
the routes of electricity lines from northern Germany to southern Germany, between the federal states, especially in
Bavaria, is still ongoing. As a result, the concrete planning of the electricity lines could be changed, especially the
proportion between underground cables and above-ground cables. This could lead to higher costs for the electricity
lines and in consequence to more pressure on the prices for our products.
Any of these factors could have a material adverse effect on our business, financial condition, cash flows
and results of operations.
The market for WTGs is highly competitive.
The market for WTGs is intensely competitive. Important factors affecting competition in the WTG
industry include the performance, reliability and quality of WTGs, the suitability of WTGs for specific project sites,
their price, the scope and quality of services offered in conjunction with the sale of the WTGs, the ability to invest
as a minority investor in large projects (including offshore projects), the training offered to customers and the
available regulatory incentives. Any deterioration in our competitive position with respect to any of these factors
could have a material adverse effect on our business, financial condition, cash flows and results of operations.
Furthermore, competition in the WTG industry has only intensified in recent years as a result of international
expansion by existing industry participants, consolidation and market entry by new entrants. If our competitors
consolidate further, through joint ventures, cooperative agreements or otherwise, we may have difficulty competing
with them. In addition, our competitors may seek in the future to expand their market share through selective
acquisitions of competing industry participants. As a result, we may become the target of a takeover bid by one of
our competitors which may pose significant operational and financial risks to our existing operations. Large
industrial groups that compete in the WTG market, such as General Electric or Siemens, benefit from a higher
capital base and cross-financing through affiliated companies, resulting in less expensive financing and providing
increased resilience against economic fluctuations. Furthermore, for large projects, in particular offshore, the WTG
supplier’s capital base, financial position and availability of guarantees are a significant competitive consideration.
Our competitors may be willing and able to spend more resources on product development, and may be able to
35
provide comparable products and services faster or at a lower price than we can. For example, competitors from
other areas, such as China, could attempt to enter the European market with less expensive WTGs. In addition, the
market for WTGs includes an increasing number of large utilities which tender wind farm projects of large sizes and
request WTG suppliers to conform to bidding processes prescribing both bespoke technical and commercial terms.
We might not have sufficient capacity to react in time and to adequately comply with such demands of bidding
processes and contractual terms. The inability to comply with such demands may result in us not being considered
as a preferred WTG supplier and not gaining expected revenues. Growing competition could result in a decline in
our market share and negatively impact our order intake or force us to reduce the prices of our products and
services, which may reduce revenues, margins and cash flows.
Given the highly innovative and competitive nature of our industry, our ability to defend our market
depends heavily on designing, developing and marketing new and more cost efficient WTGs. WTGs are
progressively becoming larger and their operational performance has improved, resulting in customers demanding
more cost-efficient WTGs. However, the development of new WTG models requires considerable investment and
there is a risk that our product development may be delayed, which may result in the incurrence of higher than
expected costs. For example, our component manufacturing equipment and technology may not be suited for future
generations of products we develop. Furthermore, though product cycles generally last two to three years,
continuous improvements are required, in particular in the fields of R&D, procurement and supply chain, production
and project management, and lifecycle engineering. In certain of these areas, scale could be an important advantage,
for example, to increase bargaining power with suppliers or to benefit from a global supply chain with low-cost
sourcing, thus putting us at a disadvantage compared to larger competitors. Additionally, there can be no assurance
that the newly developed products will deliver the expected technological results. Our competitors may develop new
and technologically more advanced WTG models, which are better equipped to satisfy customer demand. The cost
of developing new products may prove to be greater than the income generated from those products. The newly
developed WTGs may also face technical issues, which we may not be able to overcome or which may lead to
customer claims and associated costs as well as potentially reputational issues and thereby negatively affecting our
ability to compete. If we are unable to remain competitive, we may not be able to sign enough new orders. If our
order intake for onshore or offshore WTGs is not sufficient, we may face cash and non-cash negative consequences
relating to both tangible and non-tangible assets, including, for example, plant closures, write-offs and repayment of
incentives or subsidies received. Any of these factors could have a material adverse effect on our business, financial
condition, cash flows and results of operations.
The demand for wind energy projects is generally dependent on economic growth.
The demand for electricity is generally linked to economic growth. As the economy grows, economic
activities, such as industrial production and personal consumption, also tend to grow, which increases the demand
for electricity. Conversely, in economic downturns, economic activities decline or stagnate, causing demand for
electricity to decrease. If the economies of the markets in which we operate do not grow, or if any of them enter a
period of recession, or if there is an economic downturn, demand for electricity, including the demand for renewable
energy sources such as wind energy, is likely to stagnate or decrease. Additionally, challenging macroeconomic
conditions could contribute to a decline in demand for products that require sizeable initial capital expenditures. A
wind project typically represents a substantial investment, for which our customers are generally required to obtain
financing. Any increase in market volatility and liquidity disruptions in the global financial system could lead to
lenders reduce funding to borrowers. As discussed in more detail under “—The terms of financing that our
customers can obtain for wind energy projects has a significant influence on our ability to sell our products,” the
financing available to our customers has a significant influence on whether and when our customers will proceed
with the development of wind power plant projects and purchase our products and services. A significant and
sustained economic downturn in our key operating markets would have a material adverse effect on our business,
financial condition, cash flows and results of operations.
Volatility and instability in global capital and credit markets as well as significant developments in
macroeconomic and political conditions that are beyond our control could have an adverse effect on our
business, financial condition, cash flows and results of operations.
Our business can be affected by a number of factors that are beyond our control such as general
macroeconomic conditions, conditions in the global capital and credit markets, geopolitical conditions and other
general political and economic developments. Volatility in the financial markets, including in the capital and credit
markets, the European sovereign debt crisis and any economic slowdown or uncertainty in the markets in which we
operate could result in a decline in our market share or have a negative effect on our business.
36
Notwithstanding the recent improvement in the European financial markets, concerns remain regarding the
creditworthiness of the sovereign debt of various Eurozone countries, in particular Greece. Sovereign debt defaults
and European Union or Eurozone exits could have a material adverse effect on us by, for example, impacting the
cost and availability of credit to us and causing uncertainty and disruption in relation to financing. The proposed
referendum on the UK membership of the European Union may constitute an additional risk for the financial market
and the European economy. We are particularly sensitive to economic conditions in our core market of Germany.
Furthermore, the Chinese economy, which was previously particularly resilient to adverse developments in other
countries and showed constant economic growth, has recently seen a significant deceleration. This has led to
increased volatility on stock markets in China and Hong Kong. While the Chinese government and institutions
associated with the Chinese government have reiterated their commitment to support stock markets and the
country’s economic development as a whole, stock markets may still experience a significant decline, and the
growth of the Chinese economy may further decelerate or reverse into a recession which would in turn adversely
affect the global economy as a whole. If conditions in the markets we operate in or the global economy weaken, this
could result in a decline in our market share or adversely impact our business, financial condition, cash flows and
results of operations.
The viability of wind energy projects is dependent on the price at which electricity can be sold, including
regulated feed-in-tariffs (“FITs”), if any, and the cost of wind-generated electricity compared to other energy
sources.
The viability of a wind energy project in a particular region is dependent on the price at which electricity
can be sold, taking into account applicable FITs or other government incentives or subsidies, as well as the cost of
wind-generated electricity compared to electricity generated from other sources of energy in such region. Under
certain circumstances, wind energy projects might face challenges even if the government provides incentives or
subsidies, for example, in the case of delayed execution of power purchase agreements in such markets, as has been
the case in Australia. Wind energy projects require higher initial capital investment per kilowatt hour (“KWh”) of
energy produced as compared to that required for a fuel-based power plant. The cost of electricity produced by wind
energy projects is dependent on the cost of establishment of the wind energy projects themselves, including access
to the electricity grid, financing costs, maintenance costs and wind conditions at the designated site, among other
factors. Continued investment in product development and technical advances in WTG design have led to an overall
reduction in the cost per KWh of power from wind energy over a period of time. However, in many countries,
especially in Europe, wind energy is still not cost-competitive with conventional sources of energy and the gap is
even wider for offshore wind energy. Moreover, an increase in cost-competitiveness or significant developments in
technology for other sources of power generation could result in lower demand for wind energy products,
particularly in an environment of low fossil fuel prices. If wind energy fails to generate electricity at a LCoE that is
less than or equal to the price of purchasing alternative forms of energy from the grid (“grid parity”), this would
have a material adverse effect on our business, financial condition, cash flows and results of operations.
The viability and level of wind energy generation is dependent on wind patterns, which are not constant and vary
over time and may be subject to increasing extreme weather conditions due to climate change.
The viability of wind energy projects is primarily dependent on the wind patterns at project sites
conforming to the patterns that had previously been recorded to determine the suitability of these sites for wind
energy projects. There can be no assurance that wind patterns at a particular site will remain constant or consistent
with our projections. A lack of appropriate sites with favorable wind conditions or changes in wind patterns at sites
that have been previously identified as suitable for wind energy projects could impact the demand for WTGs
generally. Furthermore, WTG specifications must be suitable for the wind conditions expected at a particular site.
Therefore, unavailability of locations that are suitable for the WTGs we produce would have a negative impact on
our sales and thus materially adversely affect our business, financial condition, cash flows and results of operations.
For example, extraordinary wind conditions, such as severe storms, may increase due to climate change and may
affect the viability and predictability of wind production, as wind turbines automatically shut down in such
situations.
Wind energy cannot be considered viable as a primary source of electricity and faces the risk of substitution.
Wind energy is generally not considered a viable base load source of electricity because it is not a stable
provider of electricity. As such, it introduces volatility on the grid, which needs to be absorbed by other energy
sources that can ramp up production when electricity produced by wind is low. As a result, the share of the
electricity production that can be achieved from wind is limited. This means that, while demand for wind energy is
expected to increase, it appears unlikely in the foreseeable future that it will be considered a large-scale substitute
37
for nuclear or fossil-fuel generated power and for renewable energy from more reliable sources, such as hydro
power. In addition to energy produced from other renewable energy sources, principally solar and hydroelectric
power, the main competition to wind power is gas, coal and nuclear-fueled power generation. There have been
several technological innovations within the renewable energy industry which could lead to other forms of
renewable energy, such as solar or biomass, emerging as more cost-competitive, thereby taking market share away
from wind technology, adversely affecting the future growth prospects of the wind energy industry in general and
our prospects in particular. In recent times, the abundant availability of shale gas in the United States has resulted in
low wholesale electricity prices, which, in turn, has directly affected the demand for wind energy.
Furthermore, the cost of oil, coal and other fossil fuels is a key factor in determining the effectiveness of
wind energy from an economic perspective. Cheaper and larger supplies of fossil fuels favor non-wind energy
generation, while more expensive and limited supplies of fossil fuels would favor wind energy generation.
Discovery of new and significant oil, gas and coal deposits or a decline in the global prices of oil, gas and coal and
other petroleum products, could result in lower demand for wind energy projects, which would have a material
adverse effect on our business, financial condition, cash flows and results of operations.
The terms of financing that our customers can obtain for wind energy projects has a significant influence on our
ability to sell our products.
Most customers require bank financing for purchasing a WTG, and, therefore, the financing terms
available in the market have a significant influence on the wind energy industry. Many offshore wind farms are also
financed by utilities and are therefore directly affected by the financial health of the utilities. Additionally, banks
have now started extending project based non-recourse financing. However, if this trend is reversed, it would
negatively affect the demand for offshore wind energy. Higher interest rate levels will increase the costs of investing
in wind energy, making wind energy a less attractive investment proposition. Further, wind farms are generally
financed for a shorter term than fossil fuel-based power plants. As a result, WTG customers assume a higher degree
of risk regarding upward interest rate movements in the event a WTG project requires refinancing. The ability to
obtain financing for a wind energy project also depends on the willingness of banks and other financing institutions
to provide loans to the wind energy industry participants, including their willingness to finance large wind energy
projects. If banks and other financing institutions decide to reduce their exposure to the wind energy industry or to
one or more suppliers of WTG components or credit and liquidity conditions worsen, customers may reduce, delay
or forgo orders which would harm our business. Factors having a negative impact on the financing terms for wind
energy projects therefore influence our ability to sell our products and could materially adversely affect our
business, financial condition, cash flows and results of operations.
The construction and operation of wind energy projects have faced opposition from local communities and other
parties in the past and could encounter similar opposition in the future.
The construction and operation of wind farms in a number of countries have faced opposition from the
local communities where these plants are located and from special interest groups. WTGs cause noise pollution and
are considered by some to be aesthetically unappealing, and authorities in some of our markets, including Germany,
have or will set sound and tone requirements for WTGs. For example, in some projects in Germany, we have faced
issues with noise pollution with respect to our products. In some cases, such issues have lessened the range of wind
speeds in which our WTGs can operate and we have had to compensate our customers for their diminished use.
WTGs also emit light effects (such as rotating shadows and reflected flashes of light from the rotor blades when the
sun is shining) and ice throws in winter. In addition, certain environmental organizations have expressed opposition
to WTGs based on allegations that wind farms affect weather patterns, kill birds and have other adverse effects on
the environment. WTGs also are sometimes regarded as detrimental to the beauty of the local environment,
particularly by residents of neighboring residential areas. Laws and other regulatory measures govern the
construction and operation of WTGs (in terms of allowable noise levels, distance from buildings, and permissibility
of construction projects in nature reserves). Due to these legal regulations, and the widely different wind conditions
in various regions, only a limited number of suitable sites are available for WTGs in Germany and a number of
other countries. New or expanded legislation regulating wind energy projects may impose additional restrictions
which could lead to significant constraints on the growth of the wind energy industry as a whole. Securing suitable
sites for wind farms by entering into land use agreements or by acquiring land owned by third parties is of
increasing relevance for the realization of new onshore projects and our further project development business.
Difficulties in identifying new land that can be leased or purchased from third parties can materially affect our
future project development revenues. Any of these factors could have an adverse effect on our business, financial
condition, cash flows and results of operations.
38
We may be subject to risks relating to operating WTGs on property owned by third parties.
In most cases, we construct WTGs for our customers on land owned by third parties. If such large WTGs
or facilities are firmly connected to the ground, there is a risk, both under German law and in other legal systems,
that title to the WTGs will pass to the owner of the land whether or not payment of the WTGs or facilities has been
made. Unless the relevant parties agree on land use rights or similar rights beforehand, the title to the WTGs will
pass to the owner of the land. This also applies in the case of our wind farms, given that our customers, which are
the operators, are not normally the owners of the land. In addition (subject to agreements regarding land use rights
or similar rights), there is a risk that the security interests required for project financing purposes in favor of the
relevant bank can no longer be created, with the result that banks may be unwilling to finance projects. We have no
security interests in the form of a retention-of-title clause or similar rights under those circumstances and this could
have a material adverse effect on our business, financial condition, cash flows and results of operations.
The offshore wind industry faces particular challenges and could fail to meet market expectations.
We believe that the offshore market represents a substantial growth opportunity going forward. The
offshore wind industry is still an immature industry. The significant majority of the global offshore capacity is
currently located on the European continent, while Asia and other markets are in very early stages of development.
Offshore wind projects face specific challenges and are generally considered to carry a higher degree of risk than
onshore projects.
Wind electricity generated offshore has not yet achieved an average cost equal to the price of purchasing
alternative forms of energy from the grid in the relevant area and hence is heavily dependent on government
incentives and subsidies. If regulatory support for the industry weakens or becomes uncertain, offshore wind
investment would decline. This risk is particularly pronounced with respect to new geographical offshore markets,
such as China, India or Japan. As a result, offshore wind energy may not become a sustainable part of the energy
mix and any expected growth may not occur.
Furthermore, the cost and technological track record remains a major challenge. Offshore projects are
significantly more costly to install and maintain compared to onshore projects, making financing difficult to secure.
Substantial complexities arise in relation to, for example, multiple stakeholders involved, logistical challenges due
to numerous interfaces (land, port, marine, air), technological risks (such as those related to foundations, blades,
WTG availability and grid connection), impact of wind, current and waves on structures and activities, subsurface
conditions, ability to access including for maintenance purposes, risks associated with heavy lifts and collisions, and
health and safety risks. The construction of an offshore wind farm is a lengthy process and certain factors, such as
the availability of sufficiently large sea vessels, can exacerbate these risks.
Because of the high costs and risks associated with offshore projects, competition in the offshore WTG
industry is to a great extent affected by the WTG supplier’s, its shareholders’ or its group’s balance sheet size. This
is a competitive disadvantage for us, as compared to our competitors, such as large industrial groups that have more
equity and assets than we have or are able to offer guarantees from their affiliates in the contract tendering process.
All of these are factors potential customers take into account when awarding contracts for large, in
particular offshore, WTG projects. In addition, we will need to further develop our product offering in order to
compete effectively in the offshore business. Moreover, the major expected growth drivers of our offshore revenues
are two projects and should these projects encounter difficulties in execution or substantial delays, this may
adversely affect our offshore business.
Moreover, our future offshore business could be at risk, should not enough new orders be signed, for
example, due to our inability to locate an appropriate joint venture partner for our offshore business. If the order
intake for our offshore business is not sufficient in the future, we may be affected by cash and non-cash negative
consequences relating to both tangible and nontangible assets, including, for example, plant closures, write-offs and
repayment of incentives or subsidies received. Should any of the above occur, the future of our offshore business
may be impaired and could subsequently have a material adverse effect on our business, financial condition, cash
flows and results of operations.
We could be subject to risks in connection with our ability to connect to power grids.
The connection or access of WTGs to a power grid is essential when it comes to generating power using
WTGs, especially in our offshore business. There are statutory rules which govern the connection or access of
39
WTGs to the power grid in all of the markets in which we operate. For instance, in Germany, grid capacity for
offshore wind parks has been restricted and is subject to an auction process organized by the Federal Regulatory
Authority (Bundesnetzagentur). In addition, there are special technical challenges related to the connection of
offshore WTGs to mainland grids. Should we or our customers fail to timely obtain a connection or access to the
grid operators’ transmission grids on economically reasonable terms and enter into an agreement (whether on a
statutory or contractual basis) concerning the purchase of the electrical energy generated, this could have a material
adverse effect on our business, financial condition, cash flows and results of operations.
In light of the significant numbers of WTGs and that the electrical energy fed in by these WTGs depends
on the local wind conditions, single grid operators or energy suppliers increasingly require compliance with
technical rules that WTGs must meet in order for them to be connected to the grid. This is done with a view to
ensuring that grids are safe and stable and that there is sufficient supply. There is, therefore, a risk that WTGs might
be unable to meet these requirements, thus being unmarketable. If these requirements are not sufficiently met in the
future with respect to our WTGs, this could have a material adverse effect on our business, financial condition, cash
flows and results of operations.
Any technical deficiencies in our WTGs could adversely affect our business, financial condition, cash flows,
results of operations, and existing and future orders.
Our business, financial condition, cash flows and results of operations are directly related to the continued
technical performance and reliability of our WTGs and their components. As is common in our industry, the
performance of our WTGs is at times subject to certain significant technical risks. In addition to one-off technical
issues, our WTGs and WTG components may be affected by serial defects or damages. In the contracts with our
customers, we provide various product warranties and in our operations and maintenance (“O&M”) service
business we typically guarantee minimum annual average machine availability or a certain energy yield. Our
warranties, for all new products that we sell, generally have a duration of two years. Accordingly, we could incur a
significant amount of costs to repair defects or damages to our WTGs or their components, in particular with respect
to serial defects. In our consolidated statement of financial position as of December 31, 2015, we recorded warranty
provisions in the cumulative amount of €206.8 million for potential costs related to the technical issues of our
products and such provisions may be increased in the future. In any event, we cannot assure you that our provisions
or any insurance coverage or supplier recourse available to us would be sufficient to cover all such costs, and in any
such event we would be required to bear the amount of customer claims or replace the WTGs or their components.
Supplier recourse is often limited to the defective part, and our suppliers are not required to fully indemnify us
against any losses we incur as a result of such part.
In addition, we are exposed to the risk of disputes with our customers based on actual or alleged product
defects, which could lead to further costs and disruptions to our business. In certain countries in which we operate,
statutes of limitation or specific construction legislation may also contain provisions permitting, in certain types of
contracts, a right to bring claims in respect of latent defects that exist at the time of delivery. We also undertake
various testing on new models of WTGs and their components in different operating conditions to acquire data for
making decisions for serial production of new models, and the WTGs and components used in the course of such
tests may be damaged or become unfit to be used. In accordance with the agreement with our customers, any loss
incurred in the course of such tests is borne by us. There can be no assurance that the new WTGs or their
components will operate without any technical issues, in actual conditions, despite being fully certified and tested
extensively under laboratory conditions. We have experienced defects in our products in the past.
For example, we registered certain irregularities in the rotor bearings of our 5M and 6.XM offshore WTGs.
In certain cases, these rotor bearing irregularities can be detected by a rise in temperature in the bearings and are
potentially due to inadequate lubrication of the bearings. The affected WTGs have been retrofitted with a technical
solution to supply adequate lubrication and are continuously monitored.
Further, we registered certain irregularities in the blade bearings of our MM92 and MM82 onshore WTGs.
In certain cases, fractures have appeared in the outer ring of the blade bearing. In a few cases such fractures have
resulted in a breakdown of the blade. The root cause analysis on the affected bearings showed the presence of
corrosion in some boreholes of the bearings. Stringent monitoring procedures have been rolled out to monitor the
blade bearings of the affected onshore WTGs closely. We cannot exclude the possibility that this issue might
potentially affect a wider population of WTGs. As a result of these technical irregularities, preliminary court
proceedings for the preservation of evidence have been initiated, in which the court appointed an expert to review
specific technical questions. In addition, dispute notices have been issued as provided for under the customers’
contractual agreement and in some cases arbitration proceedings are now in progress.
40
In addition, a blade loss occurred in summer 2015 from one of our 6.XM offshore WTGs. In November
2015, through the analysis of the blade loss, which is ongoing, we determined that the design of such blades should
be revised to improve the production of the blades and thus prevent certain technical issues identified during the
analysis from recurring. A revised design of the blade or a retrofit of the produced blade, under the current design
could entail the risk that a new certification might be required, which could result in production delays and
adversely affect our results of operations and cash flows. A total of 32 installed blade sets (including 8 sets of
offshore blades that were installed onshore) and 18 manufactured sets in storage are affected by this technical issue
and will be repaired or retrofitted. In addition to internal calculations and risk assessments, examinations are being
conducted with external specialists to validate the cause and verify the solution.
Furthermore, following the loss of a rotor from a MD77 WTG, in November 2015, a model and series
discontinued by 2007 and no longer produced by Senvion, a detailed in-house root cause analysis is in progress in
order to identify the reason for the rotor shaft failure. Although, at this point in time and based on the inspected
MD77 WTGs, there is no indication that this is not a one-time occurrence, we cannot exclude the possibility that it
might relate to an issue potentially affecting a wider population of WTGs.
We recorded specific warranty provisions for potential costs and customer claims related to the specific
technical issues of our products. However, there can be no assurance that these provisions are sufficient to cover the
anticipated costs connected with these technical issues, and that, as a result, further payments may be necessary
which could negatively affect our results of operations, cash flows and profitability. Furthermore, we cannot
exclude the risk of further irregularities and resulting disputes with customers. Should we not be able to successfully
resolve these irregularities, further legal proceedings could be pursued. Also, technical irregularities, such as the
ones described above, could seriously harm our customer relationship and have a serious impact on future offshore
and onshore orders.
Although any defect or damage to any of our WTGs or their components could have a material adverse
effect on our business, financial condition, cash flows and results of operations, our offshore business is particularly
at risk due to the cost-intensive nature of offshore operations and the costs associated with the complex repair and
replacement operations for offshore WTGs. Any product failure of WTGs or WTG components or any failure of
such products to meet specified performance levels could also damage our reputation and therefore impair the
marketability or lifespan of our products.
Although any defect or damage to any of our WTGs or their components could have a material adverse
effect on our business, financial condition, cash flows and results of operations, our offshore business is particularly
at risk due to the cost-intensive nature of offshore operations and the costs associated with the complex repair and
replacement operations for offshore WTGs. Any product failure of WTGs or WTG components or any failure of
such products to meet specified performance levels could also damage our reputation and therefore impair the
marketability or lifespan of our products. In addition, in the past, our customers have withheld payments, and we
cannot exclude the possibility that customers may withhold payments in the future, in connection with actual or
potential technical issues or other commercial concerns. Such payment withholding, or any of these risks, could
have a material adverse effect on our business, financial condition, cash flows and results of operations.
We could incur expenses in relation to warranties for our products and services.
We are liable to pay liquidated damages to our customers, amounting to a certain rate per day of delay
(typically capped at a specified percentage of the total order value), if there are any delays or disruptions in the
delivery and installation of our WTGs. In most cases we provide various types of warranties and guarantees in
relation to our products, including performance, yield and availability guarantees. For example, pursuant to our
O&M service contracts for onshore projects, we typically guarantee a minimum annual average machine availability
after commissioning of the WTGs during the service period, which generally lasts around two years. If our products
fail to meet the levels guaranteed, we could incur substantial expenses, we could be required to pay liquidated
damages, our reputation may be harmed and our revenues could decline.
Our provisions could prove to be insufficient to cover potential claims arising from warranties, guarantees
and liquidated damages. In the event that such provisions are insufficient, the amount of claims arising from any
cancellations of orders, deferrals or other unanticipated delays, which arise on account of our fault or from the
warranties and guarantees in relation to our products, could have a material adverse effect on our business, financial
condition, cash flows and results of operations.
41
We could be required to repay certain subsidies if certain conditions are not met.
The Senvion Group has received subsidies of €6.8 million over the financial years ended March 31, 2013,
March 31, 2014, and March 31, 2015 and the short financial year ended December 31, 2015 from various entities to
finance mainly R&D of our products and investments. The German government requires such subsidies be used on
certain types of projects in Germany. For example, the German government requires that certain numbers of persons
be employed to work on the various projects such subsidies fund. The German government also requires, among
other things, that the research be done and products made in Germany. If these and certain other conditions are not
met, we could be required to repay the subsidies that we have received. There is a risk that subsidy repayment could
also occur in the other jurisdictions in which we operate. Should we fail to meet the conditions attached to our use
of certain subsidies, this could have a material adverse effect on our business, financial condition, cash flows and
results of operations.
The length and content of our O&M service contracts may change in the future.
As of December 31, 2015, we held O&M service contracts on 74.5% (approximately 10.2 gigawatts
(“GW”)) of all WTGs we have installed over time. As of December 31, 2015, our O&M service contract renewal
rate was more than 75%. Thereby, we also offer an “Integrated Service Package” (“ISP”) which provides a
complete O&M service, including the provision of all spare parts and labor necessary for maintaining the
operational performance of a wind farm. As a result, our service revenues have been growing each year over the
past five years. There is a risk, however, that our customers may not renew their O&M service contracts. There is
also a risk that competition among O&M service providers could reduce the prices at which we can successfully sell
O&M service contracts. There is also a risk that our new customers may not choose to enter into such O&M service
contracts. For example, banks typically expect O&M service contracts to mitigate the risk of technical
unavailability, but our customers could obtain their financing elsewhere, or technological progress could eliminate
the need for such O&M service contracts. Under our ISP contracts, some of which may even run for the entire life
of the WTG, there is a risk that we may not be able to immediately meet our obligations to replace, service or
guarantee certain degrees of availability or an energy yield of our installed WTGs. For various reasons, the length
and content of such O&M service contracts may change in the future. Should any of the above occur, this could
have a material adverse effect on our business, financial condition, cash flows and results of operations.
Because we are dependent on external suppliers for key components, equipment, machinery and materials, any
business or relationship interruptions could harm our operations.
The success of our operations depends on, among other things, our ability to source sufficient amounts of
components, equipment, machinery and materials for our projects at competitive prices. WTGs require certain
components that are specifically designed for application in wind energy generation. The type and configuration of
particular WTGs also require specifically designed components. We source raw materials such as glass fiber and
epoxy resin for rotor blades, as well as several key WTG components (such as gearboxes, yaw and pitch drives, gear
rims, slowing rings, brake calipers and castings, as well as towers, converters and generators) from third party
suppliers. The quality of our products depends on the quality of the components and materials and the ability of
suppliers to deliver them timely. Because we are less vertically integrated than some of our competitors, ability to
source key components is particularly crucial for us. We use primarily large and internationally reputable suppliers
and seek, wherever possible, to have a minimum of two suppliers for each key component to minimize the risk of
shortages. Finding suitable alternative suppliers who can meet our technical and quality standards, and who can
supply the necessary quantities, may be difficult within short periods in the event of a supply failure. We are also in
the process of implementing a local supply chain strategy in new markets, in particular with respect to India and
Turkey, to meet local content requirements that trigger regulatory benefits such as higher FITs in Turkey and to
achieve low procurement costs in India. If we are unable to identify suitable local suppliers or agree on
commercially reasonable terms, we may fail to meet the required local content threshold necessary for these
regulatory benefits, which may impair our ability or prevent us altogether from entering the Turkish market.
Furthermore, if we are unable to identify suitable local suppliers or agree on commercially reasonable terms, we
may be unable to reduce our procurement costs which may impair our ability to achieve the envisaged
improvements in our cost structure.
The failure of any of our suppliers to deliver these raw materials or components in the necessary quantities,
to adhere to delivery schedules or to comply with specified quality standards and technical specifications could
adversely affect our production and our ability to deliver orders on time and at the desired level of quality. This, in
turn, could give rise to contractual penalties or liabilities for us, loss of customers and damage to our reputation. In
the past, we have been subject to shortages in the supply of certain key components, such as WTG towers, due to
42
the inability of component suppliers to meet demand. In certain cases, this has led to and can lead to delays in
supplying and commissioning WTGs and thus delay our ability to recognize revenues and also may lead to the
payment of liquidated damages.
We may also face instances where claims against suppliers for losses caused to customers by faulty
components are disputed and recovery of such losses from the supplier is delayed or prevented, leading to us having
to compensate the customer.
We rely on equipment and machinery that is built by third parties and may be susceptible to malfunction.
Although, in certain cases, we are entitled to be compensated by manufacturers for certain equipment failures and
defects, such arrangements may not fully compensate us for the damage and loss suffered as a result thereof. We are
also subject to mechanical failure and equipment shutdowns. In such situations, undamaged manufacturing units
that are dependent on, or interact with, damaged sections of our facilities may also have to be shut down. Such
events could have a material and adverse impact on our manufacturing capacity. The realization of any of these
risks could have a material adverse effect on our business, financial condition, cash flows and results of operations.
We are subject to the risk of additional costs because of an increase in the prices of components and materials.
The prices of the components and materials used in our production depend on factors that are not within
our control. The costs of components and materials required for making WTGs could rise due to factors such as an
increase in demand, commodities or labor prices or shortages in supply. If any of these were to happen and prices
for supplies were to increase, we may be unable to pass on these additional costs to our customers by increasing the
prices of our WTGs and may be unable to implement cost-saving measures in other parts of our business. Where
possible, we include price escalation clauses in our sale agreements with customers. However, these clauses do not
comprehensively protect us from an increase in the price of all of our key inputs. These factors could have a
material adverse effect on our business, financial condition, cash flows and results of operations.
Additionally, with a view to reducing manufacturing costs, we have recently initiated a shift of our supplier
base to Asia, a strategy we intend to pursue for the coming years. However, if our new suppliers are unable to match
the quality requirements of our customers or our customers demand WTGs and components from specific factories
or geographies, shifting the supplier base may take longer or may not be possible at all.
Any failure or delay in our transportation and logistics arrangements could harm our operations.
We depend on various forms of transport, such as air, sea-borne freight, rail and road, to receive
components and materials used in the production of WTGs and to deliver our products to customers. Such
transportation and logistics may not be adequate to support our future operations. Further, we are vulnerable (in
relation to both ourselves and our suppliers) to disruptions of transportation and logistical operations because of
weather-related problems, strikes, lock-outs, inadequacies in road and rail infrastructure and port facilities, lack of
or vaguely defined regulations or other events. We have limited storage facilities and may not be able to store
sufficient WTG components and materials, making us more dependent on efficient logistical operations. In addition,
we face risks during transporting and shipping not only to our products but to the property of third parties, if, for
example, a blade while being transported strikes an object or a building. These factors could adversely affect our
ability to supply products to our customers and could have a material adverse effect on our business, financial
condition, cash flows and results of operations.
The reported amounts of our order book, signed contracts and net firm orders are not necessarily indicative of
actual or future revenues due to possible cancellations, delays or scope adjustments of projects.
Signed contracts and net firm orders, which together make up our order book as presented in this report,
comprise conditional and unconditional orders that we have received from customers on the basis of a binding
agreement. While net firm orders represent business that is considered likely, such orders may be, and from time to
time are, cancelled, modified or subject to delays in execution, and customers may dispute the amounts owed to us.
This is also true of signed contracts, which may require, for example, a building permit to be obtained before the
contract is fully enforceable. Delays or denials of necessary permits may cause delays or prevent our conversion of
net firm orders into revenues or prevent signed contracts from becoming fully enforceable contracts. There is the
possibility of cancellations or changes in the scope of the project and schedule of our orders, for example, because
of the exercise of customer discretion, technology issues or problems encountered in the timely execution of the
project for reasons outside our and our customers’ control. These events could result in our inability to convert or in
a delay in converting orders into revenues and cash flows. Any penalty levied on the customer in the event of a
43
signed contract or net firm order cancellation may not compensate us fully for the loss of potential revenues.
Accordingly, signed contracts and net firm orders should not be considered representative of future revenues.
We generally enter into WTG supply contracts which require us to supply, install, commission and test
WTGs on site and provide for a fixed construction schedule and front-loaded payment milestones for the amounts
due to us. Even relatively short delays or minor difficulties in the execution of a project could result in the non-
payment or late payment of customer dues. As the technical complexity of our projects (in particular large turnkey
projects) increases, we face greater exposure to these risks. In addition, if we are unable to execute a project
according to the order and are unable to commission WTGs on schedule, we may have to pay liquidated damages to
customers.
Any delay, including due to factors outside of our control such as weather, construction delays, customer
credit issues, political pressure and budget constraints, reduction in scope, cancellation, execution difficulty,
payment postponement or payment default in relation to signed contract or net firm order projects, or disputes with
customers could result in a decline in our market share or have a material adverse effect on our business, financial
condition, cash flows and results of operations.
Our sales cycles are complex and could negatively impact our results of operations from quarter to quarter,
making results difficult to predict.
The size and timing of our revenues from sales of products to our customers is difficult to predict and is
dependent on many factors, including market conditions, customer financing, attaining the requisite permits and
weather conditions, all of which may combine to result in high variability in our results of operations, which could
be material in the longer term when compared to our current expectations. Our sales efforts often require us to
educate our customers about the use and benefits of our products, including their technical and performance
characteristics. Customers typically undertake a significant evaluation process that has generally resulted in lengthy
sales cycles for us, typically many months, in particular for large offshore projects. Furthermore, installation of our
WTGs is generally conducted under the direction and control of end-users or third party contractors. The regulatory
approval, permit procurement, construction, start-up and operation of WTG sites could involve unanticipated
changes or delays that could negatively impact our business, financial condition, cash flows and results of
operations, which could be material in the longer term when compared to our current expectations, and result in
fluctuations in our revenues between periods. In addition, a certain portion of our operating expenses are fixed costs,
which cannot be adjusted according to short-term fluctuations in business activities. While we typically have a
number of projects scheduled to close in consecutive sales cycles, a decrease in revenues for a given period could
have a material adverse effect on our business, financial condition, cash flows and results of operations for that
period.
Our revenues are generated from a limited number of customers.
Over the last three calendar years 2013, 2014, 2015, the ten largest customers of Senvion Group
represented 37% of Senvion Group’s onshore order intake, with approximately 15% of Senvion Group’s onshore
order intake being attributable to two customers. In case of offshore order intake, eight customers of Senvion Group
represented 100% of Senvion Group’s offshore order intake. We compete with a large number of companies. It is
not certain that we will be able to generate additional business from our existing customers, to prolong existing
agreements with our customers or that we will be able to secure new customer contracts. Concentration of a
significant portion of our revenues in a limited customer base may mean that any deterioration in our relationship
with one or more of our customers may lead to our inability to agree the terms of new contractual arrangements,
which could have a material adverse effect on our business, financial condition, cash flows and results of operations.
We face credit risk in relation to payments by our customers. In addition, we may become subject to investment
counterparty risks arising from potential co-investments in projects alongside our customers.
We are exposed to credit risk in connection with deliveries of our products and services to customers. Our
receivables against main debtors are generally covered by payment security, such as letters of credit, bank
guarantees, credit insurance, third party guarantees (such as debtor parent company guarantees) and reservation of
title. We attempt to structure payments to match the obligations we undertake in accordance with the milestone plan
agreed for the project. However, we remain exposed to the risk that payments are not made when due and can be
obtained only after lengthy proceedings. Our customers’ default on their payment obligations to us could have a
material adverse effect on our financial condition, cash flows and results of operations.
44
Where we deem it necessary or helpful to secure orders, we may opportunistically co-invest in wind park
projects of our customers in the form of debt (including subordinated or mezzanine debt) or equity participation. We
expect that co-investments will primarily take the form of set-off against payments that would normally be due at
the time of contract milestones and therefore will not have an impact on our available liquidity when drawn upon.
As part of any co-investments, we expect to take minority stakes and will not have operating control over the
projects. We expect these co-investments to be illiquid and, in general, as co-investors, we would be required to
agree to a minimum investment period of several years. We have not co-invested in any projects as of December 31,
2015. While we believe that this commitment to sharing development and execution risks may help us to win
contracts and gain market share going forward, this also exposes us to operational risks of the respective projects as
well as to counterparty risk of the project company in which we invest and the risk that we may lose all or part of
our invested capital.
The long-term nature of our projects exposes us to the risk of a change in taxation.
Due to the long-term nature of our projects, we face a risk of an intervening change in taxation. If new
taxes or changes in existing taxation are introduced between the time of signing and invoicing a contract, we might
be required to bear the higher tax burden, which would affect the profitability of the project, or we may seek our
customers to cover the increased tax, which could harm our relationship with customers. Any change in the tax
regimes to which we are subject could have a material adverse effect on our financial condition, cash flows and
results of operations.
We are subject to tax risks, especially as a result of changes in tax law or its interpretation and application or as
a result of tax audits.
The German and foreign tax assessments of the Group are audited by the tax authorities in the respective
jurisdictions at regular intervals. With respect to Germany, the last completed tax audit of Senvion covered the
financial years 2003 to 2007. Tax audits for Senvion and German tax group companies covering the 2008 to 2012
financial years are currently ongoing. The Australian Tax Office (“ATO”) has notified us that they are considering
performing an audit for the financial years 2008 to 2014. The ATO signaled that if we accept income adjustments
based on a unilateral advance price agreement they will not start a tax audit. If the tax authority in Germany does
not accept the transfer price adjustment in the total amount, we will be subject to double taxation and a write down
of deferred tax assets. To avoid these effects we are in contact with the German and Australian tax authorities to
ensure concurrent income adjustments in Australia and Germany. As a result of current or future tax audits or other
review actions of the relevant financial or tax authorities, additional taxes could be assessed, for example, in
connection with intra-group pricing terms or reduction of tax losses carried forward. Demands for tax payments
relating to earlier periods may be expected. Due to the complexity and dynamics of both tax legislation and the
interpretation of applicable law by the tax authorities, it is possible that the outcome of the tax audits performed in
Germany and abroad may not be as expected and that the tax amounts determined by the tax authorities may exceed
the provisions set up for this purpose, so that additional liquid funds must be applied to pay the tax owed, which
could adversely affect our business, financial condition, cash flows and results of operations.
Moreover, future changes in tax law or in administrative practices in Germany or other countries where we
may from time to time be subject to taxation could increase our tax burden. In addition, whether or not it will be
possible to realize deferred tax assets will depend on our ability to generate sufficient taxable income in the future in
order to make use of tax loss carryforwards. A change in the estimated amounts or our future taxable income may
result in the necessity to recognize impairments.
Furthermore, internal reviews by the Group of past value-added tax (“VAT”) returns and invoices to
customers and service providers identified a need of retroactive corrections, which were executed involving both the
relevant tax authorities as well as the customers. Further detailed reviews of VAT related matters are currently still
ongoing by the Group and the results of this review could lead to the risk that the Group might have to pay
additional VAT amounts to authorities, customers or suppliers, in addition to potential interests and penalties. This
could also entail the risk of criminal proceedings in some jurisdictions. Furthermore, in case additional VAT would
need to be paid, the risk would exist that not all VAT payments thus identified are recoverable from the authorities,
customers or suppliers.
Any of these factors could have a material adverse effect on our business, financial condition, cash flows
and results of operations.
45
Due to restrictions of the deduction of interest expenses or forfeiture of interest carryforwards under German tax
laws, we may be unable to fully deduct interest expenses on our financial liabilities.
Interest payments on our debt may not be fully deductible for tax purposes, which could adversely affect
our financial results. Subject to certain prerequisites, the German interest barrier rules (Zinsschranke) impose certain
restrictions on the deductibility of interest for German tax purposes. The German interest barrier rules in general
allow the deduction of interest payments for German income tax purposes to the extent the taxpayer earns positive
interest income in the same financial year. Interest expense in excess of interest income (net interest expense) is tax
deductible only to 30% of its tax-adjusted EBITDA. Net interest expenses exceeding 30% of its tax-adjusted
EBITDA are disallowed.
All businesses belonging to the same financial unity (Organschaft) for corporate income and trade tax
purposes are treated as one single business. Such consolidation is, inter alia, relevant for the calculation of the tax-
adjusted EBITDA. We have established a financial unity between Senvion TopCo GmbH (“TopCo”), as ultimate
controlling entity, our intermediary holding company Senvion MidCo GmbH (“MidCo”), Senvion Holding GmbH
(“Holding”) and Senvion (as controlled entities). Any non-deductible amount of interest expenses exceeding the
threshold of 30% is carried forward and may, again subject to the interest barrier rules, be deductible in future
financial years (up to a maximum period of five years).
Our international operations subject us to risk.
We operate and sell our products in a number of countries. Our production facilities are located in
Germany and Portugal, and we have market presence in several additional European markets (including France,
UK, Sweden, Austria, Belgium, and Romania), as well as the U.S., Canada and Australia. Our ability to operate and
expand in international markets could be harmed by a number of factors which could have a material adverse effect
on our business, financial condition, cash flows and results of operations, including:
changes in political and economic conditions and potential instability in certain regions;
fluctuation in foreign currency exchange rates, currency control and repatriation issues;
changes in regulatory requirements or in foreign policy, including the adoption of laws, regulations
and interpretations detrimental to our business;
burdens of complying with a wide variety of legal and tax regimes, including those relating to liability
and warranty requirements in relation to our products and services;
difficulties in managing the staffing of international operations;
laws and business practices favoring local competitors;
terrorist attacks and security concerns in general;
reduced protection of our intellectual property rights; and
unfavorable tax rules or trade barriers.
In addition to the current markets in which we operate, as part of our strategy, we plan on entering new
markets in which we currently have no or only a limited presence, in particular India, Turkey, Japan, the Nordic
countries of Sweden, Norway and Finland and the Latin American countries, Mexico, Uruguay, Peru and Chile,
among others.
In particular, our entry into India is expected to deviate from our other market practices because of market
expectations unique to the Indian market. The wind energy market in India is characterized by greater involvement
of WTG manufacturers in the project planning process. In India, for a large majority of projects, WTG
manufacturers identify suitable sites for a wind farm, plan the construction, installation and commissioning of the
WTGs, purchase or lease the land on a long-term basis, investing their own capital, and then present the completed
project plan, including the sale of their own WTGs, to potential investors and purchasers. Some or all of the land we
identify as suitable for a wind farm may not be acquired by us for a variety of reasons, including that allotments of
46
government land may be cancelled and that private land may not be available at competitive prices or at all. Our
inability to acquire such suitable sites may hinder our ability to successfully execute wind power projects for our
customers in time or at all. We may not be able to assess or identify all the risks and liabilities associated with a site,
such as title defects, which may result in the cancellation of our development plans or delay development or
commissioning of the applicable project, which could expose us to liquidated damages. Further, changes in wind
patterns at sites we have identified as suitable for a wind farm, and which we have acquired and developed, could
affect our ability to provide turnkey solutions for such sites and could damage our reputation and the reputation of
the wind power industry as a whole.
Our expansion into new markets would expose us to risks associated with adapting our business to the
different economic conditions and regulatory framework in each country and integrating such expansion with our
existing business. Additional risks include the need for appropriate management of our efforts, successful
negotiation on terms advantageous to us of agreements facilitating our profitable expansion of our business,
including logistics, installation and commissioning, and post-sales support service efforts. International business
efforts generally include risks relating to management of increased currency exchange rate exposure, international
enforceability of contracts, potential exposure of intellectual property to misuse or misappropriation, compliance
and operational challenges which may delay or add complexity to sales and support efforts, and the potential of
local taxation above that which is currently forecast. We may need to comply with local content requirements and
develop products that fulfill the specific requirements of local customers. In addition, because grid connectivity
requirements differ among countries and regions, we face risks of delay in project execution if we have to build up
expertise and adapt our existing products. Furthermore, we intend to continue expanding our O&M services by
broadening our service offering and further penetrating our existing customer base. There is a risk that demand for
such new services may not compensate our costs in creating them. If we are unsuccessful in managing any of these
challenges, our expansion could increase our costs without significant contribution to the results of our operations
and our expansion plans may not yield the intended benefits. As a result, our expansion strategy may not enhance
the value of our business, and could result in a material adverse effect on our financial condition, cash flows and
results of operations if executed ineffectively or at loss.
Our capital expenditure plans are subject to change and other risks and may not yield the benefits intended.
Our operations are capital intensive, as a substantial amount of capital is required to develop, manufacture,
market and distribute our products, services and new technologies. Our capital expenditure plans are based on
management estimates, which may prove to be incorrect or based on incorrect assumptions.
Our capital expenditure plans also depend on regulations in respect of local content requirements in
countries where we have operations or plan to enter. Such regulations may require us to incur capital expenditure in
a particular country or to source locally at higher cost. Inability to comply with such requirements could result in
fines or market exit. For example, local content requirements in Canada or Brazil could create challenges for us in
such markets.
A significant amount of our capital expenditures are linked to product development. In order to remain
technologically competitive, we may be required to expand substantial resources for developing new product
platforms which may prove to be unsuccessful. If we are unable to successfully market and sell a particular product,
we may be required to write-off tangible or intangible assets, including capitalized R&D costs, or could incur
expenses related to changing or disposing of production machinery. In addition, our capital expenditure plans are
subject to a number of risks including cost overruns, construction and development delays or defects, failure or
delay in receiving governmental or other approvals, and the availability of financing on acceptable terms. The actual
amount and timing of our future capital requirements may differ from our estimates as a result of, among other
things, unforeseen delays or cost overruns, unanticipated expenses, economic, political and other conditions in the
markets in which we operate, regulatory changes, engineering design changes, weather-related delays and
technological changes. Higher-than-expected capital expenditures could have an adverse impact on our profitability,
cash flows and financial condition.
Any disruption affecting our operations could harm our business.
The manufacture of our WTGs and WTG components involves significant hazards that could result in fires
and other unexpected or dangerous conditions or accidents. Any significant interruption to our operations because of
fires, floods, severe weather or other natural disasters, power loss, rolling blackouts, telecommunication failures,
terrorist attacks, cyber-attacks, computer viruses, human error, hardware or software defects or malfunctions, or
industrial accidents. In addition, our disaster recovery plan as well as our business continuity plan could partially or
47
completely fail in an emergency situation. All of these risks could have a material adverse effect on our business,
financial condition, cash flows and results of operations.
We are exposed to foreign currency fluctuations.
The reporting currency for our consolidated financial statements is the Euro. However, due to the
international nature of our business, we generate revenues and make payments in a number of currencies outside the
Eurozone, including U.S. dollars, Canadian dollars, British pounds sterling and Australian dollars. For the short
financial year ended December 31, 2015, revenues from the Senvion Group’s operations outside of the Eurozone
represented 15.2% of its revenues. The exchange rates between these currencies can fluctuate substantially.
Our exchange rate risk arises from our foreign currency revenues, costs and other foreign currency assets
and liabilities, to the extent that there is no natural hedge. Although we may use various derivative and non-
derivative instruments to manage risks arising from fluctuations in exchange rates, any material unhedged assets or
liabilities denominated in a foreign currency, combined with adverse movements in such exchange rates, could have
a material adverse effect on our business, financial condition, cash flows and results of operations.
Our business could be adversely affected by strikes, work stoppages or increased wage demands by our employees
or other disputes with our employees.
We are exposed to the risk of strikes, lock-outs, trade union activities and other industrial actions. There
can be no assurance that we will not experience a strike, work stoppage, lock-out or other industrial action. For
example in October 2012 and February 2015, warning strikes took place during ongoing collective negotiations with
the trade union IG Metall, with whom we have a collective bargaining agreement. Further, efforts by labor unions
may divert the management’s attention and result in increased costs. Although our current collective bargaining
agreements with employees are in place until December 31, 2019, we may be unable to negotiate acceptable
collective bargaining agreements with our employees who are represented by unions, which could lead to union-
initiated stoppages. Any such event could disrupt our operations, result in an increase in wages and other benefits or
otherwise have a material adverse effect on our business, financial condition, cash flows and results of operations.
We may not be able to obtain or maintain adequate insurance cover.
Our operations are subject to various hazards and risks, including risks inherent in the use of chemicals and
other hazardous materials in the course of our production processes. These risks include the occurrence of thefts,
explosions, chemical spills, storage tank leaks, discharges or releases of hazardous substances, noise and fumes as
well as other environmental risks, mechanical failures of equipment and natural disasters. In addition, many of these
operating and other risks could cause personal injury, loss of life, severe damage to or destruction of our properties
and the property of third parties and environmental pollution, and may result in the suspension of operations and the
imposition of civil or criminal penalties.
While we believe that our insurance coverage is consistent with industry norms, if any of our production
facilities are damaged or our operations are interrupted for a sustained period, there can be no assurance that our
insurance policies will be adequate to cover any resulting losses. Similarly, our insurance may not provide sufficient
cover for warranty claims by customers. If we were to suffer a large uninsured loss, our business, financial
condition, cash flows and results of operations could be materially adversely affected.
In addition, our insurance coverage is generally subject to annual renewal. If premium levels increase, we
may not be able to obtain the same levels of coverage in the future as we currently have or we may only be able to
obtain such coverage at a substantially higher cost.
Failure to keep our technical knowledge confidential and protect our intellectual property could erode our
competitive advantage.
We rely on patents and copyright laws and licenses as well as non-assertion agreements, among other
protections, to safeguard our intellectual property rights. There can be no assurance that our rights will not be
challenged, invalidated or circumvented, or that we will successfully renew our rights or licenses. Further, our
know-how may not be adequately protected by intellectual property rights such as patents, copyrights and
trademarks. Some know-how is protected only by secrecy and any contractual protection, and we cannot be certain
that our know-how will remain confidential. If confidential technical information or know how about our products
or business becomes available to third parties or to the public, our competitive position could be harmed. Further,
48
there can be no assurance that we will be able to protect our intellectual property rights in respect of newly
developed or upgraded products. Our competitors may be able to take advantage of this and develop and market
similar or superior products. Our inability to protect our intellectual property could have a material adverse effect on
our business, financial condition, cash flows and results of operations.
We may inadvertently infringe upon the intellectual property rights of others.
Companies active in the WTG industry make extensive use of intellectual property rights, both to protect their
technology and to assert their competitive position. Although we believe that our products, services and proprietary
information do not infringe upon the intellectual property rights of others and that we do and will have all the rights
necessary to use the intellectual property employed in our business, there can be no assurance that infringement
claims, including the possibility of substantial monetary claims, will not be asserted against us. Such claims may
force us to alter our technologies, obtain licenses or cease significant portions of our operations. Irrespective of their
merit, these claims could: (i) adversely affect our relationships with customers; (ii) result in costly litigation; (iii)
cause product shipment delays or stoppages; (iv) divert management’s attention and resources; (v) subject us to
significant liabilities; (vi) require us to enter into potentially expensive royalty or licensing agreements; and (vii)
require us to cease certain activities, including the manufacture/supply of certain products and provisions of
services. Furthermore, necessary licenses may not be available to us on satisfactory terms, if at all. All of these
factors could have a material adverse effect on our business, financial condition, cash flows and results of
operations.
We depend on highly skilled personnel to operate our business, and if we are not able to hire, retain, and
motivate our personnel, we may not be able to grow effectively.
Our success depends in part on the knowledge, skill, industry experience and continued services of our
Executive Board members and other key members of senior management as well as on several key experts without
management responsibilities. Competition for talented personnel is intense, and if we lose the services of any of our
key senior management personnel, it would be very difficult to find and integrate replacement personnel in a timely
manner, which could significantly impair our ability to develop and implement our business strategies. The
development and implementation of our business strategies is also heavily dependent on our ability to recruit, retain
and train other highly qualified employees, particularly in the areas of mechanical and electrical engineering,
development of WTGs and rotor blades as well as marketing and sales employees, who should generally have a
technical background and knowledge of the particulars of WTG construction. Our failure to retain highly skilled
personnel could have a material adverse effect on our business, financial condition, cash flows and results of
operations.
Compliance with and changes in safety, health and environmental laws and regulations could adversely affect
our operations.
Our operations are subject to a broad range of safety, health and environmental laws and regulations in the
jurisdictions in which we operate. These laws and regulations require us to obtain and maintain permits and
approvals, undergo environmental impact assessments, review processes and implement environmental health and
safety programs, impose controls on our air, noise, waste, fume and water discharges, storage, handling, discharge
and disposal of chemicals, employee exposure to hazardous substances and other aspects of our operations and
products. Some of our manufacturing and O&M processes are hazardous and require compliance with stringent
safety standards. We expect to continue to incur substantial costs and capital expenditure to comply with such laws
and regulations.
While we believe we are in compliance in all material respects with all applicable safety, health and
environmental laws and regulations, the discharge of hazardous substances or pollutants into the air, soil or water
may nevertheless cause us to be liable to governmental authorities or private persons. In addition, we may be
required to incur costs to remedy the damage caused by any such discharges or environmental incidents.
We could also be affected by the adoption or implementation of new safety, health and environmental laws
and regulations, new interpretations of existing laws, increased governmental enforcement of environmental laws or
other similar developments in the future. Safety, health and environmental laws and regulations are becoming
increasingly stringent. The costs of complying with these requirements can be significant. The measures that we
implement in order to comply with these new laws and regulations may be deemed insufficient by governmental
authorities and our compliance costs may significantly exceed current estimates. If we fail to meet safety, health and
environmental requirements, we may also be subject to administrative, civil and criminal proceedings by
49
governmental authorities, as well as civil proceedings by environmental groups and other persons, which could
result in substantial fines and penalties against us as well as orders that could limit or halt our operations. Any of
these developments could have a material adverse effect on our business, financial condition, cash flows and results
of operations.
The risk of litigation is inherent in our operations. Some of our pending litigation may have an adverse outcome.
In the ordinary course of our business, legal actions and claims against and by us and arbitrations involving
our Group arise. Other than the arbitration proceedings in connection with the technical irregularities in the blade
bearings of our MM92 and MM82 onshore WTGs, we are not a party to any material legal proceedings (including
any such proceedings that are pending or anticipated of which we are aware). We may be subject to other claims
from customers, suppliers, current and former employees and third parties in the future. Our management believes
that we have made adequate provisions to cover our current litigation risks; however, our provisions may prove
insufficient in the event of an adverse outcome and we may incur significant expenses on legal defense. If publicity
associated with, or the outcome of one or more of the legal proceedings we face, is significantly different than what
our management expects, this could have a material adverse effect on our business, financial condition, cash flows
and results of operations.
Our CEO is subject to preliminary investigations for allegedly failing to comply with his obligations in his former
role as CEO of another company. If main criminal court proceedings were to be initiated against him, his service
agreement with us may be terminated.
In connection with certain payments by employees of a company for which our CEO, Dr. Geissinger,
previously served as CEO to employees of that company’s customers in Turkey, the public prosecutor’s office of
Würzburg, Germany, has initiated preliminary investigations (Ermittlungsverfahren) on the basis of an initial
suspicion (Anfangsverdacht) of criminal conduct against, among others, Dr. Geissinger. Although there is no
indication that Dr. Geissinger was in any way involved in the investigated payments, the public prosecutor’s office
is currently investigating whether Dr. Geissinger fully complied with his obligations as CEO. As a precautionary
measure a provision was included in the service agreement between the Company and Dr. Geissinger, entitling the
Company to terminate the agreement within three months of becoming aware of an application by the public
prosecutor for initiation of main criminal court proceedings (Hauptverfahren) for alleged breach of fiduciary duty or
corruption.
In case the public prosecutor applies for initiation of main criminal court proceedings against Dr.
Geissinger and Dr. Geissinger’s service agreement is subsequently terminated, we will need to search for and
appoint a successor CEO. A termination of our CEO may be disruptive to our ongoing business and adversely affect
existing customer relationships. The ongoing proceedings against Dr. Geissinger could also require him to devote
significant time and attention to their resolution, which would detract from his ability to focus on our business, and
may independently of their outcome have a negative impact on our ongoing business and may adversely affect our
existing customer relationships.
50
MANAGEMENT’S DISCUSSION AND ANALYSIS OF FINANCIAL CONDITION
AND RESULTS OF OPERATIONS
The historical consolidated financial information in the following discussion and analysis of the Senvion
Group’s financial condition and results of operations as of and for the financial years ended March 31, 2015,
March 31, 2014 and March 31, 2013 have been taken or derived from the Senvion GmbH Audited Consolidated
Financial Statements March 31, 2015, 2014 and 2013 as well as from Senvion Group’s internal accounting records
or management reporting systems. The historical consolidated financial information in the following discussion and
analysis of the Senvion Group’s financial condition and results of operations as of and for the short financial year
ended December 31, 2015 and the nine-month period ended December 31, 2014 has been taken or derived from the
Senvion GmbH Audited Consolidated Financial Statements December 31, 2015 as well as from Senvion Group’s
internal accounting records or management reporting systems, with the exception of certain financial information
as of December 31, 2015 discussed under the sections “—Liquidity and Capital Reserves”, which has been taken or
derived from the Senvion S.A. Audited Consolidated Financial Statements as well as from the Group’s internal
accounting records or management reporting systems.
The Senvion GmbH Audited Consolidated Financial Statements March 31, 2015, 2014 and 2013, the
Senvion GmbH Audited Consolidated Financial Statements December 31, 2015 and the Senvion S.A. Audited
Consolidated Financial Statements have been prepared in accordance with IFRS and are included elsewhere in this
report, and the following discussion should be read in conjunction therewith, in particular the sections “Risk
Factors” and “Business”.
The operating results of Senvion are included in the Senvion S.A. Audited Consolidated Financial
Statements only as of the date the Acquisition was completed (i.e., on April 29, 2015). In order to be presented with
comprehensive financial information which shows the material impact of the Acquisition for the entire financial
year ended December 31, 2015, investors should refer to the financial information provided under “Pro Forma
Consolidated Financial Information of Senvion S.à r.l., Luxembourg for the period from 1 January 2015 to
31 December 2015”, the purpose of which is to present the Company’s pro forma consolidated income statement
for the period from January 1, 2015 to December 31, 2015 as if the Acquisition had occurred as of January 1, 2015.
In the fourth calendar quarter of 2015, TopCo, MidCo, Holding, Senvion and certain other of Senvion’s
subsidiaries changed their respective financial year end from March 31 to December 31.
Senvion had prepared statutory consolidated financial statements each as of and for the financial years
ended March 31, 2015, March 31, 2014 and March 31, 2013 in accordance with section 315a (1) of the German
Commercial Code (Handelsgesetzbuch) in compliance with IFRS (the “Statutory Consolidated Financial
Statements”). The Statutory Consolidated Financial Statements together with the group management reports for the
respective periods were published separately in the electronic Federal Gazette (Bundesanzeiger). The Senvion
GmbH Audited Consolidated Financial Statements March 31, 2015, 2014 and 2013 included in this reportwere
prepared on a voluntary basis and cover the three financial periods that were included in the Statutory
Consolidated Financial Statements published separately as described above. The Senvion GmbH Audited
Consolidated Financial Statements March 31, 2015, 2014 and 2013 included in this report reflect the change in the
accounting policy for revenue recognition from the sale of onshore wind turbines retrospectively for all periods
presented therein. In addition, the amounts recognized in the Senvion GmbH Audited Consolidated Financial
Statements March 31, 2015, 2014 and 2013 have been adjusted in accordance with IAS 10 Events after the
Reporting Period to reflect adjusting events after the reporting period and until December 18, 2015, when the
Senvion GmbH Audited Consolidated Financial Statements March 31, 2015, 2014 and 2013 were authorized for
issue. These adjustments are limited to those that provide evidence of conditions that existed at the end of the
respective reporting period, but exclude those that are indicative of conditions that arose after the respective
reporting period. Events after the end of the reporting period adjusted for mainly relate to provisions for warranty
risks accounted for under current liabilities and related profit and loss accounts. Evidence of conditions that existed
as of the respective reporting date includes adjustments in estimates and assumptions in relation to the amount of
affected units subject to warranty as well as repair and replacement cost per unit. The adjustments for conditions
that existed at the end of the respective reporting period were made on the basis of information present at
December 18, 2015, the date of issuance of the Senvion GmbH Audited Consolidated Financial Statements March
31, 2015, 2014 and 2013. The adjustments comprise additions to existing warranty provisions which had already
been accounted for in the Statutory Consolidated Financial Statements as well as accounting for warranty
provisions which had not been accounted for in the Statutory Consolidated Financial Statements. Therefore, the
Senvion GmbH Audited Consolidated Financial Statements March 31, 2015, 2014 and 2013 differ from the
51
financial information presented in the Statutory Consolidated Financial Statements each as of and for the financial
years ended March 31, 2015, March 31, 2014 and March 31, 2013 separately published before.
Some of the measures used in this report are not measurements of financial performance under IFRS, but
have been prepared on the basis of IFRS amounts, and should not be considered in isolation or as alternatives to
result from operating activities, net result for the period or cash flow from operating activities or any other
performance measure derived in accordance with IFRS.
Where financial information is labeled “audited”, this means that it has been taken from the Senvion
GmbH Audited Consolidated Financial Statements or the Senvion S.A. Audited Consolidated Financial Statements
mentioned above. The label “unaudited” is used to indicate financial information that has not been taken from the
Senvion GmbH Audited Consolidated Financial Statements or the Senvion S.A. Audited Consolidated Financial
Statements mentioned above but was taken from the Senvion Group’s or the Group’s internal accounting records or
management reporting systems, or has been calculated on the basis of figures taken from the above-mentioned
sources, unless otherwise indicated.
The financial information presented in this report is shown in millions of Euro (in € million), except as
otherwise stated. Unless otherwise indicated, financial information presented in the text and in the tables is
commercially rounded to the nearest whole number or to one digit after the decimal point. The percentage changes
that are stated in the text and the tables have been commercially rounded to the nearest whole number unless stated
otherwise. If the figures that are compared were rounded, the percentage changes are calculated on the basis of
such rounded figures. Due to rounding effects, aggregated figures in the tables may differ from the totals shown and
aggregated percentages may not exactly equal 100.0%. Financial information presented in parentheses denotes the
negative of such number presented, a dash (“–”) signifies that the relevant figure is not available, while a zero
(“0”) signifies that the relevant figure is available but has been rounded to zero.
Except as otherwise stated, references in the following section to “we,” “us,” “our” or the “Group” are,
to Senvion GmbH and its consolidated subsidiaries. Except as otherwise stated, references in the following section
to the “Company” are to Senvion S.A. and its consolidated subsidiaries.
Overview
We are a leading global developer and manufacturer of onshore and offshore WTGs, operating in twenty
countries with approximately 13.7 GW of cumulative installed capacity worldwide as of December 31, 2015. We
hold a strong competitive position in our core markets of Germany, the UK, France, Australia and Canada. We are
headquartered in Hamburg, Germany.
In the short financial year ended December 31, 2015, we generated revenues of €1,683.0 million, a 14.8%
increase compared to €1,465.4 million in the nine-month period ended December 31, 2014. In the short financial
year ended December 31, 2015, our Adjusted EBITDA increased 59.6% to €178.0 million (10.6% Adjusted
EBITDA margin) from €111.5 million (7.6% Adjusted EBITDA margin) in the nine-month period ended December
31, 2014. As of December 31, 2015, our total order book (net firm orders for WTGs and signed contracts for
WTGs), including O&M service contracts, amounted to €5,407.3 million, as compared to €4,900.2 million as of
December 31, 2014.
For the year ended December 31, 2015, the Company’s pro forma revenues and adjusted pro forma
EBITDA amounted to €2,139.5 million and €210.4 million, respectively, for the period from January 1, 2015 to
December 31, 2015.
We develop, manufacture, assemble, install and market a competitive range of technologically advanced
WTGs with rated outputs ranging from 2 to 6.2 MW and rotor diameters ranging from 82 to 152 meters, covering
all wind classes in both onshore and offshore markets for a broad base of customers, including seven of the top
twelve global wind utility companies (excluding Chinese market participants) such as RWE, EDF, Vattenfall and
Enel, large-scale wind farm developers and leading independent producers of renewable power projects. Our
revenues from the sale of onshore and offshore WTGs comprised 89.3% of our revenues for the short financial year
ended December 31, 2015.
In addition to WTG development, manufacturing, assembly and installation, we have a large and fast-
growing service book of O&M service contracts with an average length for our active contracts of approximately 10
years as of December 31, 2015, covering WTGs with a total installed capacity of approximately 10.2 GW
52
representing 74.5% of our installed fleet as of this date. We offer our customers project-specific solutions in the
fields of transportation and installation as well as individually tailored service and maintenance options. Our O&M
services and other revenues comprised 10.7% of our revenues for the short financial year ended December 31, 2015.
In the wind farm development and operations value chain, we focus primarily on assembly and installation
of the wind turbines as well as the operation and maintenance phase and do not primarily engage in project
development or wind farm ownership. Of the components contained in our WTGs, we produce a portion of our
blades and assemble all of our nacelles internally and source other components from a broad network of more than
1,400 closely integrated suppliers. Our WTGs and blades are designed at our R&D centers in Germany and our
newly established R&D center in India and manufactured and assembled at our production facilities in Germany and
Portugal. During the short financial year ended December 31, 2015, our installations of WTGs amounted to
approximately 1.4 GW. As one of the pioneers in the wind industry, we have gained extensive experience from the
assembly and installation of approximately 6,625 WTGs as of December 31, 2015. This experience, in combination
with our engineering capabilities, has historically enabled us to develop a diverse range of WTG technologies and
establish our competitive position in the market. For instance, we were a trend setter in developing and successfully
installing larger MW rated WTGs, allowing us to significantly expand our market share in our core European
markets where demand for 3 MW and larger WTGs has been increasing, partially due to limited land available for
wind farms and other environmental constraints.
In addition to our German engineering heritage, we have an established geographical presence and
longstanding customer relationships in our other European markets, which, together with Germany, accounted for
approximately 76.5% of our cumulative installed capacity as of December 31, 2015. Over the years we have
successfully entered and expanded our operations into North America, Australia and Asia, which accounted for
approximately 23.5% of our cumulative installed capacity as of December 31, 2015.
We believe our business model is well-positioned to capture future growth in the wind energy sector,
targeting both the onshore and offshore markets. With the introduction of our newest 3.4M140 low wind turbine, we
have a complete portfolio of WTGs that allows us to target all wind classes. We operate in countries such as
Germany, France, Canada and Australia, where the regulatory environment and incentive schemes are expected to
remain supportive. In addition, we have a clear focus on entering and realizing market potential in new markets,
such as India and Turkey, as well as markets in Latin America and Nordic Countries, which offer highly attractive
growth potential and where we believe our products are particularly well suited. Moreover, because increased
demand for WTGs triggers increased demand for WTG-related services, the growth of the WTG product market
drives the growth of the WTG service market. As a provider of WTGs and WTG-related services, we therefore
benefit from the growth of both WTG market segments. Our business model has already proven that it is capable of
capturing growth opportunities. As of December 31, 2015, our installed capacity has reached approximately 13.7
GW representing a 14.2% increase from 12.0 GW as of December 31, 2014.
We have a lean and flexible business model, with an in-house focus on high value added activities, which
is characterized by a high proportion of variable costs and an average depreciation and amortization to revenues
ratio which we believe to be lower than that of our competitors. Our cost structure allows us to adapt quickly to
market dynamics, effectively manage capital commitments and support our cash flow generation in more
challenging market environments. We focus our operations on three core activities: WTG assembly, O&M services
and WTG R&D. We also have substantial control over mission critical components, such as blades, approximately
two-thirds of which were manufactured in-house during the short financial year ended December 31, 2015
compared to approximately 15% in 2010. We maintain our focus on sourcing externally other more standardized
components from a broad range of more than 1,400 suppliers, helping us enhance our lean operating business
model.
We have a proven track record of solid financial performance, characterized by strong operating
profitability even in years of weaker demand for WTGs when most of the sector experienced substantial operating
losses. Our revenue base is diversified due to our geographical diversification in addition to our product split
between revenues from the sale of onshore WTGs, revenues from the sale of offshore WTGs and O&M services,
together with other revenues, comprising 85.1%, 4.2% and 10.7%, respectively, of our revenues for the short
financial year ended December 31, 2015. Over the financial years 2012/2013, 2013/2014 and 2014/2015 and the
short financial year ended December 31, 2015, we have experienced overall positive Adjusted EBIT and Adjusted
EBITDA trends. Our Adjusted EBIT grew at a compound annual growth rate (“CAGR”) of 36.6% over the
financial years 2012/2013, 2013/2014 and 2014/2015 and, during the same period, our Adjusted EBITDA grew at a
CAGR of 27.0%. In the short financial year ended December 31, 2015, our Adjusted EBIT and Adjusted EBITDA
53
amounted to €136.3 million and €178.0 million, respectively, as compared to €72.3 million and €111.5 million,
respectively, for the nine-month period ended December 31, 2014.
Certain Factors Affecting Results of Operations
The Group’s results of operations, financial condition and liquidity have been influenced and will continue
to be influenced by the following key developments and market characteristics.
Government regulation
Market demand for wind power is dependent on, among other things, the cost of wind-generated electricity
compared to electricity generated from other sources of energy. Although the electricity production cost per KWh of
wind-generated onshore electricity has declined from 2009 to 2014 by around 12% (Source: BNEF LCOE, 2015)
the wind energy industry is less mature than other conventional energy industries such as gas and coal and the
current cost per KWh of wind-generated electricity would be less competitive with other alternative energy sources
without government incentive programs in place in certain markets. These government incentives, primarily in the
form of FITs and tax incentives, have contributed significantly to the expansion of the wind energy industry and
continue to be one of the main drivers for developing wind energy technology and increasing capacity. FIT policies
of one kind or another, which provide cost-based compensation for renewable energy producers, were in effect in
our core markets during the financial years 2012/2013 through 2014/2015 and the short financial year 2015. We
believe that most of our core markets benefit from stable government support. However, various governments may
gradually adopt the auction model (for example, the UK and Canada), lower their level of support (as done in
Germany recently) or adopt another model instead of the FIT system, which currently is the most prevalent model in
the industry. Changes in, or uncertainty regarding, governmental incentive programs in the markets in which we
operate have affected our business in the past and we expect that such changes will continue to affect our business
in the future.
For example, in Germany, prior to August 1, 2014, every KWh generated from renewable energy facilities
received a fixed FIT, and renewable energy facilities benefited from 20-year, technology-specific, guaranteed and
gradually decreasing payments for electricity generation. However, Germany’s renewable energy landscape has
changed since that time with the introduction of the revised German Renewable Energy Act (“EEG 2014”), which
increased targets for electricity generated from renewable energy sources and introduced a combined FITs system
linked to “direct marketing.” Under the EEG 2014, newly built wind farms with an installed capacity of over 500
KWh are obliged to engage in direct marketing of electricity and no longer receive only fixed FITs. Due to
uncertainty in the market about the changes in EEG 2014, wind energy developers, and financing providers in
particular, slowed the development of and investments in new projects, which negatively impacted our order intake
in Germany in the second half of financial year 2013/2014 and the first half of financial year 2014/2015. The short
financial year 2015 was characterized by a stable order intake in the German market, however net firm orders were
lower than the previous year, as one of our core sub-markets of Schleswig Holstein experienced delays in the
approval process of wind farm development thereby delaying on conversion of order intake to net firm orders. From
2017, financial support for renewable energy projects in Germany is no longer expected to be determined by FITs at
all, but will be determined on the basis of an auction process. The adoption of an auction system could significantly
reduce the number of new investments. Auction systems implemented in other countries have demonstrated that, on
average, renewable projects become larger but fewer in number. See “Risks Related to Our Market and Our
Business—Change in, or elimination of, government initiatives and incentives relating to renewable energy sources,
and in particular to wind energy, could have a material adverse effect on the demand for wind energy.” The risk
and volatility of being able to hold or expand market share in such a market is therefore higher than in a market with
many smaller projects. Furthermore, with the EEG 2014, in the future the level of FITs are expected to be lower for
new installations in excess of 2.5 GW per annum, which could, in combination with the envisaged auction system,
lead to higher competition for fewer projects.
Significant changes in the regulatory environment in the United States also occurred during the financial
years 2013/2014 through 2014/2015. In 2013, the expiration and curtailment of the United States’ Renewable
Energy Production Tax Credit (“PTC”) originally scheduled for December 31, 2013, caused a significant
contraction of newly commissioned wind capacity beginning in 2013. Newly commissioned capacity in the United
States decreased from 13.1 GW in 2012 to 1.1 GW in 2013 and recovered slightly in 2014 with 4.9 GW (Source:
GWEC, 2015). Although in December 2014 the U.S. government reinstated and retroactively applied the PTC, we
decided not to sell any WTGs in the U.S. market beginning in financial year 2013/2014 due to the uncertainty in the
U.S. wind energy market and we continue to focus our operations in the U.S. market on servicing of existing WTGs
54
and our spare parts facility in Portland, Oregon. However, as a result of the lower margin contribution of our WTG
sales in the United States, our overall profitability has not been negatively affected.
Our ability to compete through product development and operational efficiency
Winning projects in the wind energy business is intensely competitive. Important factors affecting
competition are the price/performance ratio of WTGs, suitability of a WTG for the specific project site, stability and
credibility of OEMs, the adaptability of WTGs to increasingly stringent grid requirements, suitability of the WTGs
to the acoustic requirements of the sites and the scope and quality of O&M services.
Competition focused on LCoE has led to pricing pressure for our WTGs in recent years. Rates of decline
vary by market and product, but generally this pricing pressure has led to annualized price reductions between 3%
and 6% in some of our core markets. Our success in winning customer orders primarily depends on our ability to
develop and license technologies and to market technologically advanced and cost-competitive WTGs and failure to
continually develop competitive products could result in a decline of new orders. We aim to continually optimize
the performance of our German-engineered products in diverse operating conditions such as in low and high
temperatures, low and high wind speed areas and coastal areas, as well as to reduce the cost of our offerings. Our
ability to design and develop new products that meet our customers’ changing requirements will continue to be
critical to our ability to maintain and increase our installed capacity and profitability.
In order to remain competitive by improving our existing WTG models and developing new products and
variants, we must incur significant R&D costs and capital expenditures. Our total research and development
(“R&D”) costs (capitalized and expensed costs) in the financial years 2012/2013, 2013/2014, 2014/2015 and the
short financial year ended December 31, 2015 amounted to €42.1 million (1.8% of our revenues), €44.9 million
(2.6% of our revenues), €57.5 million (3.0% of our revenues) and €48.7 million (2.9% of our revenues),
respectively. Our R&D capitalization rate, which is calculated as capitalized R&D costs as a percentage of the total
R&D costs in the respective reporting period, was 65.3% in the short financial year 2015 as compared to 48.7%,
52.1% and 67.5%, in the financial years 2012/2013, 2013/2014 and 2014/2015, respectively. In general, the
capitalization of R&D includes direct R&D project cost and a portion of the R&D overhead expenses transferred to
projects through our time recording system. Total R&D costs comprises personnel costs, overhead expenses,
allocations for rent, human resources, IT and direct spending on R&D projects. Special costs for prototypes, licenses
and others are considered and classified under IFRS separately in various line items of our consolidated financial
statements. See “Business—Research and Development.”
The release of new products and variants developed through our R&D efforts improves our average selling
prices, as we are typically able to charge higher prices for new products and variants, which in turn helps stabilize
our financial performance. To increase our R&D capabilities, we opened our newest R&D center in Bangalore,
India in September 2015. The India team supports our R&D team in Osterrönfeld, Germany, in further developing
our wind turbine technology and allowing us to offer efficient wind turbines tailored towards different wind classes
and locations. We have launched a number of new products during the financial years 2012/2013 through
2014/2015 and the short financial year 2015. In September 2012, we launched the production of the 3.0M122,
which is optimized for low wind-speed locations. Additionally, we are continuing to develop other new WTGs. In
December 2014, we installed a prototype of the type 6.2M152 WTG in an onshore location in Germany. The
6.2M152 WTG is the largest and most efficient WTG of the 6.XM series. We also introduced Vortex generators to
our existing 3.2M114, which have increased the efficiency of the blades and also announced a new variant with the
3.4M114 in September 2014 which is an upgrade of the 3.2M114 with a larger generator that provides more energy
output. In addition, we are continuously upgrading our WTGs, such as the MM100, to operate in medium wind
speed markets, thereby adding new product variants to our portfolio in an established market segment. In April
2015, we launched the 3.2M122 WTG, the successor of the 3.0M122, which offers higher yields and increased cost
efficiency due to its capacity upgrade. In September 2015, we presented the 3.4M140 WTG, our highest yield
onshore wind turbine for low-wind locations. The 3.4M140 WTG is equipped with a sound-optimized blade profile
and a new pitch control system to reduce turbine load. Further, in November 2015, we supplied for the first time the
3.XM WTG featuring the Senvion Next Electrical System (“NES”), aimed at generating higher yields with a
sustainable design while lowering the LCoE. Although we believe that we are able to compete with our peers
through our new products and variants, if a release is delayed or is not competitive with the WTGs of our
competitors, this could negatively impact our average selling prices of WTGs and therefore our business and results
of operations.
In addition to our product development, in order to remain competitive with the market and mitigate the
effects of further price declines, fixed cost increases and uncertainty in the offshore market, we have implemented
55
programs to improve our operating efficiency. We altered our organizational structure in the financial year
2013/2014 by introducing an efficiency enhancement program named POWER in order to eliminate inefficiencies
and standardize duplicative functions over 17 areas of focus, with procurement, human resources and operating
expenditures being the largest in terms of their impacts on profitability. We also optimized our human resources
resulting in approximately 500 employees agreeing to leave us. We achieved total cost savings of approximately
€160 million through POWER in the financial year 2013/2014. In financial year 2014/2015, we launched FOCUS
2015, targeted at improving revenues for sales and service, reducing direct material costs, sustainably improving
product quality, optimizing processes and keeping a tight control on discretionary spending. In order to achieve this,
we identified 22 areas of focus with individual monetary and non-monetary targets, comprising the entire value
chain, from core functions, such as R&D, procurement and sales, to supporting functions, such as organizational
development and operating expenditures. As with POWER, FOCUS 2015 was designed to, among other things,
drive product costs down, keep discretionary spending at only necessary levels, add efficiency to our service
business, gain margins by selling specialized services to our customers and optimize the design of our products on
the back of technological advances in material sciences without compromising on high quality German engineering
products that our customers expect from us. In financial year 2014/2015, we exceeded the target savings under
FOCUS 2015 of approximately €90 million by approximately 11%, or €10 million, for total expected savings of
€100 million. Continuous improvements in our value chain have become a core part of our daily business and we
intend to continue implementing the knowledge we gained from our prior cost savings programs into our business.
Installed capacity
Our results of operations are impacted by our installed capacity of WTGs (measured by MW) and the type
of WTGs installed. Cumulative and installed capacity drives the revenues for our service business, whereas the
installation of new WTGs drives revenues from the sale of our WTGs. Moreover, our revenue streams related to
services and WTG sales are further affected by the types of WTGs involved. For example, 2 MW and 3 MW WTGs
have different levels of pricing, profitability and operational requirements, which also vary depending on the other
variables of our WTGs, such as hub height. As our capacity increases, our revenues from O&M services tend to
increase, as we have held O&M service contracts for a high percentage of the WTGs we have sold over the years
(approximately 74.5% as of December 31, 2015). In addition, our cost base also increases, due to increased repairs
and maintenance costs, warranty expenses and personnel expenses. A change may thereby affect the comparability
of our results of operations as new capacity may affect both revenues and expenses. We increased our installed
capacity We increased our installations by 2,206.6 MW, 1,494.1 MW, 1,852.8 MW and 1,437.8 MW over the
course of financial years 2012/2013, 2013/2014, 2014/2015 and the short financial year 2015, respectively, and the
number of WTGs installed in the period from 941 as of March 31, 2013 to 595, 683 and 601 as of March 31, 2014,
March 31, 2015 and December 31, 2015, respectively. As a result, our revenues followed a similar trend, with
revenues of €2,294.4 million, €1,758.9 million and €1,921.8 million in the financial years 2012/2013, 2013/2014
and 2014/2015, respectively, and €1,683.0 million in the short financial year 2015. A larger installed base does not
only serve as a proven track record (which, especially for project financed developments, is a key requirement from
financing providers), but also generally increases revenues from O&M services, which provide more stable and
predictable cash flow as compared to sales of our WTGs. More installations also create scale, which helps us source
larger quantities of components and raw materials as well as create economies of scale, thereby improving payment
terms with suppliers.
Prices of components and raw materials
Our supply chain is based on a strategic mixture of in-house production and sourcing from third parties.
Our in-house production mainly comprises the assembly of nacelles and hubs, as well as rotor blade production. We
also source a certain portion of rotor blades and all key WTG components, such as gearboxes, castings and bearings,
as well as towers, converters and generators, from third parties. This allows us to follow our lean operating model
strategy, which is based on a reasonable balance between internal and external sourcing of production components
and also on utilizing the experience from best-in-class suppliers for their respective components. We also source
raw materials, such as glass fiber and epoxy resin for rotor blades, from various third party suppliers. As such, we
are dependent on the prices of components and raw materials used in the production of our WTGs.
The price of these components and raw materials depends on a number of factors that are outside of our
control such as commodities prices, currency fluctuations and supply and demand. In general, prices of components
and raw materials have declined during the financial years 2012/2013 through 2014/2015 and the short financial
year 2015. As a result, the savings on these components, which we use in our WTGs, have been one of the core
drivers of our cost savings programs. Given the nature of our business model, the costs of such components are
relatively large compared to some of our other costs, and therefore, savings on the costs of such components have a
56
large effect on our annual savings. Competition among WTG manufacturers, material overcapacity in component
markets (and the entry of well-known industrial participants into these markets) as well as further industrialization
and optimization have led to reduced component prices. In addition, the price of steel, which is one of our principal
commodities used in our business, also decreased during the financial years 2012/2013 through 2014/2015 and the
short financial year 2015, which has contributed to a drop in the price of components, such as towers. In addition,
sales prices have also reduced over time due to reduced subsidies and incentive schemes and a competitive
environment of WTG original equipment manufacturers (“OEMs”), which are other companies that manufacture
certain components that we use in assembling and producing our WTGs, resulting in price reductions for our
customers. Where possible, we include price escalation clauses in our sale agreements with customers. At the same
time, we are exposed to such clauses on the supply side (such as clauses tied to the steel price index).
We furthermore aspire to employ a strategy of natural hedging against currency exposure on the supply
side as much as we can, which means that we try to use our revenues generated in diverse currencies to purchase
components and raw materials denominated in the same currency. However, we do not specifically hedge supplier
contracts or raw material costs and only aspire to hedge majority of the currency exposure from specific project
revenue streams.
Seasonality
Our revenues and results of operations derived from our business are subject to seasonality. WTG sales in
the regions in which we currently sell our WTGs are affected by seasonal variations and the timing of the
application, expiration or beginning of government incentives. For example, the number of wind farms constructed
and connected to an electricity grid is usually higher in the months before the cut-off dates for decreases in FITs,
which typically results in increased business in the second half and mainly in the first quarter of the calendar year
(which, since the change of our financial year end from March 31 to December 31 on December 4, 2015, has also
been our financial year). In addition, weather conditions in some of the areas where we operate also lead to seasonal
influences on our business. For example, in Canada, cold weather conditions generally prevent the installation of
our products during the winter months. Moreover, in some countries incentive programs may expire or foresee
reductions of the FITs towards the end of the calendar year, which leads to stronger revenues for the third and forth
calendar quarters due to increased installation activities in such quarters. In addition, due to the project-driven
nature of our business, our revenues for any period can be influenced by large orders.
Our ability to source and manage working capital
Our operations require working capital due to the extensive timelines required for our projects, with several
months of lead time from a project’s signing to the installation and commissioning of the WTGs. Our cash flows
depend on our ability to optimize the working capital cycle time and to have adequate working capital for the size of
our business. Generally, our working capital increases during periods of high growth in our business, and especially
in periods of higher production than installation, as customer payments are subject to certain milestones.
The typical cash flows from a project are as follows. When we are awarded a contract, we receive an
advance payment from the customer. At a certain point prior to installation of the WTG we incur significant costs in
the production, assembly and delivery of the WTGs to our customers, while the next payment milestone is typically
when the WTG is ready for installation. There may also be a payment milestone related to the completion of the
tower foundation prior to the WTGs being ready for installation. Payment milestones vary, and depend upon
whether deliveries are in lots or based on single unit, the size and nature of the particular project and the standards
and practices in the respective markets in which we operate. Once the WTG is installed, commissioned and handed
over to the customer, our customer pays for the last remaining balance due under the contract for the WTGs. We
typically collect approximately half of the total payment on a project as advance payments and milestone payments
on and after delivery on-site, when the majority of costs have already been incurred. Thus, the gap between actual
costs incurred and payments received is typically at its highest just before delivery. Our cash flows from operating
activities can vary significantly depending on how operationally efficient the specific project planning for the
cluster of projects is and the delivery plans (the gap between assembling the WTG at our facilities and delivering
them to the project site), the specific payment terms of the project, and also on our ability to have more favorable
payments terms with our suppliers than those with our customers. A small amount of our suppliers require us to
make prepayments in advance of shipment or provide letters of guarantee, and certain suppliers of complicated
equipment require interim payment milestones. We may also use factoring and reverse factoring instruments in
certain specific cases, subject to instrument availability for the specific cases.
57
Our net working capital has been higher than industry averages over the last two financial years. Since the
end of the financial year 2013/2014, we have been reviewing, and implementing measures aimed at improving our
net working capital. These measures include shifting our business model to a “built to order” delivery model in
order to reduce the storage time of assembled WTGs, reducing pre-production and lead times, improving our
inventory days and payment milestones with customers and suppliers, addressing identified one-off items,
potentially utilizing the available tools of factoring accounts receivables or payment guarantees instead of longer
payment terms as well as implementing other operating efficiency measures. The most significant improvements
were achieved over the short financial year 2015, with our net working capital having decreased by 42.0% to €92.5
million as of December 31, 2015 from €159.6 million as of March 31, 2015. We expect that the focus on reducing
net working capital as an absolute number and as a percentage of total performance will continue to be at the core of
our future efficiency improvement programs. However, as it is the case with respect to revenue, working capital can
also be heavily influenced by various factors such as seasonality of production, changes and delays in precept plans,
customer payment behavior etc., and therefore may vary throughout the whole year.
Technical deficiencies in our WTGs
The performance and reliability of our WTGs and their components is at times subject to certain significant
technical risks, which is a risk common to our industry. In addition to one-off technical issues, our WTGs and WTG
components may be affected by serial defects or damages. In the contracts with our customers, we provide various
product warranties and in our O&M service business we typically guarantee minimum annual average machine
availability or a certain energy yield. Our warranties for all new products that we sell generally have a duration of
two years. General warranty provisions are based on WTG type, historical evidence available to us and the design
assessments made by the design team in terms of wear-out rates, failure rates and the replacement and unplanned
service requirements of such WTGs. We undertake an annual comparison of our average warranty rates and, usually
at the end of every financial year, adjust our warranty rates to the average over the last three applicable financial
years. We also undertake various testing on new models of WTGs and WTG components in different operating
conditions to collect data for making decisions for serial production of new models, and the WTGs and WTG
components used in the course of such tests may be damaged or become unfit to be used. In accordance with the
agreement with our customers, any loss incurred in the course of such tests is borne by us.
We have incurred costs for certain technical issues during the financial years 2012/2013, 2013/2014 and
2014/2015 and the short financial year 2015. In the financial year 2013/2014. For example, we registered certain
irregularities in the rotor bearings of our 5M and 6.XM offshore WTGs. In certain cases, these rotor bearing
irregularities can be detected by a rise in temperature in the bearings and are potentially due to inadequate
lubrication of the bearings. The affected WTGs have been retrofitted with a technical solution to supply adequate
lubrication and are continuously monitored.
Further, we registered certain irregularities in the blade bearings of our MM92 and MM82 onshore WTGs.
In certain cases, fractures have appeared in the outer ring of the blade bearing. In a few cases such fractures have
resulted in a breakdown of the blade. The root cause analysis on the affected bearings showed the presence of
corrosion in some boreholes of the bearings. Stringent monitoring procedures have been rolled out to monitor the
blade bearings of the affected onshore WTGs closely. We cannot exclude the possibility that this issue might
potentially affect a wider population of WTGs. As a result of these technical irregularities, preliminary court
proceedings for the preservation of evidence have been initiated and certain dispute notices have been issued as
provided for under the customers’ contractual agreement and in some cases arbitration proceedings are now in
progress.
In addition, a blade loss occurred in summer 2015 from one of our 6.XM offshore WTGs. In November
2015, through the analysis of the blade loss, which is ongoing, we determined that the design of such blades should
be revised to improve the production of the blades and thus prevent certain technical issues identified during the
analysis from recurring. A revised design of the blade or a retrofit of the produced blade under the current design
could entail the risk that a new certification might be required, which could result in production delays and
adversely affect our results of operations and cash flows. A total of 32 installed blade sets (including 8 sets of
offshore blades that were installed onshore) and 18 manufactured sets in storage are affected by this technical issue
and will be repaired or retrofitted in the future. In addition to internal calculations and risk assessments,
examinations are being conducted with external specialists to validate the cause and verify the solution.
Furthermore, following the loss of a rotor from a MD77 WTG, a model and series discontinued by 2007
and no longer produced by Senvion, a detailed root cause analysis is in process in order to identify the reason for the
58
rotor shaft failure. Although, at this point in time, there is no indication that this is not a one-time occurrence, we
cannot exclude the possibility that it might relate to an issue potentially affecting a wider population of WTGs.
We recorded specific warranty provisions in the amounts of €137.7 million, €186.2 million, €199.6 million
and €167.2 million in our consolidated statements of financial position as of March 31, 2013, March 31, 2014,
March 31, 2015 and December 31, 2015 respectively, for potential costs related to the specific technical issues of
our products. These provisions have been accrued for under the IFRS principles and to the best of our knowledge at
that time, covered the full anticipated and expected costs that could arise under the above mentioned technical
issues. We may increase these provisions in the future, including, potentially, as we finalize the allocation of the
purchase price for the Acquisition in accordance with IFRS. These provisions do not include general warranty
provisions for which we are required under IFRS to accrue as per our sales contracts with our customers, as
described above.
Currency fluctuations
We report our financial results in Euros, which represented 85% of our revenues for the financial year
2014/2015 and 90% of our revenues for the short financial year 2015. The remainder of our revenues is incurred in
other currencies, including U.S. dollars, Canadian dollars, British pounds sterling and Australian dollars, which are
subject to severe fluctuations. We also own certain assets that are recorded primarily in the functional currency of
our subsidiaries, U.S. dollars, Canadian dollars, British pounds sterling and Australian dollars. A portion of our cost
base is also incurred in other currencies, most notably U.S. dollars, Canadian dollars, British pounds sterling and
Australian dollars, which primarily depends on WTG projects that we have in those countries but also due to our
ongoing O&M services business in those countries. Therefore, our results of operations are affected by both
transactional and currency translation risks. As part of our strategy, we intend to shift a material portion of our
supplier base to Asia, which could increase our exposure to U.S. dollars and the Chinese Yuan. The implementation
of our strategy of entering new markets outside the Eurozone, such as India, Turkey and markets in South America,
will also increase our exposure to non-Euro currencies in the future. Although we hedge using forward exchange
contracts, currency swaps, currency options and derivatives in order to harmonize global cash flows, we do not
intend to hedge our supplier risk, except for using natural hedging and supplier hedging by having alternative
supplier base in other currencies to cover risks from a single currency. See “—Quantitative and Qualitative
Disclosures about Market Risk—Currency Risk.”
We hedge foreign currency items as they arise in order to fix prices on the basis of forward rates, and limit
some currency risk, from sales and procurement transactions. However, hedging may not eliminate all risks, as
changes in exchange rates can affect the translation into Euros of revenues, costs, assets and liabilities of our
subsidiaries that use a currency other than the Euro as their functional currency. A depreciation of other currencies
against the Euro would mean that, despite constant sales volumes and nominally constant prices, we would, after
translation into Euros, generate lower revenues and profits for purposes of our consolidated financial statements. As
we primarily use Euros as the transaction currency in our business our translation risk is limited. However, the
general weakening of the Euro against the U.S. dollar could have a negative impact on our ability to make use of an
Asian supply chain with potentially lower costs in the short term.
Key Performance Indicators
We consider the following key performance indicators in evaluating our business.
Order book and Order Intake
The size of our order book is directly related to our future revenue generation. According to our reporting
policy, we include in our order book only (i) our signed contracts, which are orders received from customers by
means of a formal binding agreement that is subject to conditions precedent or is otherwise not fully effective and
(ii) our net firm orders, which are firm orders received from customers by means of a formal binding agreement
after all conditions precedent have been fulfilled, less revenues already recognized under the percentage of
completion method. The following table shows our order book for WTGs for the dates indicated below.
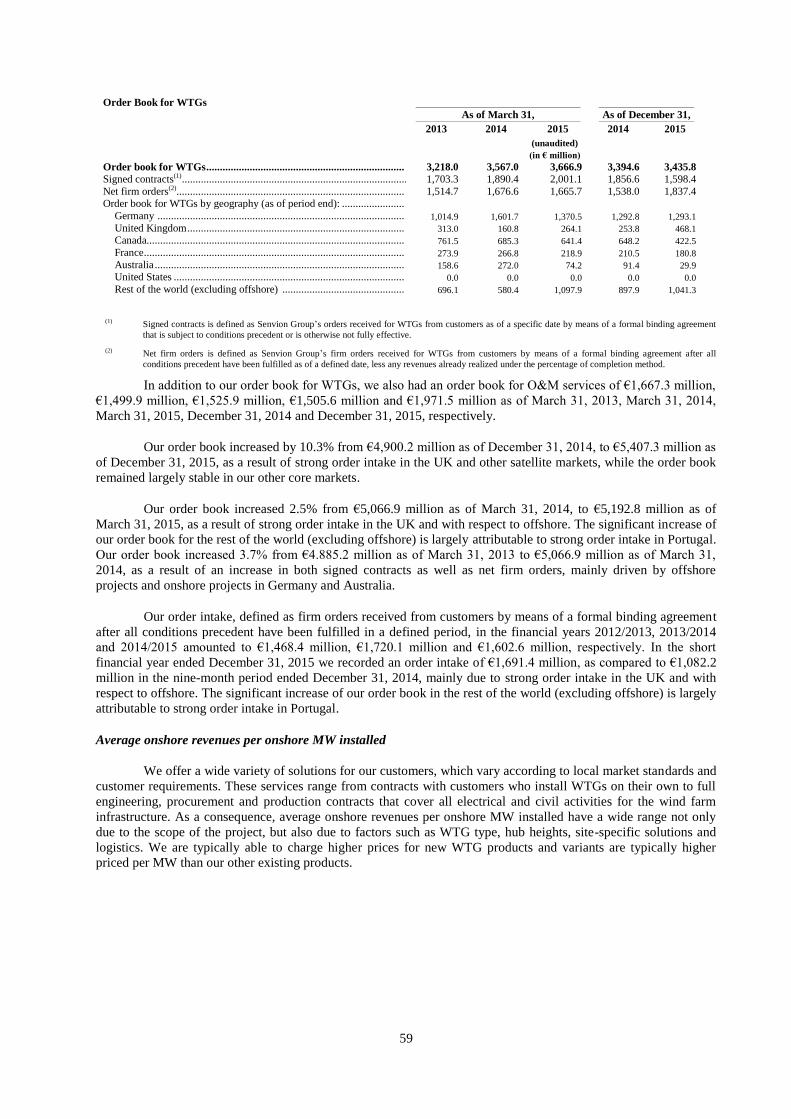
59
Order Book for WTGs
As of March 31, As of December 31,
2013 2014 2015 2014 2015
(unaudited)
(in € million)
Order book for WTGs ......................................................................... 3,218.0 3,567.0 3,666.9 3,394.6 3,435.8
Signed contracts(1) ........................................................................................................................... 1,703.3 1,890.4 2,001.1 1,856.6 1,598.4
Net firm orders(2).................................................................................... 1,514.7 1,676.6 1,665.7 1,538.0 1,837.4 Order book for WTGs by geography (as of period end): .......................
Germany ........................................................................................... 1,014.9 1,601.7 1,370.5 1,292.8 1,293.1 United Kingdom ................................................................................ 313.0 160.8 264.1 253.8 468.1 Canada............................................................................................... 761.5 685.3 641.4 648.2 422.5 France ................................................................................................ 273.9 266.8 218.9 210.5 180.8 Australia ............................................................................................ 158.6 272.0 74.2 91.4 29.9 United States ..................................................................................... 0.0 0.0 0.0 0.0 0.0 Rest of the world (excluding offshore) ............................................. 696.1 580.4 1,097.9 897.9 1,041.3
(1) Signed contracts is defined as Senvion Group’s orders received for WTGs from customers as of a specific date by means of a formal binding agreement
that is subject to conditions precedent or is otherwise not fully effective.
(2) Net firm orders is defined as Senvion Group’s firm orders received for WTGs from customers by means of a formal binding agreement after all
conditions precedent have been fulfilled as of a defined date, less any revenues already realized under the percentage of completion method.
In addition to our order book for WTGs, we also had an order book for O&M services of €1,667.3 million,
€1,499.9 million, €1,525.9 million, €1,505.6 million and €1,971.5 million as of March 31, 2013, March 31, 2014,
March 31, 2015, December 31, 2014 and December 31, 2015, respectively.
Our order book increased by 10.3% from €4,900.2 million as of December 31, 2014, to €5,407.3 million as
of December 31, 2015, as a result of strong order intake in the UK and other satellite markets, while the order book
remained largely stable in our other core markets.
Our order book increased 2.5% from €5,066.9 million as of March 31, 2014, to €5,192.8 million as of
March 31, 2015, as a result of strong order intake in the UK and with respect to offshore. The significant increase of
our order book for the rest of the world (excluding offshore) is largely attributable to strong order intake in Portugal.
Our order book increased 3.7% from €4.885.2 million as of March 31, 2013 to €5,066.9 million as of March 31,
2014, as a result of an increase in both signed contracts as well as net firm orders, mainly driven by offshore
projects and onshore projects in Germany and Australia.
Our order intake, defined as firm orders received from customers by means of a formal binding agreement
after all conditions precedent have been fulfilled in a defined period, in the financial years 2012/2013, 2013/2014
and 2014/2015 amounted to €1,468.4 million, €1,720.1 million and €1,602.6 million, respectively. In the short
financial year ended December 31, 2015 we recorded an order intake of €1,691.4 million, as compared to €1,082.2
million in the nine-month period ended December 31, 2014, mainly due to strong order intake in the UK and with
respect to offshore. The significant increase of our order book in the rest of the world (excluding offshore) is largely
attributable to strong order intake in Portugal.
Average onshore revenues per onshore MW installed
We offer a wide variety of solutions for our customers, which vary according to local market standards and
customer requirements. These services range from contracts with customers who install WTGs on their own to full
engineering, procurement and production contracts that cover all electrical and civil activities for the wind farm
infrastructure. As a consequence, average onshore revenues per onshore MW installed have a wide range not only
due to the scope of the project, but also due to factors such as WTG type, hub heights, site-specific solutions and
logistics. We are typically able to charge higher prices for new WTG products and variants are typically higher
priced per MW than our other existing products.
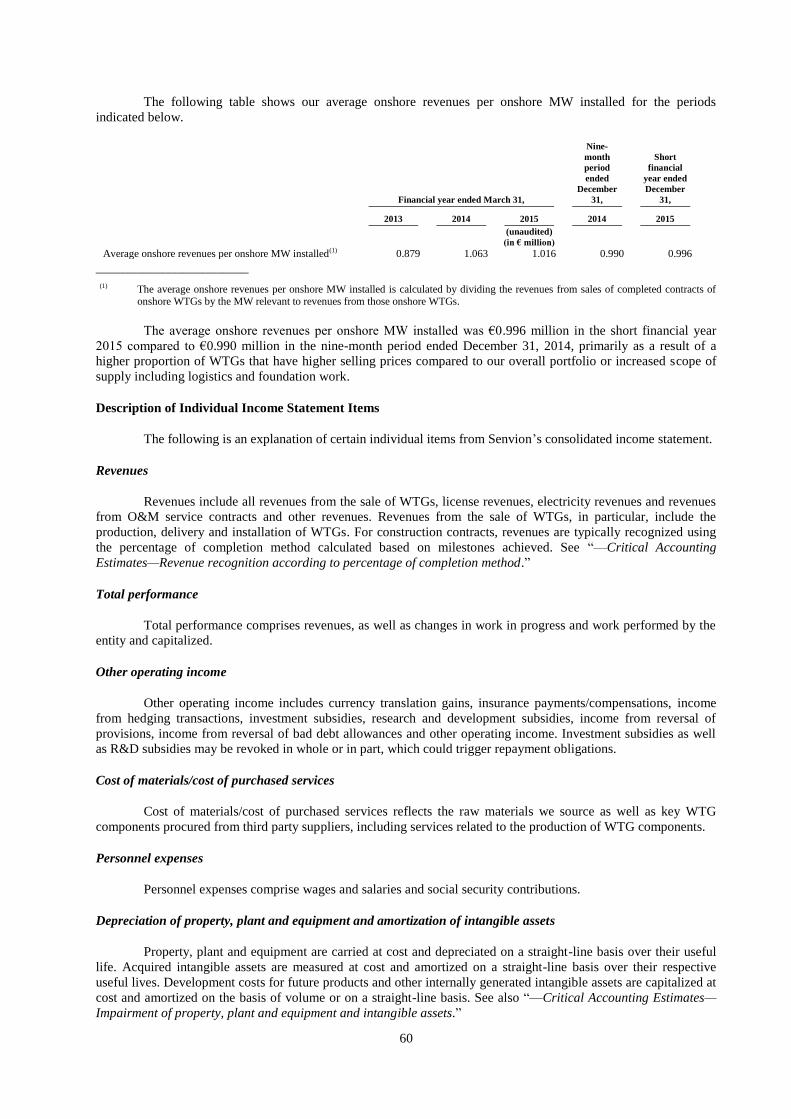
60
The following table shows our average onshore revenues per onshore MW installed for the periods
indicated below.
Financial year ended March 31,
Nine-
month
period
ended
December
31,
Short
financial
year ended
December
31,
2013 2014 2015 2014 2015
(unaudited)
(in € million)
Average onshore revenues per onshore MW installed(1) 0.879 1.063 1.016 0.990 0.996
_______________________
(1) The average onshore revenues per onshore MW installed is calculated by dividing the revenues from sales of completed contracts of onshore WTGs by the MW relevant to revenues from those onshore WTGs.
The average onshore revenues per onshore MW installed was €0.996 million in the short financial year
2015 compared to €0.990 million in the nine-month period ended December 31, 2014, primarily as a result of a
higher proportion of WTGs that have higher selling prices compared to our overall portfolio or increased scope of
supply including logistics and foundation work.
Description of Individual Income Statement Items
The following is an explanation of certain individual items from Senvion’s consolidated income statement.
Revenues
Revenues include all revenues from the sale of WTGs, license revenues, electricity revenues and revenues
from O&M service contracts and other revenues. Revenues from the sale of WTGs, in particular, include the
production, delivery and installation of WTGs. For construction contracts, revenues are typically recognized using
the percentage of completion method calculated based on milestones achieved. See “—Critical Accounting
Estimates—Revenue recognition according to percentage of completion method.”
Total performance
Total performance comprises revenues, as well as changes in work in progress and work performed by the
entity and capitalized.
Other operating income
Other operating income includes currency translation gains, insurance payments/compensations, income
from hedging transactions, investment subsidies, research and development subsidies, income from reversal of
provisions, income from reversal of bad debt allowances and other operating income. Investment subsidies as well
as R&D subsidies may be revoked in whole or in part, which could trigger repayment obligations.
Cost of materials/cost of purchased services
Cost of materials/cost of purchased services reflects the raw materials we source as well as key WTG
components procured from third party suppliers, including services related to the production of WTG components.
Personnel expenses
Personnel expenses comprise wages and salaries and social security contributions.
Depreciation of property, plant and equipment and amortization of intangible assets
Property, plant and equipment are carried at cost and depreciated on a straight-line basis over their useful
life. Acquired intangible assets are measured at cost and amortized on a straight-line basis over their respective
useful lives. Development costs for future products and other internally generated intangible assets are capitalized at
cost and amortized on the basis of volume or on a straight-line basis. See also “—Critical Accounting Estimates—
Impairment of property, plant and equipment and intangible assets.”
61
Other operating expenses
Other operating expenses include legal and consulting costs, purchased services, compensation for loss of
operations, office and land costs, IT and telecommunication costs, currency translation losses, travel expenses,
vehicle costs, costs of training and appointing staff, write-offs/write-downs of receivables, expenses from hedging
transactions and other operating expenses.
Reorganization expenses
Reorganization expenses in the financial year 2013/2014 refer to costs from reorganization related to the
efficiency enhancement program POWER, in which the Group altered its organizational structure in order to
eliminate inefficiencies and standardize duplicated functions. These expenses associated with the reorganization
relate to legal and consulting costs (other operating expenses), as well as personnel expenses from the early
redundancies of staff and cancellation of employment contracts. The program was successfully completed in the
financial year as of March 31, 2014.
Interest and similar financial income and expenses
Interest and similar financial income and expenses represent the Group’s financial and investment results
and largely relate to guarantee commissions and interest on loans. Notably, the financial information presented here
does not reflect the effects of the Notes issued by Holding in April 2015 to finance the Acquisition of Senvion.
Income tax expense/income
Income tax expense/income comprises current and deferred income tax expenses and benefits. Deferred
taxes result from temporary differences in the carrying amounts in the Group’s tax base and its consolidated
financial statements, as well as from carryforwards of unused tax credits and unused tax losses. See also “—Critical
Accounting Estimates—Income taxes.”
Profit/loss for the period from discontinued operations
Profit/loss for the period from discontinued operations relates to the income and expenses of REpower
North (China) Ltd. (“REpower North China”) as a consequence of the initiated sales activities of shares in
REpower North China, which produced WTGs for the north Chinese market. The sale of REpower North China
concluded in December 2015 after which the Group retained a 10.89% interest in REpower North China, but does
not have control over REpower North China.
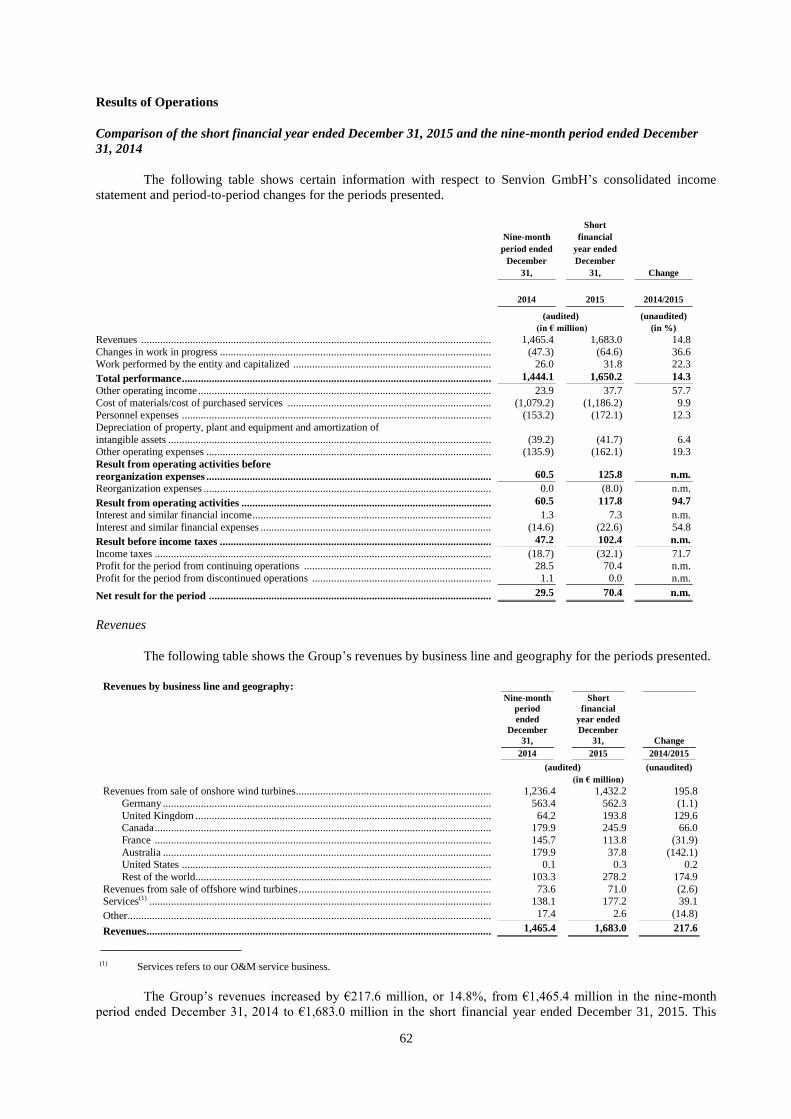
62
Results of Operations
Comparison of the short financial year ended December 31, 2015 and the nine-month period ended December
31, 2014
The following table shows certain information with respect to Senvion GmbH’s consolidated income
statement and period-to-period changes for the periods presented.
Nine-month
period ended
December
31,
Short
financial
year ended
December
31, Change
2014 2015 2014/2015
(audited)
(in € million)
(unaudited)
(in %)
Revenues ................................................................................................................................. 1,465.4 1,683.0 14.8
Changes in work in progress .................................................................................................... (47.3) (64.6) 36.6 Work performed by the entity and capitalized ......................................................................... 26.0 31.8 22.3
Total performance .................................................................................................................. 1,444.1 1,650.2 14.3
Other operating income ............................................................................................................ 23.9 37.7 57.7
Cost of materials/cost of purchased services ........................................................................... (1,079.2) (1,186.2) 9.9 Personnel expenses .................................................................................................................. (153.2) (172.1) 12.3
Depreciation of property, plant and equipment and amortization of
intangible assets ....................................................................................................................... (39.2) (41.7) 6.4 Other operating expenses ......................................................................................................... (135.9) (162.1) 19.3
Result from operating activities before
reorganization expenses ......................................................................................................... 60.5 125.8 n.m.
Reorganization expenses .......................................................................................................... 0.0 (8.0) n.m.
Result from operating activities ............................................................................................ 60.5 117.8 94.7
Interest and similar financial income ........................................................................................ 1.3 7.3 n.m.
Interest and similar financial expenses ..................................................................................... (14.6) (22.6) 54.8
Result before income taxes .................................................................................................... 47.2 102.4 n.m.
Income taxes ............................................................................................................................ (18.7) (32.1) 71.7 Profit for the period from continuing operations ..................................................................... 28.5 70.4 n.m.
Profit for the period from discontinued operations .................................................................. 1.1 0.0 n.m.
Net result for the period ........................................................................................................ 29.5 70.4 n.m.
Revenues
The following table shows the Group’s revenues by business line and geography for the periods presented.
Revenues by business line and geography:
Nine-month
period
ended
December
31,
Short
financial
year ended
December
31, Change
2014 2015 2014/2015
(audited) (unaudited)
(in € million)
Revenues from sale of onshore wind turbines .......................................................................... 1,236.4 1,432.2 195.8
Germany ........................................................................................................................... 563.4 562.3 (1.1)
United Kingdom ............................................................................................................... 64.2 193.8 129.6 Canada .............................................................................................................................. 179.9 245.9 66.0
France .............................................................................................................................. 145.7 113.8 (31.9)
Australia ........................................................................................................................... 179.9 37.8 (142.1) United States .................................................................................................................... 0.1 0.3 0.2
Rest of the world............................................................................................................... 103.3 278.2 174.9
Revenues from sale of offshore wind turbines ......................................................................... 73.6 71.0 (2.6) Services(1) ................................................................................................................................ 138.1 177.2 39.1
Other ........................................................................................................................................ 17.4 2.6 (14.8)
Revenues ................................................................................................................................. 1,465.4 1,683.0 217.6
_____________________
(1) Services refers to our O&M service business.
The Group’s revenues increased by €217.6 million, or 14.8%, from €1,465.4 million in the nine-month
period ended December 31, 2014 to €1,683.0 million in the short financial year ended December 31, 2015. This
63
increase was mainly due to the installation of a large project in Canada, the recovery of business in the United
Kingdom as well as revenues from additional business gained in Portugal (a satellite market) in the amount of €69.9
million, which partially offset the decrease in demand experienced in Australia and France.
The Group’s revenues from the sale of onshore WTGs increased from €1,236.4 million in the nine-month
period ended December 31, 2014 to €1,432.2 million in the short financial year ended December 31, 2015. This
increase in revenues was mainly attributable to the recovery of business in the United Kingdom, Canada and
additional business gained in Portugal and satellite markets.
The Group’s revenues from the sale of offshore WTGs decreased from €73.6 million in the nine-month
period ended December 31, 2014 to €71.0 million in the short financial year ended December 31, 2015, largely due
to the rescheduling of production for the project Nordergründe offshore wind farm to 2016.
The Group’s revenues from O&M services increased from €138.1 million in the nine-month period ended
December 31, 2014 to €177.2 million in the short financial year ended December 31, 2015, mainly due to strong
performance related to new installations of onshore WTGs and, also to offshore WTGs, as the Group’s major
offshore project Thornton Bank came under service.
Other operating income
The Group’s other operating income increased by €13.8 million, or 57.7%, from €23.9 million in the nine-
month period ended December 31, 2014 to €37.7 million in the short financial year ended December 31, 2015. The
increase was mainly due to an increase in currency translation gains which were partially offset by currency
translation losses. For information on the currency translation losses, see “Other operating expenses” below.
Cost of materials/cost of purchased services
The Group’s cost of materials/cost of purchased services rose by €107.0 million, or 9.9%, from €1,079.2
million in the nine-month period ended December 31, 2014 to €1,186.2 million in the short financial year ended
December 31, 2015. The cost of materials ratio (cost of materials/cost of purchased services in relation to total
performance) decreased by 2.8 percentage points from 74.7% in the nine-month period ended December 31, 2014 to
71.9% in the short financial year ended December 31, 2015, displaying the positive results from a changing turbine
mix, improving turbine performance, the internal efficiency enhancement program of the Company and additional
in-sourcing of blades.
Personnel expenses
The Group’s personnel expenses increased by €18.9 million, or 12.3%, from €153.2 million in the nine-
month period ended December 31, 2014 to €172.1 million in the short financial year ended December 31, 2015
mainly due to an increase of the average number of employees, from 3,405 employees in the nine-month period
ended December 31, 2014 to 3,817 employees in the short financial year ended December 31, 2015 reflecting an
increase in employees in services, product development and blade production.
Depreciation of property, plant and equipment and amortization of intangible assets
The Group’s depreciation of property, plant and equipment and amortization of intangible assets increased
by €2.5 million, or 6.4%, from €39.2 million in the nine-month period ended December 31, 2014 to €41.7 million in
the short financial year ended December 31, 2015, primarily due to higher amortization of intangible assets.
Other operating expenses
The Group’s other operating expenses increased by €26.2 million, or 19.3%, from €135.9 million in the
nine-month period ended December 31, 2014 to €162.1 million in the short financial year ended December 31,
2015, primarily due to an increase in purchased services, legal and consulting costs and currency translation losses.
For information on the currency translation gains, see “Other operating income” above.
64
Result from operating activities before reorganization expenses
The Group’s result from operating activities before reorganization expenses (EBIT) increased by €65.3
million, from €60.5 million in the nine-month period ended December 31, 2014 to €125.8 million in the short
financial year ended December 31, 2015. The Group’s result from operating activities before reorganization
expenses as a percentage of revenues (EBIT margin) increased from 4.1% in the nine-month period ended
December 31, 2014 to 7.5% in the short financial year ended December 31, 2015 primarily due to an improved
gross margin and personnel cost ratio.
Reorganization expenses
In the short financial year ended December 31, 2015, restructuring costs in the amount of €8.0 million were
recognized as reorganization expenses incurred in connection with the closing of the Group’s subsidiary
PowerBlades Inc., Ontario, Canada.
Interest and similar financial income and expenses
The Group’s interest and similar financial income increased by €6.0 million from €1.3 million in the nine-
month period ended December 31, 2014 to €7.3 million in the short financial year ended December 31, 2015,
primarily due to a subordinated intercompany loan.
The Group’s interest and similar financial expenses increased from €14.6 million in the nine-months ended
December 31, 2014 to €22.6 million in the short financial year ended December 31, 2015. This increase of €8.0
million can be attributed to higher margins on our L/G Facility and additional one-off costs relating to the write-off
of deferred financing fees for the syndicated loan taken out in March 2014 in connection with the renewal of our
credit facilities (amounting to €7.0 million).
Income taxes
The Group’s income taxes increased by €13.4 million, from an income tax expense of €18.7 million in the
nine-month period ended December 31, 2014 to an income tax expense of €32.1 million in the short financial year
ended December 31, 2015. The increase was mainly the result of an increase in current income taxes of €15.4
million, from a current income tax expense of €8.7 million in the nine-month period ended December 31, 2014 to an
income tax expense of €24.1 million in the short financial year ended December 31, 2015 and an increase in current
income tax expenses for previous years of €8.9 million, from an income tax expense for previous years of €2.5
million in the nine-month period ended December 31, to an income tax expense for previous years of €11.4 million
in the short financial year ended December 31, 2015. These increases in current income taxes were partly offset by
the change in Group’s deferred taxes of €10.9 million from a deferred tax expense of €7.5 million in the nine-month
period ended December 31, 2014 to a deferred tax income of €3.4 million in the short financial year ended
December 31, 2015, due to a decrease of deferred tax expenses on tax loss carryforwards and tax credits from €11.2
million in the nine-month period ended December 31, 2014, to a deferred tax expense on tax loss carryforwards and
tax credits of €2.2 million in the short financial year ended December 31, 2015. The deferred tax income on
temporary differences increased by €1.9 million, from a deferred tax income of €3.7 million in the nine-month
period ended December 31, 2014 to a deferred tax income of €5.6 million in the short financial year ended
December 31, 2015.
Profit for the period from discontinued operations
The Group’s profit for the period from discontinued operations was €1.1 million in the nine-months ended
December 31, 2014 and the Group’s profit for the period from discontinued operations was €0.0 million in the short
financial year ended December 31, 2015, reflecting the result of REpower North China which was deconsolidated in
December 2015.
Net result for the period
As a result of the developments discussed above, the Group’s net result for the period increased by €40.9
million from €29.5 million in the nine-month period ended December 31, 2014 to €70.4 million in the short
financial year ended December 31, 2015.
65
Comparison of the financial years ended March 31, 2015 and March 31, 2014
The following table shows certain information with respect to Senvion GmbH’s consolidated income
statement and period-to-period changes for the periods presented.
Financial year ended March 31, Change
2014 2015 2014/2015
(audited)
(in € million)
(unaudited)
(in %)
Revenues ................................................................................................................................. 1,758.9 1,921.8 9.3
Changes in work in progress .................................................................................................... 12.3 4.4. (64.2)
Work performed by the entity and capitalized ......................................................................... 23.4 38.8 65.8
Total performance .................................................................................................................. 1,794.6 1,965.0 9.5
Other operating income ............................................................................................................ 43.7 33.7 (22.9) Cost of materials/cost of purchased services ........................................................................... (1,366.0) (1,476.9) 8.1
Personnel expenses .................................................................................................................. (196.2) (208.9) 6.5
Depreciation of property, plant and equipment and amortization of intangible assets ....................................................................................................................... (44.8) (53.9) 20.3
Other operating expenses ......................................................................................................... (152.0) (188.9) 24.3
Result from operating activities before
reorganization expenses ......................................................................................................... 79.2 70.1 (11.5)
Reorganization expenses .......................................................................................................... (38.0) 0.0 n.m.
Result from operating activities ............................................................................................ 41.2 70.1 70.1
Interest and similar financial income ........................................................................................ 1.1 2.0 81.8 Interest and similar financial expenses ..................................................................................... (16.2) (20.0) 23.5
Result before income taxes .................................................................................................... 26.1 52.1 99.6
Income tax expense/income ..................................................................................................... (13.8) (21.2) 53.6
Profit/loss for the period from continuing operations .............................................................. 12.4 30.9 n.m.
Profit/loss for the period from discontinued operations ........................................................... (7.5) 1.2 n.m.
Net result for the period ........................................................................................................ 4.8 32.1 n.m.
Revenues
The following table shows the Group’s revenues by business line and geography for the periods presented.
Revenues by business line and geography:
Financial year ended March 31, Change
2014 2015 2014/2015
(audited) (unaudited)
(in € million)
Revenues from sale of onshore wind turbines .......................................................................... 1,483.0 1,605.5 122.5
Germany ............................................................................................................................ 565.9 763.3 197.4 United Kingdom ................................................................................................................ 185.6 109.8 (75.8)
Canada............................................................................................................................... 230.8 187.5 (43.3)
France ............................................................................................................................... 148.9 176.1 27.2 Australia ............................................................................................................................ 84.3 203.1 118.8
United States .................................................................................................................... 0.1 0.1 0.0
Rest of the world ............................................................................................................... 267.3 165.6 (101.7) Revenues from sale of offshore wind turbines .......................................................................... 82.5 101.3 18.8
Services .................................................................................................................................... 174.0 194.0 20.0
Other ........................................................................................................................................ 19.3 21.0 1.7
Revenues ................................................................................................................................. 1,758.9 1,921.8 162.9
The Group’s revenues increased by €162.9 million, or 9.3%, from €1,758.9 million in the financial year
2013/2014 to €1,921.8 million in the financial year 2014/2015. This increase was mainly due to a rise in the
revenues from the sale of WTGs from €1,565.6 million in the financial year 2013/2014 to €1,706.8 million in the
financial year 2014/2015.
The Group’s revenues from sale of onshore WTGs increased from €1,483.0 million in the financial year
2013/2014 to €1,605.5 million in the financial year 2014/2015. This increase in revenues was mainly attributable to
Germany, where, after the political uncertainty around the amendment of EEG (effective after 2014), the market
showed significant strength in 2014 with a rise in new installed capacity from 3.4 GW in 2013 to 5.3 GW in 2014
(Source: GWEC, 2015).
66
The Group’s revenues from sale of offshore WTGs increased, from €82.5 million in the financial year
2013/2014 to €101.3 million in the financial year 2014/2015, largely due to the installation of the Nordsee-Ost wind
park.
The Group’s revenues from O&M services increased from €174.0 million in the financial year 2013/2014
to €194.0 million in the financial year 2014/2015, mainly due to increasing MW covered under O&M service
contracts (from 8.1 GW on March 31, 2014 to 9.3 GW on March 31, 2015). This increase in MWs covered under
O&M service contracts was driven by a relatively high number of installations during that period in our core market
of Germany.
Other operating income
The Group’s other operating income decreased by €10.0 million, or 22.9%, from €43.7 million in the
financial year 2013/2014 to €33.7 million in the financial year 2014/2015. The decrease was mainly due to a
decrease in income from reversals of provisions (from €5.7 million in the financial year 2013/2014 to €1.3 million
in financial year 2014/2015) that had been set aside for blade damage in the United States and a litigation matter and
a decrease in income from hedging transactions (from €9.3 million in the financial year 2013/2014 to €5.9 million in
the financial year 2014/2015).
Cost of materials/cost of purchased services
The Group’s cost of materials/cost of purchased services rose by €110.9 million, or 8.1%, from
€1,366.0 million in the financial year 2013/2014 to €1,476.9 million in financial year 2014/2015. The cost of
materials ratio (cost of materials/cost of purchased services in relation to total performance) decreased by 0.9
percentage points from 76.1% in the financial year 2013/2014 to 75.2% in the financial year 2014/2015, displaying
the positive results from procurement activities under POWER and FOCUS 2015.
Personnel expenses
The Group’s personnel expenses increased by €12.7 million, or 6.5%, from €196.2 million in the financial
year 2013/2014 to €208.9 million in the financial year 2014/2015 mainly due to an increase of the average number
of employees, from 3,261 employees in the financial year 2013/2014 to 3,460 employees in the financial year
2014/2015 reflecting the Group’s growth and the rising portion of in-house produced blades, which requires a
higher number of employees.
Depreciation of property, plant and equipment and amortization of intangible assets
The Group’s depreciation of property, plant and equipment and amortization of intangible assets increased
by €9.1 million, or 20.3%, from €44.8 million in the financial year 2013/2014 to €53.9 million in the financial year
2014/2015, primarily due to finalizing development projects related to the 6.2M126 and 3.XM series that started to
amortize, as well as the Group’s development of a MM cold climate version for the North American market that
was also finished during this period.
Other operating expenses
The Group’s other operating expenses increased by €36.9 million, or 24.3%, from €152.0 million in the
financial year 2013/2014 to €188.9 million in the financial year 2014/2015 mainly due to an increase of legal and
consulting costs by €26.4 million, from €13.9 million in the financial year 2013/2014 to €40.3 million in the
financial year 2014/2015, which was driven by an increased use of consultants for compliance functions as well as
in R&D as part of the value engineering component (aimed at reducing the cost of WTGs through design
improvements) of FOCUS 2015.
Result from operating activities before reorganization expenses
The Group’s result from operating activities before reorganization expenses (EBIT) decreased from €79.2
million in the financial year 2013/2014 to €70.1 million in the financial year 2014/2015. The Group’s result from
operating activities before reorganization expenses as a percentage of revenues (EBIT margin) decreased from 4.5%
in the financial year 2013/2014 to 3.6% in the financial year 2014/2015.
67
Reorganization expenses
In the financial year 2013/2014, due to the implementation of the POWER efficiency enhancement
program initiated by the management of the Group in April 2013, costs in the amount of €38.0 million were
recognized as reorganization expenses. These expenses related to legal and consulting costs for the implementation
of POWER in the amount of €21.5 million and to personnel expenses in the amount of €16.5 million, which resulted
from the early redundancies of staff and cancellation of employment contracts. The POWER program was
completed on March 31, 2014.
Interest and similar financial income and expenses
The Group’s interest and similar financial income increased by €0.9 million from €1.1 million in the
financial year 2013/2014 to €2.0 million in the financial year 2014/2015, reflecting a higher average amount of cash
available and an improved portfolio strategy.
The Group’s interest and similar financial expenses increased from €16.2 million in the financial year
2013/2014 to €20.0 million in the financial year 2014/2015 and related primarily to higher impacts from the
unwinding of discounting of provisions and interest payments with regard to taxes.
Income tax expense/income
The Group’s income tax expense increased by €7.4 million, from an income tax expense of €13.8 million
in the financial year 2013/2014 to an income tax expense of €21.2 million in the financial year 2014/2015. The
increase in the financial year 2014/2015 was mainly the result of an increase in current income taxes of €21.2
million and a decrease in deferred taxes of €14.7 million from a deferred tax expense of €7.9 million in the financial
year 2013/2014 to a deferred tax income of €6.8 million in the financial year 2014/2015 due to an increase of
deferred taxes on tax loss carryforwards from a deferred tax income of €5.0 million in the financial year 2013/2014
to a deferred tax expense of €12.4 million in the financial year 2014/2015 and a decrease in deferred taxes on
temporary differences from a deferred tax expense of €12.9 million in the financial year 2013/2014 to a deferred tax
income of €19.2 million in the financial year 2014/2015.
Profit/loss for the period from discontinued operations
The Group’s loss for the period from discontinued operations was €7.5 million in the financial year
2013/2014 and the Group’s profit for the period from discontinued operations was €1.2 million in the financial year
2014/2015, reflecting the result of REpower North China. After the entry of a new investor in December 2015, the
Group retained a 10.89% interest in REpower North China, but does not have control over REpower North China.
Net result for the period
As a result of the developments discussed above, the Group’s net result for the period increased by €27.3
million from €4.8 million in the financial year 2013/2014 to €32.1 million in the financial year 2014/2015.
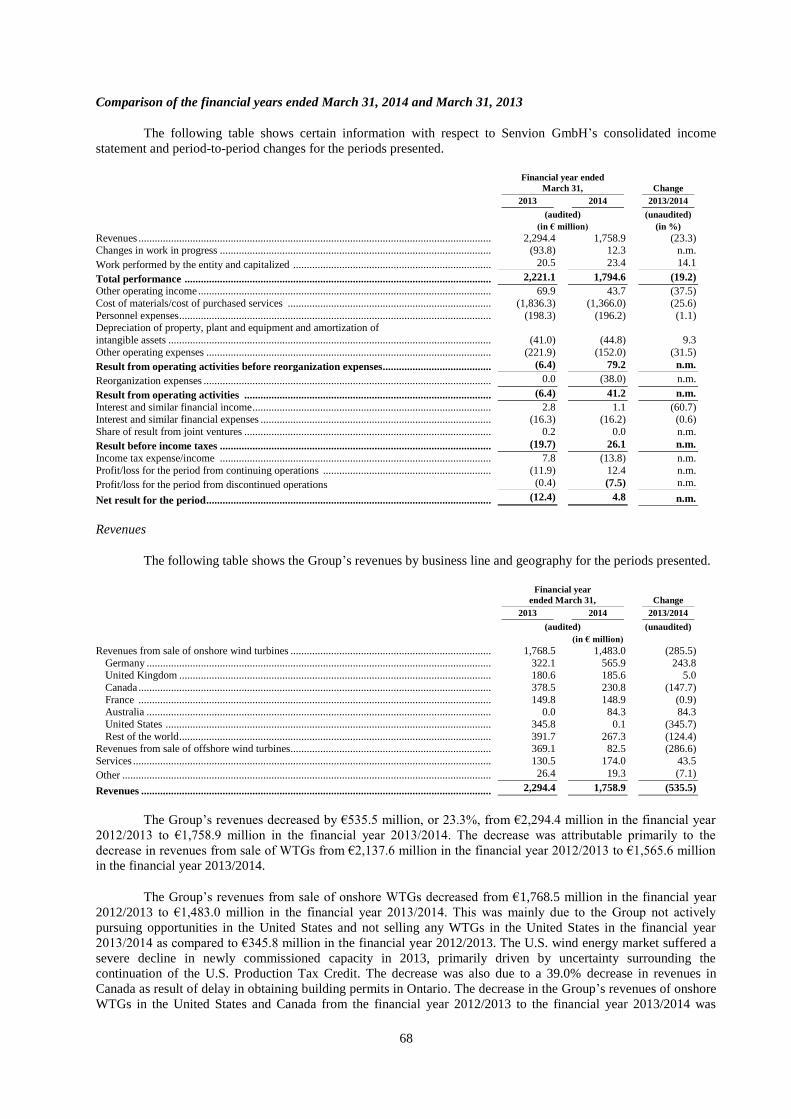
68
Comparison of the financial years ended March 31, 2014 and March 31, 2013
The following table shows certain information with respect to Senvion GmbH’s consolidated income
statement and period-to-period changes for the periods presented.
Financial year ended
March 31, Change
2013 2014 2013/2014
(audited)
(in € million)
(unaudited)
(in %)
Revenues .................................................................................................................................. 2,294.4 1,758.9 (23.3) Changes in work in progress .................................................................................................... (93.8) 12.3 n.m.
Work performed by the entity and capitalized ......................................................................... 20.5 23.4 14.1
Total performance ................................................................................................................. 2,221.1 1,794.6 (19.2)
Other operating income ............................................................................................................ 69.9 43.7 (37.5)
Cost of materials/cost of purchased services ........................................................................... (1,836.3) (1,366.0) (25.6)
Personnel expenses ................................................................................................................... (198.3) (196.2) (1.1) Depreciation of property, plant and equipment and amortization of
intangible assets ....................................................................................................................... (41.0) (44.8) 9.3
Other operating expenses ......................................................................................................... (221.9) (152.0) (31.5)
Result from operating activities before reorganization expenses ........................................ (6.4) 79.2 n.m.
Reorganization expenses .......................................................................................................... 0.0 (38.0) n.m.
Result from operating activities ........................................................................................... (6.4) 41.2 n.m.
Interest and similar financial income ........................................................................................ 2.8 1.1 (60.7) Interest and similar financial expenses ..................................................................................... (16.3) (16.2) (0.6)
Share of result from joint ventures ........................................................................................... 0.2 0.0 n.m.
Result before income taxes .................................................................................................... (19.7) 26.1 n.m.
Income tax expense/income .................................................................................................... 7.8 (13.8) n.m.
Profit/loss for the period from continuing operations .............................................................. (11.9) 12.4 n.m.
Profit/loss for the period from discontinued operations (0.4) (7.5) n.m.
Net result for the period ......................................................................................................... (12.4) 4.8 n.m.
Revenues
The following table shows the Group’s revenues by business line and geography for the periods presented.
Financial year
ended March 31, Change
2013 2014 2013/2014
(audited) (unaudited)
(in € million)
Revenues from sale of onshore wind turbines .......................................................................... 1,768.5 1,483.0 (285.5)
Germany ............................................................................................................................... 322.1 565.9 243.8 United Kingdom ................................................................................................................... 180.6 185.6 5.0
Canada .................................................................................................................................. 378.5 230.8 (147.7)
France .................................................................................................................................. 149.8 148.9 (0.9) Australia ............................................................................................................................... 0.0 84.3 84.3
United States ........................................................................................................................ 345.8 0.1 (345.7)
Rest of the world ................................................................................................................... 391.7 267.3 (124.4) Revenues from sale of offshore wind turbines .......................................................................... 369.1 82.5 (286.6)
Services .................................................................................................................................... 130.5 174.0 43.5
Other ........................................................................................................................................ 26.4 19.3 (7.1)
Revenues ................................................................................................................................. 2,294.4 1,758.9 (535.5)
The Group’s revenues decreased by €535.5 million, or 23.3%, from €2,294.4 million in the financial year
2012/2013 to €1,758.9 million in the financial year 2013/2014. The decrease was attributable primarily to the
decrease in revenues from sale of WTGs from €2,137.6 million in the financial year 2012/2013 to €1,565.6 million
in the financial year 2013/2014.
The Group’s revenues from sale of onshore WTGs decreased from €1,768.5 million in the financial year
2012/2013 to €1,483.0 million in the financial year 2013/2014. This was mainly due to the Group not actively
pursuing opportunities in the United States and not selling any WTGs in the United States in the financial year
2013/2014 as compared to €345.8 million in the financial year 2012/2013. The U.S. wind energy market suffered a
severe decline in newly commissioned capacity in 2013, primarily driven by uncertainty surrounding the
continuation of the U.S. Production Tax Credit. The decrease was also due to a 39.0% decrease in revenues in
Canada as result of delay in obtaining building permits in Ontario. The decrease in the Group’s revenues of onshore
WTGs in the United States and Canada from the financial year 2012/2013 to the financial year 2013/2014 was
69
partially offset by higher revenues in Europe (excluding the UK), especially in Germany, which increased from
€322.1 million in the financial year 2012/2013 to €565.9 million in the financial year 2013/2014 mainly due to the
Group’s strong market position and the expansion of the 3.XM series.
The Group’s revenues from sale of offshore WTGs decreased by €286.6 million from €369.1 million in the
financial year 2012/2013 to €82.5 million in the financial year 2013/2014. This was mainly the result of the
completion of the Group’s major offshore project in Thornton Bank in the financial year 2012/2013 and fewer
remaining projects as of March 31, 2013 to complete.
The decrease in the Group’s revenues from the onshore and offshore business lines from the financial year
2012/2013 to the financial year 2013/2014 was partially offset by an increase of €36.4 million in the sum of
revenues from O&M services and other revenues. This was primarily due to an increase in the number of the
Group’s WTGs sold with an O&M service contract, resulting in an increase of €43.5 million in revenues from O&M
Services from €130.5 million in the financial year 2012/2013 to €174.0 million in the financial year 2013/2014.
Other operating income
The Group’s other operating income decreased by €26.2 million, or 37.5%, from €69.9 million in the
financial year 2012/2013 to €43.7 million in the financial year 2013/2014. The decrease was the result primarily of a
decrease in currency translation gains from €22.0 million in the financial year 2012/2013 to €14.0 million in the
financial year 2013/2014 due to lower business activities in the financial year 2013/2014 in countries that do not use
the Euro, such as the United States. In addition, the decrease in other operating income from the financial year
2012/2013 to the financial year 2013/2014 was due to a decrease of €8.0 million in income from reversal of
provisions for technical issues that were solved during the period and due to a decrease of €6.4 million in income
from reversal of bad debt allowances.
Cost of materials/cost of purchased services
The Group’s cost of materials/cost of purchased services decreased by €470.3 million, or 25.6%, from
€1,836.3 million in the financial year 2012/2013 to €1,366.0 million in the financial year 2013/2014. This decrease
was mainly the result of a corresponding decrease in revenues, as well as various material cost reduction initiatives
that were part of the POWER program. Cost of materials/cost of purchased services as a ratio (cost of materials/cost
of purchased services in relation to total performance) decreased by 6.6 percentage points from 82.7% in the
financial year 2012/2013 to 76.1% in the financial year 2013/2014.
Personnel expenses
The Group’s personnel expenses decreased by €2.1 million, or 1.1%, from €198.3 million in the financial
year 2012/2013 to €196.2 million in the financial year 2013/2014. The decrease was primarily driven by a
workforce reduction that was part of the POWER program, which resulted in wages and salaries decreasing from
€167.0 million in the financial year 2012/2013 to €164.0 million in the financial year 2013/2014.
Depreciation of property, plant and equipment and amortization of intangible assets
The Group’s depreciation of property, plant and equipment and amortization of intangible assets increased
by €3.8 million, or 9.3%, from €41.0 million in the financial year 2012/2013 to €44.8 million in the financial year
2013/2014. This was primarily due to increased in-house production of rotor blades and blade molds that require
higher investments in property, plant and equipment.
Other operating expenses
The Group’s other operating expenses decreased by €69.9 million, or 31.5%, from €221.9 million in the
financial year 2012/2013 to €152.0 million in the financial year 2013/2014. The decrease was primarily due to a
change in warranty expenses from an expense of €14.6 million in the financial year 2012/2013 to income of €6.7
million in the financial year 2013/2014. This was mainly because of lower warranty rates based on lower historical
costs, resulting in the usage of the prior year’s provisions exceeding the addition of new provisions. In addition,
currency translation losses decreased from €30.3 million in the financial year 2012/2013 to €17.1 million in the
financial year 2013/2014 mainly due to lower business activities in the financial year 2013/2014 in countries that do
not use the Euro, such as the United States. The Group’s other operating expenses also decreased by €69.9 million
from the financial year 2012/2013 to the financial year 2013/2014 because of one-time effects due to late deliveries
70
to customers in the United States in 2012/2013. Legal and consulting costs decreased by €13.0 million from the
financial year 2012/2013 to the financial year 2013/2014 primarily due to legal costs in the financial year 2013/2014
for which provisions had been created in the financial year 2012/2013 and the reduction of consulting costs as the
result of the POWER program.
Result from operating activities before reorganization expenses
The Group’s result from operating activities before reorganization expenses (EBIT) increased by €85.6
million, from negative €6.4 million in the financial year 2012/2013 to €79.2 million in the financial year 2013/2014.
The Group’s result from operating activities before reorganization expenses as a percentage of revenues (EBIT
margin) increased from negative 0.3% in the financial year 2012/2013 to 4.5% in the financial year 2013/2014.
Despite revenues decreasing from the financial year 2012/2013 to the financial year 2013/2014, the
Group’s EBIT and EBIT margin increased mainly because of the reasons stated above, such as the implementation
of the POWER program in the financial year 2013/2014, as well as due to the absence of WTG sales in the United
States in the financial year 2013/2014, which had the effect of lowering the Group’s EBIT margin in the financial
year 2012/2013.
Reorganization expenses
The Group incurred reorganization expenses of €38.0 million in the financial year 2013/2014 (compared to
nil in the financial year 2012/2013) related to the POWER program. These expenses related to legal and consulting
costs of €21.5 million and to personnel expenses of €16.5 million, which resulted from the early redundancies of
staff and cancellation of employment contracts.
Interest and similar financial income and expenses
The Group’s interest and similar financial income decreased by €1.7 million from €2.8 million in the
financial year 2012/2013 to €1.1 million in the financial year 2013/2014, reflecting the general lower interest rate
environment.
The Group’s interest and similar financial expenses were €16.3 million in the financial year 2012/2013 and
€16.2 million in the financial year 2013/2014 and related primarily to guarantee commissions and interest on bank
loans.
Income tax expense/income
The Group’s income tax expense in the financial year 2013/2014 amounted to €13.8 million compared to
an income tax income of €7.8 million in the financial year 2012/2013. This was mainly the result of an increase in
current income taxes of €4.0 million and an increase in deferred taxes of €15.7 million from a deferred tax income
of €7.8 million in the financial year 2012/2013 to a deferred tax expense of €7.9 million in financial year 2013/2014
due to an increase of deferred taxes on temporary differences of €10.3 million from deferred tax expenses of €2.6
million in the financial year 2012/2013 to deferred tax expenses of €12.9 million in the financial year 2013/2014
and an increase in deferred taxes on tax loss carryforwards of €5.4 million from a deferred tax income of €10.4
million in the financial year 2012/2013 to a deferred tax income of €5.0 million in the financial year 2013/2014. The
Group’s total tax rate, which represents income tax expense as a percentage of result before income taxes, was
39.6% in the financial year 2012/2013 and 52.9% in the financial year 2013/2014.
Profit/loss for the period from discontinued operations
The Group’s loss for the period from discontinued operations was €0.4 million in the financial year
2012/2013 and €7.5 million in the financial year 2013/2014. The higher loss was primarily due to an increase in
expenses from discontinued operations from €8.1 million in the financial year 2012/2013 to €12.7 million in the
financial year 2013/2014 mainly as the result of an impairment of Senvion’s disposal group classified as held for
sale as part of the REpower North China liquidation measures planned at that time.
Net result for the period
As a result of the developments discussed above, the Group’s net result for the period increased by €17.2
million from negative €12.4 million in the financial year 2012/2013 to €4.8 million in the financial year 2013/2014.
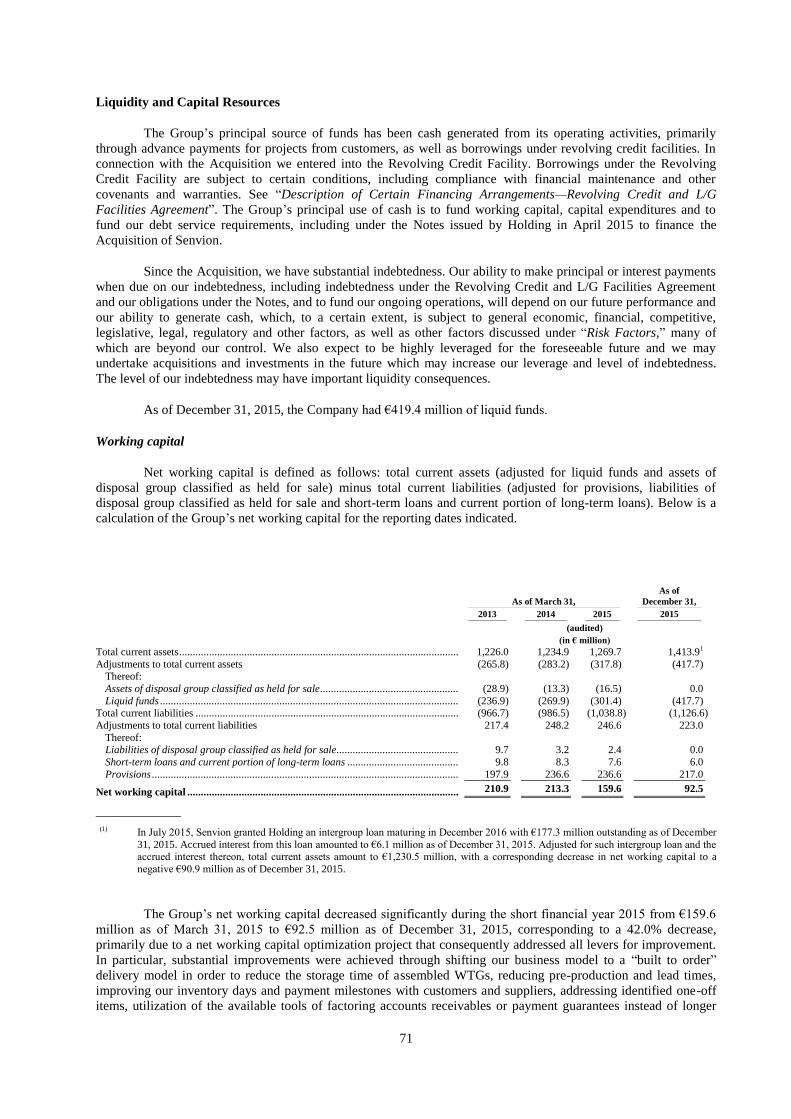
71
Liquidity and Capital Resources
The Group’s principal source of funds has been cash generated from its operating activities, primarily
through advance payments for projects from customers, as well as borrowings under revolving credit facilities. In
connection with the Acquisition we entered into the Revolving Credit Facility. Borrowings under the Revolving
Credit Facility are subject to certain conditions, including compliance with financial maintenance and other
covenants and warranties. See “Description of Certain Financing Arrangements—Revolving Credit and L/G
Facilities Agreement”. The Group’s principal use of cash is to fund working capital, capital expenditures and to
fund our debt service requirements, including under the Notes issued by Holding in April 2015 to finance the
Acquisition of Senvion.
Since the Acquisition, we have substantial indebtedness. Our ability to make principal or interest payments
when due on our indebtedness, including indebtedness under the Revolving Credit and L/G Facilities Agreement
and our obligations under the Notes, and to fund our ongoing operations, will depend on our future performance and
our ability to generate cash, which, to a certain extent, is subject to general economic, financial, competitive,
legislative, legal, regulatory and other factors, as well as other factors discussed under “Risk Factors,” many of
which are beyond our control. We also expect to be highly leveraged for the foreseeable future and we may
undertake acquisitions and investments in the future which may increase our leverage and level of indebtedness.
The level of our indebtedness may have important liquidity consequences.
As of December 31, 2015, the Company had €419.4 million of liquid funds.
Working capital
Net working capital is defined as follows: total current assets (adjusted for liquid funds and assets of
disposal group classified as held for sale) minus total current liabilities (adjusted for provisions, liabilities of
disposal group classified as held for sale and short-term loans and current portion of long-term loans). Below is a
calculation of the Group’s net working capital for the reporting dates indicated.
As of March 31,
As of
December 31,
2013 2014 2015 2015
(audited)
(in € million)
Total current assets ........................................................................................................ 1,226.0 1,234.9 1,269.7 1,413.91
Adjustments to total current assets (265.8) (283.2) (317.8) (417.7) Thereof:
Assets of disposal group classified as held for sale .................................................... (28.9) (13.3) (16.5) 0.0
Liquid funds ............................................................................................................... (236.9) (269.9) (301.4) (417.7) Total current liabilities .................................................................................................. (966.7) (986.5) (1,038.8) (1,126.6)
Adjustments to total current liabilities 217.4 248.2 246.6 223.0
Thereof: Liabilities of disposal group classified as held for sale .............................................. 9.7 3.2 2.4 0.0
Short-term loans and current portion of long-term loans .......................................... 9.8 8.3 7.6 6.0
Provisions .................................................................................................................. 197.9 236.6 236.6 217.0
Net working capital ..................................................................................................... 210.9 213.3 159.6 92.5
________________
(1) In July 2015, Senvion granted Holding an intergroup loan maturing in December 2016 with €177.3 million outstanding as of December
31, 2015. Accrued interest from this loan amounted to €6.1 million as of December 31, 2015. Adjusted for such intergroup loan and the accrued interest thereon, total current assets amount to €1,230.5 million, with a corresponding decrease in net working capital to a
negative €90.9 million as of December 31, 2015.
The Group’s net working capital decreased significantly during the short financial year 2015 from €159.6
million as of March 31, 2015 to €92.5 million as of December 31, 2015, corresponding to a 42.0% decrease,
primarily due to a net working capital optimization project that consequently addressed all levers for improvement.
In particular, substantial improvements were achieved through shifting our business model to a “built to order”
delivery model in order to reduce the storage time of assembled WTGs, reducing pre-production and lead times,
improving our inventory days and payment milestones with customers and suppliers, addressing identified one-off
items, utilization of the available tools of factoring accounts receivables or payment guarantees instead of longer
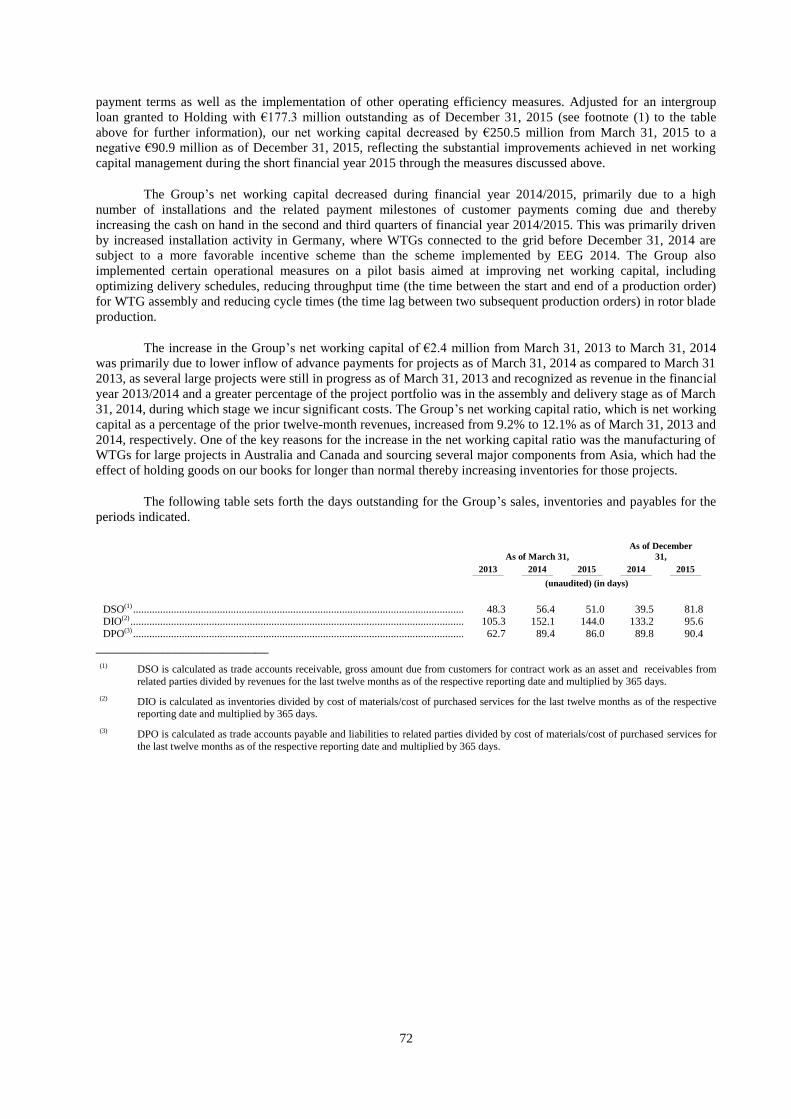
72
payment terms as well as the implementation of other operating efficiency measures. Adjusted for an intergroup
loan granted to Holding with €177.3 million outstanding as of December 31, 2015 (see footnote (1) to the table
above for further information), our net working capital decreased by €250.5 million from March 31, 2015 to a
negative €90.9 million as of December 31, 2015, reflecting the substantial improvements achieved in net working
capital management during the short financial year 2015 through the measures discussed above.
The Group’s net working capital decreased during financial year 2014/2015, primarily due to a high
number of installations and the related payment milestones of customer payments coming due and thereby
increasing the cash on hand in the second and third quarters of financial year 2014/2015. This was primarily driven
by increased installation activity in Germany, where WTGs connected to the grid before December 31, 2014 are
subject to a more favorable incentive scheme than the scheme implemented by EEG 2014. The Group also
implemented certain operational measures on a pilot basis aimed at improving net working capital, including
optimizing delivery schedules, reducing throughput time (the time between the start and end of a production order)
for WTG assembly and reducing cycle times (the time lag between two subsequent production orders) in rotor blade
production.
The increase in the Group’s net working capital of €2.4 million from March 31, 2013 to March 31, 2014
was primarily due to lower inflow of advance payments for projects as of March 31, 2014 as compared to March 31
2013, as several large projects were still in progress as of March 31, 2013 and recognized as revenue in the financial
year 2013/2014 and a greater percentage of the project portfolio was in the assembly and delivery stage as of March
31, 2014, during which stage we incur significant costs. The Group’s net working capital ratio, which is net working
capital as a percentage of the prior twelve-month revenues, increased from 9.2% to 12.1% as of March 31, 2013 and
2014, respectively. One of the key reasons for the increase in the net working capital ratio was the manufacturing of
WTGs for large projects in Australia and Canada and sourcing several major components from Asia, which had the
effect of holding goods on our books for longer than normal thereby increasing inventories for those projects.
The following table sets forth the days outstanding for the Group’s sales, inventories and payables for the
periods indicated.
As of March 31,
As of December
31,
2013 2014 2015 2014 2015
(unaudited) (in days)
DSO(1) ............................................................................................................................ 48.3 56.4 51.0 39.5 81.8 DIO(2) ............................................................................................................................. 105.3 152.1 144.0 133.2 95.6
DPO(3) ............................................................................................................................ 62.7 89.4 86.0 89.8 90.4
__________________________
(1) DSO is calculated as trade accounts receivable, gross amount due from customers for contract work as an asset and receivables from
related parties divided by revenues for the last twelve months as of the respective reporting date and multiplied by 365 days.
(2) DIO is calculated as inventories divided by cost of materials/cost of purchased services for the last twelve months as of the respective reporting date and multiplied by 365 days.
(3) DPO is calculated as trade accounts payable and liabilities to related parties divided by cost of materials/cost of purchased services for
the last twelve months as of the respective reporting date and multiplied by 365 days.
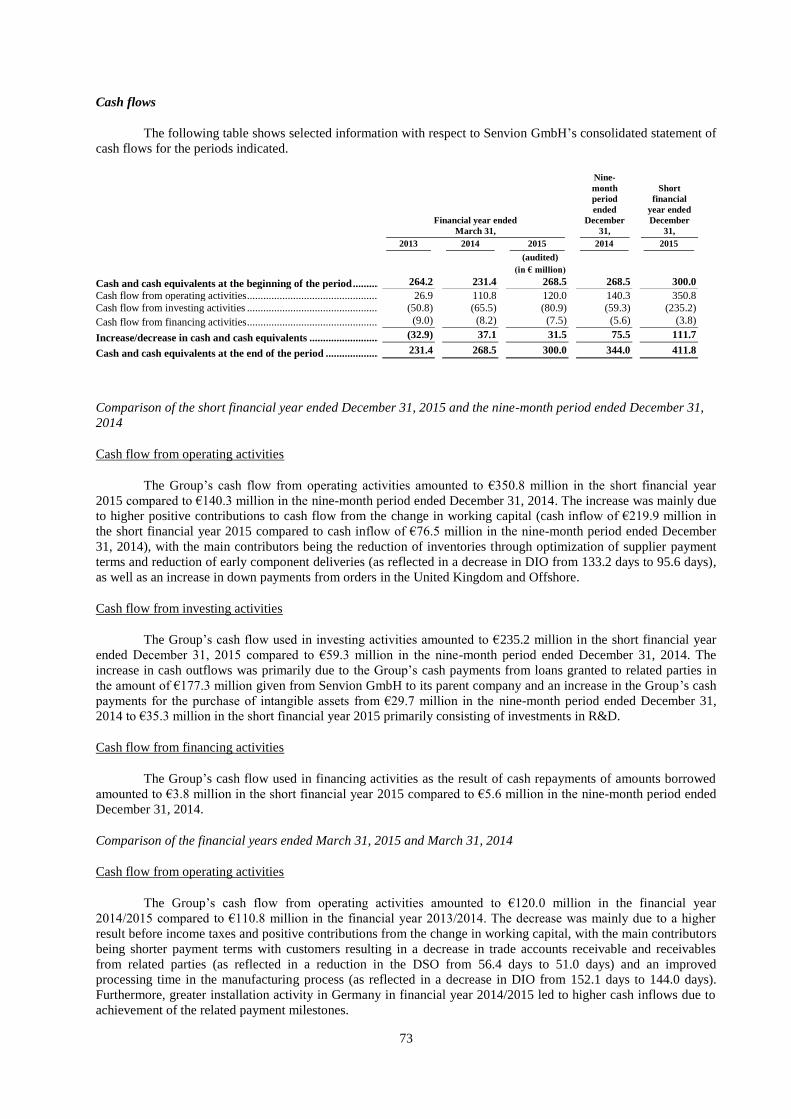
73
Cash flows
The following table shows selected information with respect to Senvion GmbH’s consolidated statement of
cash flows for the periods indicated.
Financial year ended
March 31,
Nine-
month
period
ended
December
31,
Short
financial
year ended
December
31,
2013 2014 2015 2014 2015
(audited)
(in € million)
Cash and cash equivalents at the beginning of the period ................. 264.2 231.4 268.5 268.5 300.0
Cash flow from operating activities ........................................................ 26.9 110.8 120.0 140.3 350.8
Cash flow from investing activities ........................................................ (50.8) (65.5) (80.9) (59.3) (235.2)
Cash flow from financing activities ........................................................ (9.0) (8.2) (7.5) (5.6) (3.8)
Increase/decrease in cash and cash equivalents ................................. (32.9) 37.1 31.5 75.5 111.7
Cash and cash equivalents at the end of the period ........................... 231.4 268.5 300.0 344.0 411.8
Comparison of the short financial year ended December 31, 2015 and the nine-month period ended December 31,
2014
Cash flow from operating activities
The Group’s cash flow from operating activities amounted to €350.8 million in the short financial year
2015 compared to €140.3 million in the nine-month period ended December 31, 2014. The increase was mainly due
to higher positive contributions to cash flow from the change in working capital (cash inflow of €219.9 million in
the short financial year 2015 compared to cash inflow of €76.5 million in the nine-month period ended December
31, 2014), with the main contributors being the reduction of inventories through optimization of supplier payment
terms and reduction of early component deliveries (as reflected in a decrease in DIO from 133.2 days to 95.6 days),
as well as an increase in down payments from orders in the United Kingdom and Offshore.
Cash flow from investing activities
The Group’s cash flow used in investing activities amounted to €235.2 million in the short financial year
ended December 31, 2015 compared to €59.3 million in the nine-month period ended December 31, 2014. The
increase in cash outflows was primarily due to the Group’s cash payments from loans granted to related parties in
the amount of €177.3 million given from Senvion GmbH to its parent company and an increase in the Group’s cash
payments for the purchase of intangible assets from €29.7 million in the nine-month period ended December 31,
2014 to €35.3 million in the short financial year 2015 primarily consisting of investments in R&D.
Cash flow from financing activities
The Group’s cash flow used in financing activities as the result of cash repayments of amounts borrowed
amounted to €3.8 million in the short financial year 2015 compared to €5.6 million in the nine-month period ended
December 31, 2014.
Comparison of the financial years ended March 31, 2015 and March 31, 2014
Cash flow from operating activities
The Group’s cash flow from operating activities amounted to €120.0 million in the financial year
2014/2015 compared to €110.8 million in the financial year 2013/2014. The decrease was mainly due to a higher
result before income taxes and positive contributions from the change in working capital, with the main contributors
being shorter payment terms with customers resulting in a decrease in trade accounts receivable and receivables
from related parties (as reflected in a reduction in the DSO from 56.4 days to 51.0 days) and an improved
processing time in the manufacturing process (as reflected in a decrease in DIO from 152.1 days to 144.0 days).
Furthermore, greater installation activity in Germany in financial year 2014/2015 led to higher cash inflows due to
achievement of the related payment milestones.
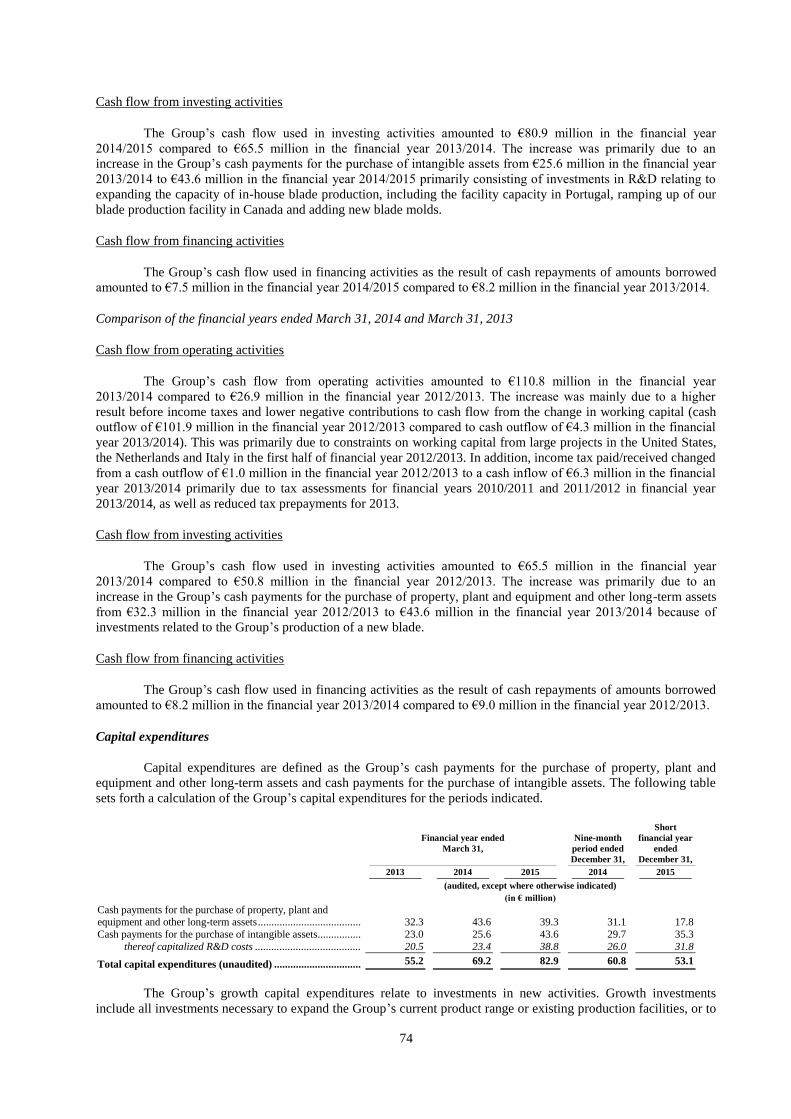
74
Cash flow from investing activities
The Group’s cash flow used in investing activities amounted to €80.9 million in the financial year
2014/2015 compared to €65.5 million in the financial year 2013/2014. The increase was primarily due to an
increase in the Group’s cash payments for the purchase of intangible assets from €25.6 million in the financial year
2013/2014 to €43.6 million in the financial year 2014/2015 primarily consisting of investments in R&D relating to
expanding the capacity of in-house blade production, including the facility capacity in Portugal, ramping up of our
blade production facility in Canada and adding new blade molds.
Cash flow from financing activities
The Group’s cash flow used in financing activities as the result of cash repayments of amounts borrowed
amounted to €7.5 million in the financial year 2014/2015 compared to €8.2 million in the financial year 2013/2014.
Comparison of the financial years ended March 31, 2014 and March 31, 2013
Cash flow from operating activities
The Group’s cash flow from operating activities amounted to €110.8 million in the financial year
2013/2014 compared to €26.9 million in the financial year 2012/2013. The increase was mainly due to a higher
result before income taxes and lower negative contributions to cash flow from the change in working capital (cash
outflow of €101.9 million in the financial year 2012/2013 compared to cash outflow of €4.3 million in the financial
year 2013/2014). This was primarily due to constraints on working capital from large projects in the United States,
the Netherlands and Italy in the first half of financial year 2012/2013. In addition, income tax paid/received changed
from a cash outflow of €1.0 million in the financial year 2012/2013 to a cash inflow of €6.3 million in the financial
year 2013/2014 primarily due to tax assessments for financial years 2010/2011 and 2011/2012 in financial year
2013/2014, as well as reduced tax prepayments for 2013.
Cash flow from investing activities
The Group’s cash flow used in investing activities amounted to €65.5 million in the financial year
2013/2014 compared to €50.8 million in the financial year 2012/2013. The increase was primarily due to an
increase in the Group’s cash payments for the purchase of property, plant and equipment and other long-term assets
from €32.3 million in the financial year 2012/2013 to €43.6 million in the financial year 2013/2014 because of
investments related to the Group’s production of a new blade.
Cash flow from financing activities
The Group’s cash flow used in financing activities as the result of cash repayments of amounts borrowed
amounted to €8.2 million in the financial year 2013/2014 compared to €9.0 million in the financial year 2012/2013.
Capital expenditures
Capital expenditures are defined as the Group’s cash payments for the purchase of property, plant and
equipment and other long-term assets and cash payments for the purchase of intangible assets. The following table
sets forth a calculation of the Group’s capital expenditures for the periods indicated.
Financial year ended
March 31,
Nine-month
period ended
December 31,
Short
financial year
ended
December 31,
2013 2014 2015 2014 2015
(audited, except where otherwise indicated)
(in € million)
Cash payments for the purchase of property, plant and equipment and other long-term assets .................................................... 32.3 43.6 39.3 31.1 17.8
Cash payments for the purchase of intangible assets.............................. 23.0 25.6 43.6 29.7 35.3
thereof capitalized R&D costs ..................................................... 20.5 23.4 38.8 26.0 31.8
Total capital expenditures (unaudited) .............................................. 55.2 69.2 82.9 60.8 53.1
The Group’s growth capital expenditures relate to investments in new activities. Growth investments
include all investments necessary to expand the Group’s current product range or existing production facilities, or to
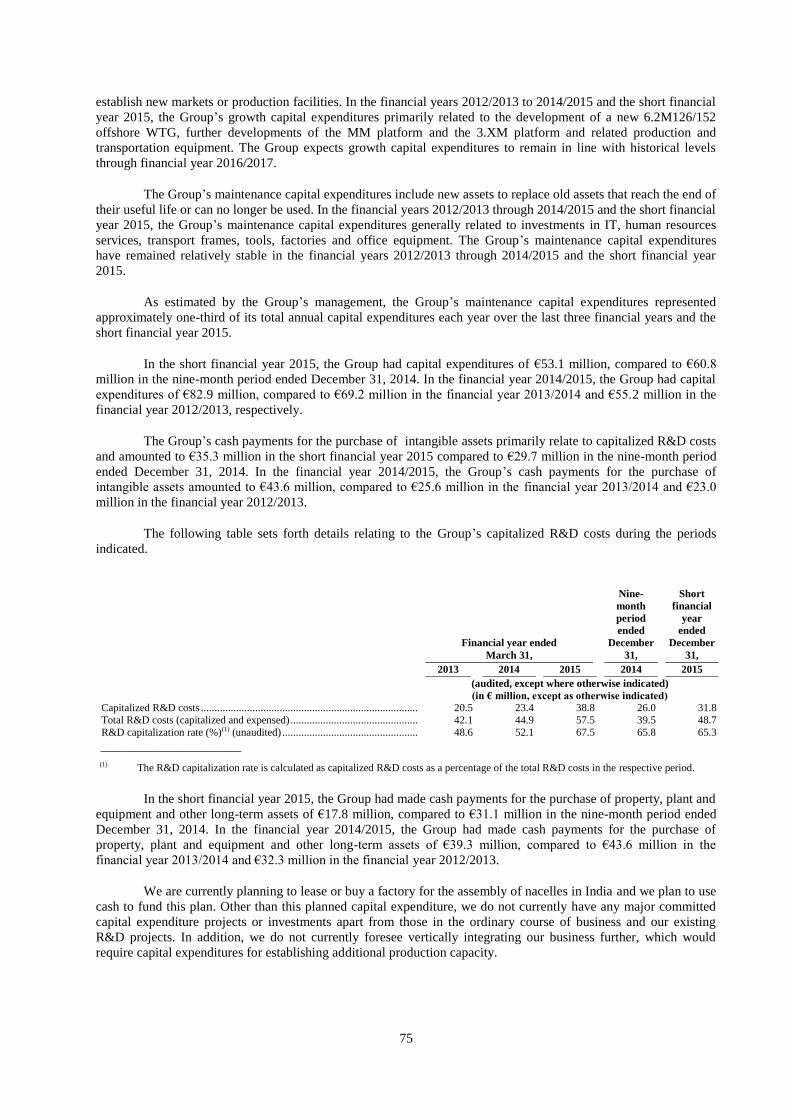
75
establish new markets or production facilities. In the financial years 2012/2013 to 2014/2015 and the short financial
year 2015, the Group’s growth capital expenditures primarily related to the development of a new 6.2M126/152
offshore WTG, further developments of the MM platform and the 3.XM platform and related production and
transportation equipment. The Group expects growth capital expenditures to remain in line with historical levels
through financial year 2016/2017.
The Group’s maintenance capital expenditures include new assets to replace old assets that reach the end of
their useful life or can no longer be used. In the financial years 2012/2013 through 2014/2015 and the short financial
year 2015, the Group’s maintenance capital expenditures generally related to investments in IT, human resources
services, transport frames, tools, factories and office equipment. The Group’s maintenance capital expenditures
have remained relatively stable in the financial years 2012/2013 through 2014/2015 and the short financial year
2015.
As estimated by the Group’s management, the Group’s maintenance capital expenditures represented
approximately one-third of its total annual capital expenditures each year over the last three financial years and the
short financial year 2015.
In the short financial year 2015, the Group had capital expenditures of €53.1 million, compared to €60.8
million in the nine-month period ended December 31, 2014. In the financial year 2014/2015, the Group had capital
expenditures of €82.9 million, compared to €69.2 million in the financial year 2013/2014 and €55.2 million in the
financial year 2012/2013, respectively.
The Group’s cash payments for the purchase of intangible assets primarily relate to capitalized R&D costs
and amounted to €35.3 million in the short financial year 2015 compared to €29.7 million in the nine-month period
ended December 31, 2014. In the financial year 2014/2015, the Group’s cash payments for the purchase of
intangible assets amounted to €43.6 million, compared to €25.6 million in the financial year 2013/2014 and €23.0
million in the financial year 2012/2013.
The following table sets forth details relating to the Group’s capitalized R&D costs during the periods
indicated.
Financial year ended
March 31,
Nine-
month
period
ended
December
31,
Short
financial
year
ended
December
31,
2013 2014 2015 2014 2015
(audited, except where otherwise indicated)
(in € million, except as otherwise indicated)
Capitalized R&D costs ................................................................................................................ 20.5 23.4 38.8 26.0 31.8
Total R&D costs (capitalized and expensed) ............................................................................... 42.1 44.9 57.5 39.5 48.7
R&D capitalization rate (%)(1) (unaudited) .................................................................................. 48.6 52.1 67.5 65.8 65.3
_____________________
(1) The R&D capitalization rate is calculated as capitalized R&D costs as a percentage of the total R&D costs in the respective period.
In the short financial year 2015, the Group had made cash payments for the purchase of property, plant and
equipment and other long-term assets of €17.8 million, compared to €31.1 million in the nine-month period ended
December 31, 2014. In the financial year 2014/2015, the Group had made cash payments for the purchase of
property, plant and equipment and other long-term assets of €39.3 million, compared to €43.6 million in the
financial year 2013/2014 and €32.3 million in the financial year 2012/2013.
We are currently planning to lease or buy a factory for the assembly of nacelles in India and we plan to use
cash to fund this plan. Other than this planned capital expenditure, we do not currently have any major committed
capital expenditure projects or investments apart from those in the ordinary course of business and our existing
R&D projects. In addition, we do not currently foresee vertically integrating our business further, which would
require capital expenditures for establishing additional production capacity.
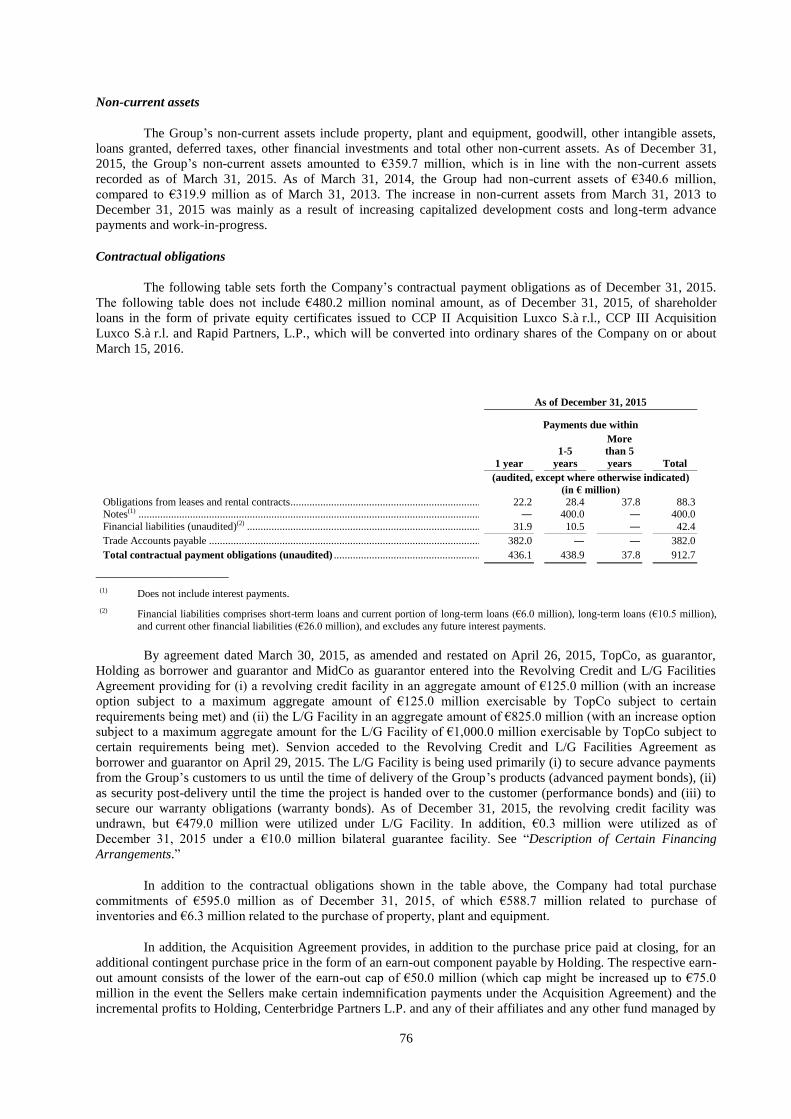
76
Non-current assets
The Group’s non-current assets include property, plant and equipment, goodwill, other intangible assets,
loans granted, deferred taxes, other financial investments and total other non-current assets. As of December 31,
2015, the Group’s non-current assets amounted to €359.7 million, which is in line with the non-current assets
recorded as of March 31, 2015. As of March 31, 2014, the Group had non-current assets of €340.6 million,
compared to €319.9 million as of March 31, 2013. The increase in non-current assets from March 31, 2013 to
December 31, 2015 was mainly as a result of increasing capitalized development costs and long-term advance
payments and work-in-progress.
Contractual obligations
The following table sets forth the Company’s contractual payment obligations as of December 31, 2015.
The following table does not include €480.2 million nominal amount, as of December 31, 2015, of shareholder
loans in the form of private equity certificates issued to CCP II Acquisition Luxco S.à r.l., CCP III Acquisition
Luxco S.à r.l. and Rapid Partners, L.P., which will be converted into ordinary shares of the Company on or about
March 15, 2016.
As of December 31, 2015
Payments due within
1 year
1-5
years
More
than 5
years Total
(audited, except where otherwise indicated)
(in € million)
Obligations from leases and rental contracts ............................................................................... 22.2 28.4 37.8 88.3 Notes(1) ....................................................................................................................................... ― 400.0 ― 400.0
Financial liabilities (unaudited)(2) ............................................................................................... 31.9 10.5 ― 42.4
Trade Accounts payable ............................................................................................................. 382.0 ― ― 382.0
Total contractual payment obligations (unaudited) ............................................................... 436.1 438.9 37.8 912.7
____________________
(1) Does not include interest payments.
(2) Financial liabilities comprises short-term loans and current portion of long-term loans (€6.0 million), long-term loans (€10.5 million),
and current other financial liabilities (€26.0 million), and excludes any future interest payments.
By agreement dated March 30, 2015, as amended and restated on April 26, 2015, TopCo, as guarantor,
Holding as borrower and guarantor and MidCo as guarantor entered into the Revolving Credit and L/G Facilities
Agreement providing for (i) a revolving credit facility in an aggregate amount of €125.0 million (with an increase
option subject to a maximum aggregate amount of €125.0 million exercisable by TopCo subject to certain
requirements being met) and (ii) the L/G Facility in an aggregate amount of €825.0 million (with an increase option
subject to a maximum aggregate amount for the L/G Facility of €1,000.0 million exercisable by TopCo subject to
certain requirements being met). Senvion acceded to the Revolving Credit and L/G Facilities Agreement as
borrower and guarantor on April 29, 2015. The L/G Facility is being used primarily (i) to secure advance payments
from the Group’s customers to us until the time of delivery of the Group’s products (advanced payment bonds), (ii)
as security post-delivery until the time the project is handed over to the customer (performance bonds) and (iii) to
secure our warranty obligations (warranty bonds). As of December 31, 2015, the revolving credit facility was
undrawn, but €479.0 million were utilized under L/G Facility. In addition, €0.3 million were utilized as of
December 31, 2015 under a €10.0 million bilateral guarantee facility. See “Description of Certain Financing
Arrangements.”
In addition to the contractual obligations shown in the table above, the Company had total purchase
commitments of €595.0 million as of December 31, 2015, of which €588.7 million related to purchase of
inventories and €6.3 million related to the purchase of property, plant and equipment.
In addition, the Acquisition Agreement provides, in addition to the purchase price paid at closing, for an
additional contingent purchase price in the form of an earn-out component payable by Holding. The respective earn-
out amount consists of the lower of the earn-out cap of €50.0 million (which cap might be increased up to €75.0
million in the event the Sellers make certain indemnification payments under the Acquisition Agreement) and the
incremental profits to Holding, Centerbridge Partners L.P. and any of their affiliates and any other fund managed by
77
Centerbridge Partners L.P. or any equity investment partner or any of their affiliates, after they have, upon the
occurrence of one or more exit events, realized and received, with respect to their invested capital, profits that
represent certain performance targets pursuant to the Acquisition Agreement. Pursuant to a reimbursement and
compensation agreement, dated February 19, 2016, CCP II Acquisition Luxco S.à r.l., CCP III Acquisition Luxco
S.à r.l., Rapid Management L.P. and Rapid Partners, L.P. have agreed to reimburse and compensate Holding for any
earn-out payments (up to the earn-out cap) that Holding may be required to make to the Sellers under the
Acquisition Agreement.
Off-balance sheet arrangements
The Company has no off-balance sheet arrangements.
Quantitative and Qualitative Disclosures about Financial Risks
The Group has exposure to currency risk, liquidity risk and interest rate risk. The Group’s risk management
policies are established to identify and analyze the risks faced by the Group, to set appropriate risk limits and
controls and to monitor risks and adherence to limits. For more information concerning financial risks associated
with financial instruments, see —Note 7.2 to the Senvion GmbH Audited Consolidated Financial Statements March
31, 2015, 2014 and 2013 and Note 8.2 to the Senvion GmbH Audited Consolidated Financial Statements December
31, 2015.
Currency risk
The Group is exposed to foreign exchange rate risk primarily from operating activities where contracts
involve a currency other than the Euro. The primary risks are in connection with the exchange of the Euro to the
U.S. dollar, the Canadian dollar, the British pounds sterling and the Australian dollar. The Group treasury
department records and measures the potential risk from transactions and payments in foreign currencies and applies
hedging approaches using forward exchange contracts, currency swaps, currency options and derivatives in order to
harmonize global cash flows. The Group does not transact in or hold such contracts for trading or speculative
purposes.
Liquidity risk
Liquidity risk is the risk that an entity will be unable to meet its financial liabilities as they fall due.
Financing for the Group is provided mainly through advanced payments for projects by customers. The Group’s
liquidity management approach is to continuously monitor payments made and received for these projects. The
Group has also utilized various short- and long-term loans, including borrowings under the Revolving Credit and
L/G Facilities Agreement, to maintain sufficient liquidity.
Interest rate risk
Interest rate risk within the Group is the risk that interest rate changes could result in an increase or
decrease in the interest expense for variable-interest rate loans and overdrafts which could negatively affect us.
Indebtedness under the Revolving Credit and L/G Facilities Agreement bear interest at a floating rate based on
EURIBOR, LIBOR or other interbank offered rates, as applicable, plus a margin. See “Description of Certain
Financing Arrangements”.
Critical Accounting Estimates
The preparation of the Group’s consolidated financial statements requires management to make certain
estimates and apply judgments that affect the reported amounts of assets and liabilities and disclosure of contingent
assets and liabilities at the date of the financial statements and the reported amounts of revenues and expenses
during the reporting period. The Group bases its estimates and judgments on historical experience, current trends
and other factors that management believes to be important at the time the financial statements are prepared. Due to
the need to make estimates about the effect of matters that are inherently uncertain, materially different amounts
could be reported under different conditions or using different assumptions. Management has changed, and might
from time to time change, the Group’s accounting policies, including in order to comply with new requirements or
to potentially adopt policies more in line with other industry participants, so as to allow better comparability. Any
change in accounting policies could impact reported results for prior and future periods. Changes in current
78
economic conditions and other events may also have a material impact on the actual figures. Therefore, actual
results could differ from Group estimates. Key estimates and assumptions relate to the following.
Impairment of property, plant and equipment and intangible assets
Property, plant and equipment and intangible assets are reviewed for impairment whenever there is a
trigger for potential impairment.
Annual goodwill impairment testing is performed at the level of the reporting units (cash-generating units)
to which goodwill is allocated. The recoverable amount is calculated on the basis of the value in use. Value in use is
calculated on the basis of the budget for the next three financial years for the financial years 2014/2015, 2013/2014
and 2013/2012 (and in financial year 2014/2015 additionally under consideration of the last quarter of the respective
period). In the financial years 2014/2015, 2013/2014 and 2012/2013, the discount rates of 6.5%, 6.5% and 8.2%,
respectively, were calculated using the weighted average cost of capital approach. The beta factor applied in the
calculation and the ratio of the fair value of equity to debt were determined by reference to a corresponding peer
group. The significant assumption underlying the budget is the projected number of WTGs installed and sold in the
respective period. This assumption is based both on the existing order book including work in progress at the end of
the period, as well as forecasted sales. In each of the financial years 2014/2015, 2013/2014 and 2012/2013 the
growth rate used to extrapolate cash flow projections beyond the three year period was 1.0%.
Impairment is recognized for other intangible assets and property, plant and equipment if certain events or
developments result in the carrying amount of the asset no longer being covered by the expected proceeds of
disposal or the discounted net cash flows from continued use.
No impairment losses were recognized on intangible assets in financial years 2012/2013 and, 2013/2014,
as the recoverable amount was greater than the carrying amount of the assets of the reporting units plus the carrying
amount of the corresponding goodwill. Impairment losses were recognized on software and other licenses in the
financial year 2014/2015. Under property, plant and equipment, impairment losses were recognized on the
construction of rotor blade molds as well as the extension of production and storage facilities in financial years
2012/2013 and 2013/2014. No impairment losses were recognized under property, plant and equipment for the
financial year 2014/2015. No impairment losses were recognized under property, plant and equipment for the short
financial year ended December 31, 2015. The increase in expenses from discontinued operations from €8.1 million
in the financial year 2012/2013 to €12.7 million in the financial year 2013/2014 was mainly the result of an
impairment of Senvion’s disposal group classified as held for sale as part of the REpower North China liquidation
measures.
Warranty provisions
The Group’s warranty provisions amounted to €186.5 million, €230.3 million, €233.8 million and €206.8
million as of March 31, 2013, 2014 and 2015 and December 31, 2015, respectively. Warranty provisions are
recognized both for individual risks from technical issues which affect individual WTGs, a specific series of WTGs
or specific components across a number of different WTGs (specific warranty provisions) and for risks and defects
of a smaller nature which generally occur in every sold WTG during the warranty period (general warranty
provision). Warranty provisions are assurance type warranties which are recognized for the legal or contractual
warranty period.
Specific technical warranty risks can be individually quantified by comprehensive documentation and are
taken into consideration in the form of individual provisions. The economic risk and the level of provisioning are
evaluated on an ongoing basis in coordination with the technical departments, taking existing risks into account.
Specific warranty provisions comprise issues falling within the legal warranty period of two years as well as issues
for which a warranty arises from contractual service agreements.
Provisions are recognized for risks and defects of a smaller nature which generally occur in every sold
WTG on the basis of past experience. General warranty provisions are determined as follows: for turbines erected,
provisions are recognized for the anticipated future costs per year for the entire legal warranty period of two years.
The anticipated costs are determined on the basis of past experience and reviewed on an ongoing basis.
The accounting for warranties requires us to make assumptions and apply judgments when estimating
product failure rates and expected repair costs. Adjustments are made to warranty accruals based on claim data and
experience. If actual results are not consistent with the assumptions and judgments used to estimate warranty
79
obligations, because either failure rates or repair costs differ from our assumptions, our resulting change in estimate
could be material.
Revenue recognition according to percentage of completion method
Revenues include all revenues from the sale of WTGs, license revenues, electricity revenues and revenues
from O&M service contracts.
Revenues from the sale of WTGs include the production, delivery and installation of WTGs. For the
related construction contracts, the Group applies the percentage of completion method, which is subject to the
prerequisite that a legally effective customer order with specific requirements must exist at the reporting date and
that both the outcome of the order and the expected total costs can be reliably estimated.
For both onshore and offshore WTGs, revenues are recognized according to the percentage of completion
method. For onshore WTGs, the percentage of completion is measured using the milestone method, under which
revenues and costs associated with the contract are recognized as revenues and expenses by reference to the
completion of individual milestones which are significant to the overall completion of the contract. Revenues
recognized under this milestone-method correspond with the value created in the process of an onshore wind farm
project at the time the milestone is achieved. For offshore WTGs, the percentage of completion is measured using
the cost-to-cost method, under which revenues recognized correspond to the total contract revenues multiplied by
the actual completion rate based on the proportion of total contract costs incurred to date and the estimated total
contract costs. In our statutory consolidated financial statements as of and for the financial year ended March 31,
2015 and for the prior financial years, we applied the cost-to-cost method for revenue recognition for both onshore
and offshore WTGs, as compared to our current use of the cost-to-cost method only to measure the percentage of
completion for the recognition of revenues for offshore WTGs. We changed our revenue recognition policy in order
to reflect better our business activities and risk profile, to bring it more in line with our internal processes and
because we believe that it enhances the comparability and usefulness of the information in our consolidated
financial statements.
In certain cases where a reliable estimate of the full construction contract is not possible, the zero profit
method is applied, with no profit margin recognized in calculating the percentage of completion until reliable
information becomes available. Customer orders for the production, delivery and installation of WTGs are generally
considered to be completed with commissioning of the WTGs or the handing over of the wind farm to the customer,
as applicable. As long as no installation is agreed upon, the contract is considered to be completed when the risks
and benefits are transferred to the buyer and payment is probable.
Contract costs are monitored by the Group’s Controlling department. The forecast costs and the results of
project controlling, which are used to determine the percentage of completion and the proportionate contribution
margins, are significant assumptions in the measurement of contracts. As these assumptions are subject to
uncertainty, the actual contract costs and contribution margins may be higher or lower than forecast when the
project is completed.
Income taxes
Uncertainties exist with respect to the interpretation of complex tax regulations, changes in tax laws and
the amount and timing of future taxable income. Given the wide range of international business relationships,
differences arising between the actual results and the assumptions made, or future changes to such assumptions,
could necessitate future adjustments to tax income and expense already recorded. The Group establishes provisions,
based on reasonable estimates, for possible consequences of audits by the tax authorities of the respective countries
in which it operates. The amount of such provisions is based on various factors, such as experience of previous tax
audits and differing interpretations of tax regulations by the taxable entity and the responsible tax authority.
Deferred taxes result from temporary differences between the carrying amounts in the companies’ tax base
and the amount recognized in the consolidated financial statements, as well as from tax loss carryforwards. They are
calculated using the liability method and the tax rate applicable in the respective countries at the date on which the
differences are reversed, to the extent that this is known at the balance sheet date, or using the tax rate at the balance
sheet date if a change in the tax rate is not likely.
Deferred taxes on tax loss carryforwards are recognized in the amount of the tax effect of the expected
utilizable tax losses of the Group companies. The key factor for determining the value of deferred tax assets is the

80
estimated reversal of the measurement differences and the usability of the tax loss carryforwards which led to
deferred tax assets. This depends on the occurrence of future taxable profit during the periods in which tax
measurement differences are reversed and tax loss carryforwards can be utilized and on the reversal of temporary
differences. As of December 31, 2015, tax loss carryforwards could be carried forward without restriction in
subsequent years in all countries where tax loss carryforwards exist. No deferred tax assets were recognized on
corporation tax losses totaling €4.0 million as well as trade tax losses of €0.04 million as of December 31, 2015 due
to the lack of prospects for offsetting in the near future.
81
INDUSTRY OVERVIEW
Overview
The renewable energy market is characterized by favorable long term growth trends. Demand for
electricity has increased consistently, with global electricity generation growing at a CAGR of approximately 3%
since 1990, supporting growing electricity prices even in periods of volatile fuel prices (Source: IEA Outlook,
2015). Despite fossil fuels and nuclear power still representing a large share of global electricity generation today,
onshore and offshore wind generated electricity is expected to grow strongly at a CAGR of approximately 12.0%
between 2013 and 2020 (Source: IEA Outlook, 2015). Such growth is driven by several factors including: (i)
increased awareness of climate change and global warming; (ii) national targets to reduce dependency on
conventional or imported energy sources and diversify away from fossil fuels; and (iii) significantly improved
relative cost competitiveness (Source: GWEC, 2015).
In order to reduce CO2 emissions and create a path to sustainable growth, governments in our core markets
have set national and international targets for sourcing energy from renewables. These targets are expected to
support the sale of our products going forward through a combination of FITs or some form of tax incentives. In
January 2014, the European Climate Agreement set targets for 2030 with the objective of reducing emissions of
greenhouse gases by at least 40% from 1990 levels, and improving energy efficiency by increasing the share of
renewable energy to 27% by 2030. Some countries, such as Germany, have set even more ambitious targets. Other
countries outside the European Union, such as Australia, Turkey and India, also have targets, which we believe will
strengthen the demand for our products going forward. In these markets, we believe the penetration of renewable
power generation will increase substantially going forward.
In July 2014, the EU and 17 other members of the World Trade Organization, including our core markets,
Germany, the UK, France, Canada and Australia and our potential new markets, Japan, Norway and Turkey, began
negotiating an Environmental Goods Agreement with the goal to remove barriers to trade in environmentally
friendly or “green” goods that are crucial for environmental protection and climate change mitigation. Green goods
include those which generate renewable energy such as wind turbines. The countries involved in the negotiations
account for approximately 90% of world trade in green goods. We believe free trade in green goods will help reduce
the cost of our products and increase demand for our products and the penetration of renewable power generation.
In November 2014, in their Climate Accord, the U.S. and China agreed, ahead of the 2015 United Nations
Climate Change Conference (“COP21”) in Paris, that the U.S. intends to achieve reduced CO2 emissions by 26-
28% from their 2005 levels by 2025 and China intends to stop its growth in total CO2 emissions and increase its
share of renewable energy consumption to 20% by 2030.
In December 2015, the COP21 took place in Paris. COP 21 reached a historic universal agreement
governing carbon dioxide reduction measures (the “Paris Agreement”) of the 196 countries participating, including
all of our core markets, Germany, the UK, France, Canada and Australia and all our potential new markets, India,
Turkey, Japan, Mexico, Norway, Finland, Sweden, Chile, Peru and Uruguay. Among other measures, the
participants intend to (i) hold the increase in global average temperature to below 2°C above pre-industrial levels by
reducing emissions to 40 gigatons or to 1.5°C above pre-industrial levels by reducing emissions to a level to be
identified in a special report to be published in 2018, (ii) peak greenhouse gas emissions as soon as possible and
achieve a balance between sources and sinks of greenhouse gasses in the second half of this century, and (iii)
provide $100 billion a year in climate finance for developing countries by 2020, with a commitment to providing
further financing in the future. The Paris Agreement will become legally binding once it has been ratified by at least
55 parties that account in total for at least 55% of the total greenhouse gas emissions. Importantly, from 2020
onwards, countries will be required to update their greenhouse gas emission targets every five years by submitting
new reduction plans. This will prevent a locking in of current reduction targets and sustain the need for more
advanced alternative energy technologies.
Wind energy has a strong position within renewables due to its proven technology and attractive relative
cost compared to alternative forms of energy, with the current average cost of wind energy in certain areas nearing
the wholesale price of purchasing power from the grid in a relevant country (“grid parity”). Wind energy (onshore
and offshore) is also characterized by low water consumption and is expected to outpace other renewable energy
technologies and account for 51% of total electricity generated from renewables, excluding hydro, by 2020 (Source:
IEA Outlook, 2015). In the near term, increases in wind electricity generation are expected to be above solar energy
in most geographical locations in the period from 2013 to 2020 (Source: IEA Outlook, 2015). In addition, increased
storage capacity for electricity generated from intermittent renewable energy sources (which is a source of energy
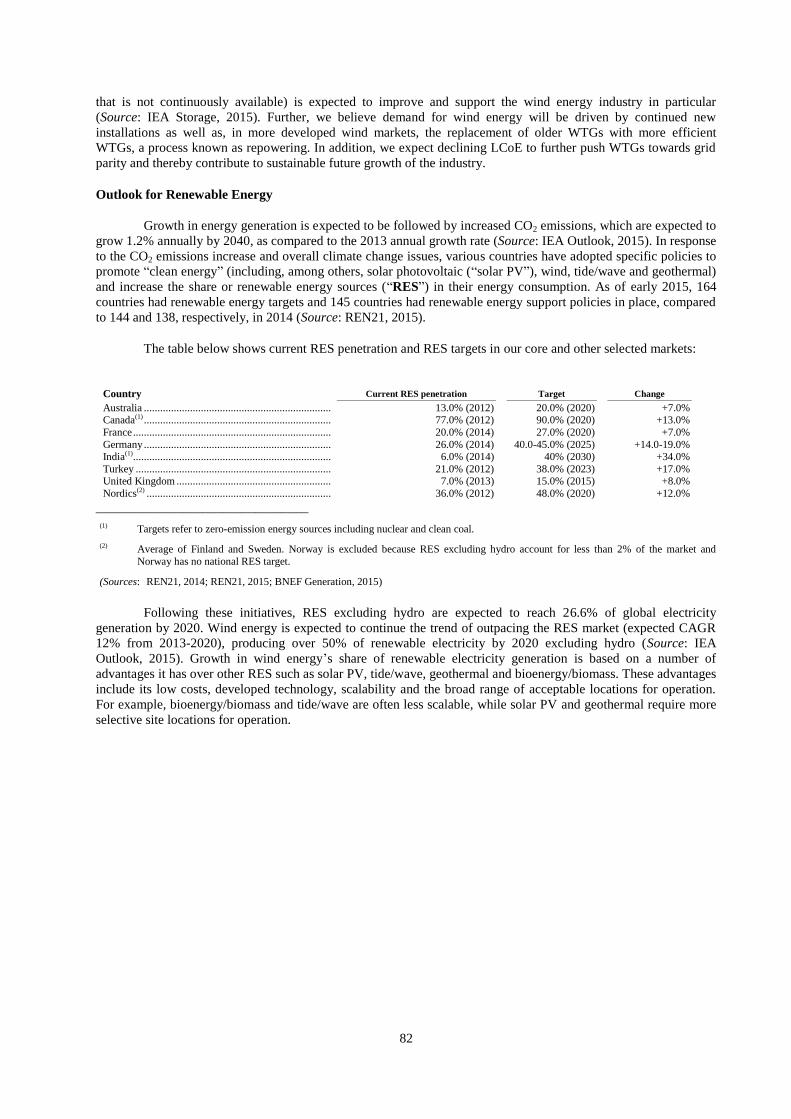
82
that is not continuously available) is expected to improve and support the wind energy industry in particular
(Source: IEA Storage, 2015). Further, we believe demand for wind energy will be driven by continued new
installations as well as, in more developed wind markets, the replacement of older WTGs with more efficient
WTGs, a process known as repowering. In addition, we expect declining LCoE to further push WTGs towards grid
parity and thereby contribute to sustainable future growth of the industry.
Outlook for Renewable Energy
Growth in energy generation is expected to be followed by increased CO2 emissions, which are expected to
grow 1.2% annually by 2040, as compared to the 2013 annual growth rate (Source: IEA Outlook, 2015). In response
to the CO2 emissions increase and overall climate change issues, various countries have adopted specific policies to
promote “clean energy” (including, among others, solar photovoltaic (“solar PV”), wind, tide/wave and geothermal)
and increase the share or renewable energy sources (“RES”) in their energy consumption. As of early 2015, 164
countries had renewable energy targets and 145 countries had renewable energy support policies in place, compared
to 144 and 138, respectively, in 2014 (Source: REN21, 2015).
The table below shows current RES penetration and RES targets in our core and other selected markets:
Country Current RES penetration Target Change
Australia ................................................................................................ 13.0% (2012) 20.0% (2020) +7.0% Canada(1) ................................................................................................ 77.0% (2012) 90.0% (2020) +13.0%
France .................................................................................................... 20.0% (2014) 27.0% (2020) +7.0%
Germany ................................................................................................ 26.0% (2014) 40.0-45.0% (2025) +14.0-19.0% India(1) .................................................................................................... 6.0% (2014) 40% (2030) +34.0%
Turkey ................................................................................................... 21.0% (2012) 38.0% (2023) +17.0% United Kingdom .................................................................................... 7.0% (2013) 15.0% (2015) +8.0%
Nordics(2) ............................................................................................... 36.0% (2012) 48.0% (2020) +12.0%
________________________________
(1) Targets refer to zero-emission energy sources including nuclear and clean coal.
(2) Average of Finland and Sweden. Norway is excluded because RES excluding hydro account for less than 2% of the market and
Norway has no national RES target.
(Sources: REN21, 2014; REN21, 2015; BNEF Generation, 2015)
Following these initiatives, RES excluding hydro are expected to reach 26.6% of global electricity
generation by 2020. Wind energy is expected to continue the trend of outpacing the RES market (expected CAGR
12% from 2013-2020), producing over 50% of renewable electricity by 2020 excluding hydro (Source: IEA
Outlook, 2015). Growth in wind energy’s share of renewable electricity generation is based on a number of
advantages it has over other RES such as solar PV, tide/wave, geothermal and bioenergy/biomass. These advantages
include its low costs, developed technology, scalability and the broad range of acceptable locations for operation.
For example, bioenergy/biomass and tide/wave are often less scalable, while solar PV and geothermal require more
selective site locations for operation.
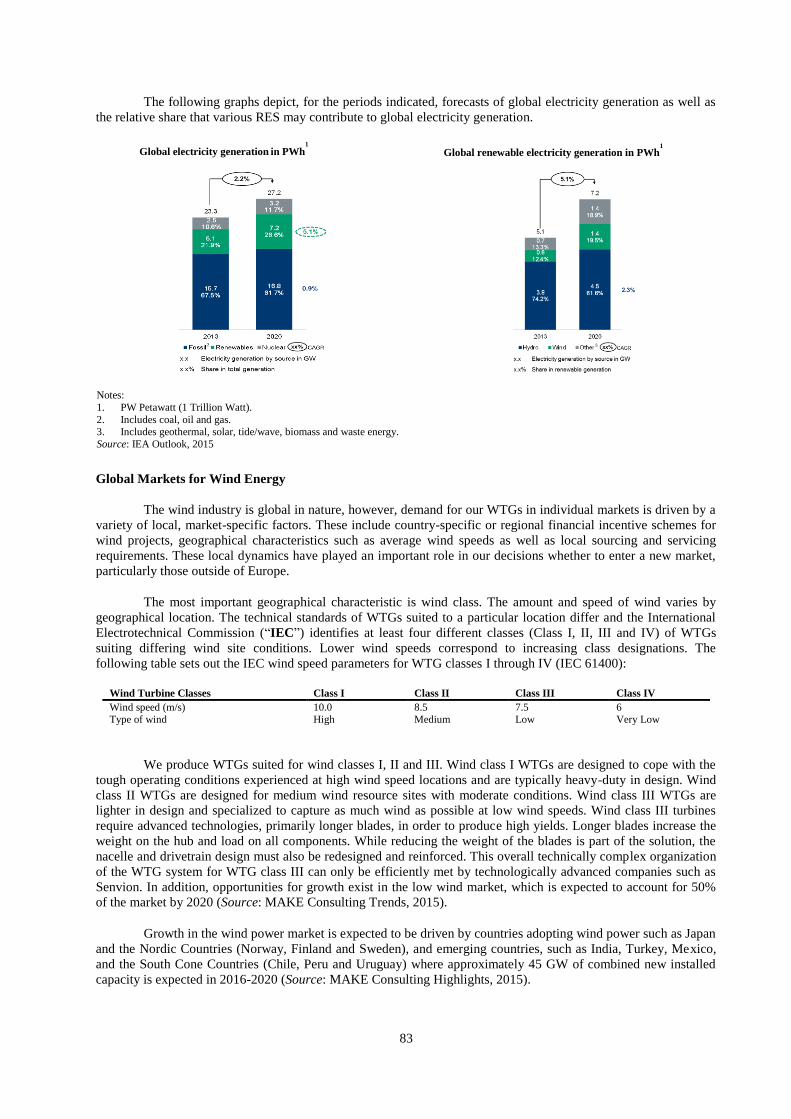
83
The following graphs depict, for the periods indicated, forecasts of global electricity generation as well as
the relative share that various RES may contribute to global electricity generation.
Global Markets for Wind Energy
The wind industry is global in nature, however, demand for our WTGs in individual markets is driven by a
variety of local, market-specific factors. These include country-specific or regional financial incentive schemes for
wind projects, geographical characteristics such as average wind speeds as well as local sourcing and servicing
requirements. These local dynamics have played an important role in our decisions whether to enter a new market,
particularly those outside of Europe.
The most important geographical characteristic is wind class. The amount and speed of wind varies by
geographical location. The technical standards of WTGs suited to a particular location differ and the International
Electrotechnical Commission (“IEC”) identifies at least four different classes (Class I, II, III and IV) of WTGs
suiting differing wind site conditions. Lower wind speeds correspond to increasing class designations. The
following table sets out the IEC wind speed parameters for WTG classes I through IV (IEC 61400):
Wind Turbine Classes Class I Class II Class III Class IV
Wind speed (m/s) 10.0 8.5 7.5 6 Type of wind High Medium Low Very Low
We produce WTGs suited for wind classes I, II and III. Wind class I WTGs are designed to cope with the
tough operating conditions experienced at high wind speed locations and are typically heavy-duty in design. Wind
class II WTGs are designed for medium wind resource sites with moderate conditions. Wind class III WTGs are
lighter in design and specialized to capture as much wind as possible at low wind speeds. Wind class III turbines
require advanced technologies, primarily longer blades, in order to produce high yields. Longer blades increase the
weight on the hub and load on all components. While reducing the weight of the blades is part of the solution, the
nacelle and drivetrain design must also be redesigned and reinforced. This overall technically complex organization
of the WTG system for WTG class III can only be efficiently met by technologically advanced companies such as
Senvion. In addition, opportunities for growth exist in the low wind market, which is expected to account for 50%
of the market by 2020 (Source: MAKE Consulting Trends, 2015).
Growth in the wind power market is expected to be driven by countries adopting wind power such as Japan
and the Nordic Countries (Norway, Finland and Sweden), and emerging countries, such as India, Turkey, Mexico,
and the South Cone Countries (Chile, Peru and Uruguay) where approximately 45 GW of combined new installed
capacity is expected in 2016-2020 (Source: MAKE Consulting Highlights, 2015).
Global electricity generation
in PWh1
Global renewable electricity generation in PWh1
Notes:
1. PW Petawatt (1 Trillion Watt).
2. Includes coal, oil and gas. 3. Includes geothermal, solar, tide/wave, biomass and waste energy.
Source: IEA Outlook, 2015
Source: IEA WEO 2015 – New policies scenario
84
The following paragraphs present highlights of the world’s wind energy markets, including our core
markets.
Germany
Germany is Europe’s largest wind energy market. As of December 31, 2015, we have a cumulative
installed capacity of 4.5 GW in Germany. Of the 12.9 GW of wind energy installed across Europe in 2014, 41% was
installed in Germany (Source: GWEC, 2015). Germany introduced a specific growth target for onshore wind energy
of net annual growth of 2.5 GW and, for offshore wind energy, an installed cumulative capacity target of 6.5 GW by
2020 and 15 GW by 2030 (Source: REN21, 2015). In addition, the German market for repowering is growing
rapidly. In 2014, WTGs with a combined capacity of 364 MW were dismantled and replaced by new turbines with a
combined capacity of 1,000 MW (Source: GWEC, 2015). By 2020, 18.4 GW of repowering in Germany is expected
(Source: BNEF Repowering, 2014). Germany contains wind class I, II and III regions. The German market consists
primarily of 3 MW WTGs and has potential for 2 MW WTGs.
United Kingdom
The UK is Europe’s second largest wind energy market. As of December 31, 2015, we have a cumulative
installed capacity of 1.5 GW in the UK. Of the 12.9 GW of wind energy installed across Europe in 2014, 13.5% was
installed in the UK (Source: GWEC, 2015). The UK introduced a specific growth target for offshore wind energy of
an installed cumulative capacity of 39 GW by 2030 (Source: REN21, 2015). The UK contains predominantly wind
class I and II regions.
France
France is Europe’s third largest wind energy market. As of December 31, 2015, we have a cumulative
installed capacity of 1.9 GW in France. Of the 12.9 GW of wind energy installed across Europe in 2014, 8.1% was
installed in France (Source: GWEC, 2015). France introduced a specific growth target for onshore wind energy of
cumulative installed capacity of 25 GW by 2020 and, for offshore wind energy, an installed cumulative capacity
target of 6 GW by 2020 (Source: REN21, 2015). The French market is moving towards equal share of 2 MW, 2.5
MW and 3 MW WTGs. France contains predominantly wind class III regions.
Australia
We have a market share in Australia of approximately 19% (2014) with a total of approximately 440 MW
installed across nine wind farms as of December 31, 2015 (Source: MAKE Consulting Market Shares, 2015).
Australia is expected to drive growth in demand for wind energy in the Asia Pacific region along with India. The
Australian government has implemented a renewable energy target scheme which has helped wind energy become
the dominant form of renewable energy and created a supportive market environment for wind energy in Australia.
The government has set a target for 20% of the nation’s power to come from renewable energy by 2020 (Source:
GWEC, 2015). Australia contains wind class I and II regions.
Canada
We have installed 1.1 GW in Canada as of December 31, 2015. The Canadian wind market has grown
from 1.8 GW of installed capacity in 2007 to 9.7 GW in 2014 (Source: GWEC, 2015). Canada’s energy market
remains well positioned to build on growth achieved in 2014 as provincial governments consider their new
electricity supply choices for the next decade in light of federal coal regulations that require existing coal powered
plants to retire after 50 years and the similar regulations affecting other fossil fuel electricity sources expected in the
future. In 2014, the top five WTG manufactures, including Senvion, provided 98% of Canada’s new wind energy
capacity (Source: GWEC, 2015). We expect 3 MW WTGs to dominate the Canadian market from 2017. Canada
contains wind class II and III regions.
India
India, as well as Australia, is driving growth in wind energy in the Asia Pacific region, making it an
attractive market. India is expected to have average annual installations of 3.2 GW from 2016 to 2018 and total
cumulative installations of 20.0 GW from 2016 to 2020 (Source: MAKE Consulting Outlook, 2015). India was the
fifth largest global wind market as of 2014 and the Indian government recently set an ambitious target to add 60
GW of wind capacity by 2022, which is equivalent to 5 GW per year (Source: REN21, 2015). The wind energy
85
market in India benefits from a supportive regulatory scheme. India adopted favorable regulation supporting
renewable energy growth; the key incentive schemes for renewable energies include feed-in tariffs, renewable
purchase obligations, generation based incentives and a renewable energy certificates program. Within India, IPPs
are the fastest growing segment of asset owners and they are expected to account for 70% of all new capacity in
India (Source: MAKE Consulting India, 2015). The wind energy market in India is characterized by greater
involvement of WTG manufacturers in the project planning process and, currently, the market is catered to by local
players producing smaller turbines. In India, WTG manufacturers identify suitable sites for a wind farm, plan the
construction, installation and commissioning of the WTGs, purchase or lease the land on a long-term basis,
investing their own capital, and then present the completed project plan, including the sale of their own WTGs, to
potential investors. India contains predominantly wind class III regions. As of December 31, 2015, we have
cumulative installed capacity of 22.5 MW in India.
Turkey
Turkey is one of the fastest growing power markets in the world and its power market did not suffer
adverse impacts from the global financial crisis (Source: GWEC, 2015). Turkey is expected to have average annual
installations of 1.1 GW from 2016 to 2018 and total cumulative installations of 5.6 GW from 2016 to 2020 (Source:
MAKE Consulting Outlook, 2015). Turkey’s installed wind power capacity has grown at over 5 GW per year since
2010 (Source: GWEC, 2015). In addition, the Turkish government set an aggressive target to reach wind energy
capacity of 20GW in 2023 (Source: REN21, 2015). In addition, Turkey benefits from a stable policy environment
with strong support for renewable energy. The key incentive schemes for renewable energies in Turkey include,
feed-in tariffs, local content bonuses and special land allowances. Turkey contains predominantly wind class III
regions and also has material wind class II sites. As of December 31, 2015, we have cumulative installed capacity of
3.4 MW in Turkey.
Japan
In 1980, Japan was the first market in the Asia Pacific region to embrace wind power and after the
Fukushima nuclear disaster interest in renewable energy gained considerable momentum. However, the introduction
of lengthy and costly environmental impact assessments for wind farms, which require four years to complete, have
prevented the Japanese market from growing despite Japan’s lack of natural resources and its heavy dependence on
energy imports and nuclear power (greater than 90%). Nevertheless, growth in Japan’s wind power market is
expected to accelerate in 2016 (Source: GWEC, 2015). Japan is expected to have average annual installations of 0.5
GW from 2016 to 2018 and total cumulative installations of 2.8 GW from 2016 to 2020 (Source: MAKE Consulting
Outlook, 2015). The Japanese government set a target to triple the share of renewable energy by 2030 and
introduced a target of 5GW of cumulative wind energy capacity by 2020 and 8.03 GW of cumulative offshore wind
energy by 2030 (Source: REN21, 2015). The Japanese Ministry of Environment and the Ministry of Economy,
Trade and Industry are also working to shorten the environmental impact assessment time from four to two years. In
addition, 88 wind power projects completed the environmental impact assessment and are ready to begin
construction (Source: GWEC, 2015). As of December 31, 2015, we have an installed capacity of 117.9 MW in
Japan. Japan contains predominantly wind class II regions and also wind class I regions.
Mexico
Mexico is well suited for wind power generation and is a driver of growth in the wind energy market in
Latin America (Source: MAKE Consulting Latin America, 2015). Mexico is expected to have average annual
installations of 1.3 GW from 2016 to 2018 and total cumulative installations of 6.3 GW from 2016 to 2020 (Source:
MAKE Consulting Outlook, 2015). Mexico has one of the world’s richest wind resources located in the states of
Oaxaca, Tamaulipas and Baja California. The Mexican government has set an ambitious target to reach 9.5 GW of
wind power by 2018 (Source: GWEC, 2015). Mexico has adopted market reforms for the electricity sector that are
expected to favorably impact Mexico’s wind energy market. Once implemented, Mexico’s Energy Reform will
open the energy market to the private sector and create an independent system operator which will play a leading
role in ensuring fair access to the grid. In February 2015, the foundation of Mexico’s electricity market was formed.
2013 and 2014 were record years for the Mexican wind energy market with installed capacity of 380 MW and 634
MW, respectively (Source: GWEC 2015). Mexico’s annual installations are expected to exceed 1 GW by 2016
(Source: MAKE Consulting Latin America). Mexico contains predominantly wind class III regions and also has
wind class II regions.
86
Nordic Countries (Norway, Finland and Sweden)
The wind energy market in Norway, Finland and Sweden (together, the “Nordic Countries”) is growing.
The Nordic Countries combined installed approximately 1,243 MW of wind energy capacity in 2014 and are
expected to have average annual installations of 1.5 GW from 2016 to 2018 and total cumulative installations of 7.8
GW from 2016 to 2020 (Source: MAKE Consulting Outlook, 2015). Over the last five years, Sweden has more than
tripled its wind power production. Sweden and Norway have a joint electricity certificate system and a joint target
of increasing renewable energy sources to 26,400 GW by 2020 (Source: GWEC, 2015). The joint certificate system
will permit trading in both Swedish and Norwegian certificates, and a generator can receive certificates for
renewable energy production in either country. Finland’s government also has policies in place supportive of the
wind energy market. Finland set a target to reach 884 MW of cumulative installed wind energy capacity by 2020
and by April 2014, Finland announced an additional 11 GW of wind power projects (Source: FWA, 2015). The
current Finnish government, in the summer of 2015, announced a change in policy against further wind subsidies
and, given the current program is almost at an end, the outlook for Finland is weak. As a result, we focus on Norway
and Sweden. In addition, there are no local content requirements in the Nordic Countries. Norway, our primary
focus area within the Nordic Countries at this time, contains predominantly wind class II regions.
South Cone Countries (Chile, Peru and Uruguay)
2014 was a record year for wind energy in Latin America with Chile, Peru and Uruguay (together the
“South Cone Countries”), along with Mexico, among the six leaders in growth (Source: MAKE Consulting Latin
America, 2015). The South Cone Countries combined installed approximately 662 MW of wind energy in 2015 and
they are expected to have average annual installations of 640 MW through 2020 and total cumulative installations of
3.2 GW from 2016 to 2020 (Source: MAKE Consulting Outlook, 2015). Chile alone has the potential for 37 GW of
wind energy which exceeds Chile’s total demand for electricity. In 2014, Chile connected 349 MW of new wind
power capacity compared to 187 MW installed in 2013 (Source: MAKE Consulting Latin America, 2015). The
Chilean government adopted renewable energy policies and steady growth of 300-400 MW per year is expected
(Source: GWEC, 2015; MAKE Consulting Latin America, 2015). Uruguay connected 419 MW of new wind power
capacity to the grid in 2014 and wind power penetration is expected to exceed 40% by 2017 (Source: MAKE
Consulting Latin America, 2015). Peru has substantial wind power resources and despite Peru’s modest target of 5%
non-large hydroelectric renewable energy sources, the wind power product pipeline continues to grow and MAKE
Consulting expects cumulative capacity to grow 31% by 2024 (Source: MAKE Consulting Latin America, 2015).
Importantly, there are no local content requirements in the South Cone countries. Chile, our primary focus area
within the South Cone Countries at this time, contains predominantly wind class III regions.
Ireland
Ireland’s location near the Atlantic Ocean provides Ireland with one of the best wind resources in Europe
(Source: IEA Ireland, 2012). The wind energy market in Ireland is growing. Ireland installed approximately 331
MW of wind energy capacity in 2014 and is expected to have average annual installations of 317 MW from 2016 to
2018 and total cumulative installations of 1.5 GW from 2016 to 2020 (Source: MAKE Consulting Outlook, 2015).
Ireland is working to meet its EU renewable energy target for 2020. An assessment of projected contributions to this
renewable electricity target indicates that 32% of demand, or 80% of the renewable electricity target, will be met
with onshore wind energy and wind energy will contribute approximately 40% of the overall national renewable
energy target (Source: IEA Wind, 2015). Ireland contains predominantly wind class II regions and also wind class I
regions.
United States
We entered the U.S. market in 2007 and have an installed capacity of approximately 1.3 GW. However, the
U.S. market has suffered from an unstable policy environment. The U.S. Congress failed to extend tax incentives in
time to positively impact the 2013 development of the wind sector. As a result, the U.S. market fell by 92% with
less than 1.1 GW installed in 2013 compared to 13.1 GW installed in 2012 (Source: GWEC, 2014). The recurring
incentive expirations caused uncertainty in the market and created a boom-bust cycle for the U.S. wind industry
because wind energy projects are consummated during the years when it is clear the tax incentive will apply. In
December 2014, the tax incentive was extended retroactively by one year to apply to wind projects commissioned in
2014. In December 2015, the expiration date for the tax incentive was extended through December 31, 2019, for
wind facilities commencing construction, with a phase down beginning for projects commencing construction after
December 31, 2016. The tax incentive was also again extended retroactively by one year to apply to wind projects
commissioned in 2015. As a result of tax incentive fluctuations, the United States became an unattractive market for
87
the Group and we partially withdrew from the U.S. market. Today, the U.S. is not a focus market for us and our
remaining U.S. operations are centered on service of existing WTGs through our operations and maintenance teams
across the country and a spare parts facility in Portland, Oregon.
Brazil
Brazil is experiencing an economic slowdown that is expected to affect future electricity demand. Based on
the technology shares of the 2014 energy auctions, in which regulators set a ceiling price and developers bid down
the price to win contracts to supply electricity, wind energy demand could decline an average of 1 GW annually
over the next five years (Source: MAKE Consulting Latin America, 2015). Brazil’s energy market suffers from
growth inhibitors such as unfavorable trade policies, burdensome bureaucratic processes and foreign exchange
volatility. Brazilian energy auctions are the primary means for power purchase agreements (“PPA”) for wind
developers to access the Brazilian market. However, the auction system has limited wind energy to 1.2 GW in 2015.
The Brazilian auction system has also influenced the price of PPAs through local content requirements (Source:
MAKE Consulting Latin America, 2015). As a result of the unattractive auction system and the difficult competitive
environment in Brazil, we decided not to enter the Brazilian market at this time.
China
The Chinese market suffers from manufacturing overcapacity, with nearly 80 WTG manufacturers active
in the Chinese market by the end of 2009, which drove fierce competition and declining market shares for
international manufactures (Source: GWEC, 2008; GWEC, 2009). Non-Chinese manufacturers have disappeared
from the top fifteen manufacturers and in 2014, the top fifteen manufactures in China had a 93% market share
(Source: GWEC, 2015). In addition, though recent regulations seek to end the practice, the Chinese market share
distribution was also influenced by local Chinese governments implementing local content requirements restricting
the award of new projects to only those project developers purchasing locally produced WTGs (Source: GWEC,
2008; GWEC, 2015). As a result, we decided not to enter the Chinese market.
General Trends in the Wind Energy Market
Overview
The wind energy market comprises two key segments: onshore (when a WTG is positioned on land) and
offshore (when a WTG is positioned at sea).
Total installed capacity of wind energy is expected to double from 2013 to 2020, which would lead to wind
energy becoming the second largest RES, following hydro energy (IEA Outlook, 2015). The wind energy market is
expected to grow at 12.0% CAGR from 2013 to 2020 (Source: IEA Outlook, 2015). From 2015 to 2020, the
onshore market is expected to grow at 5.0% CAGR and the offshore market is expected to grow from annual
installations of 3.1 GW to 4.4 GW (each excluding China and the U.S.) (Source: MAKE Consulting Outlook, 2015).
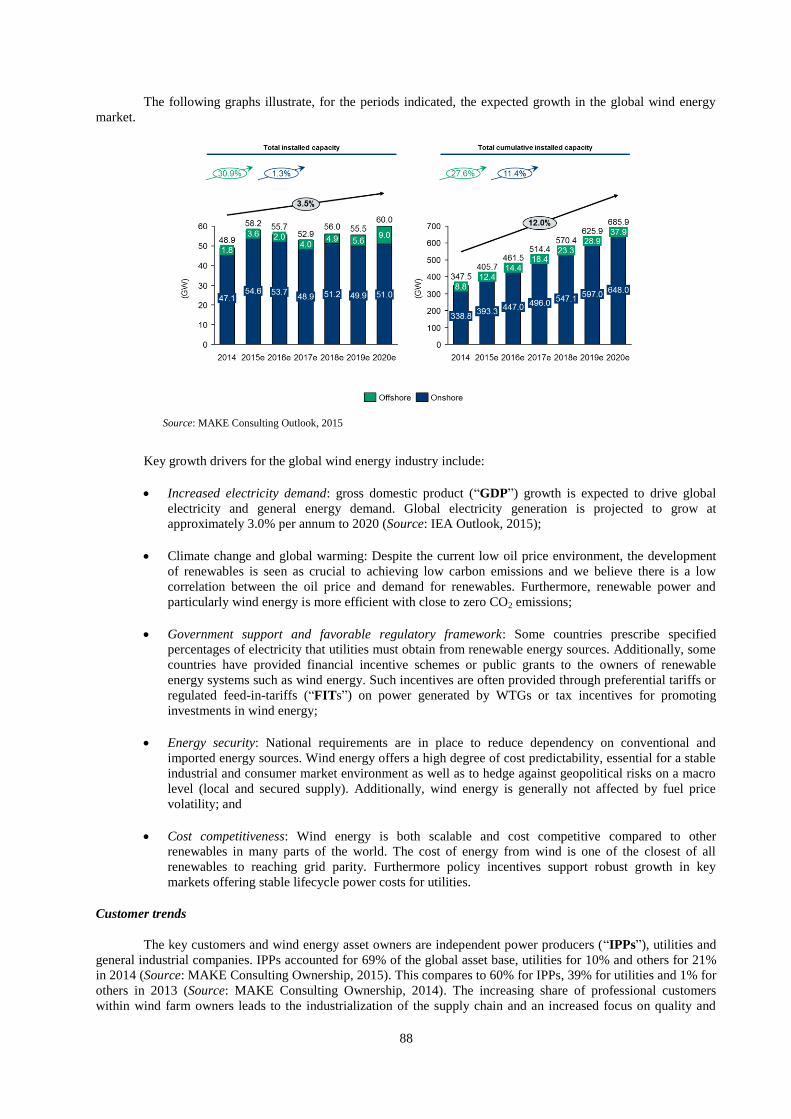
88
The following graphs illustrate, for the periods indicated, the expected growth in the global wind energy
market.
Key growth drivers for the global wind energy industry include:
Increased electricity demand: gross domestic product (“GDP”) growth is expected to drive global
electricity and general energy demand. Global electricity generation is projected to grow at
approximately 3.0% per annum to 2020 (Source: IEA Outlook, 2015);
Climate change and global warming: Despite the current low oil price environment, the development
of renewables is seen as crucial to achieving low carbon emissions and we believe there is a low
correlation between the oil price and demand for renewables. Furthermore, renewable power and
particularly wind energy is more efficient with close to zero CO2 emissions;
Government support and favorable regulatory framework: Some countries prescribe specified
percentages of electricity that utilities must obtain from renewable energy sources. Additionally, some
countries have provided financial incentive schemes or public grants to the owners of renewable
energy systems such as wind energy. Such incentives are often provided through preferential tariffs or
regulated feed-in-tariffs (“FITs”) on power generated by WTGs or tax incentives for promoting
investments in wind energy;
Energy security: National requirements are in place to reduce dependency on conventional and
imported energy sources. Wind energy offers a high degree of cost predictability, essential for a stable
industrial and consumer market environment as well as to hedge against geopolitical risks on a macro
level (local and secured supply). Additionally, wind energy is generally not affected by fuel price
volatility; and
Cost competitiveness: Wind energy is both scalable and cost competitive compared to other
renewables in many parts of the world. The cost of energy from wind is one of the closest of all
renewables to reaching grid parity. Furthermore policy incentives support robust growth in key
markets offering stable lifecycle power costs for utilities.
Customer trends
The key customers and wind energy asset owners are independent power producers (“IPPs”), utilities and
general industrial companies. IPPs accounted for 69% of the global asset base, utilities for 10% and others for 21%
in 2014 (Source: MAKE Consulting Ownership, 2015). This compares to 60% for IPPs, 39% for utilities and 1% for
others in 2013 (Source: MAKE Consulting Ownership, 2014). The increasing share of professional customers
within wind farm owners leads to the industrialization of the supply chain and an increased focus on quality and
Source: MAKE Consulting Outlook, 2015
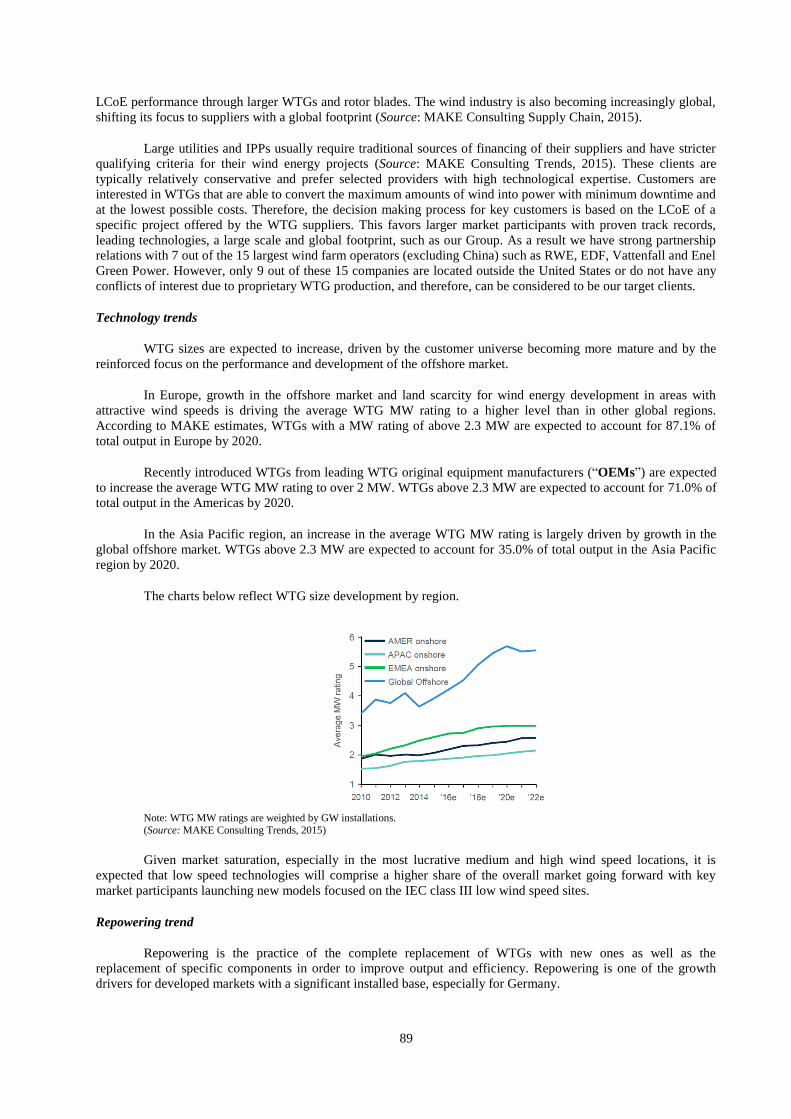
89
LCoE performance through larger WTGs and rotor blades. The wind industry is also becoming increasingly global,
shifting its focus to suppliers with a global footprint (Source: MAKE Consulting Supply Chain, 2015).
Large utilities and IPPs usually require traditional sources of financing of their suppliers and have stricter
qualifying criteria for their wind energy projects (Source: MAKE Consulting Trends, 2015). These clients are
typically relatively conservative and prefer selected providers with high technological expertise. Customers are
interested in WTGs that are able to convert the maximum amounts of wind into power with minimum downtime and
at the lowest possible costs. Therefore, the decision making process for key customers is based on the LCoE of a
specific project offered by the WTG suppliers. This favors larger market participants with proven track records,
leading technologies, a large scale and global footprint, such as our Group. As a result we have strong partnership
relations with 7 out of the 15 largest wind farm operators (excluding China) such as RWE, EDF, Vattenfall and Enel
Green Power. However, only 9 out of these 15 companies are located outside the United States or do not have any
conflicts of interest due to proprietary WTG production, and therefore, can be considered to be our target clients.
Technology trends
WTG sizes are expected to increase, driven by the customer universe becoming more mature and by the
reinforced focus on the performance and development of the offshore market.
In Europe, growth in the offshore market and land scarcity for wind energy development in areas with
attractive wind speeds is driving the average WTG MW rating to a higher level than in other global regions.
According to MAKE estimates, WTGs with a MW rating of above 2.3 MW are expected to account for 87.1% of
total output in Europe by 2020.
Recently introduced WTGs from leading WTG original equipment manufacturers (“OEMs”) are expected
to increase the average WTG MW rating to over 2 MW. WTGs above 2.3 MW are expected to account for 71.0% of
total output in the Americas by 2020.
In the Asia Pacific region, an increase in the average WTG MW rating is largely driven by growth in the
global offshore market. WTGs above 2.3 MW are expected to account for 35.0% of total output in the Asia Pacific
region by 2020.
The charts below reflect WTG size development by region.
Note: WTG MW ratings are weighted by GW installations.
(Source: MAKE Consulting Trends, 2015)
Given market saturation, especially in the most lucrative medium and high wind speed locations, it is
expected that low speed technologies will comprise a higher share of the overall market going forward with key
market participants launching new models focused on the IEC class III low wind speed sites.
Repowering trend
Repowering is the practice of the complete replacement of WTGs with new ones as well as the
replacement of specific components in order to improve output and efficiency. Repowering is one of the growth
drivers for developed markets with a significant installed base, especially for Germany.
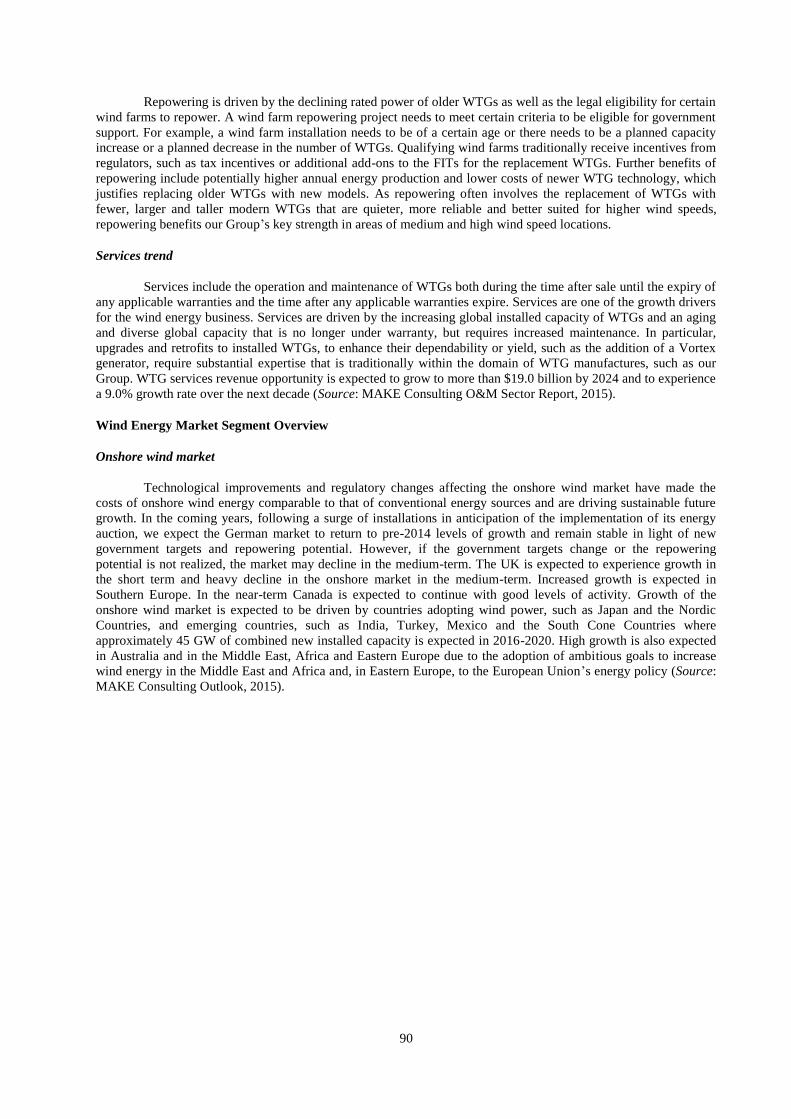
90
Repowering is driven by the declining rated power of older WTGs as well as the legal eligibility for certain
wind farms to repower. A wind farm repowering project needs to meet certain criteria to be eligible for government
support. For example, a wind farm installation needs to be of a certain age or there needs to be a planned capacity
increase or a planned decrease in the number of WTGs. Qualifying wind farms traditionally receive incentives from
regulators, such as tax incentives or additional add-ons to the FITs for the replacement WTGs. Further benefits of
repowering include potentially higher annual energy production and lower costs of newer WTG technology, which
justifies replacing older WTGs with new models. As repowering often involves the replacement of WTGs with
fewer, larger and taller modern WTGs that are quieter, more reliable and better suited for higher wind speeds,
repowering benefits our Group’s key strength in areas of medium and high wind speed locations.
Services trend
Services include the operation and maintenance of WTGs both during the time after sale until the expiry of
any applicable warranties and the time after any applicable warranties expire. Services are one of the growth drivers
for the wind energy business. Services are driven by the increasing global installed capacity of WTGs and an aging
and diverse global capacity that is no longer under warranty, but requires increased maintenance. In particular,
upgrades and retrofits to installed WTGs, to enhance their dependability or yield, such as the addition of a Vortex
generator, require substantial expertise that is traditionally within the domain of WTG manufactures, such as our
Group. WTG services revenue opportunity is expected to grow to more than $19.0 billion by 2024 and to experience
a 9.0% growth rate over the next decade (Source: MAKE Consulting O&M Sector Report, 2015).
Wind Energy Market Segment Overview
Onshore wind market
Technological improvements and regulatory changes affecting the onshore wind market have made the
costs of onshore wind energy comparable to that of conventional energy sources and are driving sustainable future
growth. In the coming years, following a surge of installations in anticipation of the implementation of its energy
auction, we expect the German market to return to pre-2014 levels of growth and remain stable in light of new
government targets and repowering potential. However, if the government targets change or the repowering
potential is not realized, the market may decline in the medium-term. The UK is expected to experience growth in
the short term and heavy decline in the onshore market in the medium-term. Increased growth is expected in
Southern Europe. In the near-term Canada is expected to continue with good levels of activity. Growth of the
onshore wind market is expected to be driven by countries adopting wind power, such as Japan and the Nordic
Countries, and emerging countries, such as India, Turkey, Mexico and the South Cone Countries where
approximately 45 GW of combined new installed capacity is expected in 2016-2020. High growth is also expected
in Australia and in the Middle East, Africa and Eastern Europe due to the adoption of ambitious goals to increase
wind energy in the Middle East and Africa and, in Eastern Europe, to the European Union’s energy policy (Source:
MAKE Consulting Outlook, 2015).
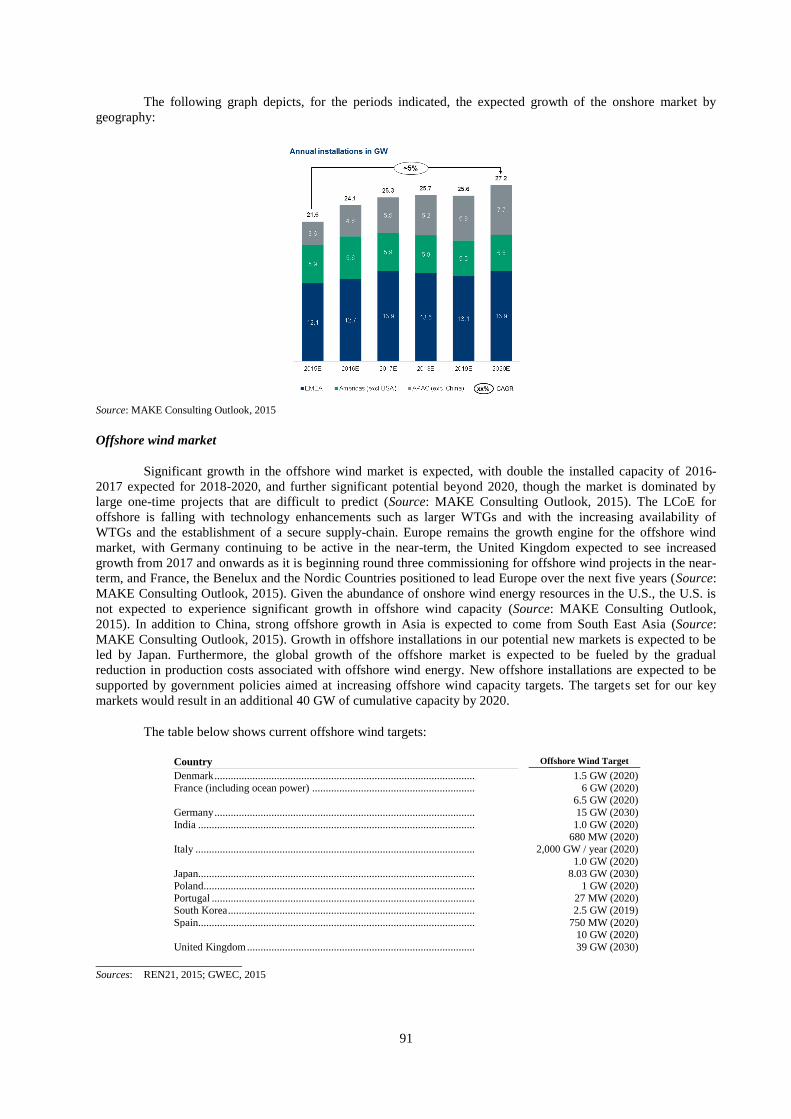
91
The following graph depicts, for the periods indicated, the expected growth of the onshore market by
geography:
Source: MAKE Consulting Outlook, 2015
Offshore wind market
Significant growth in the offshore wind market is expected, with double the installed capacity of 2016-
2017 expected for 2018-2020, and further significant potential beyond 2020, though the market is dominated by
large one-time projects that are difficult to predict (Source: MAKE Consulting Outlook, 2015). The LCoE for
offshore is falling with technology enhancements such as larger WTGs and with the increasing availability of
WTGs and the establishment of a secure supply-chain. Europe remains the growth engine for the offshore wind
market, with Germany continuing to be active in the near-term, the United Kingdom expected to see increased
growth from 2017 and onwards as it is beginning round three commissioning for offshore wind projects in the near-
term, and France, the Benelux and the Nordic Countries positioned to lead Europe over the next five years (Source:
MAKE Consulting Outlook, 2015). Given the abundance of onshore wind energy resources in the U.S., the U.S. is
not expected to experience significant growth in offshore wind capacity (Source: MAKE Consulting Outlook,
2015). In addition to China, strong offshore growth in Asia is expected to come from South East Asia (Source:
MAKE Consulting Outlook, 2015). Growth in offshore installations in our potential new markets is expected to be
led by Japan. Furthermore, the global growth of the offshore market is expected to be fueled by the gradual
reduction in production costs associated with offshore wind energy. New offshore installations are expected to be
supported by government policies aimed at increasing offshore wind capacity targets. The targets set for our key
markets would result in an additional 40 GW of cumulative capacity by 2020.
The table below shows current offshore wind targets:
Country Offshore Wind Target
Denmark ................................................................................................ 1.5 GW (2020)
France (including ocean power) ............................................................ 6 GW (2020)
Germany ................................................................................................
6.5 GW (2020)
15 GW (2030)
India ...................................................................................................... 1.0 GW (2020)
Italy .......................................................................................................
680 MW (2020)
2,000 GW / year (2020)
Japan......................................................................................................
1.0 GW (2020)
8.03 GW (2030)
Poland .................................................................................................... 1 GW (2020)
Portugal ................................................................................................. 27 MW (2020) South Korea ........................................................................................... 2.5 GW (2019)
Spain...................................................................................................... 750 MW (2020)
United Kingdom ....................................................................................
10 GW (2020)
39 GW (2030)
______________________ Sources: REN21, 2015; GWEC, 2015
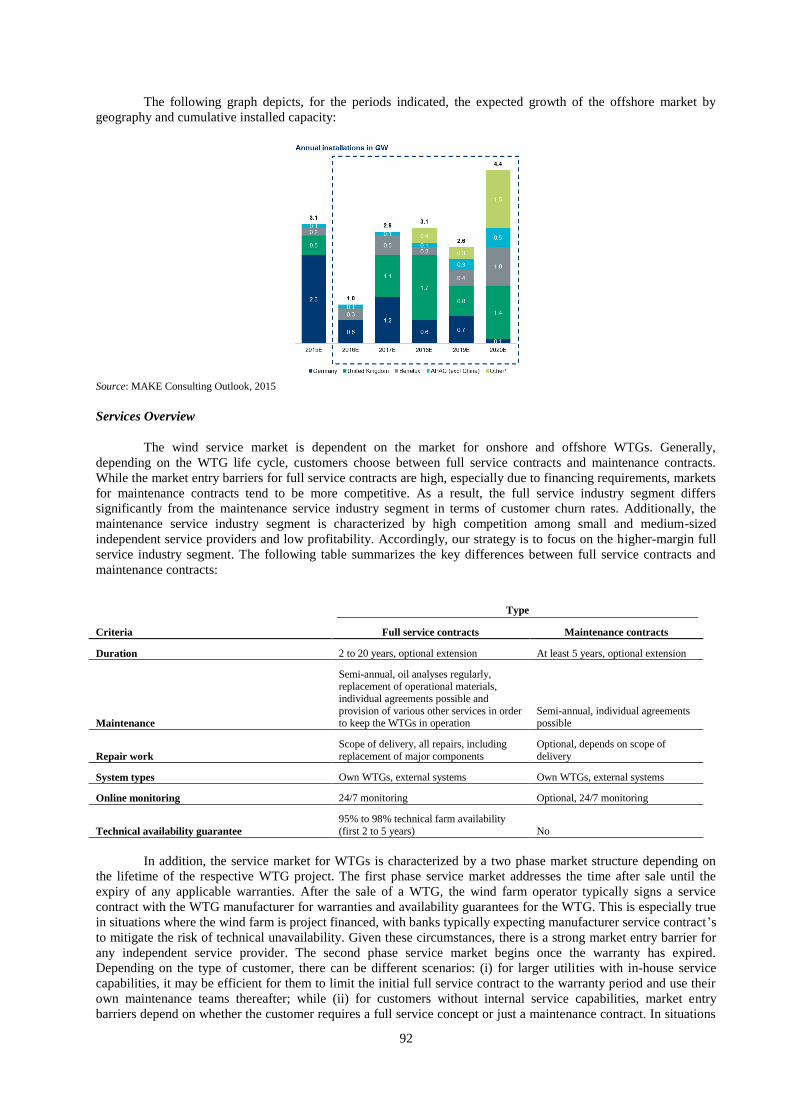
92
The following graph depicts, for the periods indicated, the expected growth of the offshore market by
geography and cumulative installed capacity:
Source: MAKE Consulting Outlook, 2015
Services Overview
The wind service market is dependent on the market for onshore and offshore WTGs. Generally,
depending on the WTG life cycle, customers choose between full service contracts and maintenance contracts.
While the market entry barriers for full service contracts are high, especially due to financing requirements, markets
for maintenance contracts tend to be more competitive. As a result, the full service industry segment differs
significantly from the maintenance service industry segment in terms of customer churn rates. Additionally, the
maintenance service industry segment is characterized by high competition among small and medium-sized
independent service providers and low profitability. Accordingly, our strategy is to focus on the higher-margin full
service industry segment. The following table summarizes the key differences between full service contracts and
maintenance contracts:
Type
Criteria Full service contracts Maintenance contracts
Duration 2 to 20 years, optional extension At least 5 years, optional extension
Maintenance
Semi-annual, oil analyses regularly, replacement of operational materials,
individual agreements possible and
provision of various other services in order to keep the WTGs in operation
Semi-annual, individual agreements possible
Repair work
Scope of delivery, all repairs, including
replacement of major components
Optional, depends on scope of
delivery
System types Own WTGs, external systems Own WTGs, external systems
Online monitoring 24/7 monitoring Optional, 24/7 monitoring
Technical availability guarantee
95% to 98% technical farm availability
(first 2 to 5 years) No
In addition, the service market for WTGs is characterized by a two phase market structure depending on
the lifetime of the respective WTG project. The first phase service market addresses the time after sale until the
expiry of any applicable warranties. After the sale of a WTG, the wind farm operator typically signs a service
contract with the WTG manufacturer for warranties and availability guarantees for the WTG. This is especially true
in situations where the wind farm is project financed, with banks typically expecting manufacturer service contract’s
to mitigate the risk of technical unavailability. Given these circumstances, there is a strong market entry barrier for
any independent service provider. The second phase service market begins once the warranty has expired.
Depending on the type of customer, there can be different scenarios: (i) for larger utilities with in-house service
capabilities, it may be efficient for them to limit the initial full service contract to the warranty period and use their
own maintenance teams thereafter; while (ii) for customers without internal service capabilities, market entry
barriers depend on whether the customer requires a full service concept or just a maintenance contract. In situations
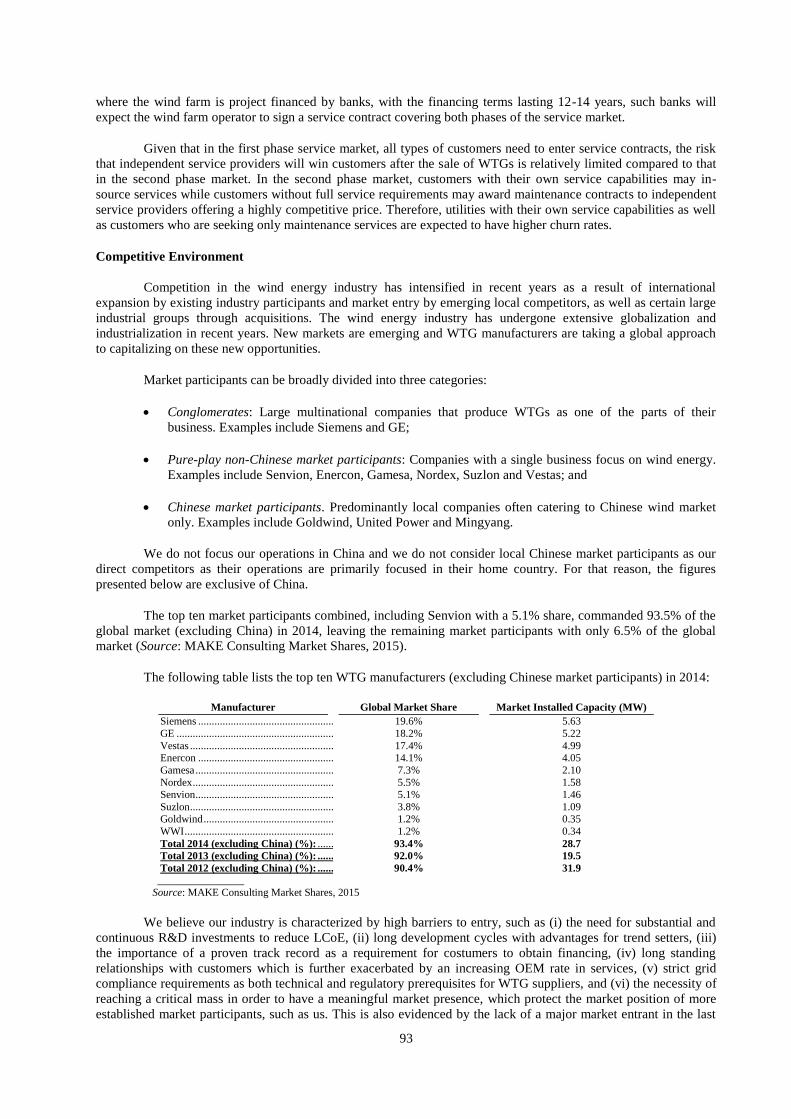
93
where the wind farm is project financed by banks, with the financing terms lasting 12-14 years, such banks will
expect the wind farm operator to sign a service contract covering both phases of the service market.
Given that in the first phase service market, all types of customers need to enter service contracts, the risk
that independent service providers will win customers after the sale of WTGs is relatively limited compared to that
in the second phase market. In the second phase market, customers with their own service capabilities may in-
source services while customers without full service requirements may award maintenance contracts to independent
service providers offering a highly competitive price. Therefore, utilities with their own service capabilities as well
as customers who are seeking only maintenance services are expected to have higher churn rates.
Competitive Environment
Competition in the wind energy industry has intensified in recent years as a result of international
expansion by existing industry participants and market entry by emerging local competitors, as well as certain large
industrial groups through acquisitions. The wind energy industry has undergone extensive globalization and
industrialization in recent years. New markets are emerging and WTG manufacturers are taking a global approach
to capitalizing on these new opportunities.
Market participants can be broadly divided into three categories:
Conglomerates: Large multinational companies that produce WTGs as one of the parts of their
business. Examples include Siemens and GE;
Pure-play non-Chinese market participants: Companies with a single business focus on wind energy.
Examples include Senvion, Enercon, Gamesa, Nordex, Suzlon and Vestas; and
Chinese market participants. Predominantly local companies often catering to Chinese wind market
only. Examples include Goldwind, United Power and Mingyang.
We do not focus our operations in China and we do not consider local Chinese market participants as our
direct competitors as their operations are primarily focused in their home country. For that reason, the figures
presented below are exclusive of China.
The top ten market participants combined, including Senvion with a 5.1% share, commanded 93.5% of the
global market (excluding China) in 2014, leaving the remaining market participants with only 6.5% of the global
market (Source: MAKE Consulting Market Shares, 2015).
The following table lists the top ten WTG manufacturers (excluding Chinese market participants) in 2014:
Manufacturer Global Market Share Market Installed Capacity (MW)
Siemens .................................................................................................. 19.6% 5.63
GE .......................................................................................................... 18.2% 5.22
Vestas ..................................................................................................... 17.4% 4.99 Enercon .................................................................................................. 14.1% 4.05
Gamesa ................................................................................................... 7.3% 2.10
Nordex .................................................................................................... 5.5% 1.58 Senvion ................................................................................................... 5.1% 1.46
Suzlon ..................................................................................................... 3.8% 1.09 Goldwind ................................................................................................ 1.2% 0.35
WWI ....................................................................................................... 1.2% 0.34
Total 2014 (excluding China) (%): ...................................................... 93.4% 28.7
Total 2013 (excluding China) (%): ...................................................... 92.0% 19.5
Total 2012 (excluding China) (%): ...................................................... 90.4% 31.9
________________ Source: MAKE Consulting Market Shares, 2015
We believe our industry is characterized by high barriers to entry, such as (i) the need for substantial and
continuous R&D investments to reduce LCoE, (ii) long development cycles with advantages for trend setters, (iii)
the importance of a proven track record as a requirement for costumers to obtain financing, (iv) long standing
relationships with customers which is further exacerbated by an increasing OEM rate in services, (v) strict grid
compliance requirements as both technical and regulatory prerequisites for WTG suppliers, and (vi) the necessity of
reaching a critical mass in order to have a meaningful market presence, which protect the market position of more
established market participants, such as us. This is also evidenced by the lack of a major market entrant in the last
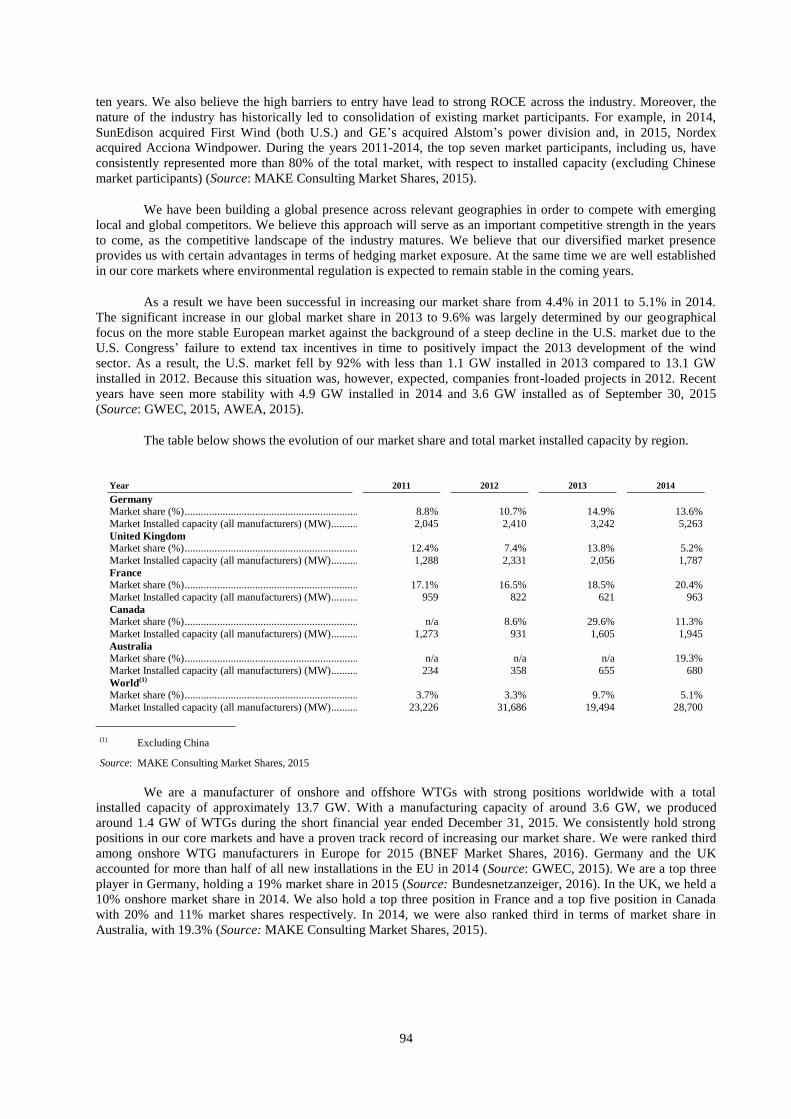
94
ten years. We also believe the high barriers to entry have lead to strong ROCE across the industry. Moreover, the
nature of the industry has historically led to consolidation of existing market participants. For example, in 2014,
SunEdison acquired First Wind (both U.S.) and GE’s acquired Alstom’s power division and, in 2015, Nordex
acquired Acciona Windpower. During the years 2011-2014, the top seven market participants, including us, have
consistently represented more than 80% of the total market, with respect to installed capacity (excluding Chinese
market participants) (Source: MAKE Consulting Market Shares, 2015).
We have been building a global presence across relevant geographies in order to compete with emerging
local and global competitors. We believe this approach will serve as an important competitive strength in the years
to come, as the competitive landscape of the industry matures. We believe that our diversified market presence
provides us with certain advantages in terms of hedging market exposure. At the same time we are well established
in our core markets where environmental regulation is expected to remain stable in the coming years.
As a result we have been successful in increasing our market share from 4.4% in 2011 to 5.1% in 2014.
The significant increase in our global market share in 2013 to 9.6% was largely determined by our geographical
focus on the more stable European market against the background of a steep decline in the U.S. market due to the
U.S. Congress’ failure to extend tax incentives in time to positively impact the 2013 development of the wind
sector. As a result, the U.S. market fell by 92% with less than 1.1 GW installed in 2013 compared to 13.1 GW
installed in 2012. Because this situation was, however, expected, companies front-loaded projects in 2012. Recent
years have seen more stability with 4.9 GW installed in 2014 and 3.6 GW installed as of September 30, 2015
(Source: GWEC, 2015, AWEA, 2015).
The table below shows the evolution of our market share and total market installed capacity by region.
Year 2011 2012 2013 2014
Germany
Market share (%) .................................................................................... 8.8% 10.7% 14.9% 13.6%
Market Installed capacity (all manufacturers) (MW) .............................. 2,045 2,410 3,242 5,263
United Kingdom
Market share (%) .................................................................................... 12.4% 7.4% 13.8% 5.2%
Market Installed capacity (all manufacturers) (MW) .............................. 1,288 2,331 2,056 1,787
France Market share (%) .................................................................................... 17.1% 16.5% 18.5% 20.4%
Market Installed capacity (all manufacturers) (MW) .............................. 959 822 621 963
Canada
Market share (%) .................................................................................... n/a 8.6% 29.6% 11.3%
Market Installed capacity (all manufacturers) (MW) .............................. 1,273 931 1,605 1,945
Australia
Market share (%) .................................................................................... n/a n/a n/a 19.3%
Market Installed capacity (all manufacturers) (MW) .............................. 234 358 655 680
World(1)
Market share (%) .................................................................................... 3.7% 3.3% 9.7% 5.1%
Market Installed capacity (all manufacturers) (MW) .............................. 23,226 31,686 19,494 28,700
_____________________
(1) Excluding China
Source: MAKE Consulting Market Shares, 2015
We are a manufacturer of onshore and offshore WTGs with strong positions worldwide with a total
installed capacity of approximately 13.7 GW. With a manufacturing capacity of around 3.6 GW, we produced
around 1.4 GW of WTGs during the short financial year ended December 31, 2015. We consistently hold strong
positions in our core markets and have a proven track record of increasing our market share. We were ranked third
among onshore WTG manufacturers in Europe for 2015 (BNEF Market Shares, 2016). Germany and the UK
accounted for more than half of all new installations in the EU in 2014 (Source: GWEC, 2015). We are a top three
player in Germany, holding a 19% market share in 2015 (Source: Bundesnetzanzeiger, 2016). In the UK, we held a
10% onshore market share in 2014. We also hold a top three position in France and a top five position in Canada
with 20% and 11% market shares respectively. In 2014, we were also ranked third in terms of market share in
Australia, with 19.3% (Source: MAKE Consulting Market Shares, 2015).
95
BUSINESS
Except as otherwise stated, references in the following section to “we,” “us,” “our” or the “Group” are,
to Senvion and its consolidated subsidiaries. Except as otherwise stated, references in the following section to the
“Company” are to Senvion S.A. and its consolidated subsidiaries.
Overview
We are a leading global developer and manufacturer of onshore and offshore WTGs, operating in twenty
countries with approximately 13.7 GW of cumulative installed capacity worldwide as of December 31, 2015. We
hold a strong competitive position in our core markets of Germany, the UK, France, Australia and Canada. We are
headquartered in Hamburg, Germany.
In the short financial year ended December 31, 2015, we generated revenues of €1,683.0 million, a 14.8%
increase compared to €1,465.4 million in the nine-month period ended December 31, 2014. In the short financial
year ended December 31, 2015, our Adjusted EBITDA increased 59.6% to €178.0 million (10.6% Adjusted
EBITDA margin) from €111.5 million (7.6% Adjusted EBITDA margin) in the nine-month period ended December
31, 2014. As of December 31, 2015, our total order book (net firm orders for WTGs and signed contracts for
WTGs), including O&M service contracts, amounted to €5,407.3 million, as compared to €4,900.2 million as of
December 31, 2014.
For the year ended December 31, 2015, the Company’s pro forma revenues and adjusted pro forma
EBITDA amounted to €2,139.5 million and €210.4 million, respectively, for the period from January 1, 2015 to
December 31, 2015.
We develop, manufacture, assemble, install and market a competitive range of technologically advanced
WTGs with rated outputs ranging from 2 to 6.2 MW and rotor diameters ranging from 82 to 152 meters, covering
all wind classes in both onshore and offshore markets for a broad base of customers, including seven of the top
twelve global wind utility companies (excluding Chinese market participants) such as RWE, EDF, Vattenfall and
Enel, large-scale wind farm developers and leading independent producers of renewable power projects. Our
revenues from the sale of onshore and offshore WTGs comprised 89.3% of our revenues for the short financial year
ended December 31, 2015.
In addition to WTG development, manufacturing, assembly and installation, we have a large and fast-
growing service book of O&M service contracts with an average length for our active contracts of approximately 10
years as of December 31, 2015, covering WTGs with a total installed capacity of approximately 10.2 GW
representing 74.5% of our installed fleet as of this date. We offer our customers project-specific solutions in the
fields of transportation and installation as well as individually tailored service and maintenance options. Our O&M
services and other revenues comprised 10.7% of our revenues for the short financial year ended December 31, 2015.
In the wind farm development and operations value chain, we focus primarily on assembly and installation
of the wind turbines as well as the operation and maintenance phase and do not primarily engage in project
development or wind farm ownership. Of the components contained in our WTGs, we produce a portion of our
blades and assemble all of our nacelles internally and source other components from a broad network of more than
1,400 closely integrated suppliers. Our WTGs and blades are designed at our R&D centers in Germany and our
newly established R&D center in India and manufactured and assembled at our production facilities in Germany and
Portugal. During the short financial year ended December 31, 2015, our installations of WTGs amounted to
approximately 1.4 GW. As one of the pioneers in the wind industry, we have gained extensive experience from the
assembly and installation of approximately 6,625 WTGs as of December 31, 2015. This experience, in combination
with our engineering capabilities, has historically enabled us to develop a diverse range of WTG technologies and
establish our competitive position in the market. For instance, we were a trend setter in developing and successfully
installing larger MW rated WTGs, allowing us to significantly expand our market share in our core European
markets where demand for 3 MW and larger WTGs has been increasing, partially due to limited land available for
wind farms and other environmental constraints.
In addition to our German engineering heritage, we have an established geographical presence and
longstanding customer relationships in our other European markets, which, together with Germany, accounted for
approximately 76.5% of our cumulative installed capacity as of December 31, 2015. Over the years we have
successfully entered and expanded our operations into North America, Australia and Asia, which accounted for
approximately 23.5% of our cumulative installed capacity as of December 31, 2015.
96
We believe our business model is well-positioned to capture future growth in the wind energy sector,
targeting both the onshore and offshore markets. With the introduction of our newest 3.4M140 low wind turbine, we
have a complete portfolio of WTGs that allows us to target all wind classes. We operate in countries such as
Germany, France, Canada and Australia, where the regulatory environment and incentive schemes are expected to
remain supportive. In addition, we have a clear focus on entering and realizing market potential in new markets,
such as India and Turkey, as well as markets in Latin America and Nordic Countries, which offer highly attractive
growth potential and where we believe our products are particularly well suited. Moreover, because increased
demand for WTGs triggers increased demand for WTG-related services, the growth of the WTG product market
drives the growth of the WTG service market. As a provider of WTGs and WTG-related services, we therefore
benefit from the growth of both WTG market segments. Our business model has already proven that it is capable of
capturing growth opportunities. As of December 31, 2015, our installed capacity has reached approximately 13.7
GW representing a 14.2% increase from 12.0 GW as of December 31, 2014.
We have a lean and flexible business model, with an in-house focus on high value added activities, which
is characterized by a high proportion of variable costs and an average depreciation and amortization to revenues
ratio which we believe to be lower than that of our competitors. Our cost structure allows us to adapt quickly to
market dynamics, effectively manage capital commitments and support our cash flow generation in more
challenging market environments. We focus our operations on three core activities: WTG assembly, O&M services
and WTG R&D. We also have substantial control over mission critical components, such as blades, approximately
two-thirds of which were manufactured in-house during the short financial year ended December 31, 2015
compared to approximately 15% in 2010. We maintain our focus on sourcing externally other more standardized
components from a broad range of more than 1,400 suppliers, helping us enhance our lean operating business
model.
We have a proven track record of solid financial performance, characterized by strong operating
profitability even in years of weaker demand for WTGs when most of the sector experienced substantial operating
losses. Our revenue base is diversified due to our geographical diversification in addition to our product split
between revenues from the sale of onshore WTGs, revenues from the sale of offshore WTGs and O&M services
together with other revenues, comprising 85.1%, 4.2% and 10.7%, respectively, of our revenues for the short
financial year ended December 31, 2015. Over the financial years 2012/2013, 2013/2014 and 2014/2015 and the
short financial year ended December 31, 2015, we have experienced overall positive Adjusted EBIT and Adjusted
EBITDA trends. Our Adjusted EBIT grew at a CAGR of 36.6% over the financial years 2012/2013, 2013/2014 and
2014/2015 and, during the same period, our Adjusted EBITDA grew at a CAGR of 27.0%. In the short financial
year ended December 31, 2015, our Adjusted EBIT and Adjusted EBITDA amounted to €136.3 million and €178.0
million, respectively, as compared to €72.3 million and €111.5 million, respectively, for the nine-month period
ended December 31, 2014.
Our History
The Company was founded on April 4, 2014 and acquired by Centerbridge Funds for purposes of
facilitating the Acquisition of Senvion from the Suzlon Group. Prior to the Acquisition, which was completed on
April 29, 2015, the Company had no operations and no material assets or liabilities.
Senvion was founded under the name REpower Systems AG in 2000. In 2001, the companies Jacobs
Energie Gesellschaft mit beschränkter Haftung, BWU-Brandenburgische Wind- und Umwelttechnologien GmbH,
BWU - Anlagenfertigung und -service GmbH, Pro+Pro Energiesysteme GmbH & Co. KG, all of which were
founded in the 1990s were merged into REpower Systems AG. REpower Systems AG was listed on the new market
(Neuer Markt) of the Frankfurt Stock Exchange in 2002. In 2007, the Suzlon Group acquired 33.85% of REpower
Systems AG’s shares. In 2011, the legal form of REpower Systems AG was changed to a European Company
(Societas Europea). Also in 2011, the Suzlon Group acquired 100% of REpower Systems SE’s shares and as a
consequence the shares of REpower Systems SE were delisted from the Frankfurt Stock Exchange. On January 20,
2014, REpower Systems SE was renamed to Senvion SE. Following the Acquisition, Senvion SE was transformed
into Senvion AG on June 25, 2015 and into Senvion GmbH on June 30, 2015.
Our Products
We develop, manufacture, assemble, install and market a competitive range of technologically advanced
WTGs, which are devices that transform wind’s kinetic energy into mechanical or electrical energy. A WTG is
comprised of a set of three rotor blades, a hub, a nacelle and a tower, each of which is described below.
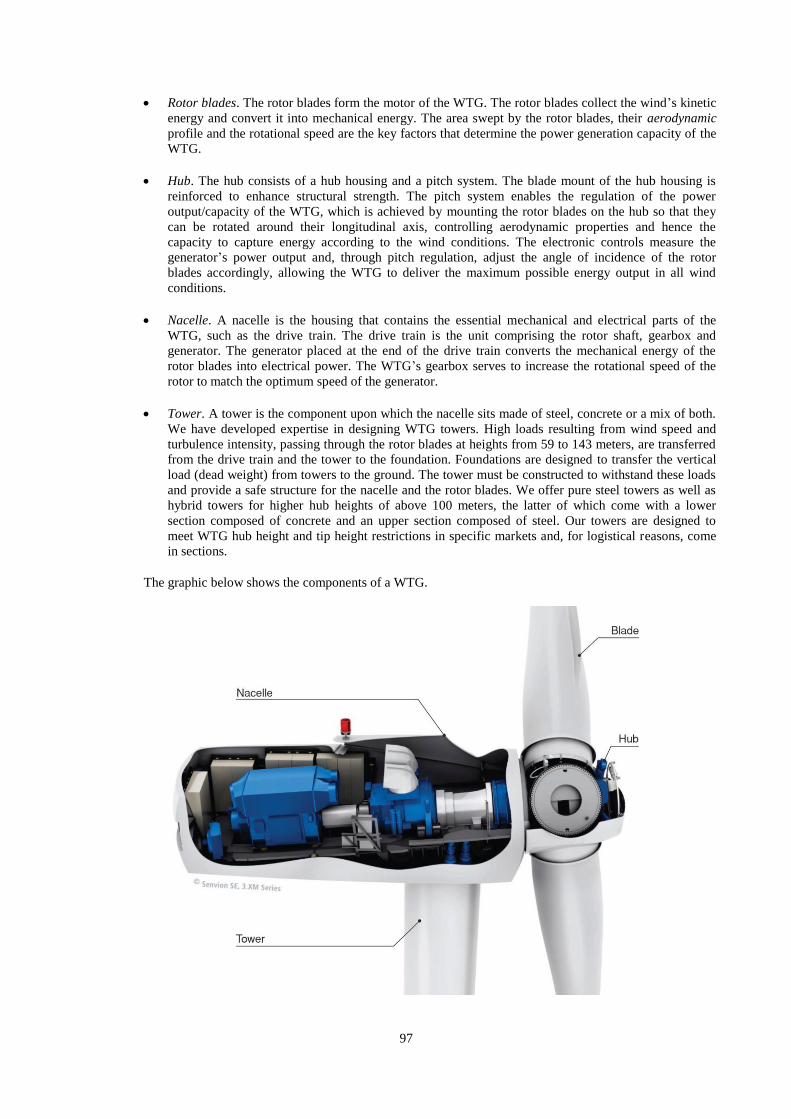
97
Rotor blades. The rotor blades form the motor of the WTG. The rotor blades collect the wind’s kinetic
energy and convert it into mechanical energy. The area swept by the rotor blades, their aerodynamic
profile and the rotational speed are the key factors that determine the power generation capacity of the
WTG.
Hub. The hub consists of a hub housing and a pitch system. The blade mount of the hub housing is
reinforced to enhance structural strength. The pitch system enables the regulation of the power
output/capacity of the WTG, which is achieved by mounting the rotor blades on the hub so that they
can be rotated around their longitudinal axis, controlling aerodynamic properties and hence the
capacity to capture energy according to the wind conditions. The electronic controls measure the
generator’s power output and, through pitch regulation, adjust the angle of incidence of the rotor
blades accordingly, allowing the WTG to deliver the maximum possible energy output in all wind
conditions.
Nacelle. A nacelle is the housing that contains the essential mechanical and electrical parts of the
WTG, such as the drive train. The drive train is the unit comprising the rotor shaft, gearbox and
generator. The generator placed at the end of the drive train converts the mechanical energy of the
rotor blades into electrical power. The WTG’s gearbox serves to increase the rotational speed of the
rotor to match the optimum speed of the generator.
Tower. A tower is the component upon which the nacelle sits made of steel, concrete or a mix of both.
We have developed expertise in designing WTG towers. High loads resulting from wind speed and
turbulence intensity, passing through the rotor blades at heights from 59 to 143 meters, are transferred
from the drive train and the tower to the foundation. Foundations are designed to transfer the vertical
load (dead weight) from towers to the ground. The tower must be constructed to withstand these loads
and provide a safe structure for the nacelle and the rotor blades. We offer pure steel towers as well as
hybrid towers for higher hub heights of above 100 meters, the latter of which come with a lower
section composed of concrete and an upper section composed of steel. Our towers are designed to
meet WTG hub height and tip height restrictions in specific markets and, for logistical reasons, come
in sections.
The graphic below shows the components of a WTG.
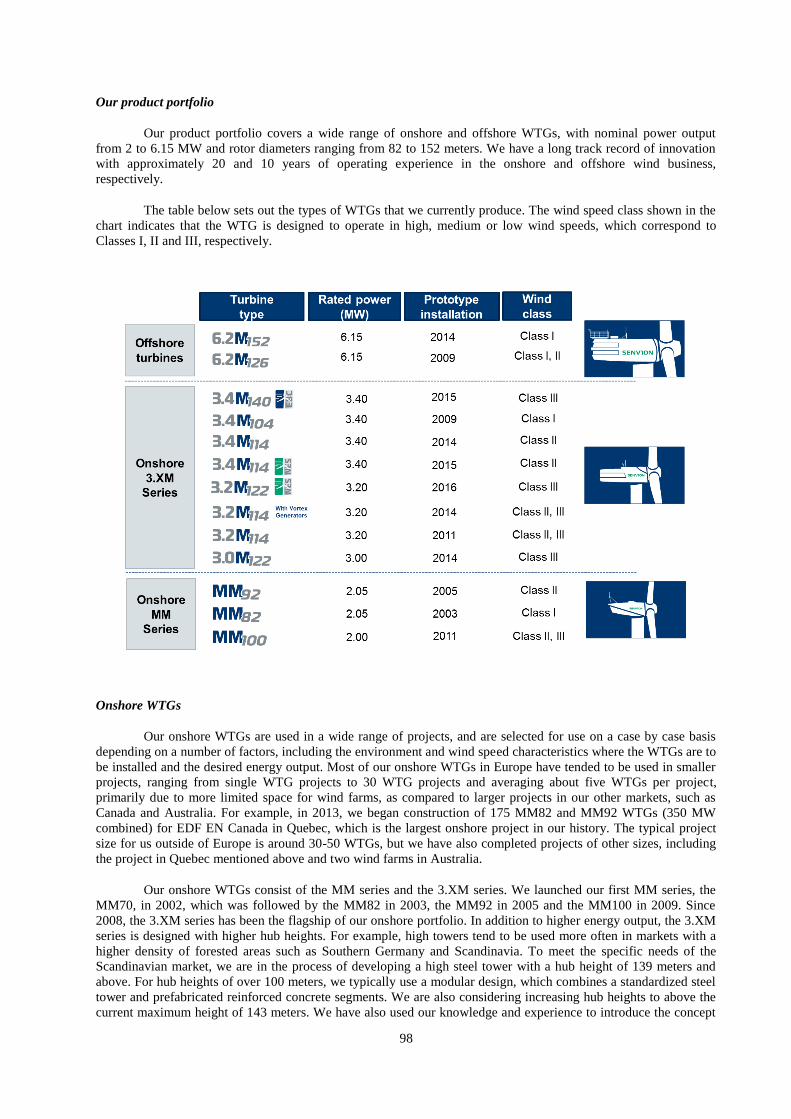
98
Our product portfolio
Our product portfolio covers a wide range of onshore and offshore WTGs, with nominal power output
from 2 to 6.15 MW and rotor diameters ranging from 82 to 152 meters. We have a long track record of innovation
with approximately 20 and 10 years of operating experience in the onshore and offshore wind business,
respectively.
The table below sets out the types of WTGs that we currently produce. The wind speed class shown in the
chart indicates that the WTG is designed to operate in high, medium or low wind speeds, which correspond to
Classes I, II and III, respectively.
Onshore WTGs
Our onshore WTGs are used in a wide range of projects, and are selected for use on a case by case basis
depending on a number of factors, including the environment and wind speed characteristics where the WTGs are to
be installed and the desired energy output. Most of our onshore WTGs in Europe have tended to be used in smaller
projects, ranging from single WTG projects to 30 WTG projects and averaging about five WTGs per project,
primarily due to more limited space for wind farms, as compared to larger projects in our other markets, such as
Canada and Australia. For example, in 2013, we began construction of 175 MM82 and MM92 WTGs (350 MW
combined) for EDF EN Canada in Quebec, which is the largest onshore project in our history. The typical project
size for us outside of Europe is around 30-50 WTGs, but we have also completed projects of other sizes, including
the project in Quebec mentioned above and two wind farms in Australia.
Our onshore WTGs consist of the MM series and the 3.XM series. We launched our first MM series, the
MM70, in 2002, which was followed by the MM82 in 2003, the MM92 in 2005 and the MM100 in 2009. Since
2008, the 3.XM series has been the flagship of our onshore portfolio. In addition to higher energy output, the 3.XM
series is designed with higher hub heights. For example, high towers tend to be used more often in markets with a
higher density of forested areas such as Southern Germany and Scandinavia. To meet the specific needs of the
Scandinavian market, we are in the process of developing a high steel tower with a hub height of 139 meters and
above. For hub heights of over 100 meters, we typically use a modular design, which combines a standardized steel
tower and prefabricated reinforced concrete segments. We are also considering increasing hub heights to above the
current maximum height of 143 meters. We have also used our knowledge and experience to introduce the concept
99
of Vortex generators, which are aerodynamic devices attached to rotor blades used to modify wind flow around the
blade and enhance efficiency, in our 3.XM series in order to increase the efficiency of our rotor blades. The 3.XM
series WTGs are assembled using optimized logistic practices. For example, the drive train is transported separately.
In addition to our standard MM and 3.XM portfolio described below, we also offer our customers project-
specific towers, provide more cost-efficient solutions for specific sites and address administrative requirements such
as hub height restrictions.
MM series
Our current MM series consists of the MM82, MM92 and MM100.
MM82. The MM82 model has a nominal power output of 2.05 MW and is specifically designed for
high wind speed locations. With hub heights between 59 and 80 meters and a rotor diameter of 82
meters, the MM82 is particularly suitable for locations with height restrictions.
MM92. The MM92 model has a nominal power output of 2.05 MW and is our top-selling WTG model
to date. Its hub height of 68 to 100 meters and large rotor diameter of 92.5 meters make it better suited
for locations with high to medium wind speeds.
MM100. The MM100 model has a nominal power output of 2.0 MW. With hub heights of 75 to 100
meters and a rotor diameter of 100 meters, it is specifically designed for deployment in medium and
low wind speed locations.
As of December 31, 2015, we had installed approximately 4,377 WTGs of the MM series.
3.XM series
Our 3.XM series includes models 3.4M104, 3.4M114, 3.2M114VG and 3.0M122.
3.4M104. The 3.4M104 model has a nominal power output of 3.4 MW, hub heights ranging from 78
meters to 128 meters, a rotor diameter of 104 meters and is designed to operate in high wind speed
locations.
3.4M114. The 3.4M114 model has a nominal power output of 3.4 MW, hub heights up to 143 meters,
a rotor diameter of 114 meters and is designated to operate in medium wind speed locations.
3.2M114(VG). The 3.2M114 model can be produced with or without Vortex generators, has a nominal
power output of 3.17 MW to 3.2 MW, hub heights ranging from 93 to 143 meters, a rotor diameter of
114 meters and is designed to operate in medium and low wind speed locations.
3.0M122. The 3.0M122 model has a nominal power output of 3 MW, has a hub height of 139 meters,
a rotor diameter of 122 meters and is designed to operate in low wind speed locations.
3.4M140 - The 3.4M140 model has a nominal power output of 3 MW, has a hub height of 110 and 130
meters, a rotor diameter of 140 meters and is designed to operate in low wind speed locations
As of December 31, 2015, we had installed approximately 746 WTGs of the 3.XM series.
Offshore WTGs
Our offshore WTG portfolio consists of the 6.XM series. We began developing a 5 MW WTG in 2001 in
response to the low average rated power output of offshore WTGs at the time. As a result we were the first company
to successfully install and connect a 5 MW WTG to the grid. We installed our first offshore 5 MW WTG off the
Scottish coast in the wind farm Beatrice in 2006 and we have the largest 5 MW+ operating fleet (Source: BNEF
Company Report, 2015). Building on our experience in 5 MW WTGs, we developed our 6.XM WTGs. We
launched the 6.2M126 in 2008, which was the most powerful WTG in the industry by nominal output. In 2014, we
successfully installed and commissioned the prototype of the 6.2M152, which makes use of a larger rotor diameter,
resulting in a 20% rise in energy yields.
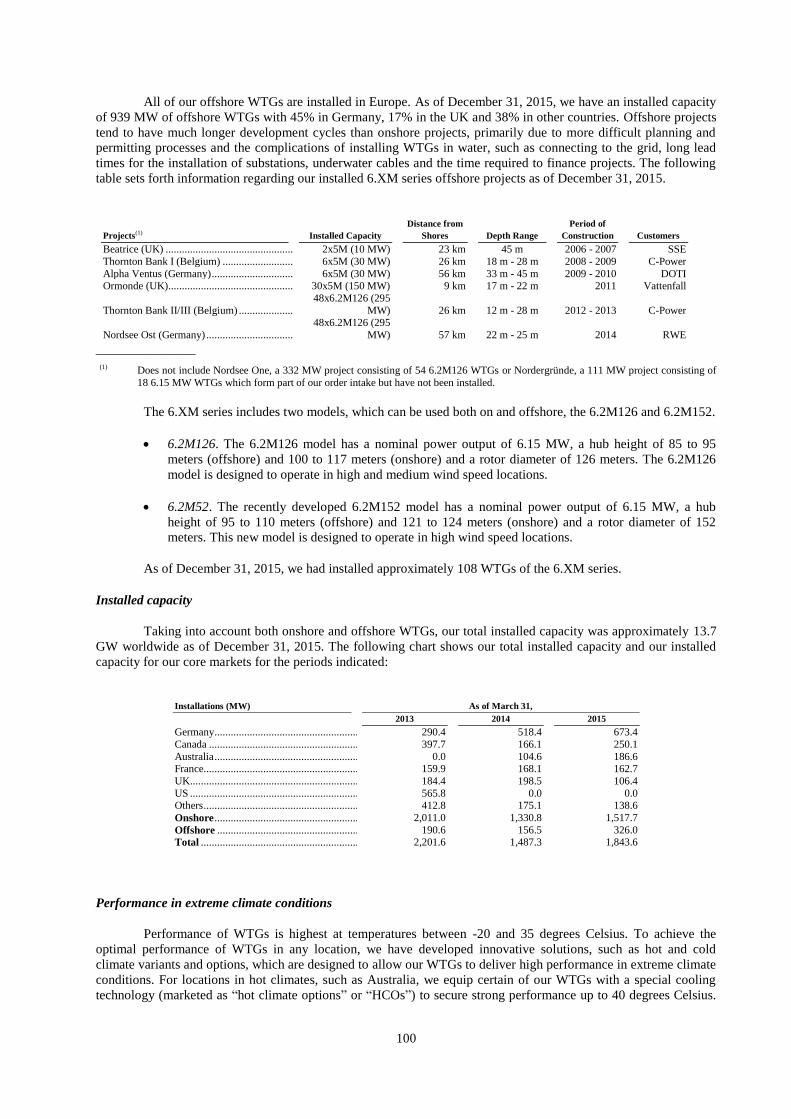
100
All of our offshore WTGs are installed in Europe. As of December 31, 2015, we have an installed capacity
of 939 MW of offshore WTGs with 45% in Germany, 17% in the UK and 38% in other countries. Offshore projects
tend to have much longer development cycles than onshore projects, primarily due to more difficult planning and
permitting processes and the complications of installing WTGs in water, such as connecting to the grid, long lead
times for the installation of substations, underwater cables and the time required to finance projects. The following
table sets forth information regarding our installed 6.XM series offshore projects as of December 31, 2015.
Projects(1) Installed Capacity
Distance from
Shores Depth Range
Period of
Construction Customers
Beatrice (UK) ........................................................................................ 2x5M (10 MW) 23 km 45 m 2006 - 2007 SSE
Thornton Bank I (Belgium) ................................................................... 6x5M (30 MW) 26 km 18 m - 28 m 2008 - 2009 C-Power
Alpha Ventus (Germany) ....................................................................... 6x5M (30 MW) 56 km 33 m - 45 m 2009 - 2010 DOTI Ormonde (UK)....................................................................................... 30x5M (150 MW) 9 km 17 m - 22 m 2011 Vattenfall
Thornton Bank II/III (Belgium) .............................................................
48x6.2M126 (295
MW) 26 km 12 m - 28 m 2012 - 2013 C-Power
Nordsee Ost (Germany) .........................................................................
48x6.2M126 (295
MW) 57 km 22 m - 25 m 2014 RWE
_______________
(1) Does not include Nordsee One, a 332 MW project consisting of 54 6.2M126 WTGs or Nordergründe, a 111 MW project consisting of
18 6.15 MW WTGs which form part of our order intake but have not been installed.
The 6.XM series includes two models, which can be used both on and offshore, the 6.2M126 and 6.2M152.
6.2M126. The 6.2M126 model has a nominal power output of 6.15 MW, a hub height of 85 to 95
meters (offshore) and 100 to 117 meters (onshore) and a rotor diameter of 126 meters. The 6.2M126
model is designed to operate in high and medium wind speed locations.
6.2M52. The recently developed 6.2M152 model has a nominal power output of 6.15 MW, a hub
height of 95 to 110 meters (offshore) and 121 to 124 meters (onshore) and a rotor diameter of 152
meters. This new model is designed to operate in high wind speed locations.
As of December 31, 2015, we had installed approximately 108 WTGs of the 6.XM series.
Installed capacity
Taking into account both onshore and offshore WTGs, our total installed capacity was approximately 13.7
GW worldwide as of December 31, 2015. The following chart shows our total installed capacity and our installed
capacity for our core markets for the periods indicated:
Installations (MW) As of March 31,
2013 2014 2015
Germany ...................................................... 290.4 518.4 673.4
Canada ........................................................ 397.7 166.1 250.1
Australia ...................................................... 0.0 104.6 186.6 France.......................................................... 159.9 168.1 162.7
UK............................................................... 184.4 198.5 106.4
US ............................................................... 565.8 0.0 0.0 Others .......................................................... 412.8 175.1 138.6
Onshore ...................................................... 2,011.0 1,330.8 1,517.7
Offshore ..................................................... 190.6 156.5 326.0
Total ........................................................... 2,201.6 1,487.3 1,843.6
Performance in extreme climate conditions
Performance of WTGs is highest at temperatures between -20 and 35 degrees Celsius. To achieve the
optimal performance of WTGs in any location, we have developed innovative solutions, such as hot and cold
climate variants and options, which are designed to allow our WTGs to deliver high performance in extreme climate
conditions. For locations in hot climates, such as Australia, we equip certain of our WTGs with a special cooling
technology (marketed as “hot climate options” or “HCOs”) to secure strong performance up to 40 degrees Celsius.
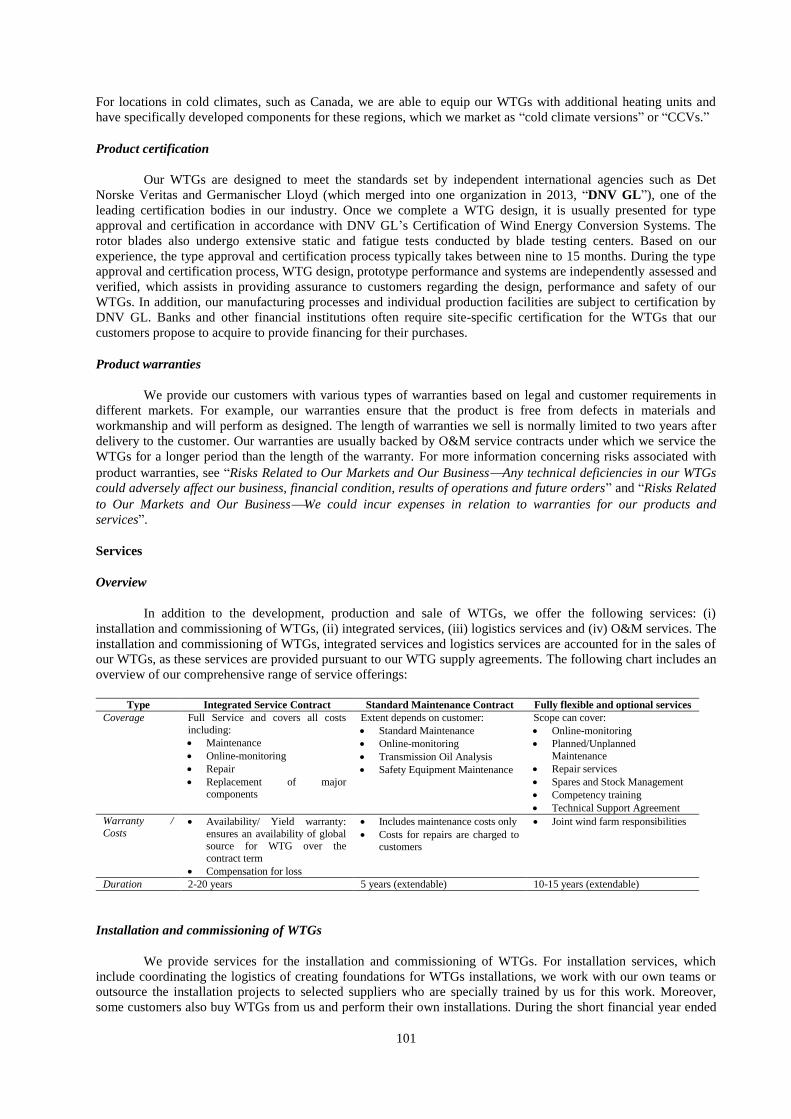
101
For locations in cold climates, such as Canada, we are able to equip our WTGs with additional heating units and
have specifically developed components for these regions, which we market as “cold climate versions” or “CCVs.”
Product certification
Our WTGs are designed to meet the standards set by independent international agencies such as Det
Norske Veritas and Germanischer Lloyd (which merged into one organization in 2013, “DNV GL”), one of the
leading certification bodies in our industry. Once we complete a WTG design, it is usually presented for type
approval and certification in accordance with DNV GL’s Certification of Wind Energy Conversion Systems. The
rotor blades also undergo extensive static and fatigue tests conducted by blade testing centers. Based on our
experience, the type approval and certification process typically takes between nine to 15 months. During the type
approval and certification process, WTG design, prototype performance and systems are independently assessed and
verified, which assists in providing assurance to customers regarding the design, performance and safety of our
WTGs. In addition, our manufacturing processes and individual production facilities are subject to certification by
DNV GL. Banks and other financial institutions often require site-specific certification for the WTGs that our
customers propose to acquire to provide financing for their purchases.
Product warranties
We provide our customers with various types of warranties based on legal and customer requirements in
different markets. For example, our warranties ensure that the product is free from defects in materials and
workmanship and will perform as designed. The length of warranties we sell is normally limited to two years after
delivery to the customer. Our warranties are usually backed by O&M service contracts under which we service the
WTGs for a longer period than the length of the warranty. For more information concerning risks associated with
product warranties, see “Risks Related to Our Markets and Our BusinessAny technical deficiencies in our WTGs
could adversely affect our business, financial condition, results of operations and future orders” and “Risks Related
to Our Markets and Our BusinessWe could incur expenses in relation to warranties for our products and
services”.
Services
Overview
In addition to the development, production and sale of WTGs, we offer the following services: (i)
installation and commissioning of WTGs, (ii) integrated services, (iii) logistics services and (iv) O&M services. The
installation and commissioning of WTGs, integrated services and logistics services are accounted for in the sales of
our WTGs, as these services are provided pursuant to our WTG supply agreements. The following chart includes an
overview of our comprehensive range of service offerings:
Type Integrated Service Contract Standard Maintenance Contract Fully flexible and optional services
Coverage Full Service and covers all costs
including:
Maintenance
Online-monitoring
Repair
Replacement of major components
Extent depends on customer:
Standard Maintenance
Online-monitoring
Transmission Oil Analysis
Safety Equipment Maintenance
Scope can cover:
Online-monitoring
Planned/Unplanned
Maintenance
Repair services
Spares and Stock Management
Competency training
Technical Support Agreement
Warranty /
Costs Availability/ Yield warranty:
ensures an availability of global source for WTG over the
contract term
Compensation for loss
Includes maintenance costs only
Costs for repairs are charged to customers
Joint wind farm responsibilities
Duration 2-20 years 5 years (extendable) 10-15 years (extendable)
Installation and commissioning of WTGs
We provide services for the installation and commissioning of WTGs. For installation services, which
include coordinating the logistics of creating foundations for WTGs installations, we work with our own teams or
outsource the installation projects to selected suppliers who are specially trained by us for this work. Moreover,
some customers also buy WTGs from us and perform their own installations. During the short financial year ended
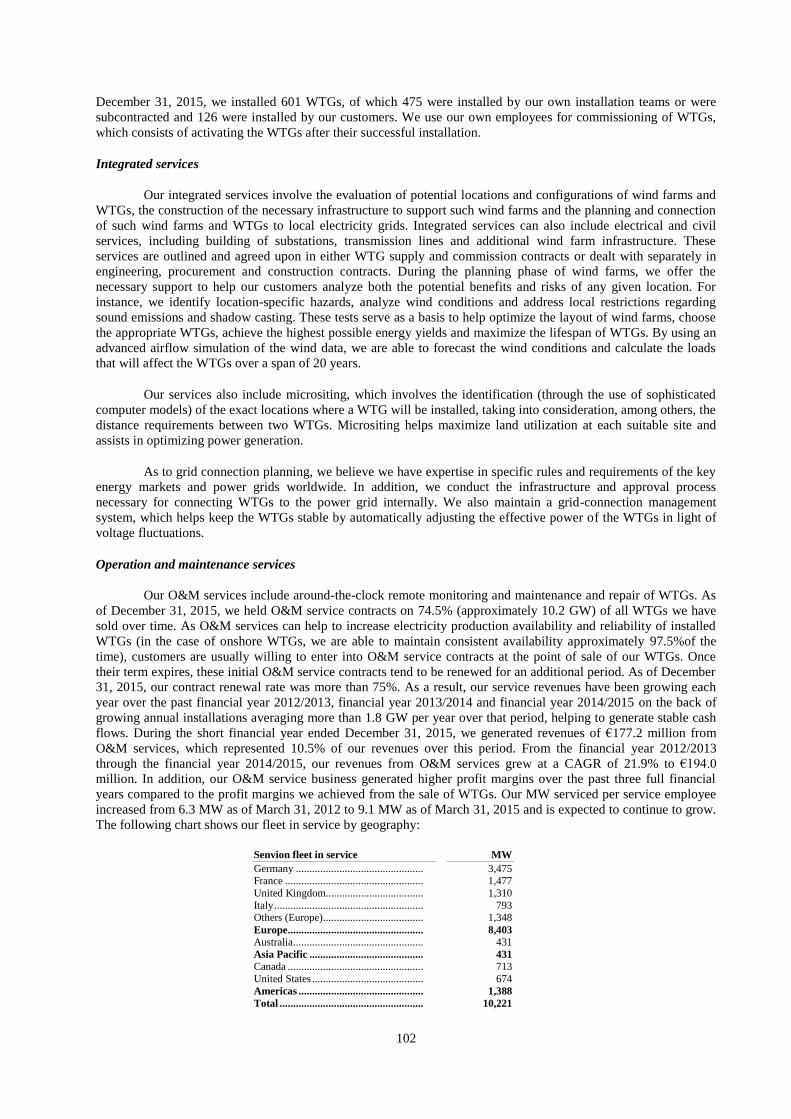
102
December 31, 2015, we installed 601 WTGs, of which 475 were installed by our own installation teams or were
subcontracted and 126 were installed by our customers. We use our own employees for commissioning of WTGs,
which consists of activating the WTGs after their successful installation.
Integrated services
Our integrated services involve the evaluation of potential locations and configurations of wind farms and
WTGs, the construction of the necessary infrastructure to support such wind farms and the planning and connection
of such wind farms and WTGs to local electricity grids. Integrated services can also include electrical and civil
services, including building of substations, transmission lines and additional wind farm infrastructure. These
services are outlined and agreed upon in either WTG supply and commission contracts or dealt with separately in
engineering, procurement and construction contracts. During the planning phase of wind farms, we offer the
necessary support to help our customers analyze both the potential benefits and risks of any given location. For
instance, we identify location-specific hazards, analyze wind conditions and address local restrictions regarding
sound emissions and shadow casting. These tests serve as a basis to help optimize the layout of wind farms, choose
the appropriate WTGs, achieve the highest possible energy yields and maximize the lifespan of WTGs. By using an
advanced airflow simulation of the wind data, we are able to forecast the wind conditions and calculate the loads
that will affect the WTGs over a span of 20 years.
Our services also include micrositing, which involves the identification (through the use of sophisticated
computer models) of the exact locations where a WTG will be installed, taking into consideration, among others, the
distance requirements between two WTGs. Micrositing helps maximize land utilization at each suitable site and
assists in optimizing power generation.
As to grid connection planning, we believe we have expertise in specific rules and requirements of the key
energy markets and power grids worldwide. In addition, we conduct the infrastructure and approval process
necessary for connecting WTGs to the power grid internally. We also maintain a grid-connection management
system, which helps keep the WTGs stable by automatically adjusting the effective power of the WTGs in light of
voltage fluctuations.
Operation and maintenance services
Our O&M services include around-the-clock remote monitoring and maintenance and repair of WTGs. As
of December 31, 2015, we held O&M service contracts on 74.5% (approximately 10.2 GW) of all WTGs we have
sold over time. As O&M services can help to increase electricity production availability and reliability of installed
WTGs (in the case of onshore WTGs, we are able to maintain consistent availability approximately 97.5%of the
time), customers are usually willing to enter into O&M service contracts at the point of sale of our WTGs. Once
their term expires, these initial O&M service contracts tend to be renewed for an additional period. As of December
31, 2015, our contract renewal rate was more than 75%. As a result, our service revenues have been growing each
year over the past financial year 2012/2013, financial year 2013/2014 and financial year 2014/2015 on the back of
growing annual installations averaging more than 1.8 GW per year over that period, helping to generate stable cash
flows. During the short financial year ended December 31, 2015, we generated revenues of €177.2 million from
O&M services, which represented 10.5% of our revenues over this period. From the financial year 2012/2013
through the financial year 2014/2015, our revenues from O&M services grew at a CAGR of 21.9% to €194.0
million. In addition, our O&M service business generated higher profit margins over the past three full financial
years compared to the profit margins we achieved from the sale of WTGs. Our MW serviced per service employee
increased from 6.3 MW as of March 31, 2012 to 9.1 MW as of March 31, 2015 and is expected to continue to grow.
The following chart shows our fleet in service by geography:
Senvion fleet in service MW
Germany ............................................... 3,475
France ................................................... 1,477
United Kingdom.................................... 1,310
Italy ....................................................... 793 Others (Europe) ..................................... 1,348
Europe .................................................. 8,403
Australia ................................................ 431
Asia Pacific .......................................... 431
Canada .................................................. 713
United States ......................................... 674
Americas .............................................. 1,388
Total ..................................................... 10,221
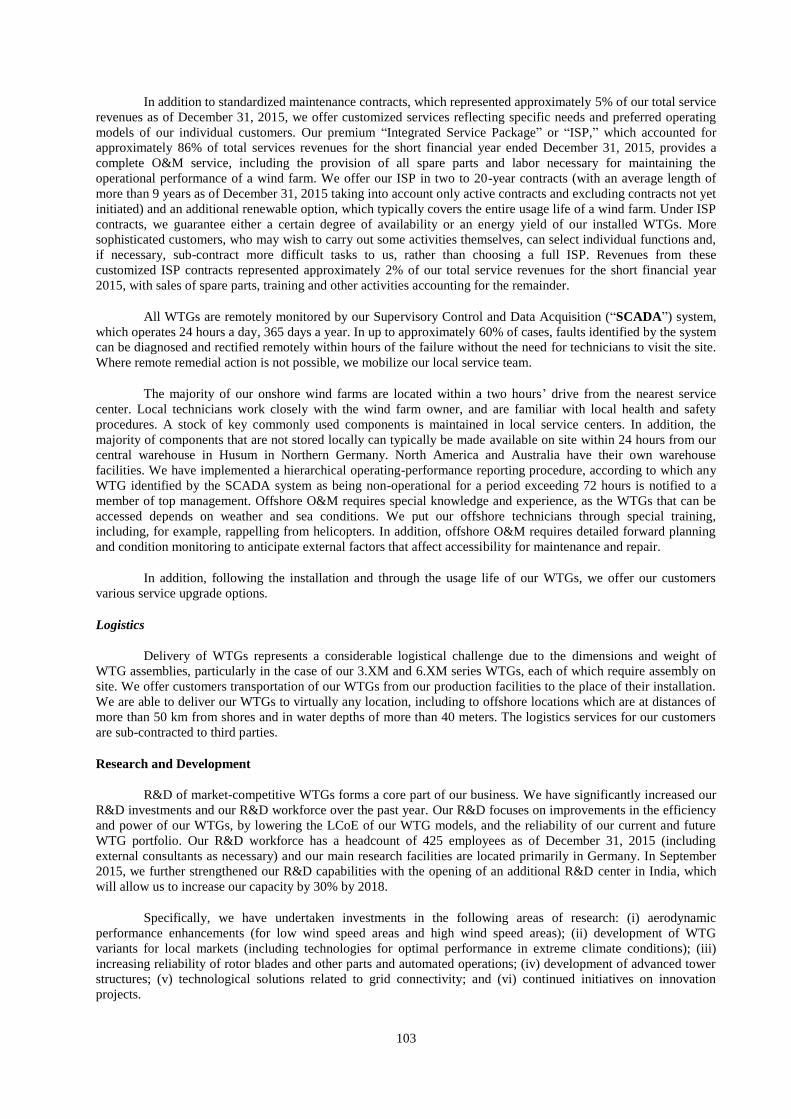
103
In addition to standardized maintenance contracts, which represented approximately 5% of our total service
revenues as of December 31, 2015, we offer customized services reflecting specific needs and preferred operating
models of our individual customers. Our premium “Integrated Service Package” or “ISP,” which accounted for
approximately 86% of total services revenues for the short financial year ended December 31, 2015, provides a
complete O&M service, including the provision of all spare parts and labor necessary for maintaining the
operational performance of a wind farm. We offer our ISP in two to 20-year contracts (with an average length of
more than 9 years as of December 31, 2015 taking into account only active contracts and excluding contracts not yet
initiated) and an additional renewable option, which typically covers the entire usage life of a wind farm. Under ISP
contracts, we guarantee either a certain degree of availability or an energy yield of our installed WTGs. More
sophisticated customers, who may wish to carry out some activities themselves, can select individual functions and,
if necessary, sub-contract more difficult tasks to us, rather than choosing a full ISP. Revenues from these
customized ISP contracts represented approximately 2% of our total service revenues for the short financial year
2015, with sales of spare parts, training and other activities accounting for the remainder.
All WTGs are remotely monitored by our Supervisory Control and Data Acquisition (“SCADA”) system,
which operates 24 hours a day, 365 days a year. In up to approximately 60% of cases, faults identified by the system
can be diagnosed and rectified remotely within hours of the failure without the need for technicians to visit the site.
Where remote remedial action is not possible, we mobilize our local service team.
The majority of our onshore wind farms are located within a two hours’ drive from the nearest service
center. Local technicians work closely with the wind farm owner, and are familiar with local health and safety
procedures. A stock of key commonly used components is maintained in local service centers. In addition, the
majority of components that are not stored locally can typically be made available on site within 24 hours from our
central warehouse in Husum in Northern Germany. North America and Australia have their own warehouse
facilities. We have implemented a hierarchical operating-performance reporting procedure, according to which any
WTG identified by the SCADA system as being non-operational for a period exceeding 72 hours is notified to a
member of top management. Offshore O&M requires special knowledge and experience, as the WTGs that can be
accessed depends on weather and sea conditions. We put our offshore technicians through special training,
including, for example, rappelling from helicopters. In addition, offshore O&M requires detailed forward planning
and condition monitoring to anticipate external factors that affect accessibility for maintenance and repair.
In addition, following the installation and through the usage life of our WTGs, we offer our customers
various service upgrade options.
Logistics
Delivery of WTGs represents a considerable logistical challenge due to the dimensions and weight of
WTG assemblies, particularly in the case of our 3.XM and 6.XM series WTGs, each of which require assembly on
site. We offer customers transportation of our WTGs from our production facilities to the place of their installation.
We are able to deliver our WTGs to virtually any location, including to offshore locations which are at distances of
more than 50 km from shores and in water depths of more than 40 meters. The logistics services for our customers
are sub-contracted to third parties.
Research and Development
R&D of market-competitive WTGs forms a core part of our business. We have significantly increased our
R&D investments and our R&D workforce over the past year. Our R&D focuses on improvements in the efficiency
and power of our WTGs, by lowering the LCoE of our WTG models, and the reliability of our current and future
WTG portfolio. Our R&D workforce has a headcount of 425 employees as of December 31, 2015 (including
external consultants as necessary) and our main research facilities are located primarily in Germany. In September
2015, we further strengthened our R&D capabilities with the opening of an additional R&D center in India, which
will allow us to increase our capacity by 30% by 2018.
Specifically, we have undertaken investments in the following areas of research: (i) aerodynamic
performance enhancements (for low wind speed areas and high wind speed areas); (ii) development of WTG
variants for local markets (including technologies for optimal performance in extreme climate conditions); (iii)
increasing reliability of rotor blades and other parts and automated operations; (iv) development of advanced tower
structures; (v) technological solutions related to grid connectivity; and (vi) continued initiatives on innovation
projects.
104
Our R&D efforts result in a strong product release pipeline. In December 2014, we completed the
installation of the prototype of the 6.2M152 WTG, the most efficient WTG of the 6.XM series, in an onshore
location in Germany. As a result of an increase in the rotor size (from 126 meters to 152 meters), the power
capacity/output of this WTG model should be approximately 21% higher compared to the WTG model 6.2M126
(we are currently testing this prototype to verify this estimate, but from our experience with other WTGs the
difference between our estimates and the actual test results is usually less than 1%). We also introduced the
3.2M122 WTG, the successor of the 3.0M122, which features NES and offers higher yields and an increased cost
efficiency due to its capacity upgrade. The NES is a full power converter that decouples the drive train from grid
faults, allows strong grid connection capabilities and meets new grid requirements, while generating higher yields
with a sustainable design, all while lowering the LCoE. We have taken significant steps in developing new WTGs
targeting the low wind market segment and recently introduced the 3.4M140 WTG. The 3.4M140 WTG achieves a
25 year operational lifetime and our highest yield for low-wind onshore locations to date through the use of highly
efficient 68 meter blades that provide for a 20% increase in yield, as compared to the 3.0M122. The 3.4M140
features our NES technology, new aero-acoustic add-ons to further reduce sound in all operation states (104.0 sB(a))
and a new pitch control system to reduce turbine load. We are also developing new WTG models based on the
platform of our MM series, 3.XM series and 6.XMseries, and we expect to start commercialization of these new
products in two to three years.
Moreover, in November 2015, we acquired the RodPack technology, which substitutes the standard glass
fabrics used in the main girder and enables optimized blade design as well as faster and higher-quality blade
production. We already use the RodPack technology for our 6.2M152 and we anticipate integrating it into our future
blade designs. The RodPack technology is exclusively available and used in our WTGs. The RodPack technology
allows for simpler manufacturing, reduced manufacturing time, lighter blades which lead to better load profiles and
better material properties than high-modulus glass and standard unidirectional glass.
In addition, we are working on various improvements to operating conditions, design principles and new
technology. We aim to improve operating conditions through developing new methods to upgrade the MW rating
(statically or dynamically) of our existing turbines while meeting reduced grid requirements and developing
enhanced systems for de-icing, reducing the maximum air density for blade loads and reducing the temperature
range while keeping a full turbine rating. We aim to improve our design through developing new methods to adapt
load calculations by reducing partial security factors, optimizing loss assumptions, skipping load events and
reducing gear box torque. We are also increasing the energy feed of existing WTGs by optimizing auxiliary power
management and operation controls. In addition, we aim to optimize the gearbox design with reduced torque and
component costs by reducing the structural component specification and increasing the tip speed and reducing
auxiliary power requirements specific to the gearbox. We aim to develop new technologies including aero-acoustic
optimization, intelligent pitch and functional line load management to reduce the maximum tower base bending
moment and blade root bending moment and reduce fatigue loads, new tower designs and tower cost reduction
measures, such as a high steel tower, soft-soft tower design and advanced welding technologies and enhanced
turbine architecture to challenge our current NES technology and the internal design of our tower to increase
standardization.
Considering our early pioneering work and field experience in WTG technologies, we are well positioned
to respond promptly to future trends in the WTG industry and capture future business opportunities in our core as
well as new markets, which could include the development of larger WTGs.
Intellectual Property Rights and Technical Know-How
We believe that securing patent and other intellectual property protection in respect to our technology is
important to our business and that our future performance will depend in part on our ability to obtain and maintain
patents and other intellectual property rights, to maintain confidential information and trade secrets and to avoid
infringing third party intellectual property rights. We protect our technology through a combination of intellectual
property rights, such as patents and trademarks, and putting in place procedures to guard the security of confidential
information.
As of December 31, 2015, our intellectual property portfolio included over 880 invention disclosure rights,
including more than 380 patents. We also have a number of protected trademarks. Our patent portfolio covers all
components of the WTGs, including rotor blade designs and materials, tower design and foundation, power
converters and grid connection capabilities, gearbox, drive train and generator apparatuses and nacelle-based control
and feedback mechanisms.
105
To protect our intellectual property rights and technical know-how, our employment contracts, particularly
those with employees who have special technical knowledge about our WTGs or our business, contain a general
confidentiality undertaking. In addition, for employees involved in R&D, the confidentiality undertaking extends for
a specified period following the termination of employment. We also require suppliers of key components to enter
into non-disclosure arrangements to limit access to and distribution of our proprietary and confidential information.
We also have a number of patent license agreements and non-assertion agreements providing for non-exclusive,
royalty-free and perpetual licenses or non-assertion covenants relating to patents owned by us or third parties.
Supply Chain Management
Overview
Our supply chain is based on a strategic mixture of in-house production and sourcing from third parties.
The in-house production mainly comprises the assembly of nacelles and hubs, as well as our rotor blade production.
Our nacelle and hub factories are located in Germany and Portugal. To serve our core markets in Europe we
produce our own rotor blades in factories located in Germany and Portugal. However, we also source rotor blades
from third parties, following our lean business model strategy based on a reasonable balance between internal and
external sourcing of production components. We believe that this reasonable balancing approach is a best-in-class
approach that enhances results and product quality and provides us with a competitive advantage, as the wind
energy supply chain continues to be affected by overcapacities in most strategic WTG components, while also
protecting us from component shortages when the market grows.
We source additional key components, including towers, generators and gearboxes, from third parties, and
we believe that we have established a strong supplier base. All supplier relationships are governed by a code of
conduct which establishes our professional business standards and ethical considerations. Our suppliers are capable
of complying with our technical requirements and quality standards. To ensure high quality standards, we and our
suppliers have entered into quality assurance agreements that define the technical and organizational framework
conditions and processes. All of our suppliers must be focused on “zero failures”, 100% reliable delivery and cost
minimization. To help ensure favorable commercial terms and required supply capacity, we have entered into
framework supply agreements with some of our suppliers. As part of our supply chain risk management, we
regularly conduct audits of our suppliers and maintain research and design control over third party production of
some key WTG components.
To reduce dependency and protect ourselves from delivery interruptions, a dual or multiple sourcing
strategy has been adopted as one of the guiding principles of our proactive supply chain management. More than
75% of the key components for our 2MW WTG are available from two or three additional sources and we plan to
increase the share of key components of our 2MW WTG available from multiple sources to 90% in 2016. For our
3MW NES platform, approximately 63% of its key components were available from multiple sources in 2015 and
we plan to increase the share of key components of our 6MW NES platform to 90% in 2016. Our ambition to grow
the multi-sourcing share of key components applies to key components across all commodities. The supplier
selection criteria particularly focus on the quality, price and technological advancement of the supplied components.
Timing and size of our supply orders are, to a great extent, driven by requirements of specific projects. To avoid
long-term purchase commitments to specific volumes and to retain flexibility, we generally enter into agreements
that limit our commitment to a particular supplier to only a certain percentage of our demand related to a particular
material (so-called “share of wallet agreements”), component or turbine within a limited time frame or we enter into
agreements for specific components or services on a project by project basis. Most of our supply agreements do not
exceed one-year terms.
We are also in the process of implementing a local supply chain strategy in new markets, in particular with
respect to India and Turkey, which will not only enable us to meet local content requirements, but also help us to
further reduce procurement costs. In India, we intend to achieve a significant majority of local sourcing. We expect
our initial ramp up in India to include local sourcing of some castings and forged items and then to speed up our
local sourcing development and potentially lease a local factory building for nacelle assembly. In Turkey, we target
achievement of a significant majority of local sourcing by the end of financial year 2019. We expect our first local
sourcing to be tower sourcing. Following our initial ramp up, we will also target local sourcing of blades, generators
and converter cabinets. We also aim to leverage local partnerships in Turkey with global and local suppliers.
Globally, we aim to achieve localization by combining local suppliers and global suppliers who have a local
presence. A key objective of our supply chain is to reduce the production costs of our WTGs. To support a
competitive positioning of our products in the market, we have successfully executed various cost reduction
initiatives over the past three years. Going forward, we plan to develop a “Tandem Team” consisting of
106
procurement and value engineering to affect commodity savings. In addition, we seek to increase our share of local
sourcing. See “—Cost savings programs.”
Some suppliers include price escalation clauses in their supply contracts. Where possible, price increases
are passed on through price escalation clauses in purchase agreements with customers. However, we are not fully
protected from price increases in key inputs. See “Risks Related to Our Market and Our Business—We are subject
to the risk of additional costs because of an increase in the prices of components and materials.”
In-house production facilities
We have established in-house production of rotor blades and nacelles and are therefore less dependent on
third party suppliers for these vital WTG components. As of December 31, 2015, approximately 66% of our blades
are produced in-house. We are focused on the increasing 3.XM demand and expanding our production capacity
without additional capital expenditures. To utilize free capacity at our blade production facilities in Germany and
Portugal, we have increased our share of in-house production for our European projects. We continue to source
some of our blades from third parties because logistic costs are an important factor influencing the price of blades.
Based on the location of a project, specific suppliers may be able to provide lower costs and it may, therefore, be
more cost efficient for us to source the blades from such third parties instead of from our in-house production
facilities. Furthermore, we also use one blade type in certain of our WTGs that we do not produce and only source
externally.
The following tables set out information regarding our existing production facilities and the installed
capacity of each of these facilities as of December 31, 2015.
Nacelles / Hubs Production
Location Established Type of WTG
Capacity
(MW per
annum) Ownership
Shop floor,
offices and
warehouse space
(thousands of
square meters)
Husum (Germany) .................................................................................. 1988 MM-Series 1,000 100% 14 Trampe (Germany) ................................................................................. 1998 3.XM or MM 500 100% 12
Bremerhaven (Germany) ........................................................................ 2008 3.XM & 6.XM
1,100 100% 40
Oliveira de Frades (Portugal) ................................................................. 2008 MM-Series 1,000 100% 11
Total nacelles / hubs (in MW): ............................................................ 3,600
Blade Production
Location Established Type of Blades Ownership
Shop floor,
offices and
warehouse space
(thousands of
square meters)
Land
(thousands of
square meters)
Bremerhaven (Germany) ........................................................................ 2008 RE 61 100% 40 220
Vagos (Portugal) .................................................................................... 2011 RE
40/45/51/55/59
100% 50 400
Cost savings programs
In 2013, we implemented an efficiency enhancement program called POWER in order to reduce
inefficiencies and standardize duplicative functions. POWER implemented a new operating model leading to more
centralized and streamlined decision-making processes, defined 17 areas of focus as income statement drivers and
cost reduction sources, with procurement, human resources and operating expenditures being the largest in terms of
their impacts on profitability, and optimized our human resources resulting in approximately 500 employees
mutually agreeing to leave us. Although we initially budgeted cost savings of approximately €100 million from
POWER, we finally achieved total cost savings of approximately €160 million in the financial year 2013/2014. Due
to POWER, we believe we have become a more agile and competitive organization.
In 2014, we launched an operational improvement program called FOCUS 2015 in order to prepare for
potential price declines, fixed cost increases and uncertainty of the offshore market. FOCUS 2015 was targeted at
improving revenues for sales and service, reducing direct material costs, achieving sustainable improvements in
product quality and optimizing processes. In order to achieve this, we identified 13 areas of focus with individual
monetary and non-monetary targets. The areas comprise the entire value chain, from core functions, such as R&D,
107
procurement, and sales to supporting functions, such as organizational development and operating expenditures. We
generated approximately €100 million in cost savings in financial year 2014/2015, which was €10 million
(approximately 11%) ahead of our initial target. Continuous improvements in our value chain have become a core
part of our daily business and we intend to continue implementing the knowledge we gained from our prior cost
savings programs into our business. We intend to focus on commercial levers such as hybrid towers and high steel
towers and continuing supplier renegotiations and multi-source development and also to embrace a shift to sourcing
from Asia, beginning with lower end components and then shifting to higher end components. We also plan to
implement value engineering or designing to cost measures for the optimization of internal designs and the
development of new more efficient designs that will compliment project management initiatives to reduce the
installation time and make better use of cranes and its logistics planning initiative to increasingly utilize tenders.
Third party key component procurement
We source nacelles/hub components, blades and towers from third party suppliers in Europe, Asia,
Australia and North America as follows.
Rotor Blades: The largest third party supplier for rotor blades is LM Wind Power. LM Wind Power
supplies rotor blades from various locations in Europe, Asia and North America.
Gearboxes: Gearboxes are supplied by, among others, Eickhoff GmbH and ZF Wind Power
Antwerpen NV.
3.XM Converters/Generators: Our electrical system is built up on partial converters that are sourced
exclusively from Woodward and our DFIG generators are exclusively supplied by VEM. In 2015, we
introduced the Next Electrical System (“NES”) for our 3.XM series WTGs and implemented a dual
sourcing strategy with Ingeteam and ABB. The NES design is based on a full converter concept with
an induction generator to fulfill the increased grid code requirements.
Blade and Yaw Bearings: Blade and yaw bearings are purchased from IMO Momentenlager GmbH
and the Liebherr Group.
Towers: Given their physical dimensions, the costs of towers are highly dependent on logistical costs.
Thus, we have established a global supplier base that is in many cases located close to our core
markets. For Central European projects, tower suppliers include Ambau and Reuther. Our projects in
France, UK and Canada are supplied by, among others, Franceole, Tegopi and Marmen, respectively.
Concrete sections for our hybrid towers are sourced from Max Bögl Wind AG in Germany.
Castings: Castings are purchased from Global Castings, Yeong Guan Group and Shandong Laiwu
Jinlei Wind Power Technology Co., Ltd.
We benefit from a diversified base of more than 1,400 suppliers with our top ten suppliers accounting for
less than 30% of our total costs for the financial year ended March 31, 2014.
Quality management certification
Pursuant to internal policies, all our design and production facilities, and each of our O&M services, have
either been certified as ISO 9001:2008 by DNV GL or are in the process of being certified according to this
standard.
Sales and Marketing
Our sales effort is project-specific and principally driven by our ability to offer WTGs achieving a superior
price/performance ratio, as measured by electricity production costs per KWh produced in a particular wind farm
location. We rely on our wide range product portfolio, which enables us to be competitive in both low and high
wind speed locations, as well as offshore areas and regions with extreme climates. Although we do not develop site-
specific WTGs, we are able to develop and produce site-specific WTG towers. For example, high towers tend to be
used more often in markets with a higher density of forested areas such as Northern Germany and Scandinavia. To
meet the specific needs of a Scandinavian market, we are in the process of developing a new steel tower with a hub
height of 119 meters, which is our first steel construction of a WTG tower above 100 meters. Other aspects
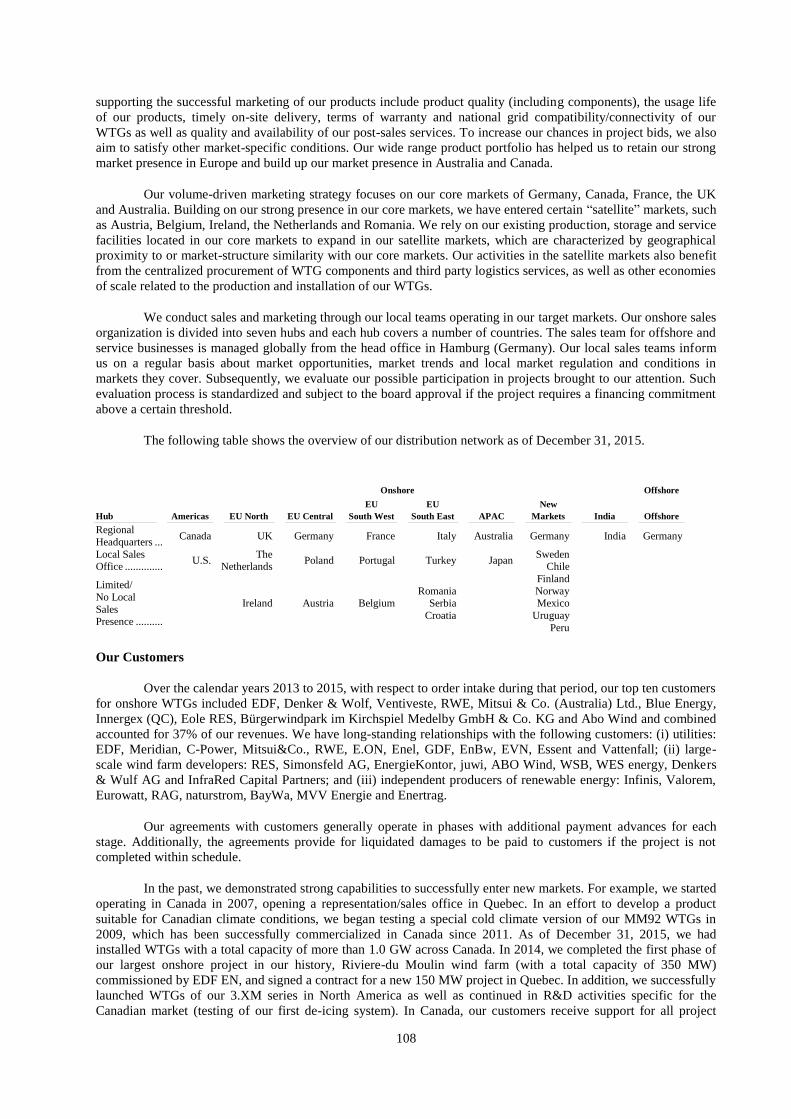
108
supporting the successful marketing of our products include product quality (including components), the usage life
of our products, timely on-site delivery, terms of warranty and national grid compatibility/connectivity of our
WTGs as well as quality and availability of our post-sales services. To increase our chances in project bids, we also
aim to satisfy other market-specific conditions. Our wide range product portfolio has helped us to retain our strong
market presence in Europe and build up our market presence in Australia and Canada.
Our volume-driven marketing strategy focuses on our core markets of Germany, Canada, France, the UK
and Australia. Building on our strong presence in our core markets, we have entered certain “satellite” markets, such
as Austria, Belgium, Ireland, the Netherlands and Romania. We rely on our existing production, storage and service
facilities located in our core markets to expand in our satellite markets, which are characterized by geographical
proximity to or market-structure similarity with our core markets. Our activities in the satellite markets also benefit
from the centralized procurement of WTG components and third party logistics services, as well as other economies
of scale related to the production and installation of our WTGs.
We conduct sales and marketing through our local teams operating in our target markets. Our onshore sales
organization is divided into seven hubs and each hub covers a number of countries. The sales team for offshore and
service businesses is managed globally from the head office in Hamburg (Germany). Our local sales teams inform
us on a regular basis about market opportunities, market trends and local market regulation and conditions in
markets they cover. Subsequently, we evaluate our possible participation in projects brought to our attention. Such
evaluation process is standardized and subject to the board approval if the project requires a financing commitment
above a certain threshold.
The following table shows the overview of our distribution network as of December 31, 2015.
Onshore Offshore
Hub Americas EU North EU Central
EU
South West
EU
South East APAC
New
Markets India Offshore
Regional
Headquarters .......................................................................................... Canada UK Germany France Italy Australia Germany India Germany
Local Sales Office .....................................................................................................
U.S. The
Netherlands Poland Portugal Turkey Japan
Sweden Chile
Limited/
No Local
Sales Presence .................................................................................................
Ireland Austria Belgium Romania
Serbia
Croatia
Finland
Norway Mexico
Uruguay
Peru
Our Customers
Over the calendar years 2013 to 2015, with respect to order intake during that period, our top ten customers
for onshore WTGs included EDF, Denker & Wolf, Ventiveste, RWE, Mitsui & Co. (Australia) Ltd., Blue Energy,
Innergex (QC), Eole RES, Bürgerwindpark im Kirchspiel Medelby GmbH & Co. KG and Abo Wind and combined
accounted for 37% of our revenues. We have long-standing relationships with the following customers: (i) utilities:
EDF, Meridian, C-Power, Mitsui&Co., RWE, E.ON, Enel, GDF, EnBw, EVN, Essent and Vattenfall; (ii) large-
scale wind farm developers: RES, Simonsfeld AG, EnergieKontor, juwi, ABO Wind, WSB, WES energy, Denkers
& Wulf AG and InfraRed Capital Partners; and (iii) independent producers of renewable energy: Infinis, Valorem,
Eurowatt, RAG, naturstrom, BayWa, MVV Energie and Enertrag.
Our agreements with customers generally operate in phases with additional payment advances for each
stage. Additionally, the agreements provide for liquidated damages to be paid to customers if the project is not
completed within schedule.
In the past, we demonstrated strong capabilities to successfully enter new markets. For example, we started
operating in Canada in 2007, opening a representation/sales office in Quebec. In an effort to develop a product
suitable for Canadian climate conditions, we began testing a special cold climate version of our MM92 WTGs in
2009, which has been successfully commercialized in Canada since 2011. As of December 31, 2015, we had
installed WTGs with a total capacity of more than 1.0 GW across Canada. In 2014, we completed the first phase of
our largest onshore project in our history, Riviere-du Moulin wind farm (with a total capacity of 350 MW)
commissioned by EDF EN, and signed a contract for a new 150 MW project in Quebec. In addition, we successfully
launched WTGs of our 3.XM series in North America as well as continued in R&D activities specific for the
Canadian market (testing of our first de-icing system). In Canada, our customers receive support for all project
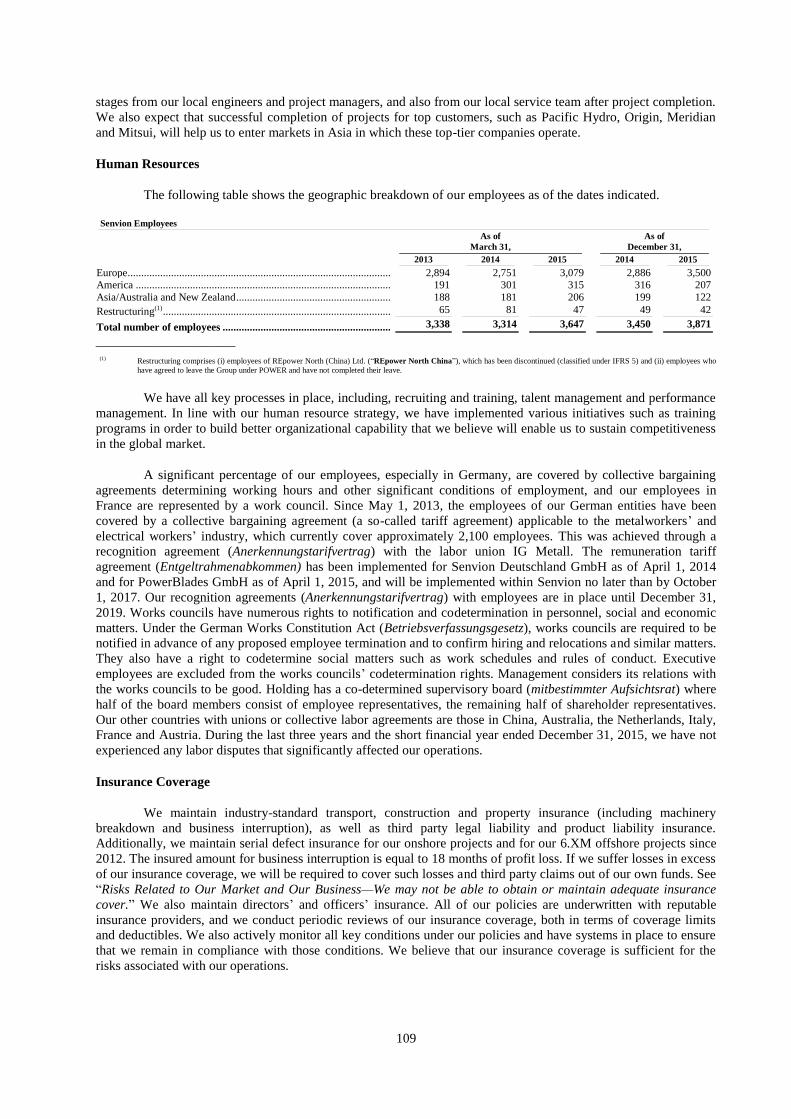
109
stages from our local engineers and project managers, and also from our local service team after project completion.
We also expect that successful completion of projects for top customers, such as Pacific Hydro, Origin, Meridian
and Mitsui, will help us to enter markets in Asia in which these top-tier companies operate.
Human Resources
The following table shows the geographic breakdown of our employees as of the dates indicated.
Senvion Employees
As of
March 31,
As of
December 31,
2013 2014 2015 2014 2015
Europe .................................................................................................... 2,894 2,751 3,079 2,886 3,500 America ................................................................................................. 191 301 315 316 207
Asia/Australia and New Zealand ............................................................ 188 181 206 199 122
Restructuring(1) ....................................................................................... 65 81 47 49 42
Total number of employees ................................................................. 3,338 3,314 3,647 3,450 3,871
_____________________
(1) Restructuring comprises (i) employees of REpower North (China) Ltd. (“REpower North China”), which has been discontinued (classified under IFRS 5) and (ii) employees who
have agreed to leave the Group under POWER and have not completed their leave.
We have all key processes in place, including, recruiting and training, talent management and performance
management. In line with our human resource strategy, we have implemented various initiatives such as training
programs in order to build better organizational capability that we believe will enable us to sustain competitiveness
in the global market.
A significant percentage of our employees, especially in Germany, are covered by collective bargaining
agreements determining working hours and other significant conditions of employment, and our employees in
France are represented by a work council. Since May 1, 2013, the employees of our German entities have been
covered by a collective bargaining agreement (a so-called tariff agreement) applicable to the metalworkers’ and
electrical workers’ industry, which currently cover approximately 2,100 employees. This was achieved through a
recognition agreement (Anerkennungstarifvertrag) with the labor union IG Metall. The remuneration tariff
agreement (Entgeltrahmenabkommen) has been implemented for Senvion Deutschland GmbH as of April 1, 2014
and for PowerBlades GmbH as of April 1, 2015, and will be implemented within Senvion no later than by October
1, 2017. Our recognition agreements (Anerkennungstarifvertrag) with employees are in place until December 31,
2019. Works councils have numerous rights to notification and codetermination in personnel, social and economic
matters. Under the German Works Constitution Act (Betriebsverfassungsgesetz), works councils are required to be
notified in advance of any proposed employee termination and to confirm hiring and relocations and similar matters.
They also have a right to codetermine social matters such as work schedules and rules of conduct. Executive
employees are excluded from the works councils’ codetermination rights. Management considers its relations with
the works councils to be good. Holding has a co-determined supervisory board (mitbestimmter Aufsichtsrat) where
half of the board members consist of employee representatives, the remaining half of shareholder representatives.
Our other countries with unions or collective labor agreements are those in China, Australia, the Netherlands, Italy,
France and Austria. During the last three years and the short financial year ended December 31, 2015, we have not
experienced any labor disputes that significantly affected our operations.
Insurance Coverage
We maintain industry-standard transport, construction and property insurance (including machinery
breakdown and business interruption), as well as third party legal liability and product liability insurance.
Additionally, we maintain serial defect insurance for our onshore projects and for our 6.XM offshore projects since
2012. The insured amount for business interruption is equal to 18 months of profit loss. If we suffer losses in excess
of our insurance coverage, we will be required to cover such losses and third party claims out of our own funds. See
“Risks Related to Our Market and Our Business—We may not be able to obtain or maintain adequate insurance
cover.” We also maintain directors’ and officers’ insurance. All of our policies are underwritten with reputable
insurance providers, and we conduct periodic reviews of our insurance coverage, both in terms of coverage limits
and deductibles. We also actively monitor all key conditions under our policies and have systems in place to ensure
that we remain in compliance with those conditions. We believe that our insurance coverage is sufficient for the
risks associated with our operations.
110
Environmental Matters
Our operations are subject to environmental regulation and periodic inspections and monitoring by local
environmental protection authorities. These laws and regulations require us to obtain and maintain permits and
approvals, undergo environmental impact assessments, review processes and implement environmental programs,
impose controls on our air and water discharges, storage, handling, discharge and disposal of chemicals and other
aspects of our operations and products. Furthermore, some of our manufacturing and O&M processes are hazardous
and require compliance with stringent safety standards in regards to potential employee exposure to hazardous
substances. We are not aware of any pending or anticipated material environmental investigation, proceeding or
action by any governmental agency or other third-party. See “Risks Related to Our Market and Our Business—
Compliance with and changes in safety, health and environmental laws and regulations could adversely affect our
operations.”
Legal and Arbitration Proceedings
We are involved in various legal proceedings in relation to our business from time to time. The majority of
these proceedings involve disputes with suppliers and customers. Other than the arbitration proceedings in
connection with the technical irregularities in the blade bearings of our MM92 and MM82 onshore WTGs, we are
not a party to any material legal proceedings (including any such proceedings that are pending or anticipated of
which we are aware) during the past twelve months that have had, or that we expect in the future may have, a
material adverse effect on our financial position, profitability, business or results of operations.
111
REGULATION
Overview
Feed-in tariff
A FIT is a policy mechanism designed to accelerate investment in renewable energy technologies which
currently, without such support, would only be capable of generating electricity at a cost above the price of energy
purchased from the grid in the relevant area (“grid parity”). FITs provide renewable energy producers with cost-
based compensation and price certainty, allowing for long-term contracts and long-term support schemes. There are
three main types of FITs: (i) a premium FIT offers certain payments in addition to the revenue a renewable energy
producer generates by selling electricity on the market; (ii) a fixed FIT provides static payments designed to replace
revenues gained from selling electricity on the market; and (iii) a FIT with a contract for difference (“CfD”)
provides variable payments to ensure that the renewable energy producer receives the agreed tariff (assuming the
producer sells its electricity at market price). The FITs are typically designed to decline over time to track and
encourage technological change. FITs also typically offer guaranteed purchase agreement/grid access for long
periods (15 to 25 years). Moreover, performance-based rates may also be implemented to incentivize producers to
maximize the output and efficiency of their projects.
As of 2014, clean energy-supportive policies had been enacted in over 145 countries, including Australia,
Austria, Belgium, Brazil, Canada, China, the Czech Republic, Denmark, France, Germany, India, the Republic of
Ireland, Israel, Italy, the Republic of Korea, the Netherlands, Portugal, South Africa, Spain, Switzerland, Turkey
and the United Kingdom. In early 2012, Spain suspended FITs for new projects. In August 2015, the UK
government also launched a consultation concerning the future of the FIT scheme for small scale projects.
Following such consultation, a pause to the scheme from January 15, 2016 until February 7, 2016 (inclusive) was
announced and the deployment of caps from February 8, 2016 onwards was introduced.
Grid parity
Grid parity occurs for a given form of energy, when the cost of purchasing that form of energy from the
grid matches the existing average cost of purchasing alternative forms of energy from the grid in that area. Grid
parity can vary both in time (i.e., during the course of the day and over the course of years) and in space (i.e.,
geographically). The price of electricity from the grid varies widely from high cost areas to lower cost areas. In
areas with time-of-day pricing, rates vary over the course of the day, rising during high demand hours and declining
during low demand hours. In some areas wind energy has already achieved lower cost than grid electricity. In
remote areas, installing decentralized electricity from wind energy can be cheaper than building new distribution
lines to connect to the transmission grid.
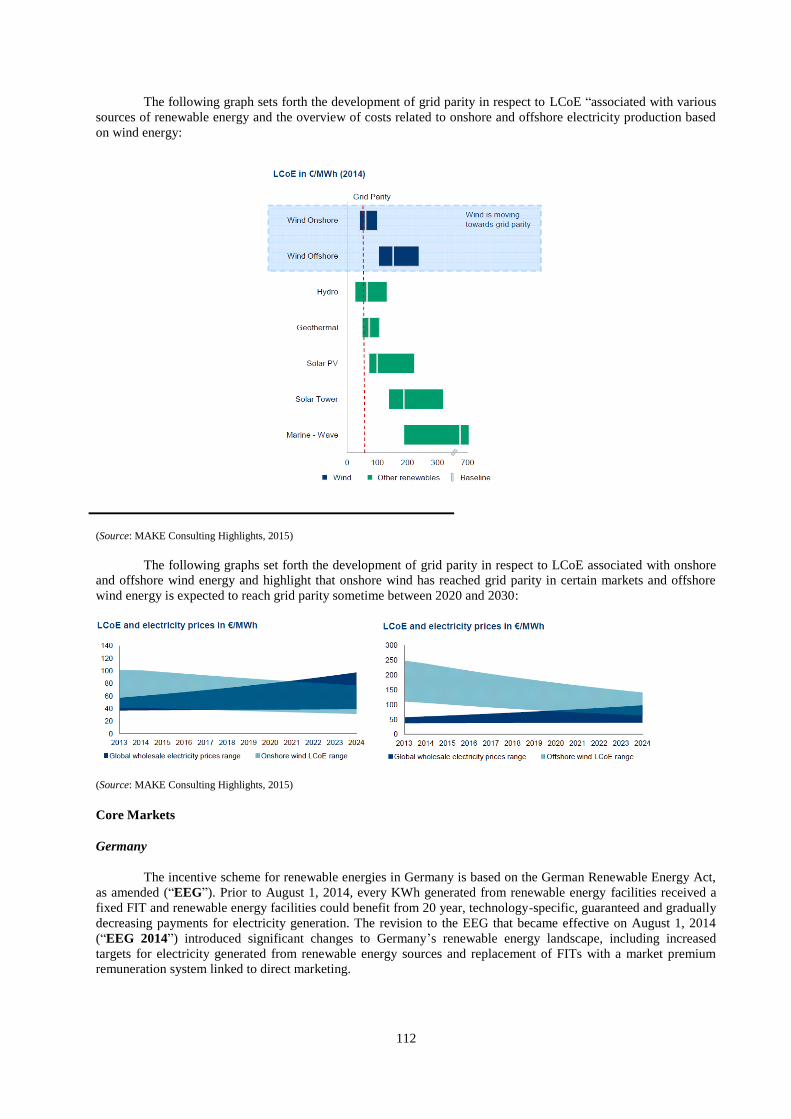
112
The following graph sets forth the development of grid parity in respect to LCoE “associated with various
sources of renewable energy and the overview of costs related to onshore and offshore electricity production based
on wind energy:
(Source: MAKE Consulting Highlights, 2015)
The following graphs set forth the development of grid parity in respect to LCoE associated with onshore
and offshore wind energy and highlight that onshore wind has reached grid parity in certain markets and offshore
wind energy is expected to reach grid parity sometime between 2020 and 2030:
(Source: MAKE Consulting Highlights, 2015)
Core Markets
Germany
The incentive scheme for renewable energies in Germany is based on the German Renewable Energy Act,
as amended (“EEG”). Prior to August 1, 2014, every KWh generated from renewable energy facilities received a
fixed FIT and renewable energy facilities could benefit from 20 year, technology-specific, guaranteed and gradually
decreasing payments for electricity generation. The revision to the EEG that became effective on August 1, 2014
(“EEG 2014”) introduced significant changes to Germany’s renewable energy landscape, including increased
targets for electricity generated from renewable energy sources and replacement of FITs with a market premium
remuneration system linked to direct marketing.
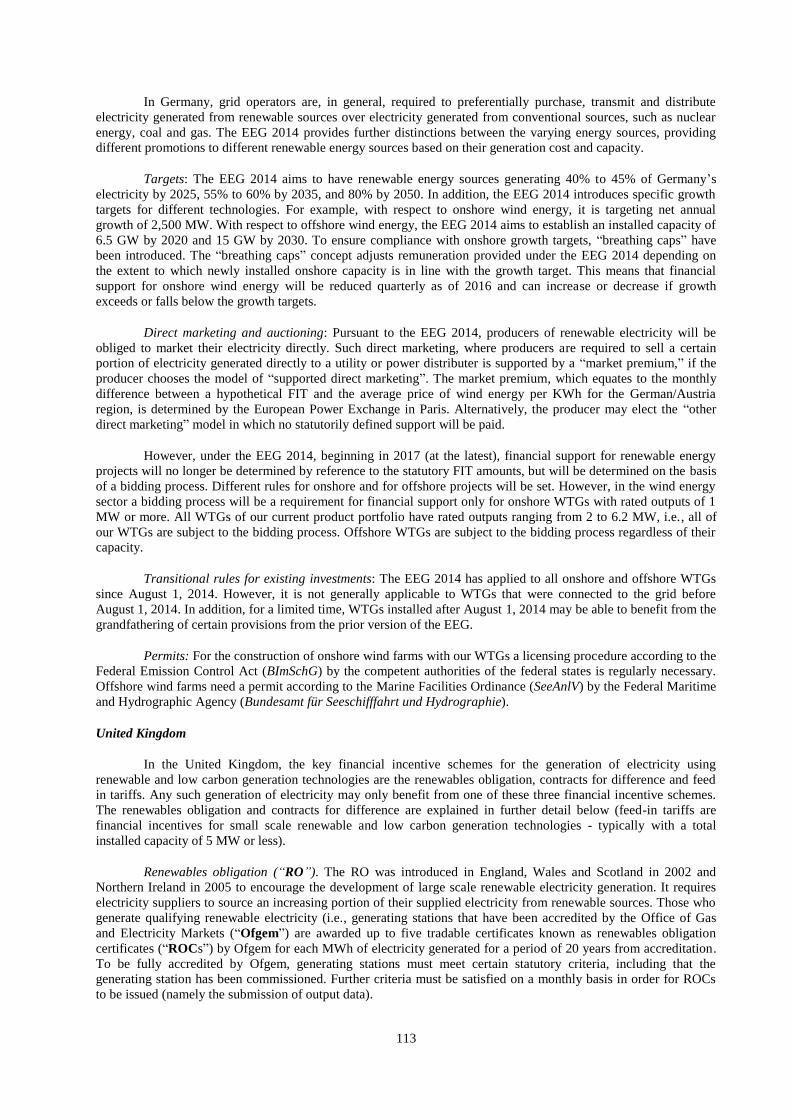
113
In Germany, grid operators are, in general, required to preferentially purchase, transmit and distribute
electricity generated from renewable sources over electricity generated from conventional sources, such as nuclear
energy, coal and gas. The EEG 2014 provides further distinctions between the varying energy sources, providing
different promotions to different renewable energy sources based on their generation cost and capacity.
Targets: The EEG 2014 aims to have renewable energy sources generating 40% to 45% of Germany’s
electricity by 2025, 55% to 60% by 2035, and 80% by 2050. In addition, the EEG 2014 introduces specific growth
targets for different technologies. For example, with respect to onshore wind energy, it is targeting net annual
growth of 2,500 MW. With respect to offshore wind energy, the EEG 2014 aims to establish an installed capacity of
6.5 GW by 2020 and 15 GW by 2030. To ensure compliance with onshore growth targets, “breathing caps” have
been introduced. The “breathing caps” concept adjusts remuneration provided under the EEG 2014 depending on
the extent to which newly installed onshore capacity is in line with the growth target. This means that financial
support for onshore wind energy will be reduced quarterly as of 2016 and can increase or decrease if growth
exceeds or falls below the growth targets.
Direct marketing and auctioning: Pursuant to the EEG 2014, producers of renewable electricity will be
obliged to market their electricity directly. Such direct marketing, where producers are required to sell a certain
portion of electricity generated directly to a utility or power distributer is supported by a “market premium,” if the
producer chooses the model of “supported direct marketing”. The market premium, which equates to the monthly
difference between a hypothetical FIT and the average price of wind energy per KWh for the German/Austria
region, is determined by the European Power Exchange in Paris. Alternatively, the producer may elect the “other
direct marketing” model in which no statutorily defined support will be paid.
However, under the EEG 2014, beginning in 2017 (at the latest), financial support for renewable energy
projects will no longer be determined by reference to the statutory FIT amounts, but will be determined on the basis
of a bidding process. Different rules for onshore and for offshore projects will be set. However, in the wind energy
sector a bidding process will be a requirement for financial support only for onshore WTGs with rated outputs of 1
MW or more. All WTGs of our current product portfolio have rated outputs ranging from 2 to 6.2 MW, i.e., all of
our WTGs are subject to the bidding process. Offshore WTGs are subject to the bidding process regardless of their
capacity.
Transitional rules for existing investments: The EEG 2014 has applied to all onshore and offshore WTGs
since August 1, 2014. However, it is not generally applicable to WTGs that were connected to the grid before
August 1, 2014. In addition, for a limited time, WTGs installed after August 1, 2014 may be able to benefit from the
grandfathering of certain provisions from the prior version of the EEG.
Permits: For the construction of onshore wind farms with our WTGs a licensing procedure according to the
Federal Emission Control Act (BImSchG) by the competent authorities of the federal states is regularly necessary.
Offshore wind farms need a permit according to the Marine Facilities Ordinance (SeeAnlV) by the Federal Maritime
and Hydrographic Agency (Bundesamt für Seeschifffahrt und Hydrographie).
United Kingdom
In the United Kingdom, the key financial incentive schemes for the generation of electricity using
renewable and low carbon generation technologies are the renewables obligation, contracts for difference and feed
in tariffs. Any such generation of electricity may only benefit from one of these three financial incentive schemes.
The renewables obligation and contracts for difference are explained in further detail below (feed-in tariffs are
financial incentives for small scale renewable and low carbon generation technologies - typically with a total
installed capacity of 5 MW or less).
Renewables obligation (“RO”). The RO was introduced in England, Wales and Scotland in 2002 and
Northern Ireland in 2005 to encourage the development of large scale renewable electricity generation. It requires
electricity suppliers to source an increasing portion of their supplied electricity from renewable sources. Those who
generate qualifying renewable electricity (i.e., generating stations that have been accredited by the Office of Gas
and Electricity Markets (“Ofgem”) are awarded up to five tradable certificates known as renewables obligation
certificates (“ROCs”) by Ofgem for each MWh of electricity generated for a period of 20 years from accreditation.
To be fully accredited by Ofgem, generating stations must meet certain statutory criteria, including that the
generating station has been commissioned. Further criteria must be satisfied on a monthly basis in order for ROCs
to be issued (namely the submission of output data).
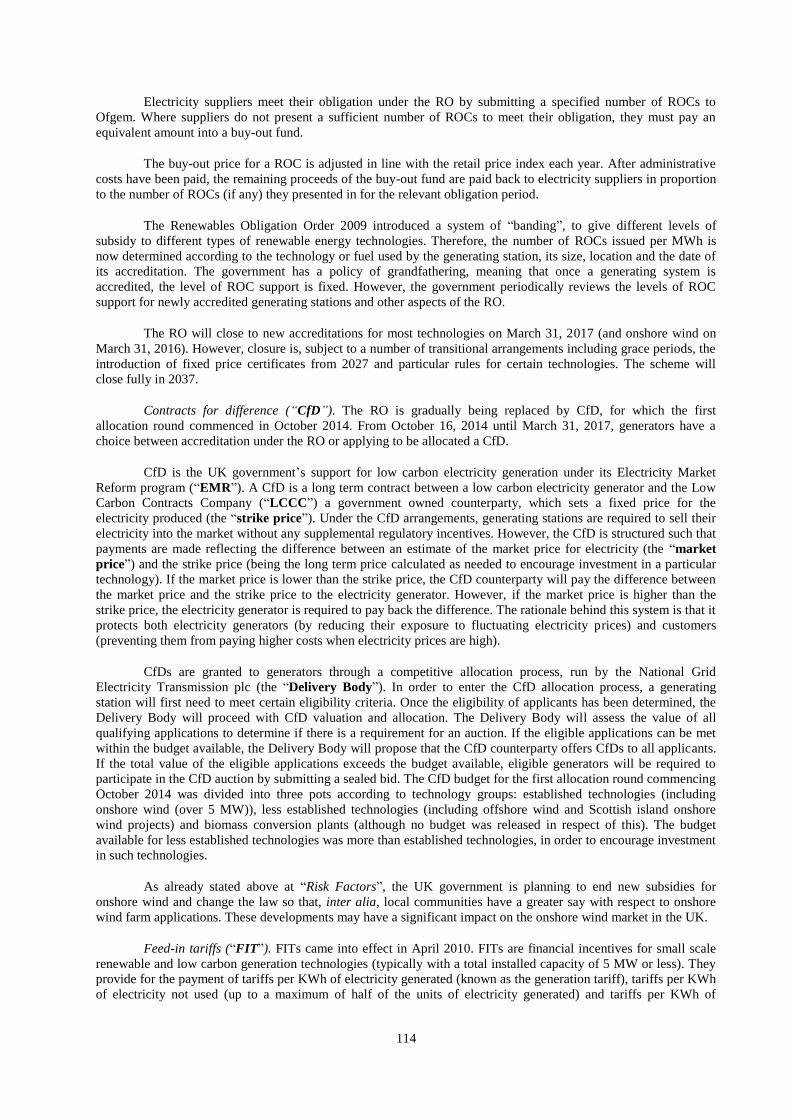
114
Electricity suppliers meet their obligation under the RO by submitting a specified number of ROCs to
Ofgem. Where suppliers do not present a sufficient number of ROCs to meet their obligation, they must pay an
equivalent amount into a buy-out fund.
The buy-out price for a ROC is adjusted in line with the retail price index each year. After administrative
costs have been paid, the remaining proceeds of the buy-out fund are paid back to electricity suppliers in proportion
to the number of ROCs (if any) they presented in for the relevant obligation period.
The Renewables Obligation Order 2009 introduced a system of “banding”, to give different levels of
subsidy to different types of renewable energy technologies. Therefore, the number of ROCs issued per MWh is
now determined according to the technology or fuel used by the generating station, its size, location and the date of
its accreditation. The government has a policy of grandfathering, meaning that once a generating system is
accredited, the level of ROC support is fixed. However, the government periodically reviews the levels of ROC
support for newly accredited generating stations and other aspects of the RO.
The RO will close to new accreditations for most technologies on March 31, 2017 (and onshore wind on
March 31, 2016). However, closure is, subject to a number of transitional arrangements including grace periods, the
introduction of fixed price certificates from 2027 and particular rules for certain technologies. The scheme will
close fully in 2037.
Contracts for difference (“CfD”). The RO is gradually being replaced by CfD, for which the first
allocation round commenced in October 2014. From October 16, 2014 until March 31, 2017, generators have a
choice between accreditation under the RO or applying to be allocated a CfD.
CfD is the UK government’s support for low carbon electricity generation under its Electricity Market
Reform program (“EMR”). A CfD is a long term contract between a low carbon electricity generator and the Low
Carbon Contracts Company (“LCCC”) a government owned counterparty, which sets a fixed price for the
electricity produced (the “strike price”). Under the CfD arrangements, generating stations are required to sell their
electricity into the market without any supplemental regulatory incentives. However, the CfD is structured such that
payments are made reflecting the difference between an estimate of the market price for electricity (the “market
price”) and the strike price (being the long term price calculated as needed to encourage investment in a particular
technology). If the market price is lower than the strike price, the CfD counterparty will pay the difference between
the market price and the strike price to the electricity generator. However, if the market price is higher than the
strike price, the electricity generator is required to pay back the difference. The rationale behind this system is that it
protects both electricity generators (by reducing their exposure to fluctuating electricity prices) and customers
(preventing them from paying higher costs when electricity prices are high).
CfDs are granted to generators through a competitive allocation process, run by the National Grid
Electricity Transmission plc (the “Delivery Body”). In order to enter the CfD allocation process, a generating
station will first need to meet certain eligibility criteria. Once the eligibility of applicants has been determined, the
Delivery Body will proceed with CfD valuation and allocation. The Delivery Body will assess the value of all
qualifying applications to determine if there is a requirement for an auction. If the eligible applications can be met
within the budget available, the Delivery Body will propose that the CfD counterparty offers CfDs to all applicants.
If the total value of the eligible applications exceeds the budget available, eligible generators will be required to
participate in the CfD auction by submitting a sealed bid. The CfD budget for the first allocation round commencing
October 2014 was divided into three pots according to technology groups: established technologies (including
onshore wind (over 5 MW)), less established technologies (including offshore wind and Scottish island onshore
wind projects) and biomass conversion plants (although no budget was released in respect of this). The budget
available for less established technologies was more than established technologies, in order to encourage investment
in such technologies.
As already stated above at “Risk Factors”, the UK government is planning to end new subsidies for
onshore wind and change the law so that, inter alia, local communities have a greater say with respect to onshore
wind farm applications. These developments may have a significant impact on the onshore wind market in the UK.
Feed-in tariffs (“FIT”). FITs came into effect in April 2010. FITs are financial incentives for small scale
renewable and low carbon generation technologies (typically with a total installed capacity of 5 MW or less). They
provide for the payment of tariffs per KWh of electricity generated (known as the generation tariff), tariffs per KWh
of electricity not used (up to a maximum of half of the units of electricity generated) and tariffs per KWh of
115
electricity exported to the grid (known as the export tariff). These tariffs are index linked and their amount depends
on total electricity generated, technology type and when the generating station was installed.
In order to receive FIT payments, the generating station must have been installed by a certified installer
who certified that the generating station met certain certification standards with respect to the small scale generation
of power by individuals, small businesses and communities in order to meet their own needs. Furthermore, the
entity running the generating station must enter into a contract with an electricity supplier (which makes the FIT
payments), and the generating station must be accredited with Ofgem (the energy regulator). The FIT payments are
made for periods of 20 or 25 years, depending on the technology and date of accreditation.
The government has a policy of grandfathering, meaning that once a generating station is accredited, the
FIT tariffs are fixed, but are adjusted in line with the retail price index each year. However, the government
periodically reviews the levels of FIT tariffs for newly accredited generating stations and has introduced measures
to manage the costs of the FIT including digression (meaning that the tariffs for newly accredited generating
stations are progressively reduced) and the multi-installation tariff which provides for reduced FIT tariffs for certain
portfolios of generating stations. Further in September 2015, the UK government launched a consultation with
respect to the FIT for small scale projects. Following such consultation, a pause to the scheme from January 15,
2016 until February 7, 2016 (inclusive) was announced and the development of caps from February 8, 2016
onwards was introduced. These developments may have a significant impact on small scale renewable generation in
the UK.
Generating stations, which are smaller than 50 KW are only eligible for FITs. For generating stations
between 50 KW and 5 MW, they may choose between FITs and the renewable obligation.
France
General regulatory framework. In France, the incentive scheme for FITs is based on the Law 2000-108 on
the Modernization and Development of Public Electricity dated 10 February 2000 (codified in the French Energy
Code, article L. 314-1 and followings), which provides for two systems in favor of renewable energy. First,
electricity suppliers (EDF and the non-nationalized distributors) and distribution grid operators have an obligation,
if so requested by a producer to conclude agreements with the operators of electricity plants that generate electricity
from renewable energy sources. These agreements regard respectively the purchase and payment for electricity at a
price fixed by a ministerial order, as well as the connection to the grid and the operation of the facility. The
ministerial orders for the specific technologies (arrêtés) each determine the FIT for a certain source of energy.
Second, a call for tenders system, set up by the French Commission for Energy Regulation (Commission de
Régulation de l’Energie) for targeted types of facilities, following which operators offer a purchase price for the
electricity they generate.
Challenges against the orders defining the FIT for on-shore wind farms. With respect to onshore wind
farm tariffs, the applicable tariff are set out by two ministerial orders of November 17, 2008 and December 23,
setting out purchase conditions for wind energy electricity (the “2008 Ministerial Orders”). Those orders were
challenged before the Conseil d’Etat (the highest French administrative court) inter alia on the grounds that the
feed-in tariffs regime is a state aid that should have been notified before being implemented. The Conseil d’Etat, in
its decision on May 28, 2014, annulled with retroactive effect, the 2008 Ministerial Orders. Following the judgment
of the European Court of Justice on December 19, 2013, the Conseil d’Etat found that the Renewable Power
Compensation System (contribution au service public de l’électricité – “RPCS”) did qualify as state aid. The
Conseil d’Etat also concluded that the 2008 Ministerial Orders implementing the RPCS were taken in breach of
Article 108(3) (so called “standstill clause”) of the Treaty on the Functioning of the European Union (“TFEU”),
since the scheme had been implemented without prior notification and approval of the EU Commission. As a result,
the Conseil d’Etat annulled the 2008 Ministerial Orders with full retroactive effect. The 2008 Ministerial Orders are
thus considered to be deprived of any legal existence since the date of their enactment at the end of 2008.
The French Ministry of Ecology, Sustainable Development and Energy decided to notify the wind feed-in
tariff regime to the EU Commission, which found it to be compatible with EU law (State aid SA.36511 (2014/C
348/05) and On July 1, 2014, published a new ministerial order dated June 17, 2014 which sets out purchase
conditions for onshore wind energy electricity (the “2014 Ministerial Order”).
The new FIT established by the 2014 Ministerial Order is the same as the FIT set out in the 2008
Ministerial Orders. The 2014 Ministerial Order provides for the same basic tariff and the same indexation formula
116
for evaluating the FIT applicable to the complete requests for power purchase agreements (“PPAs”) filed after
December 31, 2007.
In addition, Article 3 of the 2014 Ministerial Order provides for retroactive application of the new FIT to
any completed applications for PPAs filed since 2007. According to the 2014 Ministerial Order, the FIT set out for
onshore wind farms is A0.82 per KWh (subject to indexation) for the first 10 years. The tariff then varies for the
remaining 5 years, depending on the annual functioning duration of the facility between A0.28 per KWh and A0.82
per KWh (subject to indexation) for onshore wind farms.
On September 1, 2014, third parties challenged the legality of the 2014 Ministerial Order before the
Conseil d’Etat, arguing inter alia that the FIT grants an excessive return on capital to wind energy producers and
that the FIT should be considered a state subsidy that should have previously been voted on in conjunction with the
annual finance bill.
The Conseil d’Etat only has jurisdiction to rule on the lawfulness of the 2014 Ministerial Order. Thus, the
lawfulness of the PPAs should not necessarily be directly affected by the decision of the Conseil d’Etat. In order to
challenge individual PPAs, a specific action would need to be filed by a contractual party or other interested third
parties. Subject to such proceedings, performance and commissioning under the PPAs currently in force should
continue. However, it is difficult to anticipate with certainty the consequences of a potential annulment of the 2014
Ministerial Order insofar as there is uncertainty regarding (i) the grounds of the potential annulment of the 2014
Ministerial Order, (ii) the final decision of the French government on the issuance of a new order and (iii) on a
potential requirement to reimburse the FITs.
The Law n°2015-992 dated 17 August 2015 on the energy transition for green growth (the Law on Energy
Transition). The law was published on 18 August 2015. It aims at reducing greenhouse gas emissions by 40% by
2030 and to increase the percentage of electricity generation from renewable energies to 40% and the percentage of
gross final consumption of energy from renewable energies to 32%. The Law on Energy Transition includes inter
alia two main sets of measures concerning renewable energy. It modifies the regime of incentives relating to
renewable energy sources and provides new rules for the establishment of onshore wind farms.
Regarding the modification to the incentive schemes, the Law on Energy Transition introduces a new
mechanism, the so-called “supplementary remuneration” (“Supplementary Remuneration”), which integrates into
French law the market premium mechanism promoted by the guidelines on State aid for environmental protection
and energy 2014-2020 issued by the European Commission. Draft decrees relating to the supplementary
remuneration and purchase obligation and on the list and characteristics of facilities concerned (the “Draft
Decrees”) have been issued for the purpose of consultation in September 2015 and divided into two decrees in
October 2015. Those decrees, if adopted, are expected to enter into force on January 1, 2016. The mechanisms
described hereafter may be modified in the final versions of the decrees.
The Supplementary Remuneration is an ex-post premium equal to the difference between the average sale
price observed on the market and a target price (based on the average operating cost of a well-functioning facility)
set by an order for each renewable energy sector. Producers can enter into an agreement with an offtaker that
includes a supplementary remuneration clause, for a maximum duration of 20 years. Supplementary Remuneration
contract can also apply within call for tenders. The Supplementary Remuneration will be supplemented by a
management premium that aims at compensating the costs of access to the electricity market for electricity
generators. In the event of negative energy premiums, the producer would be required to repay the overpayments,
within the limit of the total amount of premiums received since the beginning of the contract, including management
premiums.
The Law on Energy Transition and the Draft Decrees also provide for a new last resort buyer mechanism,
in the event of a producer failing to sell the electricity generated by their facility on the market. In such case, a last
resort purchase contract replaces the supplementary remuneration contract. The remuneration will however be
capped at 80% of the total remuneration that would have been received from the sale of the electricity on the market
plus the payment of supplementary remuneration. Buyer management fees will also be deducted. The last resort
supplementary remuneration contract has a three-month renewable term and will be established on the basis of a
template approved by the minister in charge of energy.
The Draft Decrees would allow onshore wind farms to choose between the Supplementary Remuneration
or the preferential FIT. For facilities already in operation, the Draft Decrees provide for the possibility for producers
to request the early termination of their PPA in order to benefit from a Supplementary Remuneration contract, either
117
for the remainder of the term initially provided for in the PPA, or for the normal term of the Supplementary
Remuneration contract, on the condition of having implemented an investment plan.
According to a public statement of the Minister of Energy dated October 8, 2015, the FIT scheme for on-
shore wind farms should not be modified at least until 2018.
Regarding new rules for the establishment of onshore wind farms, the Law on Energy transition aims at
inter alia (i) enhancing minimal distance 500 meters between WTGs and housing, such minimal distance being
assessed on the basis of the environmental impact study, (ii) requesting a favorable decision of the local authority
when local planning regulations indicate that the construction of WTGs “incompatible with the neighboring
inhabited areas”, (iii) extending the obligation to provide an explanatory note to the representative body of town of
less than with fewer than 3,500 inhabitants when requesting the authorization under classified facility regulation,
(iv) allowing the possibility of participatory funding (possibility for neighboring inhabitants and local authorities to
take a stake in the capital of the company implementing the Project), (v) limiting at 18 months the duration of grid
connection months (for renewable energy facilities whose power exceeds 3 kv) and (vi) generalizing the
experimentation of a single administrative authorization for wind farm projects (building permits, area clearing,
protected species and legislation on classified facilities for the protection of the environment would be awarded
following a single procedure).
The French incentive for renewables is funded by taxes levied on the consumer’s energy bill (the so-called
(contribution au service public de l’électricité - RPCS). This tax could be modified in the future, in order to extend
the tax base to carbon intensive energy sources such as gas and gasoline. The tax would be channeled directly to the
national budget. The French government indicated on October 15, 2015 that such reform would be postponed until
2017.
With respect to the offshore wind farms, the incentive scheme is based on the power purchase obligation
introduced in the calls for tenders launched by the French government at a fixed price determined by the bidders in
their submission. Up to now, two tender procedures were completed for six projects awarded regarding offshore
wind farms. None of them is at the operation stage
Canada
Canadian energy policy reflects the constitutional division of powers between the federal government and
the provincial governments. The Constitution of Canada largely places natural resources, including renewable
energy production, under the jurisdiction of provinces.
In Ontario, the FIT program was introduced following the introduction of the Ontario Green Energy Act
2009 (“GEA”). The FIT Program includes two streams (i) the FIT Program, which is open for projects greater than
10 KW, and (ii) a simplified program, known as the microFIT program, for projects of 10 KW or less. The FIT
Program originally contained “made in Ontario” requirements, known as the domestic content requirements, which
required program participants to use or employ a certain amount of Ontario labor and manufacturing in eligible
projects. Following a World Trade Organization ruling that such content requirements were inconsistent with
Canada’s WTO obligations, the FIT Program was revised to reduce the domestic content requirements for contracts
awarded on or after August 16, 2013, and was subsequently further amended to remove domestic content
requirements from any contracts entered into on or after July 25, 2014.
In June 2013, the Ontario’s Minister of Energy announced that the Province’s future FIT program would
be limited to smaller projects (less than 500 KW) and that a cap of 900 MW of additional capacity would be set for
deployment by 2018. For larger projects, a competitive bidding system known as the Large Renewable Procurement
has been established for procuring large renewable energy projects (greater than 500 KW). This bidding system
does not apply to projects which have already been contracted.
The FIT program is administered by the Ontario Power Authority (“OPA”) and offers different levels of
tariffs for electricity depending on the renewable source. The contract for payment of tariffs is 20 years for
renewable energy derived from renewable fuels other than hydropower and 40 years for hydropower.
The OPA is required to review the prices offered to generators under the FIT and microFIT programs on an
annual basis to ensure both ratepayer value and a fair return on investment. The most recent price schedule was
released on September 30, 2014, and applies to any FIT contracts offered after September 30, 2014, and January 1,
2015, for microFIT.
118
In addition, initiatives to foster renewable energies on the federal level include the Accelerated Capital
Cost Allowance, which grants an accelerated write-off for renewable energy equipment acquired before 2012; the
Canadian Renewable Conservation Expenses (“CRCE”), which states that certain expenditures relating to
renewable energies are fully tax deductible; the Sustainable Technology Development Canada fund, which aims at
stimulating air quality via, inter alia, renewable energies; the Green Municipal Fund, which supports municipal
projects relating to renewable energies; and the Program of Energy Research and Development (“PERD”), which
funds technology initiatives for renewables. The provinces of New Brunswick, Nova Scotia and Prince Edward
Island have set up requirements (“Renewable Portfolio Standard”) for electricity providers to obtain a minimum
percentage of their electricity supply from renewable energy sources. Although there is no specific indication that
these measures, which are favorable to the wind energy business, will be ceased by the Canadian federal
government or the state governments, this risk cannot be excluded. The province of British Columbia has also set up
the Standing Offer Program (“SOP”), which was developed for projects up to 15 MW and involves a streamlined
process, a simplified contract and decreased transaction costs, while remaining cost-effective for rate payers.
Australia
The Renewable Energy Target (“RET”) scheme is designed to ensure that approximately 23.5% of
Australia’s electricity comes from renewable sources by 2020. Since January 2011, the RET scheme has operated in
two parts—the Small-scale Renewable Energy Scheme (“SRES”) and the Large-scale Renewable Energy Target
(“LRET”). The RET scheme is administered by the Clean Energy Regulator (“CER”), a Federal government
agency which operates in accordance with the provisions of the Renewable Energy (Electricity) Act 2000 (Cth). The
CER operates separately to the FIT schemes administered by State governments.
Large-scale renewable energy target (“LRET”). Renewable power stations generate large-scale generation
certificates (“LGC”) based on the amount of renewable energy they produce above their pre-determined baseline.
An LGC is equivalent to 1 MWh of renewable electricity generated above the baseline. Liable entities (typically
electricity retailers) are required to purchase and surrender LGCs to the CER to discharge their liability under the
“renewable power percentage” (“RPP”), which is set annually under regulation. LGCs are purchased through the
LGC market. The LRET creates a financial incentive for large-scale wind energy stations by providing a mechanism
for the creation of LGCs by these power stations according to how much renewable energy electricity they produce
and placing a legal liability on liable entities to purchase an amount of LGCs from these power stations to meet the
annual target.
Small-scale renewable energy scheme (“SRES”). The SRES provides a financial benefit for individual
homeowners and other entities who wish to install eligible solar water heaters, air source heat pumps and small-
scale (i.e., less than 100 KW) solar photovoltaic panels, wind and hydro systems. Installation of these units permits
the creation of small-scale technology certificates (“STC”), according to the amount of electricity they are expected
to produce or displace in the future. A STC, which is generally equivalent to 1 MWh of renewable energy, can be
exchanged for financial benefit to the unit owners and is issued through an online registry which is managed by the
CER. While owners of renewable energy systems are able to create and sell the STCs themselves, in practice,
installers of these systems usually offer a discount on the price of an installation or a cash payment in return for the
right to create the STCs. The SRES places a legal liability on liable entities (typically electricity retailers and also
RET-liable entities with an obligation under the LRET) to purchase and surrender to the CER an amount of STCs
on a quarterly basis. The amount of STCs to be surrendered is based on the small-scale technology percentage
which is set annually under regulation.
Potential Revision of RET. The RET scheme was the subject of a comprehensive review by an independent
panel appointed by the Federal government. The panel’s report, which was released on 28 August, 2014, made a
number of findings in relation to the usefulness and ongoing operation of both the LRET and SRES. The panel
recommended that the LRET either be closed to new entrants or substantially amended to reflect the RET scheme’s
intention of ensuring 20% of Australian electricity is produced from renewable sources. The panel also
recommended that the SRES either be abolished or its planned 2030 phase-out be brought forward.
The Federal government finalized its response to the panel’s report in June 2015 and enacted the
Renewable Energy (Electricity) Amendment Act 2015 on 26 June 2015 to implement its changes. The Act increased
Australia’s RET to 23.5% by 2020 (from 20%) and revised the LRET to be 33,000 GWh annually by 2020 (from
the 41,000 GWh target originally proposed by the Federal government in 2009). This LRET is double the amount of
renewable energy generation compared to current levels and to deliver this LRET will require approximately 6000
MW of new renewable energy capacity to be built by 2020. There are already projects with planning approval
equating to approximately 6600MW covering wind, large-scale solar, hydro power and bioenergy technologies in
119
place. The SRES is to continue unchanged under the new legislation. The revised target is expected to create more
than AUD10 billion worth of investment and more than 6500 new jobs in large-scale renewable energy alone.
Including the economic benefits from SRES, the total benefit is expected to be AUD40.4 billion of investment and
15,200 new jobs.
In addition to these key changes, the Bill will also make a number of other changes. This includes
increasing the rate of exemption from LRET liability for electricity used in undertaking emissions-intensive and
trade exposed activities (for example, users such as aluminum smelters that are unable to pass on costs associated
with the RET due to international competition for their output) to 100% and amending the Renewable Energy
(Electricity) Regulations 2001 (Cth) to reinstate native forest wood waste as an eligible renewable source under the
same conditions that existed prior to its removal from eligibility in 2011 (which includes a requirement that the
biomass arise from a harvesting activity where the primary purpose is not energy production – referred to as a ‘high-
value process’). The periodic review of the operation of the Renewable Energy (Electricity) Act 2000 (Cth) has also
been repealed. Instead, the CER will be required to submit an annual statement to Parliament that charts progress
towards achievement of the targets and provides an estimate of the impact that RET has had on electricity prices
during the year.
In October 2015, the Australian Government appointed a National Wind Farm Commissioner with
members of the Independent Scientific Committee on Wind Turbines. The role of the Commissioner will be to
facilitate the resolution of complaints from concerned community residents about, and to provide greater
transparency on the operations of wind farms. An annual report by the Commissioner will be made to the Australian
Parliament. Similarly, the Committee will provide advice on the science and monitoring of potential impacts of
wind turbine sound on health and the environment, providing an Annual Report to the Australian Parliament. The
Commissioner and Committee have been appointed as the settlement of the RET is expected to primarily lead to
increased construction of wind turbines in the next five years.
The Federal government has additionally set up various funds to promote the growth of renewable
energies. Programs that have been set up by the Australian Renewable Energy Agency (“ARENA”) include: the
Advancing Renewables Program (“ARP”) which supports a broad range of development, demonstration and pre-
commercial deployment projects that have potential to lower the cost and increase the use of renewable energy
technologies in Australia in the long term; the Renewable Energy Venture Capital Fund (“REVCF”), created to
provide venture capital and active investment management to encourage the development of Australian companies
that are commercializing renewable energy technologies; and a general Research and Development Program which
supports renewable energy technology that will increase the commercial deployment of renewable energy
technology in Australia. Closed programs and initiatives include the Supporting High Value Australian Renewable
Energy (“SHARE”) initiative which sought to enhance the understanding of renewable energy grid integration; the
Accelerated Step Change Initiative (“ASCI”), which was designed to foster exceptional breakthrough projects that
are not otherwise eligible under existing programs; the Regional Australia’s Renewables (“RAR”), aimed at
supporting renewable energies in remote areas with the aim of increasing the use of these technologies for power
generation once they become affordable, and the Emerging Renewables Programme (“ERP”) which supports the
development, demonstration and early stage deployment of renewable energy technologies. The Clean Energy
Finance Corporation (“CEFC”), an Australian Government-owned organization also provides loans on preferential
terms to facilitate increased flows of finance into the renewable energy sector.
In addition to these federal initiatives, the Australian states have implemented various programs to
complement the federal effort.
In November 2008, the Council of Australian Governments (“COAG”) agreed to a set of national
principles to apply to new Feed-in Tariff schemes, which are aimed at promoting consistency across the country. In
December 2012, the COAG agreed on revised National Principles for Feed-in Tariff Arrangements, which outline,
amongst other things, that all premium FiT arrangements were to be closed to new participants by 2014.
Furthermore, all other FiT customers were to receive a ‘fair and reasonable’ value for their exported electricity.
Consistent with this, premium FiT schemes are now closed to new participants and each Australian jurisdiction has
determined new ‘fair and reasonable’ values for exported electricity for new FiT customers. Electricity retailers may
voluntarily pass on a higher FiT amount as part of their unregulated market offers.
As a result, all of the states and territories of Australia have introduced or are in the process of introducing
FiT/reverse auction schemes. For example, the State of Victoria has devised a FIT scheme for microgeneration of
renewable energies, which will be closed to new applicants when certain goals are met or certain cost thresholds are
exceeded, the Residential Net Feed-in Tariff for Western Australia and the New South Wales Solar Bonus Scheme
120
have been closed to new applicants, but remain in effect for admitted beneficiaries. Although there is no impending
indication that these favorable measures will be ceased by the Australian federal government or the state
governments, this risk cannot be excluded.
India
In India, the key incentive schemes for renewable energies include feed-in tariffs, renewable purchase
obligations, generation based incentives and renewable energy certificates. The summary below describes some
sector specific regulations and policies and is not exhaustive nor does it include all state or local government
specific regulations and policies.
Under the Electricity Act 2003, the activity of generation of the power does not require any license or
permission. Necessary registrations for generation of wind energy and permission for inter-grid connectivity are
required to be obtained from the respective state agencies. The Electricity Act 2003 further requires that a certain
percentage of power generation is to be obtained from renewable energy sources by all distribution companies. In
addition, the Electricity Regulatory Commissions Act 1998 requires that the tariffs and wheeling charges are
required to be stipulated by the respective state regulatory commissions
FITs: The National Tariff Policy sets out various parameters to be followed by the central electricity
regulatory commission (“CERC”) and the various state electricity regulatory commissions (“SERCs”), as the case
may be, for determining the appropriate FIT, including, but not limited to: (i) the return on investment for the
project developer, (ii) equity norms for financing of future capital cost of projects, and (iii) the benefits obtained
should be considered in a manner so as to provide adequate incentives to the project developers. Various SERCs
have based the tariffs of renewable sources generation on the type of renewable energy. FITs vary across the states
depending upon the state’s resources, project cost and other tariff computing parameters. FITs are adopted on a
“cost plus” methodology. However, there is wide divergence in the tariffs for different technology types set by
SERCs across the country. For example, the state of Rajasthan fixed the FIT for the financial year 2015-2015 at
5.64 INR/kWh if a higher depreciation benefit is not availed and at 5.31 INR/kWh if a higher depreciation benefit is
availed for wind power plants in the Jaisalmer, Jodhpur and Barmur districts and at 5.93 INR/kWh if a higher
depreciation benefit is not availed and at 5.57 INR/kWh if a higher depreciation benefit is availed for wind power
plants in other districts within Rajasthan. For comparison, the state of Gujarat has set the tariff at 4.15 INR/kWh for
electricity generated from wind sources.
Renewable Purchase Obligation (RPO) Framework: The Renewable Purchase Obligation (“RPO”) is
designed to create demand for renewable energy across the country. Under the Electricity Act, 2003, the National
Electricity Policy, 2005 and the National Tariff Policy, 2006, SERCs are obligated to purchase a certain percentage
of their total consumption of power from renewable energy sources. However, renewable energy sources are not
evenly spread across different parts of the country and in some states the potential of renewable energy sources is
significantly limited. This inhibits SERCs in some states from specifying higher RPOs. Various SERCs have
specified a RPO and across the country RPOs vary from 2% to 10%. For example, the state of Gujarat set its RPO
for wind energy to 5.50% for 2012-2013, 5.50% for 2013-2014, 6.25% for 2014-2015, 7.00% for 2015-2016 and
7.75% for 2016-2017. For comparison, the state of Andhra Pradesh set its RPO for renewable energy sources to
5.00% for 2012-2017 and requires that 0.25% of its 5.00% RPO is met by solar energy.
Generation Based Incentive Scheme: In order to encourage investment in the wind power sector, the
Generation Based Incentive Scheme for Wind Power Projects dated December 17, 2009 (“GBI Scheme”) was
adopted. Under the GBI Scheme, a GBI is provided to wind electricity producers at the rate of INR 0.50 per unit of
electricity fed in to the grid for a period not less than four years and a maximum period of ten years with a cap of
INR 10,000,000 per MW. The total disbursement in a year will not exceed one fourth of the maximum limit of the
incentive, i.e., INR 2.50 million per MW during the first four years. The GBI scheme has a target of 15,000 MW.
The GBI Scheme is applicable only for those power producers who do not take advantage of the accelerated
depreciation benefits under the Income Tax Act, 1961.
Certificate for Renewable Energy (“REC”): RECs are intended to address the mismatch between the
required RPOs and the availability of renewable energy sources across the country by creating a national market for
renewable energy generation. Renewable energy producers will have two options: (1) sell their renewable energy
with a preferential tariff or (2) sell their renewable energy and separately sell the environmental benefits associated
with the renewable energy generation. When a renewable energy producer elects the second option, the
environmental benefits can be exchanged into a REC. The price of the electricity generated would be equivalent to
the weighted average power purchase cost of the distribution company including short-term power purchases, but
121
excluding renewable energy power purchase cost. The REC will be equivalent to 1 MWh of electricity. The REC
will be exchanged on in power exchanges approved by the CERC within a pricing band to be determined by CERC.
Other market participants will have the option of purchasing RECs to meet their RPO.
Permits: The Ministry of New and Renewable Energy set requirements for supplying and installing
equipment for wind power projects. These conditions include type certification by independent testing and
certification agencies (either the National Institute of Wind Energy (“NIWE”) or an approved international
certification agency) to ensure quality of the WTGs manufactured. In addition, renewable energy generation product
manufacturers are required to be registered with NIWE as an approved WTG manufacturer. Further, WTG
manufacturing facilitates should obtain third party certification from TUV-SÜD, DNV or Lloyds in relation to either
product inspection or the ISO 9000 series of standards for internal quality control in manufacture (normally ISO
9001 or 9002) and for field installations.
Turkey
The primary source of legislation governing renewable energy sources in Turkey is the Renewable Energy
Law No. 53461 (the “Renewable Energy Law”). The Energy Market Regulatory Authority (“EMRA”) is the
competent administrative authority responsible for the regulation and supervision of the electricity market. EMRA
is authorized to issue secondary legislation implementing the Renewable Energy Law, to issue generation licenses
for renewable energy companies, to supervise the market and to impose sanctions to license holders.
The Renewable Energy Law provides a purchase guarantee for electricity generated by renewable energy
companies. Electricity suppliers (supplying electricity to end users) are required to purchase a certain percentage of the
cumulative amount of electricity that they sold in the previous year from renewable energy companies participating
in the Renewable Energies Support Mechanism (“YEKDEM”). Such purchase guarantee is applicable for the first
ten years of operation of renewable energy companies.
Pursuant to the Renewable Energy Law, the purchase obligation will be implemented through a program.
All electricity suppliers subject to a purchase obligation and all renewable energy companies that elect to participate
in YEKDEM will participate in this program, instead of concluding separate bilateral agreements for each sale
transaction between each supplier and each renewable energy company.
The Market Financial Settlement Centre (“MFSC”) determines (i) the total generation by each power plant
included in this program for each invoice period, and (ii) the price to be paid for each power plant. The sum of the
prices determined for each power plant is determined and announced for each respective invoice period.
The purchase obligation ratio of each supplier is determined by MFSC by determining the ratio of the
amount of energy supplied to the final consumers by each of the suppliers for the same invoicing period to the total
amount of energy supplied to all of the final consumers in Turkey. The amount corresponding to the share of each
supplier is then calculated by multiplying the purchase obligation ratio of each supplier with the total price to be
paid to the renewable energy companies and notified to the parties and invoiced to the related supplier by MFSC.
Renewable energy companies are eligible to participate in this program on an annual basis at the beginning of each
calendar year; and they cannot leave the program during that year.
Those companies that do not wish to participate in the program can sell electricity on the open market and
can sign bilateral energy sale/purchase agreements. In such cases, however, they would not be entitled to benefit
from the purchase and price guarantee incentives of the Renewable Energy Law.
The Renewable Energy Law provides a minimum price guarantee (feed-in tariff) for the electricity
generated by renewable energy companies. The feed-in tariff for different types of renewable energy sources is as
follows:
Turkey feed-in tariff
First 10 years of operation
(US dollar cents/KWh)
Hydropower........................................................................................... 7.3
Wind ...................................................................................................... 7.3 Geothermal ............................................................................................ 10.5
Solar ...................................................................................................... 13.3
Biomass (including landfill gas) ............................................................ 13.3
1 Published in the Official Gazette No. 25819 dated May 18, 2005.
122
The above figures are envisaged to apply only to power plants that will be commissioned on or before
December 31, 2020. The fixed guaranteed prices and the terms applicable for the power plants to be commissioned
after December 31, 2020 shall be regulated by Council of Ministers’ Decrees, but such prices shall not exceed the
above-stated prices. Such minimum price guarantee is applicable for the first 10 years of operation of renewable
energy companies.
The Renewable Energy Law also provides a domestic production incentive for projects commissioned by
December 31, 2015 (extended until December 31, 2020 by Council of Ministers) that use mechanical or
electromechanical components produced in Turkey. The level of additional incentives will depend on the share of
domestically produced components used in the plant. The additional incentives will be available for 5 years from the date
of commencement of commercial operation of the plant. Annexed to the Renewable Energy Law, there is a chart stating,
in detail, the incentive level for each type of component. The Council of Ministers is authorized to determine the domestic
production incentives available for renewable energy producers to be commissioned after December 31, 2020. At least
55% of the equipment must be domestically produced to benefit from this incentive.
123
DESCRIPTION OF CERTAIN FINANCING ARRANGEMENTS
Revolving Credit and L/G Facilities Agreement
By agreement dated March 30, 2015, as amended and restated on April 26, 2015, TopCo, as guarantor,
Holding as borrower and guarantor and MidCo as guarantor entered into the Revolving Credit and L/G Facilities
Agreement providing for (i) a revolving credit facility in an aggregate amount of €125.0 million (with an increase
option subject to a maximum aggregate amount of €125.0 million exercisable by TopCo subject to certain
requirements being met) and (ii) the L/G Facility in an aggregate amount of €825.0 million (with an increase option
subject to a maximum aggregate amount for the L/G Facility of €1,000.0 million exercisable by TopCo subject to
certain requirements being met). Senvion acceded to the Revolving Credit and L/G Facilities Agreement as
borrower and guarantor on April 29, 2015.
The Revolving Credit Facility matures on March 30, 2020 and may be used for the general corporate
purposes of the Group. The Revolving Credit Facility may be used for the drawing of loans (in Euro, sterling and
U.S. dollar or any other currency or currencies agreed by the facility agent, acting on the instructions of all
Revolving Credit Facility lenders). Any loan made available under the Revolving Credit Facility shall be repaid on
the last day of its interest period and all amounts outstanding under the Revolving Credit Facility must be repaid on
the final maturity date. As of December 31, 2015, the Revolving Credit Facility was undrawn.
The L/G Facility is available to be drawn by a borrower and matures on March 30, 2020 and may be used
for the issuance of, among other things, warranty guarantees, payment guarantees, advance payment guarantees,
performance guarantees, customs guarantees, dismantling guarantees, tender guarantees and other types of letters of
credit, sureties and guarantees (each an “L/G”). Each borrower shall, no later than the final maturity date, provide
the relevant issuing bank with cash cover (or such other security which is satisfactory to the relevant issuing bank in
its sole discretion) in respect of each L/G issued by that issuing bank, unless that issuing bank agrees to continue to
provide an L/G under other arrangements.
As of December 31, 2015, €479.0 million of the L/G Facility were utilized by the Group.
Ancillary Facilities
A Revolving Credit Facility, a lender (or an affiliate of a lender) may make an ancillary facility available
by way of an overdraft credit facility, a guarantee, bonding, documentary letter of credit or similar instrument, a
short term facility, a derivatives facility, a foreign exchange facility or any other facility or accommodation which is
agreed by TopCo and the relevant ancillary lender, to a borrower in place of all or part of its unutilized Revolving
Credit Facility commitment (provided the maximum total amount of all ancillary facility commitments may not
exceed €30.0 million). As of December 31, 2015, the ancillary facilities were undrawn.
Interest and Fees
The Revolving Credit Facility bears interest at a rate of LIBOR or, in relation to loans in Euro, EURIBOR
(or for loans in a non-LIBOR currency, at the relevant benchmark rate), plus the applicable margin. The initial
applicable margin in relation to the Revolving Credit Facility is 3.50% per annum and will be adjusted, subject to
certain conditions (including, but not limited to, if no event of default has occurred and is continuing), starting after
delivery of the financial statements and corresponding compliance certificate in respect of the testing period ending
on March 31, 2016, to a percentage rate per annum determined in accordance with a gross leverage ratio related
margin grid with a range from 3.50% per annum to 3.00% per annum.
The L/G Facility bears a commission (the “L/G Commission”) for each day with respect to each
outstanding L/G at a rate of the applicable margin. The initial applicable margin in relation to the L/G Facility is
2.25% per annum and will be adjusted, subject to certain conditions (including, but not limited to, if no event of
default has occurred and is continuing), starting after delivery of the financial statements and corresponding
compliance certificate in respect of the testing period ending on March 31, 2016, to a percentage rate per annum
determined in accordance with a gross leverage ratio related margin grid with a range from 2.25% per annum to
1.75% per annum. Only 50% of the then applicable L/G Commission is payable in respect of any L/G in respect of
which, and to the extent that, a borrower has provided cash cover (or a counter guarantee issued by a bank or any
other security which, in each case, is satisfactory to the relevant issuing bank in its sole discretion).
124
TopCo is required to pay a commitment fee on any available but undrawn commitments under the
Revolving Credit Facility at a rate of 35% of the then applicable margin. The commitment fee is payable quarterly
in arrears or, if cancelled in full, on the cancelled amount of the lenders commitment at the time cancellation is
effective.
No commitment fee required to be paid, quarterly in arrear from April 29, 2015 and within five business
days of the L/G agent notifying us of the accrued amount, a commitment fee on the available but undrawn
commitments under the L/G Facility at a rate of 35% of the then applicable margin for the period commencing on
April 29, 2015 and ending on the final maturity date for the L/G Facility (or, if earlier, the date on which the L/G
Facility is cancelled in full).
We are not required to pay any commitment fees to a lender for so long as it is a defaulting lender. We are
also required to pay customary fees in relation to the issuance of L/Gs and ancillary facilities and certain fees to the
Facility Agent, the L/G Agent and the Security Agent under the Revolving Credit and L/G Facilities Agreement.
Guarantees and Security
The Revolving Credit Facility and the L/G Facility are guaranteed, subject to certain limitations due to
applicable corporate law provisions and contractual provisions, by TopCo, MidCo, Holding, Senvion and certain
other significant Group companies and are secured by the same collateral that secures the Notes and the Notes
Guarantees.
The Revolving Credit and L/G Facilities Agreement further provides that, as at the end of each testing
period, TopCo shall ensure that the aggregate of earnings before interest, tax, depreciation and amortization of all
guarantors and gross assets of all guarantors (calculated on an unconsolidated basis and excluding all intra-group
items) represent not less than 80% of Consolidated EBITDA (as defined in and calculated in accordance with the
Revolving Credit and L/G Facilities Agreement) and the consolidated gross assets of the restricted group,
respectively, provided that no breach of the guarantor coverage shall occur if within 30 days of the delivery of the
relevant financial statements for that testing period TopCo procures that additional restricted subsidiaries become
guarantors such that if they had been guarantors on the relevant testing date, the 80% test would have been satisfied.
Voluntary Cancellation and Prepayment and Mandatory Prepayment / Change of Control
TopCo may, if it gives the facility agent at least 5 business days prior notice, cancel the whole or, subject
to a minimum cancellation amount of €5.0 million, part of an available Facility at any time. Any such cancellation
will reduce the commitments of the lenders under the affected Facility ratably.
Subject to certain conditions and applicable break costs, each borrower may voluntarily prepay all or,
subject to a minimum prepayment amount of €5.0 million, part of a loan made available to it under the Revolving
Credit Facility at any time by giving the facility agent not less than 5 business days prior notice. Amounts prepaid in
respect of the Revolving Credit Facility may be reborrowed.
Subject to certain conditions, each borrower may voluntarily prepay all or, subject to a minimum
prepayment amount of €5.0 million, part of any L/Gs made available to it under the L/G Facility by giving the L/G
agent not less than 5 business days prior notice. Amounts prepaid shall be cancelled and the cancelled
commitment(s) under the L/G Facility shall be applied pro rata across all L/G Facility lenders.
The borrowers also have certain other voluntary prepayment and cancellation rights that are available to
them upon the occurrence of certain events in accordance with the terms of the Revolving Credit and L/G Facilities
Agreement.
In addition to voluntary prepayments, the Revolving Credit and L/G Facilities Agreement requires
mandatory prepayment and cancellation of the Revolving Credit Facility or the L/G Facility, as the case may be:
with respect to any lender, if it becomes unlawful in any applicable jurisdiction for such lender to
perform any of its obligations under the Revolving Credit and L/G Facilities Agreement or to fund,
issue or maintain its participation in any utilization under the Revolving Credit and L/G Facilities
Agreement; and
125
with respect to any lender that requires prepayment after the expiry of a 30-business day negotiation
period following a change of control event (which would, inter alia, occur if Centerbridge Capital
Partners II, L.P., Centerbridge Capital Partners III, L.P. or any funds controlled by Centerbridge
Capital Partners II, L.P. or Centerbridge Capital Partners III, L.P. cease (directly or indirectly) to hold
shares carrying more than 50% of the voting rights in TopCo).
Financial Covenants
The Revolving Credit and L/G Facilities Agreement requires TopCo to comply with the following financial
covenants:
a maximum consolidated net leverage ratio of 2.65 to 1.0 (or, from and including the testing date
falling on or about June 30, 2018, 2.45 to 1.0); and
a minimum consolidated interest cover ratio of 2.25 to 1.0 (or, from and including the testing date
falling on or about June 30, 2018, 2.45 to 1.0).
The financial covenants will be tested quarterly.
TopCo is permitted to prevent or cure breaches of the financial covenants by electing to apply cash
proceeds received by the restricted group pursuant to any new equity or subordinated shareholder debt as a cure
amount. TopCo may not make such election (i) more than four times prior to the final maturity date under the
Revolving Credit and L/G Facilities Agreement, or (ii) in consecutive testing periods.
General Undertakings
TopCo and its restricted subsidiaries are subject to certain restrictive and, as the case may be, affirmative
covenants under the Revolving Credit and L/G Facilities Agreement customary for these types of financing, which,
in turn, are subject to certain specified exceptions and qualifications (customized to our business and adjusted to our
current credit standing). These restrictive and affirmative covenants largely replicate those covenants that apply
under the Notes, subject to certain agreed amendments and exceptions, but also provide for further customary
restrictive and affirmative covenants. Additionally, under the Revolving Credit and L/G Facilities Agreement, we
have the obligation to provide certain financial information and other information regarding our financial condition,
business, assets and operations to the lenders.
Restrictions on Dividend Payments
The Revolving Credit and L/G Facilities Agreement allows payments and dividend distributions to direct
and indirect shareholders of TopCo, if and to the extent TopCo’s consolidated net leverage ratio would not exceed
0.75 to 1.0 on a pro forma basis giving effect to such distribution. The dividend amount permitted to be distributed
based on the consolidated leverage ratio test will be the lower of (i) the amount calculated by deducting from the
consolidated net leverage the normalized amount of cash and cash equivalents over the last two financial quarters
and (ii) the amount calculated by deducting from the consolidated net leverage the amount of cash and cash
equivalents without normalization adjustments as at the date on which the obligation to make the relevant dividend
payment was entered into. In addition, provided that no member of the restricted group has disposed of its
receivables under permitted receivables transactions, the Revolving Credit and L/G Facilities Agreement allows
payments and dividend distributions in an amount of up to €10,000,000 per financial year subject to an aggregate
limit of €25,000,000 over the life of the Revolving Credit Facility and the L/G Facility.
Events of Default
The Revolving Credit and L/G Facilities Agreement contains certain events of default that are customary
for such types of financing (including, subject to a materiality threshold of €30.0 million in aggregate, a cross
default in relation to the Notes and other financial indebtedness of the restricted group). The occurrence of any such
event of default would, subject to any applicable grace periods or cure rights and agreed exceptions, entitle the
lenders to cancel their commitments, declare that all or part of the loans (together with accrued interest and all other
amounts accrued or outstanding under the finance documents in respect of the Revolving Credit Facility (including
any ancillary facility) or the L/G Facility, as the case may be) be immediately due and payable or payable on
126
demand and declare that cash cover in respect of each letter of credit or bank guarantee which is outstanding is
immediately due and payable or payable on demand.
Amendment and restatement of the Revolving Credit and L/G Facilities Agreement
In preparation for the listing of the Company’s shares, the Revolving Credit and L/G Facilities Agreement
was amended and restated by way of an amendment and restatement agreement dated on or about March 4, 2016
(the “Revolving Credit and L/G Facilities Amendment and Restatement”).
Pursuant to the Revolving Credit and L/G Facilities Amendment and Restatement, TopCo may, at its
election in order to fulfill its reporting obligations, provide to the facility agent annual and quarterly financial
statements of the Company instead of its own annual and quarterly financial statements, provided that (i) TopCo
remains directly or indirectly a wholly owned subsidiary of the Company, (ii) a reasonably detailed description of
material differences between the consolidated financial statements of the Company and TopCo shall be included for
any period, provided, further, that such description shall include the consolidated revenues, EBITDA (calculated on
the same basis as Consolidated EBITDA) and total net indebtedness of TopCo and certain other information is
being provided and (iii) TopCo shall deliver to the facility agent unaudited unconsolidated quarterly financial
statements of the Company.
The Revolving Credit and L/G Facilities Amendment and Restatement further clarifies that the listing of
the Company Shares qualifies as a “Flotation” within the meaning of the Revolving Credit and L/G Facilities
Agreement and that following the listing of the Company Shares a change of control event under the Revolving
Credit and L/G Facilities Agreement would not occur if Centerbridge Funds or (for as long as Centerbridge Funds
retain and have the power to exercise at least 80 percent of the aggregate initial sponsors’ shares and voting rights in
TopCo) Arpwood Capital Private Limited or any funds controlled by Arpwood Capital Private Limited
(collectively, the “Initial Sponsors”) cease (directly or indirectly) to hold shares carrying more than 50% of the
voting rights in TopCo, but would instead, inter alia, occur if a third party (other than the Initial Sponsors) (acting
alone or in concert) acquires (directly or indirectly) shares carrying 30 per cent or more of the voting rights in
TopCo and such shares carry more voting rights in Topco than the shares held (directly or indirectly) by the Initial
Sponsors (taken together), provided that TopCo remains directly or indirectly a wholly owned subsidiary of the
Company. In addition, as a result of the amendment in relation to the definition of “Flotation”, it is clarified that the
restrictions in the Indenture relating to dividend payments by TopCo shall also apply in relation to the Revolving
Credit and L/G Facilities Agreement, subject to the additional requirement that the aggregate payment in respect of
any financial year shall be less than or equal to 50% of the consolidated net income for that financial year. The
definition of “Flotation” has further been amended in order to provide for a lower minimum percentage threshold
for a listing of shares of the Company in order for such listing to qualify as a “Flotation”. The respective minimum
percentage threshold has been reduced from at least 30% to at least 20% of the share capital of the Company.
In connection with the Revolving Credit and L/G Facilities Amendment and Restatement, the Company
granted a guarantee in relation to the Revolving Credit and L/G Facilities Agreement. Further the Company granted
the following security for the benefit of the finance parties under the Revolving Credit and L/G Facilities
Agreement:
a German law governed first-ranking pledge over its shares in TopCo,
a Luxembourg law governed first-ranking pledge over its bank accounts, and
a German law governed security assignment of its receivables.
Loan Facilities
Senvion and certain of its subsidiaries have entered into bilateral loan facilities (including mortgages
relating to certain specified properties), as well as a €10 million bilateral guarantee facility. As of December 31,
2015, the total aggregate amount outstanding under the bilateral loan facilities of the Senvion Group (comprising
short-term loans, current portion of long-term loans and long-term loans) was €16.5 million. As of the same date,
€0.3 million was utilized under the bilateral guarantee facility. The bilateral loans are disclosed in and permitted
under the Revolving Credit and L/G Facilities Agreement and the Cash Liquidity Facility Agreement, and the
properties to which they relate do not form part of the security package for the Revolving Credit Facility, the L/G
Facility or the Notes.