Embed Size (px)
Citation preview
FOOD QUALITYAND PREFERENCE2, (1990) 3947
SENSORY PROFILING OF CANNED LAGER BEERS USING CONSUMERS IN THEIR OWN HOMES
Neil Gains* & David M. H. Thomson-t Department of Food Science and Technology, University of Reading, Whiteknights,
PO Box 226, Reading RG6 2AP, UK
(Received 28 March 1990; accepted 14J4ne 1990)
ABSTRACT
An advantage offree-choice profiling for the sensory characterisation offoods and beverages is that it can, in principle, be carried out with inexperienced consumers. The technique will work best if consumers are regular users of the product range to
be investigated, are allowed to familiarise them-
selves with the products, and are allowed to develop and score these products using their own vocabulary
0 Elsevier Science Publishers Ltd
*To whom correspondence should be addressed:
Reading Scientific Services Ltd, The Lord Zuckerman
Research Centre, The University, Whiteknights, PO
Box 234, Reading RG6 2LA, UK.
t Present address: Mathematical Market Research Ltd,
PO Box 58, Wallingford, Oxfordshire OX10 OYD, UK.
of terms in the situations in which they would normally use the products. This implies free-choice profiling in consumers’ own homes. In the study
reported here, 19 consumers profiled a range of 17 canned lager beers in just such a way. The results of this profiling agree well with previous ‘expert’
profiling of similar products and, in addition, yield a vocabulary of consumer relevant descriptors.
Keywords: Beer; consumer; familiarisation; free- choice profiling; generalised Procrustes analysis; individual; sensory characteristics.
INTRODUCTION
Sensory profiling is a modern technique which is used to establish a detailed qualitat-
39
40 NEIL GAINS, DAVID M. H. THOMSON
ive and quantitative specification of the sen-
sory characteristics ofa food or beverage. How-
ever, the general principle of sensory pro-
filing dates back as far as the long established
practices of the expert tasters in the wine,
whisky, tea and coffee industries. Although
these traditional methods are still used very
effectively in their original contexts, they de-
pend entirely on the expertise and aptitude of
a few highly trained individuals and as such
are fundamentally incompatible with the re-
quirements of the modern food and beverage
industries.
The Flavor Profile Method (FPM), devel-
oped at the laboratories of Arthur D. Little
Inc., and first described by Cairncross and Sjo-
Strom (1950), transformed this type of sensory
analysis by offering one of the first practical
alternatives to the use of expert tasters. This
procedure normally involves four to six se-
lected and trained sensory assessors working
in a ‘laboratory ’ environment. Typically, the
assessors derive a consensus vocabulary of
terms to describe some of the more obvious
flavour characteristics and then agree a score
for the magnitude of each character (Powers,
1984).
The next development in profiling tech-
niques came with Quantitative Descriptive
Analysis (QDA), which is broadly similar to
FPM in that a consensus vocabulary is also
derived by a group of selected and trained
sensory assessors (Stone et al., 1974; Stone &
Sidel, 1985). However, QDA differs signifi-
cantly from FPM in that the vocabulary is
usually more extensive and normally em-
braces visual and textural attributes as well as
flavour, and that assessors independently rate
the amount of each attribute in each product.
This process is repeated several times for each
product and, hence, yields data that are
highly amenable to statistical analysis (analysis
of variance and principal component analy-
sis). Since replicate data are obtained it is
also possible to check the reliability of the
assessors. The next milestone in the evolution of pro-
filing methods was the introduction of free-
choice profiling (FCP) by Williams and Lan-
gron (1984). This differs from the previous methods in that untrained assessors may be
used and in that each assessor creates his/her
own vocabulary of terms to describe the sen-
sory characteristics of the products under in-
vestigation. The assessor then rates the
amount of each sensory characteristic in each
product. As typically implemented, FCP is
laboratory-based and involves some degree of
direct supervision and instruction. In some
applications, assessors are even supplied with
a basic lexicon from which they can select
appropriate descriptive terms.
One of the main attractions of FCP is that
it can, at least in principle, be used with in-
experienced consumers. This means that em-
phasis is placed on the attributes which are
most readily apparent to consumers and that
these are described in everyday language. Al-
though the procedures used to interpret these
individual profiles are complex, there is now
abundant evidence to prove the fundamental
efficacy of FCP.
There are several obvious extensions of
FCP which might further improve its re-
levance to the typical product consumption
situation. First of all, the assessors should be
selected from amongst heavy users of that par-
ticular type of product. Secondly, they should
be given the opportunity to familiarise them-
selves with all of the products involved in the
study, in normal situations of use. Thirdly,
they should generate their own vocabulary of
sensory terms, and score these, whilst using
the products in the normal manner. For many
types of product, this would effectively mean
conducting the entire study in the consumer’s
own home.
Guy et al. (1989) successfully carried out
FCP of Scotch whisky using home-based con-
sumers; however the experimenters retained
a large degree of supervision over their asses-
sors. This paper describes the further exten-
sion of this principle to largely unsupervised,
home-based FCP. This would be a very effi-
cient way of collecting profile data, in terms
of both time and cost.
SENSORY PROFILING OF CANNED LAGER BEERS USING CONSUMERS IN THEIR OWN HOMES 41
EXPERIMENTAL PROCEDURE Materials
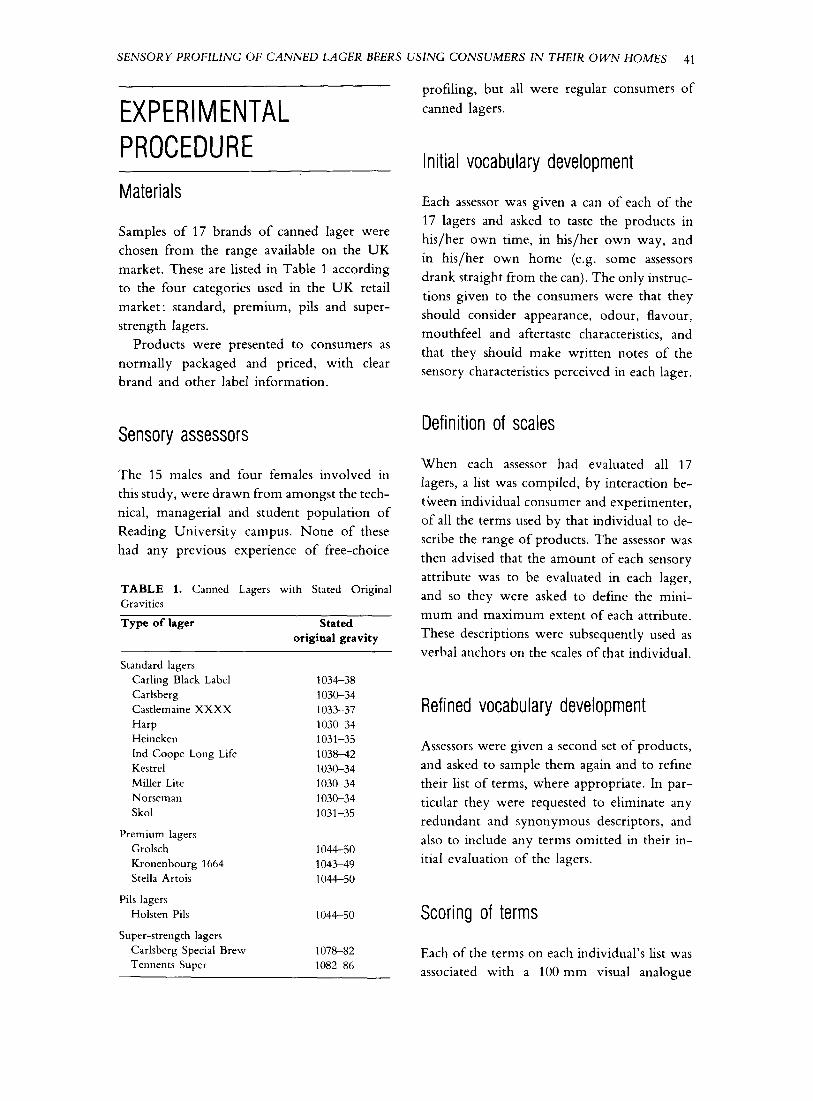
Samples of 17 brands of canned lager were
chosen from the range available on the UK
market. These are listed in Table 1 according
to the four categories used in the UK retail
market: standard, premium, pils and super-
strength lagers.
Products were presented to consumers as
normally packaged and priced, with clear
brand and other label information.
Sensory assessors
The 15 males and four females involved in
this study, were drawn from amongst the tech-
nical, managerial and student population of
Reading University campus. None of these
had any previous experience of free-choice
TABLE 1. Canned Lagers with Stated Original
Gravities
Type of lager Stated original gravity
Standard lagers
Carling Black Label
Carlsberg
Castlemaine XXXX
Harp Heineken
Ind Coope Long Life Kestrel
Miller Lite
Norseman
Skol
Premium lagers
Grolsch
Kronenbourg 1664 Stella Artois
Pils lagers
Holsten Pils
Super-strength lagers
Carlsberg Special Brew Tennents Super
1034-38
1030-34
1033-37
103&34
1031-35
103-2
1030-34
103&34
1030-34
1031-35
1044-50
104-9
1044-50
1044-50
1078-82
1082-86
profiling, but all were regular consumers of
canned lagers.
Initial vocabulary development
Each assessor was given a can of each of the
17 lagers and asked to taste the products in
his/her own time, in his/her own way, and
in his/her own home (e.g. some assessors
drank straight from the can). The only instruc-
tions given to the consumers were that they
should consider appearance, odour, flavour,
mouthfeel and aftertaste characteristics, and
that they should make written notes of the
sensory characteristics perceived in each lager.
Definition of scales
When each assessor had evaluated all I7
lagers, a list was compiled, by interaction be-
tween individual consumer and experimenter,
of all the terms used by that individual to de-
scribe the range of products. The assessor was
then advised that the amount of each sensory
attribute was to be evaluated in each lager,
and so they were asked to define the mini-
mum and maximum extent of each attribute.
These descriptions were subsequently used as
verbal anchors on the scales of that individual.
Refined vocabulary development
Assessors were given a second set of products,
and asked to sample them again and to refine
their list of terms, where appropriate. In par-
ticular they were requested to eliminate any
redundant and synonymous descriptors, and
also to include any terms omitted in their in-
itial evaluation of the lagers.
Scoring of terms
Each of the terms on each individual’s list was
associated with a 100 mm visual analogue
42 NEIL GAINS, DAVID M. H. THOMSON
scale, labelled with verbal anchors as pre-
viously described. Using a third set of canned
lagers, each assessor rated all the products on
each of the scales he/she had refined.
Duration of study
This FCP exercise, integrated within an ex-
tensive consumer study of canned lagers, was
conducted over a period of three months.
DATA ANALYSIS
The data matrices (lagers x attributes) derived
from each of the assessors were input to gener-
alised Procrustes analysis (GPA). GPA was
used to produce a separate product (lager) con-
figuration for each assessor, a consensus con-
figuration of the lagers across all 19 assessors
and to correlate each individual’s set of sen-
sory descriptors with each dimension of this
consensus configuration. This was sub-
sequently interpreted by identifying the con-
structs for each assessor which were most
highly correlated (+ or -) with the di-
mensions of the consensus. Arnold and
Williams (1986) and Gains et al. (1988) have
previously described the principles of GPA.
Principal co-ordinate analysis (Chatfield &
Collins, 1980) on the distances (residual Pro-
crustes distances) between the individual asses-
sors’ product configurations, was used to ob-
tain a two-dimensional assessor plot (Arnold
& Williams, 1986). This was used to identify
possible sub-groups and outliers within the as-
sessor population. The GPA program used in this study is avail-
able as part of the GENSTAT statistical pack-
age (Numerical Algorithms Group Ltd, Ox-
ford, UK).
RESULTS
The number of terms used by the consumers
to describe the sensory characteristics of the
lagers ranged from 14 to 40, although most
assessors used between 20 and 25 descriptors.
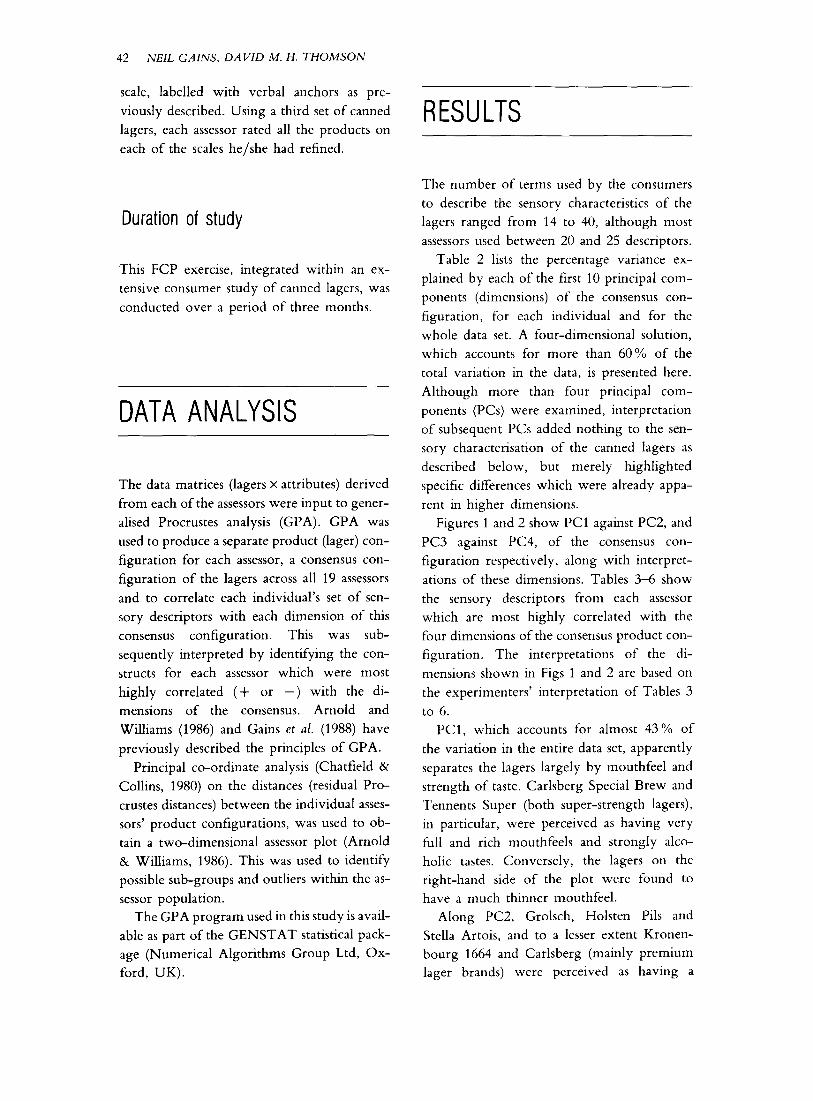
Table 2 lists the percentage variance ex-
plained by each of the first 10 principal com-
ponents (dimensions) of the consensus con-
figuration, for each individual and for the
whole data set. A four-dimensional solution,
which accounts for more than 60 % of the
total variation in the data, is presented here.
Although more than four principal com-
ponents (PCs) were examined, interpretation
of subsequent PCs added nothing to the sen-
sory characterisation of the canned lagers as
described below, but merely highlighted
specific differences which were already appa-
rent in higher dimensions.
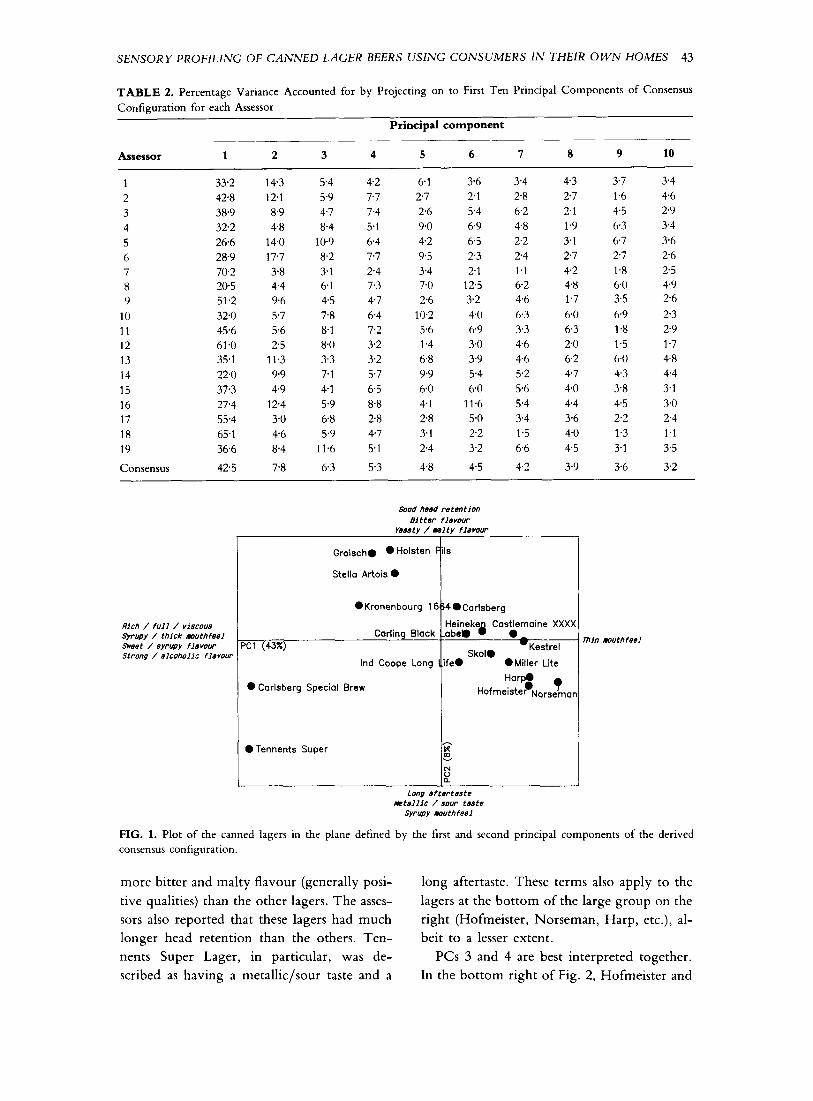
Figures 1 and 2 show PC1 against PC2, and
PC3 against PC4, of the consensus con-
figuration respectively, along with interpret-
ations of these dimensions. Tables 3-6 show
the sensory descriptors from each assessor
which are most highly correlated with the
four dimensions of the consensus product con-
figuration. Th e interpretations of the di-
mensions shown in Figs 1 and 2 are based on
the experimenters’ interpretation of Tables 3
to 6.
PCl, which accounts for almost 43 % of
the variation in the entire data set, apparently
separates the lagers largely by mouthfeel and
strength of taste. Carlsberg Special Brew and
Tennents Super (both super-strength lagers),
in particular, were perceived as having very
full and rich mouthfeels and strongly alco-
holic tastes. Conversely, the lagers on the
right-hand side of the plot were found to
have a much thinner mouthfeel.
Along PC2, Grolsch, Holsten Pils and
Stella Artois, and to a lesser extent Kronen-
bourg 1664 and Carlsberg (mainly premium lager brands) were perceived as having a
SENSORY PROFILING OF CANNED LAGER BEERS USING CONSUMERS IN THEIR OWN HOMES 43
TABLE 2. Percentage Variance Accounted for by Projecting on to First Ten Principal Components of Consensus
Configuration for each Assessor
Principal component
Assessor 1 2 3 4 5 6 7 8 9 10
1 33.2 143 5.4 42 6.1 3.6 3.4 43 3.7 3.4 2 428 12.1 5.9 7.7 2.7 2.1 2.8 27 1.6 46 3 38.9 8.9 4.7 7.4 2.6 5.4 6.2 2.1 45 2.9 4 322 48 8.4 5.1 9.0 6.9 48 1.9 6.3 3.4 5 26.6 14.0 10.9 64 42 65 2.2 3.1 6.7 3.6 6 28.9 17.7 8.2 7.7 9.5 2.3 2.4 2.7 2.7 2.6 7 702 38 3.1 2.4 3.4 2.1 1.1 42 1.8 2.5 8 20.5 4.4 6.1 7.3 7.0 125 62 48 6.0 49 9 51.2 9.6 45 47 26 3.2 4.6 1.7 3.5 2.6
10 32.0 5.7 78 64 10.2 40 63 6.0 6.9 2.3 11 45.6 5.6 8.1 7.2 5.6 6.9 3.3 6.3 1.8 29 12 61.0 2.5 8.0 3.2 1.4 3.0 46 20 1.5 1.7 13 35.1 11.3 3.3 3.2 6.8 3.9 46 6.2 6.0 48 14 22.0 9.9 7.1 5.7 99 5.4 5.2 4.7 4.3 44 15 37.3 4.9 41 65 60 6.0 5.6 40 3.8 3.1 16 27.4 12.4 5.9 8.8 4.1 11.6 5.4 44 45 3.0 17 55.4 3.0 68 28 28 5.0 3.4 3.6 2.2 2.4 18 65.1 46 5.9 47 3.1 2.2 1.5 4.0 1.3 1.1 19 36.6 8.4 11.6 5.1 24 32 6.6 45 3.1 3.5
Consensus 425 7.8 63 5.3 48 45 42 3.9 3.6 3.2
Crolscb. 0 Holsten Fils
Stella Artois ??
??Kronenbourg 16~54OCarlsberg
Rich / full / viscous Heineke Castlemaine XXX: Syr~@y / thick muthfeel Carling Black _abei@ 0 ??_ swet / syrupy flavour PC1 (43%) -Kestrel Strong / alcoholjc flavour Skol.
Ind Coope Long Life0 0 Miller Lite
??Carlsberg Special Brew Hofme~.ZtZ~~orsX,
0 Tennents Super F s
Long aftertaste
Mtallic / SD”P taste
Syrugy muthfeel
FIG. 1. Plot of the canned lagers in the plane defined by the first and second principal components of the derived
consensus configuration.
more bitter and malty flavour (generally posi- long aftertaste. These terms also apply to the
tive qualities) than the other lagers. The asses- lagers at the bottom of the large group on the
sors also reported that these lagers had much right (Hofmeister, Norseman, Harp, etc.), al-
longer head retention than the others. Ten- beit to a lesser extent.
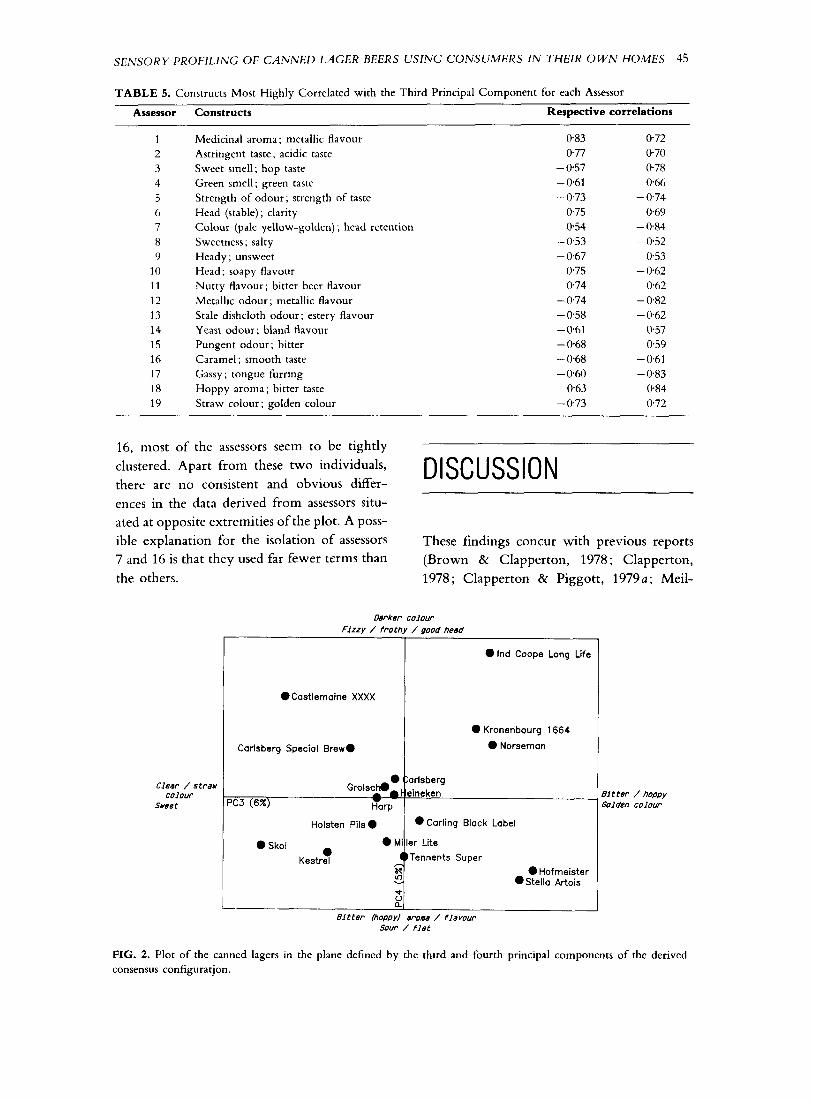
nents Super Lager, in particular, was de- PCs 3 and 4 are best interpreted together. scribed as having a metallic/sour taste and a In the bottom right of Fig. 2, Hofmeister and
44 NEIL GAINS, DAVID M. H. THOMSON
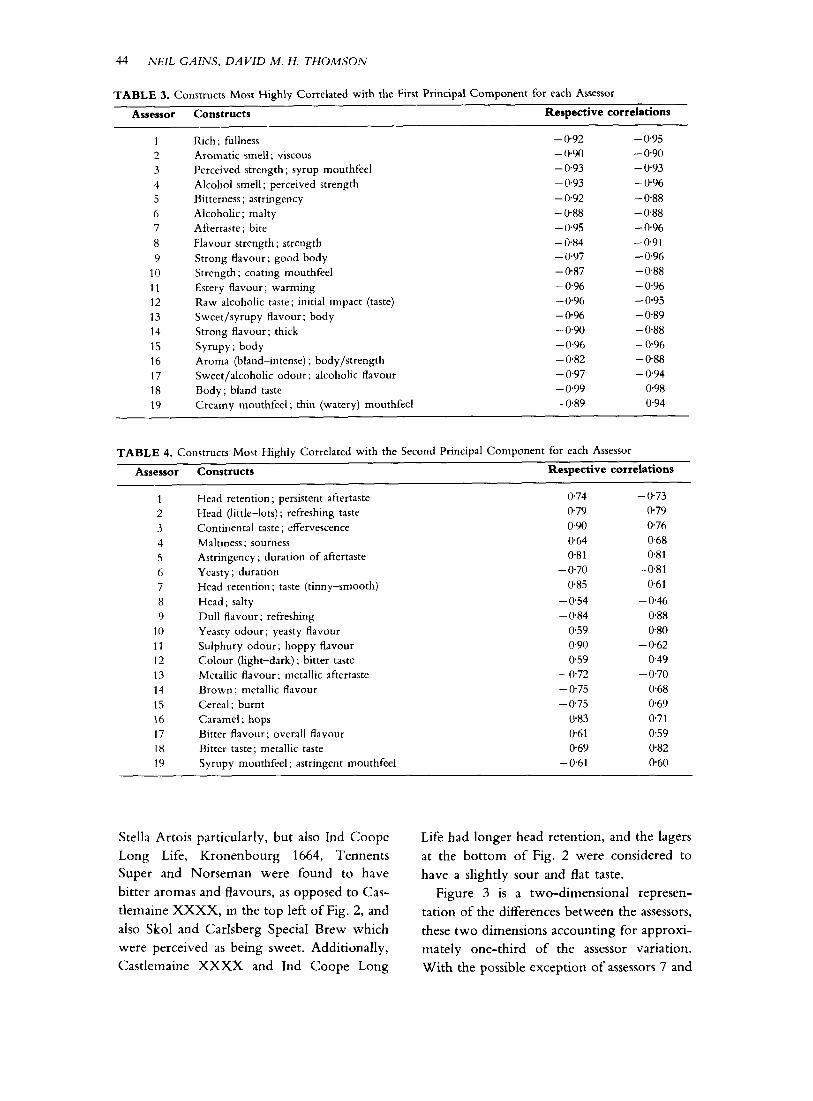
TABLE 3. Constructs Most Highly Correlated with the First Principal Component for each Assessor
Assessor Constructs Respective correlations
1 2
3
4 5
6
7
8
9
10
11 12
13
14
15
16
17
18 19
Rich ; fullness
Aromatic smell; viscous Perceived strength ; syrup mouthfeel
Alcohol smell ; perceived strength Bitterness ; astringency
Alcoholic ; malty Aftertaste ; bite
Flavour strength ; strength
Strong Aavour; good body
Strength; coating mouthfeel
Estery flavour ; warming
Raw alcoholic taste; initial impact (taste)
Sweet/syrupy flavour; body
Strong flavour ; thick
Syrupy ; body Aroma (bland-intense) ; body/strength
Sweet/alcoholic odour ; alcoholic flavour
Body; bland taste
Creamy mouthfeel; thin (watery) mouthfeel
-@92 -@95
- 0.90 - 0.90
-0.93 -0993
- 0.93 -0.96
-0.92 -088
-088 -0888 - 0.95 -096
- 0.84 -@91 -0997 -096
-@87 -0.88
- 0.96 - 0.96
-@96 - 0.95
- 0.96 -0.89
-@90 - 0.88
-0.96 -0.96
-082 -088
-0.97 -0994
- 099 098
-089 094
TABLE 4. Constructs Most Highly Correlated with the Second Principal Component for each Assessor
Assessor Constructs Respective correlations
1 Head retention ; persistent aftertaste 0.74 -073
2 Head (little-lots) ; refreshing taste 079 0.79
3 Continental taste; effervescence 090 076
4 Maltiness ; sourness 0.64 @68 5 Astringency; duration of aftertaste 081 0.81
6 Yeasty; duration -070 -0.81
7 Head retention; taste (tinny-smooth) 085 0.61
8 Head ; salty -054 - 0.46
9 Dull flavour ; refreshing - 084 088
10 Yeasty odour; yeasty flavour 059 0.80 11 Sulphury odour; hoppy Aavour @90 -0662
12 Colour (light-dark) ; bitter taste 059 0.49
13 Metallic flavour ; metallic aftertaste - 072 -070
14 Brown ; metallic flavour -0.75 068
15 Cereal ; burnt -@75 0.69
16 Caramel ; hops 083 0.71
17 Bitter flavour ; overall flavour 061 0.59
18 Bitter taste; metallic taste 069 0.82
19 Syrupy mouthfeel ; astringent mouthfeel -0.61 0.60
Stella Artois particularly, but also Ind Coope
Long Life, Kronenbourg 1664, Tennents Super and Norsernan were found to have
bitter aromas and flavours, as opposed to Cas-
tlemaine XXXX, in the top left of Fig. 2, and
also Skol and Carlsberg Special Brew which
were perceived as being sweet. Additionally,
Castlemaine XXXX and Ind Coope Long
Life had longer head retention, and the lagers
at the bottom of Fig. 2 were considered to
have a slightly sour and flat taste.
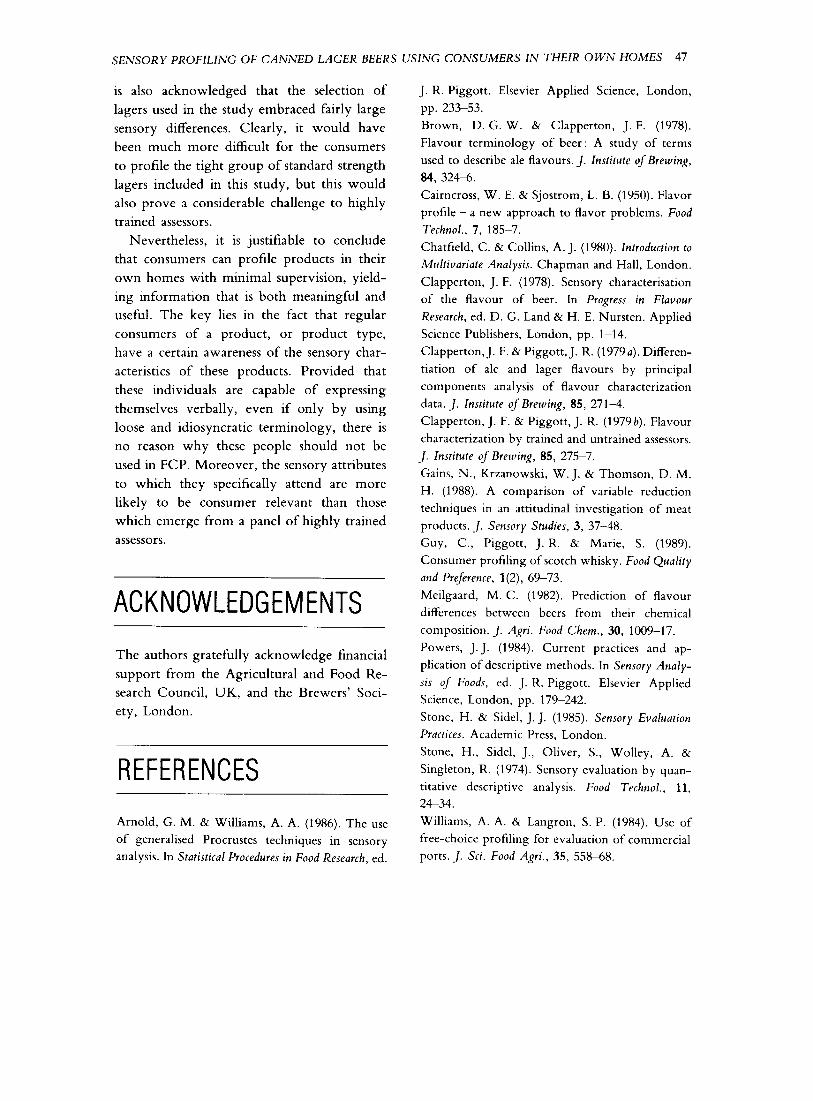
Figure 3 is a two-dimensional represen-
tation of the differences between the assessors,
these two dimensions accounting for approxi-
mately one-third of the assessor variation.
With the possible exception of assessors 7 and
SENSORY PROFlLINC OF CANNED LAGER BEERS USING CONSUMERS IN THEIR OWN HOMES 45
TABLE 5. Constructs Most Highly Correlated with the Third Principal Component for each Assessor
Assessor Constructs Respective correlations
1
2 3 4 5 6 7 8 9
10 11
12
13 14
15
16
17
18 19
Medicinal aroma ; metallic flavour
Astringent taste; acidic taste
Sweet smell; hop taste
Green smell; green taste
Strength of odour; strength of taste
Head (stable) ; clarity
Colour (pale yellow-golden) ; head retention
Sweetness; salty
Heady ; unsweet
Head; soapy flavour Nutty flavour; bitter beer Aavour
Metallic odour ; metallic flavour
Stale dishcloth odour; estery flavour
Yeast odour; bland flavour
Pungent odour ; bitter
Caramel ; smooth taste
Gassy ; tongue furring Hoppy aroma; bitter taste
Straw colour ; golden colour
0.83 072
077 0.70
-057 078
-061 -0666
- 0.73 -0.74
075 0.69
054 - 0.84
-0553 -0.52
-0667 0.53
075 -0662
0.74 062
- 074 -0.82
-0558 -062 -0.61 0.57 -0.68 059 -0.68 -@61 -060 -0.83
0.63 084
- 0.73 0.72
16, most of the assessors seem to be tightly
clustered. Apart from these two individuals,
there are no consistent and obvious differ- DISCUSSION
ences in the data derived from assessors situ-
ated at opposite extremities of the plot. A poss-
ible explanation for the isolation of assessors
7 and 16 is that they used far fewer terms than
the others.
These findings concur with previous reports
(Brown & Clapperton, 1978 ; Clapperton,
1978; Clapperton & Piggott, 19790; Meil-
Darker colour
Ftzzy / frothy / good head
??Ind Coope Long Life
??Castlemaine XXXX
Carlsberg Special Brew0
??Kronenbourg 1664
??Norseman
PC3 (6%)
Gro,ecm~ ‘:arlsberg + @k eineken
Harp
81 t te?r / happy Golden colour
FIG. 2. Plot of the canned lagers in the plane defined by the third and fourth principal components of the derived consensus contiguratjon.
46 NEIL GAINS, DAVID M. H. THOMSON
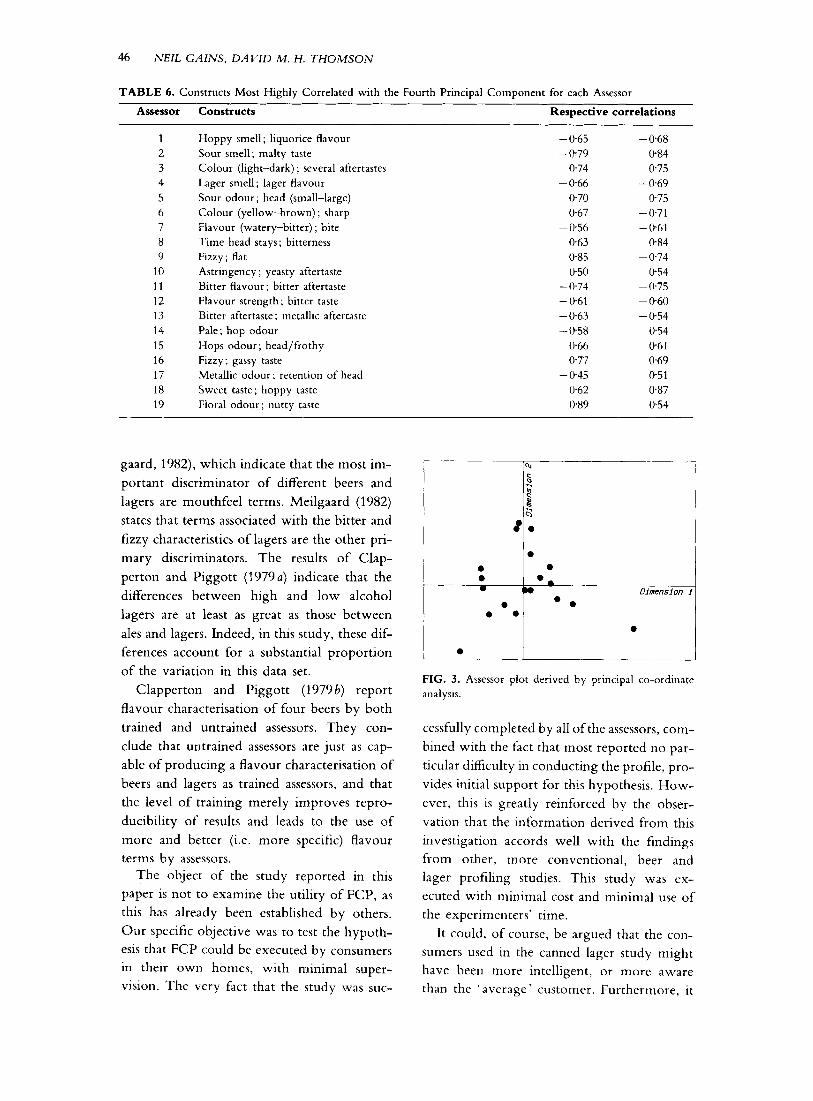
TABLE 6. Constructs Most Highly Correlated with the Fourth Principal Component for each Assessor
Assessor Constructs Respective correlations
1
2
3 4
5
6
7
8 9
10
11
12
13
14
15
16
17
18 19
Hoppy smell ; liquorice flavour
Sour smell; malty taste
Colour (light-dark) ; several aftertastes
Lager smell; lager Aavour
Sour odour ; head (small-large)
Colour (yellow-brown) ; sharp
Flavour (watery-bitter) ; bite
Time head stays; bitterness
Fizzy ; flat
Astringency ; yeasty aftertaste
Bitter flavour; bitter aftertaste
Flavour strength; bitter taste
Bitter aftertaste; metallic aftertaste
Pale; hop odour
Hops odour; head/frothy
Fizzy ; gassy taste
Metallic odour ; retention of head
Sweet taste; hoppy taste
Floral odour; nutty taste
-065 -0.68
-0.79 O-84
0.74 0.75
- 0.66 -0.69
@70 0.75
067 -0.71
- 0.56 -0.61
0.63 084
085 -0.74
@50 0.54
- 0.74 - 0.75
-061 - 0.60
-0.63 - @54
-@o-58 @54
0.66 0.61
0.77 0.69
-0.45 0.51
062 0.87
0.89 0.54
gaard, 1982), which indicate that the most im-
portant discriminator of different beers and
lagers are mouthfeel terms. Meilgaard (1982)
states that terms associated with the bitter and
fizzy characteristics of lagers are the other pri-
mary discriminators. The results of Clap-
perton and Piggott (1979a) indicate that the
differences between high and low alcohol
lagers are at least as great as those between
ales and lagers. Indeed, in this study, these dif-
ferences account for a substantial proportion
of the variation in this data set.
Clapperton and Piggott (1979b) report
flavour characterisation of four beers by both
trained and untrained assessors. They con-
clude that untrained assessors are just as cap-
able of producing a flavour characterisation of
beers and lagers as trained assessors, and that
the level of training merely improves repro-
ducibility of results and leads to the use of
more and better (i.e. more specific) flavour
terms by assessors. The object of the study reported in this
paper is not to examine the utility of FCP, as
this has already been established by others.
Our specific objective was to test the hypoth-
esis that FCP could be executed by consumers
in their own homes, with minimal super-
vision. The very fact that the study was suc-
FIG. 3. Assessor plot derived by principal co-ordinate
analysis.
cessfully completed by all of the assessors, com-
bined with the fact that most reported no par-
ticular difficulty in conducting the profile, pro-
vides initial support for this hypothesis. How-
ever, this is greatly reinforced by the obser-
vation that the information derived from this
investigation accords well with the findings
from other, more conventional, beer and
lager profiling studies. This study was ex-
ecuted with minimal cost and minimal use of
the experimenters’ time.
It could, of course, be argued that the con-
sumers used in the canned lager study might
have been more intelligent, or more aware
than the ‘average ’ customer. Furthermore, it
SENSORY PROFILING OF CANNED LAGER BEERS USING CONSUMERS IN THEIR OWN HOMES 47
is also acknowledged that the selection of lagers used in the study embraced fairly large sensory differences. Clearly, it would have been much more difficult for the consumers to profile the tight group of standard strength lagers included in this study, but this would also prove a considerable challenge to highly trained assessors.
Nevertheless, it is justifiable to conclude that consumers can profile products in their own homes with minimal supervision, yield- ing information that is both meaningful and useful. The key lies in the fact that regular consumers of a product, or product type, have a certain awareness of the sensory char- acteristics of these products. Provided that these individuals are capable of expressing themselves verbally, even if only by using loose and idiosyncratic terminology, there is no reason why these people should not be used in FCP. Moreover, the sensory attributes to which they specifically attend are more likely to be consumer relevant than those which emerge from a panel of highly trained assessors.
ACKNOWLEDGEMENTS
The authors gratefully acknowledge financial support from the Agricultural and Food Re- search Council, UK, and the Brewers’ Soci- ety, London.
REFERENCES
Arnold, G. M. & Williams, A. A. (1986). The use
of generalised Procrustes techniques in sensory
analysis. In Statistical Procedures in Food Research, ed.
J. R. Piggott. Elsevier Applied Science, London,
pp. 233-53.
Brown, D. G. W. & Clapperton, J. F. (1978).
Flavour terminology of beer: A study of terms
used to describe ale flavours. /. Institute ofBrewing, 84, 324-6.
Cairncross, W. E. & Sjostrom, L. B. (1950). Flavor
profile - a new approach to flavor problems. Food Technol., 7, 185-7. Chatfield, C. & Collins, A. J. (1980). Introduction to M&variate Analysis. Chapman and Hall, London.
Clapperton, J. F. (1978). Sensory characterisation
of the flavour of beer. In Progress in Flavour Research, ed. D. G. Land & H. E. Nursten. Applied
Science Publishers, London, pp. 1-14.
Clapperton, J. F. & Piggott, J. R. (1979a). Differen-
tiation of ale and lager flavours by principal
components analysis of flavour characterization
data. 1. Institute of Brewing, 85, 271-4. Clapperton, J. F. & Piggott, J. R. (1979b). Flavour
characterization by trained and untrained assessors.
J. Institute of Brewing, 85, 275-7. Gains, N., Krzanowski, W. J. & Thomson, D. M.
H. (1988). A comparison of variable reduction
techniques in an attitudinal investigation of meat
products. J. Sensory Studies, 3, 37-48. Guy, C., Piggott, J. R. & Marie, S. (1989).
Consumer profiling of scotch whisky. Food Quality and Preference, l(2), 69-73. Meilgaard, M. C. (1982). Prediction of flavour
differences between beers from their chemical
composition. J. Agri. Food Chew., 30, 1009-17. Powers, J. J. (1984). Current practices and ap-
plication of descriptive methods. In Sensory Analy- sis of Foods, ed. J. R. Piggott. Elsevier Applied
Science, London, pp. 179-242.
Stone, H. & Sidel, J. J. (1985). Sensory Evaluation Practices. Academic Press, London.
Stone, H., Sidel, J., Oliver, S., Wolley, A. &
Singleton, R. (1974). Sensory evaluation by quan-
titative descriptive analysis. Food Technol., 11, 24-34.
Williams, A. A. & Langron, S. P. (1984). Use of
free-choice profiling for evaluation of commercial
ports. J. Sci. Food Agri., 35, 55848.