Embed Size (px)
Citation preview
University of New HavenDigital Commons @ New Haven
Civil Engineering Faculty Publications Civil Engineering
12-2005
Sensors to Monitor CFRP/Concrete Bond inBeams Using Electrochemical ImpedanceSpectroscopySangdo HongIndiana Department of Transportation
Ronald S. HarichandranUniversity of New Haven, [email protected]
Follow this and additional works at: http://digitalcommons.newhaven.edu/civilengineering-facpubs
Part of the Civil Engineering Commons
CommentsThis is the authors' accepted version of the article published in Journal of Composites for Construction. The version of record can be found in the ASCElibrary athttp://dx.doi.org/10.1061/(ASCE)1090-0268(2005)9:6(515)
Publisher CitationHong, S., and Harichandran, R. S. (2005). “Sensors to monitor CFRP/concrete bond in beams using electrochemical impedancespectroscopy.” Journal of Composites for Construction, ASCE, 9(6), 515-523. doi:10.1061/(ASCE)1090-0268(2005)9:6(515)

Sensors to Monitor CFRP/Concrete Bond in Beams Using Electrochemical Impedance
Spectroscopy
Sangdo Hong1 and Ronald S. Harichandran,2 P.E., Member, ASCE
ABSTRACT The use of inexpensive electrochemical impedance spectroscopy based sensor tech-
nology for NDE of bond degradation between external CFRP reinforcement and concrete
is examined. Copper tape on the surface of the CFRP sheet, stainless steel wire embedded
in the concrete, and reinforcing bars were used as the sensing elements. Laboratory ex-
periments were designed to test the capability of the sensors to detect the debonding of
the CFRP from the concrete and to study the effect of short-term (humidity and tempera-
ture fluctuations) and long-term (freeze-thaw and wet-dry exposure, and rebar corrosion)
environmental conditions on the measurements. The CFRP sheet was debonded from the
concrete and impedance measurements were taken between various pairs of electrodes at
various interfacial crack lengths. The dependence of the impedance spectra, and of the
parameters obtained from equivalent circuit analysis, on the interfacial crack length was
studied. Capacitance parameters in the equivalent circuit correlated strongly with the in-
terfacial crack length and can be used to assess the global state of the bond between
CFRP sheets and concrete. Impedance measurements taken between embedded wire sen-
sors can be used to detect the location of debonded regions.
1 Former Graduate student, Dept. of Civil & Envir. Engrg., Michigan State Univ., East Lansing, MI 48824-1224

2 Professor and Chair, Dept. of Civil & Envir. Engrg., Michigan State Univ., East Lansing, MI 48824-1224; Tel.: 517-355-5107; Fax: 517-432-1827; E-Mail: [email protected]

3
Introduction Many structures built in the past need strengthening and retrofitting to overcome deficien-
cies caused by increased load demands, environmental deterioration and structural aging. Thirty-
five percent of all bridges in the U.S. are estimated to be structurally deficient and require repair,
strengthening, widening or replacement (Karbhari and Zhao 2000). To overcome structural defi-
ciencies, composite materials such as fiber-reinforced polymers (FRP) are being increasingly
used for strengthening and retrofitting. Carbon fiber reinforced polymer (CFRP) is a well-known
high performance composite material used to strengthen reinforced concrete structural
components.
Concrete beams strengthened or retrofitted with FRP behave as composite components, and
their strengths are calculated by taking this into account. Interfacial bonding between the FRP
and concrete plays a significant role in achieving composite behavior and increasing strength.
For flexural strengthening of beams, CFRP plates or sheets are bonded to the tension face—a
simple and convenient technique (Rahimi and Hutchinson 2001). Unlike steel plates, FRP plates
do not suffer from corrosion problems. However, the interfacial bond between the FRP and con-
crete can deteriorate due to environmental and load-related issues leading to debonding.
Concrete structures with FRP plates can exhibit a brittle failure mode if the FRP debonds
from the concrete. Debonding of the plates and ripping of concrete are common failure modes
(Nguyen et al. 2001) initiated due to highly localized stress concentration in the interface layer
(Buyukozturk and Hearing 1998). It is therefore important to identify the integrity of the interfa-
cial bond between concrete and the FRP using effective nondestructive evaluation (NDE) tech-
niques.

4
Visual inspection is not a reliable method of assessing the integrity of interfacial bond in
composite components. “Tap” tests are time consuming and difficult to conduct in structural
components that are difficult to access. Destructive tests are not feasible for in-service structures.
Different NDE methods, including ultrasonic (e.g., Mirmiran and Wei 2001) and microwave
techniques (e.g., Akuthota et al. 2004), have been used to detect or monitor the delamination be-
tween two composite materials. However, these NDE methods do not always work well for con-
crete structures rehabilitated with FRP, and some are quite complicated to use in the field. It is
important to develop inexpensive, simple and effective NDE methods for concrete structures re-
habilitated with FRP.
Background Concepts on EIS Traditionally, electrochemical impedance spectroscopy (EIS) has been used to detect coat-
ing deterioration and substrate corrosion, and the EIS technique is performed in an electrolyte
with working, counter and reference electrodes (Kendig and Scully 1989). Use of an external
electrolyte is cumbersome in the field. However, it is possible to use in-situ electrodes to meas-
ure the impedance in the ambient condition without submerging the electrochemical cell (Davis
et al. 2000). In this modified EIS technique, the reference and working electrodes are combined
into a single electrode, and yield stable measurements.
In-situ sensors have been used to detect moisture ingress and crack propagation in structur-
al adhesive bonds (Davis et al. 2000). This sensor technology uses EIS to inspect the integrity of
the bond. The impedance typically increases in magnitude as the crack propagates (Davis et al.
1999). In the simplest method for detecting debonding, the impedance spectra can be compared
directly (Hong 2003). A raw impedance analysis is quick and the investigator performing analy-
sis does not need to be highly trained. However, additional information can be obtained from the
5
impedance spectra by using equivalent circuit analysis. Davis et al. (1999) found that the resis-
tive components in the equivalent circuit they used were functions of moisture content and the
capacitance parameter was a function of both moisture content and bonded area.
Electrical Impedance Electrochemical impedance is the resistance to current in an electrochemical cell. It is gen-
erally obtained by measuring the AC current across a pair of electrodes due to an applied AC
voltage. Electrical resistance is independent of the frequency of the harmonic (sinusoidal) AC
voltage excitation. However, electrical impedance is often dependent on frequency. When the
excitation signal is harmonic, the response signal is also harmonic at the same frequency with an
amplitude and phase angle. The impedance, Z, is a complex-valued quantity and is defined as the
ratio between the excitation voltage, V(t), and the response current, I(t):
)()(tItVZ = (1)
For a harmonic AC excitation signal, V(t) may be expressed as
)sin(cos)( tjtVtV o ww += (2)
where w is the circular natural frequency of the applied voltage (expressed in radian/second), V0
is the amplitude of the excitation signal and j is the unit imaginary number. The harmonic current
response I(t) may be expressed as
)]sin()[cos()( fwfw -+-= tjtItI o (3)
where I0 is the amplitude of the harmonic current and f is the phase shift. The electrical imped-
ance in Eq. (1) is then
)sin(cos ff jZZ o += (4)
6
where Z0 = V0/I0 is the magnitude of the impedance. Both the magnitude and phase vary with the
excitation frequency and it is common to display the impedance by plotting the variation of its
magnitude and phase with excitation frequency. The plot of the magnitude vs. excitation fre-
quency is called the Bode magnitude plot (or magnitude spectrum), and the plot of the phase vs.
excitation frequency is called the phase spectrum.
Impedance, Z, is generally complex-valued. The impedance of a resistor, R, is ZR = R and is
real-valued. The impedance of a capacitor, C, is purely imaginary and is ZC = 1/(jwC). The con-
stant phase element (CPE) is often used in an equivalent circuit to represent the response of real-
world electrochemical systems. These systems do not respond ideally because some properties
are not homogeneous and often there are distributed elements in addition to lumped elements in
the system. The impedance of the CPE is
aw -= )( jAZCPE (5)
When a = 1 (maximum value), the CPE is equivalent to a capacitor with A = 1/C (the inverse of
the capacitance), and when a = 0 (minimum value), the CPE is equivalent to a resistor with
A = R.
The capacitance between two parallel plates separated by a dielectric material may be ex-
pressed as
dA
C 0ee= (6)
where e0 = electrical permittivity, e = relative electrical permittivity, A = area of the plates, and
d = distance between the plates. While the value of e0 is constant, the value of e depends on the
7
dielectric material. Moisture in the dielectric material changes the value of e. Davis et al. (1999)
used Equation (6) to evaluate the moisture uptake into the adhesive in a metal-FRP bond.
EIS and Equivalent Circuit Analysis In EIS, an AC voltage is applied between the working and counter electrodes. The complex
impedance spectrum is then measured as a function of frequency. Two methods of analyzing the
impedance spectra from a set of measurements are common. The first method is to simply com-
pare the raw impedance spectra. The impedance spectrum can be plotted in different ways. The
conventional presentations are the Bode magnitude and phase plot, Nyquist plot, and real and
imaginary impedance plots. The impedance spectra are compared over the entire frequency range
or over specific frequencies. The second method is to analyze the impedance spectra by using a
lumped parameter equivalent circuit model. In this method, the parameters of an electrical circuit
which has a theoretical impedance similar to that of the measured impedance are estimated, and
spectra are compared based on the differences in the estimated parameters. The equivalent circuit
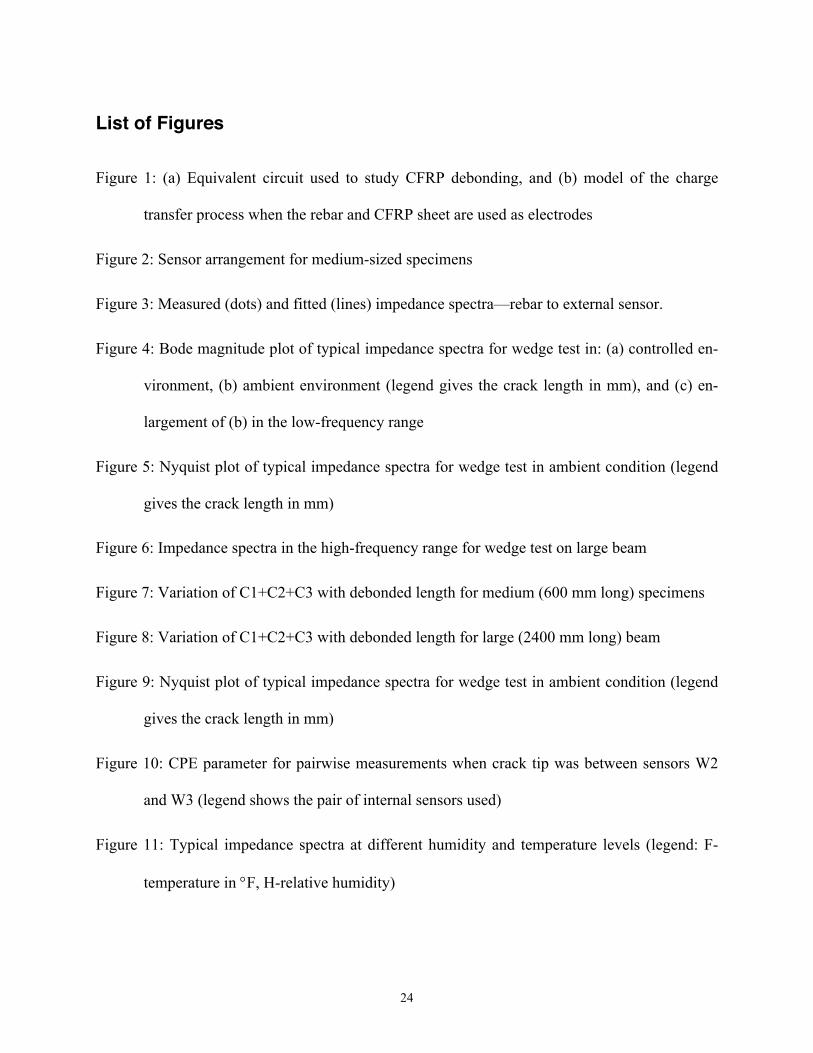
used in this research is shown in Figure 1(a). The circuit consists of a loop that is composed of a
resistance, capacitance and a constant phase element (CPE), and two simple resistor/capacitor
loops in series.
A justification for the equivalent circuit used is an understanding of the physical process of
current flow. Figure 1(b) shows the charge transfer process in a CFRP-strengthened reinforced
concrete beam with the rebar and the CFRP used as electrodes. Charge transfer between ions and
the electrode involves long-range electrostatic forces, so that their interaction is essentially inde-
pendent of the chemical properties of ions. Charge transfer through the electrolyte (pore fluid in
the case of concrete) occurs by the diffusion of ions. At low excitation frequencies, the imped-
ance to current flow is controlled by the rate of diffusion, while at high frequencies, the imped-
8
ance is controlled by the kinetics of the charge transfer processes at the electrode/electrolyte in-
terface. In Figure 1(a) the loops containing the resistance and capacitance in the equivalent cir-
cuit represent the double layer effects at the two electrodes, and the loop with the CPE element
represents the body of concrete.
Several simpler circuits were tried before arriving at the one that was used (Hong 2003). A
simple Randles cell and the circuit commonly used when examining failed coatings (Gamry
2005, Davis 2000) were among those that were tried. None of the simpler circuits were able to
provide a good fit for the variety of impedance spectra obtained in this work with the various
combinations of sensors. While the equivalent circuit used has eight parameters, electrochemical
systems such as the one in this work that are governed by mixed kinetic and diffusion control are
often modeled with circuits that have nine parameters (Gamry 2005).
Experimental Setup and Procedures Concrete structures rehabilitated with CFRP are subjected to various short- and long-term
environmental conditions. Short-term environmental conditions include the variation of tempera-
ture and humidity. Long-term environmental conditions include freeze-thaw cycles, wet- dry cy-
cles and corrosion of the rebar. The effect of rebar corrosion on the measured impedance spectra
was studied because the potential of using the rebar as an electrode was investigated. The varia-
bility in measured impedance due to short- and long-term environmental effects must be under-
stood if the measurements are to be used to detect debonding of CFRP from concrete.
Experimental Setup The study on detection of CFRP debonding was conducted with medium-sized reinforced
concrete specimens with dimensions of 150´150´600 mm and a large reinforced concrete beam
with dimensions of 600´450´2400 mm. The study on the effects of environmental conditions

9
was conducted with small reinforced concrete specimens with dimensions of 150´150´300mm.
Some specimens were manufactured with chloride (11.0 kg NaCl per cubic meter of concrete)
and some without chloride. The CFRP was bonded over the entire width of each specimen. The
CFRP was provided by Master Builders and had a nominal tensile strength of 700 N/mm of
width. The concrete had a compressive strength of 35.7 MPa (5180 psi) after 28 days of curing.
The test specimens were prepared with an initial crack by using a Teflon insert. To propagate the
interfacial crack between the CFRP layer and the concrete substrate, a wedge (sharpened saw
blade) was driven with a hammer. The position of the front edge of the saw blade after it was
driven was taken as the leading edge of the crack. The wedge test on the large beam was con-
ducted at ambient conditions with temperatures varying from 18oC to 24oC and relative humidity
varying from 30% to 60%. The relative humidity was measured using a humidity meter. None of
the specimens had any external load applied to them and were supported on a table or floor over
their entire length. The number of each type of specimen used is shown in Table 1. The sensor
(electrode) arrangement for the medium-sized specimens is shown in Figure 2. The Ci sensors
consisted of copper tape with a conductive adhesive mounted directly on the outside surface of
the CFRP before any epoxy was applied. The Wi sensors consisted of stainless steel wire set into
grooves on the concrete specimen before the CFRP was bonded. The W7 wire sensor in the lon-
gitudinal direction crosses the lateral wire sensors and was therefore electrically isolated from
those by using a small shrink wrap tube at each intersection point. R represents a reinforcing bar
(rebar).
Experimental Procedure Different sensor combinations were used to produce impedance spectra. Combinations of
internal sensors (Wi) to external sensor (Ci), rebar (R) to external sensors, and pairs of internal

10
sensors were used to produce the impedance spectra at different crack states. The impedance
spectra were obtained over the frequency range from 0.1 Hz to 100 kHz using a commercial po-
tentiostat and software marketed by Gamry Instruments, Inc. The potentiostat is constructed on a
PC card and is inserted into a computer for use. The impedance measurements between a given
pair of sensors were stable and repeatable at a given time. Once the raw impedance data was ob-
tained, comparisons of measured spectra and equivalent circuit analysis were performed. The
measured impedances were compared over the entire frequency range and also at specific fre-
quencies. Equivalent circuit analysis adjusts the parameters of the circuit shown in Figure 1 us-
ing a nonlinear least squares algorithm such that the impedance of the circuit closely matches the
data. Equivalent circuit analysis was performed using computer software marketed by Gamry
Instruments (Gamry 2003). Figure 3 shows typical impedance magnitude and phase spectra
measured from the rebar to an external sensor and the impedance of the fitted equivalent circuit.
Because the CFRP is highly conductive, the entire sheet acts as a single electrode and measure-
ments from the rebar to any of the external sensors yielded essentially the same
measurements.
Experimental Results
Parameters of the Equivalent Circuit The elements in the equivalent circuit in Figure 1 control the behavior of the fitted imped-
ance spectrum over different frequency ranges. The impedance measurements shown in Figure 3
are characteristic of an electrochemical system governed by mixed kinetic and diffusion control.
The C1 (capacitance), R1 (resistance) and CPE (constant phase element) parameters control the
fitted impedance spectrum in the low-frequency region and characterize the diffusion process in
the electrolyte (pore fluid in the concrete). The C2, C3, R2 and R3 parameters control the fitted
11
impedance spectrum in the mid- to high-frequency region and characterize the kinetics of the
charge transfer processes at the electrode-electrolyte (steel/concrete and CFRP/concrete) inter-
faces. The high-, mid- and low-frequency regions are defined as 1000-100,000 Hz, 10-1000 Hz
and 0.1-10 Hz, respectively.
No major problems were encountered in fitting the equivalent circuit parameters to the
measurements using the Gamry software. Initial values specified for each parameter are shown in
Table 1.
Effect of CFRP Debonding Investigation of the debonding of CFRP reinforcement from concrete was conducted using
the wedge test in two different environmental conditions with medium-sized and large concrete
specimens. One condition was a controlled environment with a temperature of about 5oC and a
relative humidity range of about 35 to 40%. The other condition was an ambient environment
with a temperature of about 22oC and variable humidity. For medium-sized specimens, imped-
ance measurements were made from the rebar to each of the copper tape sensors and between
pairs of internal wire sensors. The large beam had four rebars (two at the top and two at the bot-
tom) and stirrups (vertical steel), and measurements were taken from one of the rebars closest to
the CFRP sheet and the external sensors and between pairs of internal wire sensors. Equivalent
circuit analysis was performed for all impedance measurements. Impedance measurements taken
from the reinforcing bar (R) to any of the copper tape sensors (Ci) were essentially identical. This
observation implies that the highly conductive CFRP serves as a single continuous electrode
even at this large scale. As a result, each equivalent circuit parameter value corresponding to the
impedance measurement from the rebar sensor to each external copper tape sensor was averaged
at each crack state.
12
Assessing the Global State of the Bond Impedances were measured for three medium concrete specimens in a refrigerator and
three medium specimens in the ambient condition at the initial crack state (100mm crack length).
The cracks were then extended in the same environmental conditions and additional readings
were taken. The refrigerator provided a controlled environment with a temperature of about 5oC
and a relative humidity range between 35 and 40%. For the ambient condition, the temperature
fluctuated between 18oC and 24oC and the relative humidity fluctuated between 30% and 60%.
The debonding was best detected with impedance measurements from the rebar to the copper
tape sensors.
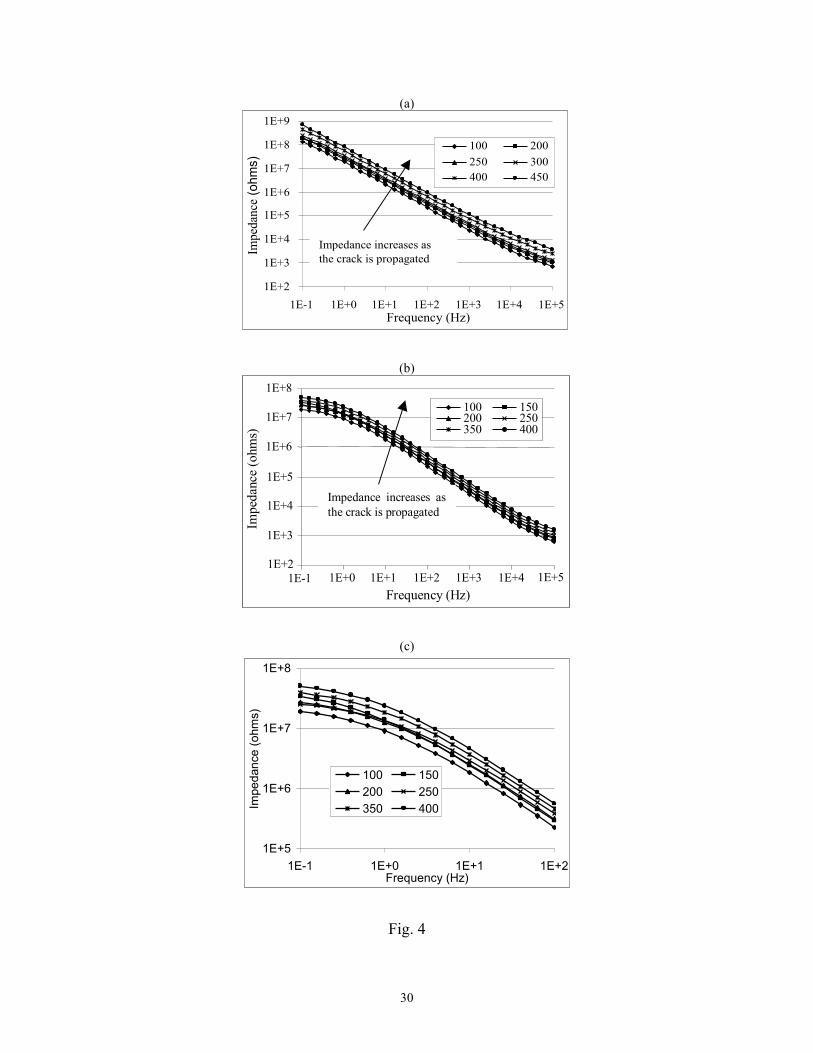
Typical variations of the impedance spectra as the crack length increases are shown in Fig-
ure 4. In the controlled environment (Figure 4a), the impedance magnitude increases over the
entire frequency range as the crack length is increased. In the ambient condition (Figure 4b and
4c), the impedance measurements in the low- to mid-frequency range were influenced by tem-
perature and humidity variations and the curves corresponding to crack lengths of 150-250 mm
cross each other (more visible in Figure 4c). This effect is clearer in Figure 5 and is discussed
further below. However, the measurements in the mid- to high-frequency range were much less
sensitive to environmental effects.
The Nyquist plot, in which the real part of the impedance is plotted against the imaginary
part of the impedance, more clearly displays the impedance in the low-mid frequency range be-
cause the high-frequency measurements are clustered near the origin. Figure 5 shows a typical
set of Nyquist plots for the wedge test at ambient conditions. The radii of the arcs in the Nyquist
plot represent the magnitude of measured impedance in the mid-low frequency range. For the
test under controlled environmental conditions, the radii of the arcs increased progressively with

13
the debonded length (Harichandran et al. 2003, Hong 2003). However, for the test at ambient
conditions (Figure 5) the radii of the arcs do not progressively increase with the crack length,
thereby indicating that there is an interaction between the debonding effect and short-term envi-
ronmental effects (moisture and temperature). The measured impedance decreased when the
crack length grew from 150 to 250 mm due to increasing humidity and then increased as the
crack length grew further from 250-400 mm. However, the magnitude of impedance in the high-
frequency range progressively increases as the crack is propagated.
Tests on the medium specimens indicated that impedance measurements were most stable
in a cold environment. For this reason, the large beam was initially placed outdoors from Febru-
ary to March 2003 with the intent of taking stable measurements at cold temperatures in early
spring. However, because of large temperature fluctuations that winter, it was decided that meas-
urements would be taken indoors. The measured impedances from the rebar to the copper tapes
for the large beam are about an order of magnitude lower than those for the small specimens.
This is believed to be due to the larger sensor surface areas in the beam (reinforcement cage and
CFRP sheet).
For the wedge test on the large beam the impedance magnitude decreased at low frequen-
cies as the CFRP debonded length increased. This indicated that humidity and temperature varia-
tions were interfering with the effect of CFRP debonding in the low- and mid-frequency regions
after the large beam was moved indoors. It is postulated that the concrete dried out in the very
cold and dry environment when it was outdoors and began to absorb moisture after it was moved
indoors. Because of its large size, the beam is likely to have absorbed moisture gradually over a
long period of time. The increased moisture and temperature fluctuations from 18oC to 24oC
would explain the reduction in impedance at low frequencies. However, at high frequencies, the
14
magnitude of the impedance increased with the debonded length of the CFRP, since it is not sen-
sitive to humidity and temperature variations as observed for the medium specimens. The meas-
ured impedances at high frequencies are shown in Figure 6.
Equivalent circuit analysis also is effective in studying CFRP debonding. In equivalent cir-
cuit analysis, the CPE parameter controls the fitted impedance in the low-frequency region and is
therefore sensitive to humidity and temperature variations. However, the capacitance parameters
are not overly sensitive to the different environmental conditions. All capacitance parameters
decreased as the crack length increased. This is contrary to expectations if the capacitance pa-
rameters physically represent different interfaces, since the capacitance due to the re-
bar/electrolyte interface should be independent of crack length. This behavior illustrates that a
purely physical interpretation of the empirical equivalent circuit can be problematic. The (R2,
C2) and (R3, C3) parameter pairs can switch from one fit to another since they represent sym-
metric sub-circuits in the equivalent circuit. Thus, rather than treating the C2 and C3 parameters
independently, it is convenient to add them. It was found that the C1, C2+C3, and C1+C2+C3
capacitor combinations from the equivalent circuit analysis all correlate well with the crack
length with C1 decreasing from 7.5-1.5 nanofarads and C2+C3 decreasing from 25-5 nanofarads
(Hong 2003). However, as described later, the C1+C2+C3 combination is the quantity most sta-
ble under short- and long-term environmental exposure.
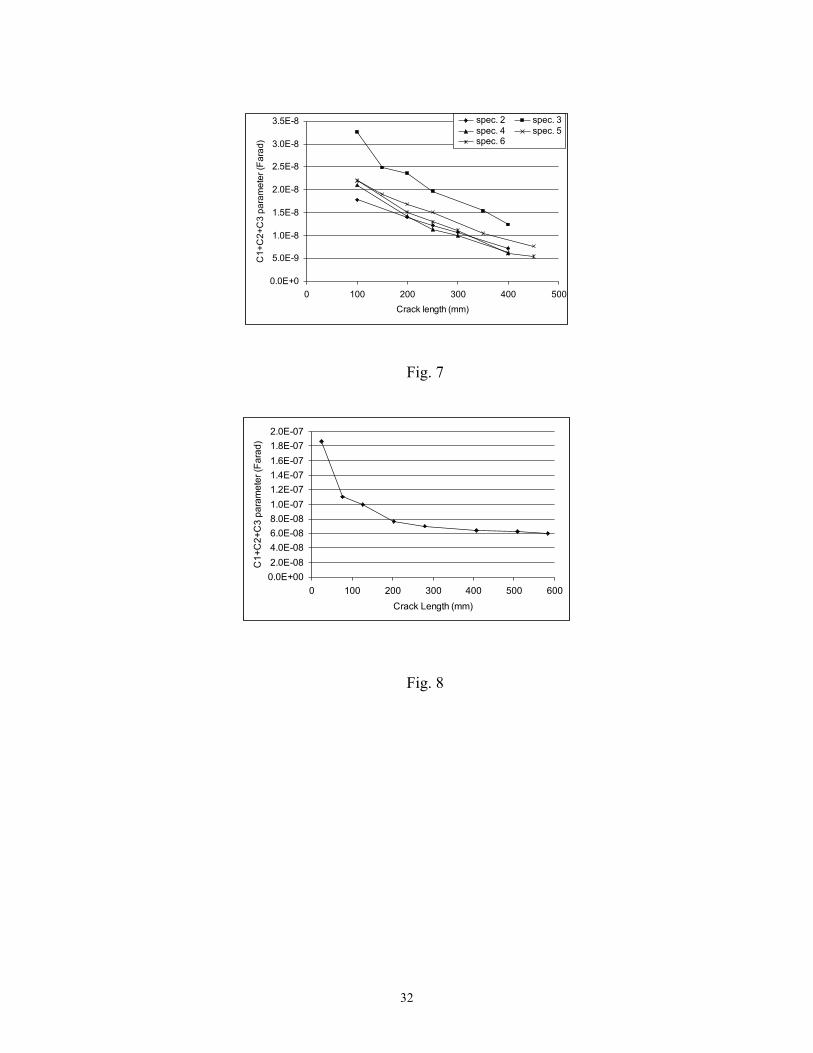
Figure 7 shows that the sum of all capacitance parameters for the medium specimens sub-
jected to controlled and ambient environmental conditions decreased linearly with increasing
crack length. Figure 8 shows the C1+C2+C3 values for the large concrete beam due to CFRP
debonding. The C1+C2+C3 values decreased significantly during the initial debonding of the
CFRP. The different behaviors in Figures 7 and 8 are attributed to scale effects. Wedge tests on

15
the medium specimens indicated that the C1+C2+C3 value is a reliable indicator of CFRP
debonded area and had a low sample-to-sample variation (Hong 2003). The fact that C1+C2+C3
is relatively insensitive to environmental effects makes it a good indicator of CFRP debonding.
Detecting the Location of Debonded Regions While impedance measurements between the rebar and external sensors provide a global
assessment of the debonded area, they are incapable of revealing the location of debonded re-
gions. However, impedance measurements taken between pairs of internal wire sensors (Wi) can
be used to locate debonded regions. Measurements were made between adjacent sensors (such as
W1 and W2, W2 and W3 and so on) as the internal crack between the CFRP and concrete was
propagated.
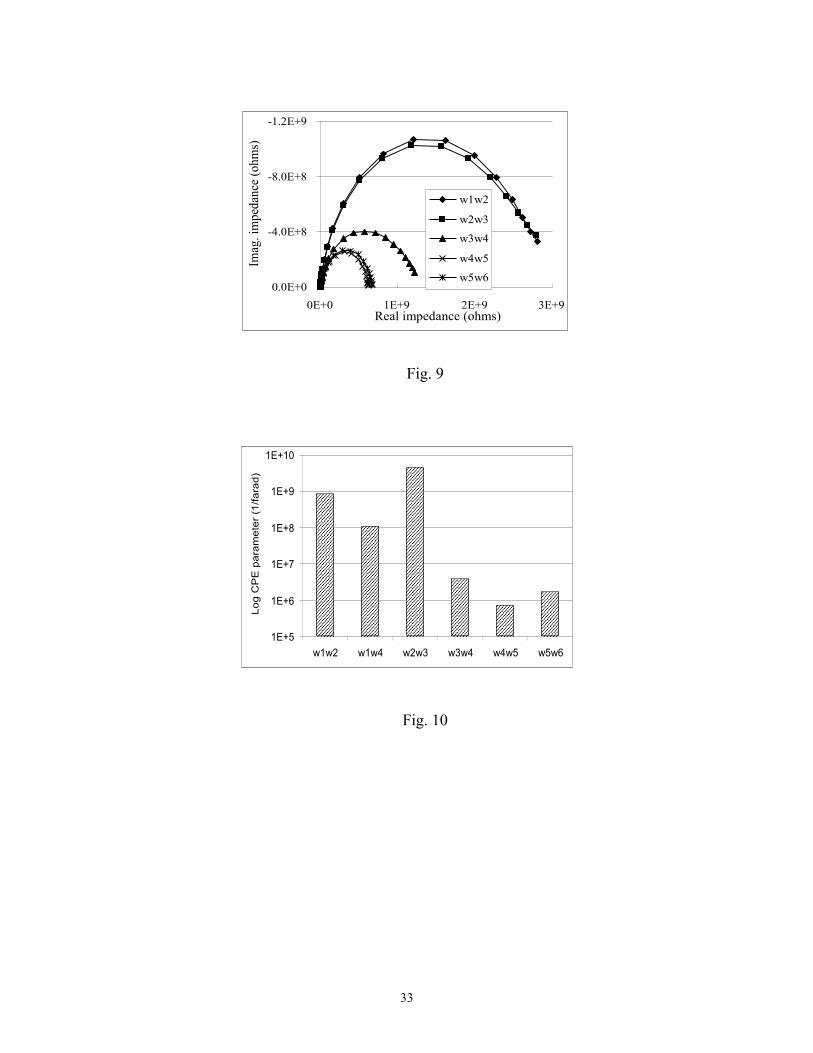
Nyquist plots for measurements between internal sensors for a typical medium specimen
are shown in Figure 9 when the crack tip was located between the W3 and W4 sensors. The
Nyquist plot shows a very clear demarcation between readings for sensor pairs in the bonded and
debonded regions. The impedance magnitude is much lower when the pair of sensors used are in
the bonded region (W4W5 and W5W6), than when the pair of sensors are in the debonded region
(W1W2 and W2W3). When one sensor is in the bonded region and the other in the debonded
region (W3W4), the impedance magnitude is in between those for the other two cases. It is pos-
tulated that the reason for this distinctive difference in the magnitude of impedance is the path of
current flow in each case. When the impedance measurement is made between sensors in the
debonded area, current must flow through the concrete, and the impedance is high. On the other
hand, when measurements are made between sensors in the bonded area, current probably flows
predominantly through the highly conductive CFRP sheet, with charge transfer between the in-
ternal sensors and the CFRP sheet, resulting in lower impedances.
16
While raw impedance measurements are sufficient to detect debonded regions, equivalent
circuit analysis also can be used. The effect of debonding on the impedances measured between
pairs of internal sensors is best observed with the CPE parameter. The variation of the CPE pa-
rameter on the large concrete beam is shown in Figure 10 when the crack tip was between the
W2 and W3 sensors. Note that a logarithmic scale is used for the vertical axis. The magnitude of
the CPE parameter corresponding to measurements between pairs of sensors in the debonded re-
gion is about two orders of magnitude higher than that corresponding to pairs of sensors in the
bonded region. Although the a parameter of the CPE was different for measurements between
different sensor pairs, it was usually less than 0.5 (often less than 0.2) indicating that the CPE
was mainly resistive. This is in agreement with the current flow mechanism postulated earlier.
A narrow debonded region that extends in the longitudinal direction across all internal wire
sensors will not be able to be detected by the pairwise measurements because all pairwise meas-
urement will reflect the presence of the debond. However, for a large beam, a narrow debonded
region will never extend over the whole beam length and if internal wires are distributed over the
entire beam length then there will always be internal sensor pairs outside the debonded region.
Moisture is also likely to have an effect on pairwise measurements. However, since all
pairwise measurements are typically taken over a short time interval, moisture will affect all
readings in a similar way. Since only relative differences in the pairwise measurements are used
to locate the debonded regions, moisture will not affect this identification.
Effect of Short-Term Environmental Conditions Six small specimens were exposed to relative humidity levels of 30%, 60% and 90% in an
environmental chamber while the temperature was maintained at 21oC (70oF). Three were manu-
factured with chloride (11.0 kg NaCl per cubic meter of concrete) and three without chloride. For
17
each humidity level the specimens were kept in the chamber for at least one week and their
weights were measured daily. Impedance measurements were taken only when moisture absorp-
tion had ceased and the weights stabilized. Specimens also were exposed to a temperature of
38oC (100oF) for one week in an oven in which the humidity level could not be controlled, and
impedance measurements were taken while the specimens remained in the oven.
Figure 11 shows typical impedance spectra measured from the rebar to an external sensor
over the entire frequency range for different humidity and temperature levels for a specimen
without chloride. Although increasing temperature decreases the impedance measurements over
the entire frequency range, they have a significant influence only in the mid-and low-frequency
regions. The lower impedance at low-frequencies for specimens in the oven is either due to the
increased moisture that might have been present inside the oven at the high temperature or due to
a faster rate of diffusion at the higher temperature. Unfortunately the humidity meter could not
be exposed to the environment inside the oven and hence the humidity was not measured. Differ-
ent humidity levels affect the impedance at low frequencies because the amount of pore fluid in
the concrete influences the rate of ion diffusion. At high frequencies the impedance is governed
by the kinetics of the charge transfer processes at the electrode-electrolyte interface which is not
influenced significantly by the moisture content.
In equivalent circuit analysis, the CPE parameter controls the fitted impedance in the low-
frequency region and is therefore sensitive to humidity and temperature variations. However, the
capacitance parameters are not very sensitive to the different environmental conditions. Figure
12 shows the variation of the sum of all capacitance parameters (C1+C2+C3) from the equiva-
lent circuit analysis at the various humidity and temperature levels for the three specimens with-
out chloride. This measure is considerably different for specimens in the oven (100oF), and also

18
shows a noticeable change for specimen 3 at 90% relative humidity. However, in general this
measure is somewhat insensitive to changes in humidity.
The lack of sensitivity of C1+C2+C3 to humidity changes might appear counter-intuitive.
For parallel plate capacitors, the capacitance is dependent on the electrical permittivity of the
dielectric as shown in Eq. (6). With moisture uptake, the permittivity of the dielectric should
change thereby causing a change in the capacitance. Davis et al. (1999) were able to correlate the
moisture uptake into the adhesive with capacitance when studying metal/FRP bonds. For the
concrete specimens, however, the concrete is more like an electrolyte than a dielectric, and mois-
ture absorption by the concrete only changes the electrolyte resistance. The dielectric adjacent to
the FRP is more likely to be the epoxy adhesive, which will not absorb a significant amount of
moisture due to humidity changes in the environment. More aggressive wetting of the specimen
would be required to cause significant moisture uptake by the epoxy adhesive.
Effect of Long-term Environmental Conditions Three sets, each containing three small specimens, were exposed to: (1) 300 cycles of
freeze-thaw using the ASTM C666 Procedure B; (2) 300 cycles of wetting and drying with two
hours of immersion in water and ten hours of drying during each cycle; and (3) 21 days of accel-
erated corrosion using a 12V power supply with specimens immersed in a 2% sodium chloride
solution for one hour and exposed to air for 23 hours each day. The specimens used in the accel-
erated corrosion test contained a second rebar near the upper surface that was used as the cath-
ode, while the bar near the bottom was the anode subjected to corrosion. The corroded anode was
used as the electrode for EIS. Baiyasi and Harichandran (2001) used this corrosion test previous-
ly. Based on the total current over the 21 days and use of Faraday’s Law, the total steel loss was
19
estimated to be about 13g for each specimen. This represents an average corrosion depth of 0.45
mm (3.6% loss) over the bar (Hong 2003).
Figure 13 shows typical impedance spectra measured from the rebar to an external sensor
before and after the three different long-term environmental exposures. Long-term environmen-
tal conditions generally tend to deteriorate the concrete and increase the width and density of mi-
crocracks. This increases the mobility of ions within the concrete and hence reduces the magni-
tude of impedance. The results indicate that the reduction in impedance is most significant in the
low- to mid-frequency regions where diffusion is the primary mode of conductance. Figure 14
shows the variation of the sum of the capacitance parameters (C1+C2+C3) from the equivalent
circuit analysis before and after the different long-term environmental conditions for a typical
specimen. It is apparent that the high-frequency impedance measurements and the C1+C2+C3
parameter are insensitive to the long-term environmental conditions.
Recommendations for Field Implementation In the proposed EIS technique, the impedance of an electrochemical cell is measured be-
tween two electrode sensors. These are the reinforcing bar, internal sensors and external sensors.
Internal sensors (Wi) are installed before the CFRP sheet is applied and external sensors (Ci) are
installed on the outside of the last CFRP sheet before the protective epoxy layer is applied. Inter-
nal sensors cannot be installed in beams that have already been retrofitted with CFRP. Internal
sensors consist of 0.625 mm diameter stainless steel wire installed in grooves. These installations
can be done both for prefabricated and cast-in-place beams, although it is much easier to install
the sensors in prefabricated beams. Wiring from the sensors need to be collected and routed to a
junction box to which a portable potentiostat could be connected when impedance measurements
are to be taken.

20
Impedance measured between a rebar and the external copper tape sensors are most effec-
tive for assessment of the total debonded area. Only one or two external sensors are needed for a
large beam. Therefore, using just a few measurements the global state of the bond can be as-
sessed. Measurements must be taken once or twice a year from the time the sensors are installed,
and subsequent measurements must be compared with initial measurements. Care must be exer-
cised to account for variations in measurements that are caused by variations in environmental
conditions when measurement are taken by using the sum of the capacitance parameters of the
equivalent circuit or by only using high-frequency measurements. Measurements should not be
taken on very hot summer days when temperatures may approach 100°F. As shown in Figure 8,
a significant change in the C1+C2+C3 parameters is observed when only about 100 mm of the
CFRP is debonded. Once CFRP debonding is detected using the measurements from a rebar to
external sensors, measurements can be taken between pairs of internal sensors to locate the
debonded regions for performing repairs. One set of impedance measurements from 100,000 Hz
to 0.1 Hz takes about five minutes.
The installation of the wire sensors may appear tedious in practice. However, this is true of
almost any structural health monitoring system that employs sensors. While the initial labor cost
for the installation may be high, the stainless steel wire sensors are extremely inexpensive and
the long-term monitoring cost is also modest.
Conclusions Electrochemical impedance spectroscopy (EIS) is used for nondestructive evaluation
(NDE) of carbon fiber reinforced polymer (CFRP) debonding in concrete beams strengthened
with CFRP sheets. Sensor elements (electrodes) consisted of: (a) copper tape with a conductive
adhesive applied to the outside of the CFRP prior to application of the epoxy; (b) stainless steel
21
wire placed in grooves on the bottom face of the concrete; and (c) a reinforcing bar. Impedance
measurements were taken between pairs of sensors using a potentiostat. An equivalent circuit
was fitted to each measured impedance spectrum and the circuit parameters were estimated. Var-
iations in the measured impedance spectra and the equivalent circuit parameters due to different
environmental conditions and debonding of the CFRP sheet were studied in controlled and ambi-
ent conditions.
Impedance measurements taken between a rebar and external copper tape sensors can be
used to assess the total debonded area. The sum of the capacitance parameters in the equivalent
circuit correlate well with the debonded area and is not sensitive to environmental factors. Im-
pedance measurements taken between pairs of internal wire sensors reveal the location of
debonded regions. The EIS-based sensor technology shows promise for inexpensive and effec-
tive NDE of concrete structures strengthened with CFRP.
Acknowledgments The Michigan State Department of Transportation (MDOT) funded this research. The pro-
ject manager was Roger D. Till. Dr. Guy Davis from DACCO SCI Inc., Columbia, Maryland,
shared with the authors the basic techniques he developed for the use of EIS for NDE. Dr. Ah-
med Alostaz, presently with the Department of Civil Engineering, University of Mississippi, Ox-
ford, Mississippi, was involved in this project during the early stages.
References Akuthota,B.,Hughes,D.,Zoughi,R.,Myers,J.J.andNanni,A.(2004).“Near-field microwave
detection of disbond in carbon fiber reinforced polymer composites used for strengthening

22
cement-based structures and disbond repair verification.” JournalofMaterialsinCivilEn-
gineering,ASCE,16(6),540-546.
Baiyasi, I. M., and Harichandran, R. S. (2001). “Corrosion and wrap strains in concrete bridge
columns repaired with FRP wraps.” Proceedings (CD-ROM), 80th Annual Meeting of the
Transportation Research Board, Washington, D.C., Paper No. 01-2609, 11 pp.
Buyukozturk, O., and Hearing, B. (1998). “Failure behavior of precracked concrete beams retro-
fitted with FRP.” Journal of Composites for Construction, Vol. 2 (3), August, 138-144.
Davis, G.D., Krebs, L.A., Drzal, L.T., Rich, M.J., and Askeland, P. (2000). “Electrochemical
sensors for nondestructive evaluation of adhesive bonds.” Journal of Adhesion, Vol. 72,
335-358.
Davis, G.D., Rich, M. J., Harichandran, R.S., Drzal, L. T., Mase, T., and Al-Ostaz, A. (2003).
“Development of an electrochemical impedance sensor to monitor delamination and mois-
ture uptake in CFRP-reinforced concrete structures.” Proceedings, 81st Annual Meeting of
the Transportation Research Board (CD-ROM), National Research Council, Washington,
D.C., Paper No. 03-2392.
Davis, G.D., Dacres, C.M., and Krebs, L.A. (1999). “In-situ sensor to detect moisture intrusion
and degradation of coatings, composites, and adhesive bonds.” Proc., Tri-Services Confer-
ence on Corrosion, Myrtle Beach, South Carolina.
Gamry Instruments. (2005). “Electrochemical impedance spectroscopy theory: a primer.”
<http://www.gamry.com/App_Notes/EIS_Primer/EIS_Primer.htm> (February 19, 2005).
Gamry Instruments. (1997). “Redefining electrochemical measurements.” <http://
www.gamry.com/Homepage/Index.html> (October 20, 2003).
23
Harichandran, R.S., Hong, S., Al-Ostaz, A., and Davis, G.D. (2003). “NDE of bond integrity in
concrete structures strengthened with carbon FRP using EIS.” Proceedings, 1st Interna-
tional Conference on Structural Health Monitoring and Intelligent Infrastructure, Tokyo,
Japan, November, 1183-1190.
Hong, S. (2003). “Electrochemical impedance spectroscopy based sensors for NDE of
CFRP/concrete bond in beams.” MS Thesis, Dept. of Civil and Environmental Engineering,
Michigan State University, East Lansing, Michigan.
Karbhari, V. M., and Zhao, L. (2000). “Use of composites for 21st century civil infrastructure.”
Computer Method in Applied Mechanics and Engineering, 185(2-4), 433-454.
Kendig, M.W., and Scully, J.R. (1989). “Basic aspects of the application of electrochemical im-
pedance for the life prediction of organic coatings on metals.” Corrosion J., Vol. 45, April.
Mirmiran, A. and Wei, Y. (2001). “Damage assessment of FRP-encased concrete using ultrason-
ic pulse velocity.” Journal of Engineering Mechanics, ASCE, 127(2), 126-135.
Nguyen, D.M., Chan, T.K., and Cheong, H.K. (2001). “Brittle failure and bond development
length of CFRP-concrete beams.” Journal of Composites for Construction, 5(1), 12-17.
Rahimi, H., and Hutchinson, A. (2001). “Concrete beams strengthened with externally bonded
FRP plates.” Journal of Composites for Construction, 5(1), 44-56.
24
List of Figures
Figure 1: (a) Equivalent circuit used to study CFRP debonding, and (b) model of the charge
transfer process when the rebar and CFRP sheet are used as electrodes
Figure 2: Sensor arrangement for medium-sized specimens
Figure 3: Measured (dots) and fitted (lines) impedance spectra—rebar to external sensor.
Figure 4: Bode magnitude plot of typical impedance spectra for wedge test in: (a) controlled en-
vironment, (b) ambient environment (legend gives the crack length in mm), and (c) en-
largement of (b) in the low-frequency range
Figure 5: Nyquist plot of typical impedance spectra for wedge test in ambient condition (legend
gives the crack length in mm)
Figure 6: Impedance spectra in the high-frequency range for wedge test on large beam
Figure 7: Variation of C1+C2+C3 with debonded length for medium (600 mm long) specimens
Figure 8: Variation of C1+C2+C3 with debonded length for large (2400 mm long) beam
Figure 9: Nyquist plot of typical impedance spectra for wedge test in ambient condition (legend
gives the crack length in mm)
Figure 10: CPE parameter for pairwise measurements when crack tip was between sensors W2
and W3 (legend shows the pair of internal sensors used)
Figure 11: Typical impedance spectra at different humidity and temperature levels (legend: F-
temperature in °F, H-relative humidity)

25
Figure 12: Variation of C1+C2+C3 with humidity and temperature (legend: F-temperature in °F,
H-relative humidity)
Figure 13: Typical impedance measurements before and after 21 days of accelerated corrosion of
the rebar, and 300 cycles of freezing/thawing and wetting/drying (legend identifies the
time of measurement and the exposure: B-before, A-after, C-corrosion, FT-freeze/thaw,
WD-wet/dry)
Figure 14: Variation of C1+C2+C3 before and after 21 days of accelerated corrosion of the re-
bar, and 300 cycles of freezing/thawing and wetting/drying
26
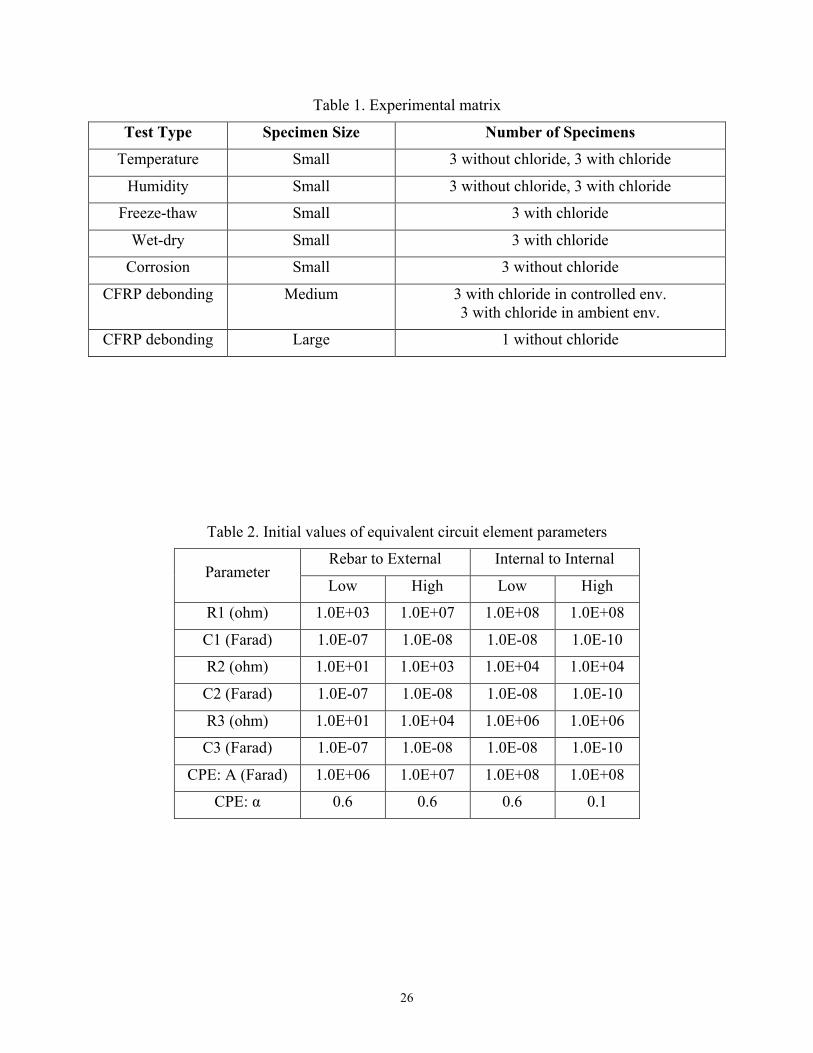
Table 1. Experimental matrix
Test Type Specimen Size Number of Specimens
Temperature Small 3 without chloride, 3 with chloride
Humidity Small 3 without chloride, 3 with chloride
Freeze-thaw Small 3 with chloride
Wet-dry Small 3 with chloride
Corrosion Small 3 without chloride
CFRP debonding Medium 3 with chloride in controlled env. 3 with chloride in ambient env.
CFRP debonding Large 1 without chloride
Table 2. Initial values of equivalent circuit element parameters
Parameter Rebar to External Internal to Internal
Low High Low High
R1 (ohm) 1.0E+03 1.0E+07 1.0E+08 1.0E+08
C1 (Farad) 1.0E-07 1.0E-08 1.0E-08 1.0E-10
R2 (ohm) 1.0E+01 1.0E+03 1.0E+04 1.0E+04
C2 (Farad) 1.0E-07 1.0E-08 1.0E-08 1.0E-10
R3 (ohm) 1.0E+01 1.0E+04 1.0E+06 1.0E+06
C3 (Farad) 1.0E-07 1.0E-08 1.0E-08 1.0E-10
CPE: A (Farad) 1.0E+06 1.0E+07 1.0E+08 1.0E+08
CPE: α 0.6 0.6 0.6 0.1
27
(a)
C1
R1 CPE R3
C3
R2
C2
(b)
CFRP electrode
Concrete with pore fluid (electrolyte)
Rebar electrode
Electrical double layer
Fig. 1

28
Fig. 2
Ci are external sensors (solid lines) Wi are internal sensors (dashed lines)

29
2
3
4
5
6
7
8
-1 1 3 5 Log Freq (Hz)
Log
Mod
ulus
(O
hm)
-90
-70
-50
-30
-10
Phas
e (D
egre
e)
Impedance
Phase
Fig. 3
30
(a)
1E+2
1E+3
1E+4
1E+5
1E+6
1E+7
1E+8
1E+9
1E-1 1E+0 1E+1 1E+2 1E+3 1E+4 1E+5 Frequency (Hz)
Impe
danc
e (o
hms)
100 200 250 300 400 450
Impedance increases as the crack is propagated
(b)
1E+2
1E+3
1E+4
1E+5
1E+6
1E+7
1E+8
1E-1 1E+0 1E+1 1E+2 1E+3 1E+4 1E+5Frequency (Hz)
Impe
danc
e (o
hms)
100 150200 250350 400
Impedance increases asthe crack is propagated
(c)
1E+5
1E+6
1E+7
1E+8
1E-1 1E+0 1E+1 1E+2Frequency (Hz)
Impe
danc
e (o
hms)
100 150200 250350 400
Fig. 4

31
-2.5E+7
-2.0E+7
-1.5E+7
-1.0E+7
-5.0E+6
0.0E+0 0E+0 2E+7 4E+7 6E+7
Real impedance (ohms)
Imag
. im
peda
nce
(ohm
s) 100 150 200 250 350 400
Fig. 5
0.0E+0
5.0E+1
1.0E+2
1.5E+2
2.0E+2
2.5E+2
3.0E+2
3.5E+2
4.0E+2
1E+4 1E+5Log Frequency (Hz)
Mag
. of I
mpe
danc
e (O
hms)
25 75125 200275 400500 575
Impedance increases as the crack is propagated
Fig. 6
32
0.0E+0
5.0E-9
1.0E-8
1.5E-8
2.0E-8
2.5E-8
3.0E-8
3.5E-8
0 100 200 300 400 500Crack length (mm)
C1+
C2+
C3
para
met
er (F
arad
)
spec. 2 spec. 3spec. 4 spec. 5spec. 6
Fig. 7
0.0E+002.0E-084.0E-086.0E-088.0E-081.0E-071.2E-071.4E-071.6E-071.8E-072.0E-07
0 100 200 300 400 500 600Crack Length (mm)
C1+
C2+
C3
para
met
er (F
arad
)
Fig. 8
33
-1.2E+9
-8.0E+8
-4.0E+8
0.0E+0 0E+0 1E+9 2E+9 3E+9
Real impedance (ohms)
Imag
. im
peda
nce (
ohm
s)
w1w2
w2w3
w3w4
w4w5
w5w6
Fig. 9
1E+5
1E+6
1E+7
1E+8
1E+9
1E+10
w1w2 w1w4 w2w3 w3w4 w4w5 w5w6
Log
CP
E p
aram
eter
(1/
fara
d)
Fig. 10

34
1E+3
1E+4
1E+5
1E+6
1E+7
1E+8
1E+9
1E-1 1E+0 1E+1 1E+2 1E+3 1E+4 1E+5 Log frequency (Hz)
Log
impe
danc
e (o
hms)
70F-30H 70F-60H
70F-90H 100F
Fig. 11
0.0E+0
5.0E-9
1.0E-8
1.5E-8
2.0E-8
2.5E-8
3.0E-8
3.5E-8
4.0E-8
Specimen 1 Specimen 2 Specimen 3
C1+
C2+
C3
para
met
er (F
arad
) 70F-30H 70F-60H 70F-90H 100F
Fig. 12

35
1E+3
1E+4
1E+5
1E+6
1E+7
1E+8
1E+9
1E-1 1E+0 1E+1 1E+2 1E+3 1E+4 1E+5 Log Frequency (Hz)
Log
impe
danc
e (o
hms)
B-C A-C
B-FT A-FT B-WD A-WD
Fig. 13
0.0E+0
2.0E-9
4.0E-9
6.0E-9
8.0E-9
1.0E-8
1.2E-8
1.4E-8
1.6E-8
Corrosion test Freeze-thaw Wet-dry
C1+
C2+
C3
para
met
er (F
arad
)
Before After
Fig. 14