Embed Size (px)
Citation preview

Sensors 2015, 15, 20873-20893; doi:10.3390/s150820873
sensors ISSN 1424-8220
www.mdpi.com/journal/sensors
Article
A Context-Aware EEG Headset System for Early Detection of
Driver Drowsiness
Gang Li and Wan-Young Chung *
Department of Electronic Engineering, Pukyong National University, Busan 608-737, Korea;
E-Mail: [email protected]
* Author to whom correspondence should be addressed; E-Mail: [email protected];
Tel.: +82-10-629-6223; Fax: +82-10-629-6210.
Academic Editor: Xue Wang
Received: 6 July 2015 / Accepted: 18 August 2015 / Published: 21 August 2015
Abstract: Driver drowsiness is a major cause of mortality in traffic accidents worldwide.
Electroencephalographic (EEG) signal, which reflects the brain activities, is more directly
related to drowsiness. Thus, many Brain-Machine-Interface (BMI) systems have been
proposed to detect driver drowsiness. However, detecting driver drowsiness at its early
stage poses a major practical hurdle when using existing BMI systems. This study proposes
a context-aware BMI system aimed to detect driver drowsiness at its early stage by
enriching the EEG data with the intensity of head-movements. The proposed system is
carefully designed for low-power consumption with on-chip feature extraction and low
energy Bluetooth connection. Also, the proposed system is implemented using JAVA
programming language as a mobile application for on-line analysis. In total, 266 datasets
obtained from six subjects who participated in a one-hour monotonous driving simulation
experiment were used to evaluate this system. According to a video-based reference, the
proposed system obtained an overall detection accuracy of 82.71% for classifying alert and
slightly drowsy events by using EEG data alone and 96.24% by using the hybrid data of
head-movement and EEG. These results indicate that the combination of EEG data and
head-movement contextual information constitutes a robust solution for the early detection
of driver drowsiness.
Keywords: driver drowsiness detection; EEG; gyroscope; slightly drowsy events;
mobile application
OPEN ACCESS

Sensors 2015, 15 20874
1. Introduction
Driver drowsiness is a major cause of mortality in traffic accidents worldwide. The U.S. National
Highway Traffic Safety Administration reports that drowsy driving is the cause of an estimated
40,000 injuries and 1550 deaths in car crashes every year [1]. Also, the Korean Expressway
Cooperation reports that, from 2010 to 2013, 1223 people died in Korean highway traffic accidents,
31% of which could be attributed to driver drowsiness [2,3]. Many of these deaths could be avoided if
driver drowsiness could be properly monitored and drivers are given early warnings.
Driver drowsiness, that is, excessive sleepiness, is more likely to happen when a person is driving
for extended periods in monotonous environments, such as on a highway. The standard clinical tests
for measuring sleepiness are the Multiple Sleep Latency Test (MSLT) and the Maintenance of
Wakefulness Test (MWT), combined with polysomnography datasets [4]. These measurements are
very expensive and cumbersome to perform (at least eight channels are needed: four EEG, two
electrooculogram (EOG), one electromyogram, and one electrocardiogram (ECG) [4]); it would be
practically impossible to use these methods to detect driver drowsiness in an actual driving
environment. For instance, the use of multiple sensors would be uncomfortable for the driver and could
even impede his or her movement. Thus, there is a strong demand for an easy-to-use driver drowsiness
detection (DDD) system.
To enable the detection of driver drowsiness both simply and inexpensively, many methods have
been proposed, including vehicle-based methods (such as the lane departure warning system [5] and
the steering wheel movement system [6–8]), video-based methods (such as the detector of the
degree (percentage) of eyelid closure over the pupils over time [9–12]), and physiological-signal-based
methods (such as those based on the ratio of low frequency to high frequency of heart rate
variability [13,14] and EEG (brain waves) [15]). Among these methods, physiological-signal-based
methods are considered to be the most reliable means of detection as these signals provide an
indication of the true internal state of the driver [16]; and compared to other physiological signals, the
EEG, that is a non-invasive physiological means of measuring brain activity, is considered to have the
closest relationship with drowsiness [4,17–19]. Over the years, Lin’s group is committed to detect
driver drowsiness using EEG alone. For example, in 2010, his group developed a real-time DDD
system, which consists of a wireless EEG headband and a self-developed portable device, which is
embedded with a binary threshold-based decision-making model [20]. In November 2012, his group
developed an EEG headset and Android smartphone-based driver drowsiness monitoring and
management system [21]. In more recent work [22], his group further proposed a driver vigilance
monitoring system, which is based on a wireless EEG headband and a support vector regression model
enabled Android tablet device.
These systems, which integrate portable smart devices and EEG together, might lead to low-cost
and simple-to-use DDD solutions. However, for practical purpose, a possible drawback is that the
inevitable head movements caused by yawning, rubbing face or eyes and moving restlessly on chair
when drivers are slightly drowsy [23], would significantly influence the EEG signal quality and result
in unreliable detection result. Therefore, using EEG alone is not robust to recognize a drowsy driver’s
early features, when feedback might be the most effective. If taking EEG as the main signals for DDD,
then the information of head movements can be regarded as contextual information that could be easily

Sensors 2015, 15 20875
captured by motion sensor. For example, Vural et al. [24] proposed to use accelerometer to measure
the head movements. They mentioned that head motion increased as the driver became drowsy and the
head would become still just before falling asleep. One limitation of this study is that the head motion
was measured using only one dimension of the accelerometer. Regan et al. [25,26] proposed to use
gyroscope to measure head movements. Based on a commercial device with integrated gyroscope [27],
they successfully recognized the head-movement-related artifacts in EEG signals. Nevertheless, the
head movements mentioned were intentioned movements that were instructed by researchers instead
of the natural movements occurred in a real-life application circumstances. Also, the usage of
two-axis (X and Y axis) gyroscope limits the system to a low-directional-resolution output. Compass,
accelerometer and gyroscope are commonly-used motion sensors. Among the three sensors, compass
and accelerometer sense magnetic north and gravity as the external references respectively. However,
gyroscope is very different. It senses its own rotation without any external reference needed. So,
whenever and wherever the head stopped, its sensory value goes to zero, which is very suitable to
detect the intensity of head movements.
This study aims to enrich the EEG data with the intensity of head-movement by integrating
three-axis gyroscope sensor into the EEG headset. We would like to determine if using a combination
of EEG and head-movement parameters would increase the ability to earlier predict driver drowsiness
compared to using EEG signals alone. To achieve this goal, this study includes the following aspects:
(1) design and implement a low-power, wireless and context-aware EEG acquisition headset with
integrated feature extraction processor; (2) design and implement a mobile Data-to-Knowledge
platform using smartphone; (3) test the Data-to-Knowledge platform by driving simulation experiment.
We reviewed studies about EEG-based DDD in the past decade from well-known literature pools
including IEEE Xplore, ScienceDirect, and SpringerLink. To the author’s best knowledge, this is the
first study attempting to detect driver drowsiness using EEG signals enriched with head-movement
context information. Thus, the contributions of this work are twofold: (1) the full design for a wireless
context-aware EEG system is described; (2) the concept of early detection of driver drowsiness using
context-aware EEG is confirmed.
The rest of the paper is organized as follows. Section 2 presents the system design. Section 3
presents the system evaluation design for simulated driving. Section 4 presents the evaluation results.
Further discussion about the evaluation results is presented in Section 5. Section 6 concludes the paper
with future work.
2. System Design
Figure 1 shows the proposed DDD system, which consists of a wireless context-aware EEG headset
and a smartphone (Android 4.4.2, Samsung, Suwon, South Korea,). The EEG headset is powered by a
3.6 V 2600-mAh lithium-ion battery and incorporates a sensory input unit (SIU) as well as a sensory
processing unit (SPU). The analog data from the SIU are converted to digital data by the SPU’s
built-in 12-bit analog-to-digital converter (ADC) and stored in the 20 K static random access memory.
Then, the digital data are transformed by Fast Fourier Transformation (FFT) algorithm directly inside
of the 32-bit processor on the SPU. Then, the extracted FFT-based EEG and head movement features
are wirelessly transmitted to the smartphone via a Bluetooth Low-Energy (BLE) module [28]. The
Sensors 2015, 15 20876
smartphone puts these features into a support vector machine (SVM)-based classification model to
automatically estimate the driver drowsiness level. The following sections introduce in detail the major
components of this system.
(a)
(b) (c)
(d) (e)
Figure 1. (a) Block diagram of the proposed system; (b) The top view of the
designed headset; (c) The full view of the headset; (d) The fabricating procedure using
3D printer; (e) The fabricated headset prototype.
2.1. Wireless Context-Aware EEG Headset
Traditional wired EEG acquisition systems were commonly seen in EEG-based DDD studies,
such as [15,18,29–31]. These systems could be acceptable for research purposes, but essentially
impossible for practical use due to being so cumbersome. This limitation can be overcome by wireless
EEG acquisition systems, which eliminate the wire connection between the EEG sensing part and the
Sensors 2015, 15 20877
Data-to-Knowledge part, using wireless transmission technology such as Bluetooth, Zigbee, or some
other proprietary radio frequency unit. In this case, wireless EEG acquisition systems can be
manufactured easily and offer several desirable advantages, such as small size and light weight. These
desirable aspects of wireless EEG acquisition systems make them very suitable for real-life DDD
applications. In this study, the developed wireless context-aware EEG headset consists of two parts:
SIU and Bluetooth-enabled SPU. As can be seen in Figure 1, for wearable purposes, the two units are
put into a specifically designed case which is fabricated by 3D printer, which is then connected to an
elastic headband via two snap buttons.
2.1.1. SIU
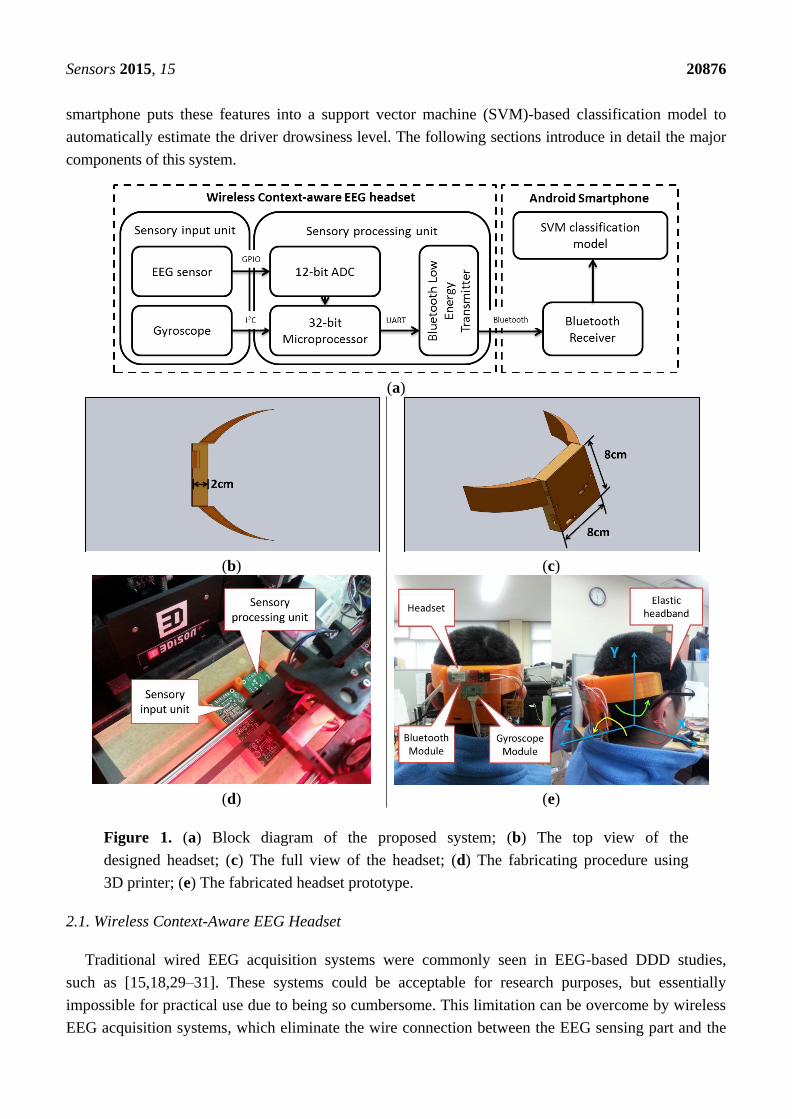
The SIU consists of three EEG dry electrodes, an EEG bio-potentials conditioning circuit
and a three-axis gyroscope module. Among the three dry electrodes, one ear-clip electrode,
from Laxtha Co., Ltd [32], serves as a ground electrode which is placed on the earlobe and given 1.65 V
bias to satisfy the required condition of the SPU’s ADC which is powered by a single positive
reference voltage (+3.3 V). Two dry electrodes, from Cognionics Co., Ltd [33], are used as EEG signal
electrodes. They are specifically designed for hairy regions. Thus, in this study, they are placed at
occipital regions O1 and O2, where is highly correlated with the driver’s vigilance level [34]. Before
applying them to EEG bio-potentials conditioning circuit (as shown in Figure 2), the driver circuit for
the dry electrodes which is adapted from [35] is implemented. The comparison between conventional
wet Ag/AgCl electrodes and the dry electrodes can be found in Section 4.
Figure 2. Structure of EEG bio-potentials conditioning circuit and a pair of commercial
dry electrodes used. The locations marked by red dotted circles are the locations EEG
electrodes attached in this study.
EEG signals are usually weak and easy to be interfered by undesired noises (EEG signals typically
have amplitude in the range of 10 µ–100 µV). Therefore, both amplifying and filtering are required for
further signal processing. In addition, human skin typically provides source impedance on the order
of 1 M–5 MΩ. Thus, amplifiers must match the source impedance or have greater input impedance
than the source skin impedance to acquire EEG signals. For these reasons, the output of the bipolar
electrode is transferred to EEG bio-potentials conditioning circuit and firstly amplified by an
instrument amplifier (IA: INA28, Texas Instruments) with 16.5 × gains. The INA128 is a low-power
Rain-to-Rain IA which features a high differential input-impedance of 10GΩ || 2pF and a high
common mode rejection ratio of 100 dB when the gains are 10×. Therefore, INA128 can balance the

Sensors 2015, 15 20878
electrode-skin impedance well and reject common mode signals as much as possible. Additionally, in
order to acquire the most useful EEG bands for DDD application (θ (4–7 Hz), α (8–13 Hz) and
β (13–30 Hz)) [12,13,19–22,36], the cutoff frequencies of the Low Pass Filter (LPF) and High Pass
Filter (HPF) are set to 4 Hz and 30 Hz, respectively. The output signal of IA is transferred to 2nd-order
Butterworth HPF and then filtered by the 4th-order Butterworth LPF. Finally, the signal is amplified
by the main and 2nd non-inverting amplifier with 151 × and 12 × gains. The significance of using
non-inverting amplifier is that it features high input impedance and low output impedance, which is
similar to voltage follower. The amplifier used here is LMC6464 from Texas Instruments, which is a
low-power operation amplifier with Rail-to-Rail input and output. A notch filter for power-line noise
was not included in this circuit because there are no main power outlets in the car environment. For
indoor tasks, such as the driving simulation experiment, a digital notch filter was directly implemented
on chip to remove 60 Hz power-line noise in real-time.
We use L3G4200D as the sensor platform for collecting the gyroscope data. The L3G4200D is from
ST semiconductor, which is a low-power three-axis digital output gyroscope. It integrates LPF, HPF
and 16-bit ADC together and also supports I2C and SPI digital output interface. In this study, the
L3G4200D are attached on EEG headset using expansion board. The 16-bit sensor readings are
transferred directly to the SPU via I2C connection. As shown in Figure 1e, the location of the
gyroscope is around the center part of the squared case of the headset. The directions of the three axes
are also shown in Figure 1e, where X, Y, Z axes direct to the right-left, up-down and front-rear
directions, respectively. Therefore, the head-movements around the three axes can be captured.
For example, X axis is used to capture yield and look up head-movements, like yawning. Y axis is used
to capture left-right head shaking movements. Z axis is used to capture left-right head
swaying movements.
2.1.2. SPU
The SPU consists of a self-developed micro-controller unit (MCU) system and a commercial BLE
transmitter. The MCU is STM32F103CB from ST semiconductor. It operates at 3.3 V with a clock
speed of 8 MHz. The MCU’s state-machine loop repeats at an interval equal to the sampling rate of
128 Hz. STM32 MCU was chosen because it is 32-bit MCU with more RAM space, which is very
suitable for running real-time feature extraction on chip. The BLE is used because the Android 4.4.2
smartphone has embedded BLE microprocessors with capabilities for connecting wirelessly to external
biomedical sensors by lower power consumption. Generally, wireless transmission is the most
power-demanding component for wireless sensor nodes [37]. Therefore, the combination of on-chip
feature extraction and BLE in this study aims to reduce the transmitted data and the whole system
power consumption.
2.1.3. Signal Analysis and Feature Extraction
A digital band-pass filter (4–30 Hz) is implemented in SPU to further filter EEG signals,
particularly the power line noise (60 Hz). For each 2-s EEG and gyroscope epoch, the following
feature extraction approaches are operated respectively.
Sensors 2015, 15 20879
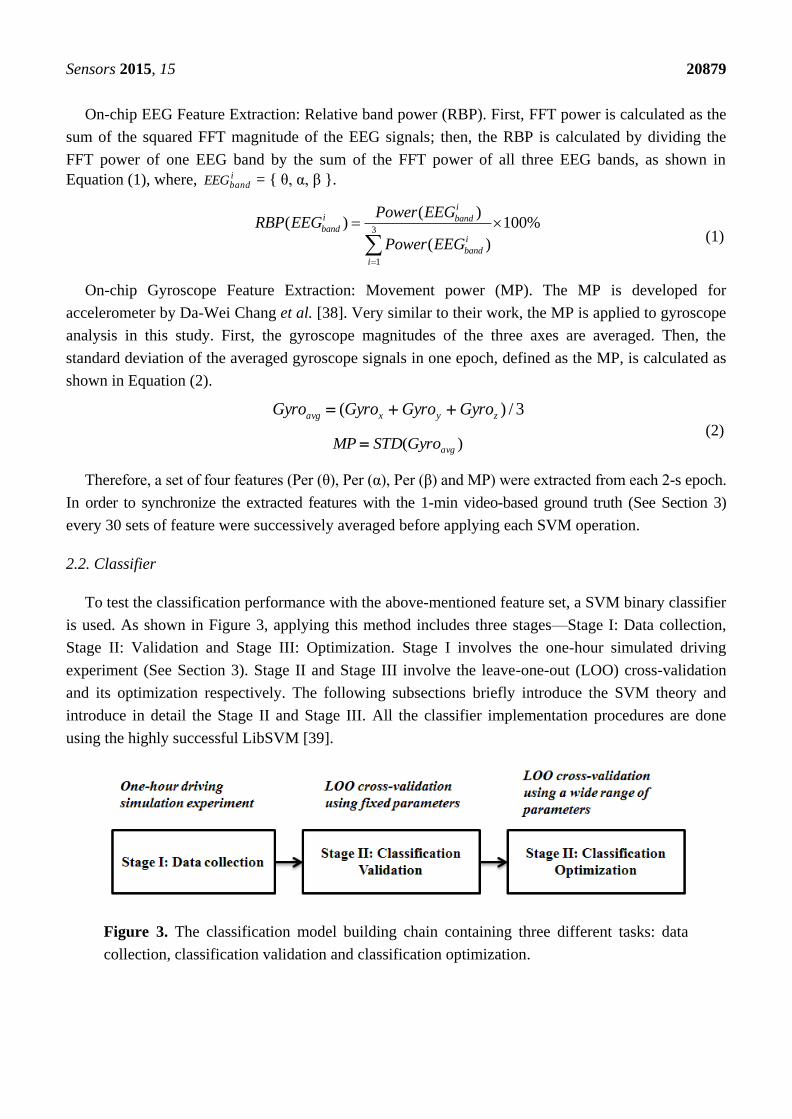
On-chip EEG Feature Extraction: Relative band power (RBP). First, FFT power is calculated as the
sum of the squared FFT magnitude of the EEG signals; then, the RBP is calculated by dividing the
FFT power of one EEG band by the sum of the FFT power of all three EEG bands, as shown in
Equation (1), where, ibandEEG = { θ, α, β }.
3
1
( )( ) 100%
( )
ii bandband
i
band
i
Power EEGRBP EEG
Power EEG
(1)
On-chip Gyroscope Feature Extraction: Movement power (MP). The MP is developed for
accelerometer by Da-Wei Chang et al. [38]. Very similar to their work, the MP is applied to gyroscope
analysis in this study. First, the gyroscope magnitudes of the three axes are averaged. Then, the
standard deviation of the averaged gyroscope signals in one epoch, defined as the MP, is calculated as
shown in Equation (2).
3/)( zyxavg GyroGyroGyroGyro
)( avgGyroSTDMP (2)
Therefore, a set of four features (Per (θ), Per (α), Per (β) and MP) were extracted from each 2-s epoch.
In order to synchronize the extracted features with the 1-min video-based ground truth (See Section 3)
every 30 sets of feature were successively averaged before applying each SVM operation.
2.2. Classifier
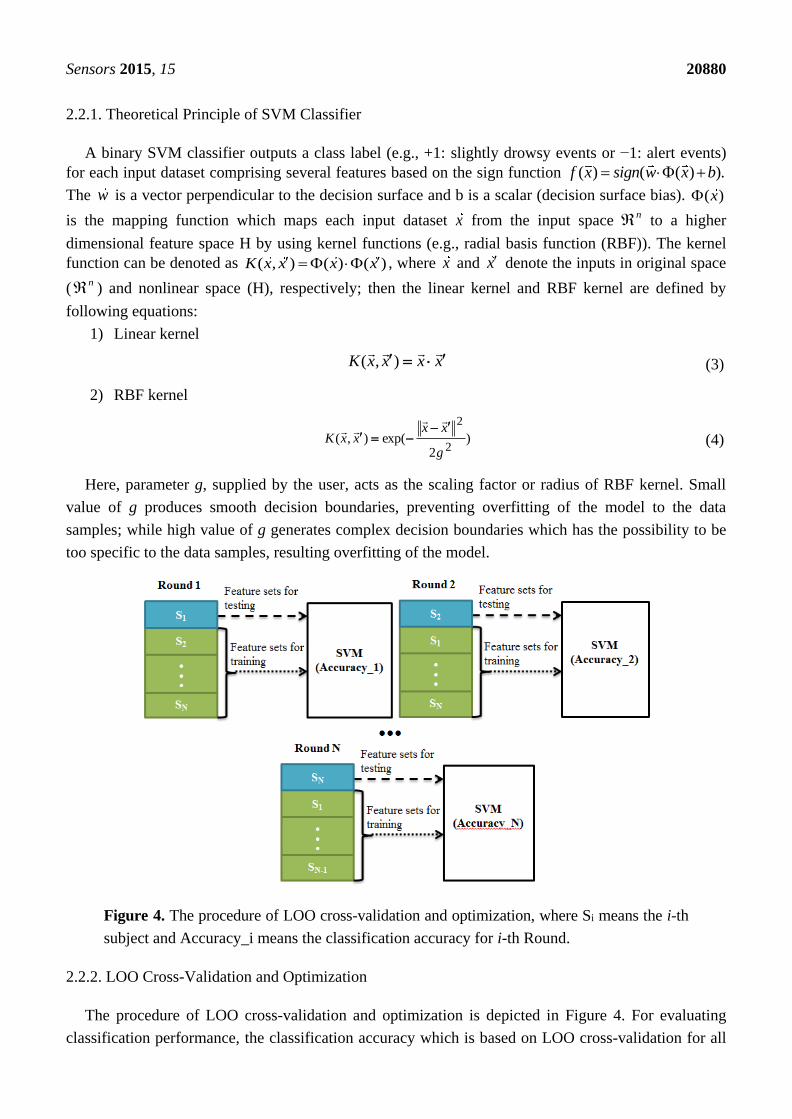
To test the classification performance with the above-mentioned feature set, a SVM binary classifier
is used. As shown in Figure 3, applying this method includes three stages—Stage I: Data collection,
Stage II: Validation and Stage III: Optimization. Stage I involves the one-hour simulated driving
experiment (See Section 3). Stage II and Stage III involve the leave-one-out (LOO) cross-validation
and its optimization respectively. The following subsections briefly introduce the SVM theory and
introduce in detail the Stage II and Stage III. All the classifier implementation procedures are done
using the highly successful LibSVM [39].
Figure 3. The classification model building chain containing three different tasks: data
collection, classification validation and classification optimization.
Sensors 2015, 15 20880
2.2.1. Theoretical Principle of SVM Classifier
A binary SVM classifier outputs a class label (e.g., +1: slightly drowsy events or −1: alert events)
for each input dataset comprising several features based on the sign function ( ) ( ( ) ).f x sign w x b
The w is a vector perpendicular to the decision surface and b is a scalar (decision surface bias). ( )x
is the mapping function which maps each input dataset x from the input space n to a higher
dimensional feature space H by using kernel functions (e.g., radial basis function (RBF)). The kernel
function can be denoted as ( , ) ( ) ( )K x x x x , where x and x denote the inputs in original space
(n ) and nonlinear space (H), respectively; then the linear kernel and RBF kernel are defined by
following equations:
1) Linear kernel
xxxxK),( (3)
2) RBF kernel
)2
exp(),(2
2
g
xxxxK
(4)
Here, parameter g, supplied by the user, acts as the scaling factor or radius of RBF kernel. Small
value of g produces smooth decision boundaries, preventing overfitting of the model to the data
samples; while high value of g generates complex decision boundaries which has the possibility to be
too specific to the data samples, resulting overfitting of the model.
Figure 4. The procedure of LOO cross-validation and optimization, where Si means the i-th
subject and Accuracy_i means the classification accuracy for i-th Round.
2.2.2. LOO Cross-Validation and Optimization
The procedure of LOO cross-validation and optimization is depicted in Figure 4. For evaluating
classification performance, the classification accuracy which is based on LOO cross-validation for all

Sensors 2015, 15 20881
participants was calculated. The specific steps are as follows: (1) Omit a subject from all available
feature sets; (2) Train the classifier; (3) Test the omitted feature sets; (4) Repeat the steps that are listed
above until each subject has been omitted and tested once; (5) Calculate the average classification
accuracy (e.g., based on the N Rounds). In order to get the optimized average accuracy, the regulation
parameter C and value of g will be updated from 0.01 to 10 in steps of 0.01 and each updating step
corresponds to each cycle of Round 1 to N.
2.3. Smartphone
Since the initial release of iPhone and Android phones in 2007 and 2008, respectively, there has
been an unprecedented increase in the number of smartphone subscribers in the world. Not surprisingly,
smartphones have been proposed as an inexpensive platform for data acquisition and processing.
In this study, an Android smartphone serves an on-line Data-to-Knowledge platform. In
Android OS, each Activity corresponds to each user interface. Each user interface has a short lifetime
due to the power save mode of smartphone screen; while Service is independent of Activity and
specifically designed to run the repeating task in background. So, in order to achieve low-power
purpose, we employed Service to collect data continuously in background instead of keeping screen
ON. It is also important to note that we employed another Service to classify the collected data
continuously (as shown in Figure 5). The two Services mainly involved two Android API components:
BroadcastUpdate and BroadcastReceiver. By using the two components, the smartphone just needs to
burst out the collected data when data is ready and then powering back down again. This not only can
reduce power consumption, but also can release the workload of core processor.
Figure 5. The working flowchart of smartphone which consists of two Activities (User
interfaces) and Services (The functions running in background).
The SVM binary classification model is embedded in the smartphone. This model was well trained
on a PC first using MATLAB version R2012a. After that, the parameters of the well-trained SVM
model were hardcoded in text-file format and stored on the Secure Digital (SD) card memory of the
smartphone. Meanwhile, the LibSVM library was embedded into the smartphone. Finally, the
smartphone can call library functions such as svm.svm_load_model and svm.svm_predict to run SVM
in real-time.

Sensors 2015, 15 20882
3. System Evaluation Design and Materials
The feasibility of the proposed DDD system is tested in four aspects. First, we test the EEG signal
quality from the dry electrodes used. Then, before applying to SVM classifier, the extracted EEG and
gyroscope features from a simulated driving experiment will be analyzed and compared between alert
and slightly drowsy group using ROCarea. ROCarea is the area under the receiver operating
characteristic (ROC) curve and reference line (as shown in Figure 5c), which is an effective measure of
the class-discrimination capability of a specific feature [13,40]. Its value can be any value from 0.5 to 1.
A value of 0.5 implies that the features are completely overlapped and thus non-separable; while a
value of 1 implies that the features are completely separable. The ROC analysis was implemented on
IBM SPSS Statistics software (IBM, Armonk, NY, USA), where the features need to be analyzed
(“Test variable” in SPSS) are Per(θ), Per(β) and Per(α). The “State variable” is ground-truth-based
label (alert and slightly drowsy). Next, the detection accuracy of the proposed system will be evaluated.
Finally, the system real-time performance including the system computational cost and power
consumption will be investigated. The following part introduces in detail the simulated driving experiment.
According to our previous experiences [12,13], one-hour monotonous driving after lunch (typically
around 1:00–2:30 pm) results in drowsiness in a majority of subjects. Therefore, to evaluate the
proposed system, six subjects, possessing valid driver’s licenses, participated in the one-hour
monotonous driving simulation experiment. The driving simulation environment consisted of a
commercial truck driving simulator (Euro Truck Simulator 2), a Logitech® steering wheel, acceleration
and brake pedals. During experiment, the participants drove the virtual truck with a few road
simulators on the highways and experienced various realistic cognitive loads, such as keeping or
changing lanes to avoid collisions, turning on windshield wiper when driving in rainy conditions, and
early deceleration before red lights. On the day of the experiment, subjects were prohibited from
drinking tea or consuming anything containing caffeine. Moreover, consumption of soporific
medicines, such as standard cold medications, was prohibited. Before the experiment, each subject was
given ten minutes to familiarize himself/herself with the operation of the driving simulator. For
labeling the true alert and slightly drowsy events, Wierwille scale was used. Wierwille scale is a
widely-used video-based DDD ground truth [23], which can classify the driving status into slightly
drowsy driving according to following indicators: (1) increase in duration of eye blinks; (2) possible
increase in rate of eye blinks; (3) increase in duration and frequency of sideway glances;
(4) appearance of “glazed-eye” look; (5) appearance of abrupt irregular movements—rubbing
face/eyes, moving restlessly on the chair; (6) Abnormally large body movements following drowsiness
episodes; (7) occasional yawning. We can see clearly that indicator (5)–(7) can directly cause
head-movements and thus can be easily captured by gyroscope sensor.
4. System Evaluation Results
4.1. EEG Signal Quality Test
The test of EEG signal quality can be divided into two separate phases: (1) Getting EEG signals
from dry electrodes; (2) Getting EEG signals from wet electrodes. Both phases were based on the same
SIU and SPU and the same positions (O1 & O2). One subject was instructed to close his eyes for five

Sensors 2015, 15 20883
seconds. What we expected to be common between these two sessions was the appearance of obvious
α rhythmicity in time domain and the largest power percentage for α band in frequency domain. What
exactly we observed is shown in Figure 6, which is just consistent with our expectation.
Figure 6. Comparison of EEG signals (line chart) and band power (pie chart) between wet
electrodes (the top) and dry electrodes (the bottom). For the line chart, X-axis indicates the
time (second). Y-axis indicates the amplitude of the digitalized EEG samples which are
already filtered by the digital band-pass filter (4–30 Hz) in SPU. For the pie chart, the
X-axis indicates the frequency ranged from 0–64 Hz (half of the sampling rate 128 Hz).
Y-axis indicates the magnitude of FFT power.
4.2. Feature Analysis
In total, 266 labeled feature sets containing 68 alert feature sets and 198 slightly drowsy feature sets
were collected through this one-hour driving experiment from six subjects. The labeled drowsy events
also included moderately drowsy events, significantly events and extremely drowsy events (a total of
94 events). However, the focus of this study is to build a binary classification model (alert events vs.
slightly drowsy events) with an aim to enable the early-detection of driver drowsiness, so the analysis
of mid- or late-stage drowsiness analysis are excluded in this study.
Each feature set consists of four extracted features: RBP (θ), RBP (α), RBP (β) and MP. The
Box-Whiskers plots (Figure 7a,b) show that the median values for EEG features RBP (θ), RBP (α),
RBP (β) and Gyroscope feature MP are 18.2%, 37.9%, 38.6% and 74.1 for alert group and 14.5%,
42.6%, 37.9% and 168.7 for slightly drowsy group. The trend of EEG features is consistent with
previous EEG conclusion [12,17,19], that is, when a driver passes from the alert to the drowsy stage,
β power decreases and α power increases and becomes abundant. However, ROC analysis (Figure 7c)
shows that the EEG features are not clearly separable with ROCarea = 0.760 for RBP (θ), ROCarea = 0.628
for RBP (α) and ROCarea = 0.550 for RBP (β); while gyroscope feature MP shows an outstanding
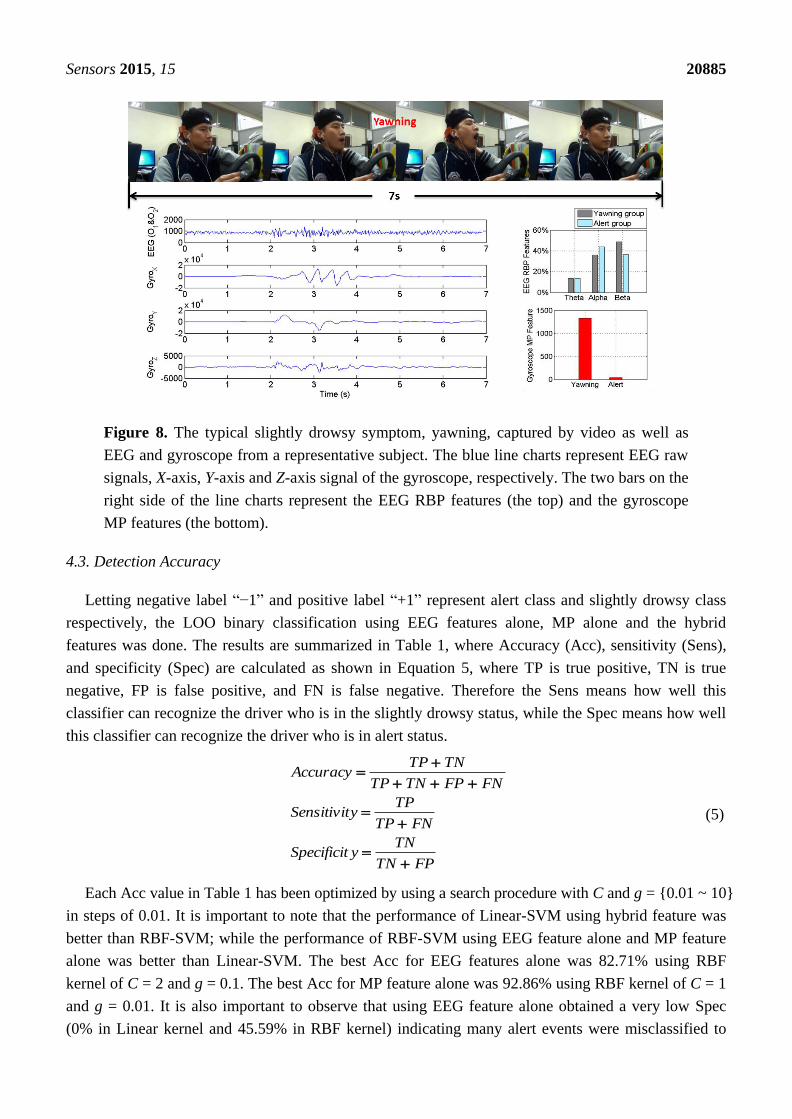
class-discrimination capability with ROCarea = 0.967. To explain this further, the EEG features and MP
features of one representative subject that were extracted from yawing movement (the most frequent
slightly drowsy symptom during driving experiment if compared to rubbing eyes movements and
moving restlessly movements) are shown in Figure 8, where we can see clearly that the MP has a
significant increase when this subject was yawning, while his α power decreased and β power
increased during this period, which is just contrary to previous conclusions. This phenomenon is

Sensors 2015, 15 20884
expected since the intermittent head-movements that are caused by slightly drowsy symptoms lead to
poor contact between the dry electrodes and scalp. This results in artifacts and friction noise for EEG
signals [41], but it is useful contextual information for DDD that can be easily captured by the
gyroscope sensor.
(a) (b)
(c)
Figure 7. Box-Whiskers plots of (a) EEG and (b) gyroscope features. The boxes have
three lines to present the values for first quartile (the bottom), median, and third quartile
(the top) for column data. The length between the first quartile (Q1) and the third quartile
(Q3) is called interquartile range (IQR). Two addition lines at both ends of the whisker
indicate the Q1 − 1.5 × IQR and Q3 + 1.5 × IQR value of a column data. Any data not
included between the whiskers is plotted as outliers represented by “o” for mild outliers
and “*” for extreme outliers. The number next to the outlier is the number of the data in
that column, called case number; (c) ROC curve showing sensitivity (possibility of true
drowsy event) and 1-specificity (possibility of false drowsy event) for extracted EEG and
gyroscope features.
Sensors 2015, 15 20885
Figure 8. The typical slightly drowsy symptom, yawning, captured by video as well as
EEG and gyroscope from a representative subject. The blue line charts represent EEG raw
signals, X-axis, Y-axis and Z-axis signal of the gyroscope, respectively. The two bars on the
right side of the line charts represent the EEG RBP features (the top) and the gyroscope
MP features (the bottom).
4.3. Detection Accuracy
Letting negative label “−1” and positive label “+1” represent alert class and slightly drowsy class
respectively, the LOO binary classification using EEG features alone, MP alone and the hybrid
features was done. The results are summarized in Table 1, where Accuracy (Acc), sensitivity (Sens),
and specificity (Spec) are calculated as shown in Equation 5, where TP is true positive, TN is true
negative, FP is false positive, and FN is false negative. Therefore the Sens means how well this
classifier can recognize the driver who is in the slightly drowsy status, while the Spec means how well
this classifier can recognize the driver who is in alert status.
FPTN
TNySpecificit
FNTP
TPySensitivit
FNFPTNTP
TNTPAccuracy
(5)
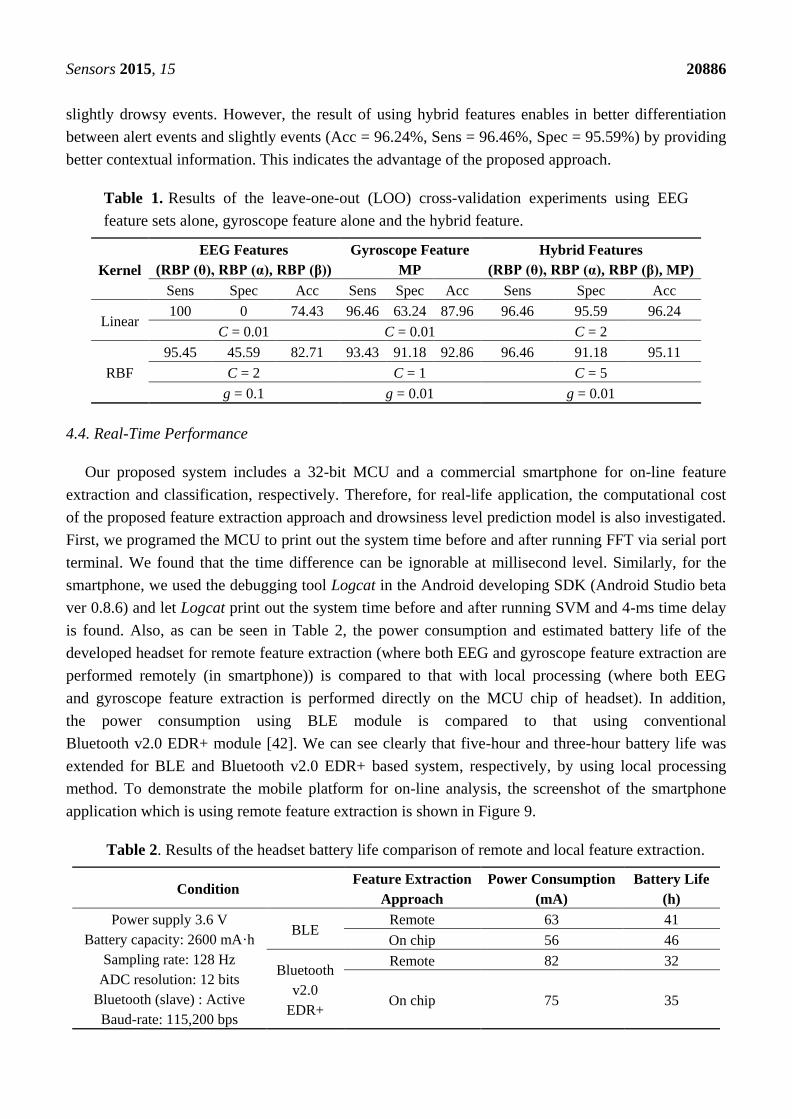
Each Acc value in Table 1 has been optimized by using a search procedure with C and g = {0.01 ~ 10}
in steps of 0.01. It is important to note that the performance of Linear-SVM using hybrid feature was
better than RBF-SVM; while the performance of RBF-SVM using EEG feature alone and MP feature
alone was better than Linear-SVM. The best Acc for EEG features alone was 82.71% using RBF
kernel of C = 2 and g = 0.1. The best Acc for MP feature alone was 92.86% using RBF kernel of C = 1
and g = 0.01. It is also important to observe that using EEG feature alone obtained a very low Spec
(0% in Linear kernel and 45.59% in RBF kernel) indicating many alert events were misclassified to
Sensors 2015, 15 20886
slightly drowsy events. However, the result of using hybrid features enables in better differentiation
between alert events and slightly events (Acc = 96.24%, Sens = 96.46%, Spec = 95.59%) by providing
better contextual information. This indicates the advantage of the proposed approach.
Table 1. Results of the leave-one-out (LOO) cross-validation experiments using EEG
feature sets alone, gyroscope feature alone and the hybrid feature.
Kernel
EEG Features
(RBP (θ), RBP (α), RBP (β))
Gyroscope Feature
MP
Hybrid Features
(RBP (θ), RBP (α), RBP (β), MP)
Sens Spec Acc Sens Spec Acc Sens Spec Acc
Linear 100 0 74.43 96.46 63.24 87.96 96.46 95.59 96.24
C = 0.01 C = 0.01 C = 2
RBF
95.45 45.59 82.71 93.43 91.18 92.86 96.46 91.18 95.11
C = 2 C = 1 C = 5
g = 0.1 g = 0.01 g = 0.01
4.4. Real-Time Performance
Our proposed system includes a 32-bit MCU and a commercial smartphone for on-line feature
extraction and classification, respectively. Therefore, for real-life application, the computational cost
of the proposed feature extraction approach and drowsiness level prediction model is also investigated.
First, we programed the MCU to print out the system time before and after running FFT via serial port
terminal. We found that the time difference can be ignorable at millisecond level. Similarly, for the
smartphone, we used the debugging tool Logcat in the Android developing SDK (Android Studio beta
ver 0.8.6) and let Logcat print out the system time before and after running SVM and 4-ms time delay
is found. Also, as can be seen in Table 2, the power consumption and estimated battery life of the
developed headset for remote feature extraction (where both EEG and gyroscope feature extraction are
performed remotely (in smartphone)) is compared to that with local processing (where both EEG
and gyroscope feature extraction is performed directly on the MCU chip of headset). In addition,
the power consumption using BLE module is compared to that using conventional
Bluetooth v2.0 EDR+ module [42]. We can see clearly that five-hour and three-hour battery life was
extended for BLE and Bluetooth v2.0 EDR+ based system, respectively, by using local processing
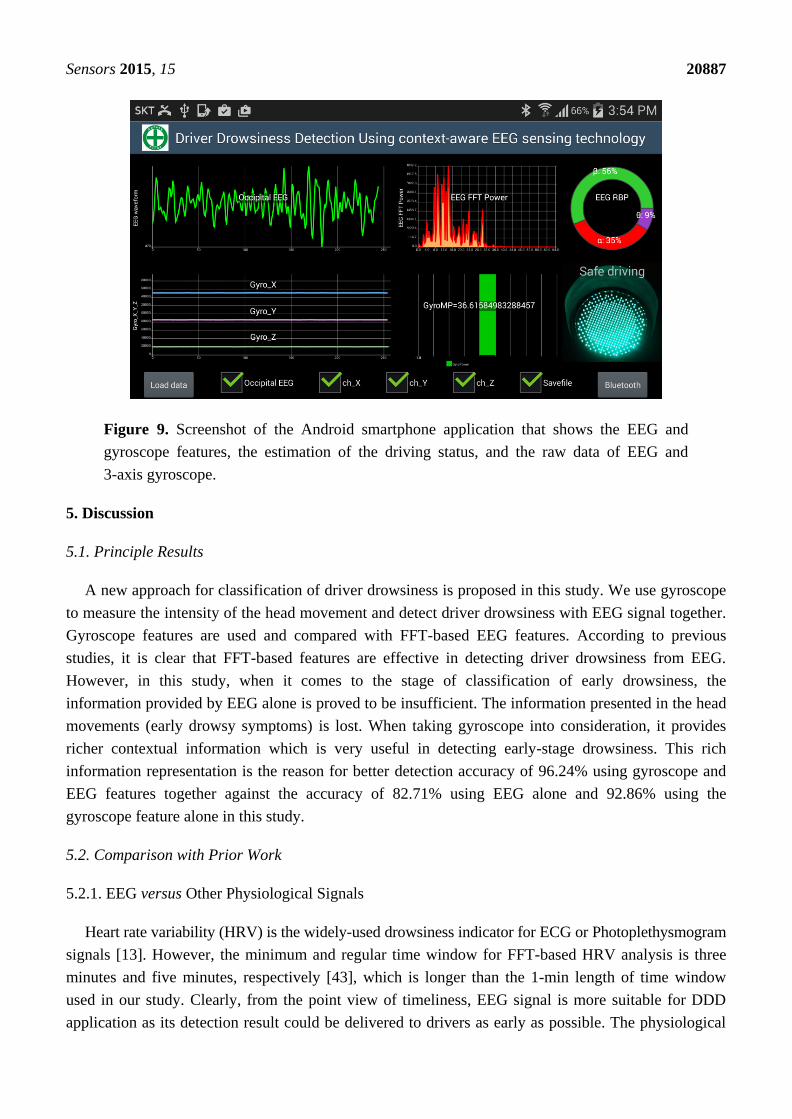
method. To demonstrate the mobile platform for on-line analysis, the screenshot of the smartphone
application which is using remote feature extraction is shown in Figure 9.
Table 2. Results of the headset battery life comparison of remote and local feature extraction.
Condition Feature Extraction
Approach
Power Consumption
(mA)
Battery Life
(h)
Power supply 3.6 V
Battery capacity: 2600 mA·h
Sampling rate: 128 Hz
ADC resolution: 12 bits
Bluetooth (slave) : Active
Baud-rate: 115,200 bps
BLE Remote 63 41
On chip 56 46
Bluetooth
v2.0
EDR+
Remote 82 32
On chip 75 35
Sensors 2015, 15 20887
Figure 9. Screenshot of the Android smartphone application that shows the EEG and
gyroscope features, the estimation of the driving status, and the raw data of EEG and
3-axis gyroscope.
5. Discussion
5.1. Principle Results
A new approach for classification of driver drowsiness is proposed in this study. We use gyroscope
to measure the intensity of the head movement and detect driver drowsiness with EEG signal together.
Gyroscope features are used and compared with FFT-based EEG features. According to previous
studies, it is clear that FFT-based features are effective in detecting driver drowsiness from EEG.
However, in this study, when it comes to the stage of classification of early drowsiness, the
information provided by EEG alone is proved to be insufficient. The information presented in the head
movements (early drowsy symptoms) is lost. When taking gyroscope into consideration, it provides
richer contextual information which is very useful in detecting early-stage drowsiness. This rich
information representation is the reason for better detection accuracy of 96.24% using gyroscope and
EEG features together against the accuracy of 82.71% using EEG alone and 92.86% using the
gyroscope feature alone in this study.
5.2. Comparison with Prior Work
5.2.1. EEG versus Other Physiological Signals
Heart rate variability (HRV) is the widely-used drowsiness indicator for ECG or Photoplethysmogram
signals [13]. However, the minimum and regular time window for FFT-based HRV analysis is three
minutes and five minutes, respectively [43], which is longer than the 1-min length of time window
used in our study. Clearly, from the point view of timeliness, EEG signal is more suitable for DDD
application as its detection result could be delivered to drivers as early as possible. The physiological

Sensors 2015, 15 20888
reasoning behind the shorter time window for EEG analysis should be its direct relationship to
drowsiness. Even if more advanced pattern recognition techniques were used, the performance using
EEG alone is still better than using other physiological signal alone (e.g., ECG, EOG) as long as under
the same conditions (e.g., the same subjects, ground truth and experimental environment) [18].
5.2.2. Signal Processing Comparison
To compare different techniques of EEG processing for drowsiness detection, three more recent
research papers are used here. Unlike the FFT-based RBP features and SVM classifier used in our
study, Garcés et al. [44] obtained accuracy of 83.6% for drowsiness detection and 87.4% for alertness
detection by using artificial neural network and a wide range of EEG features including
time-domain features (e.g., minimum, maximum and standard deviation (STD) of EEG amplitude),
frequency-domain features (e.g., FFT-based central frequency, peak frequency and maximum
frequency) and time-frequency-domain features (e.g., Wavelet-based zero-crossing rate and integrated
EEG from each of the bands (θ to β)). A major drawback of this study is that they directly categorized
driver drowsiness as the sleep Stage I when feedback might be already late. To detect drowsiness
earlier, Melia et al. [45] conducted a study based on the MSLT and WMT standard as introduced in
Section 1. They proposed two novel non-linear EEG features: auto-mutual information function and
cross-mutual information function based features. Experimental results show that these non-linear
features (ROCarea > 0.75) outperform traditional linear features (ROCarea < 0.75). However, one
limitation for this study is that the subjects used were excessive daytime sleepiness patients instead of
normal healthy persons indicating this method is not yet readily applicable to the general population of
drivers. Similarly, Chen et al. [46] also used nonlinear features to detect drowsiness; however, they
used long-term mental calculation to induce drowsiness rather than using a real-life environment (e.g.,
monotonous driving environment used in our study).
5.2.3. Detection Accuracy Comparison
To compare the detection accuracy with prior work, three EEG-based DDD studies that use the
same ground truth Wierwille scale and also combine contextual information are carefully found from
the numeric DDD studies. One of them recorded contextual information using motion sensor; while the
remaining two studies recorded contextual information using physiological signals. Specifically,
Pritchett et al. [47] also proposed an EEG-based context-aware solution for DDD. The main difference
between the current system and that presented in [47] is that they recorded contextual information from
the driver’s seat where a piezoelectric film sensor is attached rather than from the headset directly.
In addition, unlike the SVM model used in our study, they used linear regression model to estimate the
drowsiness level (dependent variable), in which a wide range of α burst parameters and body
movement parameters were used as features (independent variables). Experimental results show that
hybrid features (R2 = 0.308) outperform EEG features (R2 = 0.272), where R2 is the squared correlation
coefficient, a commonly used method of estimating the performance of the proposed regression
model [48]. If R2 is high (maximum value is 1), it can be claimed that the driver drowsiness level and
the extracted features have a strong linear relationship and that the performance of the regression
model is superior if compared to a low R2. Clearly, the performance of the regression model above is

Sensors 2015, 15 20889
poor. This is expected because regression models are good for estimating a continuous variable not the
discrete labels here (5-level driver drowsiness). Khushaba et al. [18] extracted features using
normalized logarithmic energy of the wavelet-packet coefficients from 5-channel physiological signals:
3-ch EEG, 1-ch ECG and 1-ch EOG. Then, a fuzzy mutual information based method is used to select
features. Finally, the kernel spectral regression based linear discrimination analysis model obtains an
outstanding detection accuracy of 97% for 5-level classification including mid- or late-stage
drowsiness classification. However, they did not mention the detection accuracy between alert events
and slightly drowsy events which indicates the capability to early detect driver drowsiness. Also,
Khushaba et al. [49] extracted time domain autoregressive features from the aforementioned 5-ch
signals and then uncorrelated fuzzy neighborhood preserving analysis is used to select features.
Finally, they can detect alert events and slightly drowsy events with 94% accuracy using RBF-SVM
classifier. These pattern recognition techniques used above are more complicated than that used in the
proposed method. However, they do not outperform our proposed method (94% vs. 96.24%). This
result shows that the selection of signal source is still the most important part of designing the best
detection models. In addition, compared with the two studies, this study has several advantages. First,
we used dry electrodes instead of conventional wet electrodes, which show more realistic detection
accuracy. Second, we used 4-ch signals (1-ch EEG + 3-ch gyroscope) instead of 5-ch physiological
signals (3-ch EEG + 1-ch ECG + 1-ch EOG), which is less intrusive. Third, our proposed approach is
evaluated on miniaturized and source-limited devices instead of laboratory-oriented devices, which
show strong practical utility.
5.3. Limitation
This paper has been primarily focused on the design and implementation of an EEG headset with
integrated gyroscope sensor with an aim to enable the early-detection of driver drowsiness. There are
no arousing feedback methods (thus drivers’ attention cannot be boosted) in this study. However, this
can be easily overcome by setting a warning signal, such as an auditory tone-burst [21,50,51].
6. Conclusions and Future Work
The design and evaluation of a context-aware EEG headset system is described in this paper.
The system uses a Bluetooth-enabled, EEG and gyroscope sensor-equipped headset and a machine
learning model-enabled smartphone aimed to detect driver drowsiness at its early stage. This not only
shifts DDD from being a reactive to a preventive driver safety technology, but also achieves a simple
and inexpensive on-line analysis platform. Further studies considering an effective brainwave
entrainment technology need to be performed in order to develop a real-time driver alertness boosting
method. In addition, we are considering enhancing the wearability of the developed headset using
more flexible 3D printer material. Also, an extensive field test needs to be established before applying
the proposed system to a practical environment.

Sensors 2015, 15 20890
Acknowledgments
This work was supported by the BK21 Plus Program (Creative Human Resource Development
Team for ICT-based smart devices, 214C000066) funded by the Ministry of Education (MOE, Korea)
and National Research Foundation of Korea (NRF).
Author Contributions
All authors contributed extensively to the work presented in this paper. Wan-Young Chung and
Gang Li designed the sensors, conducted the experiments and assembled input data. Gang Li wrote
code, ran the algorithms and the classification model, and analyzed output data as well as wrote the
manuscript. Wan-Young Chung administered the experiments and carefully proofread this manuscript.
Conflicts of Interest
The authors declare no conflict of interest.
References
1. Kim, I.S. The risk of accidents using DMB and smartphone when driving. Traffic 2012, 172,
32–36.
2. Korean Expressway Corporation. 24% Decrease in Death in Highway Traffic Accidents Last
Year. Yearly Report. Available online: http://www.ex.co.kr/portal/cus/public_relations/
press_release/1197307_3960.jsp?clickParentNum=3&clickNum=40&pageRow=10&startRow=5
&pageURL=/portal/cus/public_relations/press_release/bodo_list (accessed on 18 August 2014).
3. Korean Expressway Corporation. Significant Decrease in Death in Highway Traffic Accidents.
Yearly Report. Available online: http://www.ex.co.kr/portal/cus/public_relations/press_release/
1194829_3960.jsp?clickParentNum=3&clickNum=40&pageRow=10&startRow=21&pageURL=/
portal/cus/public_relations/press_release/bodo_list (accessed on 18 August 2014).
4. Swarnkar, V.; Abeyratne, U.; Hukins, C. The Objective measure of sleepiness and sleep latency
via bispectrum analysis of EEG. Med. Biol. Eng. Comput. 2010, 48, 1203–1213.
5. Ingre, M.; ÅKerstedt, T.; Anund, B.A.; Kecklund, G. Subjective sleepiness, simulated driving
performance and blink duration: Examining individual differences. J. Sleep Res. 2006, 15, 47–53.
6. Otmani, S.; Pebayle, T.; Roge, J.; Muzet, A. Effect of driving duration and partial sleep
deprivation on subsequent alertness and performance of car drivers. Physiol. Behav. 2005, 84,
715–724.
7. Boyraz, P.; Hansen, J.H.L. Active Accident Avoidance Case Study: Integrating Drowsiness
Monitoring System with Lateral Control and Speed Regulation in Passenger Vehicles. In
Proceedings of the IEEE the International Conference Vehicular Electronics and Safety,
Columbus, OH, USA, 22–24 September 2008; pp. 293–298.
8. Thiffault, P.; Bergeron, J. Monotony of road environment and driver fatigue: A simulator study.
Accid. Anal. Prev. 2003, 35, 381–391.
Sensors 2015, 15 20891
9. Dinges, D.F.; Grace, R. PERCLOS: A Valid Psychophysiological Measure of Alertness as
Assessed by Psychomotor Vigilance. Available online: http://ntl.bts.gov/lib/10000/10100/
10114/tb98-006.pdf (accessed on 18 August 2014).
10. Dinges, D.F.; Grace, R. Research on Vehicle-Based Driver Status/Performance Monitoring;
Development, Validation, and Refinement of Algorithms for Detection of Driver Drowsiness.
Available online: http://ntl.bts.gov/lib/5000/5900/5911/887.pdf (accessed on 18 August 2014).
11. Hanowski, R.J.; Blanco, M.; Nakata, A.; Hickman, J.S.; Schaudt, W.A.; Fumero, M.C.;
Olson, R.L.; Jermeland, J.; Greening, M.; Holbrook, G.T.; et al. The Drowsy Driver
Warning System Field Operational Test: Data Collection Methods. Available online:
http://www.nhtsa.gov/DOT/NHTSA/NRD/Multimedia/PDFs/Crash Avoidance/2008/810035.pdf
(accessed on 9 March 2015).
12. Li, G.; Chung, W.Y. Estimation of eye closure degree using EEG sensors and its application in
driver drowsiness detection. Sensors 2014, 14, 17491–17515.
13. Li, G.; Chung, W.Y. Detection of driver drowsiness using wavelet analysis of heart rate variability
and a support vector machine classifier. Sensors 2013, 13, 16494–16511.
14. Jung, S.J.; Shin, H.S.; Chung, W.Y. Driver fatigue and drowsiness monitoring system with
embedded electrocardiogram sensor on steering wheel. Intell. Transp. Syst. 2014, 8, 43–50.
15. Papadelis, C.; Kourtidou-Papadeli, C.; Bamidis, P.D.; Chouvarda, I. Indicators of Sleepiness in an
ambulatory EEG study of night driving Christos. In Proceedings of the IEEE International Conference
Engineering in Medicine and Biology Society, New York, NY, USA, 30 August–3 September 2006;
pp. 6201–6204.
16. Sahayadhas, A.; Sundaraj, K.; Murugappan, M. Detecting Driver Drowsiness Based on Sensors:
A Review. Sensors 2012, 12, 16937–16953.
17. Iber, C.; Sonia, A.I.; Andrew, L.; Chesson, J.; Quan, S.F. The AASM Manual for the Scoring of
Sleep and Associated Events. Available online: http://www.nswo.nl/userfiles/files/AASM%20-
%20Manual%20for%20the%20Scoring%20ofSleep%20and%20Associted%20Events%20%2005-
2007_2.pdf (accessed on 18 August 2014).
18. Khushaba, R.N.; Kodagoda, S.S.; Lal, S. Dissanayake, G. Driver drowsiness classification using
fuzzy wavelet-packet-based feature-extraction algorithm. IEEE Trans. Biomed. Eng. 2011, 58,
121–131.
19. Akin, M.; Kurt, M.B.; Sezgin, N.; Bayram, M. Estimating vigilance level by using EEG and EMG
signals. J. Neural Comput. Applic. 2008, 17, 227–236.
20. Lin, C.T.; Chang, C.J.; Lin, B.S.; Hung, S.H.; Chao, C.F.; Wang, I.J. A Real-Time Wireless
Brain–Computer Interface System for Drowsiness Detection. IEEE Trans. Biomed. Circuits Syst.
2010, 4, 214–222.
21. Wang, Y.T.; Cheng, C.K.; Huang, K.C.; Lin, C.T. Cell-Phone Based Drowsiness Monitoring and
Management System. In Proceedings of the IEEE International. Conference. Biomedical Circuits
and Systems. Hsinchu, Taiwan, 28–30 November 2012; pp. 200–203.
22. Lin, C.T.; Chuang, C.H.; Huang, C.S.; Tsai, S.F.; Lu, S.W.; Chen, Y.H.; Ko, L.W. Wireless and
Wearable EEG System for Evaluating Driver Vigilance. IEEE Trans. Biomed. Circuits Syst. 2014,
8, 165–176.

Sensors 2015, 15 20892
23. Wierwille, W.W.; Ellsworth, L.A. Evaluation of driver drowsiness by trained raters. Accid. Anal.
Prev. 1994, 26, 571–581.
24. Vural, E.; Cetin, M.; Ercil, A.; Littlewort, G.; Bartlett, M.; Movellan, J. Automated drowsiness
detection for improved driving safety. In Proceedings of the International. Conference.
Automotive Technologies, Istanbul, Turkey, 13–14 November 2008; pp. 1–15.
25. Regan, S.O.; Faul, S.; Marnane, W. Automatic detection of EEG artefacts arising from head
movements using EEG and gyroscope signals. Med. Eng. Phys. 2013, 35, 867–874.
26. Regan, S.O.; Marnane, W. Multimodal detection of head-movement artefacts in EEG. J. Neurosci.
Methods 2013, 218, 110–120.
27. Emotiv EPOC EEG Acquisition Device. Available online: https://emotiv.com/epoc.php
(accessed on 2 July 2015).
28. Bluetooth 4.0 Low Energy Mini Module. Available online: http://redbearlab.com (accessed on
2 July 2015).
29. Li, M.A.; Zhang, C.; Yang, J.F. An EEG-based Method for Detecting Drowsy Driving State. In
Proceedings of the 7th International. Conference. Fuzzy Systems and Knowledge Discovery,
Yantai, China, 10–12 August 2010; pp. 2164–2167.
30. Maglione, A.; Borghini, G.; Arico, P.; Borgia, F.; Graziani, I.; Colosimo, A.; Kong, W.;
Vecchiato, G.; Babiloni, F. Evaluation of the workload and drowsiness during car driving by
using high resolution EEG activity and neurophysiologic indices. In Proceedings of the IEEE
International Conference. Engineering in Medicine and Biology Society, Chicago, IL, USA,
26–30 August 2014; pp. 6238–6241.
31. De Rosario, H.; Solaz, J.S.; Rodriguez, N.; Bergasa, L.M. Controlled inducement and measurement
of drowsiness in a driving simulator. Intell. Transp. Syst. 2010, 4, 280–288.
32. Ear-Clip Electrode. Available online: http://www.laxtha.com/ProductView.asp?Model=LXEL-
EAR-01&catgrpid=1&catidx=30 (accessed on 2 July 2015).
33. Dry electrode for hair. Available online: http://www.cognionics.com/index.php/products/
sensors-/flex (accessed on 2 July 2015).
34. Lin, C.T.; Chuang, C.H.; Wang, Y.K.; Tsai, S.F.; Chiu, T.C.; Ko, L.W. Neurocognitive
characteristics of the driver: A review on drowsiness, distraction, navigation, and motion sickness.
J. Neurosci. Neuroengin. 2012, 1, 61–81.
35. Chi, Y.M.; Ng, P.; Kang, E.; Kang, J.; Fang, J.; Cauwenberghs, G. Wireless non-contact cardiac
and Neural monitoring. Available online: http://www.isn.ucsd.edu/pubs/wh2010.pdf (accessed on
2 July 2015).
36. Jap, B.T.; Lal, S.; Fischer, P. Comparing combinations of EEG activity in train drivers during
monotonous driving. Expert Syst. Appl. 2011, 38, 996–1003.
37. Lo, B.; Yang, G.Z. Wireless Sensor Development Platforms in Body Sensor Networks, 1st ed.;
Springer: London, UK, 2006; p. 407.
38. Chang, D.W.; Liang, S.F.; Young, C.P.; Shaw, F.Z.; Su, A.W.Y.; Liu, Y.D.; Wang, Y.L.;
Liu, Y.C.; Chen J.J.; Chen, C.Y. A versatile wireless portable monitoring system for
brain-behavior approaches. IEEE J. Emerg. Sel. Top. Circuits Syst. 2012, 1, 440–450.
39. Chang, C.C.; Lin. C.J. LIBSVM: A library for support vector machines. ACM Trans. Intell. Syst.
Technol. 2011, 2, 27:1–27:27.
Sensors 2015, 15 20893
40. Theodoridis, S.; Pikrakis, A.; Koutroumbas, K.; Cavouras, D. The Receiver Operating
Characteristic Curve in Introduction to Pattern Recognition: A Matlab Approach, 1st ed.;
Academic Press: Waltham, MA, USA, 2010; p. 113. Available online:
http://www.manalhelal.com/Books/F2014/-Introduction%20to%20Pattern-%20Recognition.pdf
(accessed on 2 July 2015).
41. Chi, Y.M.; Jung, T.P.; Cauwenberghs, G. Dry-contact and Noncontact bio-potential electrodes:
Methodological review. IEEE Rev. Biomed. Eng. 2010, 3, 106–119.
42. Bluetooth Mate Gold. Available online: https://www.sparkfun.com/products/9358 (accessed on
21 August 2015).
43. Malik, M. Heart rate variability: Standards of Measurement, Physiological Interpretation, and
Clinical Use. Task Force of the European Society of Cardiology and the North American Society
of Pacing and Electrophysiology. Eur. Heart J. 1996, 17, 354–381.
44. Garces, C.A.; Orosco, L.; Laciar, E. Automatic detection of drowsiness in EEG records based on
multimodal analysis. Med. Eng. Phys. 2014, 36, 244–249.
45. Melia, U.; Guaita, M.; Vallverdu, M.; Embid, C.; Vilaseca, I.; Salamero, M.; Santamaria, J.
Mutual information measures applied to EEG signals for sleepiness characterization. Med. Eng.
Phys. 2015, 37, 297–308.
46. Chen, L.L.; Zhao, Y.; Zhang, J.; Zou, J.J. Automatic detection of alertness/drowsiness from
physiological signals using wavelet-based nonlinear features and machine learning. Expert Syst.
Appl. 2015, 42, 7344–7355.
47. Pritchett, S.; Zilberg, E.; Xu, Z.M.; Karrar, M.; Lal, S.; Burton, D. Strengthening association
between driver drowsiness and its physiological predictors by combing EEG with measures of
body movement. In Proceedings of the 6th International. Conference. Broadband Communications
& Biomedical Applications, Melbourne, Australia, 21–24 November 2011; pp. 103–107.
48. Lin, F.C.; Ko, L.W.; Chuang, C.H.; Su, T.P.; Lin, C.T. Generalized EEG-based drowsiness
prediction system by using a self-organizing neural fuzzy system. IEEE Trans. Circuits Syst.-I
Regul. Pap. 2012, 59, 2044–2055.
49. Khushaba, R.N.; Kodagoda, S.; Lal, S.; Dissanayake, G. Uncorrelated fuzzy neighborhood
preserving analysis based feature projection for driver drowsiness recognition. Fuzzy Sets Syst.
2011, 221, 90–111.
50. Lin, C.T.; Chen, Y.C.; Huang, T.Y.; Chiu, T.T.; Ko, L.W.; Hsieh, H.Y.; Hsu, S.H.; Duann, J.R.
Development of Wireless Brain Computer Interface With Embedded Multitask Scheduling and Its
Application on Real-Time Driver’s Drowsiness Detection and Warning. IEEE Trans.
Biomed. Eng. 2008, 55, 1582–1591.
51. Huang, K.C.; Jung, T.P.; Chuang, C.H.; Ko, L.W.; Lin, C.T. Preventing lapse in performance
using a drowsiness monitoring and management system. In Proceedings of the IEEE the
International Conference Engineering in Medicine and Biology Society, Chicago, IL, USA,
28 August–1 September 2012; pp. 3336–3339.
© 2015 by the authors; licensee MDPI, Basel, Switzerland. This article is an open access article
distributed under the terms and conditions of the Creative Commons Attribution license
(http://creativecommons.org/licenses/by/4.0/).