Embed Size (px)
Citation preview
SENSOR STORIESDeveloping materials to support community use of
low-cost air quality sensors
PEPH Webinar, September 24, 2018
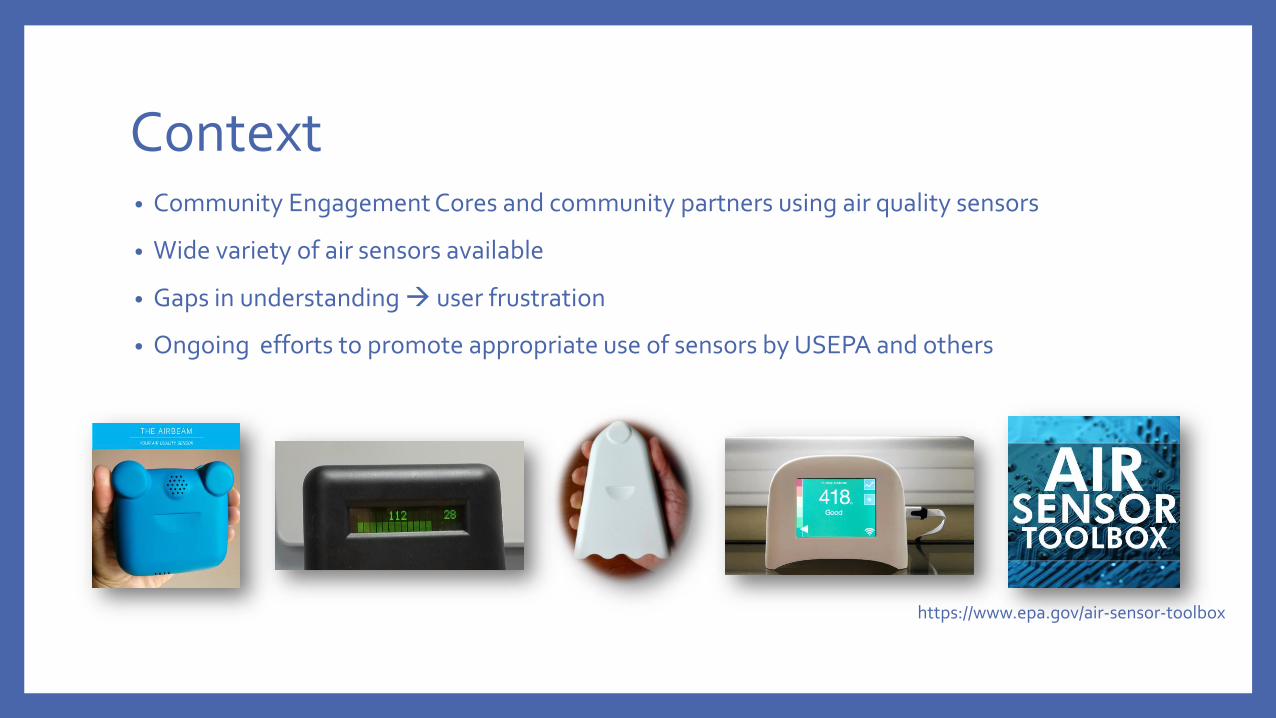
Context• Community Engagement Cores and community partners using air quality sensors
• Wide variety of air sensors available
• Gaps in understanding → user frustration
• Ongoing efforts to promote appropriate use of sensors by USEPA and others
https://www.epa.gov/air-sensor-toolbox
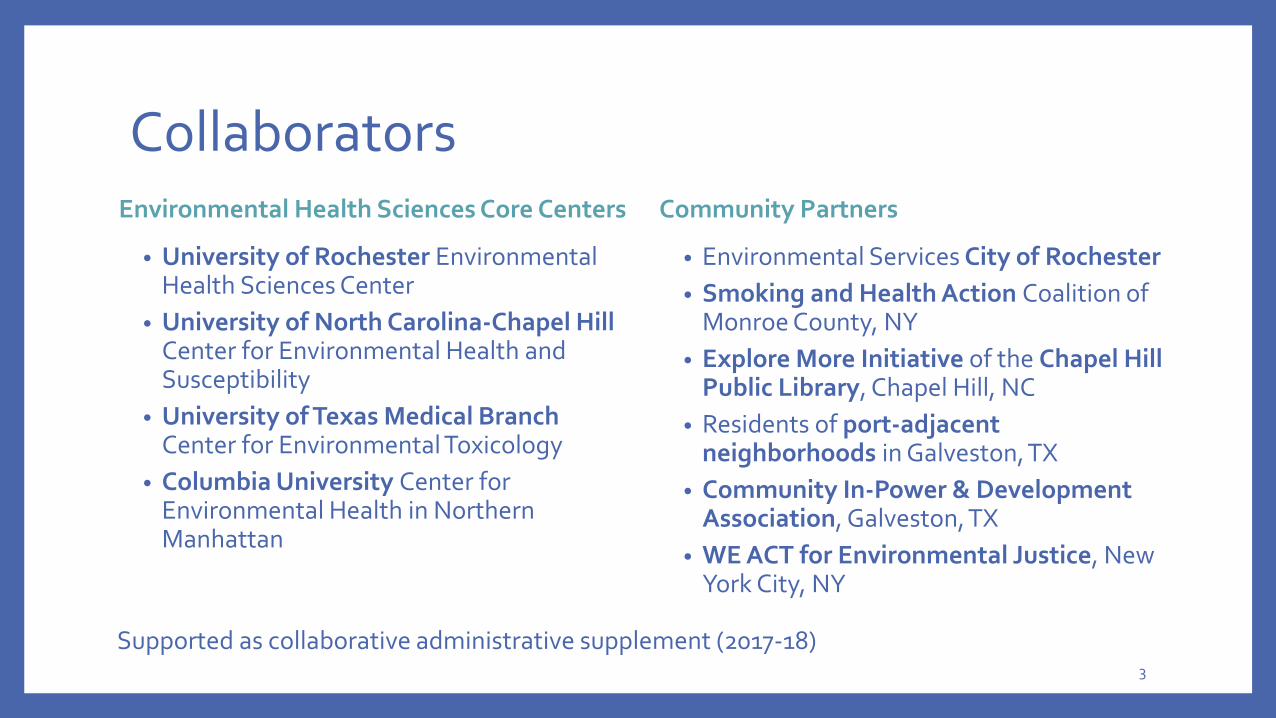
CollaboratorsEnvironmental Health Sciences Core Centers
• University of Rochester Environmental Health Sciences Center
• University of North Carolina-Chapel Hill Center for Environmental Health and Susceptibility
• University of Texas Medical Branch Center for Environmental Toxicology
• Columbia University Center for Environmental Health in Northern Manhattan
Community Partners
• Environmental Services City of Rochester
• Smoking and Health Action Coalition of Monroe County, NY
• Explore More Initiative of the Chapel Hill Public Library, Chapel Hill, NC
• Residents of port-adjacent neighborhoods in Galveston, TX
• Community In-Power & Development Association, Galveston, TX
• WE ACT for Environmental Justice, New York City, NY
3
Supported as collaborative administrative supplement (2017-18)
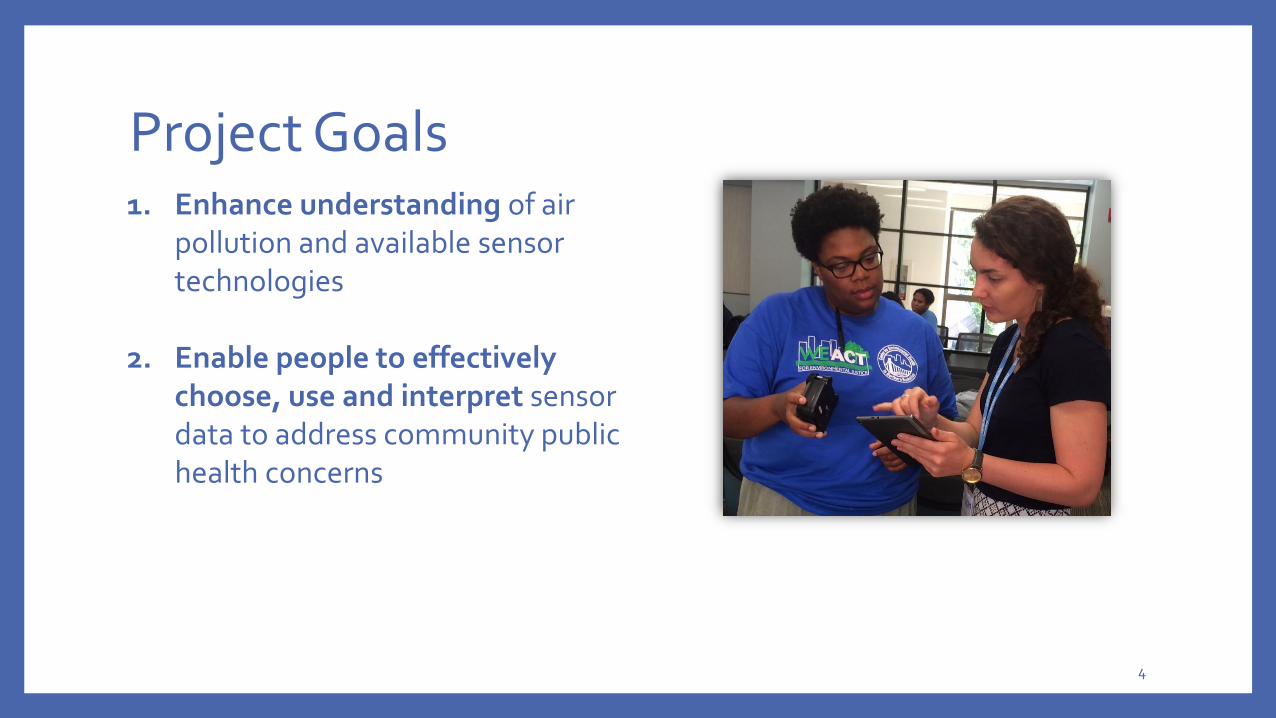
Project Goals
4
1. Enhance understanding of air pollution and available sensor technologies
2. Enable people to effectively choose, use and interpret sensor data to address community public health concerns
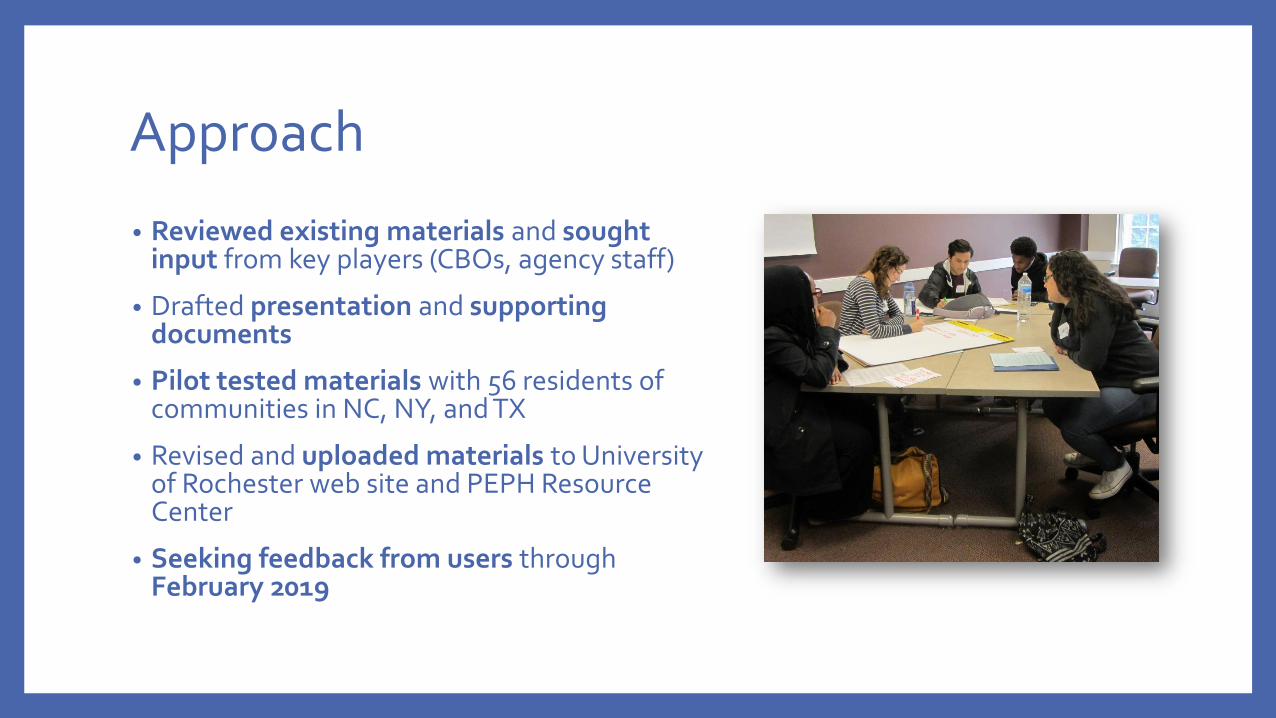
Approach
• Reviewed existing materials and sought input from key players (CBOs, agency staff)
• Drafted presentation and supporting documents
• Pilot tested materials with 56 residents of communities in NC, NY, and TX
• Revised and uploaded materials to University of Rochester web site and PEPH Resource Center
• Seeking feedback from users through February 2019
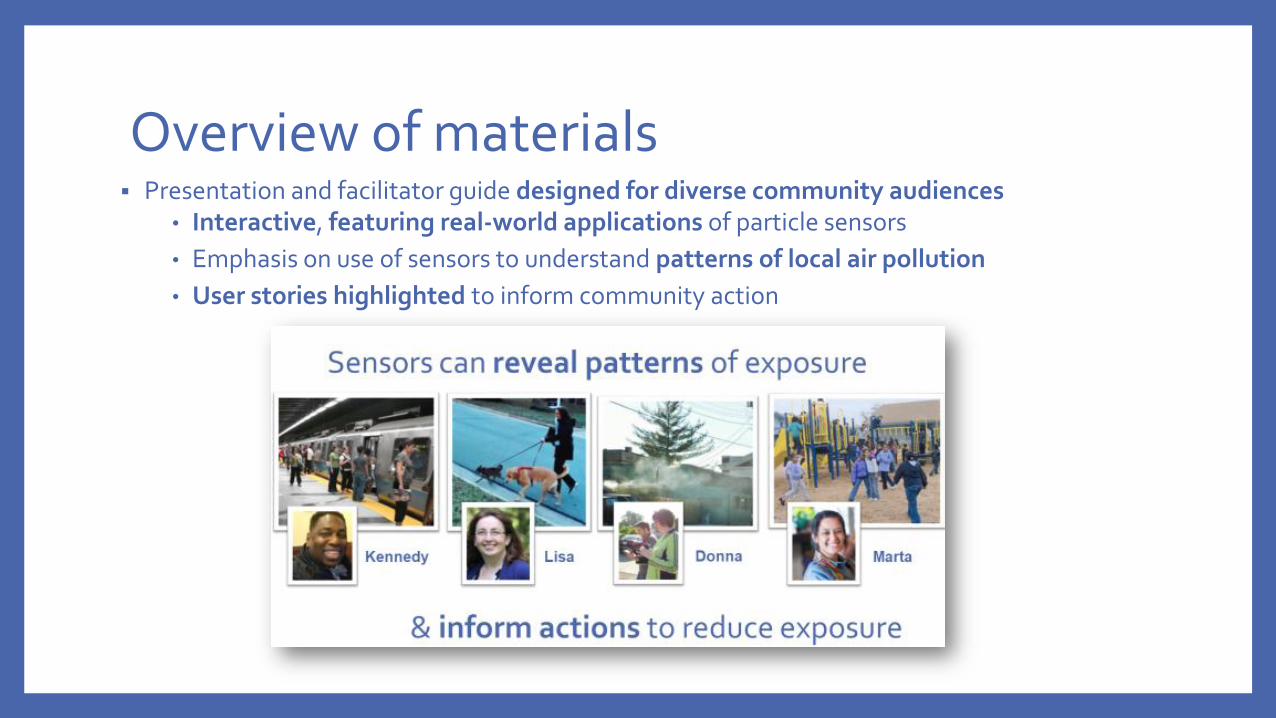
Overview of materials▪ Presentation and facilitator guide designed for diverse community audiences
• Interactive, featuring real-world applications of particle sensors
• Emphasis on use of sensors to understand patterns of local air pollution
• User stories highlighted to inform community action

Let’s look at some slides from the presentation…
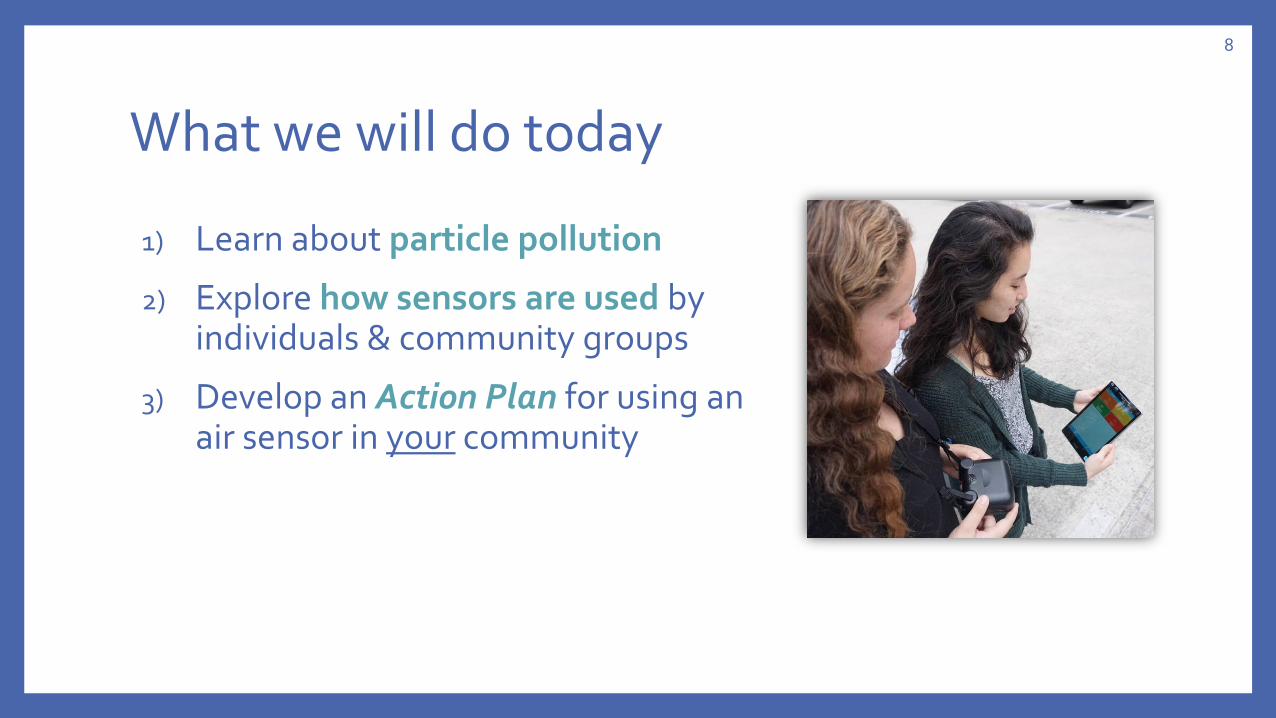
What we will do today
1) Learn about particle pollution
2) Explore how sensors are used by individuals & community groups
3) Develop an Action Plan for using an air sensor in your community
8
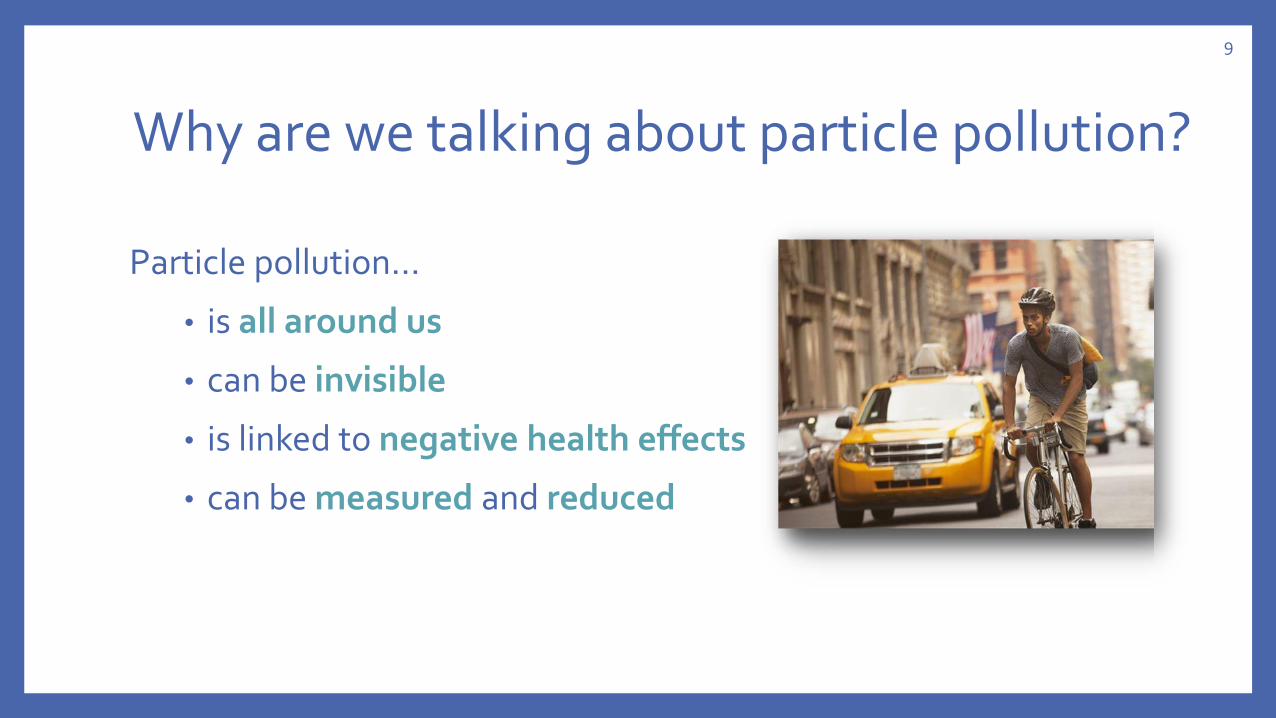
Why are we talking about particle pollution?
Particle pollution…
• is all around us
• can be invisible
• is linked to negative health effects
• can be measured and reduced
9
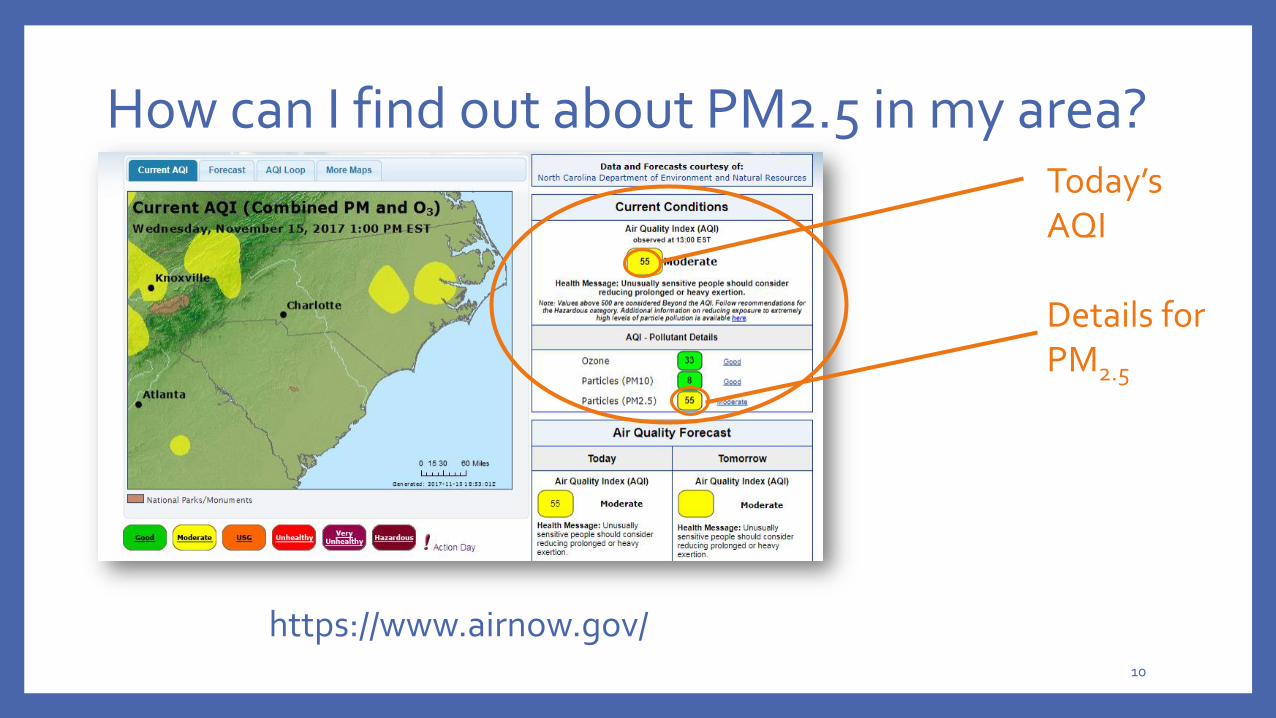
How can I find out about PM2.5 in my area? Today’s AQI
Details for PM2.5
https://www.airnow.gov/10
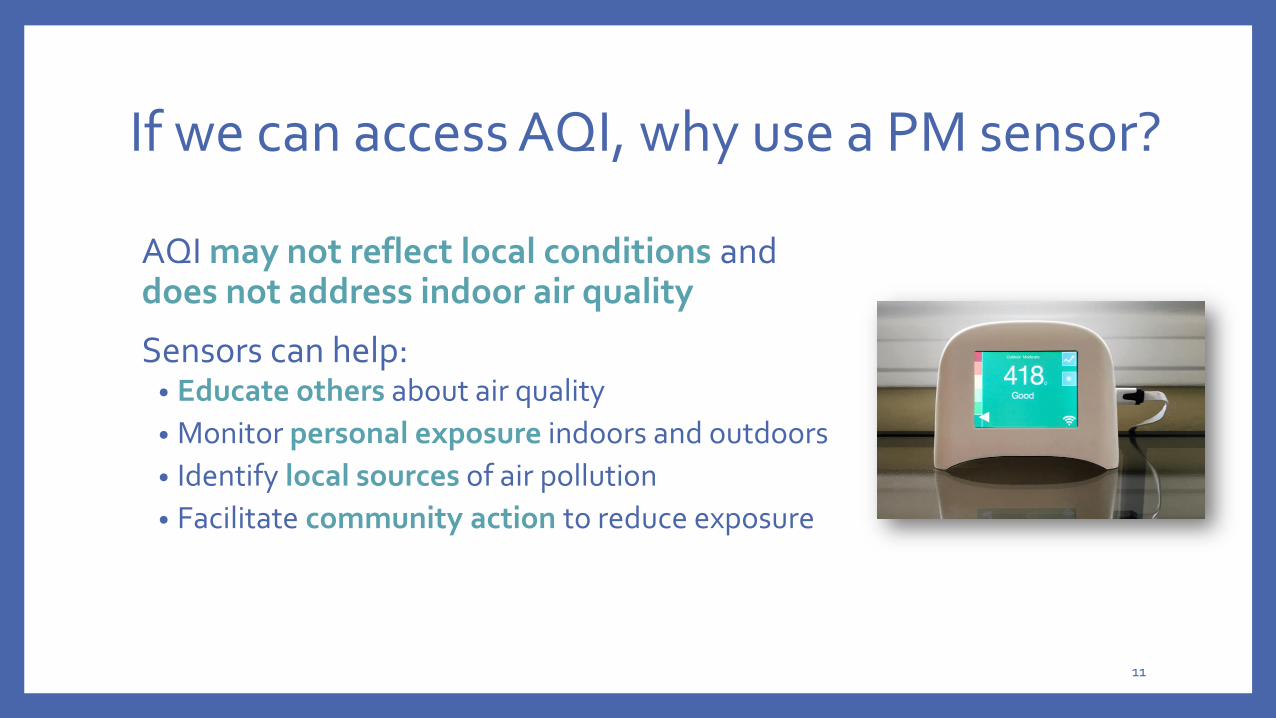
If we can access AQI, why use a PM sensor?
AQI may not reflect local conditions and does not address indoor air quality
Sensors can help:• Educate others about air quality
• Monitor personal exposure indoors and outdoors
• Identify local sources of air pollution
• Facilitate community action to reduce exposure
11
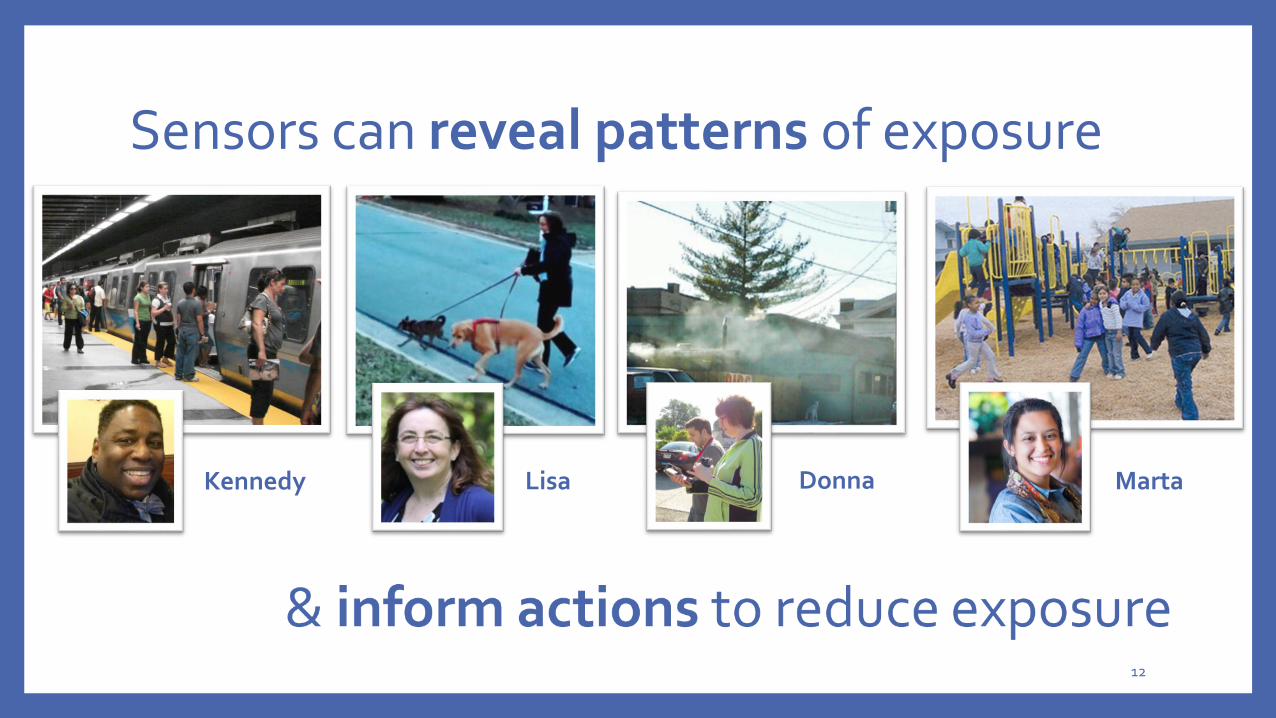
Sensors can reveal patterns of exposure
12
Lisa MartaDonnaKennedy
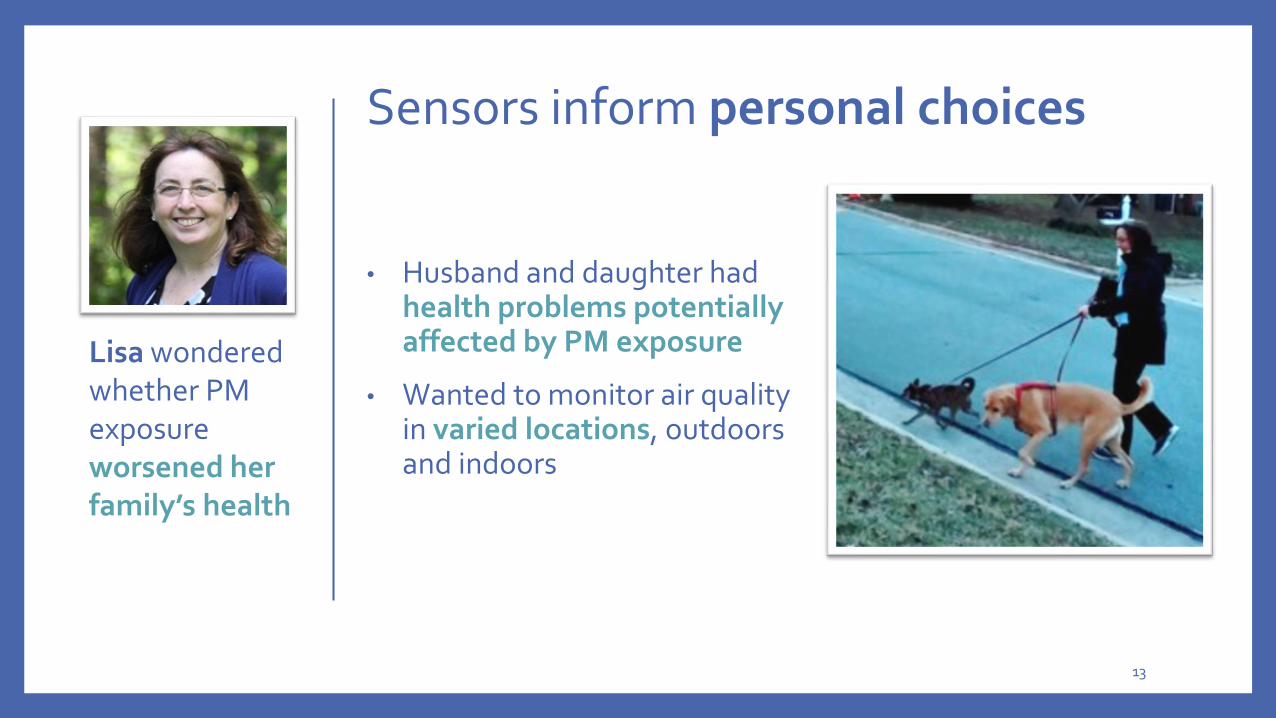
Sensors inform personal choices
13
• Husband and daughter had health problems potentially affected by PM exposure
• Wanted to monitor air quality in varied locations, outdoors and indoors
Lisa wondered whether PM exposure worsened her family’s health
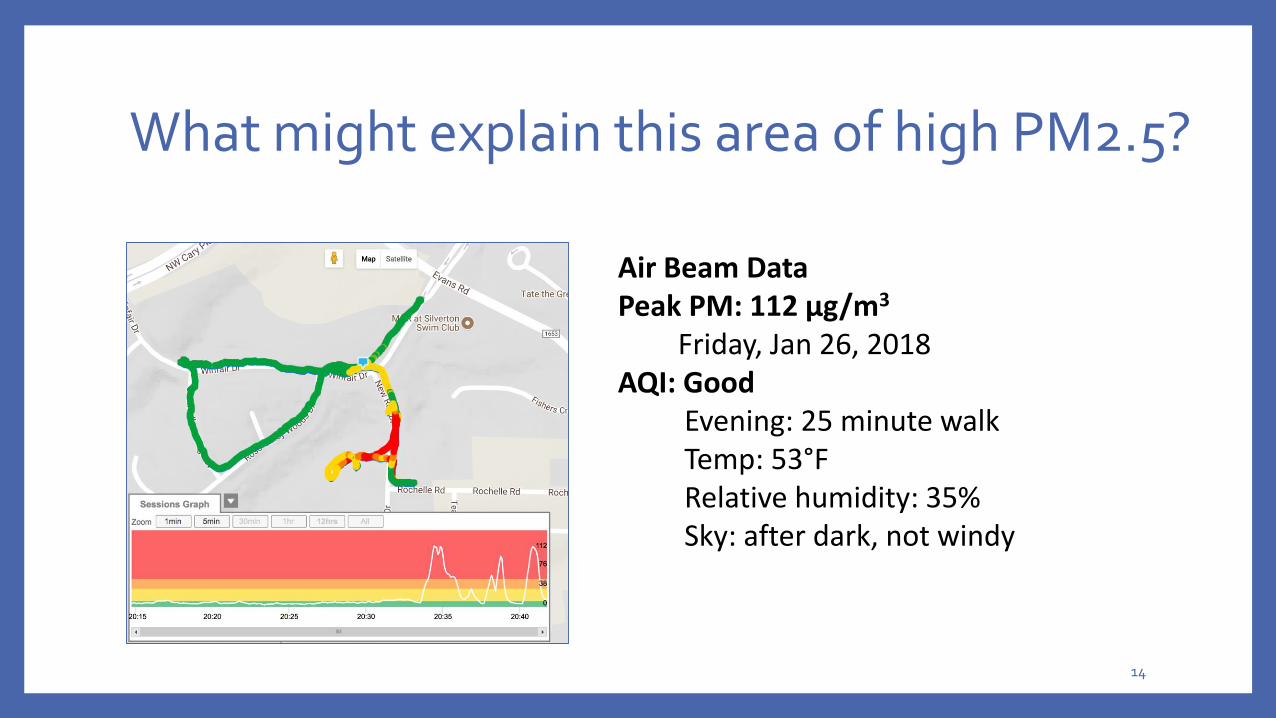
What might explain this area of high PM2.5?
Air Beam DataPeak PM: 112 µg/m3
Friday, Jan 26, 2018AQI: Good
Evening: 25 minute walkTemp: 53°FRelative humidity: 35%Sky: after dark, not windy
14
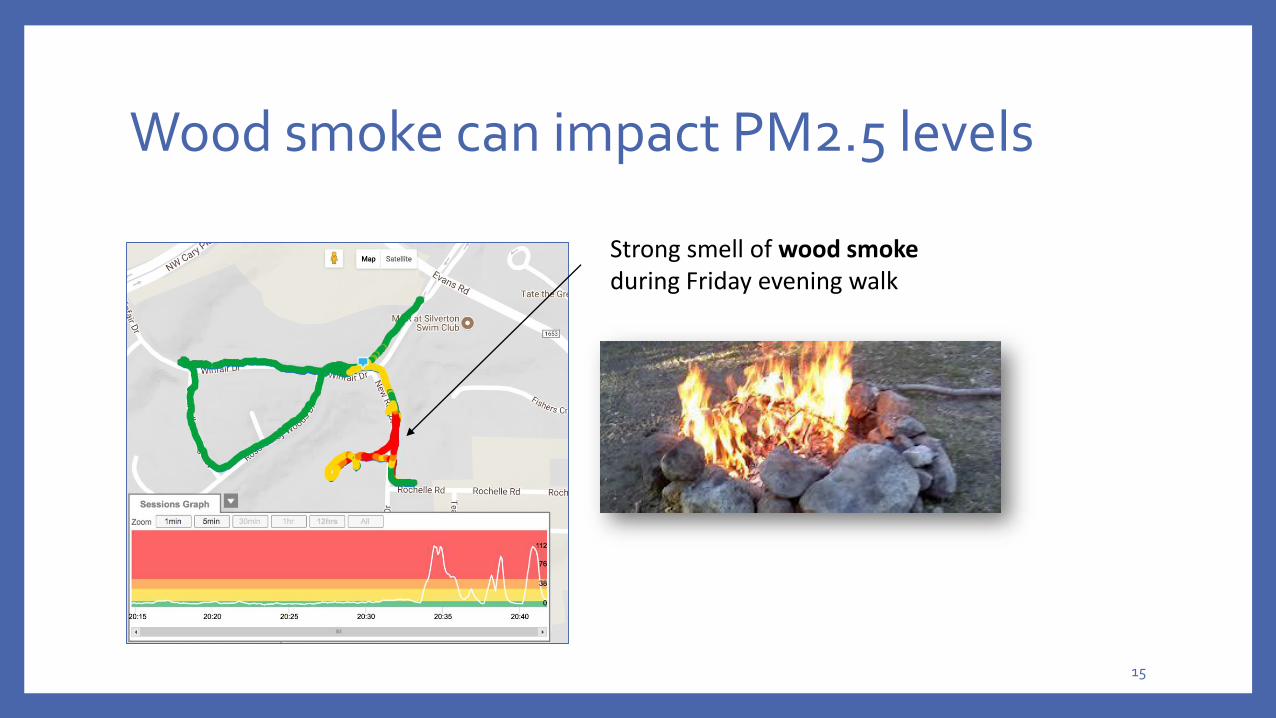
Wood smoke can impact PM2.5 levels
Strong smell of wood smoke during Friday evening walk
15
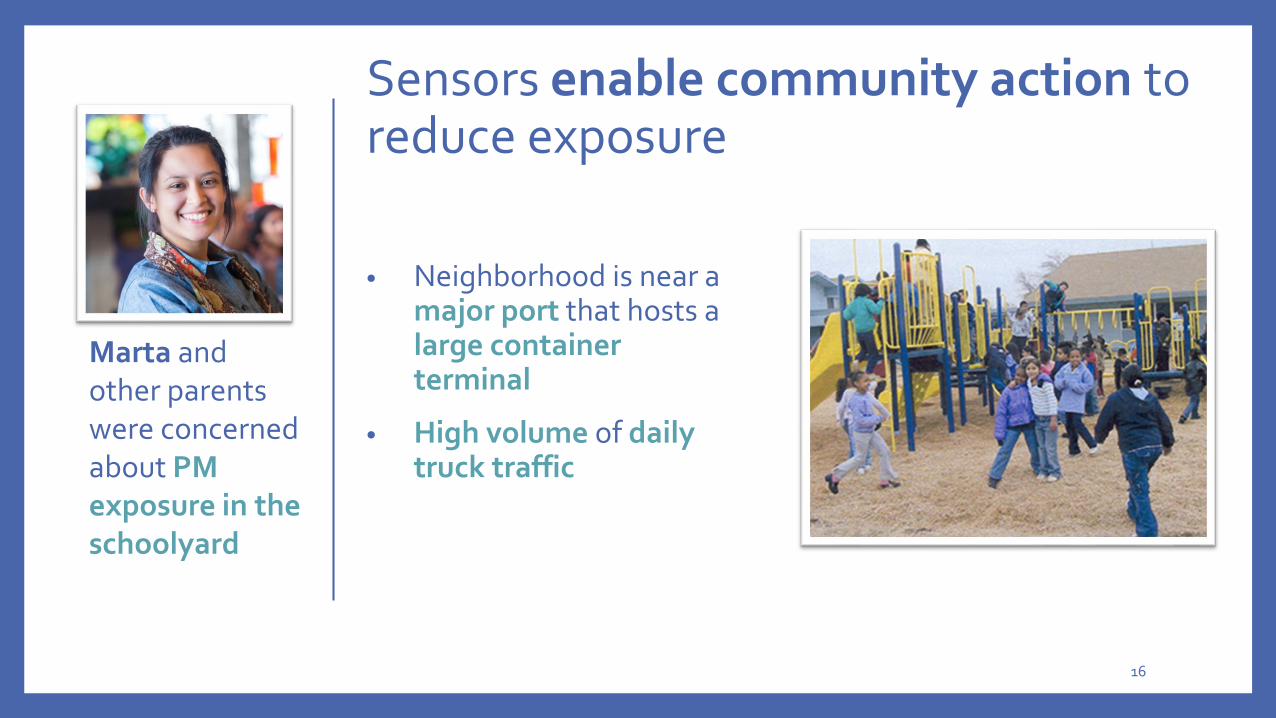
Sensors enable community action to reduce exposure
16
• Neighborhood is near a major port that hosts a large container terminal
• High volume of daily truck traffic
Marta and other parents were concerned about PM exposure in the schoolyard
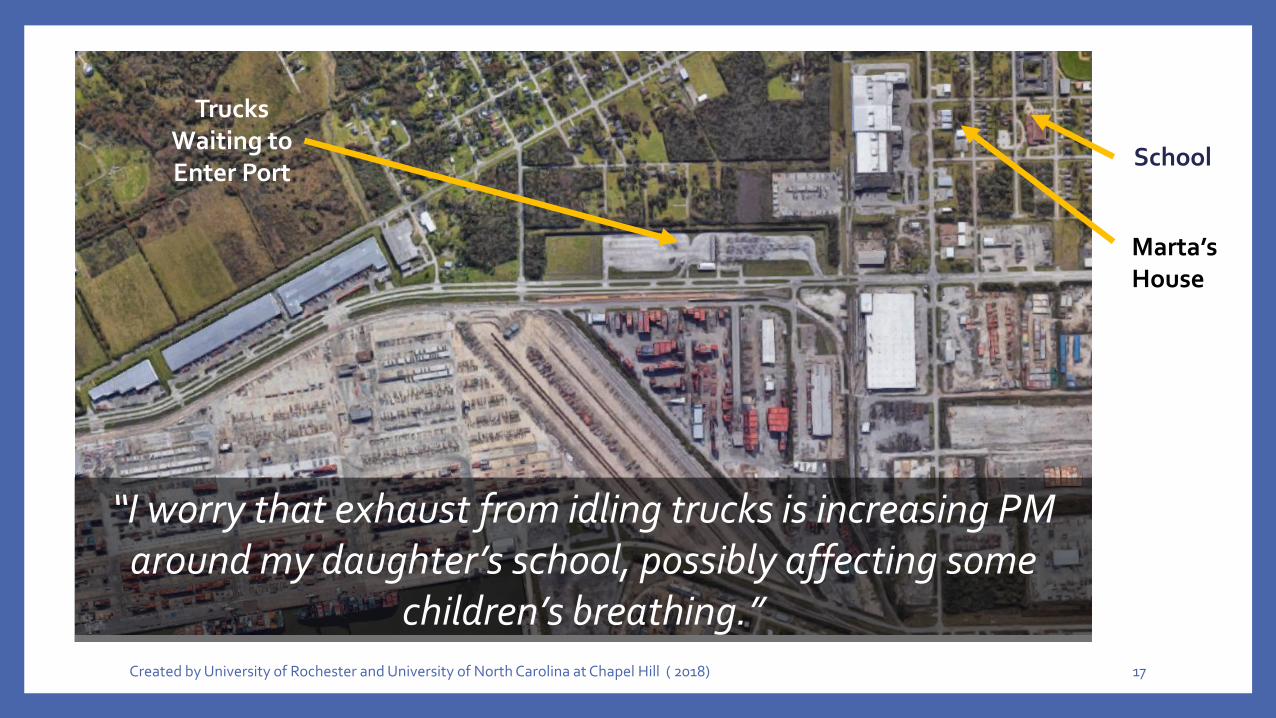
Created by University of Rochester and University of North Carolina at Chapel Hill ( 2018) 17
School
Trucks Waiting to Enter Port
Marta’s House
“I worry that exhaust from idling trucks is increasing PM around my daughter’s school, possibly affecting some
children’s breathing.”
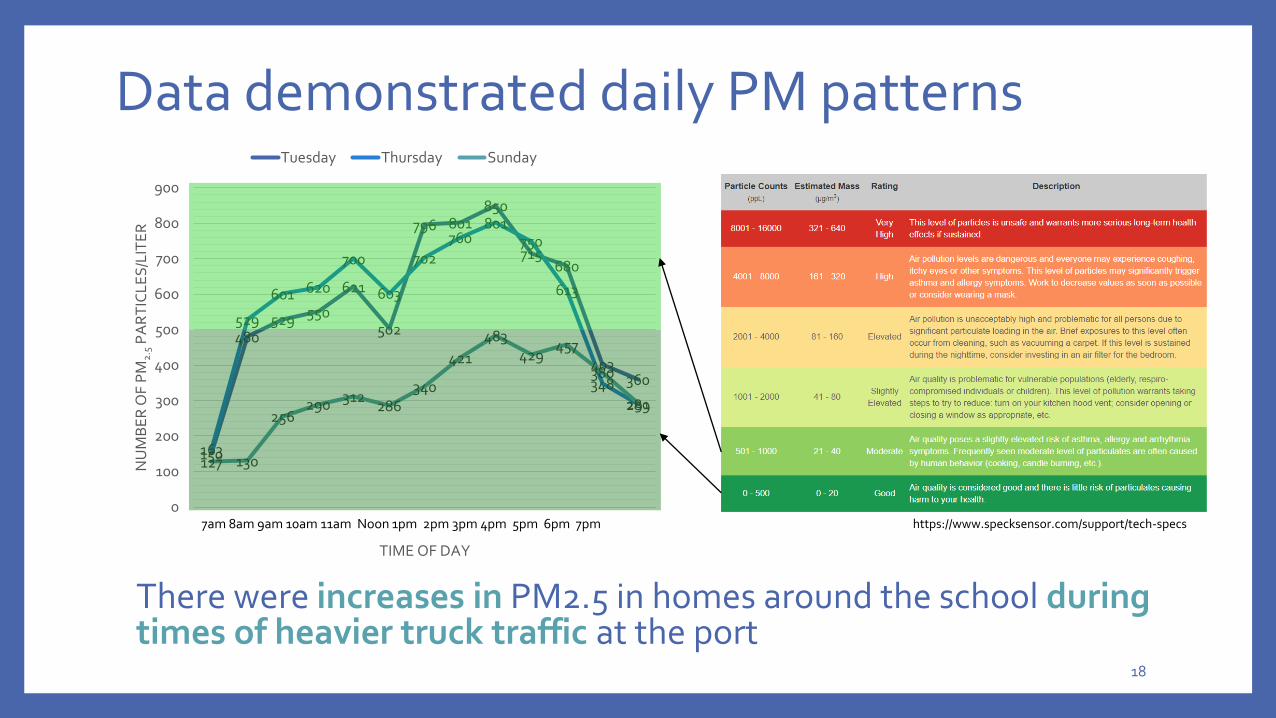
Data demonstrated daily PM patterns
There were increases in PM2.5 in homes around the school during times of heavier truck traffic at the port
18
150
480529 550
621
502
796 801850
715680
403360
163
529
601 620
700
603
702
760801
750
613
348
289
127 130
256290 312
286340
421
483429
457
380
291
0
100
200
300
400
500
600
700
800
900
0700 0800 0900 1000 1100 1200 1300 1400 1500 1600 1700 1800 1900
NU
MB
ER
OF
PM
2.5
PA
RT
ICL
ES
/LIT
ER
TIME OF DAY
Tuesday Thursday Sunday
7am 8am 9am 10am 11am Noon 1pm 2pm 3pm 4pm 5pm 6pm 7pm https://www.specksensor.com/support/tech-specs
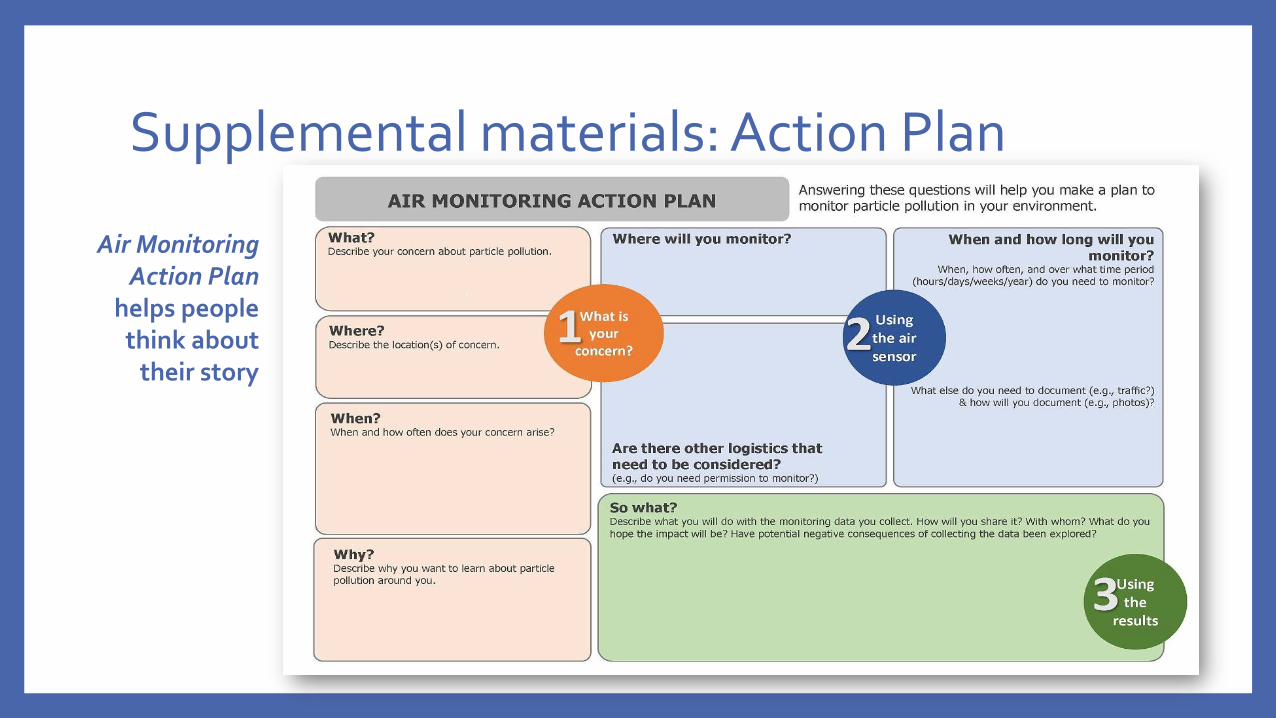
Supplemental materials: Action Plan
Air Monitoring Action Plan
helps people think about
their story
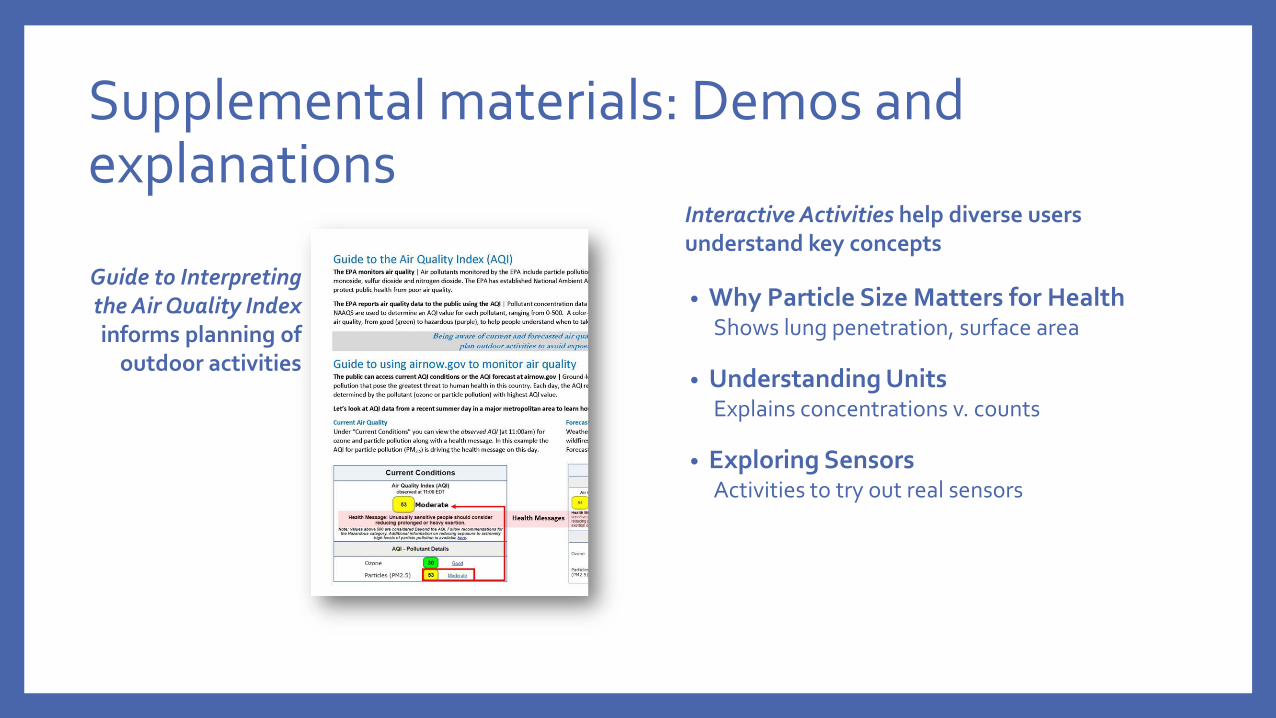
Supplemental materials: Demos and explanations
Guide to Interpreting the Air Quality Indexinforms planning of
outdoor activities
• Why Particle Size Matters for Health Shows lung penetration, surface area
• Understanding Units Explains concentrations v. counts
• Exploring SensorsActivities to try out real sensors
Interactive Activities help diverse users understand key concepts
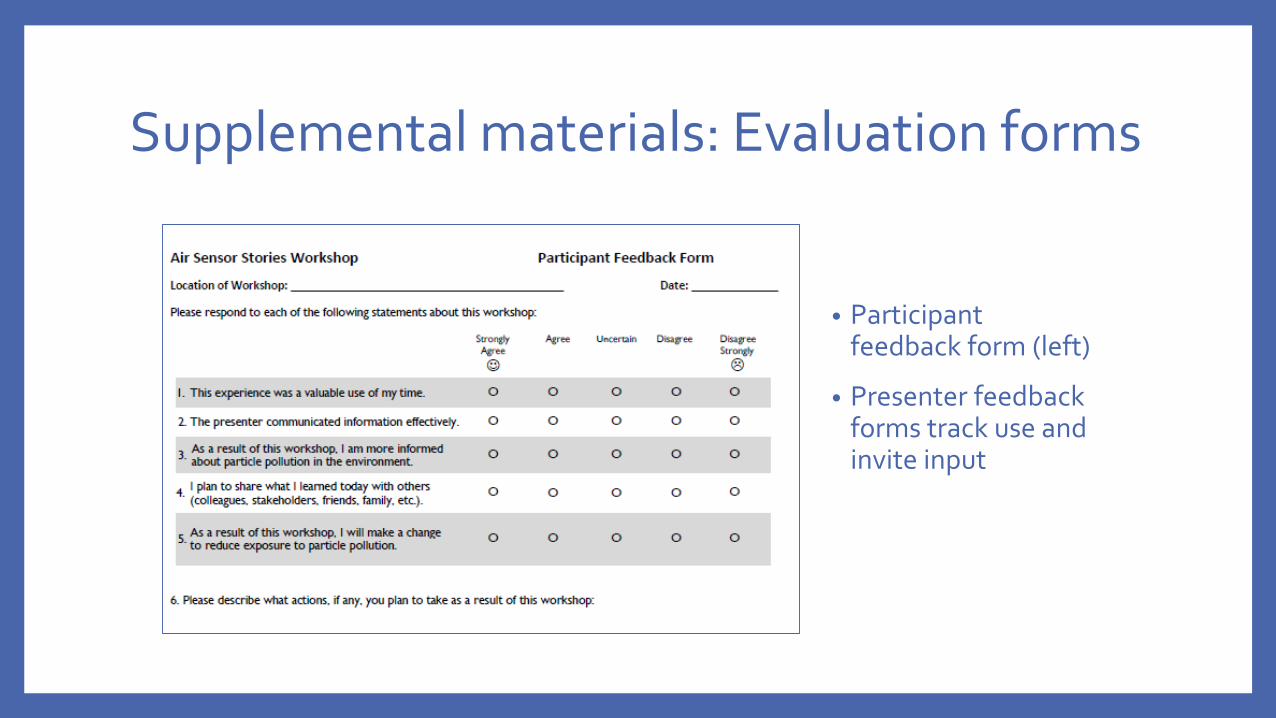
Supplemental materials: Evaluation forms
• Participant feedback form (left)
• Presenter feedback forms track use and invite input
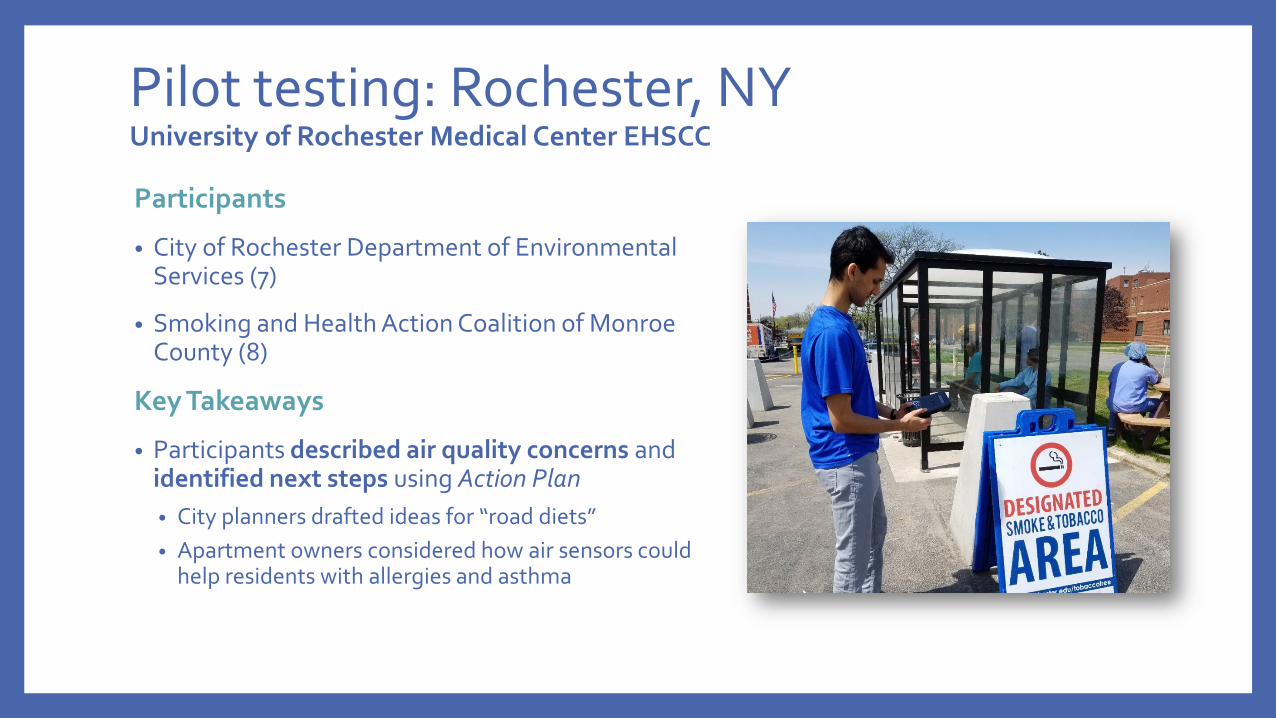
Pilot testing: Rochester, NYUniversity of Rochester Medical Center EHSCC
Participants
• City of Rochester Department of Environmental Services (7)
• Smoking and Health Action Coalition of Monroe County (8)
Key Takeaways
• Participants described air quality concerns and identified next steps using Action Plan
• City planners drafted ideas for “road diets”
• Apartment owners considered how air sensors could help residents with allergies and asthma
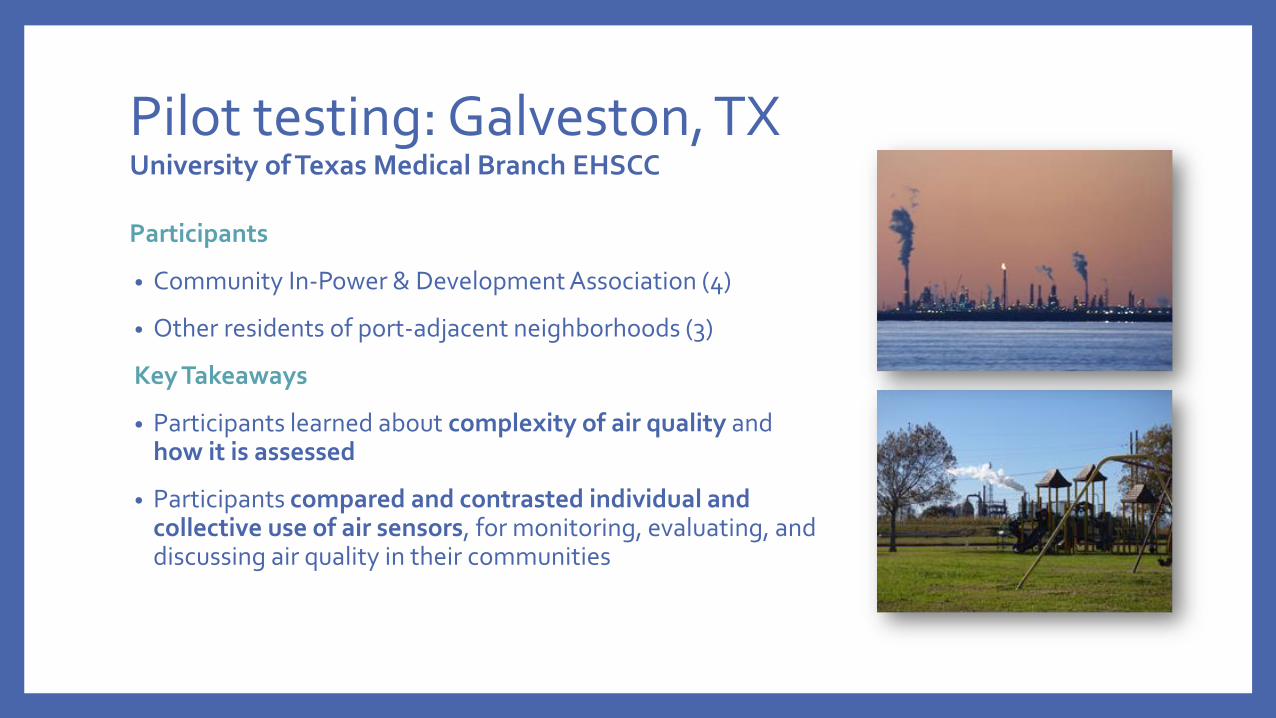
Pilot testing: Galveston, TXUniversity of Texas Medical Branch EHSCC
Participants
• Community In-Power & Development Association (4)
• Other residents of port-adjacent neighborhoods (3)
Key Takeaways
• Participants learned about complexity of air quality and how it is assessed
• Participants compared and contrasted individual and collective use of air sensors, for monitoring, evaluating, and discussing air quality in their communities
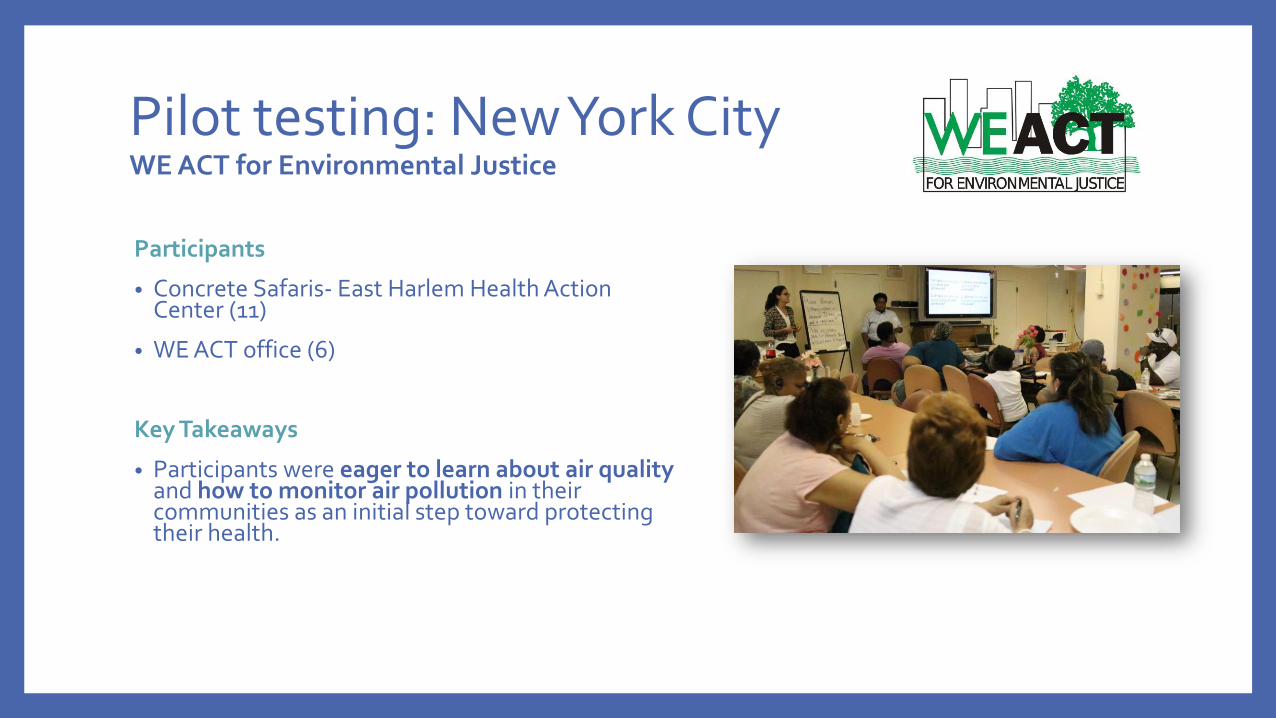
Pilot testing: New York CityWE ACT for Environmental Justice
Participants
• Concrete Safaris- East Harlem Health Action Center (11)
• WE ACT office (6)
Key Takeaways
• Participants were eager to learn about air quality and how to monitor air pollution in their communities as an initial step toward protecting their health.
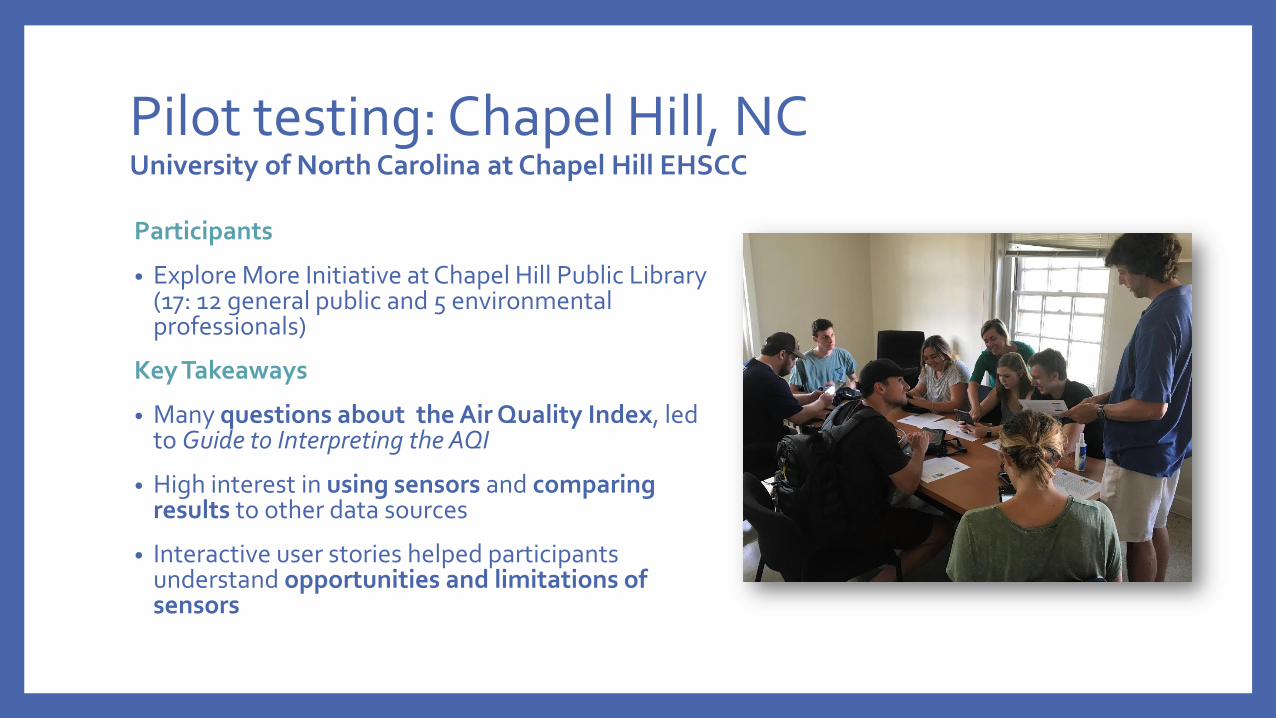
Pilot testing: Chapel Hill, NCUniversity of North Carolina at Chapel Hill EHSCC
Participants
• Explore More Initiative at Chapel Hill Public Library (17: 12 general public and 5 environmental professionals)
Key Takeaways
• Many questions about the Air Quality Index, led to Guide to Interpreting the AQI
• High interest in using sensors and comparing results to other data sources
• Interactive user stories helped participants understand opportunities and limitations of sensors

Dissemination
• Formal and informal science education settings
• Citizen science activities
• Online
• Please share your ideas!
Acknowledgements
Funding was provided by the National Institute of Environmental Health Sciences
Project Team
• University of Rochester Environmental Health Sciences Center (P30-ES01247)
• University of North Carolina-Chapel Hill Center for Environmental Health and Susceptibility (P30-ES010126)
• University of Texas Medical Branch Center for Environmental Toxicology (P30-ES006676)
• Columbia University Center for Environmental Health in Northern Manhattan and We Act for Environmental Justice
Many thanks to colleagues in USEPA and in the EHSCC Community Engagement Core network for their invaluable input on this project!
27
https://sensorstories.urmc.edu
Please use and provide feedback by February 2019!