Embed Size (px)
Citation preview
University of Calgary
PRISM: University of Calgary's Digital Repository
Graduate Studies The Vault: Electronic Theses and Dissertations
2018-07-03
Sensor Fusion-based Framework for Floor
Localization
Haque, Fahimul
Haque, F. (2018). Sensor Fusion-based Framework for Floor Localization (Unpublished master's
thesis). University of Calgary, Calgary, AB. doi:10.11575/PRISM/32261
http://hdl.handle.net/1880/107039
master thesis
University of Calgary graduate students retain copyright ownership and moral rights for their
thesis. You may use this material in any way that is permitted by the Copyright Act or through
licensing that has been assigned to the document. For uses that are not allowable under
copyright legislation or licensing, you are required to seek permission.
Downloaded from PRISM: https://prism.ucalgary.ca
UNIVERSITY OF CALGARY
Sensor Fusion-based Framework for Floor Localization
by
Fahimul Haque
A THESIS
SUBMITTED TO THE FACULTY OF GRADUATE STUDIES
IN PARTIAL FULFILMENT OF THE REQUIREMENTS FOR THE
DEGREE OF MASTER OF SCIENCE
GRADUATE PROGRAM IN ELECTRICAL AND COMPUTER ENGINEERING
CALGARY, ALBERTA
JULY, 2018
© Fahimul Haque 2018
ii
Abstract
Floor localization is at the heart of indoor positioning systems (IPSs) in multi-storey
buildings with a variety of commercial, industrial, and health and safety applications. The
prevalence of wireless technologies along with the integration of micro electro-mechanical
sensors (e.g. barometers) in handheld devices and wearable gadgets of current vintage have
prompted a surge in research and development efforts in the IPS area. Received signal
strength (RSS), barometric altimetry (BA), and differential barometric altimetry (DBA) are
three well-known methods of floor localization. However, the RSS-based methods lack the
required accuracy, BA-based methods are prone to random errors due to local changes in
the air pressure, e.g. from approaching weather systems, and DBA-based methods require
installation of additional infrastructure (e.g. reference nodes and ad-hoc network for real-
time information exchange). Fusion of BA and RSS is a viable solution for floor
localization; nevertheless, available fusion algorithms are rather heuristic. In this
dissertation, a theoretical framework is developed for fusing BA and Wi-Fi RSS
measurements. The proposed framework involves a novel Monte Carlo Bayesian inference
algorithm, for processing RSS measurements, and then fusion with BA using a Kalman
Filter scheme. As demonstrated by our experimental results, the proposed sensor fusion
algorithm achieves floor localization accuracy of 97% on average. The algorithm does not
require new infrastructure, and has low computational complexity, hence, can be readily
integrated into various state-of-the-art mobile devices.

iii
Acknowledgements
I would like to extend my heartfelt gratitude to my supervisor Dr. Vahid Dehghanian
and my co-supervisor Dr. Abraham Fapojuwo for their constant assistance, guidance, and
encouragement during my MSc program. Thank you for providing your valuable insights
and expertise to support me with my research work.
I would also like to thank my parents and my brothers who have always been there
for me.

iv
Dedication
To my amazing family, beloved fiancé, and lighthearted friends.
v
Table of Contents
Abstract ............................................................................................................................... ii
Acknowledgements ............................................................................................................ iii
Dedication .......................................................................................................................... iv
Table of Contents ................................................................................................................ v
List of Figures .................................................................................................................. viii
List of Tables ...................................................................................................................... x
List of Symbols, Abbreviations and Nomenclature ........................................................... xi
Chapter 1: Introduction ....................................................................................................... 1
1.1 Chapter Focus ............................................................................................................ 1
1.2 Motivation ................................................................................................................. 2
1.3 Objectives and Contributions .................................................................................... 3
1.4 Dissertation Outline ................................................................................................... 5
Chapter 2: Literature Review .............................................................................................. 6
2.1 Chapter Focus ............................................................................................................ 6
2.2 Prior Research Using RSS ......................................................................................... 6
2.3 Prior Research Using BP ......................................................................................... 13
2.4 Prior Research Using Both RSS and BP ................................................................. 18
2.5 Relationship between the Thesis and Previous Works ............................................ 21
Chapter 3: Floor Localization Using Barometric Pressure .............................................. 22
3.1 Introduction ............................................................................................................ 22
3.2 MEMS Barometer Measurement Model ................................................................. 23
vi
3.3 Framework for BP-based Floor Localization .......................................................... 30
3.3.1 Multiple Hypothesis Testing ............................................................................ 32
3.4 Experimental Setup ................................................................................................. 34
3.4.1 Apparatus .......................................................................................................... 35
3.4.2 Selected Environments for Measurements ....................................................... 36
3.5 Floor Localization Using BA .................................................................................. 39
3.5.1 Results and Analysis of BA-based Floor Localization ..................................... 40
3.6 Floor Detection Using DBA .................................................................................... 42
3.6.1 Results and Analysis of DBA-based Floor Localization .................................. 44
3.7 Summary ................................................................................................................ 44
Chapter 4: Floor Localization Using Received Signal Strength ...................................... 47
4.1 Introduction ............................................................................................................ 47
4.2 RSS Distribution Model .......................................................................................... 47
4.3 Conventional RSS-based Floor Localization Methods ........................................... 53
4.3.1 RSS Fingerprinting ........................................................................................... 54
4.3.2 RSS-based Multilateration ................................................................................ 55
4.3.3 Maximum Likelihood-based Approach ............................................................ 56
4.4 Proposed MCBI Framework for RSS-based Floor Localization ............................ 57
4.5 Results and Analysis ............................................................................................... 59
4.6 Summary ................................................................................................................ 62
Chapter 5: Floor Localization Using Proposed Sensor Fusion Framework .................... 63
5.1 Introduction ............................................................................................................. 63
5.2 Kalman Filter ........................................................................................................... 63
vii
5.3 Proposed Sensor Fusion Algorithm ......................................................................... 66
5.4 Results and Analysis ............................................................................................... 69
5.5 Summary ................................................................................................................ 71
Chapter 6: Conclusion ....................................................................................................... 74
6.1 Thesis Summary ...................................................................................................... 74
6.2 Conclusions ............................................................................................................. 74
6.3 Recommendations for Future Work ........................................................................ 75
References ......................................................................................................................... 77
APPENDIX A ................................................................................................................... 87
APPENDIX B ................................................................................................................... 92
APPENDIX C ................................................................................................................... 94
viii
List of Figures
Figure 3.1: Determined height error (∆ℎ) for 115 hours long measurement set ……...… 24
Figure 3.2: Allan deviation plot for MEMS barometer of different models ………….… 26
Figure 3.3: Allan deviation plots for MEMS BP sensors (DBA) ……………………….. 27
Figure 3.4: Varying magnitude of 𝛼 for 1 𝑓𝛼⁄ (𝛼 > 1) noise ………………………..… 28
Figure 3.5: Measured height error ∆ℎ using DBA ………………………..……………... 31
Figure 3.6: Distribution of estimated height ℎ̂𝑏 on a fixed floor (First floor of TFDL) … 31
Figure 3.7: Handheld electronic comprising BMP280 and Wi-Fi module ……………… 35
Figure 3.8: Left figure - Outside view of ICT building; Middle figure - Narrow hallway
on the second/third floor; Right figure - Partial view of the first floor (open floor plan) . 37
Figure 3.9: Top figure - Outside view of TFDL building; Middle figure - Hollow interiors
between first and second floor; Bottom figure - Partial view of the third floor ………… 37
Figure 3.10: Top figure - Outside view of MSC; Middle figure – Hollow interiors inside
MSC; Bottom Figure – Open floor plan on the first floor of MSC ……………………... 38
Figure 3.11: BA-based floor localization system ……………………………………….. 39
Figure 3.12: Estimated height using BA in (a) ICT, (b) TFDL, and (c) MSC ……….…. 41
Figure 3.13: Distribution of estimated height ℎ̂𝑏 (1.5 hours apart) on the first floor
of TFDL ……………………………………..…..……………………………………… 42
Figure 3.14: DBA-based floor localization system ……………………………………... 43
Figure 3.15: Estimated height using DBA in (a) ICT, (b) TFDL, and (c) MSC ………... 45
Figure 3.16: Distribution of estimated height ℎ̂𝑏 using DBA on different floors
of TFDL …….………………….…………………….…………………….………….... 46
Figure 4.1: Illustration of multipath effect in an indoor environment …………………... 48
ix
Figure 4.2: Distribution of RSS measurements form an AP with fixed transmitter-receiver
radial separation inside ICT Building …………………………………………………… 50
Figure 4.3: (a) Distribution of RSS (|𝑡𝑚 − 𝑙𝑓|=0), (b) Distribution of RSS
(|𝑡𝑚 − 𝑙𝑓|=1) …………………….…..……………………….……..…………………... 51
Figure 4.4: Conditional probability density 𝑝(𝒟ℱ|ℓ𝑓) ……………………………….… 53
Figure 4.5: Fingerprinting approach (online phase) …………………………………….. 55
Figure 4.6: RSS map (ICT, 2nd Floor) …………………………………………….…… 60
Figure 4.7: Impact of AP availability on floor localization …………………………...… 61
Figure 5.1: Block diagram of state model ………………………………………….…... 64
Figure 5.2: Block Diagram of the Kalman filter …………………………………...…… 66
Figure 5.3: Pseudocode of sensor fusion algorithm ……………………………………... 68
Figure 5.4: Estimated height for floor localization using sensor fusion algorithm in (a) ICT,
(b) TFDL, and (c) MSC…………………………………………………………………. 70
Figure 5.5: Comparison of floor localization accuracy ………………………………… 71
Figure 5.6: Percentage of false floor localization in (a) ICT, (b) TFDL, and (c) MSC …. 72
Figure C.1: Average RSS measurements ……………………………………………….. 95
Figure C.2: Distribution of RSS on different floors (signals transmitted by AP 1) …….. 96
x
List of Tables
TABLE 3.1 NOISE CHARACTERISTICS OF THE TESTED BP SENSORS ………. 28
TABLE 3.2 FLOOR LOCALIZATION ACCURACY USING BA …………………... 42
TABLE 3.3 FLOOR LOCALIZATION ACCURACY USING DBA ………………… 46
TABLE 4.1 STATISTICAL CHARACTERISTICS OF LOG-NORMAL
DISTRIBUTION ……………………………………………………………………….. 52
TABLE 4.2 FLOOR LOCALIZATION ACCURACY USING RSS-BASED
ALGORITHMS ………………………………………………………………………... 61
TABLE 5.1 FLOOR LOCALIZATION ACCURACY USING SENSOR FUSION
ALGORITHM ………………………………………………………………………….. 69
TABLE A.1 ESTIMATED AR(1)MA(1) PARAMETERS …………………………… 91
TABLE B.1 E[𝐷ℱ] AND std[𝐷ℱ] FOR ICT BUILDING …………………………..… 92
TABLE B.2 E[𝐷ℱ] AND std[𝐷ℱ] FOR TFDL ……………………………………..…. 92
TABLE B.3 E[𝐷ℱ] AND std[𝐷ℱ] FOR MSC ……………………………………..….. 93
xi
List of Symbols, Abbreviations and Nomenclature
Symbols Definition
𝑎𝑛 Amplitude of the 𝑛-th impulse
𝑏[𝑛] Randomly varying mean (i.e. bias) in barometric pressure at
n-th sampling interval
𝑏𝑘 Randomly varying mean (i.e. bias) in barometric pressure
for 𝑛 = (𝑘 − 1)𝑁𝑏 + 1, … , 𝑘𝑁𝑏-th sampling intervals,
where 𝑘 = 1,2,3.. and 𝑁𝑏 = 𝐹𝑠𝑇𝑏
𝐶 Assigned cost
𝒞 Total number of clusters for a given cluster time in Allan
deviation
𝒟 Observed data during a Wi-Fi network scan
𝑑𝑚 Measurement set that includes 𝑧𝑚 and 𝑡𝑚
𝒟ℱ Observed data for a given mobile-access point floor
separation ℱ
𝑑𝑗,𝑖 Euclidean distance between 𝑗-th access point and 𝑖-th
measurement point
𝜂 Path loss coefficient
ℱ Floor separation between mobile and access point (i.e. |𝑡𝑚 −
ℓ𝑓|)
𝐹𝑠 Sampling frequency
ℎ𝑚 Calculated height using atmospheric pressure with reference
to sea level
∆ℎ Height error in measurement
ℎ̃ Measured height relative to a local reference point
ℎ Correct height relative to the local reference point
xii
ℎ𝑟 Height of the reference point/floor location with reference
to sea level
ℎ𝑓 Correct floor height associated with floor hypothesis ℓ𝑓 with
respect to local reference point
ℎ̂|𝑏𝑘 , ℎ̂𝑏 Estimated height for a known bias 𝑏𝑘
ℎ𝑅𝑆𝑆 The correct floor height corresponding to a floor
(determined using RSS-based MAP classifier)
ℎ𝑝𝑞(𝑡; 𝜏) Time-varying impulse response of the channel between
nodes 𝑝 and 𝑞 at time 𝑡 to a unit impulse 𝛿[. ] transmitted at
time 𝑡 − 𝜏
𝐾 Kalman Gain
ℒ Set of all possible user floor locations in an 𝑁-storey
building
ℒs Subset of floors that are associated with the access points
discovered during a wireless network scan
ℓ𝑓 Hypothesis associated with 𝑓-th floor
ℓMAP Output (i.e. detected floor) of the MHT algorithm
ℓMAP𝑅 Output (i.e. detected floor) of the RSS-based MAP classifier
𝑀 Total number of measurement samples
ℳ Minimum mean square error
𝑁 Total number of floors inside a building
𝑁s Total number of floors associated with the access points
discovered during a wireless network scan
𝑁𝑐 Number of samples per cluster in Allan deviation
𝑛 Sample/iteration Number
𝑛𝐴𝑃 Total number of observed access points during a Wi-Fi scan
xiii
𝒫 Barometric pressure measured by the pressure sensor (i.e.
barometer)
𝒫𝑜 Pressure at sea level, which is 1013.25 hPa or 101325 Pa
𝒫𝑟 Pressure of the reference location with reference to sea level
𝑝 Probability density function or likelihood function
𝑃 Probability
𝑃𝑒 Probability of error
𝑃𝑟𝑖 Received signal strength at 𝑖-th measurement point
𝑃𝑇𝑗 Transmitted power by 𝑗-th access point
𝜙ℱ Percentage of discovered access points for a given floor
separation ℱ
𝜙𝑛 Phase of the 𝑛-th impulse
ℛ Bayes risk
𝑠𝑝𝑞 Transmitted signal
𝜎𝐴𝐷𝐸𝑉 Allan deviation
𝜎𝑏 , 𝜎𝑢, 𝜎𝑤 Standard deviation of WGN
𝑇𝑏 Time interval over which the WGN is the dominant noise
process in barometer measurement
𝑡𝑚 Floor location corresponding to m-th AP
𝜏𝑐 Cluster time (averaging time) in Allan deviation
𝜏𝑛 Time-delay of the 𝑛-th impulse
𝑣𝑝𝑞 Induced voltage across terminals of the antenna on the
receiver side
𝜔𝑓 Normalized importance weights
z RSS observables from an access point
𝑧𝑚 Measured RSS value (in dBf) from m-th AP

xiv
𝑍𝑇𝑃𝑖 Set of RSS observables at the 𝑖-th location during training
phase
𝑍𝑂𝑃 Set of RSS observables during online phase
ℤ+ Set of positive integers
xv
Abbreviations Definition
AOA Angle of Arrival
ADEV Allan Deviation
AP Access Point
BA Barometric Altimetry
BP Barometric Pressure
DBA Differential Barometric Altimetry
ED Euclidean Distance
GNSS Global Navigation Satellite System
ICT Information and Communications
Technology Building, University of Calgary
IPS Indoor Positioning System
KF Kalman Filter
KNN 𝑘-nearest Neighbor (algorithm)
LOS Line-of-sight
MAC ID Medium Access Control Identifications
MAP Maximum Posteriori Probability
MCBI Monte Carlo Bayesian Inference
MEMS Micro-Electro-Mechanical-Systems
MHT Multiple Hypothesis Testing
ML Maximum Likelihood
MSC MacEwan Student Centre, University of
Calgary
MSE Minimum Squared Error
PDF Probability Density Function
PSD Power Spectral Density

xvi
RW Random Walk
RN Reference Node
RSS Received Signal Strength
SUT Sensor Under Test
TOA Time of Arrival
TDOA Time Difference of Arrival
TFDL Taylor Family Digital Library, University of
Calgary
WGN White Gaussian Noise
1
Chapter 1: Introduction
1.1 Chapter Focus
The prevalence of wireless technologies and the integration of miniaturized sensors
in modern gadgets, e.g. smartphones and wearable electronics, has prompted a recent surge
in mobile location based services (LBS). The total LBS revenues are supposed to reach
US$ 3.8 billion in North America and €2.3 billion in Europe by 2018 [1]. As a core
technology of LBS, indoor positioning system (IPS) is vital to detect a smartphone user
location in indoor environment. There is a high demand for robust IPS because most LBS
users spend 70% - 90% of their time indoors [1]. Application areas of IPS are gradually
expanding, ranging from goods and services to search and rescue [2, 3].
In multi-story buildings, floor localization (also known as floor
detection/identification) is an essential part of IPS. In fact, the Federal Communication
Commission in USA emphasized on developing solutions for estimating altitude so that
the floor location of the emergency (911) callers can be determined [4]. With the ubiquitous
use of wireless access points (APs), e.g. Wi-Fi APs, and the integration of Micro-electro-
mechanical-systems (MEMS) sensors, such as barometric pressure sensors (also known as
pressure altimeter or barometer), in modern handheld devices (e.g. smartphones) and
wearable gadgets, Wi-Fi received signal strength (RSS) and barometric altimetry (BA)
have become two well-known methods for floor localization. The focus of this dissertation
is to develop a sensor fusion based framework for enhanced floor localization using Wi-Fi
RSS and BA.
This chapter introduces the motivation and objectives behind the research work of
this dissertation as well as highlights the contributions of the research to the scientific
community. Section 1.2 discusses the motivation for this dissertation, which leads to
Section 1.3 where the objectives and contributions of the research work are detailed.
Finally, Section 1.4 provides an outline of the remaining chapters in this dissertation.
2
1.2 Motivation
RSS-based localization techniques have become prominent in recent years [2, 3]
because they are inexpensive and readily available. Nevertheless, RSS-based positioning
is generally prone to a variety of errors due to for example; multipath fading, signal
blocking, and changes in smartphone antenna polarization and pattern from user interaction
with the handheld device [5, 6, 7]. RSS-based localization techniques based on
crowdsourced real-time RSS fingerprints have been shown to achieve meter-level accuracy
[8, 9]. Nonetheless, crowdsourcing requires new infrastructure and localization based on
off-line RSS fingerprints is inaccurate and unreliable especially in multi-story buildings
with irregular structures, e.g. floors with hollow interiors.
Recent integration of MEMS barometers in smartphones (e.g. iPhone 6/7/8/X,
Samsung note 6/7/8, Google Pixel 2) has prompted its use in relative height (known as
altitude) estimation and floor localization [10, 11, 12, 13]. Nevertheless, BA is highly
affected by local environmental elements such as approaching high/low pressure weather
systems, air-conditioning, wind, temperature, factory calibration (or the lack of), etc. These
local variations (i.e. drift) in the air pressure can result in large altitude estimation errors of
tens of meters over the course of a few hours [11, 12]. Differential barometric altimetry
(DBA) based on (near-) real-time differencing of measured air pressures from mobile and
reference barometers, where the altitude of the reference is known, has been shown to
achieve decimeter level accuracy [10, 14, 15]. However, DBA requires additional
infrastructure, e.g. installation of reference nodes and ad-hoc network for real-time
information exchange, hence not readily applicable.
Multi-sensor altimetry based on fusing alternate altitude observables with those
obtained from MEMS barometers can be very effective. One such alternate source of
altitude observables is Global Navigation Satellite System (GNSS) [11, 13, 16].
Unfortunately, GNSS signals are prone to significant RF penetration losses and multipath,
therefore GNSS-barometer fusion is not suitable for indoor positioning. Multi-sensor
altimetry based on integrating MEMS barometer and MEMS Inertial Measurement Units
(IMUs) has been shown to result in improved altitude estimation [17, 18, 19]. Nevertheless,
IMUs and barometers are both prone to drift errors (of different origins) and long-term (i.e.
3
≥ 30 minutes) reliability of such solutions have not yet been verified. Integration of ultra
high frequency based techniques that use time of arrival (TOA), time difference of arrival
(TDOA), and angle of arrival (AOA) is not feasible for IPS because they require
sophisticated and costly devices, e.g. ultra-high precision clocks for TOA, TDOA or
antenna arrays with small form factor for AOA [20].
More recently, barometer-aided RSS floor localization has been considered [2, 21,
22, 23]. Barometer-aided RSS methods are attractive due to the complimentary nature of
RSS observables and barometer output. Nevertheless, to the best of author’s knowledge,
current state-of-the-art fusion algorithms based on BA and RSS are rather heuristic and a
theoretical framework for BA and RSS fusion, which this thesis aims to provide, does not
exist.
1.3 Objectives and Contributions
Given the shortcomings involving implementation of various floor localization
methods, this dissertation presents a theoretical framework for fusing BA and Wi-Fi RSS
readings that can be applied without additional infrastruture for accurate floor localization.
With regard to the limitations outlined in the previous section, the objectives of this
dissertation can be summarized as follows:
1. Development of a smartphone compatible floor localization algorithm that does not
require installation of additional infrastructure and can provide floor localization
accuracy comparable to that of DBA-based method. [Chapter 5]
2. Estimation and compensation of drift errors due to local changes in the air pressure
observed in BA. [Chapter 3, Chapter 5]
3. Development of a theoretical framework for fusing BA and Wi-Fi RSS. [Chapter
5]
4. Evaluating the robustness and accuracy of the proposed sensor fusion framework
along with BA-only, DBA-only, and RSS-only methods for floor localization under
different conditions. [Chapter 3, Chapter 4, Chapter 5]
4
5. Performance analysis of the proposed method in comparison with BA-only, DBA-
only, and RSS-only methods for floor localization over extensive measurements.
[Chapter 5]
The major contributions of this dissertation are as follows:
1. Use of Allan Deviation (ADEV) over extensive measurements to characterize
underlying random processes (for four state-of-the-art barometers) that influence
the BA-based height estimation errors. To the best of author’s knowledge, this is
the first time use of ADEV is made to characterize barometer errors. [Chapter 3]
2. Development of a tractable mathematical model that adequately characterizes the
random process in barometer measurement, and later the model is used to estimate,
track, and mitigate barometer measurement errors through sensor fusion. [Chapter
3, Chapter 5]
3. Approximation of Wi-Fi RSS (from plurality APs) distribution in indoor
environments with a log-normal distribution. [Chapter 4]
4. Formulation of a Monte Carlo Bayesian Inference (MCBI) framework for floor
localization using Wi-Fi RSS. [Chapter 4]
5. Development of a sensor fusion framework for floor localization fusing
(combining) both BA and Wi-Fi RSS readings. [Chapter 5]
6. Publication/Submission of scientific papers based on the research work in this
dissertation. The list of papers is as follows:
• F. Haque, V. Dehghanian and A. O. Fapojuwo, "Sensor Fusion for Floor
Detection," in The 8th IEEE Annual Information Technology, Electronics and
Mobile Communication Conference, Vancouver, 2017.
• F. Haque, V. Dehghanian, A. O. Fapojuwo, J. Nielsen, “Wi-Fi RSS and MEMS
Barometer Sensor Fusion Framework for Floor Localization” (Accepted for
publication in IEEE Sensors Journal).
5
1.4 Dissertation Outline
This dissertation contains six chapters and three appendices. The remaining chapters
are organized as follows:
Chapter 2 provides a literature review on recent RSS-based and barometric pressure
(BP)-based floor localization methods. The chapter also includes brief details about the
methods that are relevant to floor localization and methods that considered both RSS and
BP for floor localization. Benefits and limitations of implementing different methods are
also specified.
Chapter 3 develops a MEMS barometer measurement model based on Allan
deviation analysis, and the model is later used in the proposed sensor fusion framework.
The chapter also presents a framework for BP-based floor localization and studies
implementation of BA and DBA for floor localization. The performance analysis of BA
and DBA in floor localization over extensive measurements are provided in this chapter.
Chapter 4 studies RSS distribution in indoor environment and it is shown that Wi-Fi
RSS from plurality of APs can be approximated with log-normal distribution. This chapter
also briefly describes well-known RSS-based floor localization methods and formulates an
RSS-based MCBI framework for floor localization. The proposed method is tested against
two traditional RSS-based floor localization methods and the results are analyzed in this
chapter.
Chapter 5 focuses on the proposed sensor fusion framework, where a Kalman Filter
(KF) is utilized to fuse (combine) both Wi-Fi RSS and pressure readings for enhanced floor
localization. The implementation steps of the proposed algorithm are briefly described in
this chapter. Afterwards, performance of the proposed sensor fusion algorithm is analyzed
in comparison with BA-only, DBA-only, and RSS-only methods.
Chapter 6 concludes the dissertation and provides recommendations for future work.
Lastly, the appendices detail information relevant to the dissertation.
6
Chapter 2: Literature Review
2.1 Chapter Focus
This chapter briefly reviews recent and noteworthy received signal strength (RSS)-
based and barometric pressure (BP)-based methods that have been developed for floor
localization or are relevant to floor localization. In Section 2.2, previous works that
involved RSS-based localization are considered, and Section 2.3 summarizes the
significant research that used BP for height estimation or floor localization. Section 2.4
discusses the studies that exploited both RSS and BP for floor localization.
2.2 Prior Research Using RSS
Nowadays, a Wireless Local Area Network (WLAN) is deployed in almost all indoor
environments, such as shopping malls, museums, educational institution, apartment
buildings, office spaces, airports and so on. As a result, a large number of Wi-Fi access
points (APs) can be seen inside each building and RSS from those APs can be readily
utilized for indoor positioning without any additional infrastructure. The two well-known
approaches for RSS-based positioning are: 1) fingerprinting, and 2) RSS-based
multilateration techniques. In traditional fingerprint matching approach, a list is made with
RSS values from the APs at a known position, media access control (MAC) identification
numbers (IDs) of those APs, and the coordinate of that reference position. The list is termed
as ‘fingerprint’. Subsequently, a database is generated that contains many such fingerprints
from a set of selected reference positions and the database is termed as radio map. When a
user’s smartphone scans the Wi-Fi network, the measured RSS values from the scan will
be compared to the pre-stored values in the database and, based on that, the system will
estimate user position. Particle filtering is one the most popular signal processing methods
used in fingerprinting [24]. The set of steps involved in generating a fingerprint database
is commonly known as offline or training phase, and the set of steps involved in locating a
user is referred to as online phase.
RSS-based multilateration is the other popular RSS-based approach that utilizes the
well-known pathloss model for localization [25]. Using RSS values from APs, the model
7
estimates distances between a user and the APs. After that the estimated distances are used
by some positioning methods such as trilateration (where distances between the user and 3
APs are determined) to locate the user. Traditionally, in this approach, the locations or the
coordinates of APs are assumed to be known.
In this section, RSS-based research pertinent to floor localization is classified into
three categories. The first category includes studies that utilized larger grid sizes, i.e. fewer
areas to collect fingerprints, to reduce the size of the fingerprint database. Selection of
larger grid sizes for fingerprint collection results in smaller storage space (memory) on the
mobile device. As well, the signal processing in the online phase is faster than that of
traditional fingerprinting approach. The second category considers studies that were done
either to remove the offline phase from fingerprinting method or to introduce dynamic
fingerprinting to incorporate any changes in the fingerprints without manual recalibration.
Lastly, the studies that were performed to improve RSS-based positioning by incorporating
additional methods or information from various sensors, are classified under the third
category.
Under the first category, [20] pointed out that an intensive calibration is required to
ensure the quality of RSS-based positioning system. Also, the traditional fingerprinting
method will take complete recalibration to accommodate any changes in the Wi-Fi
infrastructure. To overcome those two disadvantages [20] designed two models, namely 1)
Nearest Floor algorithm, 2) Group Variance algorithm. Nearest Floor algorithm uses a
shortened fingerprint database that only contains the MAC IDs of APs, their corresponding
floor locations, and the maximum RSS obtained from the APs during the offline phase. To
make the fingerprint dynamic, when a new maximum RSS is obtained from an AP during
the online phase, the pre-stored maximum RSS against that AP is replaced with the new
maximum. Also, information about added or removed APs can also be incorporated in the
database. During the online phase, the collected RSS values from the APs are compared
with the maximum values stored in the database. Based on that comparison, closest 𝑘 APs
to the user are selected, where 𝑘 is a number defined by the network administrator. The
floor that is associated with those 𝑘 APs maximum number of times is selected as output
of the algorithm. The second proposed model, i.e. Group Variance algorithm, considers
8
three statistical parameters: variance of the Wi-Fi RSS readings, range of the Wi-Fi RSS
readings, and availability of APs. During the online phase of the Group Variance algorithm,
the visible APs from Wi-Fi network scans at a location are paired into groups according to
their associated floors. Subsequently, the weighted values of the three parameters
corresponding to each group are determined and later added, and the floor with the
maximum score is selected as the output of Group Variance algorithm. In the performed
experiment in [20], the Nearest Floor algorithm and the Group Variance algorithm
achieved 86% and 72% floor localization accuracy, respectively, where floor localization
accuracy is the ratio of correct to total floor estimates. The difference of the performance
was attributed to the construction materials of the buildings. Moreover, [20] stated that
Group Variance algorithm outperformed Nearest Floor algorithm in an environment where
strong signals were not available, e.g. washrooms, rooms far from APs etc.
[26] suggested a floor localization algorithm based on Bayesian posterior probability
and a fingerprint database that occupies less space than the traditional fingerprint database.
Rather than taking all APs into account to develop fingerprints, [26] considered the APs
which were accessible from at least two floors. Any APs from which the signals were
available from only one floor were discarded from the fingerprints. As a result, the new
database occupied less space. Nevertheless, the procedure of determining APs that are
accessible from multiple floors is labor intensive. During the online phase, the probabilities
of observing scanned APs on a specific floor were found. Based on RSS measurements,
specific weights were given to the probabilities. Later, corresponding to each floor, the
summation of the probabilities was found and the floor with maximum summation was
selected as the correct floor. To evaluate the performance, the proposed algorithm was
compared with the Nearest Floor algorithm [20]. For the performed experiments in [26],
the proposed algorithm achieved 80% floor localization accuracy on average; whereas, on
average the Nearest Floor algorithm obtained 65% floor localization accuracy.
In [27], an outlier filtering process was presented to remove any large sudden changes
in RSS values. For outlier filtering process, the collected RSS values from offline phase
were arranged in ascending order to determine 1st and 3rd quartiles. Using the 1st and 3rd
quartiles, two boundary limits were set, and any RSS values less than the lower limit and
9
higher than the upper limit were removed. In addition to the filtering process, standard
deviation (SD) of RSS values from all visible APs were exploited to select the most stable
APs for the detection process instead of using all APs. The APs that had RSS values with
lower SD were assigned as the stable APs, which means RSS from those APs were less
affected by multipath interference and, as a result, there were less variations in the RSS
values. The APs were sorted in an ascending manner based on their SD values and the top
𝑁 number APs were selected for the database. During online phase, popular fingerprint
matching method 𝑘-nearest neighbor (KNN) was applied for locating user. KNN first
calculates the Euclidean distance (ED) between the collected RSS values on current
location and the pre-stored RSS values at certain reference points with known coordinates.
ED is a rough measure of the distance between user and pre-stored known locations. The
algorithm selects 𝑘 number of reference points that give the smallest ED. An average of
coordinates of the 𝑘 reference points gives the user’s location.
[28] considered generating offline fingerprints with top 𝑁-APs from which the
strongest signals were received. During the localization phase, the system scanned the
network and found top 𝑁-APs that were transmitting the strongest signals. Subsequently,
by comparing the order of the APs (e.g. AP transmitting the strongest signal had
order/position 1 on the list) on the offline fingerprints with that of APs observed during
online scan, a score was given to each offline fingerprint. The floor associated with the
fingerprint with the maximum score was estimated as the smartphone floor location. The
proposed method in [28] showed to have 95% floor localization accuracy when top 11-APs
were considered.
Under the second category of the classification, [29] proposed a new floor
localization algorithm called sum-RSS floor algorithm, which does not require offline
calibration. To replace the need of offline calibration, 2-4 reference nodes (RNs), i.e.
wireless transceivers, were installed on each floor. During the online phase, data was
collected over 100 network scans to calculate and add average RSS values transmitted by
RNs installed on a specific floor. The floor associated with the maximum average RSS was
selected as the output of the algorithm. Performance of sum-RSS floor algorithm was
compared with that of Nearest Floor algorithm and Group Variance algorithm [20] and it
10
was shown that sum-RSS floor algorithm outperformed the other two techniques. Using
two and four RNs on each floor in a three-storey building, sum-RSS floor algorithm
achieved floor localization accuracy of 91.33% and 98.67%, respectively. In later work
[30, 31, 32] introduced the use of statistical properties (confidence interval) as a part of
previously suggested algorithm in [29]. After determining sum-RSS per floor, a 95%
confidence interval of each sum-RSS was calculated. The floor with the highest confidence
interval value indicated the user’s floor. Moreover, in [31], rather than using RSS from all
reference nodes, 50% of the RNs on each floor were selected from which the strongest
signal strengths were received in each scan of the network. In addition to that, in [32], the
experiments were performed to estimate user’s floor with fault-free and faulty RNs. The
RNs that worked properly during online phase was termed as fault-free RNs; whereas the
RNs that stopped working or failed during online phase were termed as faulty-RNs. In
scenarios with fault-free and faulty RNs, the floor localization accuracy was 100% and
95.1%, respectively. Note that the algorithms proposed in [29, 30, 31, 32] require new
infrastructure (i.e. installation of RNs) and network scans over a longer period to improve
floor localization accuracy. The high accuracy in [29, 30, 31, 32] can also be attributed to
the fact that the reference nodes were distributed on each floor such that the maximum and
uniform coverage was obtained from the RNs on each floor. Subsequently, the uniform
arrangement of RNs made it possible to place the two or four RNs in a way so that the RNs
approximately had the similar placement on each floor, which is not always the case in real
world. For a specific area of a floor, non-uniform placements of the RNs can result in
receiving the strongest signals from the RNs placed on adjacent floors, which will impact
the accuracy of the algorithms presented in [29, 30, 31, 32]. Furthermore, the detection
process for a single test point was based on 20-100 samples, which required a long time (1
minute for 20 samples [32]) for estimating user floor location; and so, this is not favorable
in real-time applications. Along with that, the number of selected test points (15 points in
[31, 32] and 50 points in [29, 30, 31, 32]) on each floor was not sufficient to reach a general
conclusion.
[33] described a trajectory learning mechanism that uses crowdsourcing for indoor
positioning when fingerprints of RSS and floor map are not available. Also, feature
extraction algorithm was included in [33] to reduce the size of the fingerprint. Linear
11
discriminant analysis (LDA) and principal component analysis (PCA) are the two feature
extraction techniques that were used in a combination in [33]. From the scanned RSS
measurements, PCA and LDA remove the elements that do not add any value to the
detection process, such as empty or meaningless RSS values due to APs from which no
signals are received at a location. PCA uses only the RSS measurements to extract the
essential data; whereas, LDA uses labeled information, i.e. RSS measurements associated
with a floor, a landmark, or a position. During the offline phase, [33] used primary RSS
measurements vector (observant vector) and a transformed vector with reduced
dimensionality of that observant vector to calculate a transformation matrix. Solving for
transformation matrix included an optimization problem and it was solved using LDA and
PCA. During the online phase, a transformed vector was found for each scan using the
transformation matrix found in the training phase. Subsequently, KNN algorithm [27] was
applied to the transformed vector (i.e. reduced observant vector) to estimate user floor
location.The proposed algorithm in [33] had an error of 2.2 meters on average, which lacks
the required accuracy for floor localization. Authors in [34] suggested a dynamic
adjustment in the RSS-fingerprint to remove the effect of APs’ transmitted power variation.
The transmission power can vary automatically to maintain the transmission quality in the
network. As an example, it was shown that during a performed experiment, the
transmission power of an AP decreased 3 dBm per hour over a 5 hours measurement period,
before it started re-transmitting with the expected power. To cancel out the effect of power
variation, [34] measured the RSS among APs along with traditional RSS-fingerprints
during the offline phase. During the online phase, when variation in RSS among APs was
detected, the information was incorporated into the floor localization algorithm. [34]
showed that dynamic adjustment algorithm helped to keep the regular position accuracy
stable under the transmitted power variation of the APs.
As stated earlier, the third category incorporates information from additional sensors
or other methods to improve RSS-based positioning. [3] proposed cooperative information
sharing between mobile nodes and integration of inertial measurement units (INS) with
RSS to improve indoor positioning. In cooperative sharing, the neighboring mobile nodes
share their RSS observables from APs along with range measurements between the nodes,
where the range is determined using RSS-based multilateration technique. Incorporating
12
cooperative sharing with RSS can significantly improve indoor positioning and it makes it
possible to design a localization system with a small number of reference nodes even in
large-scale environment. Additionally, [3] used measurements from INS as prior
information to further improve the accuracy of location estimation. In [25], authors utilized
M-estimator, which is a generalization of maximum likelihood (ML) estimation, to make
four existing approaches based on RSS more robust. The four approaches were: weighted
centroid localization (WCL), linear and non-linear trilateration, and deconvolution-based
approach. In WCL approach, the location of smartphone is estimated as the weighted
average of the distances between smartphone and APs. Non-linear trilateration approach
considers minimizing a square function based on RSS values and distances between
smartphone and APs. Whereas, to estimate smartphone location, linear trilateration
technique uses a least square method to solve for linear equations based on distances
between APs and smartphone as well as distances between two APs. The deconvolution-
based approach uses methods such as least squares, weighted least squares, mean square
error to estimate smartphone location based on RSS pathloss model. [25] showed that using
regular WCL, NLT, and deconvolution-based approach the floor localization accuracies
were 85%, 73.3%, and 66.5%, respectively. When the robust version of WCL, NLT, and
deconvolution-based approach was used, the floor localization accuracies increased to
85.8%, 75.6%, and 68.3%, respectively.
[35] proposed a Wi-Fi aided pedestrian dead reckoning algorithm for indoor
localization. The algorithm in [35] used inertial measurement unit (IMUs) to determine the
maximum and the minimum acceleration over a sliding window and compare the difference
of those values to a threshold to identify pedestrian’s activities such as standing, walking,
or taking stairs. In addition, [35] used the change in RSS values from the APs to determine
any movement between floors. [35] showed that 70% of the distance errors for the proposed
algorithm were less than 1 meter. Note that the results in [35] were not based on extensive
measurements, and [35] assumed access to some information, e.g. height of stairs, slant
angle of stairway, which are not conveniently available when considering practical
scenarios. In another study, [36] combined RSS fingerprint and magnetic field fingerprints
to improve the accuracy of indoor positioning. Stairs and elevators were defined as
landmarks and accelerometer was used to detect when someone was in vicinity of these
13
landmarks. [36] showed that the use of landmarks along with the RSS and magnetic field
fingerprints improved localization accuracy.
[37] introduced a sequential approach to RSS-based positioning that uses a Bayesian
metric to find the likelihood of a particular path. During the offline phase, fingerprints were
collected at some certain reference points, and during online phase, KNN algorithm was
used to determine the probability of a user being on a particular location conditioned on a
time series of RSS observations. [37] showed that increasing the length of the series of RSS
observation increased the probability of correct path estimation and reduced the average
distance error. Average distance error represented the distance between true location of the
user and the estimated location by the system. The experimental result in [37] showed a
probability of correct path estimation of larger than 97% and average distance error of less
than 0.1 meter. The average distance error determined in [37] using RSS is unusual in RSS-
based positioning techniques. In [38], it was shown that the level of accuracy that can be
achieved using methods based on signal patterns along the trajectory (known as Temporal
patterns) is less than 2 or 1.8 (based on which methods are used) meters. The rationale
behind the high correct location estimation accuracy in [37] can be that the experiment was
conducted only on a hallway of a single floor and only 18 locations were selected for
measurements during the online phase. The locations were also really close to each other
(1 meter apart) and 10 online measurements were drawn from each location which
mitigated the multipath effect. Moreover, multi-story building introduces some challenges
in location estimation, which was not considered in [37]. Also, [38] stated that the
positioning becomes difficult if the user moves faster or in different directions; these
scenarios were not exploited in [37]. Moreover, the conclusion about the accuracy was
based on only 100 realizations, which is not sufficient.
2.3 Prior Research Using BP
The inclusion of BP sensors (i.e. barometers) in modern gadgets (smartphone,
smartwatches etc.) has augmented the interest of using barometers in the field of indoor
positioning. Pressure measurements from barometer can be converted to equivalent height,
which subsequently is used for floor localization. Many recent studies have been done
using pressure sensors for height measurements and floor localization. Researchers either
14
used measurements from a single pressure sensor or from two pressure sensors for the
conducted studies. Use of a single barometer for height measurements is known as
barometric altimetry (BA). Whereas, differential barometric altimetry (DBA) uses a
barometer specifically as reference and another barometer as a roaming node to measure
the relative height between those two sensors.
In [39], barometer was deployed for BA and it was shown that pressure drift is
observed during data collection due to changes in the local environment, e.g. influence of
wind, air-conditioning system etc. [39] suggested using height observation from GPS or
returning to a point (with known height) inside a building to calibrate for pressure drift. A
linear characteristic curve was derived to determine relative change in height for a given
change in pressure. Based on a 6 minutes measurement set, it was shown that 91% of the
time floor transitions could be detected with an error of less than 1 m and it was concluded
that the error could change depending on the time of the day the measurements were taken.
[40] worked with different barometer models to verify whether those sensors could
be used to accurately detect changes in heights and transportation modes (e.g. elevator,
escalator or stairs). Three parameters, i.e. difference in BP measurements, the rate of
change of BP, and transition time to move between floors, were considered to determine
exact number of floor changes and the transportation mode used by the smartphone user.
Transportation mode was detected with 100% accuracy when both rate of change of BP
and transition time were considered. To accurately detect the transportation mode, [40]
assumed that the required time to change a floor was different for different transportation
modes. Apart from detecting transportation modes, [40] used BA to determine floor
changes and it showed 100% localization accuracy when the user moved just one floor up
or down. For other scenarios, the accuracy of correct detection of exact number of floor
movement dropped to 60% because the time required to move between floors was same
for different transportation modes. In comparison, [40] showed that accelerometers
embedded inside smartphones achieved 40% accuracy in determining mode of
transportation and 50% accuracy in detecting a floor change. Also, it was mentioned that
barometers consume 3-23% less power than accelerometers do. Moreover, [40]
demonstrated that the value of absolute pressure measured by barometers embedded inside
15
smartphones varies throughout the day because of changes in diurnal temperature and
weather. In addition, [40] showed that the pressure readings measured at a fixed location
varies over different models of smart-phones. Even the same models of smart-phone can
provide different measurement readings while measuring BP from the same place. For
example, during pressure measurements with two Googly Galaxy Nexus, a pressure
difference of 1.2 hPa, which is equivalent to height difference of 10 m, was observed in
[40].
[15] illustrated that environmental factors (closing or opening doors in a room,
ventilation system, and weather conditions) greatly impacts the pressure readings of a
single barometer. Fortunately, differential pressure sensing process in DBA compensates
that effect as both reference and rover barometers are influenced by similar change in the
environment. As such, [15] suggested the use of DBA to accurately measure height
difference (estimation within centimeter range) for medical application, such as
determining body orientation of a patient who needs intensive care. To estimate the height,
[15] used a barometric equation that considers density of air (which depends on
temperature and humidity) and showed that the pressure measurements were not
significantly influenced by humidity and temperature. A maximum error of 17 cm was seen
for a 20° C variation in the temperature; whereas, only 1 cm of maximum error was
observed for 10-90% variation in the humidity. Additionally, [15] suggested the use of
moving average filter to smooth the measured raw readings and to give a better precision.
However, moving average filter adds delay to the localization phase and it was shown that
a moving average filter with order 60 (i.e. averaging over 60 samples) added a lag of 4
seconds. Based on a 35 seconds measurement, [15] demonstrated 4.2% height estimation
error.
In [41], the suggestion of using multiple reference barometers was given. Reference
barometers were placed on each floor inside a building to measure real-time pressure
readings at each level. Afterwards, the measured pressure readings were uploaded to a
server to make a real-time pressure map. Pressure reading from user smartphone was
compared with the measurement stored in the pressure map to determine user floor
location. Note that offset calibrations were performed for all the barometers involved in
16
the measurements. The achieved floor localization accuracy for the conducted
measurements in [41] varied from 88% to 99%. [41] also demonstrated small improvement
in floor localization by taking averages over multiple samples, which averaged out the
fluctuations in the measurements. For instance, floor localization accuracy improved from
95.65% to 96.06% when 5 seconds time window was considered for decision making
instead of 1 second window.
Similar to [41], [42] and [43] considered generating pressure map (i.e. pressure
fingerprints) of each floor inside a building. Unlike [41], [42] and [43] used crowdsourcing
to form the pressure map. This map was updated in a timely basis and uploaded to cloud
server. The measured pressure values by the user smartphones were clustered with a
specific time stamp and if changes in pressure was observed on a floor, then all pressure
values on other floors were updated as well. The fact that the pressure difference between
two floors does not change over time - was considered in map updating process. The
pressure map generating and updating process required calibration among smartphones and
it was performed when users shared the elevator to a certain floor. For localizing a user,
user smartphone was required to download the calibration information and the pressure
map from the cloud through an app. Subsequently, the readings from barometer embedded
in user smartphone was used by the app to determine user floor location by comparing the
real-time measurements with the pressure readings from the pressure map. Both field
experiments and simulation were done by [42] and [43] to observe the efficiency of the
proposed localization system. The system achieved 98% floor localization accuracy when
calibration among smartphones was possible and 70% floor localization accuracy when
calibration could not be done (e.g. at the beginning of a day, when there are not sufficient
users inside a building).
In [44], a self-adapting method was introduced that detected any pressure drift due
to environment and made correction to the measurements for estimating user floor location.
The proposed method in [44] had two stages: recognition and correction. In the recognition
stage, a window containing most recent pressure measurements was considered to
determine an average pressure. Subsequently, difference between the average pressure and
the current measurement was determined, which was then compared with a threshold to
17
decide whether the change in pressure was related to environment or floor transitions. The
threshold depended on the maximum and the minimum pressure readings in the selected
window. When a pressure change due to environment was detected, the initial measurement
after the last floor transition was compared with the most recent reading to calculate the
pressure offset, which was used in pressure drift correction. [44] also integrated a beacon
system that transmitted pressure readings measured by a reference barometer at a certain
interval. Any user terminal (i.e. smartphone) receiving the signal transmitted by the beacon,
if needed, would make appropriate changes to the measurements. For the performed
measurements, [44] achieved floor localization accuracy between 85%-95%.
In [19], the researchers combined DBA and measurements from accelerometer using
a complementary filter to estimate height. DBA was used to remove the drift error observed
in BA and measurements from the accelerometer were used to mitigate the stochastic error
(i.e. high-frequency random noise) in pressure measurements. Low-pass filter and high-
pass filter were used to reduce the stochastic error in DBA and accelerometer output,
respectively. [19] showed that using the proposed method a standard deviation of 0.0679
meter was achieved in the output compared to the original 0.4661 meter. [45] compared
the results that were found using DBA and BA to estimate relative height. For using DBA,
the offset between the sensors was removed by initially placing both reference and rover
barometers at the same height. For the performed experiments in [45], BA and DBA
resulted in 41.49% and 12.76%, respectively, height estimation error. [45] also discussed
how at different pressure levels the differential pressure measurements (i.e. the outcome of
differencing operation in DBA) could change in a nonlinear way and it was concluded that
deviation in the measurements occurred due to dissimilarities in sensors’ pressure-response
curves. For example, it was shown that a pressure change of 0.06 bar or 60 hPa resulted in
a deviation of 160 μbar or 0.16 hPa in differential pressure measurements, which is
equivalent to a height error of 1.35 meters. Based on observation, [45] concluded that a
one-time calibration of reference and rover barometers might show some measurement
error over time.
18
2.4 Prior Research Using Both RSS and BP
In recent years, few studies have been conducted where both RSS and BP were used
for indoor positioning. Using both techniques simultaneously, the individual drawbacks of
both methods are compensated. [2] introduced a hybrid approach that utilized Wi-Fi RSS
and BP readings for floor localization. Initially [2] formulated a Bayesian classification-
based floor identification (BCFI) algorithm that generated Wi-Fi RSS fingerprints and then
used the fingerprints to determine user floor location based on the probability of being
located on a floor. [2] also demonstrated a barometric pressure-based floor identification
(BPFI) algorithm that created an altitude-based floor map from the initial BP measurement
and initial floor number given as an input by the user. Self-calibration in BPFI was done
based on detecting the magnitude of change in pressure over time. If the pressure changed
more than a specified threshold after a certain identification period (15 seconds), then a
change in floor level was detected. Otherwise, a slow change in pressure was detected and
the floor map was updated based on the last measurement. BPFI could not detect floor
transition when a user changed the floor at a very slow speed; and there was a delay in
detection through BPFI because of the identification period. The suggested hybrid
approach combined BPFI with BCFI, which removed the necessity of providing the initial
floor number as a manual input and could detect change in floors even when the user was
moving at slow speed. In hybrid approach, BPFI was initialized and calibrated only when
a floor identification from BCFI was obtained with high probability. It was not possible to
identify floors with high probability using BCFI in an area with hollow interiors. [2]
showed 96.1% floor localization accuracy using hybrid approach over a 20 minutes
measurement set.
In [21], fingerprints comprising RSS and BP readings were stored in a server through
crowdsourcing as a training dataset. The pressure measurements among multiple
smartphones from the training dataset were compared to a pre-determined value to identify
smartphone floor locations and consequently corresponding collected RSS fingerprints
were assigned to specific floors. Later, in localization phase, RSS measured by user
smartphone were sent to the server and compared with the training dataset to determine
user floor location. The method mentioned in [21] achieved more than 90% floor
19
localization accuracy; however, it is computationally complex because it required
integration of crowdsourcing, comparison of RSS fingerprints, and calibration among
barometers of different smarphones.
In [23], researchers used RSS-based radio propagation model with ML estimation to
identify correct floor location. The ML estimation was based on maximizing the RSS
measurement obtained from access points on each floor. Further, barometer was combined
with the RSS-based approach so that the system could perform well even when the signal
strength was poor or not enough APs were visible through Wi-Fi scans. The barometer
measured the pressure, from which relative altitude changes and consequently vertical
velocity was found through differentiation. Afterwards, the vertical velocity was compared
with a threshold to detect any floor transitions. If it was detected that the user was using
stairs or elevator, the algorithm would show the last detected floor using RSS as output
until user reached the new floor. Over a minute lasting measurement, the proposed
algorithm achieved more than 99% floor localization accuracy. The suggested method in
[23] used ML framework, which is prone to singularities for problems involving Gaussian
mixtures such as Wi-Fi RSS observables inside buildings. Also, performance analysis over
extensive measurements was not carried out.
[46] demonstrated a technique that utilized both RSS-based fingerprint matching
method and barometric pressure for 3-D localization. In the experiment, the technique used
two filter windows in time domain for processing height measurements based on barometer
readings. The first window considered the current samples for measuring average of
measured heights. The second window used past measurement samples to calculate an
average height. Subsequently, the difference between the two average heights was
compared with a threshold to detect floor transitions. When a floor transition was detected,
the total change in floor numbers was found assuming building height information was
available. The RSS measurements were used to determine user’s initial floor location and
to find the (x, y) coordinates. Assuming all the floors of a building have the same height,
the researchers detected the floor for the experiment with 0 false floor detection. The
limitation of the technique used in [46] is that the technique falsely assumed same height
difference between any two floors of a building. Also, the technique did not consider the
20
scenarios where a user may make slow or fast transitions between floors. The value of
involved parameters, such as length of the filter windows, time difference between the two
windows, threshold etc., can vary depending on buildings.
[47] considered a crowdsourcing algorithm that used inertial measurement units
(IMUs), RSS from Wi-Fi access points and BP for indoor positioning. Information from
the users’ walking trajectory was collected by a server that included readings from IMUs
and barometer, and Wi-Fi RSS at each step of the user. Afterwards, the server compared
and matched the information obtained from the users and then clustered that information
to create a floor plan. In the algorithm, no previous knowledge about the environment was
needed and the floor map and radio map were auto updated through crowdsourcing.
However, periodically the users were required to give their locations as an input to the
algorithm. Moreover, the proposed process in [47] required the server to continuously do
complicated computation and the algorithm did not consider an open space building
structure. [47] showed an accuracy of 1~3 meters in positioning along with 98% average
accuracy in floor transition detection.
The proposed method in [48] had two stages for floor localization with. In the first
stage, RSS-fingerprint based method, such as weighted KNN algorithm, was utilized to
identify the floor. The suggested weighted KNN was similar to ordinary KNN [27]
algorithm, except a weight value was given to the obtained RSS based on their values. In
the second stage, [48] measured change in pressure after every certain number of steps to
detect any movement between floors. Change in pressure was measured by using barometer
and number of steps were measured using accelerometer. Based on a single experiment,
[48] showed an accuracy of 97% in detecting floor changes and 99% in identifying the
proper floor. Note that during the measurement, only 2 floors with 301 reference points
were selected for the training phase.
[4] proposed a method using Bluetooth Low Energy (BLE) RSS and BA for floor
localization. The method required installation of BLE beacons and a server capable of
continuous real-time information processing. According to the method, when access to
BLE beacons with known coordinates was available, the measured pressure by a
smartphone was stored in the server as reference atmosphere pressure, which was updated
21
periodically when the same smartphone had access to the beacons again. During
localization, the measured BP was compared with the reference atmosphere reference
corresponding to each floor to determine smartphone floor location. Moreover, calibration
among smartphones was performed when multiple smartphones were in vicinity of the
same BLE beacon and measurement from one of the smartphones was considered as
reference for calibration. The pressure difference between adjacent floors was determined
when calibrated smartphones detected installed BLE beacons on two different floors. [4]
showed a floor localization accuracy of 91% over a measurement of 23 minutes.
2.5 Relationship between the Thesis and Previous Works
The prior works that considered both RSS and BP readings for floor localization are
rather heuristic and failed to formulate a theoretical framework for combining both
readings. As well, performance of the previously proposed methods was analyzed over
short time periods and/or based on limited measurements. In addition, prior works were
computationally complex due to integration of various factors, such as crowdsourcing,
barometer calibrations, RSS fingerprints comparison etc. This thesis proposes a sensor
fusion algorithm (see Chapter 5 for details) that not only provides a theoretical framework
for Wi-Fi RSS and BP (more specifically BA) fusion, but also has high floor localization
accuracy under different experimental conditions. The proposed method uses a Kalman
filter (KF) to predict the drift (i.e. the slowly varying mean) in BA using a prediction model
introduced in Chapter 3. Correction to the prediction is performed when access to Wi-Fi
RSS is available using an RSS-based Monte Carlo Bayesian Inference (MCBI) framework
formulated in Chapter 4. As will be shown, both RSS and BA-based techniques for floor
localization will be used as an integrated part of the sensor fusion framework. Unlike prior
fusion methods, the performance analysis of the proposed method (provided in Chapter 5)
along with BA-only, DBA-only, and RSS-only methods (detailed in Chapter 3 and Chapter
4) was performed over extensive measurements.
22
Chapter 3: Floor Localization Using
Barometric Pressure
3.1 Introduction
It is well known that atmospheric pressure varies with altitude. Barometric pressure
(BP) sensors have long been used by hikers and climbers, and Micro-electro-mechanical-
systems (MEMS) barometers, i.e. BP sensors, are highly integrated into positioning
systems for altitude measurements. The integration of MEMS BP sensor in state-of-the-art
handheld devices, such as smartphones (e.g., Samsung S4/S8/note 2/3/4/8, iPhone 6/7/8/X,
Xiaomi 2/3/4/5, Google Pixel 2, etc.) and smartwatches, has prompted a surge in its use in
indoor positioning system (IPS). One simplified model for converting atmospheric pressure
measurements to height is given by [2]:
where ℎ𝑚 is the calculated height with reference to sea level, 𝒫 is the BP measured by the
sensor, and 𝒫𝑜 is the pressure at sea level, which is 1013.25 hPa or 101325 Pa. Up until
now researchers have studied the use of single BP sensor for barometric altimetry (BA)
and multiple BP sensors for differential barometric altimetry (DBA) to detect smartphone
user floor location. Floor localization system using BA and DBA both have their
advantages and disadvantages that need to be considered before implementing the system.
BA can be readily implemented with the smartphones of current vintage; however, BA is
prone to drift errors due to local changes in the air pressure. Whereas, DBA can provide
with required floor localization accuracy, but additional infrastructures need to be installed.
The objective of this chapter is to briefly discuss use of barometer in floor
localization, and compare performance of BA and DBA in floor localizatoin. The rest of
the chapter is organized as follows. In Section 3.2, MEMS barometer measurement model
is developed using Allan deviation (ADEV). Section 3.3 describes a maximum a posteriori
(MAP) classifier based on minimum probability of error criteria for floor localization using
BP. Section 3.4 details the equipment and environments selected for conducting
ℎ𝑚 = 44330 × (1 −𝒫
𝒫𝑜)
15.255
(3.1)
23
measurements. Descriptions and results of floor localization using BA and DBA are given
in Section 3.5 and Section 3.6, respectively. Finally, Section 3.7 summarizes this chapter.
3.2 MEMS Barometer Measurement Model
While (3.1) provides a direct mapping between the measured pressure 𝒫 and height
ℎ𝑚, local air pressure is significantly influenced by unknown disturbances such as
approaching high/low pressure weather systems, air-conditioning, wind, temperature, etc.,
resulting in large height estimation errors. For accurate floor localization using MEMS BP
sensors, the measurement errors must be modeled and accounted for.
In [11] BP-based height estimation errors are categorized into three groups: bias
error, drift error, and drift-rate. [49] proposed a different error model, where the drift error
is modeled as a first order Random Walk (RW). Others, e.g. [2], simply treat BP-based
height estimation error as a single unknown error term which needs to be estimated and
removed from each measurement snapshot. While most of the previously proposed error
models may be valid for certain datasets, to the best of author’s knowledge those conditions
are not properly discussed and understood. In this section, the underlying random processes
that influence the BP-based height estimation errors are characterized.
Let ∆ℎ denote the height error due to a plurality of factors such as approaching
high/low pressure systems, air conditioning, factory calibration (or the lack of), etc. such
that
where ℎ̃ is the measured height, relative to a local reference point, e.g. first floor of a
building calculated from a MEMS BP sensor output, and ℎ denotes the correct height
relative to the same reference point (e.g. from surveying). The variables ∆ℎ, ℎ and ℎ̃ are
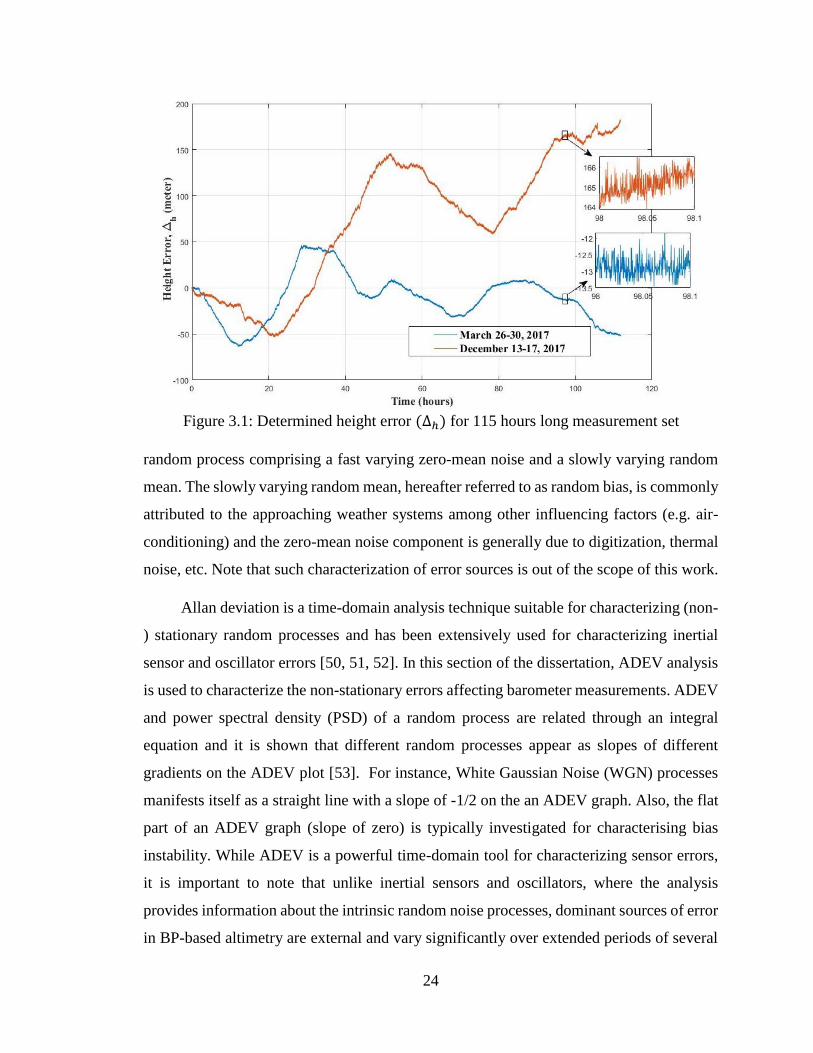
time-varying random processes. Figure 3.1 shows ∆ℎ for two set of measurements made
over two separate 115 hours long periods using a BMP180 barometric pressure sensor.
During the measurements, the sensor(s) under test (SUT) was kept at a fixed position inside
an office building that was subject to climate control pressure changes and data was
captured at 1 second intervals. As evident from this Figure 3.1, ∆ℎ is a non- stationary
ℎ̃ = ℎ + ∆ℎ (3.2)
24
random process comprising a fast varying zero-mean noise and a slowly varying random
mean. The slowly varying random mean, hereafter referred to as random bias, is commonly
attributed to the approaching weather systems among other influencing factors (e.g. air-
conditioning) and the zero-mean noise component is generally due to digitization, thermal
noise, etc. Note that such characterization of error sources is out of the scope of this work.
Allan deviation is a time-domain analysis technique suitable for characterizing (non-
) stationary random processes and has been extensively used for characterizing inertial
sensor and oscillator errors [50, 51, 52]. In this section of the dissertation, ADEV analysis
is used to characterize the non-stationary errors affecting barometer measurements. ADEV
and power spectral density (PSD) of a random process are related through an integral
equation and it is shown that different random processes appear as slopes of different
gradients on the ADEV plot [53]. For instance, White Gaussian Noise (WGN) processes
manifests itself as a straight line with a slope of -1/2 on the an ADEV graph. Also, the flat
part of an ADEV graph (slope of zero) is typically investigated for characterising bias
instability. While ADEV is a powerful time-domain tool for characterizing sensor errors,
it is important to note that unlike inertial sensors and oscillators, where the analysis
provides information about the intrinsic random noise processes, dominant sources of error
in BP-based altimetry are external and vary significantly over extended periods of several
Figure 3.1: Determined height error (∆ℎ) for 115 hours long measurement set
25
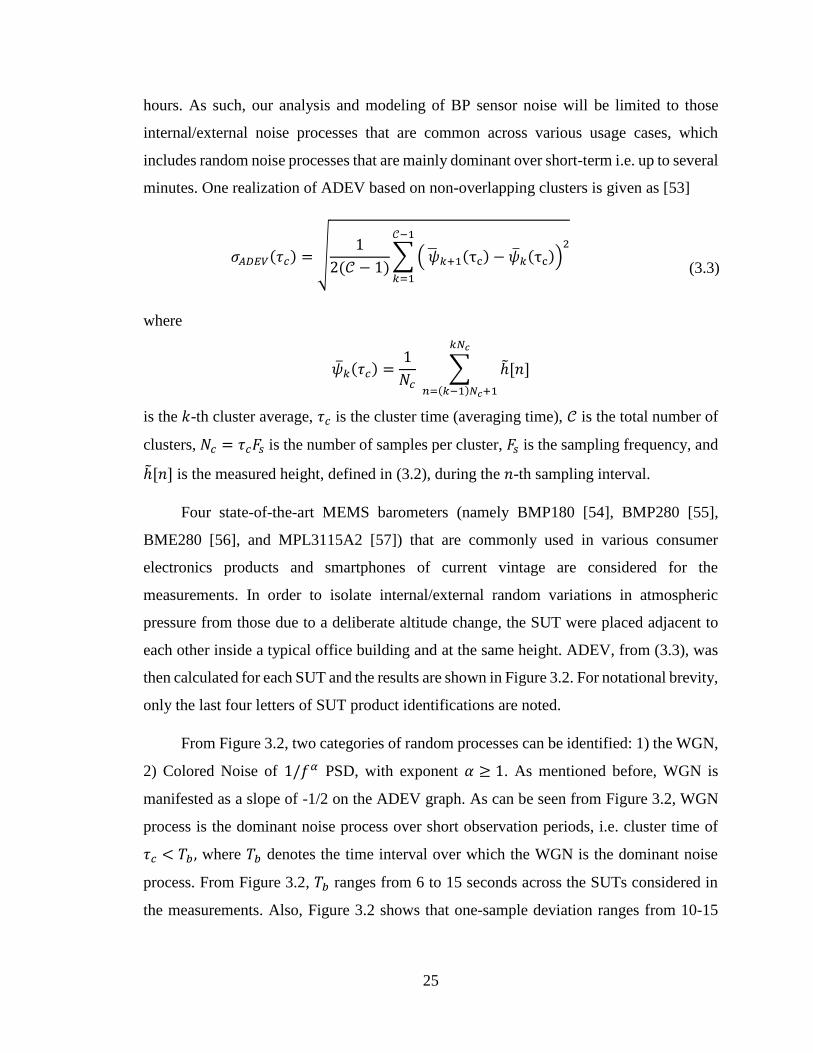
hours. As such, our analysis and modeling of BP sensor noise will be limited to those
internal/external noise processes that are common across various usage cases, which
includes random noise processes that are mainly dominant over short-term i.e. up to several
minutes. One realization of ADEV based on non-overlapping clusters is given as [53]
𝜎𝐴𝐷𝐸𝑉(𝜏𝑐) = √1
2(𝒞 − 1)∑ ( �̅�𝑘+1(τc) − �̅�𝑘(τc))
2𝒞−1
𝑘=1
(3.3)
where
�̅�𝑘(𝜏𝑐) =1
𝑁𝑐 ∑ ℎ̃[𝑛]
𝑘𝑁𝑐
𝑛=(𝑘−1)𝑁𝑐+1
is the 𝑘-th cluster average, 𝜏𝑐 is the cluster time (averaging time), 𝒞 is the total number of
clusters, 𝑁𝑐 = 𝜏𝑐𝐹𝑠 is the number of samples per cluster, 𝐹𝑠 is the sampling frequency, and
ℎ̃[𝑛] is the measured height, defined in (3.2), during the 𝑛-th sampling interval.
Four state-of-the-art MEMS barometers (namely BMP180 [54], BMP280 [55],
BME280 [56], and MPL3115A2 [57]) that are commonly used in various consumer
electronics products and smartphones of current vintage are considered for the
measurements. In order to isolate internal/external random variations in atmospheric
pressure from those due to a deliberate altitude change, the SUT were placed adjacent to
each other inside a typical office building and at the same height. ADEV, from (3.3), was
then calculated for each SUT and the results are shown in Figure 3.2. For notational brevity,
only the last four letters of SUT product identifications are noted.
From Figure 3.2, two categories of random processes can be identified: 1) the WGN,
2) Colored Noise of 1/𝑓𝛼 PSD, with exponent 𝛼 ≥ 1. As mentioned before, WGN is
manifested as a slope of -1/2 on the ADEV graph. As can be seen from Figure 3.2, WGN
process is the dominant noise process over short observation periods, i.e. cluster time of
𝜏𝑐 < 𝑇𝑏 , where 𝑇𝑏 denotes the time interval over which the WGN is the dominant noise
process. From Figure 3.2, 𝑇𝑏 ranges from 6 to 15 seconds across the SUTs considered in
the measurements. Also, Figure 3.2 shows that one-sample deviation ranges from 10-15
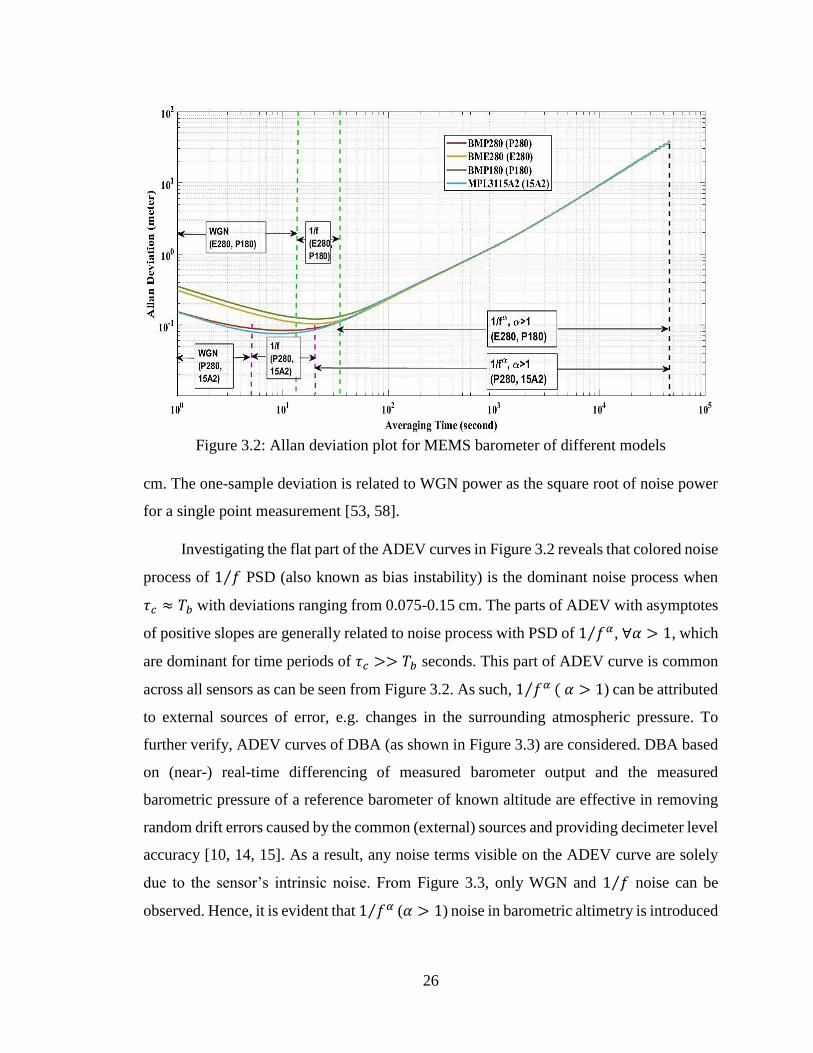
26
cm. The one-sample deviation is related to WGN power as the square root of noise power
for a single point measurement [53, 58].
Investigating the flat part of the ADEV curves in Figure 3.2 reveals that colored noise
process of 1 𝑓⁄ PSD (also known as bias instability) is the dominant noise process when
𝜏𝑐 ≈ 𝑇𝑏 with deviations ranging from 0.075-0.15 cm. The parts of ADEV with asymptotes
of positive slopes are generally related to noise process with PSD of 1 𝑓𝛼⁄ , ∀𝛼 > 1, which
are dominant for time periods of 𝜏𝑐 >> 𝑇𝑏 seconds. This part of ADEV curve is common
across all sensors as can be seen from Figure 3.2. As such, 1 𝑓𝛼⁄ ( 𝛼 > 1) can be attributed
to external sources of error, e.g. changes in the surrounding atmospheric pressure. To
further verify, ADEV curves of DBA (as shown in Figure 3.3) are considered. DBA based
on (near-) real-time differencing of measured barometer output and the measured
barometric pressure of a reference barometer of known altitude are effective in removing
random drift errors caused by the common (external) sources and providing decimeter level
accuracy [10, 14, 15]. As a result, any noise terms visible on the ADEV curve are solely
due to the sensor’s intrinsic noise. From Figure 3.3, only WGN and 1 𝑓⁄ noise can be
observed. Hence, it is evident that 1 𝑓𝛼⁄ (𝛼 > 1) noise in barometric altimetry is introduced
Figure 3.2: Allan deviation plot for MEMS barometer of different models
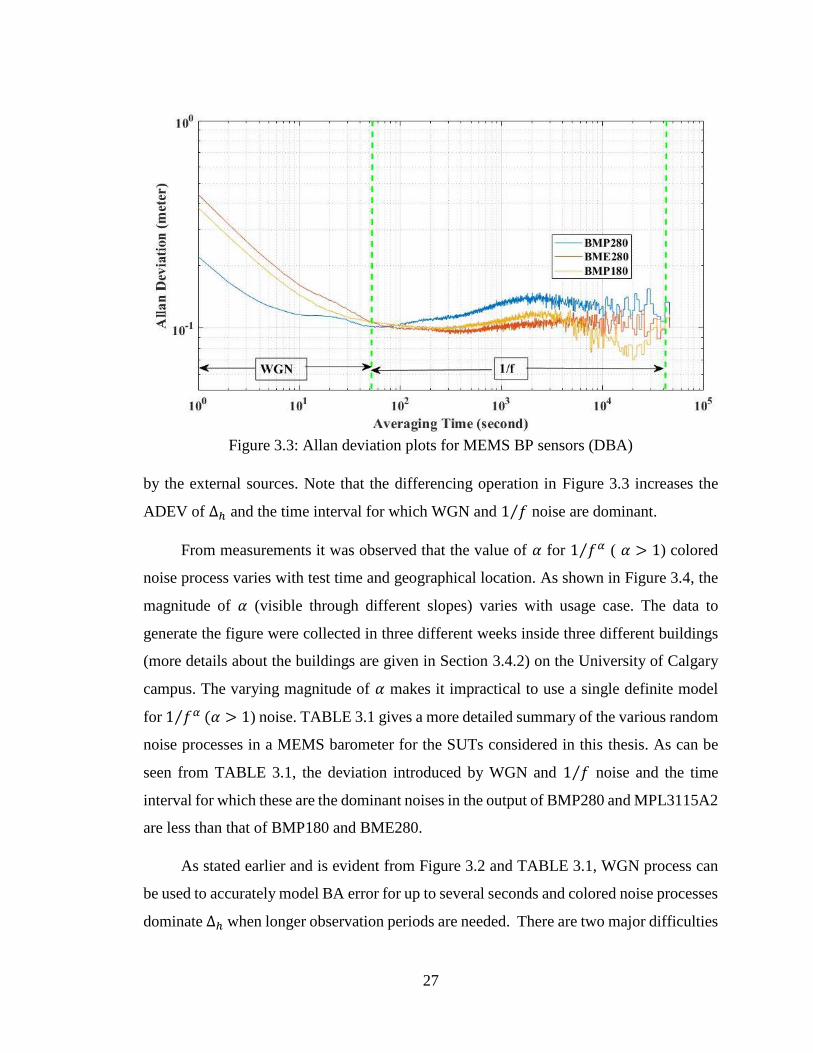
27
by the external sources. Note that the differencing operation in Figure 3.3 increases the
ADEV of ∆ℎ and the time interval for which WGN and 1 𝑓⁄ noise are dominant.
From measurements it was observed that the value of 𝛼 for 1 𝑓𝛼⁄ ( 𝛼 > 1) colored
noise process varies with test time and geographical location. As shown in Figure 3.4, the
magnitude of 𝛼 (visible through different slopes) varies with usage case. The data to
generate the figure were collected in three different weeks inside three different buildings
(more details about the buildings are given in Section 3.4.2) on the University of Calgary
campus. The varying magnitude of 𝛼 makes it impractical to use a single definite model
for 1 𝑓𝛼⁄ (𝛼 > 1) noise. TABLE 3.1 gives a more detailed summary of the various random
noise processes in a MEMS barometer for the SUTs considered in this thesis. As can be
seen from TABLE 3.1, the deviation introduced by WGN and 1 𝑓⁄ noise and the time
interval for which these are the dominant noises in the output of BMP280 and MPL3115A2
are less than that of BMP180 and BME280.
As stated earlier and is evident from Figure 3.2 and TABLE 3.1, WGN process can
be used to accurately model BA error for up to several seconds and colored noise processes
dominate ∆ℎ when longer observation periods are needed. There are two major difficulties
Figure 3.3: Allan deviation plots for MEMS BP sensors (DBA)
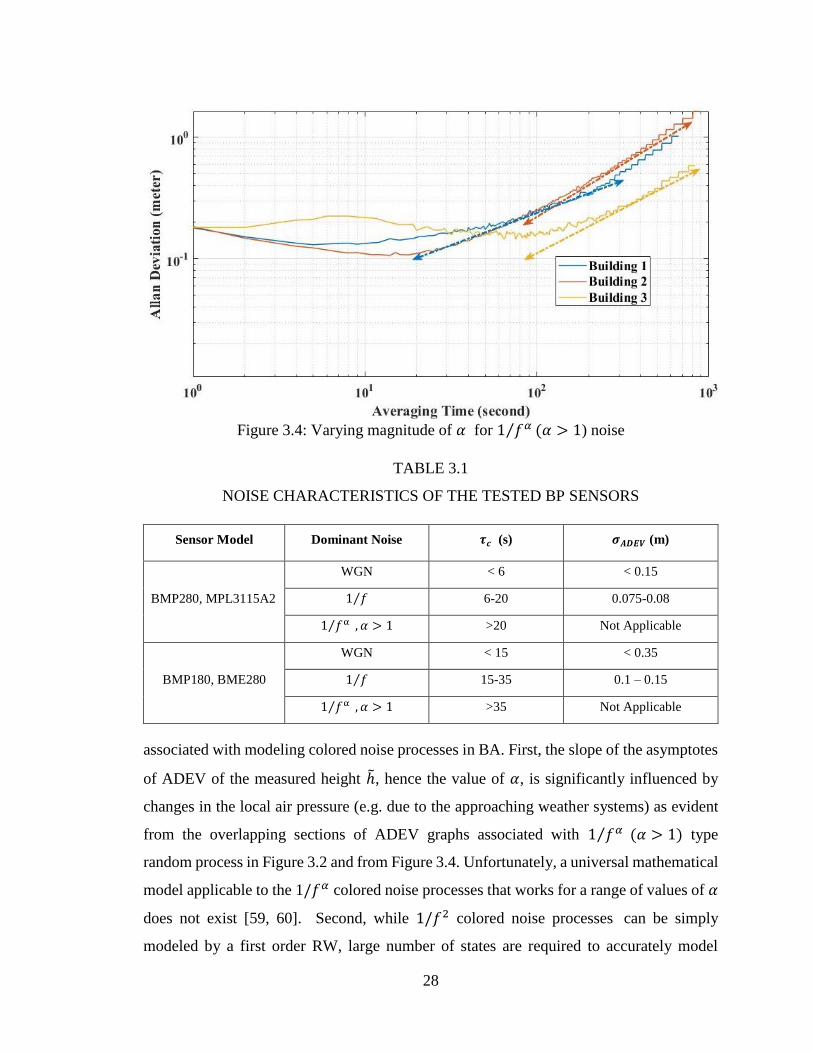
28
TABLE 3.1
NOISE CHARACTERISTICS OF THE TESTED BP SENSORS
Sensor Model Dominant Noise 𝝉𝒄 (s) 𝝈𝑨𝑫𝑬𝑽 (m)
BMP280, MPL3115A2
WGN < 6 < 0.15
1 𝑓⁄ 6-20 0.075-0.08
1 𝑓α⁄ , 𝛼 > 1 >20 Not Applicable
BMP180, BME280
WGN < 15 < 0.35
1 𝑓⁄ 15-35 0.1 – 0.15
1 𝑓α⁄ , 𝛼 > 1 >35 Not Applicable
associated with modeling colored noise processes in BA. First, the slope of the asymptotes
of ADEV of the measured height ℎ̃, hence the value of 𝛼, is significantly influenced by
changes in the local air pressure (e.g. due to the approaching weather systems) as evident
from the overlapping sections of ADEV graphs associated with 1 𝑓𝛼⁄ (𝛼 > 1) type
random process in Figure 3.2 and from Figure 3.4. Unfortunately, a universal mathematical
model applicable to the 1/𝑓𝛼 colored noise processes that works for a range of values of 𝛼
does not exist [59, 60]. Second, while 1/𝑓2 colored noise processes can be simply
modeled by a first order RW, large number of states are required to accurately model
Figure 3.4: Varying magnitude of 𝛼 for 1 𝑓𝛼⁄ (𝛼 > 1) noise
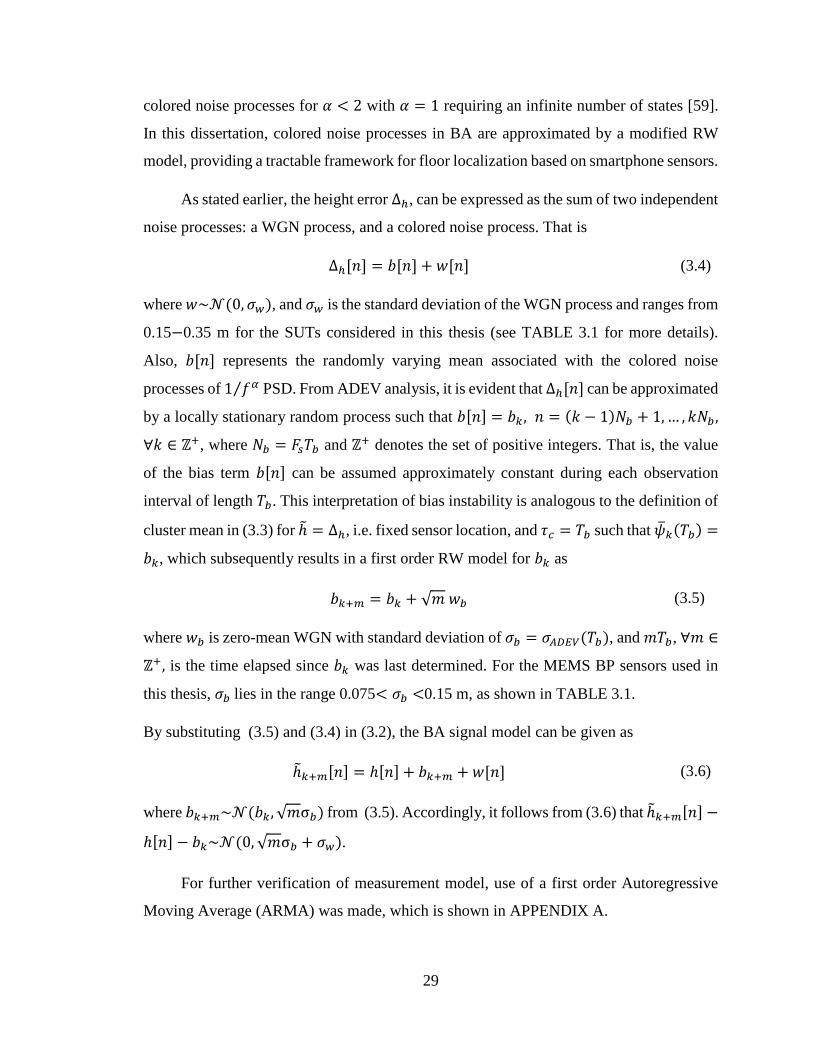
29
colored noise processes for 𝛼 < 2 with 𝛼 = 1 requiring an infinite number of states [59].
In this dissertation, colored noise processes in BA are approximated by a modified RW
model, providing a tractable framework for floor localization based on smartphone sensors.
As stated earlier, the height error ∆ℎ, can be expressed as the sum of two independent
noise processes: a WGN process, and a colored noise process. That is
∆ℎ[𝑛] = 𝑏[𝑛] + 𝑤[𝑛] (3.4)
where 𝑤~𝒩(0, 𝜎𝑤), and 𝜎𝑤 is the standard deviation of the WGN process and ranges from
0.15−0.35 m for the SUTs considered in this thesis (see TABLE 3.1 for more details).
Also, 𝑏[𝑛] represents the randomly varying mean associated with the colored noise
processes of 1 𝑓𝛼⁄ PSD. From ADEV analysis, it is evident that ∆ℎ[𝑛] can be approximated
by a locally stationary random process such that 𝑏[𝑛] = 𝑏𝑘, 𝑛 = (𝑘 − 1)𝑁𝑏 + 1, … , 𝑘𝑁𝑏 ,
∀𝑘 ∈ ℤ+, where 𝑁𝑏 = 𝐹𝑠𝑇𝑏 and ℤ+ denotes the set of positive integers. That is, the value
of the bias term 𝑏[𝑛] can be assumed approximately constant during each observation
interval of length 𝑇𝑏. This interpretation of bias instability is analogous to the definition of
cluster mean in (3.3) for ℎ̃ = ∆ℎ, i.e. fixed sensor location, and 𝜏𝑐 = 𝑇𝑏 such that �̅�𝑘(𝑇𝑏) =
𝑏𝑘, which subsequently results in a first order RW model for 𝑏𝑘 as
𝑏𝑘+𝑚 = 𝑏𝑘 + √𝑚 𝑤𝑏 (3.5)
where 𝑤𝑏 is zero-mean WGN with standard deviation of 𝜎𝑏 = 𝜎𝐴𝐷𝐸𝑉(𝑇𝑏), and 𝑚𝑇𝑏, ∀𝑚 ∈
ℤ+, is the time elapsed since 𝑏𝑘 was last determined. For the MEMS BP sensors used in
this thesis, 𝜎𝑏 lies in the range 0.075< 𝜎𝑏 <0.15 m, as shown in TABLE 3.1.
By substituting (3.5) and (3.4) in (3.2), the BA signal model can be given as
ℎ̃𝑘+𝑚[𝑛] = ℎ[𝑛] + 𝑏𝑘+𝑚 + 𝑤[𝑛] (3.6)
where 𝑏𝑘+𝑚~𝒩(𝑏𝑘, √𝑚σ𝑏) from (3.5). Accordingly, it follows from (3.6) that ℎ̃𝑘+𝑚[𝑛] −
ℎ[𝑛] − 𝑏𝑘~𝒩(0, √𝑚σ𝑏 + 𝜎𝑤).
For further verification of measurement model, use of a first order Autoregressive
Moving Average (ARMA) was made, which is shown in APPENDIX A.
30
3.3 Framework for BP-based Floor Localization
According to (3.6), for a known bias term 𝑏𝑘, maximum likelihood (ML) estimation
of actual height is
where ℎ̂[𝑛]|𝑏𝑘 is the estimated height for a known 𝑏𝑘 with var(ℎ̂[𝑛]|𝑏𝑘) = 𝑚σ𝑏2 + 𝜎𝑤
2 .
For notational brevity, hereafter, ℎ̂|𝑏𝑘 will be denoted as ℎ̂𝑏 and consequentlyℎ̂[𝑛]|𝑏𝑘 will
be replaced with ℎ̂𝑏[𝑛].
Without access to any external information to update 𝑏𝑘, ℎ̂𝑏 in BA can only be used
over short-term (<30 minutes) measurements for floor localization. From the ADEV
graphs in Figure 3.2, the deviation in ℎ̃ introduced by BA is found to be less than 2 meters
when the measurement length considered is less than 30 minutes. Since typically the floor
heights in most of the buildings are larger than 2.5 meters, BA can be utilized for floor
localization over short-term measurements without observing large errors.
On the contrary, as mentioned before, DBA can be used for floor localization over
long-term measurements (> 30 minutes) because differencing operation in DBA mitigates
the random bias introduced by approaching weather systems. Figure 3.5 shows height error
∆ℎ observed in DBA, where two BP sensors were positioned at a fixed height and in
proximity during a 115 hours long measurement inside a typical office building. From the
figure, ∆ℎ is observed to fluctuate to a small degree approximately centering at zero and
no large deviation is detected. As such, measurement from DBA can be considered locally
stationary and used for floor localization over an extended period.
When BP sensor is positioned at a fixed height, measured BP follows a Gaussian
distribution [10]. As such, from the conducted measurements, it was observed that ℎ̂𝑏 on a
fixed floor also has a Gaussian distribution. Figure 3.6 shows ℎ̂𝑏 measured on the first floor
of TFDL, where ℎ̂𝑏 follows Gaussian distribution with a mean of zero. Considering the
altimetry system is locally-stationary, ℎ̂𝑏 can be shown to have a Gaussian distribution with
a different mean for all the floors inside a building. As such, floor localization using ℎ̂𝑏 can
be considered as a multiple hypothesis testing (MHT) problem, where the distribution of
ℎ̂[𝑛]|𝑏𝑘 = ℎ̃𝑘+𝑚[𝑛] − 𝑏𝑘 (3.7)
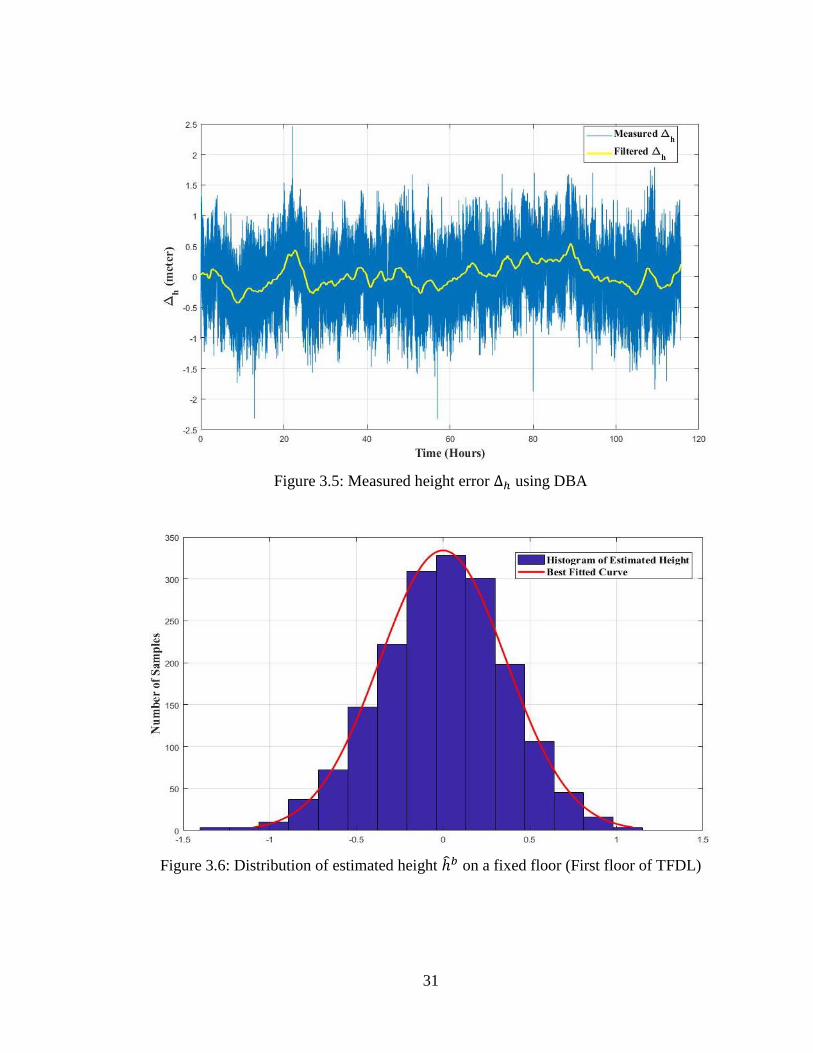
31
Figure 3.5: Measured height error ∆ℎ using DBA
Figure 3.6: Distribution of estimated height ℎ̂𝑏 on a fixed floor (First floor of TFDL)
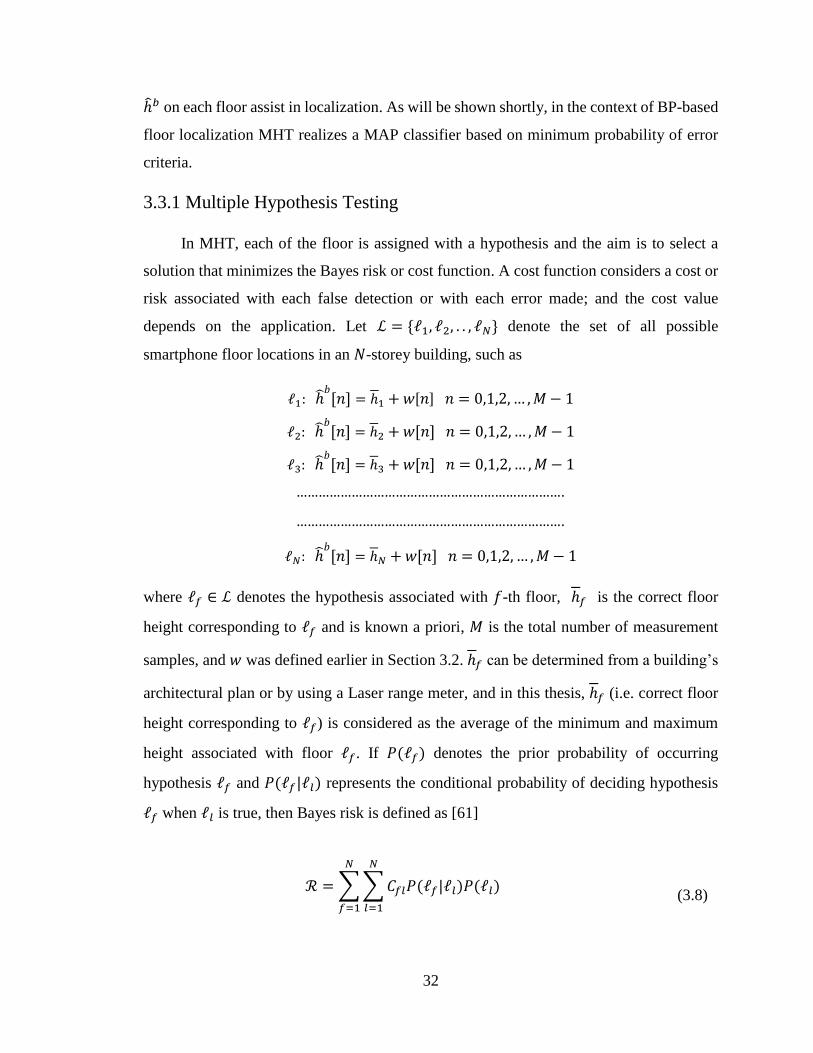
32
ℎ̂𝑏 on each floor assist in localization. As will be shown shortly, in the context of BP-based
floor localization MHT realizes a MAP classifier based on minimum probability of error
criteria.
3.3.1 Multiple Hypothesis Testing
In MHT, each of the floor is assigned with a hypothesis and the aim is to select a
solution that minimizes the Bayes risk or cost function. A cost function considers a cost or
risk associated with each false detection or with each error made; and the cost value
depends on the application. Let ℒ = {ℓ1, ℓ2, . . , ℓ𝑁} denote the set of all possible
smartphone floor locations in an 𝑁-storey building, such as
ℓ1: ℎ̂𝑏[𝑛] = ℎ1 + 𝑤[𝑛] 𝑛 = 0,1,2, … , 𝑀 − 1
ℓ2: ℎ̂𝑏[𝑛] = ℎ2 + 𝑤[𝑛] 𝑛 = 0,1,2, … , 𝑀 − 1
ℓ3: ℎ̂𝑏[𝑛] = ℎ3 + 𝑤[𝑛] 𝑛 = 0,1,2, … , 𝑀 − 1
……………………………………………………………….
……………………………………………………………….
ℓ𝑁: ℎ̂𝑏[𝑛] = ℎ𝑁 + 𝑤[𝑛] 𝑛 = 0,1,2, … , 𝑀 − 1
where ℓ𝑓 ∈ ℒ denotes the hypothesis associated with 𝑓-th floor, ℎ𝑓 is the correct floor
height corresponding to ℓ𝑓 and is known a priori, 𝑀 is the total number of measurement
samples, and 𝑤 was defined earlier in Section 3.2. ℎ𝑓 can be determined from a building’s
architectural plan or by using a Laser range meter, and in this thesis, ℎ𝑓 (i.e. correct floor
height corresponding to ℓ𝑓) is considered as the average of the minimum and maximum
height associated with floor ℓ𝑓. If 𝑃(ℓ𝑓) denotes the prior probability of occurring
hypothesis ℓ𝑓 and 𝑃(ℓ𝑓|ℓ𝑙) represents the conditional probability of deciding hypothesis
ℓ𝑓 when ℓ𝑙 is true, then Bayes risk is defined as [61]
ℛ = ∑ ∑ 𝐶𝑓𝑙𝑃(ℓ𝑓|ℓ𝑙)𝑃(ℓ𝑙)
𝑁
𝑙=1
𝑁
𝑓=1
(3.8)
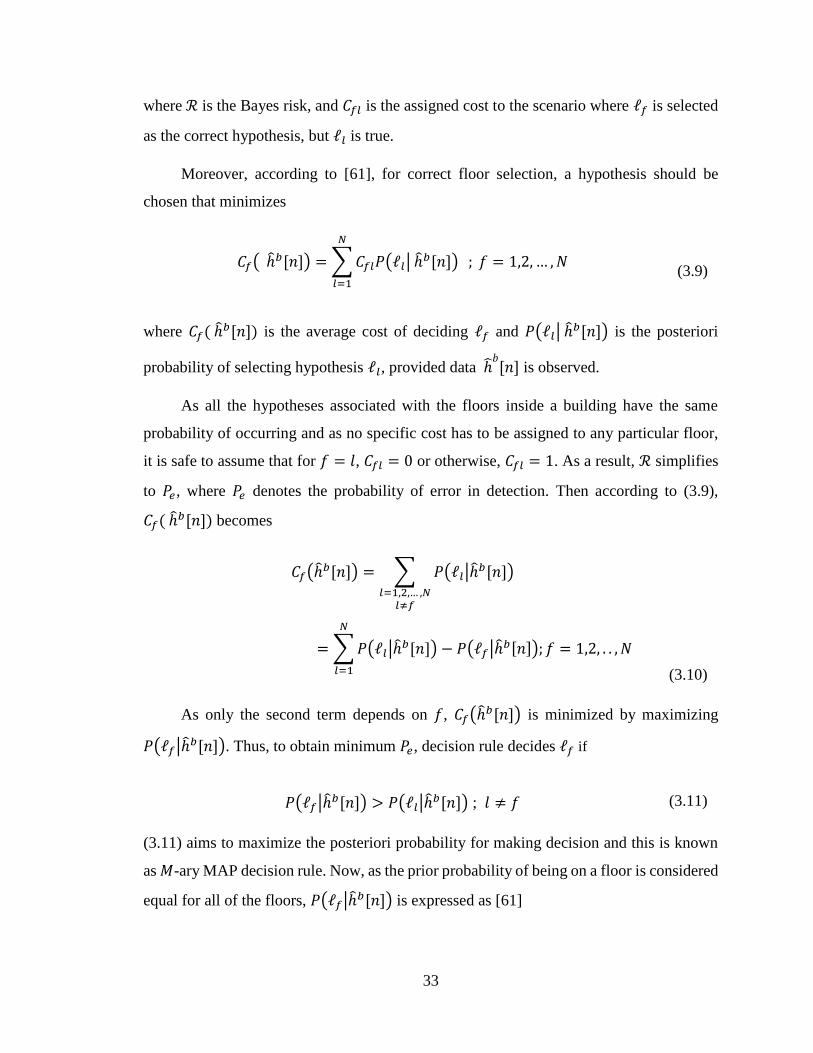
33
where ℛ is the Bayes risk, and 𝐶𝑓𝑙 is the assigned cost to the scenario where ℓ𝑓 is selected
as the correct hypothesis, but ℓ𝑙 is true.
Moreover, according to [61], for correct floor selection, a hypothesis should be
chosen that minimizes
where 𝐶𝑓( ℎ̂𝑏[𝑛]) is the average cost of deciding ℓ𝑓 and 𝑃(ℓ𝑙| ℎ̂𝑏[𝑛]) is the posteriori
probability of selecting hypothesis ℓ𝑙, provided data ℎ̂𝑏[𝑛] is observed.
As all the hypotheses associated with the floors inside a building have the same
probability of occurring and as no specific cost has to be assigned to any particular floor,
it is safe to assume that for 𝑓 = 𝑙, 𝐶𝑓𝑙 = 0 or otherwise, 𝐶𝑓𝑙 = 1. As a result, ℛ simplifies
to 𝑃𝑒, where 𝑃𝑒 denotes the probability of error in detection. Then according to (3.9),
𝐶𝑓( ℎ̂𝑏[𝑛]) becomes
As only the second term depends on 𝑓, 𝐶𝑓(ℎ̂𝑏[𝑛]) is minimized by maximizing
𝑃(ℓ𝑓|ℎ̂𝑏[𝑛]). Thus, to obtain minimum 𝑃𝑒, decision rule decides ℓ𝑓 if
(3.11) aims to maximize the posteriori probability for making decision and this is known
as 𝑀-ary MAP decision rule. Now, as the prior probability of being on a floor is considered
equal for all of the floors, 𝑃(ℓ𝑓|ℎ̂𝑏[𝑛]) is expressed as [61]
𝐶𝑓( ℎ̂𝑏[𝑛]) = ∑ 𝐶𝑓𝑙𝑃(ℓ𝑙| ℎ̂𝑏[𝑛])
𝑁
𝑙=1
; 𝑓 = 1,2, … , 𝑁
(3.9)
𝐶𝑓(ℎ̂𝑏[𝑛]) = ∑ 𝑃(ℓ𝑙|ℎ̂𝑏[𝑛])
𝑙=1,2,… ,𝑁𝑙≠𝑓
= ∑ 𝑃(ℓ𝑙|ℎ̂𝑏[𝑛])
𝑁
𝑙=1
− 𝑃(ℓ𝑓|ℎ̂𝑏[𝑛]); 𝑓 = 1,2, . . , 𝑁
(3.10)
𝑃(ℓ𝑓|ℎ̂𝑏[𝑛]) > 𝑃(ℓ𝑙|ℎ̂𝑏[𝑛]) ; 𝑙 ≠ 𝑓 (3.11)
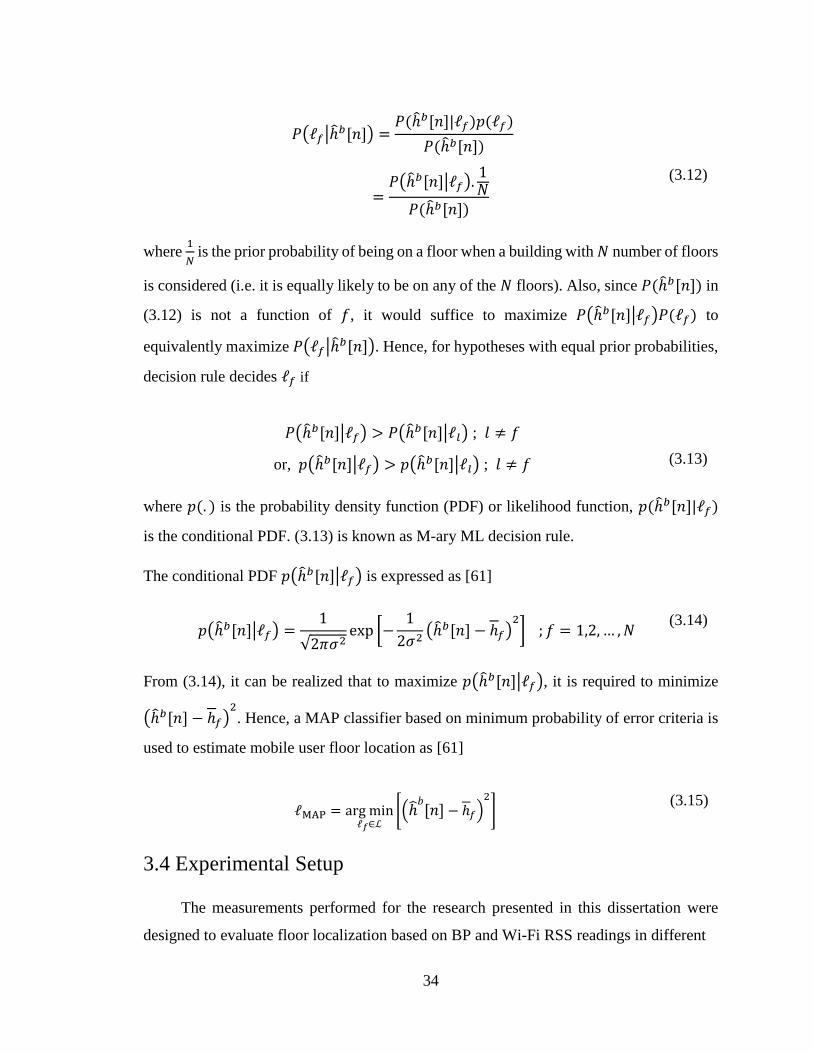
34
where 1
𝑁 is the prior probability of being on a floor when a building with 𝑁 number of floors
is considered (i.e. it is equally likely to be on any of the 𝑁 floors). Also, since 𝑃(ℎ̂𝑏[𝑛]) in
(3.12) is not a function of 𝑓, it would suffice to maximize 𝑃(ℎ̂𝑏[𝑛]|ℓ𝑓)𝑃(ℓ𝑓) to
equivalently maximize 𝑃(ℓ𝑓|ℎ̂𝑏[𝑛]). Hence, for hypotheses with equal prior probabilities,
decision rule decides ℓ𝑓 if
where 𝑝(. ) is the probability density function (PDF) or likelihood function, 𝑝(ℎ̂𝑏[𝑛]|ℓ𝑓)
is the conditional PDF. (3.13) is known as M-ary ML decision rule.
The conditional PDF 𝑝(ℎ̂𝑏[𝑛]|ℓ𝑓) is expressed as [61]
From (3.14), it can be realized that to maximize 𝑝(ℎ̂𝑏[𝑛]|ℓ𝑓), it is required to minimize
(ℎ̂𝑏[𝑛] − ℎ𝑓)2. Hence, a MAP classifier based on minimum probability of error criteria is
used to estimate mobile user floor location as [61]
3.4 Experimental Setup
The measurements performed for the research presented in this dissertation were
designed to evaluate floor localization based on BP and Wi-Fi RSS readings in different
𝑃(ℓ𝑓|ℎ̂𝑏[𝑛]) =𝑃(ℎ̂𝑏[𝑛]|ℓ𝑓)𝑝(ℓ𝑓)
𝑃(ℎ̂𝑏[𝑛])
=𝑃(ℎ̂𝑏[𝑛]|ℓ𝑓).
1𝑁
𝑃(ℎ̂𝑏[𝑛])
(3.12)
𝑃(ℎ̂𝑏[𝑛]|ℓ𝑓) > 𝑃(ℎ̂𝑏[𝑛]|ℓ𝑙) ; 𝑙 ≠ 𝑓
or, 𝑝(ℎ̂𝑏[𝑛]|ℓ𝑓) > 𝑝(ℎ̂𝑏[𝑛]|ℓ𝑙) ; 𝑙 ≠ 𝑓
(3.13)
𝑝(ℎ̂𝑏[𝑛]|ℓ𝑓) =1
√2𝜋𝜎2exp [−
1
2𝜎2(ℎ̂𝑏[𝑛] − ℎ𝑓)
2] ; 𝑓 = 1,2, … , 𝑁
(3.14)
ℓMAP = arg minℓ𝑓∈ℒ
[(ℎ̂𝑏[𝑛] − ℎ𝑓)
2
] (3.15)
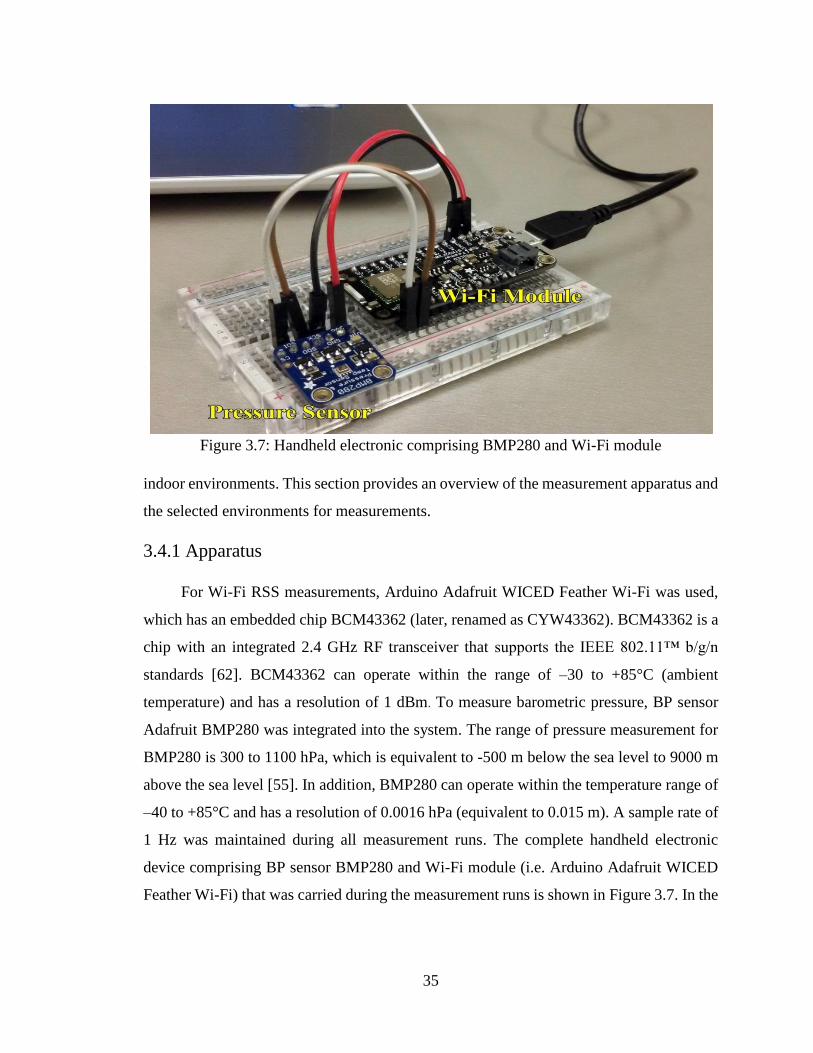
35
indoor environments. This section provides an overview of the measurement apparatus and
the selected environments for measurements.
3.4.1 Apparatus
For Wi-Fi RSS measurements, Arduino Adafruit WICED Feather Wi-Fi was used,
which has an embedded chip BCM43362 (later, renamed as CYW43362). BCM43362 is a
chip with an integrated 2.4 GHz RF transceiver that supports the IEEE 802.11™ b/g/n
standards [62]. BCM43362 can operate within the range of –30 to +85°C (ambient
temperature) and has a resolution of 1 dBm. To measure barometric pressure, BP sensor
Adafruit BMP280 was integrated into the system. The range of pressure measurement for
BMP280 is 300 to 1100 hPa, which is equivalent to -500 m below the sea level to 9000 m
above the sea level [55]. In addition, BMP280 can operate within the temperature range of
–40 to +85°C and has a resolution of 0.0016 hPa (equivalent to 0.015 m). A sample rate of
1 Hz was maintained during all measurement runs. The complete handheld electronic
device comprising BP sensor BMP280 and Wi-Fi module (i.e. Arduino Adafruit WICED
Feather Wi-Fi) that was carried during the measurement runs is shown in Figure 3.7. In the
Figure 3.7: Handheld electronic comprising BMP280 and Wi-Fi module
36
post-analysis stage, MATLAB (Version R2017a) was used to analyze collected data and
to generate graphs.
3.4.2 Selected Environments for Measurements
Three multi-storey buildings were considered on the University of Calgary campus
grounds for measurements. These buildings were selected due to their different structural
designs, which help to evaluate the robustness of a localization method. Measurements
were carried out on different days to test floor localization methods under different weather
patterns.
Building 1:
The first measurement run was conducted inside Information and Communications
Technology (ICT) building, which is typical of a multi-story building with a combination
of open and office floor plans. The first three floors were considered for the measurements.
The ground floor covers an area of approximately 2250 sq. meters and has an open layout
with shops, sitting area, and large lecture halls. The second and third floors cover an area
of approximately 1950 sq. meters and comprise a variety of offices and labs connected by
narrow hallways. The ceiling on the ground floor is 7 meters high and the ceilings on the
second and third floors are around 4 meters high. The measurement was carried out on June
19 of 2017 and it lasted for 1 hour and 45 minutes. The exterior and interior views of the
ICT building are shown in Figure 3.8.
Building 2:
The second measurement was conducted inside Taylor Family Digital Library
(TFDL), which is a six-story building with open floor designs. The use of concrete slabs
and signal interfering metal mesh was made to separate two adjacent floors in TFDL. The
first two floors have an area of 5370 sq. meters and the rest of the floors individually cover
3,470 sq. meters. Bookshelves and study areas occupy most of the areas on each floor and
there is a hollow interior between first and second floors. On average, the ceilings on all
floors are roughly 5 meters high. The measurement was carried out on August 8, 2017, and
it lasted for 2 hours. Figure 3.9 shows the outer and inner views of TFDL.
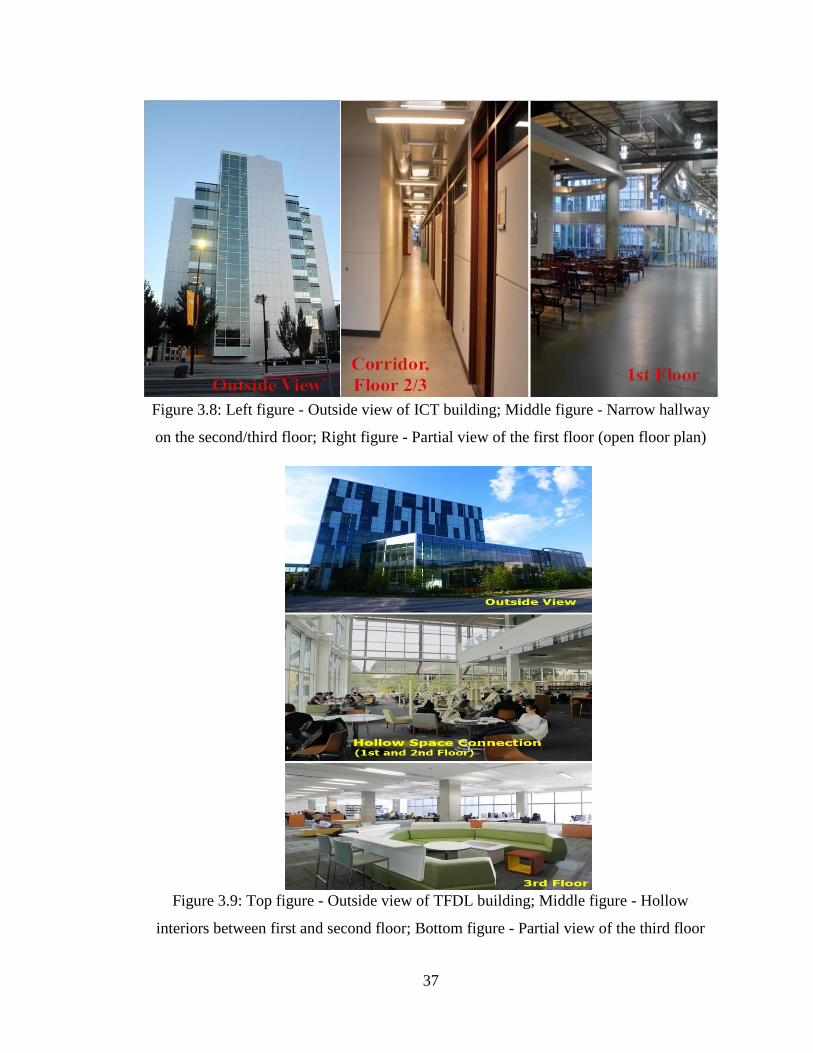
37
Figure 3.8: Left figure - Outside view of ICT building; Middle figure - Narrow hallway
on the second/third floor; Right figure - Partial view of the first floor (open floor plan)
Figure 3.9: Top figure - Outside view of TFDL building; Middle figure - Hollow
interiors between first and second floor; Bottom figure - Partial view of the third floor
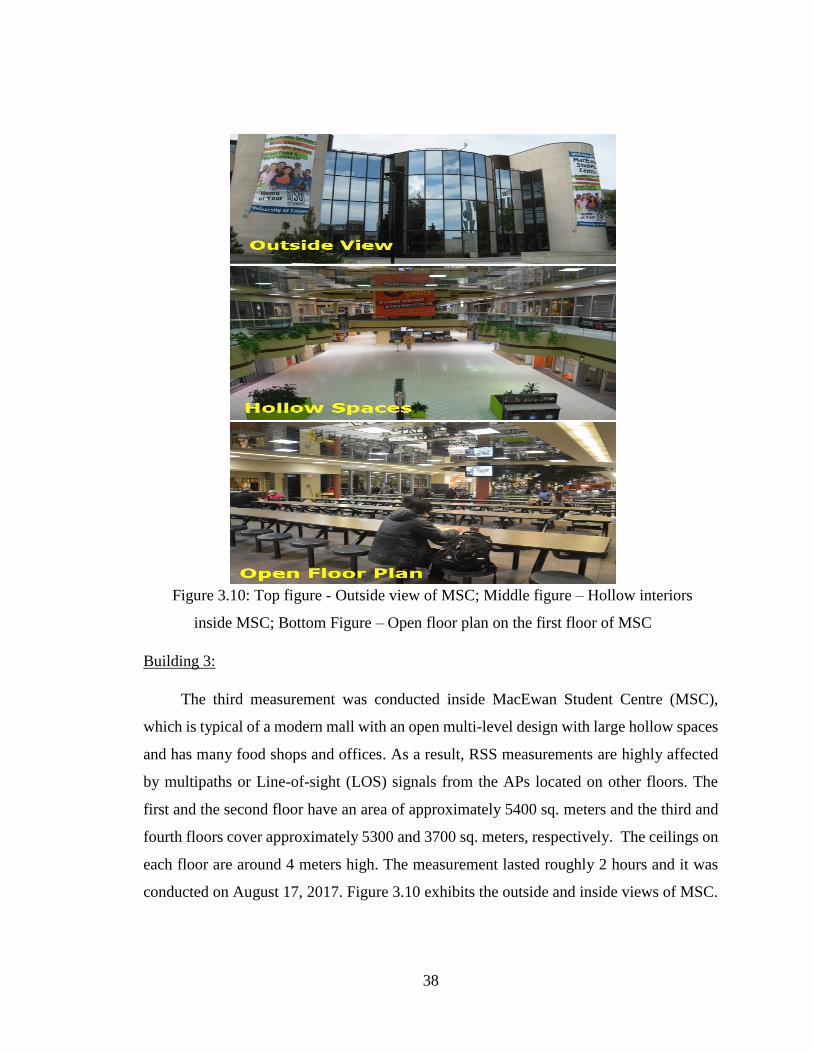
38
Figure 3.10: Top figure - Outside view of MSC; Middle figure – Hollow interiors
inside MSC; Bottom Figure – Open floor plan on the first floor of MSC
Building 3:
The third measurement was conducted inside MacEwan Student Centre (MSC),
which is typical of a modern mall with an open multi-level design with large hollow spaces
and has many food shops and offices. As a result, RSS measurements are highly affected
by multipaths or Line-of-sight (LOS) signals from the APs located on other floors. The
first and the second floor have an area of approximately 5400 sq. meters and the third and
fourth floors cover approximately 5300 and 3700 sq. meters, respectively. The ceilings on
each floor are around 4 meters high. The measurement lasted roughly 2 hours and it was
conducted on August 17, 2017. Figure 3.10 exhibits the outside and inside views of MSC.
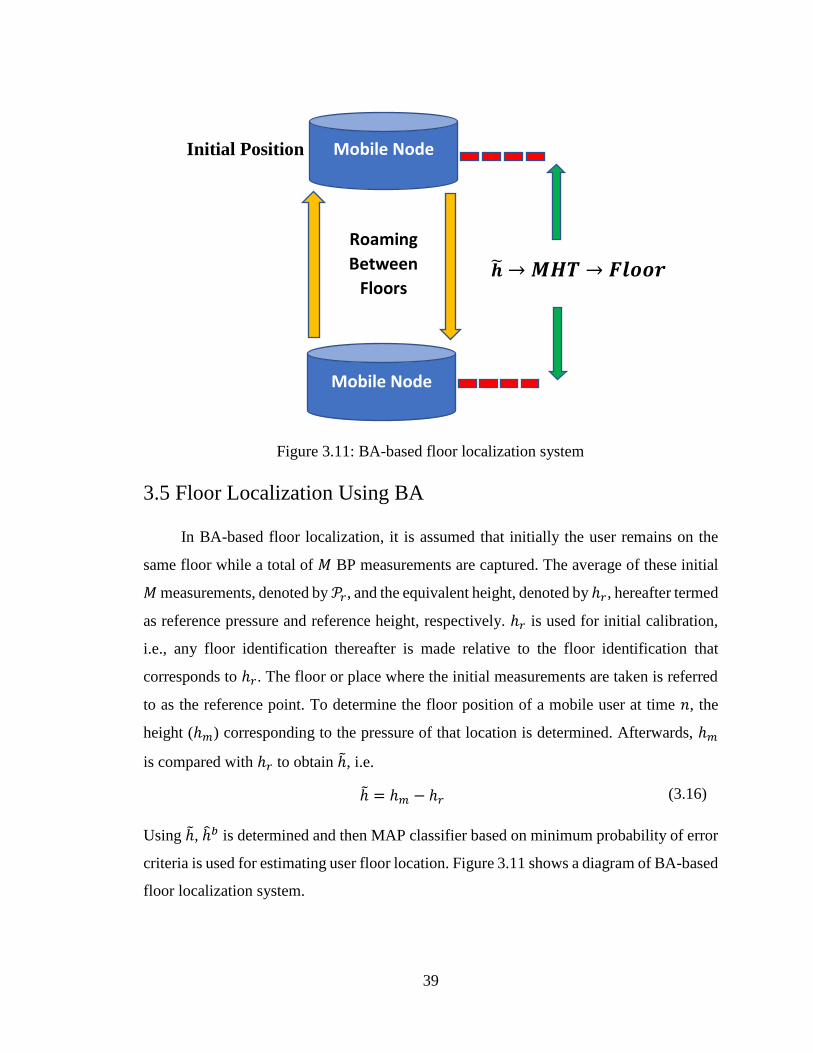
39
Figure 3.11: BA-based floor localization system
3.5 Floor Localization Using BA
In BA-based floor localization, it is assumed that initially the user remains on the
same floor while a total of 𝑀 BP measurements are captured. The average of these initial
𝑀 measurements, denoted by 𝒫𝑟, and the equivalent height, denoted by ℎ𝑟, hereafter termed
as reference pressure and reference height, respectively. ℎ𝑟 is used for initial calibration,
i.e., any floor identification thereafter is made relative to the floor identification that
corresponds to ℎ𝑟. The floor or place where the initial measurements are taken is referred
to as the reference point. To determine the floor position of a mobile user at time 𝑛, the
height (ℎ𝑚) corresponding to the pressure of that location is determined. Afterwards, ℎ𝑚
is compared with ℎ𝑟 to obtain ℎ̃, i.e.
Using ℎ̃, ℎ̂𝑏 is determined and then MAP classifier based on minimum probability of error
criteria is used for estimating user floor location. Figure 3.11 shows a diagram of BA-based
floor localization system.
ℎ̃ = ℎ𝑚 − ℎ𝑟 (3.16)
Initial Position Mobile Node
Mobile Node
𝒉෩ → 𝑴𝑯𝑻 → 𝑭𝒍𝒐𝒐𝒓
Roaming
Between
Floors
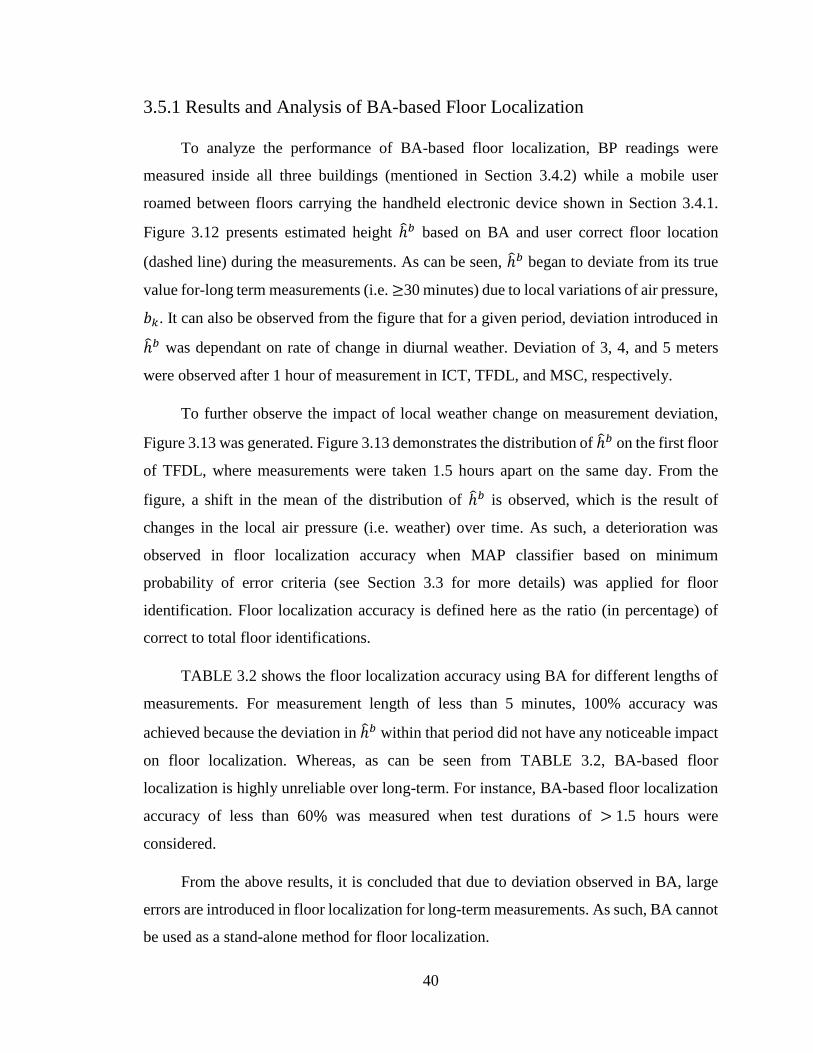
40
3.5.1 Results and Analysis of BA-based Floor Localization
To analyze the performance of BA-based floor localization, BP readings were
measured inside all three buildings (mentioned in Section 3.4.2) while a mobile user
roamed between floors carrying the handheld electronic device shown in Section 3.4.1.
Figure 3.12 presents estimated height ℎ̂𝑏 based on BA and user correct floor location
(dashed line) during the measurements. As can be seen, ℎ̂𝑏 began to deviate from its true
value for-long term measurements (i.e. ≥30 minutes) due to local variations of air pressure,
𝑏𝑘. It can also be observed from the figure that for a given period, deviation introduced in
ℎ̂𝑏 was dependant on rate of change in diurnal weather. Deviation of 3, 4, and 5 meters
were observed after 1 hour of measurement in ICT, TFDL, and MSC, respectively.
To further observe the impact of local weather change on measurement deviation,
Figure 3.13 was generated. Figure 3.13 demonstrates the distribution of ℎ̂𝑏 on the first floor
of TFDL, where measurements were taken 1.5 hours apart on the same day. From the
figure, a shift in the mean of the distribution of ℎ̂𝑏 is observed, which is the result of
changes in the local air pressure (i.e. weather) over time. As such, a deterioration was
observed in floor localization accuracy when MAP classifier based on minimum
probability of error criteria (see Section 3.3 for more details) was applied for floor
identification. Floor localization accuracy is defined here as the ratio (in percentage) of
correct to total floor identifications.
TABLE 3.2 shows the floor localization accuracy using BA for different lengths of
measurements. For measurement length of less than 5 minutes, 100% accuracy was
achieved because the deviation in ℎ̂𝑏 within that period did not have any noticeable impact
on floor localization. Whereas, as can be seen from TABLE 3.2, BA-based floor
localization is highly unreliable over long-term. For instance, BA-based floor localization
accuracy of less than 60% was measured when test durations of > 1.5 hours were
considered.
From the above results, it is concluded that due to deviation observed in BA, large
errors are introduced in floor localization for long-term measurements. As such, BA cannot
be used as a stand-alone method for floor localization.
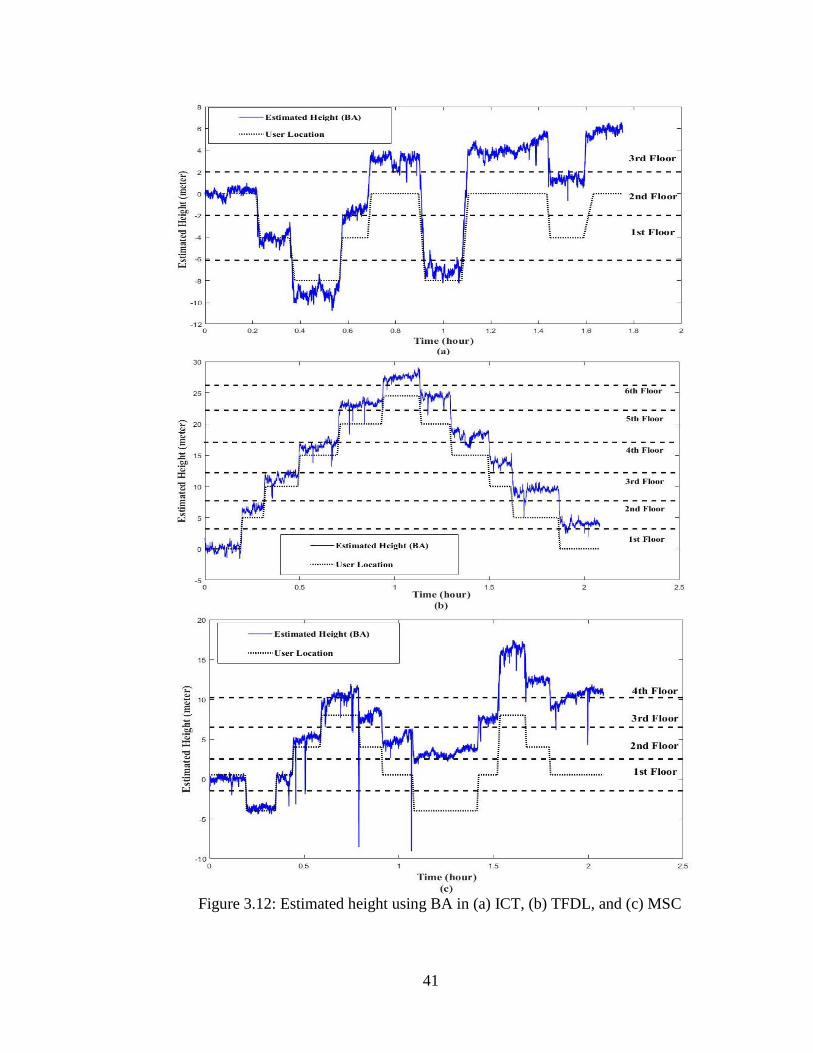
41
Figure 3.12: Estimated height using BA in (a) ICT, (b) TFDL, and (c) MSC
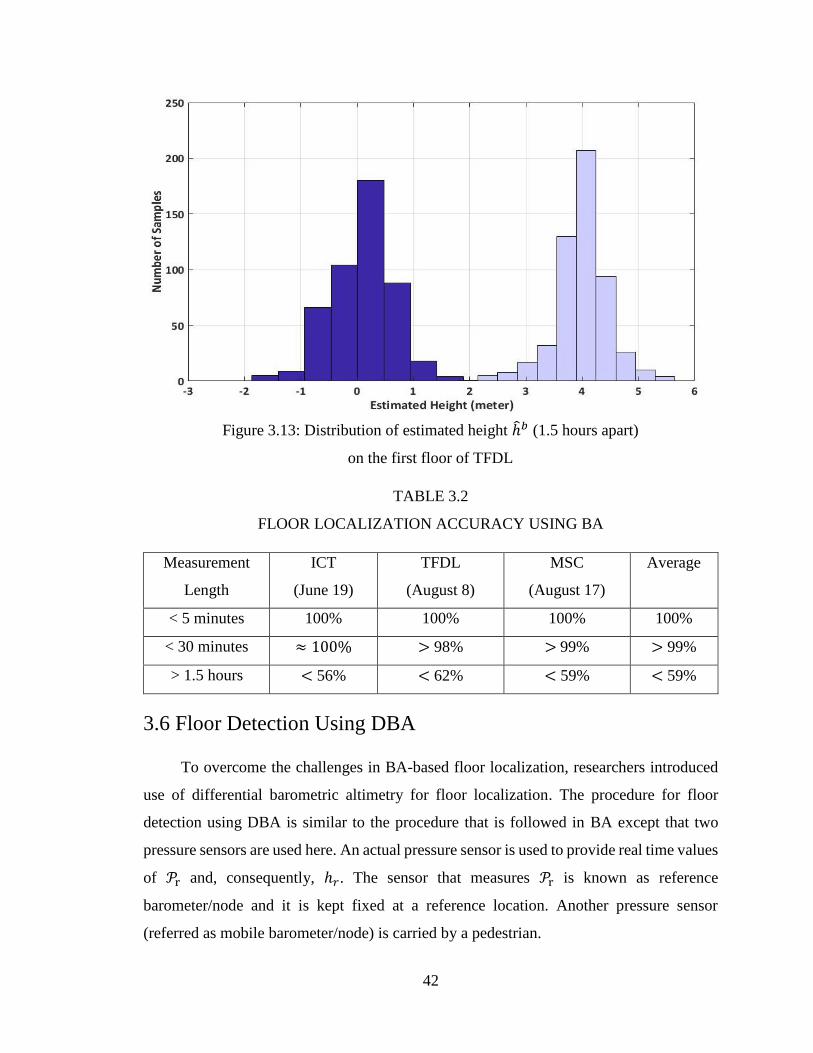
42
Figure 3.13: Distribution of estimated height ℎ̂𝑏 (1.5 hours apart)
on the first floor of TFDL
TABLE 3.2
FLOOR LOCALIZATION ACCURACY USING BA
Measurement
Length
ICT
(June 19)
TFDL
(August 8)
MSC
(August 17)
Average
< 5 minutes 100% 100% 100% 100%
< 30 minutes ≈ 100% > 98% > 99% > 99%
> 1.5 hours < 56% < 62% < 59% < 59%
3.6 Floor Detection Using DBA
To overcome the challenges in BA-based floor localization, researchers introduced
use of differential barometric altimetry for floor localization. The procedure for floor
detection using DBA is similar to the procedure that is followed in BA except that two
pressure sensors are used here. An actual pressure sensor is used to provide real time values
of 𝒫r and, consequently, ℎ𝑟. The sensor that measures 𝒫r is known as reference
barometer/node and it is kept fixed at a reference location. Another pressure sensor
(referred as mobile barometer/node) is carried by a pedestrian.
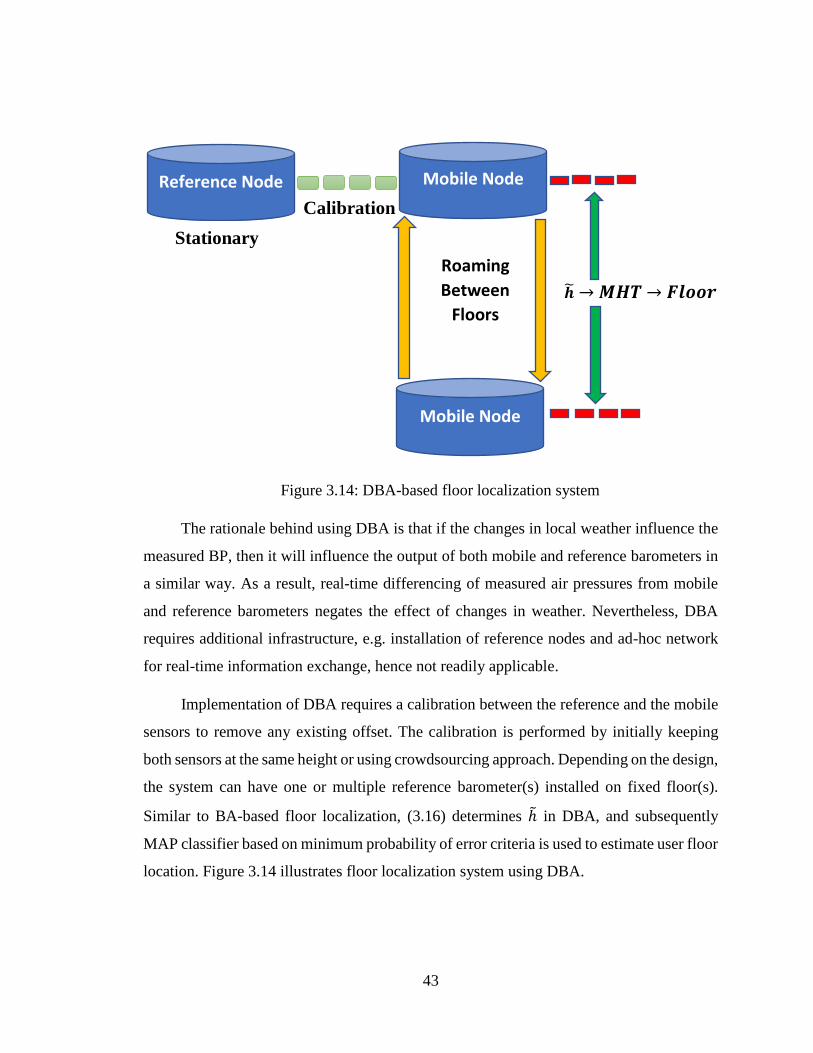
43
The rationale behind using DBA is that if the changes in local weather influence the
measured BP, then it will influence the output of both mobile and reference barometers in
a similar way. As a result, real-time differencing of measured air pressures from mobile
and reference barometers negates the effect of changes in weather. Nevertheless, DBA
requires additional infrastructure, e.g. installation of reference nodes and ad-hoc network
for real-time information exchange, hence not readily applicable.
Implementation of DBA requires a calibration between the reference and the mobile
sensors to remove any existing offset. The calibration is performed by initially keeping
both sensors at the same height or using crowdsourcing approach. Depending on the design,
the system can have one or multiple reference barometer(s) installed on fixed floor(s).
Similar to BA-based floor localization, (3.16) determines ℎ̃ in DBA, and subsequently
MAP classifier based on minimum probability of error criteria is used to estimate user floor
location. Figure 3.14 illustrates floor localization system using DBA.
Figure 3.14: DBA-based floor localization system
𝒉෩ → 𝑴𝑯𝑻 → 𝑭𝒍𝒐𝒐𝒓
Calibration
Reference Node Mobile Node
Mobile Node
Roaming
Between
Floors
Stationary
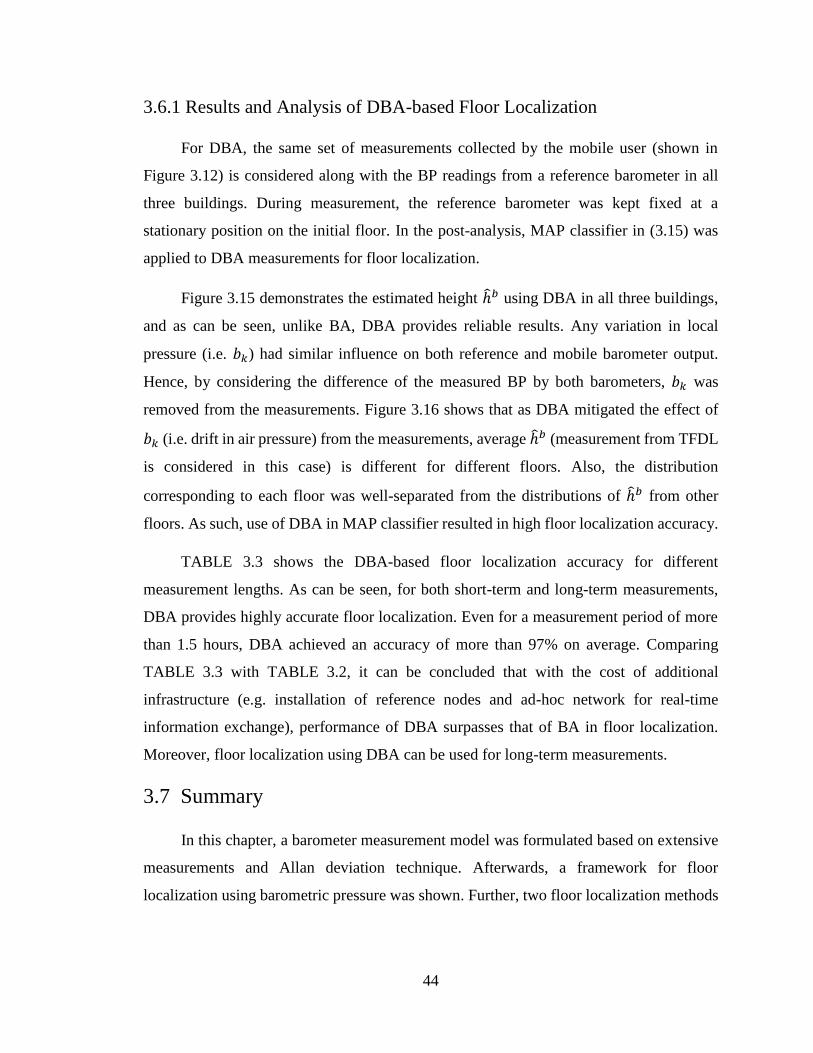
44
3.6.1 Results and Analysis of DBA-based Floor Localization
For DBA, the same set of measurements collected by the mobile user (shown in
Figure 3.12) is considered along with the BP readings from a reference barometer in all
three buildings. During measurement, the reference barometer was kept fixed at a
stationary position on the initial floor. In the post-analysis, MAP classifier in (3.15) was
applied to DBA measurements for floor localization.
Figure 3.15 demonstrates the estimated height ℎ̂𝑏 using DBA in all three buildings,
and as can be seen, unlike BA, DBA provides reliable results. Any variation in local
pressure (i.e. 𝑏𝑘) had similar influence on both reference and mobile barometer output.
Hence, by considering the difference of the measured BP by both barometers, 𝑏𝑘 was
removed from the measurements. Figure 3.16 shows that as DBA mitigated the effect of
𝑏𝑘 (i.e. drift in air pressure) from the measurements, average ℎ̂𝑏 (measurement from TFDL
is considered in this case) is different for different floors. Also, the distribution
corresponding to each floor was well-separated from the distributions of ℎ̂𝑏 from other
floors. As such, use of DBA in MAP classifier resulted in high floor localization accuracy.
TABLE 3.3 shows the DBA-based floor localization accuracy for different
measurement lengths. As can be seen, for both short-term and long-term measurements,
DBA provides highly accurate floor localization. Even for a measurement period of more
than 1.5 hours, DBA achieved an accuracy of more than 97% on average. Comparing
TABLE 3.3 with TABLE 3.2, it can be concluded that with the cost of additional
infrastructure (e.g. installation of reference nodes and ad-hoc network for real-time
information exchange), performance of DBA surpasses that of BA in floor localization.
Moreover, floor localization using DBA can be used for long-term measurements.
3.7 Summary
In this chapter, a barometer measurement model was formulated based on extensive
measurements and Allan deviation technique. Afterwards, a framework for floor
localization using barometric pressure was shown. Further, two floor localization methods
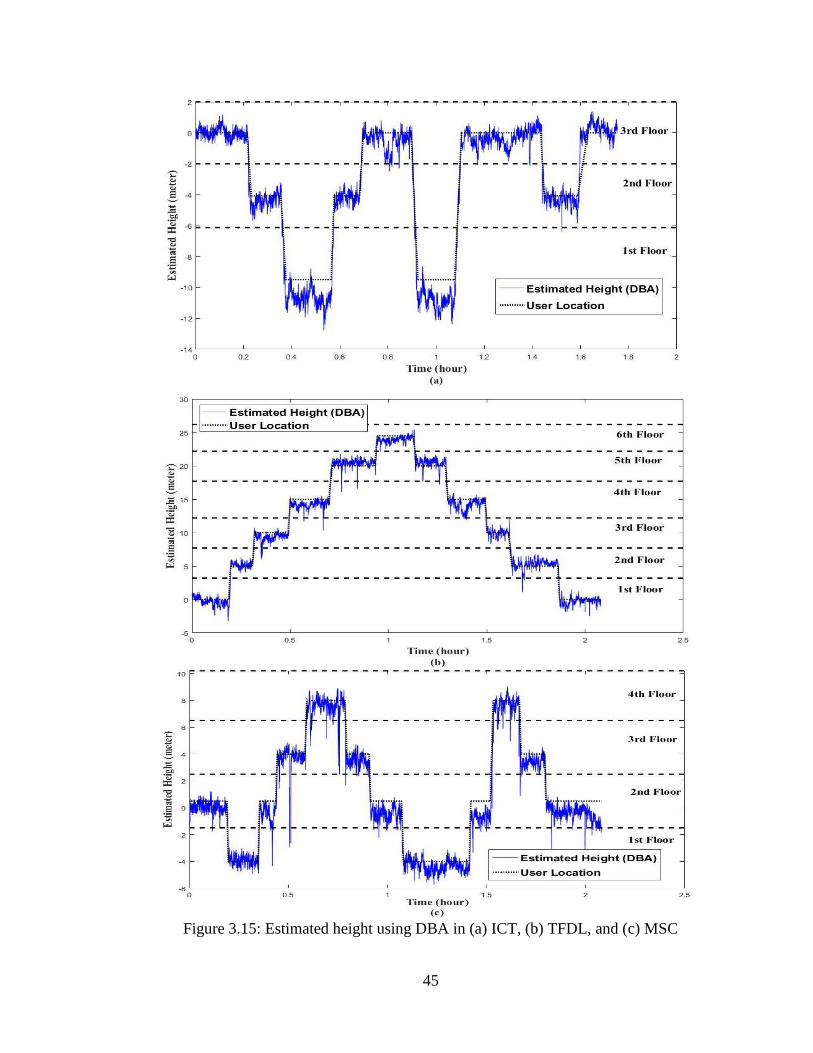
45
Figure 3.15: Estimated height using DBA in (a) ICT, (b) TFDL, and (c) MSC
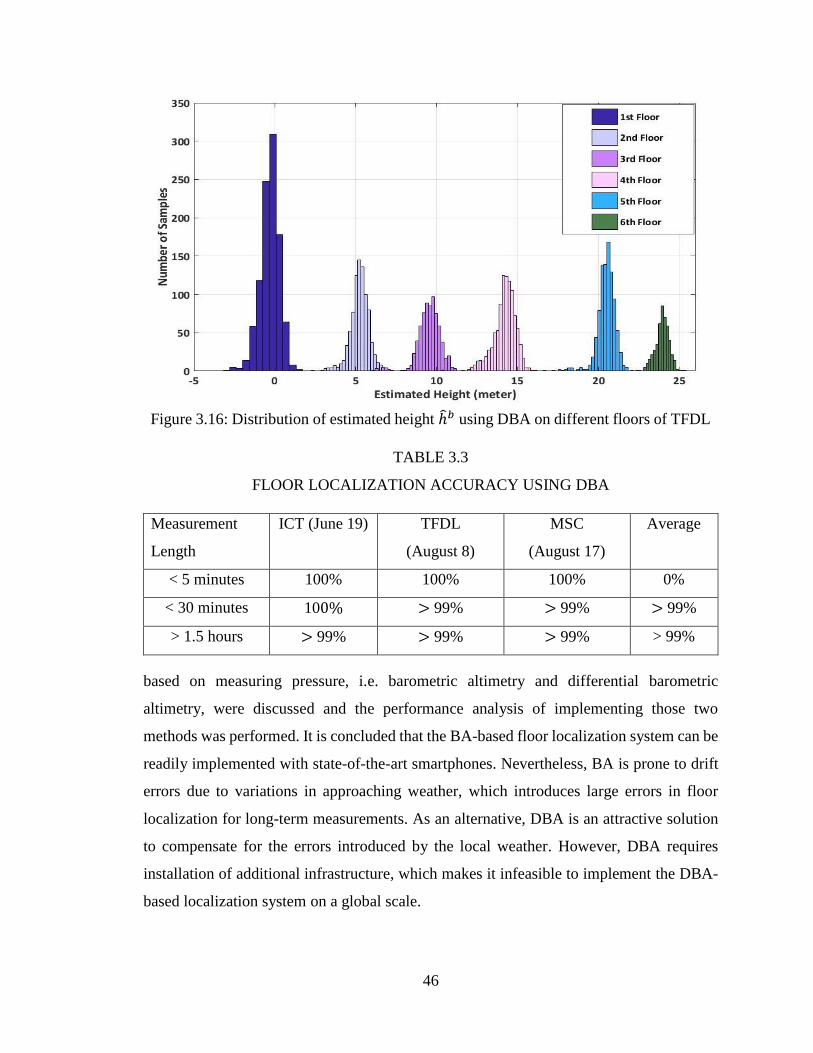
46
Figure 3.16: Distribution of estimated height ℎ̂𝑏 using DBA on different floors of TFDL
TABLE 3.3
FLOOR LOCALIZATION ACCURACY USING DBA
Measurement
Length
ICT (June 19) TFDL
(August 8)
MSC
(August 17)
Average
< 5 minutes 100% 100% 100% 0%
< 30 minutes 100% > 99% > 99% > 99%
> 1.5 hours > 99% > 99% > 99% > 99%
based on measuring pressure, i.e. barometric altimetry and differential barometric
altimetry, were discussed and the performance analysis of implementing those two
methods was performed. It is concluded that the BA-based floor localization system can be
readily implemented with state-of-the-art smartphones. Nevertheless, BA is prone to drift
errors due to variations in approaching weather, which introduces large errors in floor
localization for long-term measurements. As an alternative, DBA is an attractive solution
to compensate for the errors introduced by the local weather. However, DBA requires
installation of additional infrastructure, which makes it infeasible to implement the DBA-
based localization system on a global scale.
47
Chapter 4: Floor Localization Using
Received Signal Strength
4.1 Introduction
In many commercial and industrial location applications, the major objective of the
system designer is to reduce system requirements despite reasonable degradation in the
positioning accuracy. For that purpose, received signal strength (RSS)-based floor
localization is an attractive approach due to its cost-effectiveness, low-complexity, and
pervasiveness of mobile devices all over the world [63]. Most of the RSS-based approaches
can be readily implemented and incorporated into a hybrid localization approach with the
existing infrastructure, e.g., access points, smartphones. Nevertheless, the localization
process based on RSS is affected by multipath signals and improvement is required inside
buildings with irregular structures and hollow interiors.
This chapter develops and evaluates a Monte Carlo Bayesian Inference (MCBI)
framework for floor localization. The remainder of the chapter is organized as follows.
Section 4.1 presents RSS distribution and its statistical characteristics based on the
performed measurements inside three multi-storey buildings. Conventional RSS-based
localization approaches are briefly described in Section 4.3. In Section 4.4, a MCBI
algorithm is formulated for floor localization. Section 4.5 analyzes measured Wi-Fi RSS
readings and evaluates the performance of the formulated algorithm in floor localization.
Summary is given in Section 4.6
4.2 RSS Distribution Model
To design a robust estimator that can use Wi-Fi RSS from APs for floor localization,
it is essential to know about the RSS distributions through wireless channels in an indoor
environment. The wireless channel refers to the physical space or media through which
signal propagates. The natural signal power decay and the physical obstacles (e.g., walls,
doors, furniture, etc.) occupying the environment are taken into consideration to determine
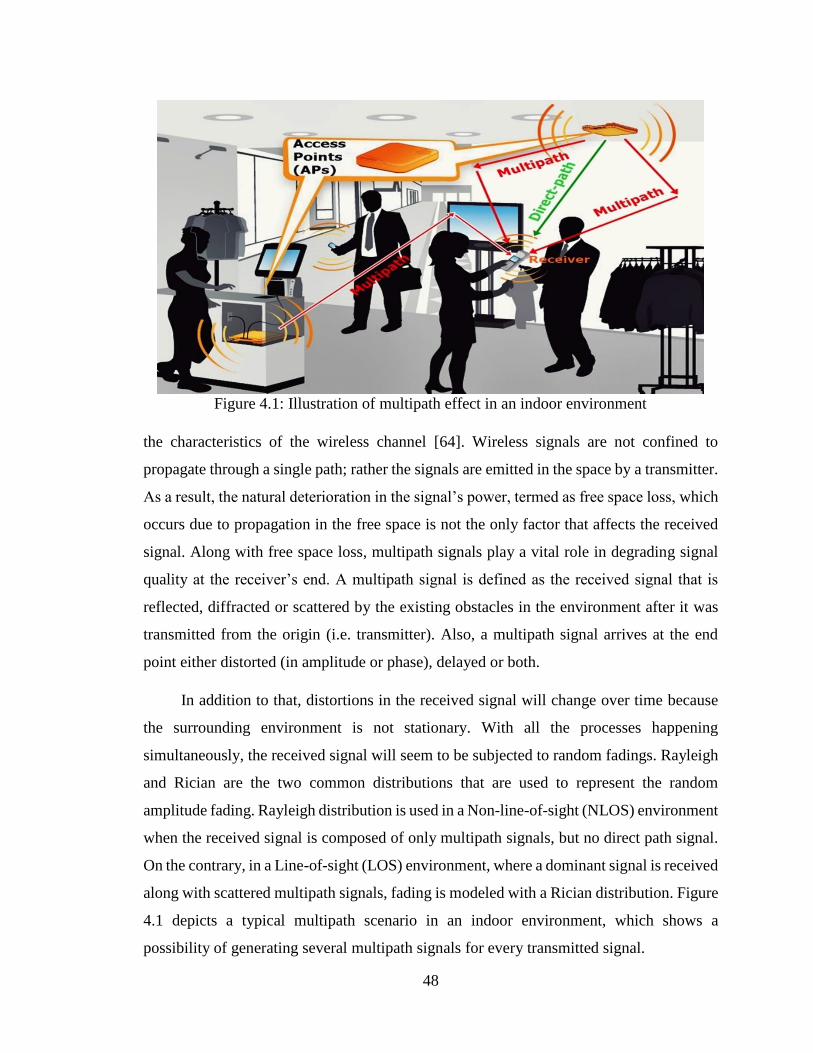
48
the characteristics of the wireless channel [64]. Wireless signals are not confined to
propagate through a single path; rather the signals are emitted in the space by a transmitter.
As a result, the natural deterioration in the signal’s power, termed as free space loss, which
occurs due to propagation in the free space is not the only factor that affects the received
signal. Along with free space loss, multipath signals play a vital role in degrading signal
quality at the receiver’s end. A multipath signal is defined as the received signal that is
reflected, diffracted or scattered by the existing obstacles in the environment after it was
transmitted from the origin (i.e. transmitter). Also, a multipath signal arrives at the end
point either distorted (in amplitude or phase), delayed or both.
In addition to that, distortions in the received signal will change over time because
the surrounding environment is not stationary. With all the processes happening
simultaneously, the received signal will seem to be subjected to random fadings. Rayleigh
and Rician are the two common distributions that are used to represent the random
amplitude fading. Rayleigh distribution is used in a Non-line-of-sight (NLOS) environment
when the received signal is composed of only multipath signals, but no direct path signal.
On the contrary, in a Line-of-sight (LOS) environment, where a dominant signal is received
along with scattered multipath signals, fading is modeled with a Rician distribution. Figure
4.1 depicts a typical multipath scenario in an indoor environment, which shows a
possibility of generating several multipath signals for every transmitted signal.
Figure 4.1: Illustration of multipath effect in an indoor environment
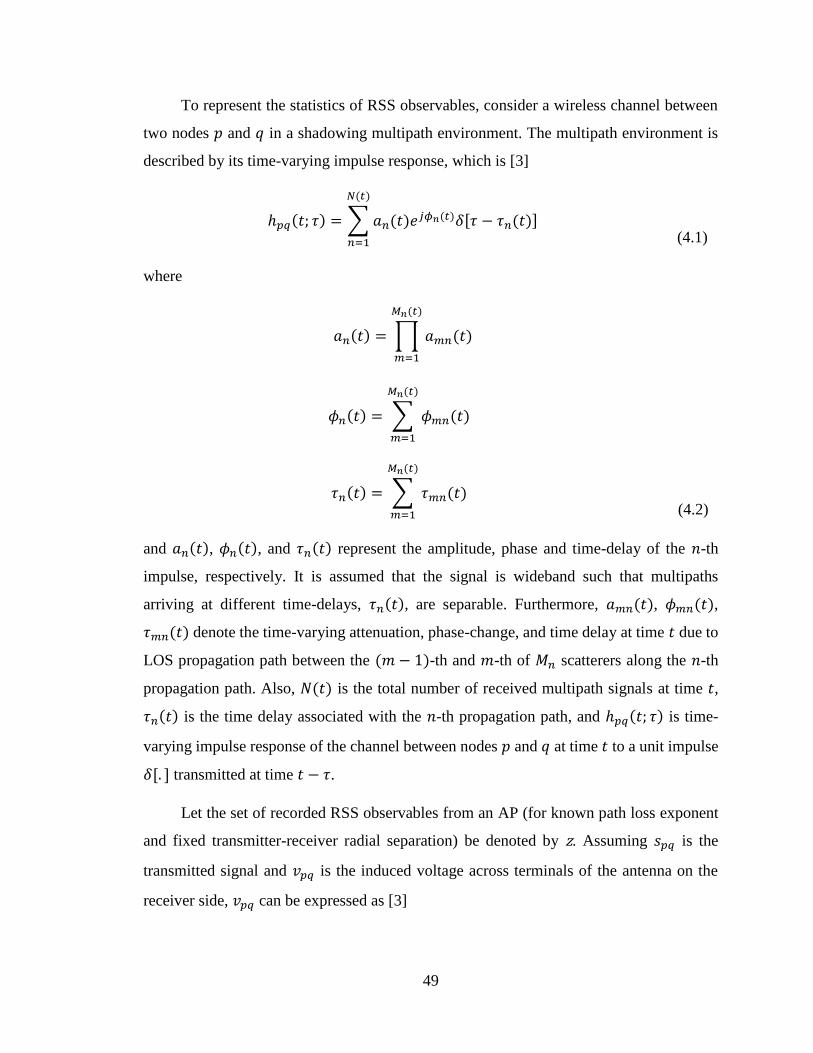
49
To represent the statistics of RSS observables, consider a wireless channel between
two nodes 𝑝 and 𝑞 in a shadowing multipath environment. The multipath environment is
described by its time-varying impulse response, which is [3]
ℎ𝑝𝑞(𝑡; 𝜏) = ∑ 𝑎𝑛(𝑡)𝑒𝑗𝜙𝑛(𝑡)𝛿[𝜏 − 𝜏𝑛(𝑡)]
𝑁(𝑡)
𝑛=1
(4.1)
where
𝑎𝑛(𝑡) = ∏ 𝑎𝑚𝑛(𝑡)
𝑀𝑛(𝑡)
𝑚=1
and 𝑎𝑛(𝑡), 𝜙𝑛(𝑡), and 𝜏𝑛(𝑡) represent the amplitude, phase and time-delay of the 𝑛-th
impulse, respectively. It is assumed that the signal is wideband such that multipaths
arriving at different time-delays, 𝜏𝑛(𝑡), are separable. Furthermore, 𝑎𝑚𝑛(𝑡), 𝜙𝑚𝑛(𝑡),
𝜏𝑚𝑛(𝑡) denote the time-varying attenuation, phase-change, and time delay at time 𝑡 due to
LOS propagation path between the (𝑚 − 1)-th and 𝑚-th of 𝑀𝑛 scatterers along the 𝑛-th
propagation path. Also, 𝑁(𝑡) is the total number of received multipath signals at time 𝑡,
𝜏𝑛(𝑡) is the time delay associated with the 𝑛-th propagation path, and ℎ𝑝𝑞(𝑡; 𝜏) is time-
varying impulse response of the channel between nodes 𝑝 and 𝑞 at time 𝑡 to a unit impulse
𝛿[. ] transmitted at time 𝑡 − 𝜏.
Let the set of recorded RSS observables from an AP (for known path loss exponent
and fixed transmitter-receiver radial separation) be denoted by z. Assuming 𝑠𝑝𝑞 is the
transmitted signal and 𝑣𝑝𝑞 is the induced voltage across terminals of the antenna on the
receiver side, 𝑣𝑝𝑞 can be expressed as [3]
𝜙𝑛(𝑡) = ∑ 𝜙𝑚𝑛(𝑡)
𝑀𝑛(𝑡)
𝑚=1
𝜏𝑛(𝑡) = ∑ 𝜏𝑚𝑛(𝑡)
𝑀𝑛(𝑡)
𝑚=1
(4.2)
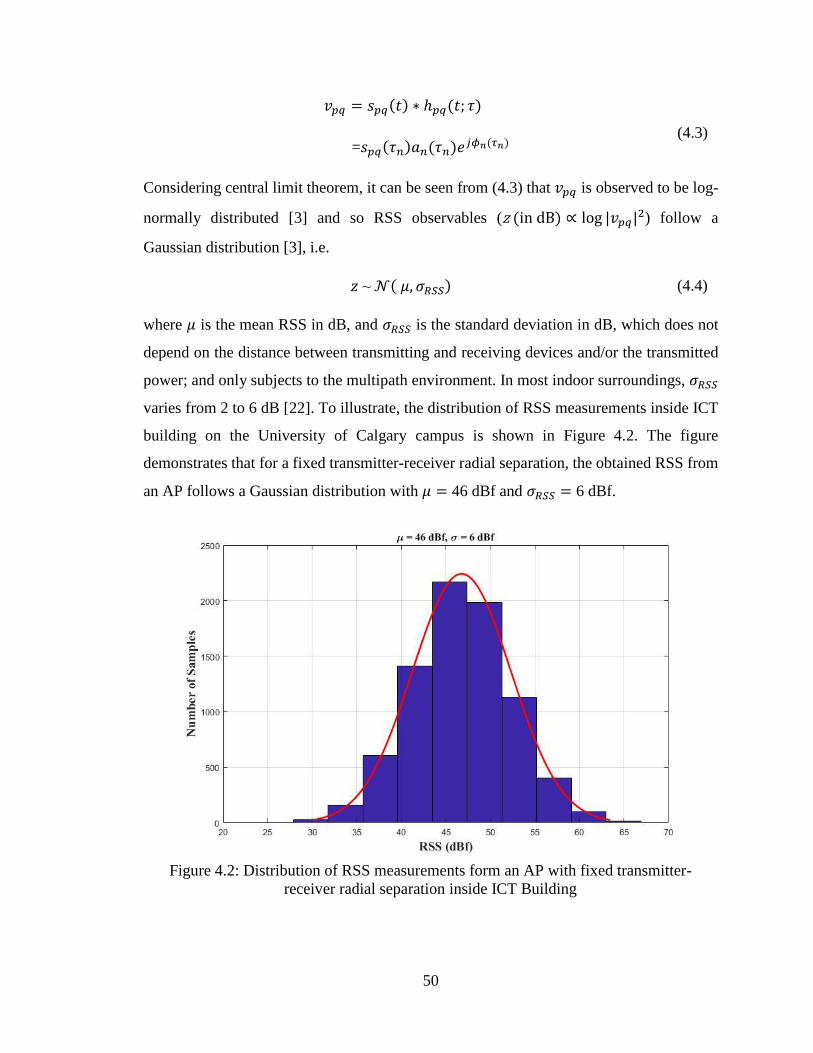
50
𝑣𝑝𝑞 = 𝑠𝑝𝑞(𝑡) ∗ ℎ𝑝𝑞(𝑡; 𝜏)
=𝑠𝑝𝑞(𝜏𝑛)𝑎𝑛(𝜏𝑛)𝑒𝑗𝜙𝑛(𝜏𝑛)
(4.3)
Considering central limit theorem, it can be seen from (4.3) that 𝑣𝑝𝑞 is observed to be log-
normally distributed [3] and so RSS observables (z (in dB) ∝ log |𝑣𝑝𝑞|2) follow a
Gaussian distribution [3], i.e.
𝑧 ~ 𝒩( 𝜇, 𝜎𝑅𝑆𝑆) (4.4)
where 𝜇 is the mean RSS in dB, and 𝜎𝑅𝑆𝑆 is the standard deviation in dB, which does not
depend on the distance between transmitting and receiving devices and/or the transmitted
power; and only subjects to the multipath environment. In most indoor surroundings, 𝜎𝑅𝑆𝑆
varies from 2 to 6 dB [22]. To illustrate, the distribution of RSS measurements inside ICT
building on the University of Calgary campus is shown in Figure 4.2. The figure
demonstrates that for a fixed transmitter-receiver radial separation, the obtained RSS from
an AP follows a Gaussian distribution with 𝜇 = 46 dBf and 𝜎𝑅𝑆𝑆 = 6 dBf.
Figure 4.2: Distribution of RSS measurements form an AP with fixed transmitter-
receiver radial separation inside ICT Building
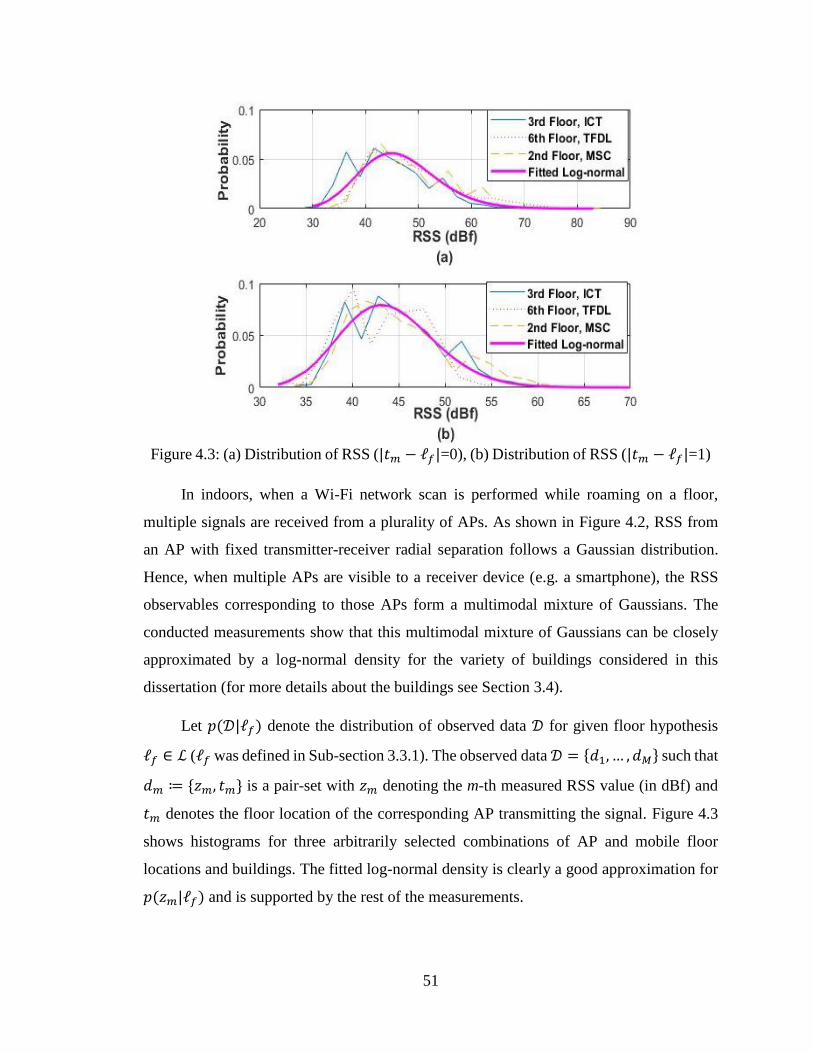
51
In indoors, when a Wi-Fi network scan is performed while roaming on a floor,
multiple signals are received from a plurality of APs. As shown in Figure 4.2, RSS from
an AP with fixed transmitter-receiver radial separation follows a Gaussian distribution.
Hence, when multiple APs are visible to a receiver device (e.g. a smartphone), the RSS
observables corresponding to those APs form a multimodal mixture of Gaussians. The
conducted measurements show that this multimodal mixture of Gaussians can be closely
approximated by a log-normal density for the variety of buildings considered in this
dissertation (for more details about the buildings see Section 3.4).
Let 𝑝(𝒟|ℓ𝑓) denote the distribution of observed data 𝒟 for given floor hypothesis
ℓ𝑓 ∈ ℒ (ℓ𝑓 was defined in Sub-section 3.3.1). The observed data 𝒟 = {𝑑1, … , 𝑑𝑀} such that
𝑑𝑚 ≔ {𝑧𝑚, 𝑡𝑚} is a pair-set with 𝑧𝑚 denoting the m-th measured RSS value (in dBf) and
𝑡𝑚 denotes the floor location of the corresponding AP transmitting the signal. Figure 4.3
shows histograms for three arbitrarily selected combinations of AP and mobile floor
locations and buildings. The fitted log-normal density is clearly a good approximation for
𝑝(𝑧𝑚|ℓ𝑓) and is supported by the rest of the measurements.
Figure 4.3: (a) Distribution of RSS (|𝑡𝑚 − ℓ𝑓|=0), (b) Distribution of RSS (|𝑡𝑚 − ℓ𝑓|=1)
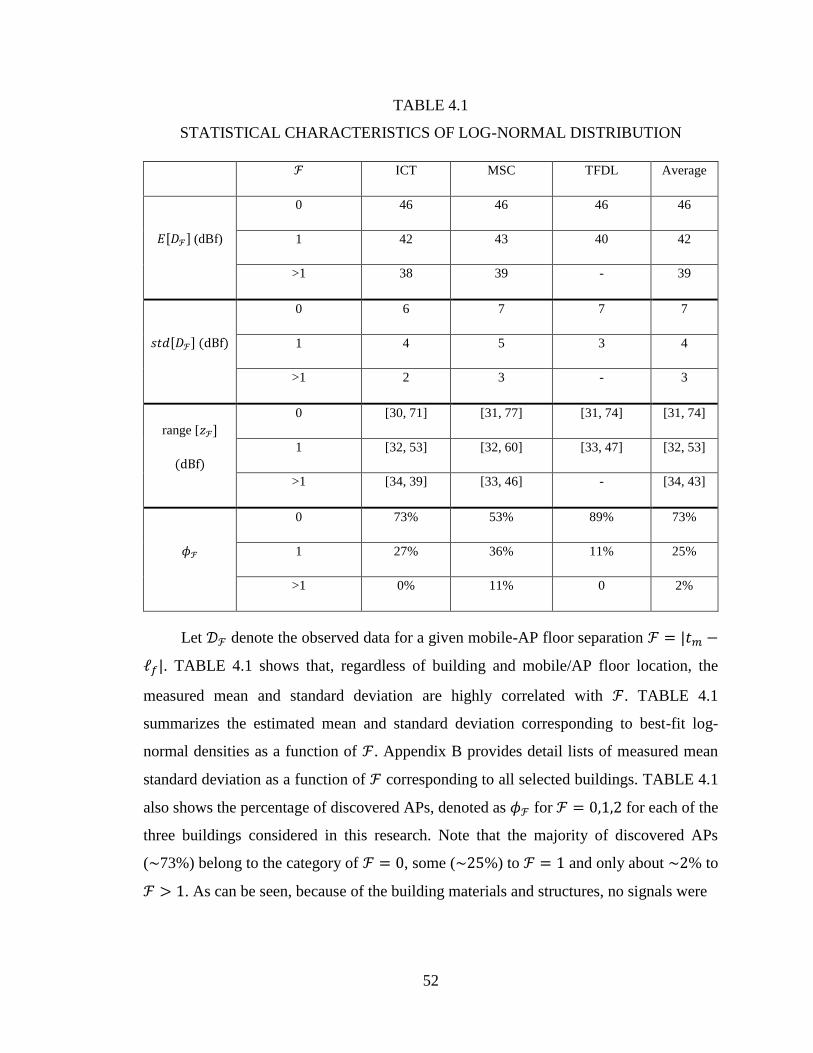
52
TABLE 4.1
STATISTICAL CHARACTERISTICS OF LOG-NORMAL DISTRIBUTION
ℱ ICT MSC TFDL Average
𝐸[𝐷ℱ] (dBf)
0 46 46 46 46
1 42 43 40 42
>1 38 39 - 39
𝑠𝑡𝑑[𝐷ℱ] (dBf)
0 6 7 7 7
1 4 5 3 4
>1 2 3 - 3
range [𝑧ℱ]
(dBf)
0 [30, 71] [31, 77] [31, 74] [31, 74]
1 [32, 53] [32, 60] [33, 47] [32, 53]
>1 [34, 39] [33, 46] - [34, 43]
𝜙ℱ
0 73% 53% 89% 73%
1 27% 36% 11% 25%
>1 0% 11% 0 2%
Let 𝒟ℱ denote the observed data for a given mobile-AP floor separation ℱ = |𝑡𝑚 −
ℓ𝑓|. TABLE 4.1 shows that, regardless of building and mobile/AP floor location, the
measured mean and standard deviation are highly correlated with ℱ. TABLE 4.1
summarizes the estimated mean and standard deviation corresponding to best-fit log-
normal densities as a function of ℱ. Appendix B provides detail lists of measured mean
standard deviation as a function of ℱ corresponding to all selected buildings. TABLE 4.1
also shows the percentage of discovered APs, denoted as 𝜙ℱ for ℱ = 0,1,2 for each of the
three buildings considered in this research. Note that the majority of discovered APs
(~73%) belong to the category of ℱ = 0, some (~25%) to ℱ = 1 and only about ~2% to
ℱ > 1. As can be seen, because of the building materials and structures, no signals were
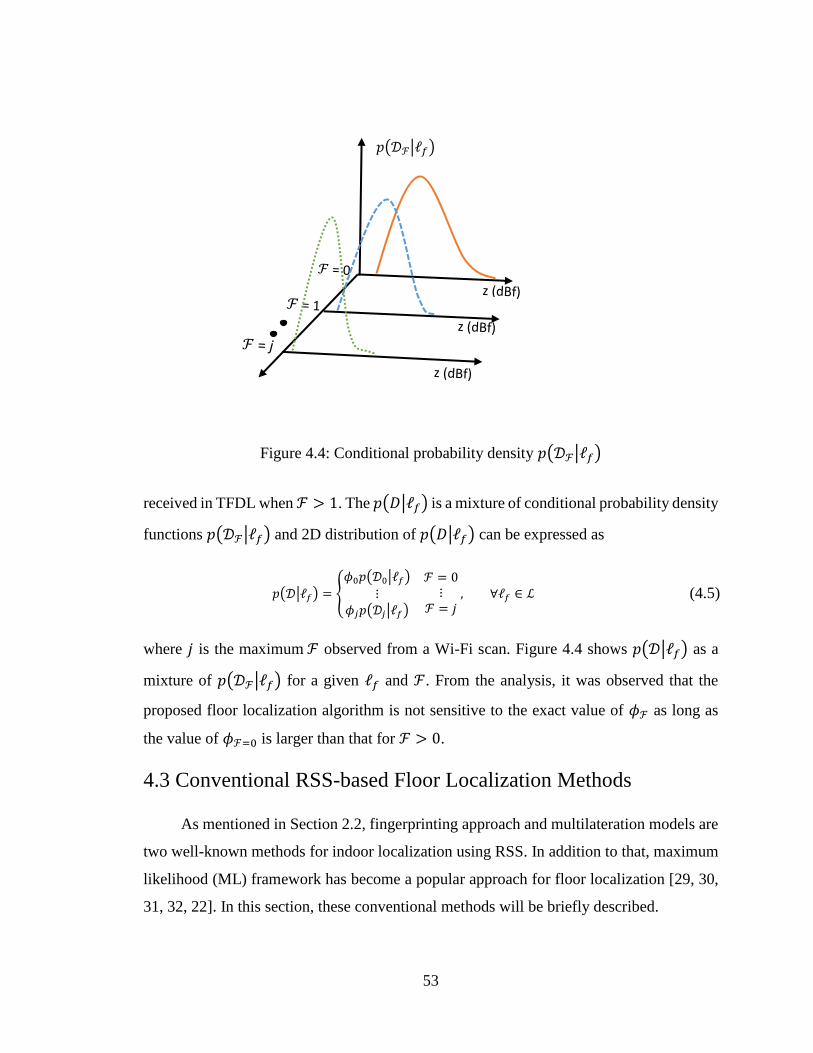
53
received in TFDL when ℱ > 1. The 𝑝(𝐷|ℓ𝑓) is a mixture of conditional probability density
functions 𝑝(𝒟ℱ|ℓ𝑓) and 2D distribution of 𝑝(𝐷|ℓ𝑓) can be expressed as
where 𝑗 is the maximum ℱ observed from a Wi-Fi scan. Figure 4.4 shows 𝑝(𝒟|ℓ𝑓) as a
mixture of 𝑝(𝒟ℱ|ℓ𝑓) for a given ℓ𝑓 and ℱ. From the analysis, it was observed that the
proposed floor localization algorithm is not sensitive to the exact value of 𝜙ℱ as long as
the value of 𝜙ℱ=0 is larger than that for ℱ > 0.
4.3 Conventional RSS-based Floor Localization Methods
As mentioned in Section 2.2, fingerprinting approach and multilateration models are
two well-known methods for indoor localization using RSS. In addition to that, maximum
likelihood (ML) framework has become a popular approach for floor localization [29, 30,
31, 32, 22]. In this section, these conventional methods will be briefly described.
Figure 4.4: Conditional probability density 𝑝(𝒟ℱ|ℓ𝑓)
𝑝(𝒟|ℓ𝑓) = {
𝜙0𝑝(𝒟0|ℓ𝑓)
⋮𝜙𝑗𝑝(𝒟𝑗|ℓ𝑓)
ℱ = 0⋮
ℱ = 𝑗, ∀ℓ𝑓 ∈ ℒ (4.5)
𝑝(𝒟ℱ|ℓ𝑓)
54
4.3.1 RSS Fingerprinting
RSS fingerprinting is based on the concept that signal strength changes over different
places, which in turn, makes it possible to assign each selected location with a unique signal
signature (termed as fingerprint) that can assist to identify that location with unknown
coordinates. Accessibility to large number of unique fingerprints leads to better location
accuracy. The fingerprinting technique can be divided into two stages: 1) offline or training
phase, and 2) online or localization phase [25, 63]. During the training phase, network
administrators generate a database with RSS values at some reference locations inside a
building. During the online phase, RSS readings captured by a mobile device (e.g.
smartphone) is compared with the pre-stored values in the database to locate the device.
Let, during the training phase, 𝑍𝑇𝑃𝑖 = {𝑧𝑇𝑃
1, 𝑧𝑇𝑃
2 … , 𝑧𝑇𝑃𝑚} be the set of RSS observables
of length 𝑚 at the 𝑖-th location, whose associated coordinates (𝑥𝑖 , 𝑦𝑖, 𝑧𝑖) are known, and
𝑧𝑇𝑃𝑚 denotes the RSS obtained from 𝑚-th AP. The set that contains information, such as
𝑍𝑇𝑃𝑖, IDs of the observed APs, coordinates of location 𝑖 etc., is called a fingerprint. The
generated database, termed as radio map, combines all such fingerprints collected at
different reference locations.
Let 𝑍𝑂𝑃 = {𝑧𝑂𝑃1
, 𝑧𝑂𝑃2 … , 𝑧𝑂𝑃
�́�} represent the RSS set observed during the online
phase after a network scan is performed at an unknown position with coordinates 𝑐 =
(𝑥𝑢, 𝑦𝑢, 𝑧𝑢). 𝑧𝑂𝑃�́� is the observed RSS value from the �́�-th AP. To identify the location,
a pattern matching method, such as KNN (mentioned earlier in Section 2.2), is utilized. As
an example, 1-nearest neighbor (1-NN) aims to locate the user’s unknown position as [25]
�̂� = 𝑎𝑟𝑔min(𝑑[𝑍𝑂𝑃, 𝑍𝑇𝑃𝑖]); 𝑖 = 1,2,3, … , 𝑁𝑓 (4.6)
where �̂� is the estimation of the unknown position, 𝑑[. ] denotes the dissimilarity, and 𝑁𝑓
is the total number of fingerprints in the database. Further, 𝑑[𝑍𝑂𝑃, 𝑍𝑇𝑃𝑖] can be shown as
the squared Euclidean distance between 𝑍𝑂𝑃 and 𝑍𝑇𝑃𝑖 [25]. i.e.
𝑑[𝑍𝑂𝑃, 𝑍𝑇𝑃𝑖] = ||𝑍𝑂𝑃 − 𝑍𝑇𝑃
𝑖||2; 𝑖 = 1,2,3, … , 𝑁𝑓 (4.7)
As mentioned in Chapter 2, to reduce the complexity and space needed in the
traditional fingerprinting method, a few simplified forms of the traditional methods were
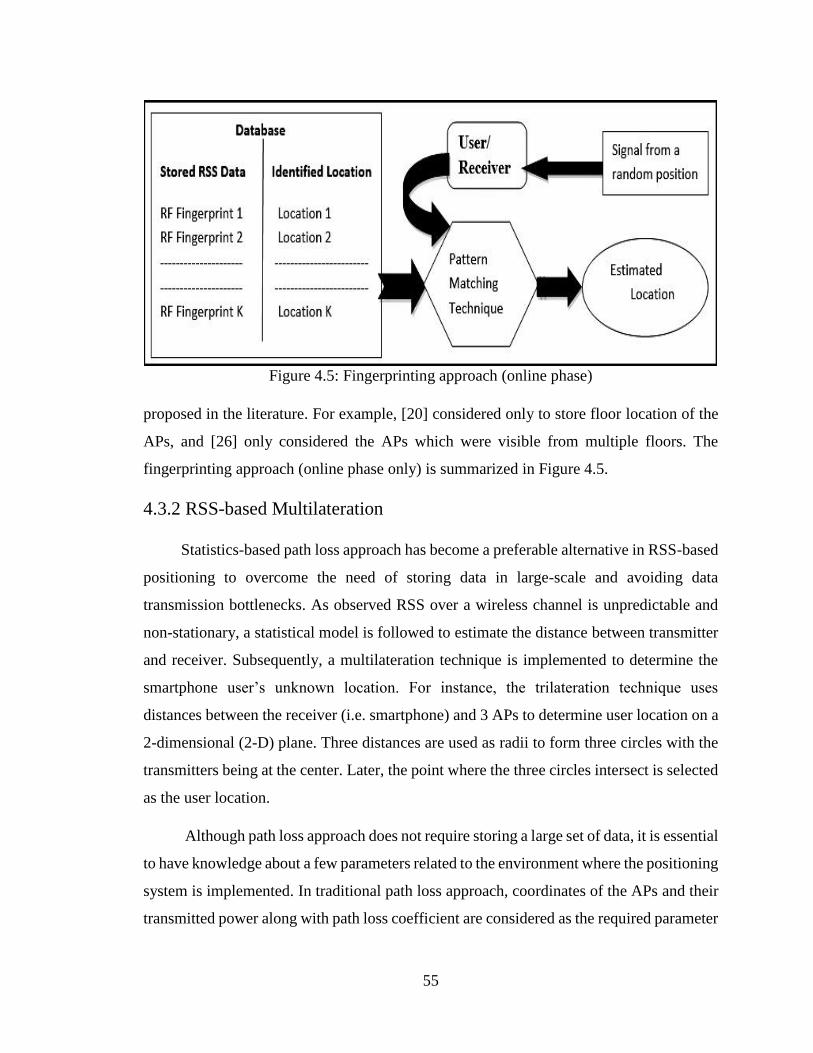
55
proposed in the literature. For example, [20] considered only to store floor location of the
APs, and [26] only considered the APs which were visible from multiple floors. The
fingerprinting approach (online phase only) is summarized in Figure 4.5.
4.3.2 RSS-based Multilateration
Statistics-based path loss approach has become a preferable alternative in RSS-based
positioning to overcome the need of storing data in large-scale and avoiding data
transmission bottlenecks. As observed RSS over a wireless channel is unpredictable and
non-stationary, a statistical model is followed to estimate the distance between transmitter
and receiver. Subsequently, a multilateration technique is implemented to determine the
smartphone user’s unknown location. For instance, the trilateration technique uses
distances between the receiver (i.e. smartphone) and 3 APs to determine user location on a
2-dimensional (2-D) plane. Three distances are used as radii to form three circles with the
transmitters being at the center. Later, the point where the three circles intersect is selected
as the user location.
Although path loss approach does not require storing a large set of data, it is essential
to have knowledge about a few parameters related to the environment where the positioning
system is implemented. In traditional path loss approach, coordinates of the APs and their
transmitted power along with path loss coefficient are considered as the required parameter
Figure 4.5: Fingerprinting approach (online phase)
56
for positioning [25]. Moreover, the concept of free space wave propagation is exploited,
which provides with the following equation
𝑃𝑟𝑖= 𝑃𝑇𝑗
− 10𝜂 log10 𝑑𝑗,𝑖 + 𝑛𝑗,𝑖 (4.8)
where 𝑃𝑟𝑖 is the received signal strength at 𝑖-th measurement point (user location), 𝑃𝑇𝑗
is
the transmitted power by 𝑗-th AP, 𝜂 is the path loss coefficient (𝜂 varies from 2 to 5 [63]),
and 𝑛𝑗,𝑖~𝒩(0, 𝜎𝑛2) is a noise factor due to measurement errors, small-scale fading, and
shadowing. Lastly, 𝑑𝑗,𝑖 is the Euclidean distance between 𝑗-th AP and 𝑖-th measurement
point, which can be expressed as
𝑑𝑗,𝑖 = √(𝑥𝑖 − 𝑥𝑗)2
+ (𝑦𝑖 − 𝑦𝑗)2
+ (𝑧𝑖 − 𝑧𝑗)2
(4.9)
where (𝑥𝑖, 𝑦𝑖, 𝑧𝑖) and (𝑥𝑗 , 𝑦𝑗 , 𝑧𝑗) are the coordinates of the 𝑖-th measurement point and 𝑗-th
AP, respectively.
4.3.3 Maximum Likelihood-based Approach
Due to its asymptotic optimality, ML is an attractive framework applicable to a
variety of problems involving parameter estimation and classification. Authors in [29, 30,
31, 32, 22] applied ML framework to floor localization. Nevertheless, ML estimators and
classifiers are inherently biased and are prone to significant issues due to the presence of
singularities when applied to problems involving multi-modal Gaussian distribution
mixtures such as Wi-Fi RSS observables inside buildings.
Approaches in this category only require the address of the APs and their locations,
and no offline calibration is needed. During the online phase, different algorithms are
followed to determine user location. Two of such algorithms are [22]:
a) Maximum RSS: After a Wi-Fi scan is performed during localization phase,
maximum RSS approach detects the AP from which maximum RSS is observed and selects
the corresponding floor hypothesis ℓ𝑓 as the output of the algorithm, i.e.
ℓ𝑀𝐿 = 𝑎𝑟𝑔𝑚𝑎𝑥(𝑍𝑂𝑃) (4.10)
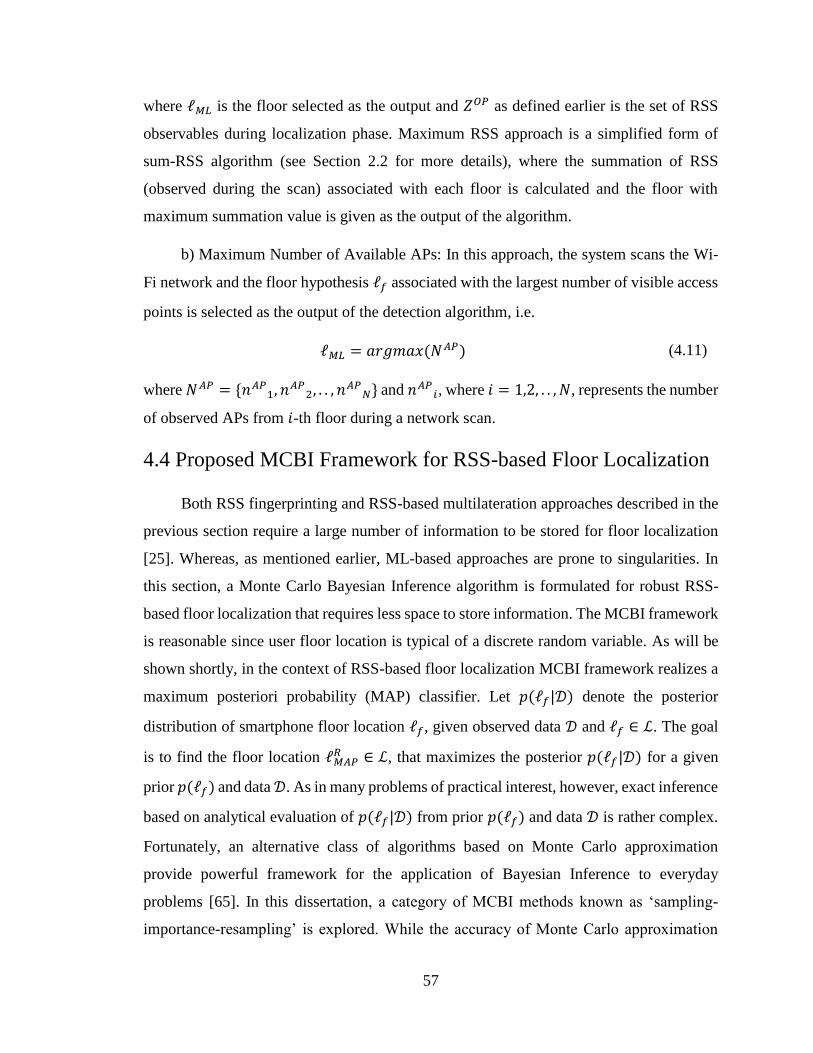
57
where ℓ𝑀𝐿 is the floor selected as the output and 𝑍𝑂𝑃 as defined earlier is the set of RSS
observables during localization phase. Maximum RSS approach is a simplified form of
sum-RSS algorithm (see Section 2.2 for more details), where the summation of RSS
(observed during the scan) associated with each floor is calculated and the floor with
maximum summation value is given as the output of the algorithm.
b) Maximum Number of Available APs: In this approach, the system scans the Wi-
Fi network and the floor hypothesis ℓ𝑓 associated with the largest number of visible access
points is selected as the output of the detection algorithm, i.e.
ℓ𝑀𝐿 = 𝑎𝑟𝑔𝑚𝑎𝑥(𝑁𝐴𝑃) (4.11)
where 𝑁𝐴𝑃 = {𝑛𝐴𝑃1, 𝑛𝐴𝑃
2, . . , 𝑛𝐴𝑃𝑁} and 𝑛𝐴𝑃
𝑖, where 𝑖 = 1,2, . . , 𝑁, represents the number
of observed APs from 𝑖-th floor during a network scan.
4.4 Proposed MCBI Framework for RSS-based Floor Localization
Both RSS fingerprinting and RSS-based multilateration approaches described in the
previous section require a large number of information to be stored for floor localization
[25]. Whereas, as mentioned earlier, ML-based approaches are prone to singularities. In
this section, a Monte Carlo Bayesian Inference algorithm is formulated for robust RSS-
based floor localization that requires less space to store information. The MCBI framework
is reasonable since user floor location is typical of a discrete random variable. As will be
shown shortly, in the context of RSS-based floor localization MCBI framework realizes a
maximum posteriori probability (MAP) classifier. Let 𝑝(ℓ𝑓|𝒟) denote the posterior
distribution of smartphone floor location ℓ𝑓, given observed data 𝒟 and ℓ𝑓 ∈ ℒ. The goal
is to find the floor location ℓ𝑀𝐴𝑃𝑅 ∈ ℒ, that maximizes the posterior 𝑝(ℓ𝑓|𝒟) for a given
prior 𝑝(ℓ𝑓) and data 𝒟. As in many problems of practical interest, however, exact inference
based on analytical evaluation of 𝑝(ℓ𝑓|𝒟) from prior 𝑝(ℓ𝑓) and data 𝒟 is rather complex.
Fortunately, an alternative class of algorithms based on Monte Carlo approximation
provide powerful framework for the application of Bayesian Inference to everyday
problems [65]. In this dissertation, a category of MCBI methods known as ‘sampling-
importance-resampling’ is explored. While the accuracy of Monte Carlo approximation
58
improves when a larger number of independent samples are used, nevertheless, the overall
accuracy does not depend on the dimensionality of the sampling space, and high accuracy
may be achieved with relatively small number of samples [65, 66].
The first step is to draw unweighted samples from the prior 𝑝(ℓ𝑓). When no prior
information about smartphone user floor location is available, sampling from a non-
informative prior (uniform distribution) is an obvious strategy. For example, for floor
localization in an 𝑁-story building 𝑁 unweighted samples of a uniform prior distribution
can be obtained such that 𝑝(ℓ𝑓) = 1/𝑁 ∀ℓ𝑓 ∈ ℒ. However, a more effective strategy is
to draw samples from areas of 𝑝(ℓ𝑓) with high probability. The main advantage of drawing
samples from areas with high probability is that very efficient posterior inference can result
from a small number of samples [65, 66]. Let ℓ𝑓 ∈ ℒ𝑠 denote samples drawn from areas of
the prior distribution with high probability such that
𝑝(ℓ𝑓) =1
𝑁s , ℒ𝑠 ⊆ ℒ and 𝑁s ≤ 𝑁 (4.12)
In this dissertation, the sample set ℒ𝑠 includes the subset of floors that are associated
with the APs discovered during a recent wireless network scan. This is feasible since due
to RF pathloss and penetration losses in buildings, APs with large smartphone-AP floor
separation (> 2) are highly unlikely to be discovered, as shown in TABLE 4.1.
The next step is to generate a set of posterior samples by updating the prior samples
through the medium of importance weighting. Recall from Bayes’ theorem that 𝑝(ℓ𝑓|𝒟) =
𝑝(𝒟|ℓ𝑓)𝑝(ℓ𝑓)/𝑝(𝒟) [67]. Let 𝑝(ℓ𝑓|𝒟) = 𝑝(𝒟|ℓ𝑓)𝑝(ℓ𝑓) denote the unnormalized target
posterior distribution. Consequently, normalized importance weights, 𝜔𝑓, may be
calculated as [65]
𝜔𝑓 =𝑝(ℓ𝑓|𝒟)/𝑝(ℓ𝑓)
∑ 𝑝(ℓ�́�|𝒟)/𝑝(ℓ�́�)ℓ�́�
=𝑝(𝒟|ℓ𝑓)
∑ 𝑝(𝒟|ℓ�́�)ℓ�́�
, ℓ𝑓 ∈ ℒs (4.13)
where the quantity 𝑝(𝒟|ℓ𝑓) is evaluated for the observed dataset 𝒟. Since RSS observables
from spatially separated APs are statistically independent due to multipath fading inside
buildings, 𝑝(𝒟|ℓ𝑓) can be calculated from the product rule of probability as
59
𝑝(𝒟|ℓ𝑓) = ∏ 𝑝(𝑑𝑚|ℓ𝑓)
𝑚
, ℓ𝑓 ∈ ℒs (4.14)
where 𝑝(𝑑𝑚|ℓ𝑓) is calculated using normalized conditional probability density 𝑝(𝒟ℱ|ℓ𝑓)
introduced in Section 4.2.
The calculated weights 𝜔𝑓 from (4.13) are then used to approximate the posterior
probabilities as
𝑝(ℓ𝑓|𝒟) = ω𝑓 , ℓ𝑓 ∈ ℒs (4.15)
Finally, a MAP classifier based on maximum posterior expectation picks mobile user floor
location as
ℓMAP𝑅 = arg max
ℓ𝑓 ∈ ℒs[𝑝(ℓ𝑓|𝒟)] (4.16)
4.5 Results and Analysis
To do a comprehensive performance analysis of the proposed MAP classifier, RSS
readings from APs were measured alongside BP from the three multistory buildings
mentioned in Section 3.4. Different structural designs and construction materials of the
buildings made those well-fitted for evaluating the robustness of a localization method.
Depending on the floor area to be covered, each floor in all three buildings is equipped
with 5-14 APs. Nevertheless, in some areas such as washrooms, stairways, either the RSS
was weak or no access to Wi-Fi was available.
As mentioned in Section 3.4, an Arduino comprising of Broadcom BCM43362 radio
capable of measuring Wi-Fi RSS values with a resolution of 1 dBm was used with a sample
rate of 1 hertz for RSS measurements. Data 𝒟, comprising of 2.4 GHz Wi-Fi RSS from a
plurality of APs and corresponding floor locations was captured, as the mobile device was
moved by a pedestrian. For each mobile floor location, ℓ𝑓, measured RSS values 𝑧, were
grouped based on their corresponding AP floor locations 𝑡. It is required to store the address
of the APs and their corresponding floor numbers in the database. The information about
the APs inside a building can be easily obtained from the network administrator of that
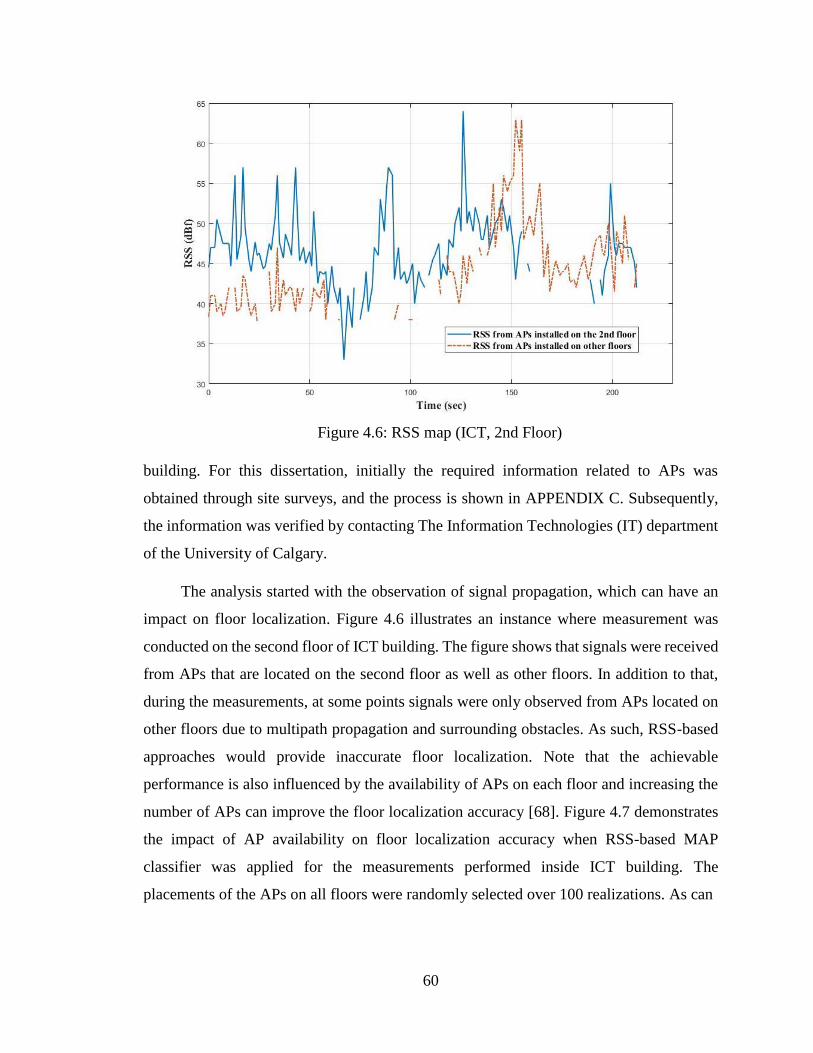
60
Figure 4.6: RSS map (ICT, 2nd Floor)
building. For this dissertation, initially the required information related to APs was
obtained through site surveys, and the process is shown in APPENDIX C. Subsequently,
the information was verified by contacting The Information Technologies (IT) department
of the University of Calgary.
The analysis started with the observation of signal propagation, which can have an
impact on floor localization. Figure 4.6 illustrates an instance where measurement was
conducted on the second floor of ICT building. The figure shows that signals were received
from APs that are located on the second floor as well as other floors. In addition to that,
during the measurements, at some points signals were only observed from APs located on
other floors due to multipath propagation and surrounding obstacles. As such, RSS-based
approaches would provide inaccurate floor localization. Note that the achievable
performance is also influenced by the availability of APs on each floor and increasing the
number of APs can improve the floor localization accuracy [68]. Figure 4.7 demonstrates
the impact of AP availability on floor localization accuracy when RSS-based MAP
classifier was applied for the measurements performed inside ICT building. The
placements of the APs on all floors were randomly selected over 100 realizations. As can
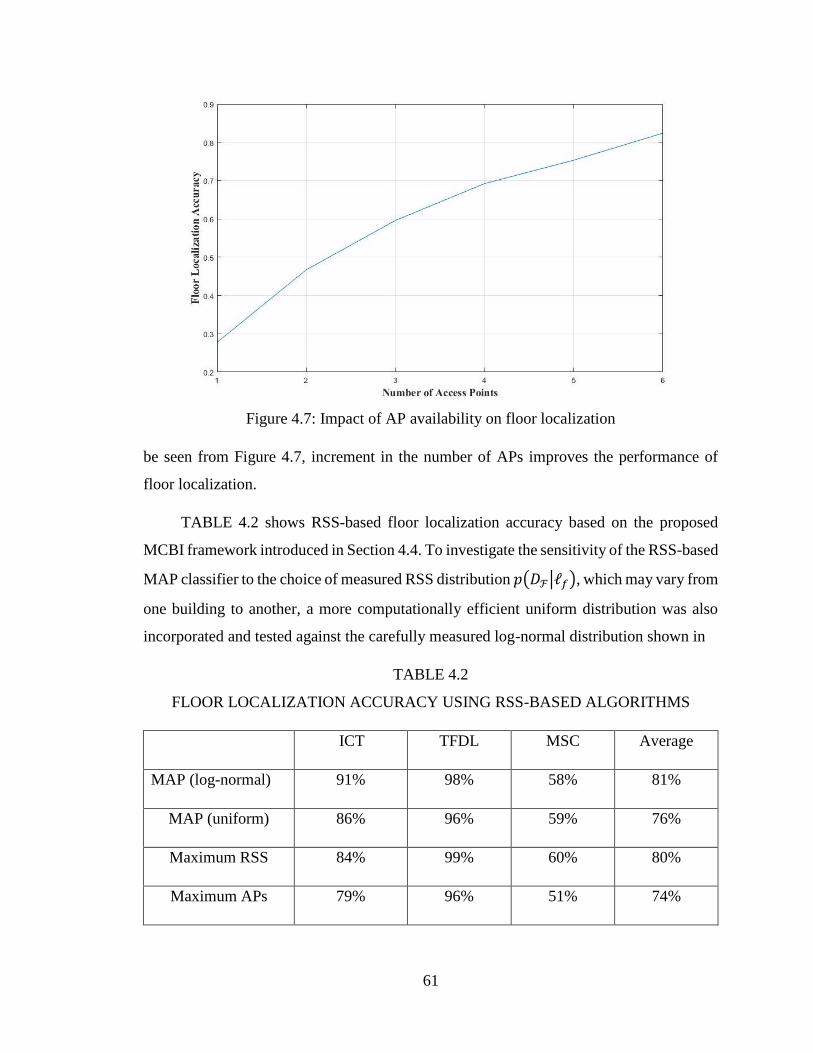
61
Figure 4.7: Impact of AP availability on floor localization
be seen from Figure 4.7, increment in the number of APs improves the performance of
floor localization.
TABLE 4.2 shows RSS-based floor localization accuracy based on the proposed
MCBI framework introduced in Section 4.4. To investigate the sensitivity of the RSS-based
MAP classifier to the choice of measured RSS distribution 𝑝(𝐷ℱ|ℓ𝑓), which may vary from
one building to another, a more computationally efficient uniform distribution was also
incorporated and tested against the carefully measured log-normal distribution shown in
TABLE 4.2
FLOOR LOCALIZATION ACCURACY USING RSS-BASED ALGORITHMS
ICT TFDL MSC Average
MAP (log-normal) 91% 98% 58% 81%
MAP (uniform) 86% 96% 59% 76%
Maximum RSS 84% 99% 60% 80%
Maximum APs 79% 96% 51% 74%
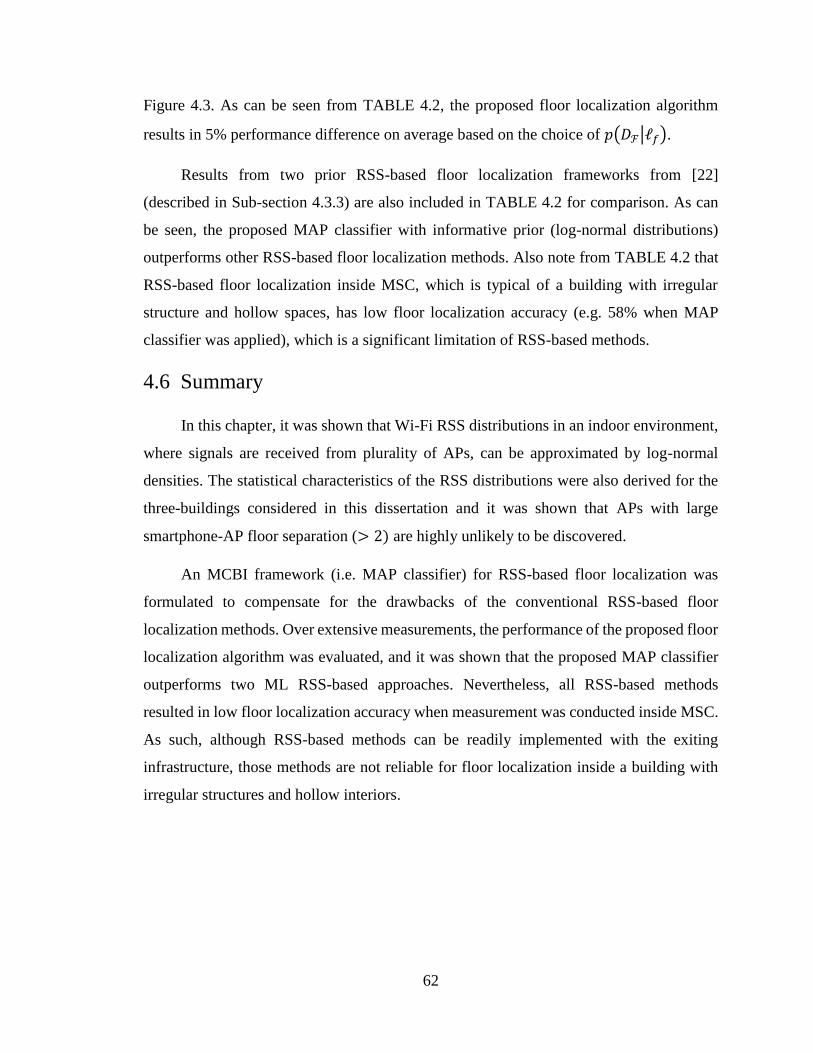
62
Figure 4.3. As can be seen from TABLE 4.2, the proposed floor localization algorithm
results in 5% performance difference on average based on the choice of 𝑝(𝐷ℱ|ℓ𝑓).
Results from two prior RSS-based floor localization frameworks from [22]
(described in Sub-section 4.3.3) are also included in TABLE 4.2 for comparison. As can
be seen, the proposed MAP classifier with informative prior (log-normal distributions)
outperforms other RSS-based floor localization methods. Also note from TABLE 4.2 that
RSS-based floor localization inside MSC, which is typical of a building with irregular
structure and hollow spaces, has low floor localization accuracy (e.g. 58% when MAP
classifier was applied), which is a significant limitation of RSS-based methods.
4.6 Summary
In this chapter, it was shown that Wi-Fi RSS distributions in an indoor environment,
where signals are received from plurality of APs, can be approximated by log-normal
densities. The statistical characteristics of the RSS distributions were also derived for the
three-buildings considered in this dissertation and it was shown that APs with large
smartphone-AP floor separation (> 2) are highly unlikely to be discovered.
An MCBI framework (i.e. MAP classifier) for RSS-based floor localization was
formulated to compensate for the drawbacks of the conventional RSS-based floor
localization methods. Over extensive measurements, the performance of the proposed floor
localization algorithm was evaluated, and it was shown that the proposed MAP classifier
outperforms two ML RSS-based approaches. Nevertheless, all RSS-based methods
resulted in low floor localization accuracy when measurement was conducted inside MSC.
As such, although RSS-based methods can be readily implemented with the exiting
infrastructure, those methods are not reliable for floor localization inside a building with
irregular structures and hollow interiors.
63
Chapter 5: Floor Localization Using
Proposed Sensor Fusion Framework
5.1 Introduction
The primary goal in designing floor localization system is to formulate a system at
reasonable cost that has high accuracy and low complexity. As described in previous
chapters, although low-cost floor localization systems based on barometric altimetry (BA)
and received signal strength (RSS)-based are readily available, both systems lack the
required accuracy for many commercial and non-commercial applications such as search
and rescue. As well, differential barometric altimetry (DBA)-based floor localization
systems, although fairly accurate, are not compatible with the available infrastructure. As
such, a method is required that can be conveniently implemented to gain high accuracy in
floor detection.
In this chapter, a novel RSS-aided BA algorithm is proposed for floor localization,
where the novelty is the fusion (combination) of both the RSS and barometer measurement
values using Kalman filter (KF). The proposed system can be deployed with available
infrastructure and can achieve high accuracy. The result is comparable to that of DBA-
based floor localization system. The rest of the chapter is structured as follows. In Section
5.2 a brief description about KF is given. The proposed sensor fusion algorithm is
formulated in Section 5.3. Section 5.4 evaluates the performance of the sensor fusion
algorithm in comparison with that of RSS-only, BA-only, and DBA-only localization
methods. Lastly, a summary is given in section 5.5.
5.2 Kalman Filter
Kalman filter is over 50 years old, and yet it is one of the most prevalent and popular
techniques for data fusion in use today. The filter was named after Rudolf Emil Kalman,
who proposed it in late 1958 [69]. KF is a convenient mathematical tool to solve a problem,
which follows a Bayesian approach and uses prior knowledge to estimate the next state of
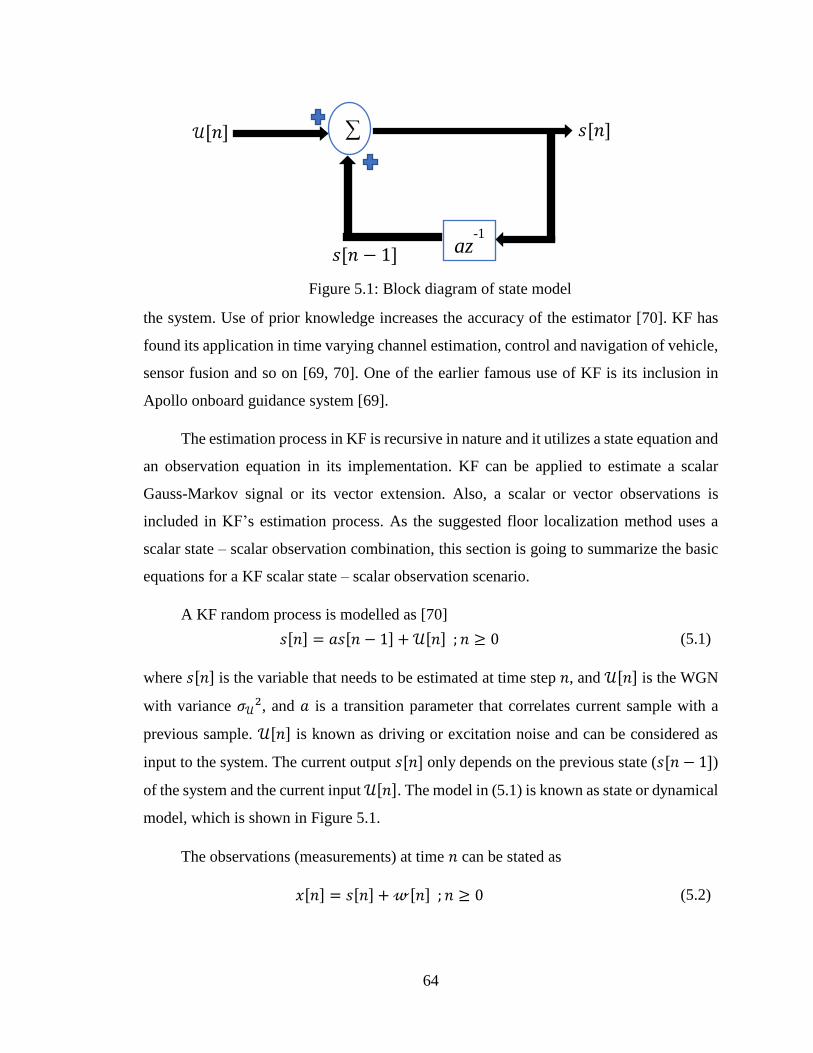
64
the system. Use of prior knowledge increases the accuracy of the estimator [70]. KF has
found its application in time varying channel estimation, control and navigation of vehicle,
sensor fusion and so on [69, 70]. One of the earlier famous use of KF is its inclusion in
Apollo onboard guidance system [69].
The estimation process in KF is recursive in nature and it utilizes a state equation and
an observation equation in its implementation. KF can be applied to estimate a scalar
Gauss-Markov signal or its vector extension. Also, a scalar or vector observations is
included in KF’s estimation process. As the suggested floor localization method uses a
scalar state – scalar observation combination, this section is going to summarize the basic
equations for a KF scalar state – scalar observation scenario.
A KF random process is modelled as [70]
where 𝑠[𝑛] is the variable that needs to be estimated at time step 𝑛, and 𝒰[𝑛] is the WGN
with variance 𝜎𝒰2, and 𝑎 is a transition parameter that correlates current sample with a
previous sample. 𝒰[𝑛] is known as driving or excitation noise and can be considered as
input to the system. The current output 𝑠[𝑛] only depends on the previous state (𝑠[𝑛 − 1])
of the system and the current input 𝒰[𝑛]. The model in (5.1) is known as state or dynamical
model, which is shown in Figure 5.1.
The observations (measurements) at time 𝑛 can be stated as
𝑥[𝑛] = 𝑠[𝑛] + 𝓌[𝑛] ; 𝑛 ≥ 0 (5.2)
Figure 5.1: Block diagram of state model
𝑠[𝑛] = 𝑎𝑠[𝑛 − 1] + 𝒰[𝑛] ; 𝑛 ≥ 0 (5.1)
az-1
∑ 𝑠[𝑛]
𝑠[𝑛 − 1]
𝒰[𝑛]
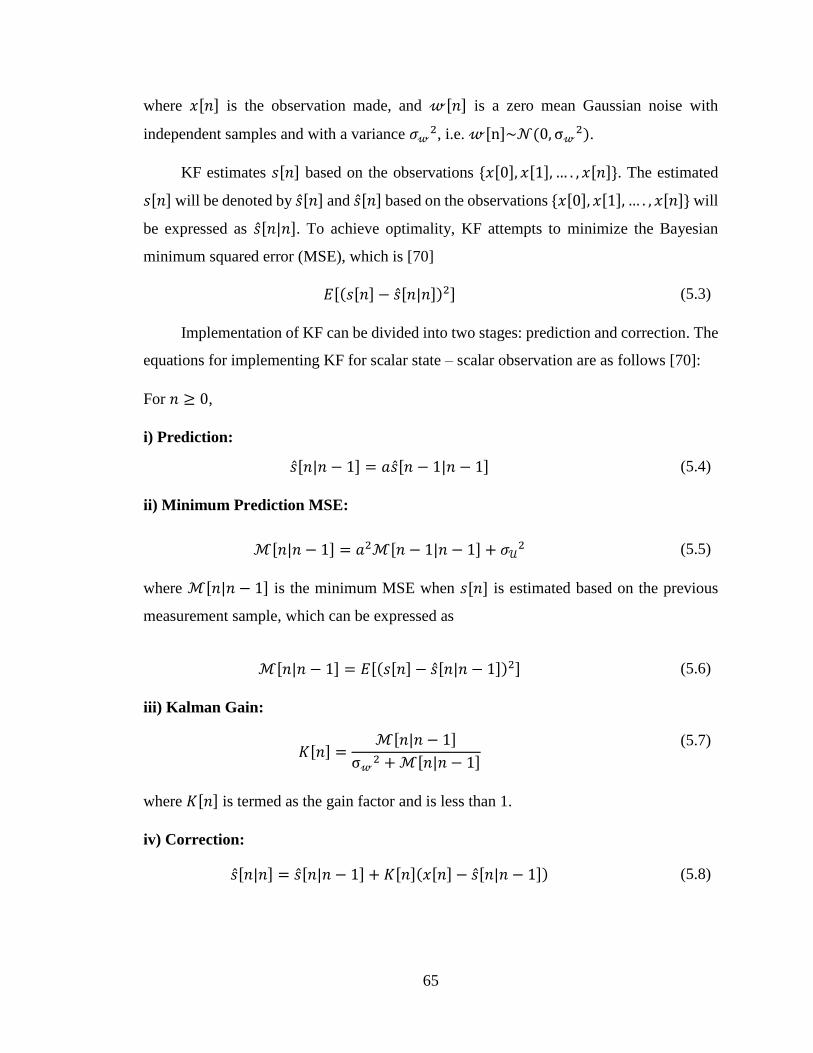
65
where 𝑥[𝑛] is the observation made, and 𝓌[𝑛] is a zero mean Gaussian noise with
independent samples and with a variance 𝜎𝓌2, i.e. 𝓌[n]~𝒩(0, σ𝓌
2).
KF estimates 𝑠[𝑛] based on the observations {𝑥[0], 𝑥[1], … . , 𝑥[𝑛]}. The estimated
𝑠[𝑛] will be denoted by �̂�[𝑛] and �̂�[𝑛] based on the observations {𝑥[0], 𝑥[1], … . , 𝑥[𝑛]} will
be expressed as �̂�[𝑛|𝑛]. To achieve optimality, KF attempts to minimize the Bayesian
minimum squared error (MSE), which is [70]
Implementation of KF can be divided into two stages: prediction and correction. The
equations for implementing KF for scalar state – scalar observation are as follows [70]:
For 𝑛 ≥ 0,
i) Prediction:
ii) Minimum Prediction MSE:
where ℳ[𝑛|𝑛 − 1] is the minimum MSE when 𝑠[𝑛] is estimated based on the previous
measurement sample, which can be expressed as
iii) Kalman Gain:
where 𝐾[𝑛] is termed as the gain factor and is less than 1.
iv) Correction:
𝐸[(𝑠[𝑛] − �̂�[𝑛|𝑛])2] (5.3)
�̂�[𝑛|𝑛 − 1] = 𝑎�̂�[𝑛 − 1|𝑛 − 1] (5.4)
ℳ[𝑛|𝑛 − 1] = 𝑎2ℳ[𝑛 − 1|𝑛 − 1] + 𝜎𝒰2 (5.5)
ℳ[𝑛|𝑛 − 1] = 𝐸[(𝑠[𝑛] − �̂�[𝑛|𝑛 − 1])2] (5.6)
𝐾[𝑛] =ℳ[𝑛|𝑛 − 1]
σ𝓌2 + ℳ[𝑛|𝑛 − 1]
(5.7)
�̂�[𝑛|𝑛] = �̂�[𝑛|𝑛 − 1] + 𝐾[𝑛](𝑥[𝑛] − �̂�[𝑛|𝑛 − 1]) (5.8)
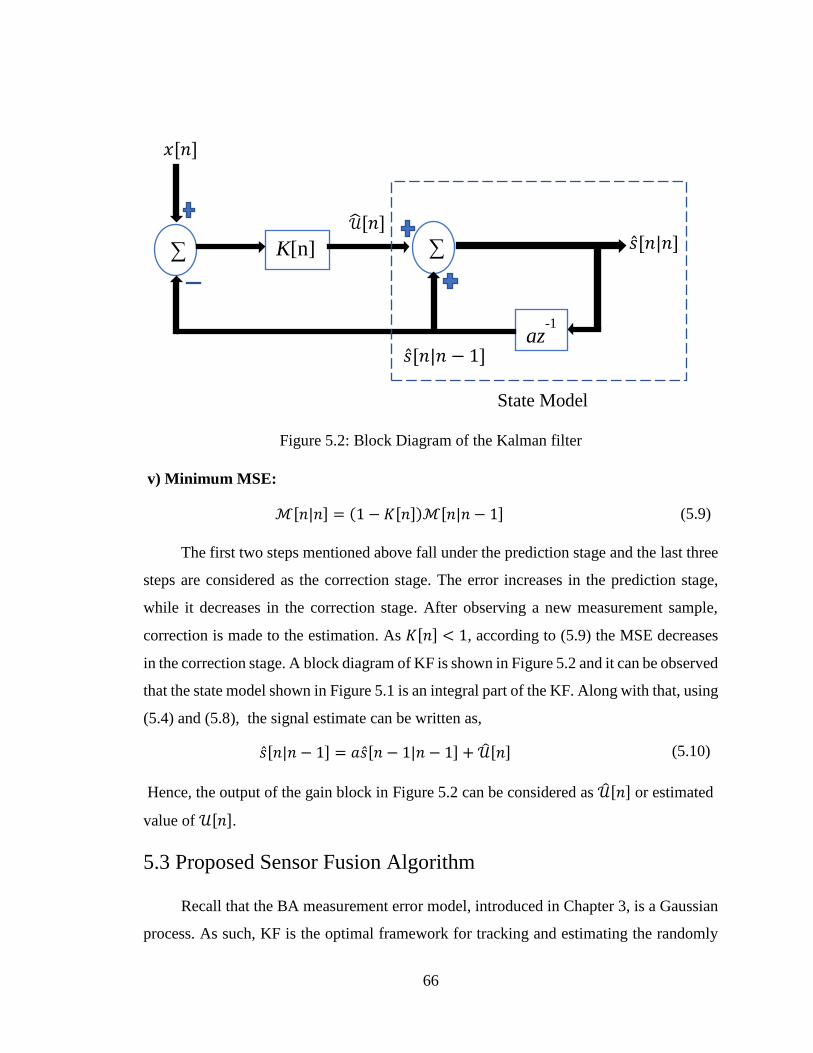
66
v) Minimum MSE:
The first two steps mentioned above fall under the prediction stage and the last three
steps are considered as the correction stage. The error increases in the prediction stage,
while it decreases in the correction stage. After observing a new measurement sample,
correction is made to the estimation. As 𝐾[𝑛] < 1, according to (5.9) the MSE decreases
in the correction stage. A block diagram of KF is shown in Figure 5.2 and it can be observed
that the state model shown in Figure 5.1 is an integral part of the KF. Along with that, using
(5.4) and (5.8), the signal estimate can be written as,
Hence, the output of the gain block in Figure 5.2 can be considered as �̂�[𝑛] or estimated
value of 𝒰[𝑛].
5.3 Proposed Sensor Fusion Algorithm
Recall that the BA measurement error model, introduced in Chapter 3, is a Gaussian
process. As such, KF is the optimal framework for tracking and estimating the randomly
Figure 5.2: Block Diagram of the Kalman filter
ℳ[𝑛|𝑛] = (1 − 𝐾[𝑛])ℳ[𝑛|𝑛 − 1] (5.9)
�̂�[𝑛|𝑛 − 1] = 𝑎�̂�[𝑛 − 1|𝑛 − 1] + �̂�[𝑛] (5.10)
az-1
∑ K[n] ∑ �̂�[𝑛|𝑛]
�̂�[𝑛|𝑛 − 1]
𝒰ෝ[𝑛]
𝑥[𝑛]
State Model
67
varying bias 𝑏𝑘. In the implementation stage, KF requires a physical model that represents
how the current state of a system evolves from its previous state. In this dissertation, the
first order random walk model introduced in (3.5) is used to update KF state variable
during the prediction stage as
𝑏𝑘+𝑚 = 𝑏𝑘 + √𝑚 𝑤𝑏
The correction is done when an RSS value can be mapped to a floor. In the correction
stage of the KF, the Monte Carlo Bayesian Inference (MCBI) scheme developed in Chapter
4 is used to determine smartphone floor location and subsequently the associated correct
floor height, denoted as ℎ𝑅𝑆𝑆. Later, ℎ𝑅𝑆𝑆 is used to update (correct) bias 𝑏𝑘. As mentioned
before, the MCBI framework is reasonable since user floor location is typical of a discrete
random variable. As shown in Chapter 4, in the context of RSS-based floor localization the
proposed MCBI framework realizes a maximum posteriori probability (MAP) classifier.
The correct floor height ℎ𝑅𝑆𝑆 (determined from ℓMAP𝑅 using RSS-based MAP classifier)
and building floor height information, which is assumed to be known a priori, are applied
in the correction stage of the KF as
ℎ𝑅𝑆𝑆 = ℎ̃[𝑛] − 𝑏𝑘 + 𝑣[𝑛] (5.11)
where ℎ̃[𝑛] is the measured height using barometer at the 𝑛-th iteration of KF, 𝑣 is the
measurement noise with standard deviation of 𝜎v, and 𝑏𝑘 is the randomly varying bias term,
defined in Chapter 3.
Finally, the last updated 𝑏𝑘 is used to estimate correct height according to (3.7) as
ℎ̂[𝑛]|𝑏𝑘 = ℎ̃𝑘+𝑚[𝑛] − 𝑏𝑘
where as mentioned in Section 3.3, ℎ̂[𝑛]|𝑏𝑘 is the estimated height for a known 𝑏𝑘 with
var(ℎ̂[𝑛]|𝑏𝑘) = 𝑚σ𝑏2 + 𝜎𝑤
2 . Subsequently, a MAP classifier based on minimum
probability of error criteria introduced in (3.15) is used to estimate mobile user floor
location as
ℓ𝑀𝐴𝑃 = 𝑎𝑟𝑔 𝑚𝑖𝑛ℓ𝑓∈ℒ
[(ℎ̂[𝑛]|𝑏𝑘 − ℎ𝑓)2
]
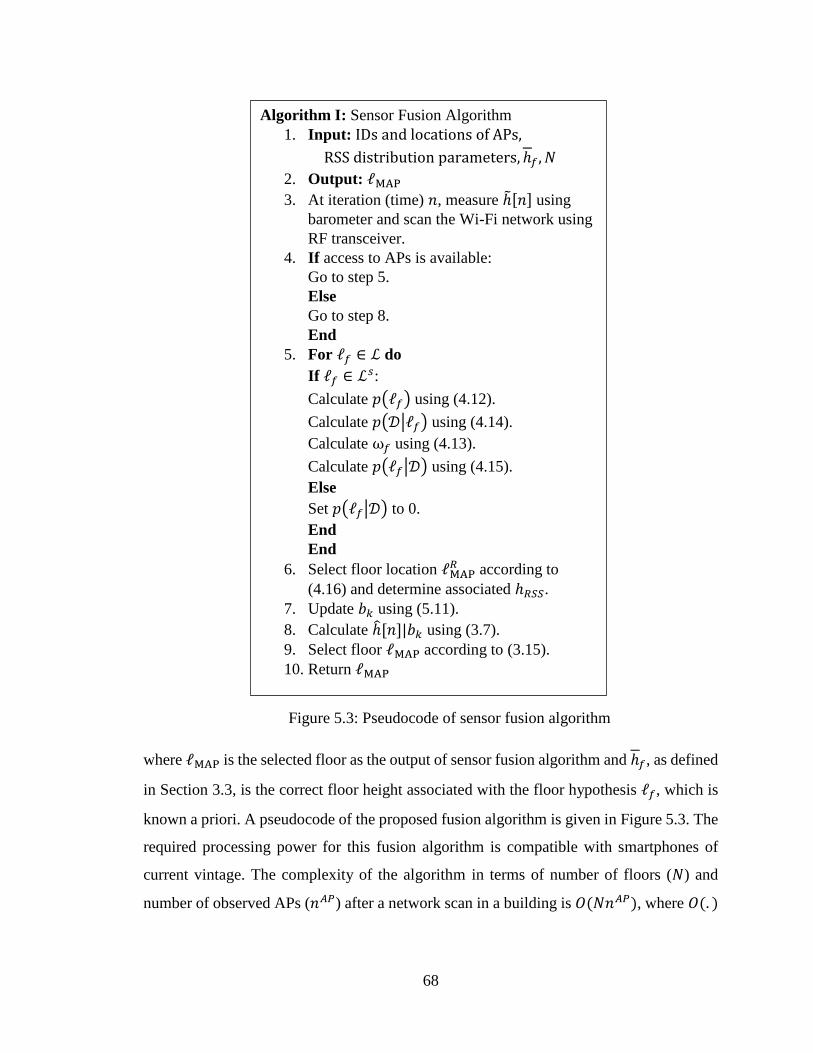
68
where ℓMAP is the selected floor as the output of sensor fusion algorithm and ℎ𝑓, as defined
in Section 3.3, is the correct floor height associated with the floor hypothesis ℓ𝑓, which is
known a priori. A pseudocode of the proposed fusion algorithm is given in Figure 5.3. The
required processing power for this fusion algorithm is compatible with smartphones of
current vintage. The complexity of the algorithm in terms of number of floors (𝑁) and
number of observed APs (𝑛𝐴𝑃) after a network scan in a building is 𝑂(𝑁𝑛𝐴𝑃), where 𝑂(. )
Figure 5.3: Pseudocode of sensor fusion algorithm
Algorithm I: Sensor Fusion Algorithm
1. Input: IDs and locations of APs,
RSS distribution parameters, ℎ𝑓 , 𝑁
2. Output: ℓMAP
3. At iteration (time) 𝑛, measure ℎ̃[𝑛] using
barometer and scan the Wi-Fi network using
RF transceiver.
4. If access to APs is available:
Go to step 5.
Else
Go to step 8.
End
5. For ℓ𝑓 ∈ ℒ do
If ℓ𝑓 ∈ ℒ𝑠:
Calculate 𝑝(ℓ𝑓) using (4.12).
Calculate 𝑝(𝒟|ℓ𝑓) using (4.14).
Calculate ω𝑓 using (4.13).
Calculate 𝑝(ℓ𝑓|𝒟) using (4.15).
Else
Set 𝑝(ℓ𝑓|𝒟) to 0.
End
End
6. Select floor location ℓMAP𝑅 according to
(4.16) and determine associated ℎ𝑅𝑆𝑆.
7. Update 𝑏𝑘 using (5.11).
8. Calculate ℎ̂[𝑛]|𝑏𝑘 using (3.7).
9. Select floor ℓMAP according to (3.15).
10. Return ℓMAP
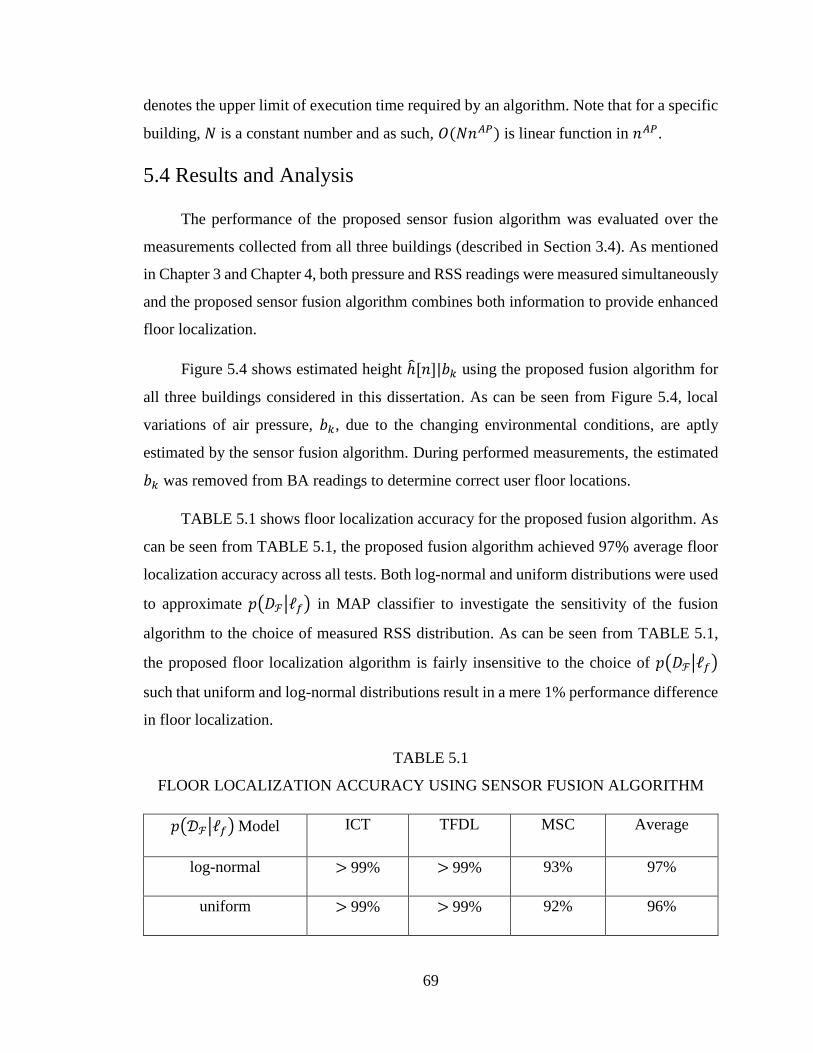
69
denotes the upper limit of execution time required by an algorithm. Note that for a specific
building, 𝑁 is a constant number and as such, 𝑂(𝑁𝑛𝐴𝑃) is linear function in 𝑛𝐴𝑃.
5.4 Results and Analysis
The performance of the proposed sensor fusion algorithm was evaluated over the
measurements collected from all three buildings (described in Section 3.4). As mentioned
in Chapter 3 and Chapter 4, both pressure and RSS readings were measured simultaneously
and the proposed sensor fusion algorithm combines both information to provide enhanced
floor localization.
Figure 5.4 shows estimated height ℎ̂[𝑛]|𝑏𝑘 using the proposed fusion algorithm for
all three buildings considered in this dissertation. As can be seen from Figure 5.4, local
variations of air pressure, 𝑏𝑘, due to the changing environmental conditions, are aptly
estimated by the sensor fusion algorithm. During performed measurements, the estimated
𝑏𝑘 was removed from BA readings to determine correct user floor locations.
TABLE 5.1 shows floor localization accuracy for the proposed fusion algorithm. As
can be seen from TABLE 5.1, the proposed fusion algorithm achieved 97% average floor
localization accuracy across all tests. Both log-normal and uniform distributions were used
to approximate 𝑝(𝐷ℱ|ℓ𝑓) in MAP classifier to investigate the sensitivity of the fusion
algorithm to the choice of measured RSS distribution. As can be seen from TABLE 5.1,
the proposed floor localization algorithm is fairly insensitive to the choice of 𝑝(𝐷ℱ|ℓ𝑓)
such that uniform and log-normal distributions result in a mere 1% performance difference
in floor localization.
TABLE 5.1
FLOOR LOCALIZATION ACCURACY USING SENSOR FUSION ALGORITHM
𝑝(𝒟ℱ|ℓ𝑓) Model ICT TFDL MSC Average
log-normal > 99% > 99% 93% 97%
uniform > 99% > 99% 92% 96%
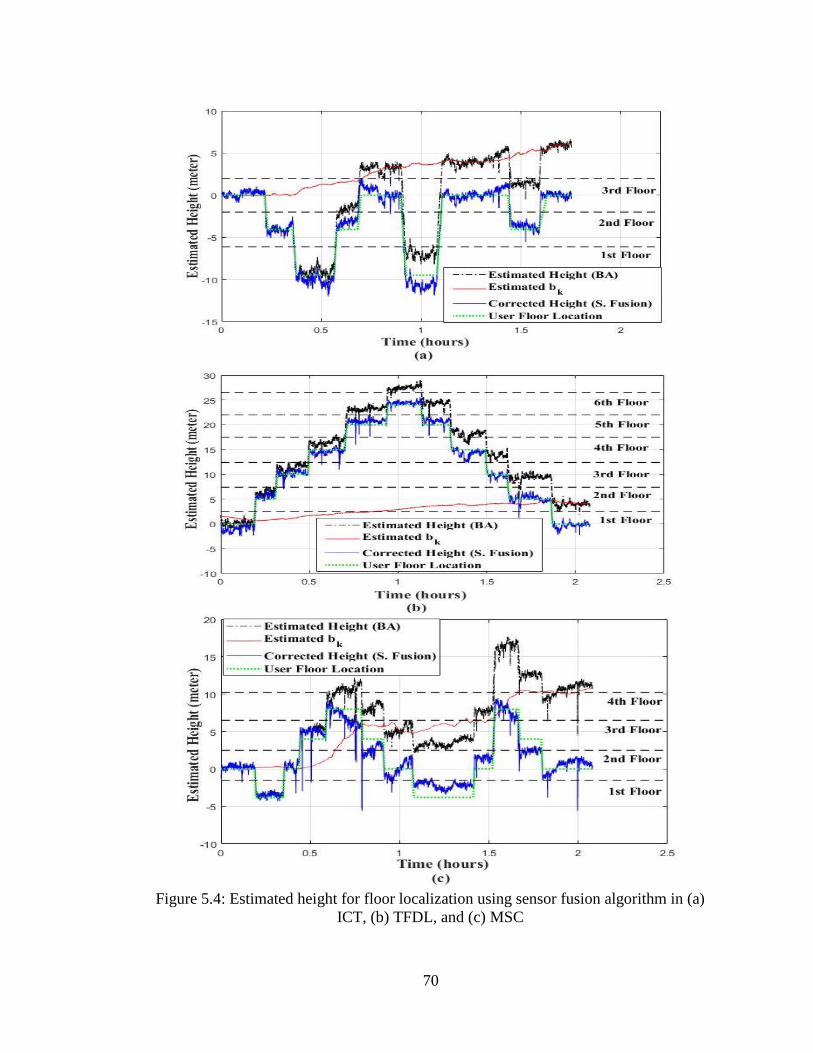
70
Figure 5.4: Estimated height for floor localization using sensor fusion algorithm in (a)
ICT, (b) TFDL, and (c) MSC
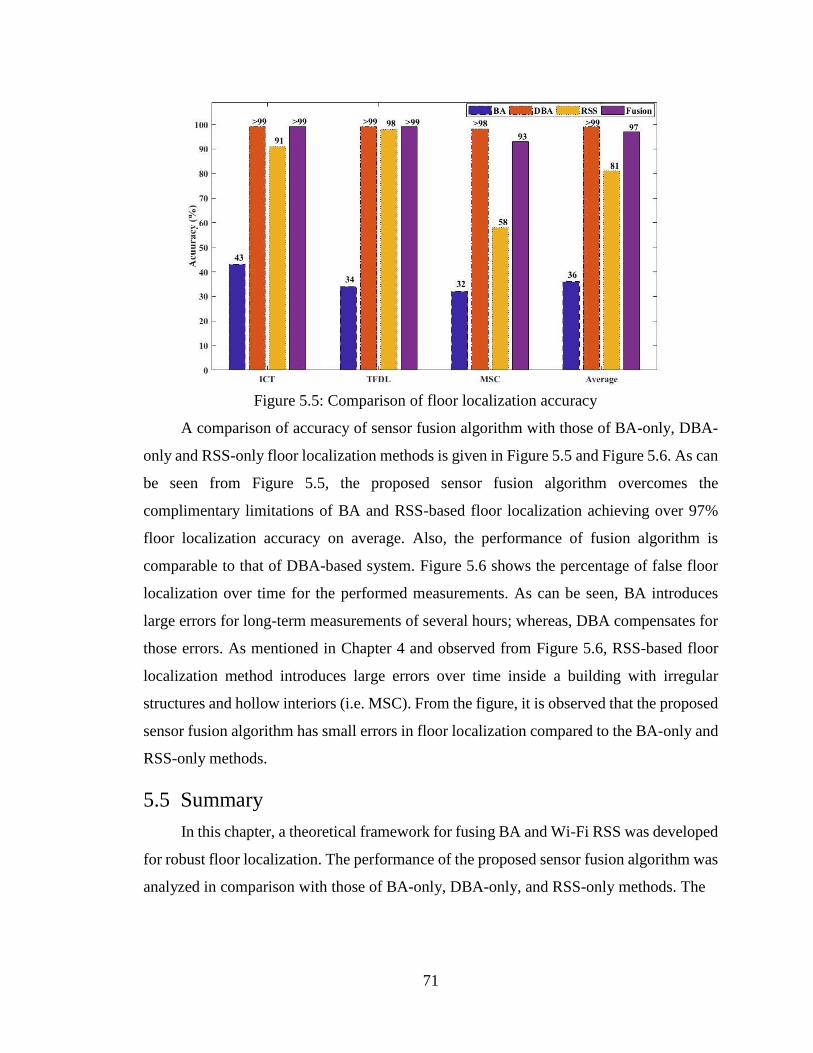
71
Figure 5.5: Comparison of floor localization accuracy
A comparison of accuracy of sensor fusion algorithm with those of BA-only, DBA-
only and RSS-only floor localization methods is given in Figure 5.5 and Figure 5.6. As can
be seen from Figure 5.5, the proposed sensor fusion algorithm overcomes the
complimentary limitations of BA and RSS-based floor localization achieving over 97%
floor localization accuracy on average. Also, the performance of fusion algorithm is
comparable to that of DBA-based system. Figure 5.6 shows the percentage of false floor
localization over time for the performed measurements. As can be seen, BA introduces
large errors for long-term measurements of several hours; whereas, DBA compensates for
those errors. As mentioned in Chapter 4 and observed from Figure 5.6, RSS-based floor
localization method introduces large errors over time inside a building with irregular
structures and hollow interiors (i.e. MSC). From the figure, it is observed that the proposed
sensor fusion algorithm has small errors in floor localization compared to the BA-only and
RSS-only methods.
5.5 Summary
In this chapter, a theoretical framework for fusing BA and Wi-Fi RSS was developed
for robust floor localization. The performance of the proposed sensor fusion algorithm was
analyzed in comparison with those of BA-only, DBA-only, and RSS-only methods. The
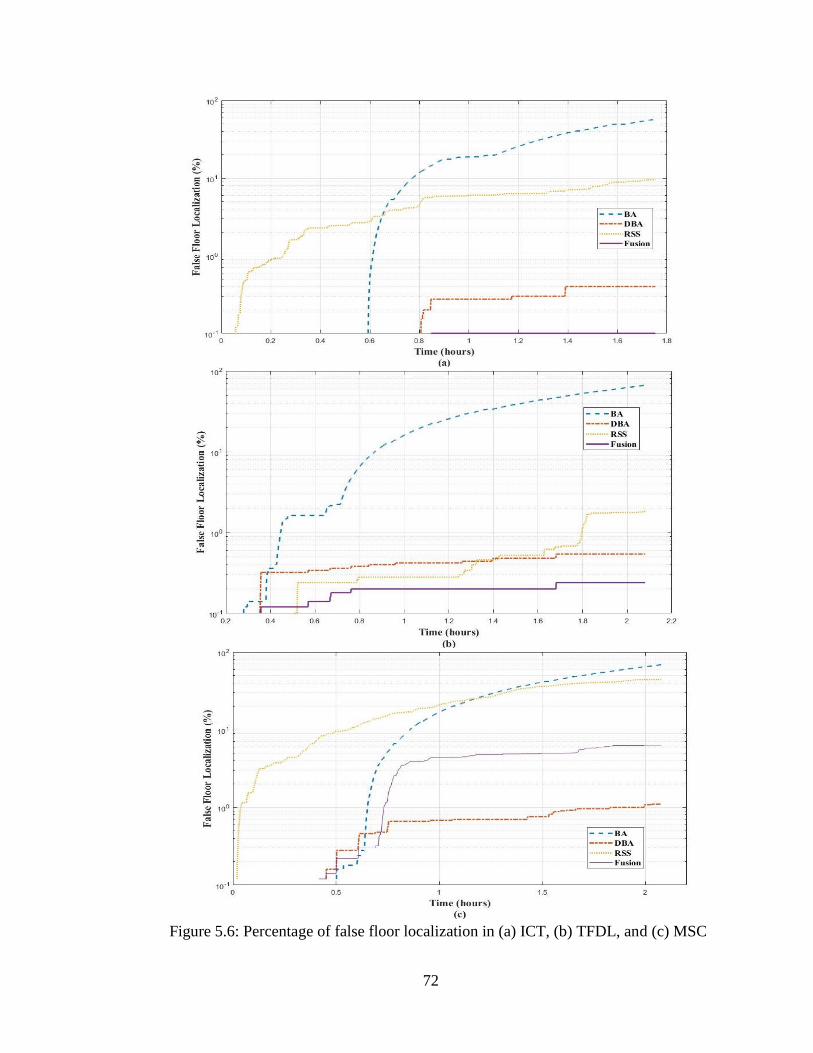
72
Figure 5.6: Percentage of false floor localization in (a) ICT, (b) TFDL, and (c) MSC
73
chapter demonstrated that using the proposed sensor fusion algorithm the changes in bias
in BA can be accurately estimated and tracked. Utilizing Wi-Fi RSS observables through
a KF, the sensor fusion algorithm can compensate for the errors observed in BA. Unlike
RSS-based floor localization methods, the proposed algorithm achieved 93% or higher
floor localization accuracy for all performed measurements irrespective of the building
structure. The proposed algorithm is compatible with the state-of-the-art smartphones and
can achieve accuracy comparable to that of DBA-based method without additional
infrastructure.
74
Chapter 6: Conclusion
6.1 Thesis Summary
A sensor fusion based framework for floor localization was developed based on using
barometric pressure and Wi-Fi received signal strength (RSS) measurements. The proposed
sensor fusion algorithm involved development of a new BA signal model, which was
formulated based on extensive Allan deviation (ADEV) analysis of Micro-electro-
mechanical-systems (MEMS) barometers. As well, a new Monte Carlo Bayesian Inference
(MCBI) framework was developed for interpreting Wi-Fi RSS measurements. The
performance of the proposed sensor fusion algorithm was then quantified and compared
with barometric altimetry (BA)-only, differential barometric altimetry (DBA)-only, and
RSS-only floor localization algorithms through measurements. The major conclusions of
this dissertation are given in Section 6.2 and the recommendations for future work are
outlined in Section 6.3.
6.2 Conclusions
The following major conclusions can be made based on the results obtained in the
previous chapters:
• BA can be readily implemented for floor localization; nevertheless, it is highly
influenced by approaching weather, air-conditioning, wind, temperature, etc.
ADEV analysis performed in this dissertation revealed two categories of underlying
random processes in BA, which are: WGN, and Colored Noise of 1/𝑓𝛼 PSD, with
exponent 𝛼 ≥ 1.
• Since BA readings are prone to drift errors due to local changes in the air pressure,
BA lacks the required accuracy to be used as a standalone technique in floor
localization for long-term measurements of several hours.
• DBA achieves high accuracy (on average > 99% for the performed measurements
in this dissertation) in floor localization by real-time differencing of measured air
pressures from reference and mobile barometers. However, DBA requires
installation of reference nodes and ad-hoc network for real-time information
75
exchange. As such, DBA cannot be implemented readily and on a global scale for
floor localization.
• Performance of RSS-based floor localization methods depends on the availability
of APs, quality of offline calibration, and building structure. The performance
deteriorates drastically inside a building with irregular structure and hollow
interiors. For the performed measurements, RSS-based methods achieved ≤ 60%
accuracy in MSC (as shown in Chapter 4), which as mentioned in Chapter 3 is a
typical of a modern mall with an open multi-level design with large hollow spaces.
• Distribution of Wi-Fi RSS observables from plurality of APs inside a building
resembles a log-normal distribution. Based on the distribution, an RSS based MCBI
framework was formulated for floor localization in this dissertation that
outperforms two existing ML-based methods.
• The proposed sensor fusion framework compensates for the drawbacks of BA-only
and RSS-only floor localization methods. Also, the proposed method can be
conveniently implemented with the existing infrastructures.
• The proposed sensor fusion algorithm outperforms both BA-only and RSS-only
floor localization methods with an average accuracy of 97% for the performed
measurements. The algorithm can be used for floor localization inside buildings
with irregular structures and hollow interiors without introducing large errors.
6.3 Recommendations for Future Work
In future, more research can be conducted involving the proposed sensor fusion
algorithm. Following is a list of recommendations for future work:
• The proposed sensor fusion algorithm can be integrated into a 3-dimensional (3D)
indoor localization system to completely determine the position of a smartphone
user and to improve the accuracy of the localization system.
• RSS-based maximum posteriori probability (MAP) classifier is an integrated part
of the proposed sensor fusion algorithm. For floor localization, MAP classifier
draws samples from areas with high probability (i.e. considers floors that are
associated with the APs discovered during a recent wireless network scan) as shown

76
in (4.12). This step can be further modified by considering user activities during a
day. For instance, at lunch hours inside a mall it is more probable that a shopper
will be located on a floor with food court. Exploring this aspect and incorporating
this information may further improve the floor localization accuracy.
• Cooperative sharing of RSS observables along with range measurements between
the neighboring mobile nodes can be incorporated in future measurements.
Incorporating cooperative sharing is expected to further improve localization
system.
• In this dissertation, for RSS measurements, a 2.4 GHz RF transceiver was used. In
future, RSS observables from both Wi-Fi 2.4 GHz and 5 GHz bands can be
considered during measurements to observe the impact on the performance of the
proposed algorithm.
• This dissertation only considered a scenario of locating smartphone user floor
location inside a building. The proposed sensor fusion algorithm can also be
incorporated in robotics for indoor navigation.
• Crowdsourcing technique can be introduced to make the proposed floor localization
algorithm more dynamic. Nevertheless, note that integrating crowdsourcing
technique will increase the complexity of the localization system.
77
References
[1] Y. Li, P. Zhang, X. Niu, Y. Zhuang, H. Lan and N. El-Sheimy, "Real-time Indoor
Navigation using Smartphone Sensors," in 2015 International Conference on Indoor
Positioning and Indoor Navigation (IPIN), Banff, Canada, 2015.
[2] F. Zhao, H. Luo, X. Zhao, Z. Pang and H. Park, "HYFI: Hybrid Floor Identification
Based on Wireless Fingerprinting and Barometric Pressure," IEEE Transactions on
Industrial Informatics, vol. 13, no. 1, pp. 330-341, 2017.
[3] V. Dehghanian and M. Lowe, "RSS-INS Integration for Cooperative Indoor
Positioning," in International Conference on Indoor Positioning and Indoor
Navigation (IPIN), Alcalá de Henares, Spain, 2016.
[4] R. Ichikari, L. C. M. Ruiz, M. Kourogi, T. Kurata, T. Kitagawa and S. Yoshii,
"Indoor Floor-Level Detection by Collectively Decomposing Factors of
Atmospheric Pressure," in 2015 International Conference on Indoor Positioning
and Indoor Navigation (IPIN), Banff, Canada, 2015.
[5] V. Dehghanian, Generalized Diversity Gain of a Mobile Antenna, Calgary:
Electrical and Computer Engineering, University of Calgary, 2011.
[6] N. Amani, V. Dehghanian and J. Nielsen, "User-induced antenna variation and its
impact on the performance of RSS-based indoor positioning," in 2016 IEEE
Canadian Conference on Electrical and Computer Engineering (CCECE),
Vancouver, BC, Canada, 2016.
[7] V. Dehghanian, J. Nielsen and G. Lachapelle, "Combined spatial-polarization
correlation function for indoor multipath environments," in 2010 7th International
Symposium on Wireless Communication Systems (ISWCS), York, UK, 2010.
78
[8] M. Zhang, L. Pei and X. Deng, "GraphSLAM-based Crowdsourcing framework for
indoor Wi-Fi fingerprinting," in 2016 Fourth International Conference on
Ubiquitous Positioning, Indoor Navigation and Location Based Services
(UPINLBS), Shanghai, China, 2016.
[9] A. Rai, K. K. Chintalapudi, V. N. Padmanabhan and R. Sen, "Zee: zero-effort
crowdsourcing for indoor localization," in Mobicom '12 Proceedings of the 18th
annual international conference on Mobile computing and networking, Istanbul,
Turkey, 2012.
[10] D. E. Bolanakis, "Evaluating performance of MEMS barometric sensors in
differential altimetry systems," IEEE Aerospace and Electronic Systems Magazine,
vol. 32, no. 9, pp. 34 - 39, 2017.
[11] N. Hayashi, Augmentation of GPS with a barometer and a heading rate gyroscope
for urban vehicular navigation [microform], Calgary: University of Calgary, 1996.
[12] J. Rantakokko, J. Rydell, P. Strömbäck, P. Händel, J. Callmer, D. Törnqvist, F.
Gustafsson, M. Jobs and M. Grudén, "Accurate and reliable soldier and first
responder indoor positioning: multisensor systems and cooperative localization,"
IEEE Wireless Communications, vol. 18, no. 2, pp. 10-18, 2011.
[13] D. A. Grejner-Brzezinska, C. K. Toth, T. Moore, J. F. Raquet, M. M. Miller and A.
Kealy, "Multisensor Navigation Systems: A Remedy for GNSS Vulnerabilities?,"
Proceedings of the IEEE, vol. 104, no. 6, pp. 1339 - 1353, 2016.
[14] K. Liu, Y. Wang and J. Wang, "Differential Barometric Altimetry Assists Floor
Identification in WLAN Location Fingerprinting Study," in Principle and
Application Progress in Location-Based Services, Springer, 2014, pp. 21-29.
[15] C. Bollmeyer, T. Esemann, H. Gehring and H. Hellbruck, "Precise Indoor Altitude
Estimation based on differential barometric Sensing for wireless Medical
Applications," in 2013 IEEE International Conference on Body Sensor Networks
(BSN), Cambridge, MA, USA, 2013.
79
[16] M. Won, A. Mishra and S. H. Son, "HybridBaro: Mining Driving Routes Using
Barometer Sensor of Smartphone," IEEE Sensors Journal, vol. 17, no. 19, pp. 6397
- 6408, 2017.
[17] S. Zihajehzadeh, T. J. Lee, J. K. Lee, R. Hoskinson and E. J. Park, "Integration of
MEMS Inertial and Pressure Sensors for Vertical Trajectory Determination," IEEE
Transactions on Instrumentation and Measurement, vol. 64, no. 3, pp. 804-814,
2015.
[18] B. Shin, C. Kim, J. Kim, S. Lee, C. Kee, H. S. Kim and T. Lee, "Motion Recognition-
Based 3D Pedestrian Navigation System Using Smartphone," IEEE Sensors
Journal, vol. 16, no. 18, pp. 6977 - 6989, 2016.
[19] S. Wei, G. Dan and H. Chen, "Altitude data fusion utilising differential measurement
and complementary filter," IET Science, Measurement & Technology, vol. 10, no.
8, pp. 874-879, 2016.
[20] F. Alsehly, T. Arslan and Z. Sevak, "Indoor Positioning with floor determination in
Multi Story Buildings," in International Conference on Indoor Positioning and
Indoor Navigation (IPIN) 2011, Guimaraes, Portugal, 2011.
[21] X. Shen, Y. Chen, J. Zhang, L. Wang, G. Dai and T. He, "BarFi: Barometer-Aided
Wi-Fi Floor Localization Using Crowdsourcing," in 2015 IEEE 12th International
Conference on Mobile Ad Hoc and Sensor Systems, Dallas, TX, 2015.
[22] F. Haque, V. Dehghanian and A. O. Fapojuwo, "Sensor Fusion for Floor Detection,"
in The 8th IEEE Annual Information Technology, Electronics and Mobile
Communication Conference, Vancouver, 2017.
[23] P. Gupta, S. Bharadwaj, S. Ramakrishnan and J. Balakrishnan, "Robust Floor
Determination for Indoor Positioning," in 2014 Twentieth National Conference on
Communications (NCC), Kanpur, 2014.
80
[24] Y. Tian, B. Denby, I. Ahriz, P. Roussel and G. Dreyfus, "Hybrid Indoor Localization
using GSM Fingerprints, Embedded Sensors and a Particle Filter," in 11th
International Symposium on Wireless Communications Systems (ISWCS),
Barcelona, Spain, 2014.
[25] A. Razavi, M. Valkama and E. S. Lohan, "Robust Statistical Approaches for RSS-
Based Floor Detection in Indoor Localization," Sensors, vol. 16, no. 6, 2016.
[26] M. A. A. Rahman, M. Dashti and J. Zhang, "Floor Determination for Positioning in
Multi-story Building," in IEEE Wireless Communications and Networking
Conference (WCNC), 2014, Istanbul, Turkey, 2014.
[27] F.-M. Jhuang, C.-F. Hung, C.-C. Tuan, Y.-C. Wu and F.-Y. Leu, "An AP Selection
with RSS Standard Deviation for Indoor Positioning in Wi-Fi," in 9th International
Conference on Innovative Mobile and Internet Services in Ubiquitous Computing,
Blumenau, Brazil, 2015.
[28] T. Vongsuteera, K. N. Nakorn and K. Rojviboonchai, "Floor Localization Algorithm
utilizing Different Order of Access Point from Wi-Fi Signal Fingerprint," in 2016
13th International Conference on Electrical Engineering/Electronics, Computer,
Telecommunications and Information Technology (ECTI-CON), Chiang Mai,
Thailand, 2016.
[29] K. Maneerat and C. Prommak, "Floor Estimation Algorithm for Wireless Indoor
Multi-Story Positioning Systems," in 11th International Conference on Electrical
Engineering/Electronics, Computer, Telecommunications and Information
Technology (ECTI-CON), Nakhon Ratchasima, Thailand, 2014.
[30] K. Maneerat and C. Prommak, "An Enhanced Floor Estimation Algorithm for
Indoor Wireless Localization Systems Using Confidence Interval Approach,"
International Journal of Computer, Electrical, Automation, Control and
Information Engineering, vol. 8, no. 7, p. 1182–1186, 2014.
81
[31] K. Maneerat and C. Prommak, "Floor Determination Algorithm with Node Failure
Consideration for Indoor Positioning Systems," in Proceedings of the 8th
International Conference on signal processing systems, Auckland, New Zealand,
2016.
[32] K. Maneerat, K. Kaemarungsi and C. Prommak, "Robust Floor Determination
Algorithm for Indoor Wireless Localization Systems under Reference Node
Failure," Mobile Information Systems, vol. 2016, 2016.
[33] J. Yoo, K. H. Johansson and H. J. Kim, "Indoor Localization Without a Prior Map
by Trajectory Learning From Crowdsourced Measurements," IEEE
TRANSACTIONS ON INSTRUMENTATION AND MEASUREMENT, vol. PP, no.
99, pp. 1-11, 2017.
[34] B.-A. Chen, P.-H. Tseng, K.-T. Feng and T.-S. Wang, "Fingerprinting-based
Dynamic RSS Adjustment for Time-variant Indoor Positioning Systems," in 2016
IEEE International Conference on Consumer Electronics-Taiwan (ICCE-TW),
Nantou, Taiwan, 2016.
[35] Y. Li, J. Chen, Y. Shi, Y. Cheng and L. Wang, "WiFi-Assisted Multi-Floor Indoor
Localization with Inertial Sensors," in 2016 8th International Conference on
Wireless Communications & Signal Processing (WCSP), Yangzhou, China, 2016.
[36] P. Tang, Z. Huang and J. Lei, "Fingerprint localization using WLAN RSS and
magnetic field with landmark detection," in 3rd International Conference on
Computational Intelligence & Communication Technology (CICT), Ghaziabad,
India, 2017.
[37] N. Etemadyrad and J. K. Nelson, "A Sequential Detection Approach to Indoor
Positioning Using RSS-Based Fingerprinting," in IEEE Global Conference on
Signal and Information Processing (GlobalSIP), Washington, DC, USA, 2016.
82
[38] S. He and S.-H. G. Chan, "Wi-Fi Fingerprint-Based Indoor Positioning: Recent
Advances and Comparisons," IEEE Communications Surveys & Tutorials, vol. 18,
no. 1, pp. 466 - 490, 2016.
[39] G. Retscher, "Augmentation of Indoor Positioning Systems with a Barometric
Pressure Sensor for Direct Altitude Determination in a Multi-storey Building,"
Cartography and Geographic Information Science, vol. 34, no. 4, pp. 305-310,
2007.
[40] K. Muralidharan, A. J. Khan, A. Misra, R. K. Balan, S. Agarwal, R. K. Balan and S.
Agarwal, "Barometric Phone Sensors – More Hype Than Hope!," in HotMobile '14
Proceedings of the 15th Workshop on Mobile Computing Systems and Applications,
Santa Barbara, California, 2014.
[41] H. Xia, X. Wang, Y. Qiao, J. Jian and Y. Chang, "Using Multiple Barometers to
Detect the Floor Location of Smart Phones with Built-in Barometric Sensors for
Indoor Positioning," Sensors, vol. 15, no. 4, pp. 7857-7877, April 2015.
[42] H. Ye, T. Gu, X. Tao and J. Lu, "B-Loc: Scalable Floor Localization using
Barometer on Smartphone," in IEEE 11th International Conference on Mobile Ad
Hoc and Sensor Systems, Philadelphia, PA, USA, 2014.
[43] H. Ye, T. Gu, X. Tao and J. Lu, "Scalable floor localization using barometer on
smartphone," Wireless Communications and Mobile Computing, vol. 16, no. 16, pp.
2557-2571, 2016.
[44] L. Bedogni, F. Franzoso and L. Bononi, "A Self-Adapting Algorithm Based on
Atmospheric Pressure to Localize Indoor Devices," in IEEE Global
Communications Conference (GLOBECOM), Washington, DC, USA, 2016.
[45] D. E. Bolanakis, K. T. Kotsis and T. Laopoulos, "A Prototype Wireless Sensor
Network System for a Comparative Evaluation of Differential and Absolute
Barometric Altimetry," IEEE Aerospace and Electronic Systems Magazine, vol. 30,
no. 11, pp. 20-28, 2015.
83
[46] H. Wang, H. Lenz, A. Szabo, U. D. Hanebeck and J. Bamberger, "Fusion of
Barometric Sensors, WLAN Signals and Building Information for 3-D
Indoor/Campus Localization," in IEEE International Conference on Multisensor
Fusion and Integration for Intelligent Systems (MFI 2006), Heidelberg, Germany,
2006.
[47] C. Luo, H. Hong, M. C. Chan, J. Li, X. Zhang and Z. Ming, "MPiLoc: Self-
calibrating Multi-floor Indoor Localization Exploiting Participatory Sensing," IEEE
Transactions on Mobile Computing, vol. PP, no. 99, 2017.
[48] H. J. Ai, M. Y. Liu, Y. M. Shi and J. Q. Zhao, "Floor Identification with Commercial
Smartphones In Wifi-Based Indoor Localization System," The International
Archives of the Photogrammetry, Remote Sensing and Spatial Information Sciences,
Vols. XLI-B4, pp. 573-577, 2016.
[49] X. Bao, Z. Xiong, S. Sheng, Y. Dai, S. Bao and J. Liu, "Barometer measurement
error modeling and correction for UAH altitude tracking," in 2017 29th Chinese
Control And Decision Conference (CCDC), Chongqing, China, 2017.
[50] IEEE, "IEEE Recommended Practice for Inertial Sensor Test Equipment,
Instrumentation, Data Acquisition, and Analysis," IEEE Std. 1554-2005, pp. 1-145,
2013.
[51] IEEE, "IEEE Standard Definitions of Physical Quantities for Fundamental
Frequency and Time Metrology---Random Instabilities," IEEE Std. 1139-2008
(Revision of IEEE Std 1139-1999), pp. 1-50, 2009.
[52] IEEE, "IEEE Standard Specification Format Guide and Test Procedure for Single-
Axis Interferometric Fiber Optic Gyros -- Corrigendum 1: Figure 1 and Subclauses
5.3.4, 8.3, 12.11.4.3.2, 12.11.4.3.3, 12.11.4.3.4, 12.12.3.1, and 12.12.4.1," IEEE Std.
952-1997/Cor 1-2016 (Corrigendum to IEEE Std. 952-1997), pp. 1-14, 2017.
84
[53] N. El-Sheimy, H. Hou and X. Niu, "Analysis and Modeling of Inertial Sensors Using
Allan Variance," IEEE Transactions on Instrumentation and Measurement, vol. 57,
no. 1, pp. 140-149, 2008.
[54] Bosch Sensortec, "Datasheet BMP180 Digital Pressure Sensor," Bosch Sensortec,
Reutlingen, Germany, 2013.
[55] Bosch Sensortec, "Datasheet BMP280 Digital Pressure Sensor," Bosch Sensortec,
Reutlingen, Germany, 2015.
[56] Bosch Sensortec, "BME280 Combined humidity and pressure sensor," Bosch
Sensortec, Reutlingen, Germany, 2016.
[57] Freescale Semiconductor, Inc. , "Datasheet: Xtrinsic MPL3115A2 I2C Precision
Altimeter," Freescale Semiconductor, Inc. , Austin, Texas, United States, 2013.
[58] Freescale Semiconductor Inc., "Allan Variance: Noise Analysis for Gyroscopes,"
NXP, Austin, Texas, United States, 2015.
[59] M. S. Keshner, "1/f noise," Proceedings of the IEEE, vol. 70, no. 3, pp. 212 - 218,
1982.
[60] J. R. M. Hosking, "Fractional differencing," Biometrika, vol. 68, no. 1, pp. 165-176,
1981.
[61] S. M. Kay, "Statistical Decision Theory I," in Fundamentals of Statistical Signal
Processing: Detection Theory, Upper Saddle River, New Jersey, Prentice Hall PTR,
1998, pp. 60-92.
[62] Cypress Semiconductor Corporation, "CYW43362 Single-Chip IEEE 802.11™
b/g/n MAC/Baseband/Radio," Cypress Semiconductor Corporation, San Jose,
California, United States, 2017.
85
[63] J. H. Lee and R. M. Buehrer, "Fundamentals of Received Signal Strength - Based
Position Location," in Handbook of Position Location: Theory, Practice and
Advances, Hoboken, New Jersey, John Wiley & Sons, Inc., 2012, pp. 359-394.
[64] D. P. Smith, "Fundamentals of the Wireless Channel," in Wireless Propagation in
the Near-Ground Forest Environment, Calgary, University of Calgary, 2015, pp. 12-
40.
[65] K. P. Murphy, Machine learning: a probabilistic perspective, Cambridge, MA: MIT
Press, 2012.
[66] C. M. Bishop, Pattern Recognition and Machine Learning (Information Science and
Statistics), New York: Springer, 2006.
[67] J. L. Puga, M. Krzywinski and N. Altman, "Points of Significance: Bayes' theorem,"
Nature Methods, vol. 12, pp. 277-278, 2015.
[68] J. A. d. Peral-Rosado, M. Bavaro, J. A. Lopez-Salcedo, G. Seco-Granados, P.
Chawdhry, J. Fortuny-Guasch, P. Crosta, F. Zanier and M. Crisci, "Floor Detection
with Indoor Vertical Positioning in LTE Femtocell Networks," in 2015 IEEE
Globecom Workshops (GC Wkshps), San Diego, CA, USA, 2015.
[69] M. S. Grewal and A. P. Andrews, "General Information," in Kalman Filtering
Theory and Practice Using Matlab, Hoboken, New Jersey, John Wiley & Sons, Inc.,
2008, pp. 1-25.
[70] S. M. Kay, Fundamentals of Statistical Signal Processing: Estimation Theory, Upper
Saddle River, New Jersey: Prentice Hall PTR, 1993.
[71] L. Zhang and X. Peng, "Time series estimation of gas sensor baseline drift using
ARMA and Kalman based models," Sensor Review, vol. 36, no. 1, pp. 34-39, 2016.
86
[72] Z. Diao, H. Quan, L. Lan and Y. Han, "Analysis and compensation of MEMS
gyroscope drift," in Sensing Technology (ICST), 2013 Seventh International
Conference on, Wellington, New Zealand, 2013.
[73] K. Wang, S. Xiong and Y. Li, "Modeling with noises for inertial sensors," in 2012
IEEE/ION Position, Location and Navigation Symposium, Myrtle Beach, SC, USA,
2012.
[74] E. Rossi, "Stationary ARMA Processes, University of Pavia," 2007. [Online].
Available:
http://economia.unipv.it/pagp/pagine_personali/erossi/macroeconometria_stationar
y_arma.pdf. [Accessed 29 May 2018].
[75] A. Nosedal, "The Moving Average Models MA(1) and MA(2), University of
Toronto," 10 February 2016. [Online]. Available:
https://mcs.utm.utoronto.ca/~nosedal/sta457/ma1-and-ma2.pdf. [Accessed 15
November 2017].
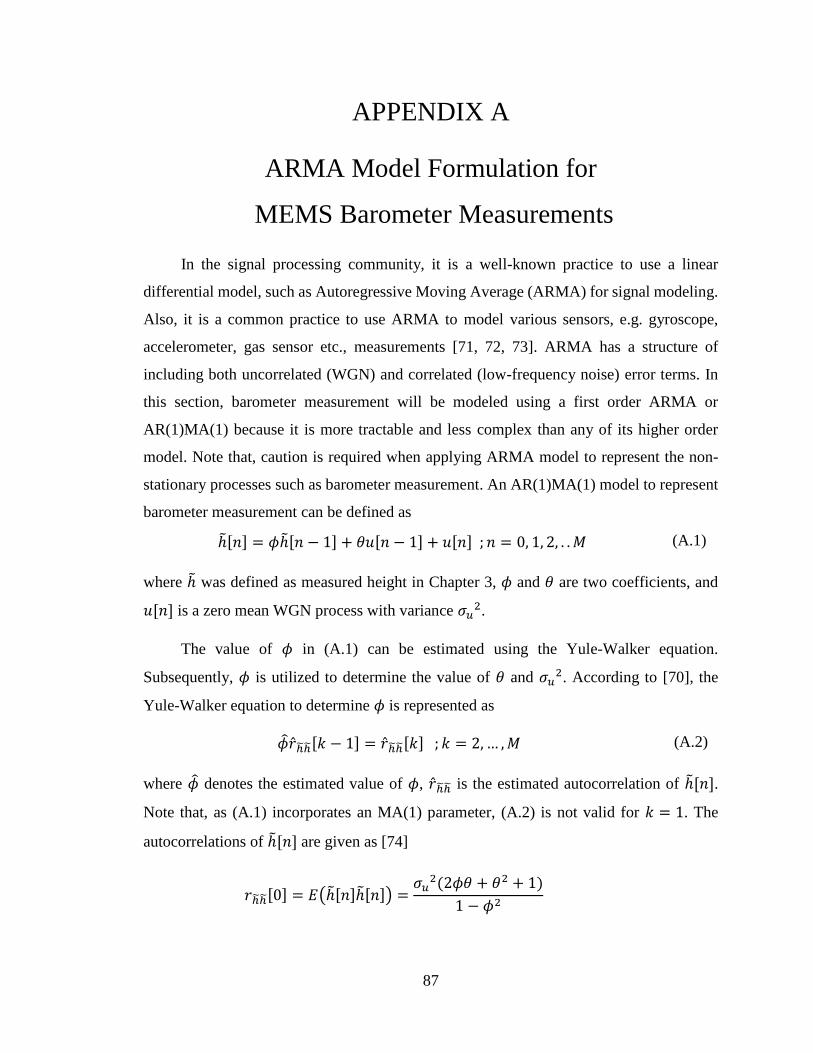
87
APPENDIX A
ARMA Model Formulation for
MEMS Barometer Measurements
In the signal processing community, it is a well-known practice to use a linear
differential model, such as Autoregressive Moving Average (ARMA) for signal modeling.
Also, it is a common practice to use ARMA to model various sensors, e.g. gyroscope,
accelerometer, gas sensor etc., measurements [71, 72, 73]. ARMA has a structure of
including both uncorrelated (WGN) and correlated (low-frequency noise) error terms. In
this section, barometer measurement will be modeled using a first order ARMA or
AR(1)MA(1) because it is more tractable and less complex than any of its higher order
model. Note that, caution is required when applying ARMA model to represent the non-
stationary processes such as barometer measurement. An AR(1)MA(1) model to represent
barometer measurement can be defined as
where ℎ̃ was defined as measured height in Chapter 3, 𝜙 and 𝜃 are two coefficients, and
𝑢[𝑛] is a zero mean WGN process with variance 𝜎𝑢2.
The value of 𝜙 in (A.1) can be estimated using the Yule-Walker equation.
Subsequently, 𝜙 is utilized to determine the value of 𝜃 and 𝜎𝑢2. According to [70], the
Yule-Walker equation to determine 𝜙 is represented as
where �̂� denotes the estimated value of 𝜙, �̂�ℎ෩ℎ෩ is the estimated autocorrelation of ℎ̃[𝑛].
Note that, as (A.1) incorporates an MA(1) parameter, (A.2) is not valid for 𝑘 = 1. The
autocorrelations of ℎ̃[𝑛] are given as [74]
ℎ̃[𝑛] = 𝜙ℎ̃[𝑛 − 1] + 𝜃𝑢[𝑛 − 1] + 𝑢[𝑛] ; 𝑛 = 0, 1, 2, . . 𝑀 (A.1)
�̂��̂�ℎ෩ℎ෩[𝑘 − 1] = �̂�ℎ෩ℎ෩[𝑘] ; 𝑘 = 2, … , 𝑀 (A.2)
𝑟ℎ෩ℎ෩[0] = 𝐸(ℎ̃[𝑛]ℎ̃[𝑛]) =𝜎𝑢
2(2𝜙𝜃 + 𝜃2 + 1)
1 − 𝜙2
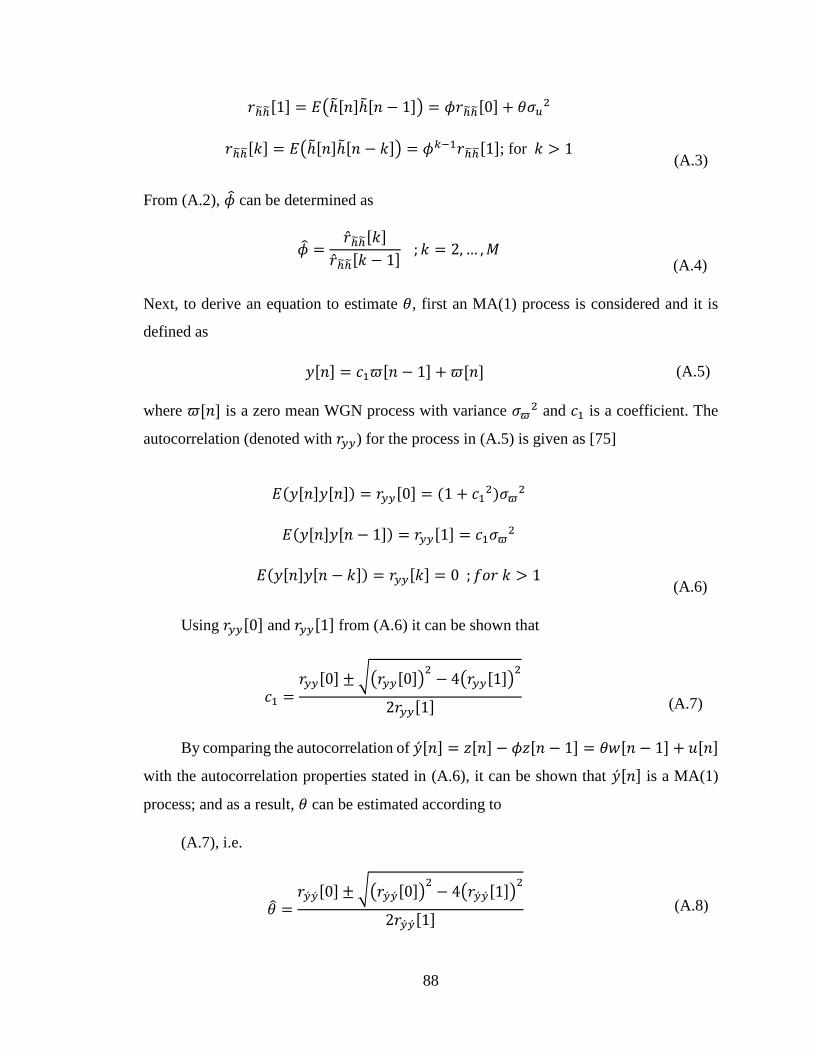
88
From (A.2), �̂� can be determined as
Next, to derive an equation to estimate 𝜃, first an MA(1) process is considered and it is
defined as
where 𝜛[𝑛] is a zero mean WGN process with variance 𝜎𝜛2 and 𝑐1 is a coefficient. The
autocorrelation (denoted with 𝑟𝑦𝑦) for the process in (A.5) is given as [75]
Using 𝑟𝑦𝑦[0] and 𝑟𝑦𝑦[1] from (A.6) it can be shown that
𝑐1 =𝑟𝑦𝑦[0] ± √(𝑟𝑦𝑦[0])
2− 4(𝑟𝑦𝑦[1])
2
2𝑟𝑦𝑦[1]
(A.7)
By comparing the autocorrelation of �́�[𝑛] = 𝑧[𝑛] − 𝜙𝑧[𝑛 − 1] = 𝜃𝑤[𝑛 − 1] + 𝑢[𝑛]
with the autocorrelation properties stated in (A.6), it can be shown that �́�[𝑛] is a MA(1)
process; and as a result, 𝜃 can be estimated according to
(A.7), i.e.
𝑟ℎ෩ℎ෩[1] = 𝐸(ℎ̃[𝑛]ℎ̃[𝑛 − 1]) = 𝜙𝑟ℎ෩ℎ෩[0] + 𝜃𝜎𝑢2
𝑟ℎ෩ℎ෩[𝑘] = 𝐸(ℎ̃[𝑛]ℎ̃[𝑛 − 𝑘]) = 𝜙𝑘−1𝑟ℎ෩ℎ෩[1]; for 𝑘 > 1
(A.3)
�̂� =
�̂�ℎ෩ℎ෩[𝑘]
�̂�ℎ෩ℎ෩[𝑘 − 1] ; 𝑘 = 2, … , 𝑀
(A.4)
𝑦[𝑛] = 𝑐1𝜛[𝑛 − 1] + 𝜛[𝑛] (A.5)
𝐸(𝑦[𝑛]𝑦[𝑛]) = 𝑟𝑦𝑦[0] = (1 + 𝑐12)𝜎𝜛
2
𝐸(𝑦[𝑛]𝑦[𝑛 − 1]) = 𝑟𝑦𝑦[1] = 𝑐1𝜎𝜛2
𝐸(𝑦[𝑛]𝑦[𝑛 − 𝑘]) = 𝑟𝑦𝑦[𝑘] = 0 ; 𝑓𝑜𝑟 𝑘 > 1
(A.6)
𝜃 =𝑟�́��́�[0] ± √(𝑟�́��́�[0])
2− 4(𝑟�́��́�[1])
2
2𝑟�́��́�[1]
(A.8)
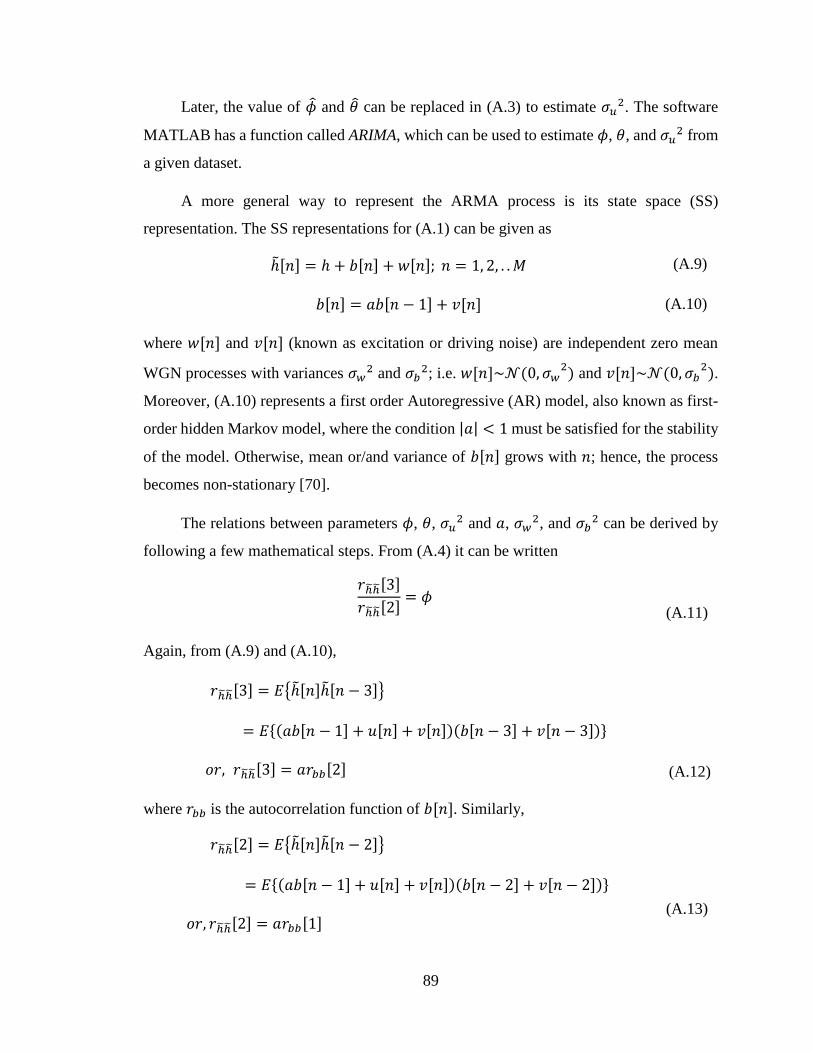
89
Later, the value of �̂� and 𝜃 can be replaced in (A.3) to estimate 𝜎𝑢2. The software
MATLAB has a function called ARIMA, which can be used to estimate 𝜙, 𝜃, and 𝜎𝑢2 from
a given dataset.
A more general way to represent the ARMA process is its state space (SS)
representation. The SS representations for (A.1) can be given as
where 𝑤[𝑛] and 𝑣[𝑛] (known as excitation or driving noise) are independent zero mean
WGN processes with variances 𝜎𝑤2 and 𝜎𝑏
2; i.e. 𝑤[𝑛]~𝒩(0, 𝜎𝑤2) and 𝑣[𝑛]~𝒩(0, 𝜎𝑏
2).
Moreover, (A.10) represents a first order Autoregressive (AR) model, also known as first-
order hidden Markov model, where the condition |𝑎| < 1 must be satisfied for the stability
of the model. Otherwise, mean or/and variance of 𝑏[𝑛] grows with 𝑛; hence, the process
becomes non-stationary [70].
The relations between parameters 𝜙, 𝜃, 𝜎𝑢2 and 𝑎, 𝜎𝑤
2, and 𝜎𝑏2 can be derived by
following a few mathematical steps. From (A.4) it can be written
Again, from (A.9) and (A.10),
𝑟ℎ෩ℎ෩[3] = 𝐸{ℎ̃[𝑛]ℎ̃[𝑛 − 3]}
= 𝐸{(𝑎𝑏[𝑛 − 1] + 𝑢[𝑛] + 𝑣[𝑛])(𝑏[𝑛 − 3] + 𝑣[𝑛 − 3])}
𝑜𝑟, 𝑟ℎ෩ℎ෩[3] = 𝑎𝑟𝑏𝑏[2]
(A.12)
where 𝑟𝑏𝑏 is the autocorrelation function of 𝑏[𝑛]. Similarly,
ℎ̃[𝑛] = ℎ + 𝑏[𝑛] + 𝑤[𝑛]; 𝑛 = 1, 2, . . 𝑀 (A.9)
𝑏[𝑛] = 𝑎𝑏[𝑛 − 1] + 𝑣[𝑛] (A.10)
𝑟ℎ෩ℎ෩[3]
𝑟ℎ෩ℎ෩[2]= 𝜙
(A.11)
𝑟ℎ෩ℎ෩[2] = 𝐸{ℎ̃[𝑛]ℎ̃[𝑛 − 2]}
= 𝐸{(𝑎𝑏[𝑛 − 1] + 𝑢[𝑛] + 𝑣[𝑛])(𝑏[𝑛 − 2] + 𝑣[𝑛 − 2])}
𝑜𝑟, 𝑟ℎ෩ℎ෩[2] = 𝑎𝑟𝑏𝑏[1]
(A.13)
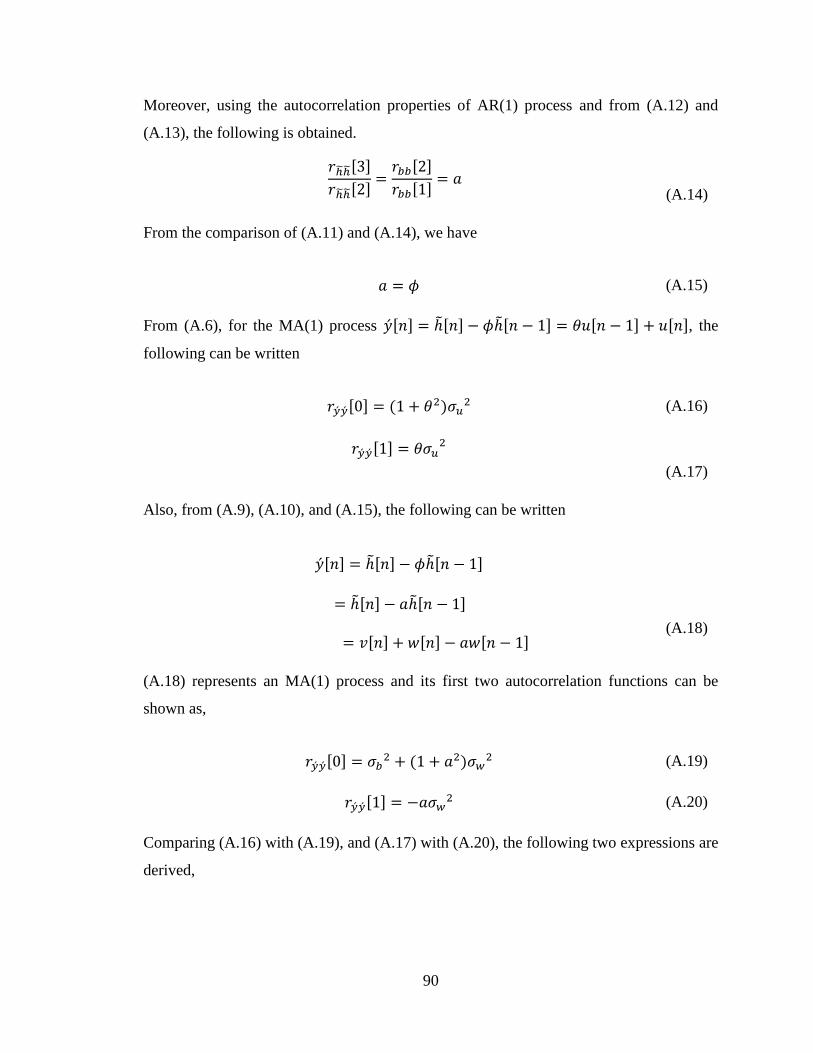
90
Moreover, using the autocorrelation properties of AR(1) process and from (A.12) and
(A.13), the following is obtained.
From the comparison of (A.11) and (A.14), we have
From (A.6), for the MA(1) process �́�[𝑛] = ℎ̃[𝑛] − 𝜙ℎ̃[𝑛 − 1] = 𝜃𝑢[𝑛 − 1] + 𝑢[𝑛], the
following can be written
Also, from (A.9), (A.10), and (A.15), the following can be written
(A.18) represents an MA(1) process and its first two autocorrelation functions can be
shown as,
Comparing (A.16) with (A.19), and (A.17) with (A.20), the following two expressions are
derived,
𝑟ℎ෩ℎ෩[3]
𝑟ℎ෩ℎ෩[2]=
𝑟𝑏𝑏[2]
𝑟𝑏𝑏[1]= 𝑎
(A.14)
𝑎 = 𝜙 (A.15)
𝑟�́��́�[0] = (1 + 𝜃2)𝜎𝑢2
𝑟�́��́�[1] = 𝜃𝜎𝑢2
(A.16)
(A.17)
�́�[𝑛] = ℎ̃[𝑛] − 𝜙ℎ̃[𝑛 − 1]
= ℎ̃[𝑛] − 𝑎ℎ̃[𝑛 − 1]
= 𝑣[𝑛] + 𝑤[𝑛] − 𝑎𝑤[𝑛 − 1]
(A.18)
𝑟�́��́�[0] = 𝜎𝑏2 + (1 + 𝑎2)𝜎𝑤
2 (A.19)
𝑟�́��́�[1] = −𝑎𝜎𝑤2 (A.20)
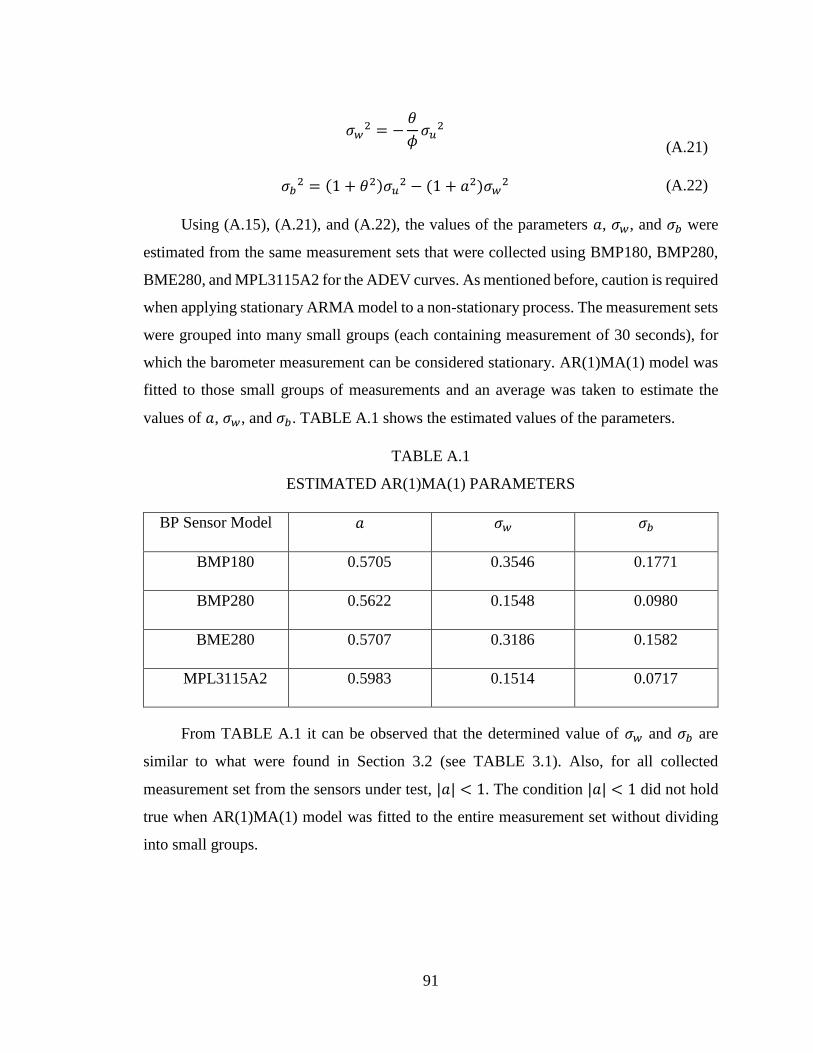
91
Using (A.15), (A.21), and (A.22), the values of the parameters 𝑎, 𝜎𝑤, and 𝜎𝑏 were
estimated from the same measurement sets that were collected using BMP180, BMP280,
BME280, and MPL3115A2 for the ADEV curves. As mentioned before, caution is required
when applying stationary ARMA model to a non-stationary process. The measurement sets
were grouped into many small groups (each containing measurement of 30 seconds), for
which the barometer measurement can be considered stationary. AR(1)MA(1) model was
fitted to those small groups of measurements and an average was taken to estimate the
values of 𝑎, 𝜎𝑤, and 𝜎𝑏. TABLE A.1 shows the estimated values of the parameters.
TABLE A.1
ESTIMATED AR(1)MA(1) PARAMETERS
BP Sensor Model 𝑎 𝜎𝑤 𝜎𝑏
BMP180 0.5705 0.3546 0.1771
BMP280 0.5622 0.1548 0.0980
BME280 0.5707 0.3186 0.1582
MPL3115A2 0.5983 0.1514 0.0717
From TABLE A.1 it can be observed that the determined value of 𝜎𝑤 and 𝜎𝑏 are
similar to what were found in Section 3.2 (see TABLE 3.1). Also, for all collected
measurement set from the sensors under test, |𝑎| < 1. The condition |𝑎| < 1 did not hold
true when AR(1)MA(1) model was fitted to the entire measurement set without dividing
into small groups.
𝜎𝑤2 = −
𝜃
𝜙𝜎𝑢
2
(A.21)
𝜎𝑏2 = (1 + 𝜃2)𝜎𝑢
2 − (1 + 𝑎2)𝜎𝑤2 (A.22)
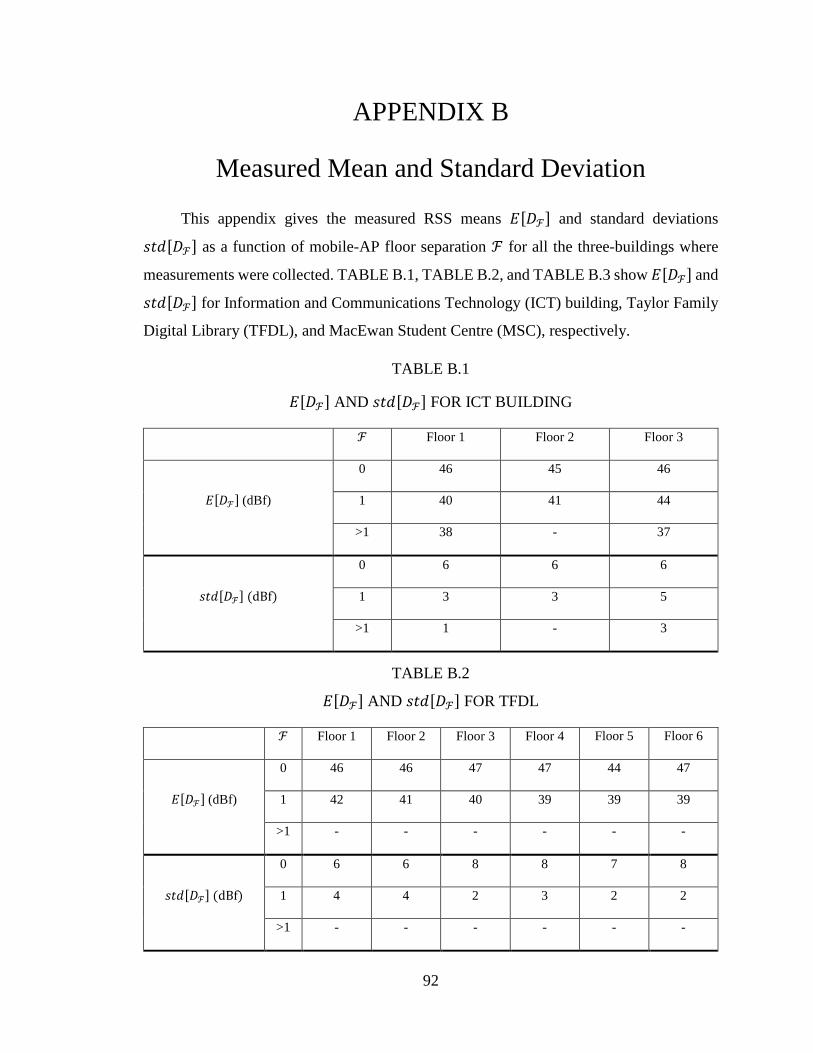
92
APPENDIX B
Measured Mean and Standard Deviation
This appendix gives the measured RSS means 𝐸[𝐷ℱ] and standard deviations
𝑠𝑡𝑑[𝐷ℱ] as a function of mobile-AP floor separation ℱ for all the three-buildings where
measurements were collected. TABLE B.1, TABLE B.2, and TABLE B.3 show 𝐸[𝐷ℱ] and
𝑠𝑡𝑑[𝐷ℱ] for Information and Communications Technology (ICT) building, Taylor Family
Digital Library (TFDL), and MacEwan Student Centre (MSC), respectively.
TABLE B.1
𝐸[𝐷ℱ] AND 𝑠𝑡𝑑[𝐷ℱ] FOR ICT BUILDING
ℱ Floor 1 Floor 2 Floor 3
𝐸[𝐷ℱ] (dBf)
0 46 45 46
1 40 41 44
>1 38 - 37
𝑠𝑡𝑑[𝐷ℱ] (dBf)
0 6 6 6
1 3 3 5
>1 1 - 3
TABLE B.2
𝐸[𝐷ℱ] AND 𝑠𝑡𝑑[𝐷ℱ] FOR TFDL
ℱ Floor 1 Floor 2 Floor 3 Floor 4 Floor 5 Floor 6
𝐸[𝐷ℱ] (dBf)
0 46 46 47 47 44 47
1 42 41 40 39 39 39
>1 - - - - - -
𝑠𝑡𝑑[𝐷ℱ] (dBf)
0 6 6 8 8 7 8
1 4 4 2 3 2 2
>1 - - - - - -
93
TABLE B.3
𝐸[𝐷ℱ] AND 𝑠𝑡𝑑[𝐷ℱ] FOR MSC
ℱ Floor 1 Floor 2 Floor 3 Floor 4
𝐸[𝐷ℱ] (dBf)
0 48 47 45 45
1 43 43 42 41
>1 38 39 40 41
𝑠𝑡𝑑[𝐷ℱ] (dBf)
0 9 7 6 7
1 5 5 5 4
>1 3 3 2 3
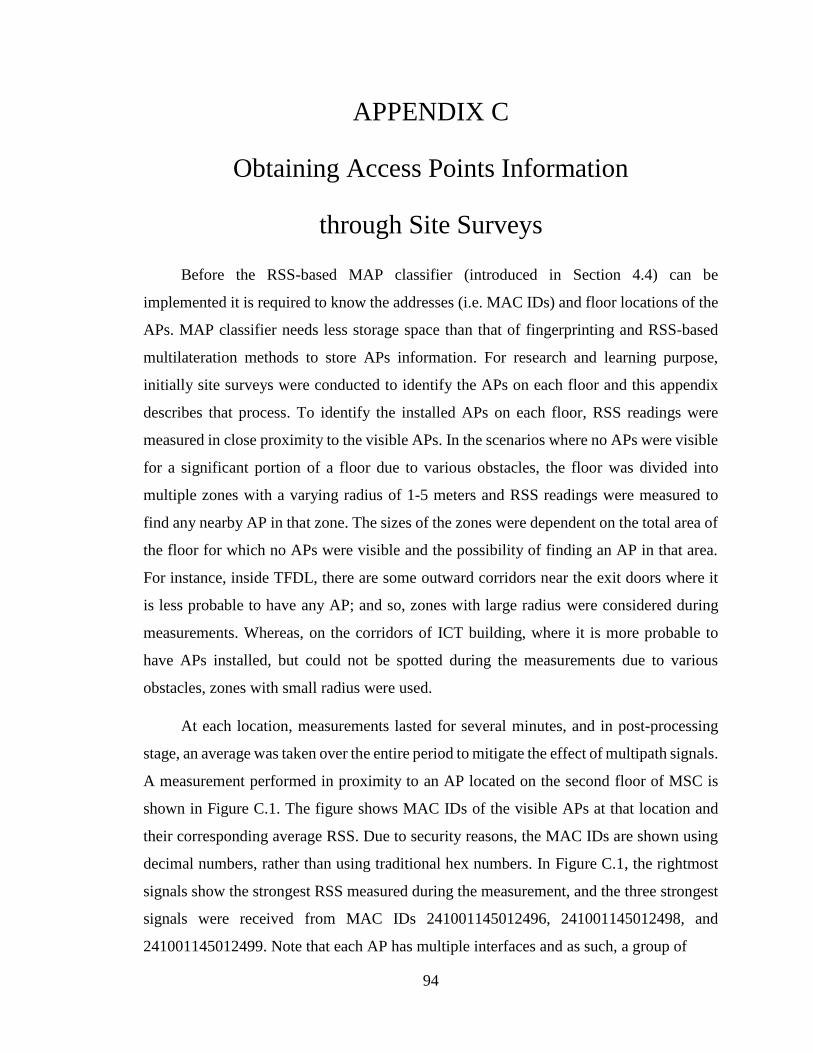
94
APPENDIX C
Obtaining Access Points Information
through Site Surveys
Before the RSS-based MAP classifier (introduced in Section 4.4) can be
implemented it is required to know the addresses (i.e. MAC IDs) and floor locations of the
APs. MAP classifier needs less storage space than that of fingerprinting and RSS-based
multilateration methods to store APs information. For research and learning purpose,
initially site surveys were conducted to identify the APs on each floor and this appendix
describes that process. To identify the installed APs on each floor, RSS readings were
measured in close proximity to the visible APs. In the scenarios where no APs were visible
for a significant portion of a floor due to various obstacles, the floor was divided into
multiple zones with a varying radius of 1-5 meters and RSS readings were measured to
find any nearby AP in that zone. The sizes of the zones were dependent on the total area of
the floor for which no APs were visible and the possibility of finding an AP in that area.
For instance, inside TFDL, there are some outward corridors near the exit doors where it
is less probable to have any AP; and so, zones with large radius were considered during
measurements. Whereas, on the corridors of ICT building, where it is more probable to
have APs installed, but could not be spotted during the measurements due to various
obstacles, zones with small radius were used.
At each location, measurements lasted for several minutes, and in post-processing
stage, an average was taken over the entire period to mitigate the effect of multipath signals.
A measurement performed in proximity to an AP located on the second floor of MSC is
shown in Figure C.1. The figure shows MAC IDs of the visible APs at that location and
their corresponding average RSS. Due to security reasons, the MAC IDs are shown using
decimal numbers, rather than using traditional hex numbers. In Figure C.1, the rightmost
signals show the strongest RSS measured during the measurement, and the three strongest
signals were received from MAC IDs 241001145012496, 241001145012498, and
241001145012499. Note that each AP has multiple interfaces and as such, a group of
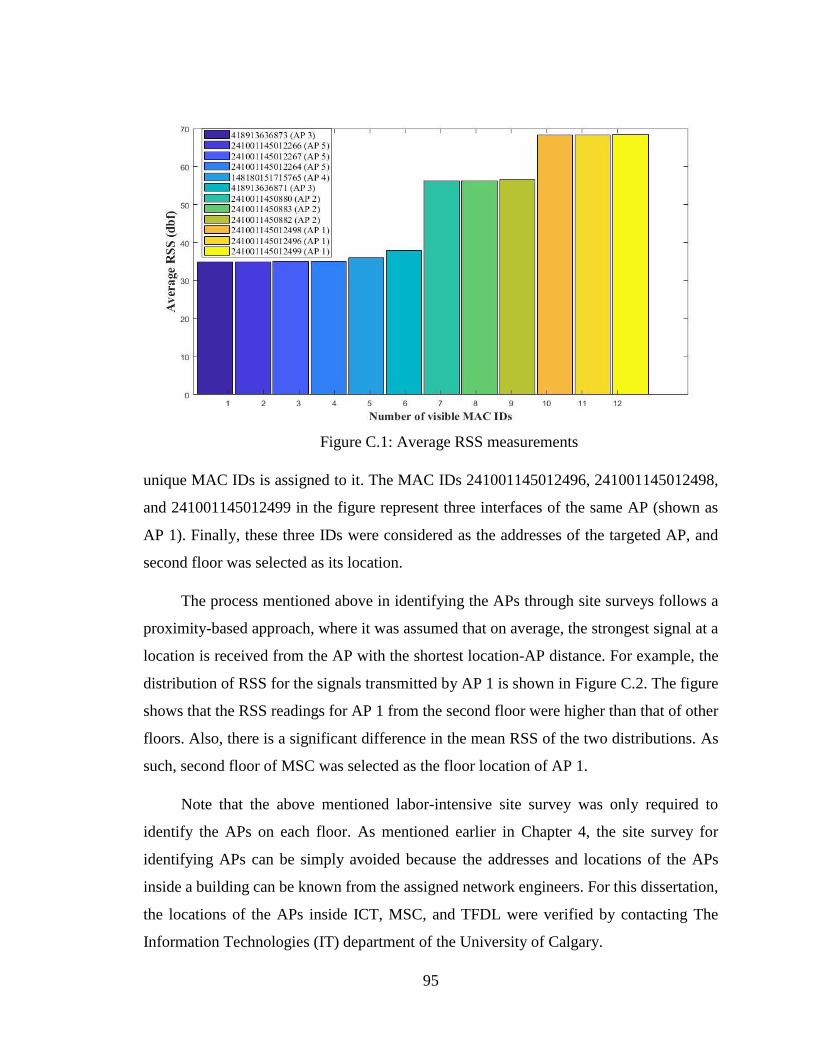
95
unique MAC IDs is assigned to it. The MAC IDs 241001145012496, 241001145012498,
and 241001145012499 in the figure represent three interfaces of the same AP (shown as
AP 1). Finally, these three IDs were considered as the addresses of the targeted AP, and
second floor was selected as its location.
The process mentioned above in identifying the APs through site surveys follows a
proximity-based approach, where it was assumed that on average, the strongest signal at a
location is received from the AP with the shortest location-AP distance. For example, the
distribution of RSS for the signals transmitted by AP 1 is shown in Figure C.2. The figure
shows that the RSS readings for AP 1 from the second floor were higher than that of other
floors. Also, there is a significant difference in the mean RSS of the two distributions. As
such, second floor of MSC was selected as the floor location of AP 1.
Note that the above mentioned labor-intensive site survey was only required to
identify the APs on each floor. As mentioned earlier in Chapter 4, the site survey for
identifying APs can be simply avoided because the addresses and locations of the APs
inside a building can be known from the assigned network engineers. For this dissertation,
the locations of the APs inside ICT, MSC, and TFDL were verified by contacting The
Information Technologies (IT) department of the University of Calgary.
Figure C.1: Average RSS measurements
96
Figure C.2: Distribution of RSS on different floors (signals transmitted by AP 1)
97
98
99
100


![Target Localization in Wireless Sensor Networks using ... · localization where at every iteration, the Fusion Center (FC) ... tection/estimation/tracking of events [1]–[4]. In](https://img.pdfslide.us/doc/110x75/5f8a29c34bb46533952d203c/target-localization-in-wireless-sensor-networks-using-localization-where-at.jpg)