Embed Size (px)
Citation preview
Sensitivity study of TEM data at La Bajada Fault
Tobyn W. VanVeghtenUniversity of Missouri-Rolla
July 11, 2004
Outline
• Objective
• Methodology with example 1-D results
• TEM Cross-section constrained by sensitivity analysis WinGLink
• EMMA and results from EMMA
• Conclusion
Objective
• Sensitivity analysis– Constrain TEM data at Canyon Site
• Qualitatively in WinGLink
• Quantitatively using EMMA
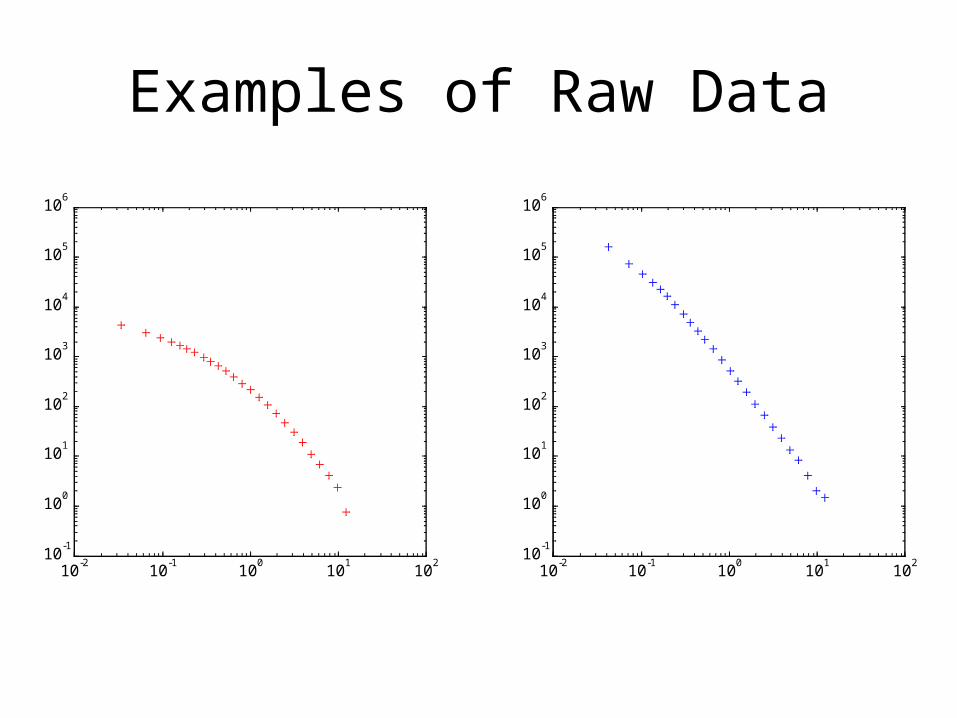
Examples of Raw Data
10-2
10-1
100
101
102
10-1
100
101
102
103
104
105
106
LB800 Raw Data
E.M.F. (uV/Amp)
Time (msec)10
-210
-110
010
110
210
-1
100
101
102
103
104
105
106
Time (msec)
E.M.F. (uV/Amp)
LB400 Raw Data
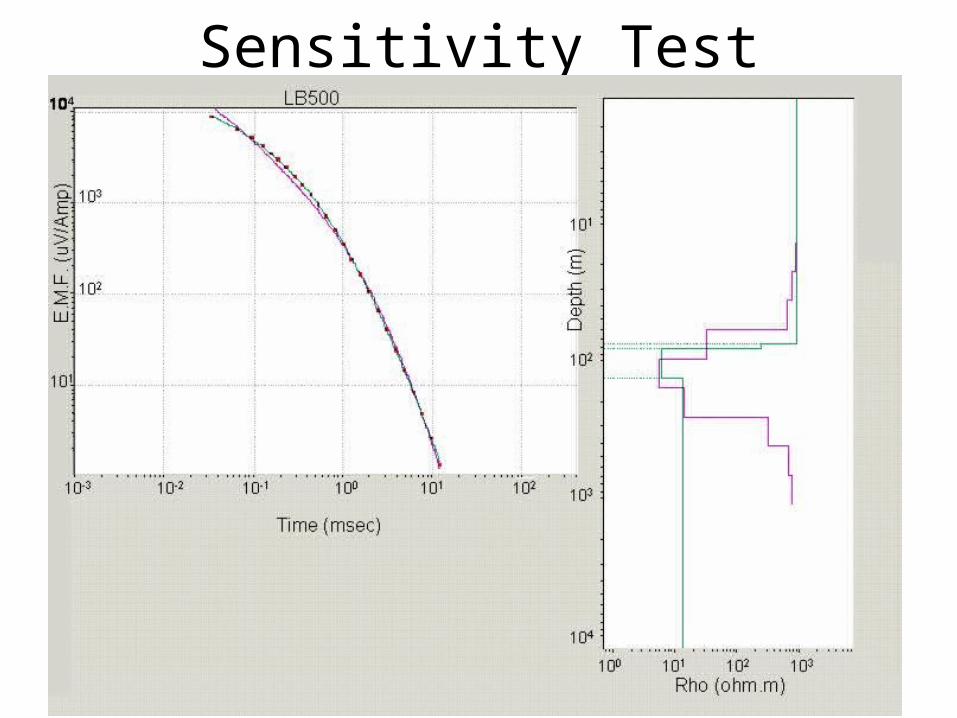
Sensitivity Test
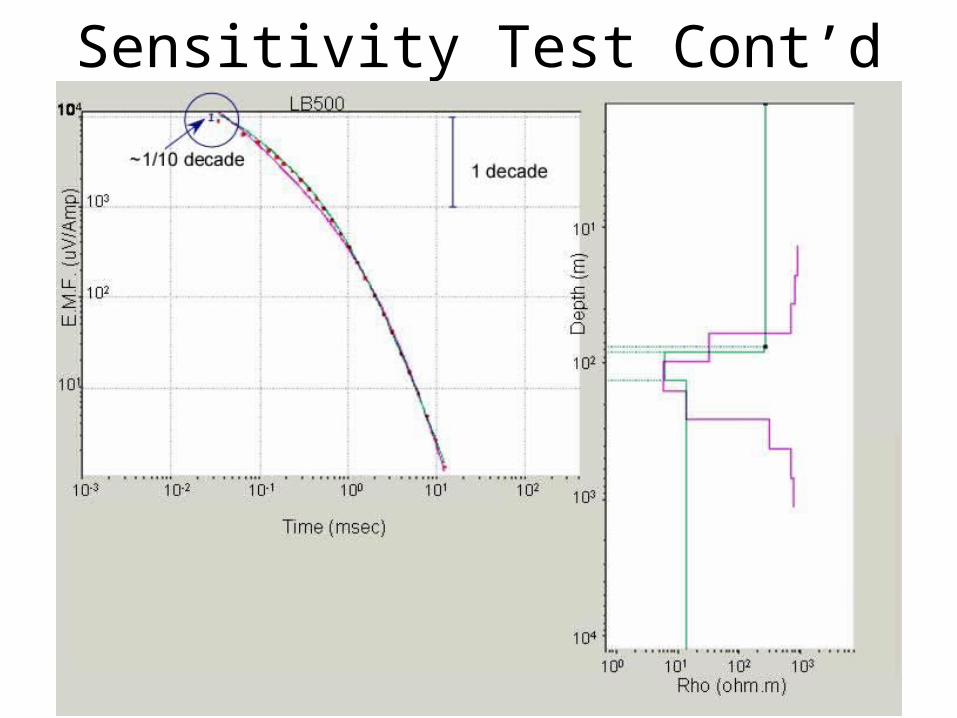
Sensitivity Test Cont’d
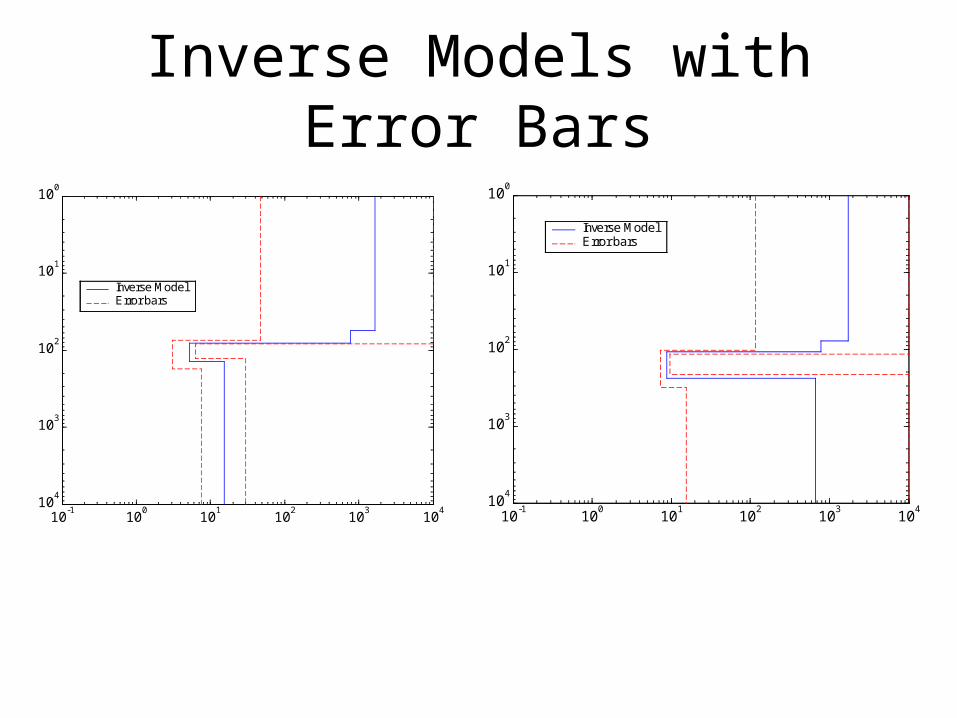
Inverse Models with Error Bars
10-1
100
101
102
103
104
100
101
102
103
104
Rho (ohm.m)
Depth(m)
Inverse model for LB100
Inverse ModelError bars
10-1
100
101
102
103
104
100
101
102
103
104
Rho (ohm.m)
Depth(m)
Inverse model for LB300
Inverse ModelError bars
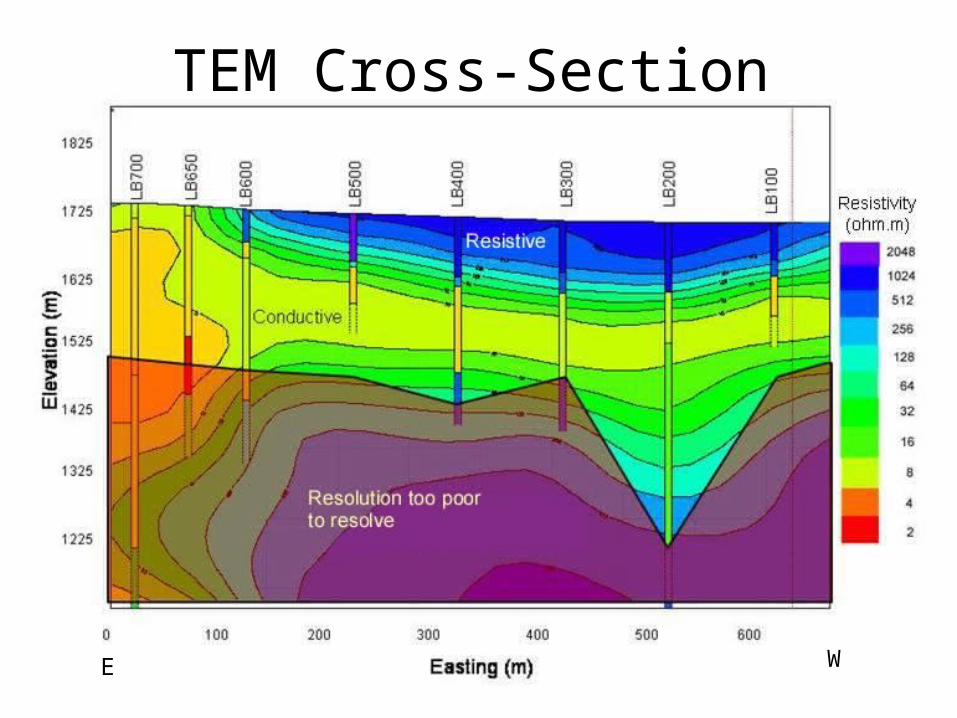
TEM Cross-Section
E W

EMMA
• Electromagnetic Model Analysis (EMMA) Program
• Developed by the HydroGeophysics Group, University of Aarhus, Denmark
• 1-D modeling program for most TEM, FDEM, Resistivity, MT, and borehole methods
• Includes model sensitivity analysis
*From Auken, Nebel, Sorensen, Breiner, Pellerin, and Christensen, June 2002
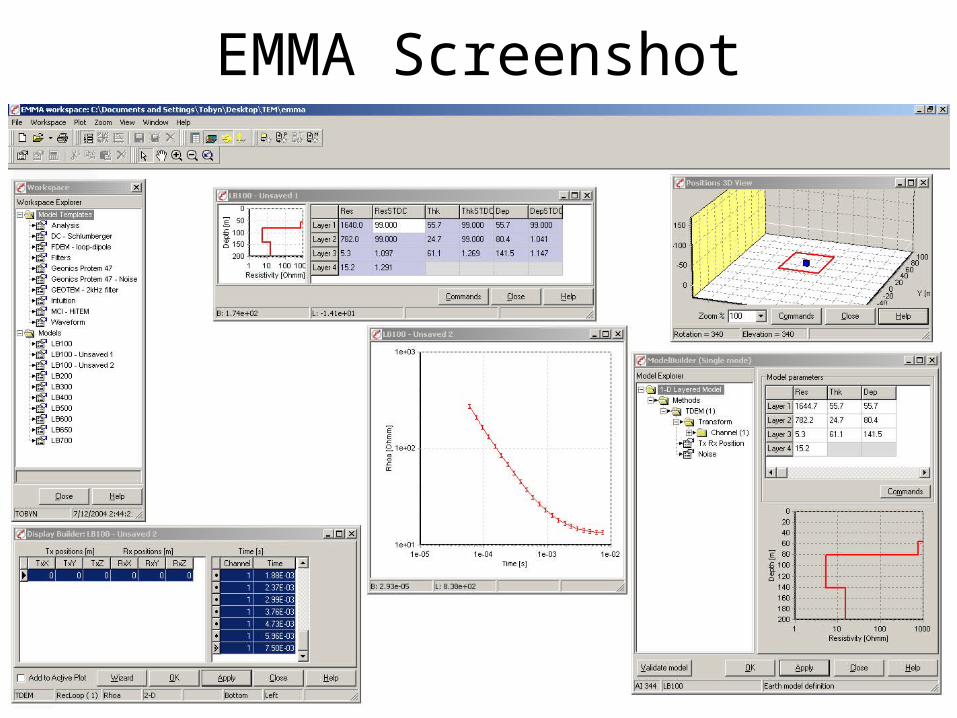
EMMA Screenshot
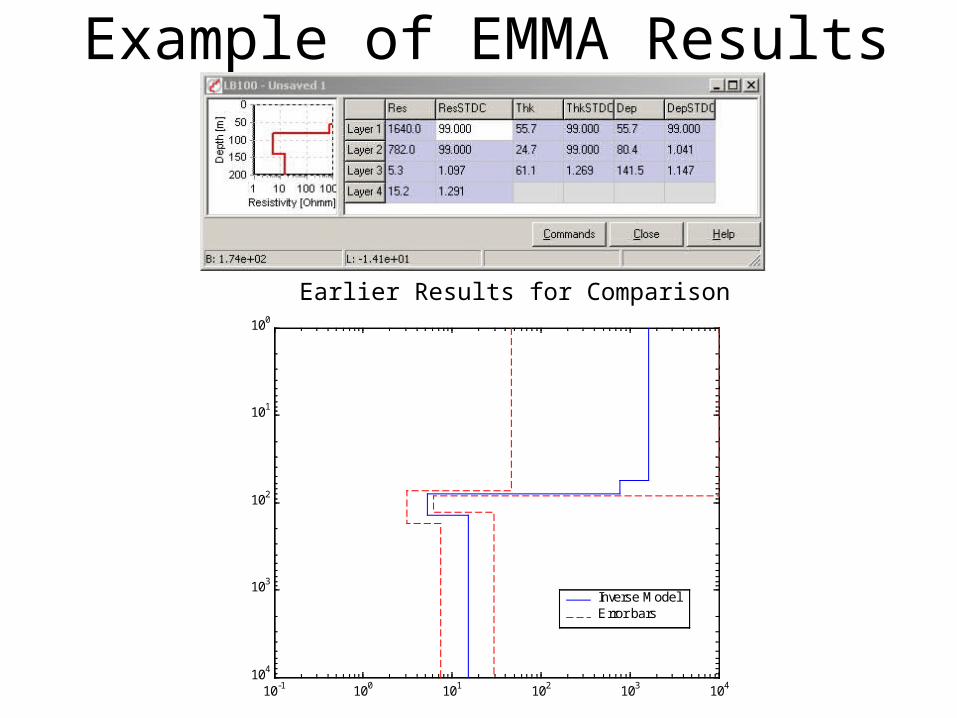
Example of EMMA Results
10-1 100 101 102 103 104
100
101
102
103
104
Rho (ohm.m)
Depth(m)
Inverse model for LB100
Inverse ModelError bars
Earlier Results for Comparison
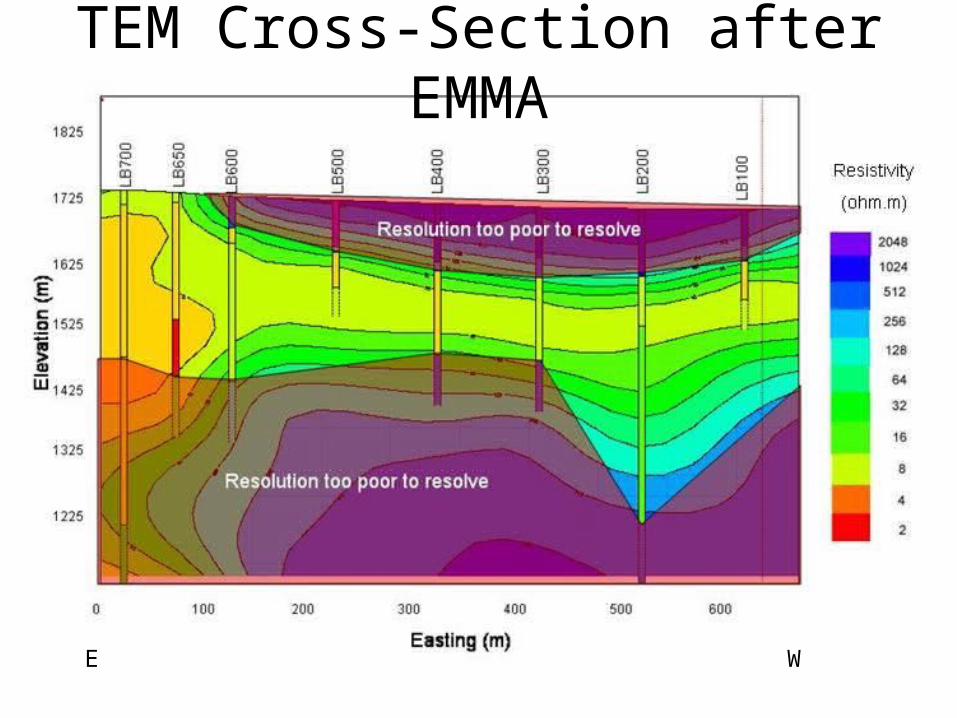
TEM Cross-Section after EMMA
E W
Conclusion
• Can’t resolve top and bottom resistive layers
• Change in character between LB600 and LB650
• Possible fault here