Embed Size (px)
Citation preview
Earth’s Future
Sensitivity of the Southern Ocean to enhanced regionalAntarctic ice sheet meltwater inputC. J. Fogwill1, S. J. Phipps1,2,3, C. S. M. Turney1, and N. R. Golledge4,5
1Climate Change Research Centre, School of Biological, Earth and Environmental Sciences, University of New SouthWales, Sydney, NSW, Australia, 2ARC Centre of Excellence for Climate System Science, University of New South Wales,Sydney, NSW, Australia, 3Institute for Marine and Antarctic Studies, University of Tasmania, Hobart, TAS, Australia,4Antarctic Research Centre, Victoria University of Wellington, Wellington, New Zealand, 5GNS Science, Lower Hutt, NewZealand
Abstract Despite advances in our understanding of the processes driving contemporary sea levelrise, the stability of the Antarctic ice sheets and their contribution to sea level under projected futurewarming remains uncertain due to the influence of strong ice-climate feedbacks. Disentangling thesefeedbacks is key to reducing uncertainty. Here we present a series of climate system model simulationsthat explore the potential effects of increased West Antarctic Ice Sheet (WAIS) meltwater flux on South-ern Ocean dynamics. We project future changes driven by sectors of the WAIS, delivering spatially andtemporally variable meltwater flux into the Amundsen, Ross, and Weddell embayments over future cen-turies. Focusing on the Amundsen Sea sector of the WAIS over the next 200 years, we demonstrate thatthe enhanced meltwater flux rapidly stratifies surface waters, resulting in a significant decrease in the rateof Antarctic Bottom Water (AABW) formation. This triggers rapid pervasive ocean warming (>1∘C) at depthdue to advection from the original site(s) of meltwater input. The greatest warming is predicted alongsectors of the ice sheet that are highly sensitized to ocean forcing, creating a feedback loop that couldenhance basal ice shelf melting and grounding line retreat. Given that we do not include the effects of ris-ing CO2 —predicted to further reduce AABW formation—our experiments highlight the urgent need todevelop a new generation of fully coupled ice sheet climate models, which include feedback mechanismssuch as this, to reduce uncertainty in climate and sea level projections.
1. Introduction
The Fifth Assessment Report of the Intergovernmental Panel on Climate Change highlights that currentand future anthropogenic greenhouse gas emissions are likely to affect climate for millennia to come, dueto the long equilibrium response time scales of Earth’s oceans and ice sheets [Collins et al., 2013; Stockeret al., 2013]. One major uncertainty, however, is how the marine-based West Antarctic Ice Sheet (WAIS) willrespond to future climate change, and particularly how it may contribute to future global mean sea level(GMSL) [Lenton et al., 2008; Pritchard et al., 2012; Vaughan et al., 2013; Golledge et al., 2015]. In part, this ques-tion arises from analogy with past interglacial periods when, despite only small apparent increases in meanatmospheric and ocean temperatures, GMSL is predicted to have been far higher than present [Dutton et al.,2015; Dutton and Lambeck, 2012; Kopp et al., 2009]. To achieve these levels, undefined mechanisms musthave been at work that substantially increased the net contribution of the Earth’s ice sheets to global sealevel [Fogwill et al., 2014].
One such mechanism could have been through ice-ocean feedbacks that arose as a consequence ofenhanced meltwater discharge to the Southern Ocean. This has been highlighted in recent studiesinvestigating the apparent coupling between Antarctic ice sheet change and atmospheric temperaturesduring past interglacials [Holden et al., 2010]. In conclusion, this detailed study of the Last Interglacialdemonstrated that feedbacks from WAIS retreat were required to simulate the magnitude of the observedwarming within Antarctic ice core records. Therefore, here we focus on the future impacts of increasingAntarctic meltwater input on ocean circulation on a localized time-transgressive basis. While previousstudies have examined the effects of Southern Ocean wide sea ice and meltwater feedbacks [Bintanja et al.,2013; Golledge et al., 2014; Menviel et al., 2010; Swingedouw et al., 2008; Weaver et al., 2003; Weber et al.,2014], we project future changes driven by sectors of the WAIS, delivering spatially and temporally variable
RESEARCH ARTICLE10.1002/2015EF000306
Key Points:• Antarctic Bottom Water formation
rate highly sensitized to freshwaterinput
• Ocean stratification leads to reducedvertical mixing and warming at depth
• Warming occurs in sectors ofAntarctic ice sheet sensitized toocean forcing
Supporting Information:• EFT296-sup-0001-2015EF000306-SI
Corresponding author:C. J. Fogwill, [email protected]
Citation:Fogwill, C. J., S. J. Phipps, C. S. M. Turney,and N. R. Golledge (2015), Sensitivity ofthe Southern Ocean to enhancedregional Antarctic ice sheet meltwaterinput, Earth’s Future, 3, 317–329,doi:10.1002/2015EF000306.
Received 18 JUN 2015Accepted 12 OCT 2015Accepted article online 15 OCT 2015Published online 17 NOV 2015
© 2015 The Authors.
This is an open access article underthe terms of the Creative CommonsAttribution-NonCommercial-NoDerivsLicense, which permits use and distri-bution in any medium, provided theoriginal work is properly cited, the useis non-commercial and no modifica-tions or adaptations are made.
FOGWILL ET AL. ANTARCTIC MELTWATER OCEAN SENSITIVITY 317

Earth’s Future 10.1002/2015EF000306
EAISWAIS
Amundsen Sea
Ross
Weddell
Byrd
David
Amundsen
George VI Coast
Weddell Sea
RossSea
(b) (a)
(d)
WAISWed
AMUN
WAISROSS
(c)
Figure 1. Location map. (a) Overview map of WAIS and EAIS outlining areas of grounded ice (white) and floating ice shelves (grey). (b)The Antarctic ice sheet with key locations and the sectors of the WAIS from which the grounded ice is sourced is labeled (Weddell,Amundsen, and Ross), represented by the RADARSAT-1 synthetic aperture radar mosaic of the ice sheet surface from the AntarcticMapping Mission (AMM-1) © CSA 2001. The image is overlaid with the modern ice divides of the WAIS and EAIS. (c) CSIRO Mk3L Antarcticland/sea mask with grid squares of meltwater addition highlighted. Blue boxes define the locations of meltwater input for each sector.(d) Convective depth (m) of the pre-industrial control simulation, showing regions of Southern Ocean downwelling and deepwaterformation predicted by CSIRO Mk3L.
meltwater flux into the Amundsen, Ross, and Weddell embayments over future centuries (Figure 1). Giventhat the WAIS has been demonstrated to be a key source of rapid sea level rise during the last deglaciation[Deschamps et al., 2012; Golledge et al., 2014; Weber et al., 2014], and has recently been suggested to havepassed a threshold in apparent stability [Joughin et al., 2014], the need to understand ice sheet-oceanfeedbacks that may alter future ice sheet dynamics is imperative.
The importance of feedbacks is highlighted by recent studies that have demonstrated the Southern Oceanhas warmed and freshened substantially over the last four decades [Purkey and Johnson, 2013; Schmidtkoet al., 2014; van Wijk and Rintoul, 2014], leading to increased stratification and a reduction in Antarctic Bot-tom Water (AABW) formation [de Lavergne et al., 2014]. The exact drivers of these changes, however, remainuncertain. Possible causal mechanisms range from increased ocean heat uptake to changes in regionalhydroclimate or shifts in atmospheric fronts or entrainment of warm deep water [Fogwill et al., 2014; Rheinet al., 2013; Spence et al., 2009; Spence et al., 2014; van Wijk and Rintoul, 2014]. A potentially major driver ofthis trend is increasing direct meltwater input from one or more sectors of the Antarctic ice sheets [Rye et al.,2014], leading to a reduction in the production of dense shelf water, the precursor to AABW.
Of particular concern is that WAIS retreat in the Amundsen Sea embayment may have passed a threshold instability and may now be unstoppable [Joughin et al., 2014]. This sector of the WAIS has an associated globalsea level rise of around ∼1.2 m, adding uncertainty to 21st century sea level rise projections and ocean cir-culation changes, and suggesting that current upper estimates of ∼1 m sea level rise over the next century
FOGWILL ET AL. ANTARCTIC MELTWATER OCEAN SENSITIVITY 318
Earth’s Future 10.1002/2015EF000306
may be conservative [Joughin et al., 2014; Stocker et al., 2013]. In addition, based on palaeoclimate recordsand ice sheet modeling studies, it appears that anthropogenic climate change today may be replicatingconditions that in the past triggered significant shifts in the stability of the Antarctic ice sheet through pos-itive feedback mechanisms that are not currently included in future projections [Golledge et al., 2014]. Thisuncertainty has been highlighted by several recent studies that have demonstrated changes in the circula-tion pattern of the Southern Ocean led to rapid melting of sectors of the Antarctic ice sheets [Golledge et al.,2014; Weber et al., 2014], potentially leading to abrupt rises in global sea level during the last deglaciation[Deschamps et al., 2012].
In light of the above questions, we analyze a suite of model simulations that examine the potential impactof Antarctic meltwater on the Southern Ocean over future centuries and millennia. In order to explore theeffects of meltwater discharge on ocean circulation, we undertake a number of simulations using a fullycoupled climate system model that provide new insights into the effects of spatially and temporally vari-able meltwater fluxes from Antarctica. We examine the response of the atmosphere, ocean, and sea ice tovariable and time-transgressive meltwater input from specific locations at the periphery of the ice sheet tobetter understand both contemporaneous and potential future interactions between the ice sheet and theocean around Antarctica. We do not include the effects of rising CO2 —predicted to further reduce AABW[Phipps et al., 2012]—so as to explore the role of meltwater alone on Southern Ocean circulation, a factorthat may play a role in freshening and contraction of AABW today [van Wijk and Rintoul, 2014].
2. Data and Methods
We use CSIRO Mk3L version 1.2, a fully coupled atmosphere-ocean general circulation model, to carry outmulti-centennial simulations. The model comprises fully interacting ocean, atmosphere, land surface, andsea ice components, and is designed for millennial-scale climate simulations [Phipps et al., 2011; Phipps et al.,2012]. The ocean model has a horizontal resolution of 1.6∘ latitude× 2.8∘ longitude and 21 vertical levels,while the atmosphere model has a horizontal resolution of 3.2∘ latitude× 5.6∘ longitude and 18 vertical lev-els. Importantly, CSIRO Mk3L has demonstrated utility for simulating past and future changes in the climatesystem, including the millennial-scale response to anthropogenic forcing [Phipps et al., 2013; Phipps et al.,2012]. We chose CSIRO Mk3L for this study because it includes full dynamic complexity in its sub-models,and yet is sufficiently computationally efficient to allow us to explore the long-term evolution of the South-ern Ocean to meltwater fluxes.
Our experiments consider a range of idealized hypothetical scenarios, from collapse of discrete sectors ofthe WAIS, as suggested by remote sensing and model estimates [Joughin et al., 2014; Rignot et al., 2014],through to a complete collapse of the entire ice sheet. Meltwater is added in specific sectors, close to mod-ern grounding lines, over varying periods of time (Table 1). We focus on the WAIS given that, as the onlymarine-based ice sheet on the planet, it represents one of the key potential tipping elements in the Earth’sclimate system [Lenton et al., 2008]. While we acknowledge that there is a growing body of evidence thatsuggests sectors of the East Antarctic Ice Sheet (EAIS) may also be at risk from marine ice sheet instabil-ity (MISI) [Mengel and Levermann, 2014], the WAIS has the potential to respond on centennial timeframes[Hellmer et al., 2012; Joughin et al., 2014; Lenton et al., 2008]. We divide the WAIS into three sectors, Weddell,Ross, and Amundsen, based on the modern ice sheet geometry and ice divides (Figure 1); while these couldevolve over time due to rapid changes such as those recorded in the Amundsen Sea region [Joughin et al.,2014], it provides a means of dividing the potential meltwater input of the modern ice sheet into sectors.
We employ an ensemble modeling approach. For each experiment, the model was integrated three times.Each of these simulations was identical except for the fact that it is initialized from a different year of apre-industrial control simulation. Such an approach allows us to better distinguish between natural inter-nal climate variability and the forced response to the meltwater fluxes. The results reported here representthe ensemble mean for each experiment, with any anomalies being calculated relative to the pre-industrialcontrol simulation. Extensive analysis demonstrates that CSIRO Mk3L reproduces pre-industrial climatologyfaithfully [Phipps et al., 2011; Phipps et al., 2012], and it has been used extensively to examine decadal andcentennial changes in climate phenomena including El Niño and the Southern Annular Mode [Abram et al.,2014; McGregor et al., 2013]. Critically, CSIRO Mk3L reproduces broader scale Southern Ocean dynamics well,predicting rates of pre-industrial simulation AABW formation of ∼6.8 Sv, a value close to Southern Ocean
FOGWILL ET AL. ANTARCTIC MELTWATER OCEAN SENSITIVITY 319

Earth’s Future 10.1002/2015EF000306
Table 1. Southern Ocean Freshwater Pulse Experiments: Seawater Equivalent (SWE), Time of Meltwater Input for EachExperiment, Freshwater Flux (Sv) Based on Time Frame, and Key Reference
Scenario
Total
SWE (m)
Time
(years)
Freshwater
Flux (Sv) Description Principal Reference
AMUN 1.2 200 0.069 Loss of Amundsen Seasector of the WAIS over200 years
Rignot et al. [2014]
WAISMAX 3.6 (i) 200
(ii) 400
(i) 0.139
(ii) 0.070
Loss of Amundsen Seasector over 200 years, plusloss of Ross and Weddell Seasectors over 400 years
Rignot et al. [2014]; Bamberet al. [2009]
WAISMIN 3.6 (i) 900
(ii) 1000
(i) 0.044
(ii) 0.028
Loss of Amundsen Seasector over 900 years, plusRoss and Weddell Seasectors over 1,000 years
Rignot et al. [2014]; Bamberet al. [2009]
observations of between 8.1 and 9.4 Sv [Orsi et al., 1999]. In addition, it reproduces the subduction of South-ern Ocean surface waters just north of the Antarctic Circumpolar Current (ACC), where it forms Sub-AntarcticMode Water and Antarctic Intermediate Water, the building blocks of the global ocean shallow-overturningcirculation [Connolley and Bracegirdle, 2007]. These features can clearly be seen in our pre-industrial clima-tology, apparent from the projected depth of convection in the simulated pre-industrial control simulation(Figure 1d).
We deliberately choose not to increase CO2 in our experiments. While we acknowledge that the combinedeffects of elevated CO2 have substantial implications for both sea ice production and AABW formation[Phipps et al., 2012], our aim is to disentangle, in detail, the effects of localized meltwater flux delivery at theperiphery of the Antarctic ice sheets to examine potential feedback loops independent of past or futureCO2 changes [Collins et al., 2013; Holden et al., 2010; Joughin et al., 2014; Swingedouw et al., 2008].
Our simulations focus on the three hypothetical “end member” scenarios: AMUN, WAISMAX, and WAISMIN.These are summarized in Table 1. AMUN reflects a hypothetical collapse of the Amundsen Sea sector of theWAIS over the next two centuries [Joughin et al., 2014]. This was implemented as a freshwater flux of 0.069 Svinto the Southern Ocean through the Amundsen Sea embayment for 200 years, equivalent to an increaseof ∼1.2 m in the global sea level. WAISMAX provides an extreme scenario of a collapse of the AmundsenSea sector of the WAIS over 200 years, combined with an additional collapse of the Weddell and Ross Seasectors of the WAIS over a total of 400 years [Bamber et al., 2009]. Finally, WAISMIN represents a hypotheticalcollapse of the Amundsen Sea sector of the WAIS over 900 years, combined with an additional collapse ofthe Weddell and Ross Sea sectors of the WAIS over 1000 years. As such, the only difference between WAISMIN
and WAISMAX is the timing of meltwater delivery to the ocean. The locations of the sources of grounded iceand resultant meltwater input for each experiment are shown in Figure 1.
Past studies have considered simple scenarios, hosing large sectors of the Southern Ocean [Bintanja et al.,2013; Holden et al., 2010; Menviel et al., 2010; Morrison et al., 2015; Weaver et al., 2003], but we are not awareof any that have considered the direct effects of localized time-transgressive meltwater input on ice sheetdynamics. Recent studies have shown that Antarctic meltwater input can be highly localized [Shepherd et al.,2004], and yet still have important implications for the Southern Ocean circulation, atmospheric processes,sea ice regimes, and potentially ice sheet dynamics [Pritchard et al., 2012; Rhein et al., 2013; Vaughan et al.,2013]. Importantly, we choose not to include the additional effects of rising CO2 in our simulations due tothe extremely strong impact that predicted increases in CO2 will have on sea ice formation, brine rejection,and therefore AABW formation over forthcoming decades and centuries [Phipps et al., 2012], which poten-tially contradict contemporary observations of Southern Ocean sea ice expansion and AABW contractionand freshening [Rhein et al., 2013; van Wijk and Rintoul, 2014]. Thus, while our experiments represent hypo-thetical idealized scenarios, they allow us to examine the response of the Southern Ocean to both limitedlocalized meltwater additions (i.e., AMUN) and more extensive time-transgressive collapse scenarios (i.e.,WAISMAX and WAISMIN). These scenarios are critical for better understanding the evolution and response
FOGWILL ET AL. ANTARCTIC MELTWATER OCEAN SENSITIVITY 320

Earth’s Future 10.1002/2015EF000306
of the Southern Ocean to meltwater input that is predicted to be highly spatially and temporally variable[Rignot et al., 2014].
3. Results
Here we discuss the response of the Southern Ocean to the meltwater forcing simulations, and the drivingmechanisms involved.
3.1. Southern Ocean Response
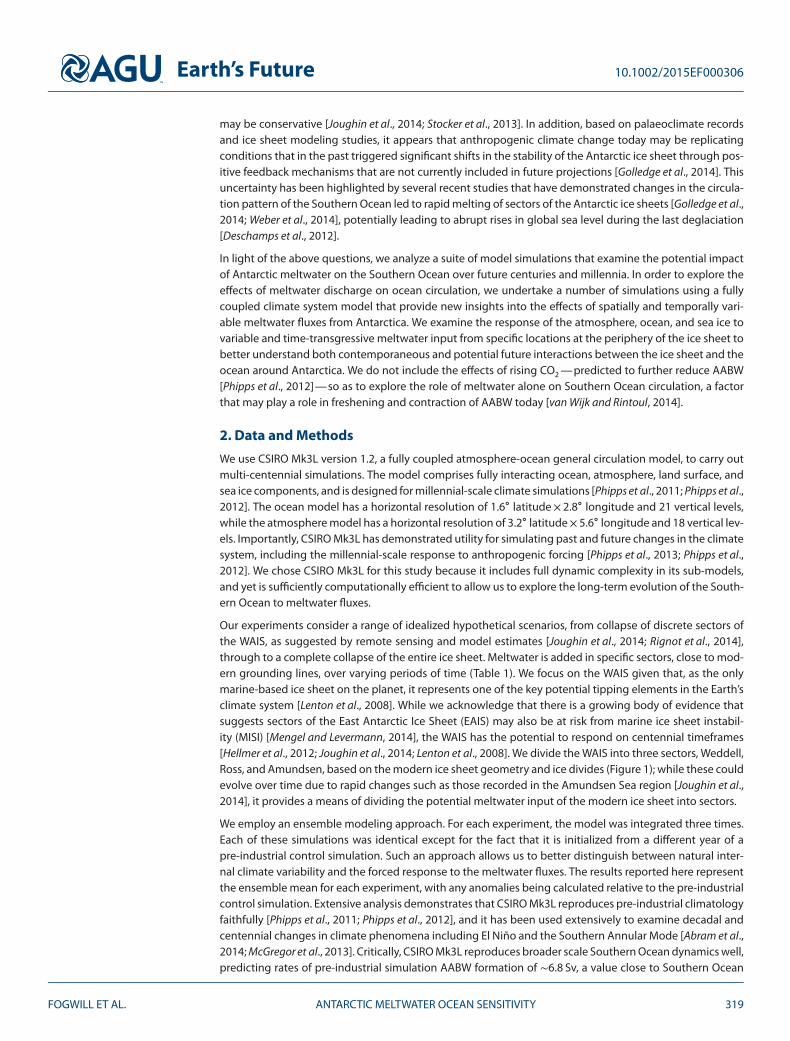
Each model simulation reveals rapid and pervasive impacts on the Southern Ocean circulation from theimposed freshwater flux. To understand the impacts on AABW formation and other climate variables, wecompare changes to the climatology of the pre-industrial control simulation. While there is some variabilityin the structure, due to the evolving model response to each individual experiment, the 50 year runningmean of each simulation clearly demonstrates the strong effect that meltwater has on AABW formation,with the rate decreasing by 25–50% within decades in comparison to the control situation (Figure 2a).Importantly, the levels of AABW remain reduced throughout the hosing period and, while there is apparentstructure within the 50 year running mean in the first 200 years of the WAISMAX and AMUN experiments,this structure, which reflects the model’s evolving response to forcing, is lost when we examine the 10 yearrunning means over this period (Figure 2b). The extremely rapid nature of the freshwater flux’s impact onAABW formation causes far-reaching, rapid, and pervasive changes within the Southern Hemisphere cli-mate system.
Through comparison between the scenarios, it is possible to assess the impact of an increased freshwaterflux in different regions of the Southern Ocean; this is particularly important when considering potentialfeedback effects on the Antarctic ice sheets [Golledge et al., 2014; Rye et al., 2014]. Figure 2 demonstrates theeffect on the rate of AABW formation within each experiment. While each scenario leads to rapid reductionsin AABW formation, their signatures vary markedly. AMUN experiences a rapid decline from a mean rate of6.9 Sv in the pre-industrial control simulation to a minimum of about 3.6 Sv by the end of the 200 year hosingperiod (Figure 2b). WAISMAX experiences a similar magnitude of change, with a rapid initial decline to around3.2 Sv, followed by a gradual recovery, and then further stepped recoveries after 200 and 400 years as themeltwater flux ceases. These simulations both contrast with WAISMIN which, while exhibiting a strong andpervasive response to the hosing, only experiences a reduction in AABW formation of ∼1.7 Sv at a broadlyconstant level over the 900 years, with a recovery to levels above background after a further 100 years priorto returning to pre-industrial levels by the end of the 1500 year experiment. The apparent bounce back andvariability of the WAISMIN experiment post-hosing reflects the evolving model response to forcing, and it isimportant to note that the values in Figure 2 are the 50 year running means of the simulations. More detailof both the reduction and increase in the rate of AABW formation can be seen in Figure 2a where the 10 yearrunning mean is presented for the first 250 years of hosing.
3.2. Driving Mechanisms
The model outputs show that these increased freshwater fluxes rapidly reduce the mixing of the cold surfacewaters with the underlying warmer waters and lead to cooling of the surface and warming at depth inall simulations. This can be seen clearly in Figure 3, which depicts the evolving temperature anomaly inresponse, over each 50 year period of the 200 year experiment (Figures 3a–3d), to the reduction in the rateof AABW formation (Figure 3e) for the AMUN simulations. This results from density-driven stratification ofthe upper ocean by the increased freshwater, with increased freshwater fluxes rapidly reducing the rateof AABW formation. This results in a rapid initial freshening of the surface waters, which is apparent as areduction in the sea surface salinity (SSS; Figure 4) and a concomitant reduction in the sea surface density(SSD; Figure 5). As would be expected, these changes are strongest in the regions where the freshwaterfluxes are applied. The SSS is reduced by up to 6 psu in the Amundsen Sea during the first 200 years of theexperiment, but then rapidly recovers as soon as the hosing ceases. The SSS is also reduced by up to 4 psuin the Ross and Weddell Seas (Figure 4). The reduction in SSD leads to increases in the stratification of theupper ocean, reducing the depth of convection markedly in some locations (Figure 6). It is worth notingthat, regardless of the internal redistribution of heat within the ocean, the response of the surface climateis negligible with, for example, only insignificant changes in the latitude and/or intensity of core westerlyairflow (Figure 7).
FOGWILL ET AL. ANTARCTIC MELTWATER OCEAN SENSITIVITY 321
Earth’s Future 10.1002/2015EF000306
(a)
(b)
Figure 2. The changes in the rate of AABW formation predicted from experiments AMUN, WAISMIN, and WAISMAX, plotted against thepre-industrial control simulation to demonstrate the background variability. The thin lines indicate the rate of AABW formation fromindividual simulations; thick lines indicate the ensemble mean. (a) Evolution of AABW formation over the full period of the regionalexperiments from −100 to 1500 model years. It should be noted that the values shown are 50 year running means. (b) Evolution of theperiod −50 to 250 model years. It should be noted that the values shown are 10 year running means. The vertical dashed lines indicatethe end(s) of the hosing phase(s) for each experiment.
These changes in the Southern Ocean are most apparent in the regions of strong contemporary AABWformation in the Ross and Weddell Seas, as the sudden decrease in the rate of AABW formation drives thepronounced temperature differences through the water column (Figure 3). The magnitude of the warmingat depth varies spatially depending on the location and magnitude of the imposed meltwater flux; however,the pattern of warming simulated in response to each of our scenarios is remarkably similar. This can be seenin Figure 8, which compares each of the experiments 101–200 years after the initiation of hosing.
While all of the experiments predict warming at depth (400–700 m) around the entire continent, the focus ofintense warming stretches from the western Antarctic Peninsula, along the Amundsen Sea Embayment andinto the Ross Sea extending to George V Coast (Figures 8a–8c). The degree of warming in these regions isremarkable, ranging from 0.5∘C to in excess of 1∘C between 400 and 700 m within the first 200 years of eachexperiment. The sites of intense warming at depth correlate with regions of marked changes in convectivedepth (Figures 8d–8f ). Given that changes in convective depth are seen in all regions of AABW formation inall simulations, advection of the meltwater input around the Southern Ocean in the coastal counter current
FOGWILL ET AL. ANTARCTIC MELTWATER OCEAN SENSITIVITY 322

Earth’s Future 10.1002/2015EF000306
(a)(a) (b)
(c) (d)
(e)
Figure 3. The average zonal mean ocean temperature anomaly (∘C), relative to the equivalent years of a pre-industrial controlsimulation, across the Southern Hemisphere during hosing for experiment AMUN for years (a) 1–50, (b) 51–100, (c) 101–150, and (d)151–200. (e) Lower panel depicts the evolution in the rate of AABW formation predicted from experiment AMUN, plotted against thepre-industrial control simulation to demonstrate the background variability and evolving model response. The thin lines indicate the rateof AABW formation from individual simulations evolution of the period −50 to 250 model years. It should be noted that the valuesshown are 10 year running means. The vertical dashed lines indicate the end of the hosing phase for experiment AMUN.
is clearly an important mechanism for communicating the meltwater signal and triggering stratification andconcomitant warming around the periphery of the continent.
4. Discussion
The results of our three experiments clearly demonstrate a strong positive feedback mechanism betweenincreased Antarctic meltwater flux and warming at depth in the Southern Ocean in all scenarios. By focusingmeltwater flux in discrete locations in a time-transgressive way, we are able to demonstrate that the oceanicresponse is controlled not only by the volume or temporal evolution of the flux of freshwater into the oceanbut also that the location plays a critical role in the impact that meltwater has on Southern Ocean dynamics.
While the effects of the freshwater input are strongest near the Antarctic continent, they are felt acrossthe Southern Hemisphere (Figure 3), with the reduced AABW and increased stratification impacting thesalinity and temperature structure across the oceans; however, the most intense changes are seen in the
FOGWILL ET AL. ANTARCTIC MELTWATER OCEAN SENSITIVITY 323

Earth’s Future 10.1002/2015EF000306
(a) (b)
Figure 4. Average sea surface salinity (psu) during (a) a pre-industrial control simulation, and (b) years 151–200 of experiment AMUN,expressed as an anomaly relative to the control.
(a) (b)
Figure 5. Average sea surface density (kg m−3) during (a) a pre-industrial control simulation, and (b) years 151–200 of experimentAMUN, expressed as an anomaly relative to the control. In (a), 1000 kg m−3 has been subtracted from the values for convenience.
Southern Ocean, as suggested by other studies that use Southern Ocean sector wide freshwater forcing[Menviel et al., 2010; Morrison et al., 2015] (Figure 9). In reality, although possible increases in CO2 are notincluded in our experiments, future fluxes of freshwater into the Southern Ocean due to melting of theWAIS may also change in response to increasing atmospheric concentrations of greenhouse gases; theseincreases, through a reduction in Antarctic sea ice formation, would cause an additional reduction in therate of AABW formation [Phipps et al., 2012; Swingedouw et al., 2008]. These changes would act to exagger-ate the response seen in our simulations. Our scenarios should therefore be regarded as conservative, andwarming at depth in the Southern Ocean with increased CO2 would likely exceed the values simulated. Adetailed understanding of the interplay and feedbacks between meltwater and rising CO2 should be seenas a priority for future modeling studies given the rises predicted over the coming decades [Collins et al.,2013].
With the recent evidence which suggests that the Amundsen Sea sector of the WAIS may have alreadypassed a key threshold in stability [Joughin et al., 2014], our discussion focuses on the AMUN experiment,and the potential implications that this has for future Antarctic ice sheet stability and associated global sealevel rise. The AMUN experiment shows a remarkable and rapid reduction in the rate of AABW formation, incommon with each of the experiments (Figure 2). The resultant warming at depth is also remarkable, and
FOGWILL ET AL. ANTARCTIC MELTWATER OCEAN SENSITIVITY 324

Earth’s Future 10.1002/2015EF000306
(a) (b)
Figure 6. Average depth of convection (m) during (a) a pre-industrial control simulation, and (b) years 151–200 of experiment AMUN,expressed as an anomaly relative to the control.
(a) (b)
Figure 7. Average zonal component of surface wind stress (N m−2) during (a) a pre-industrial control simulation, and (b) years 151–200of experiment AMUN, expressed as an anomaly relative to the control.
is of a similar magnitude to the WAISMAX experiment, reflecting the importance of the location of the melt-water input (Figure 8). This is supported by the WAISMAX experiment, which shows a distinct recovery oncehosing from the Amundsen Sea has ceased after 200 years (Figure 2). The magnitude of this response sug-gests that the Amundsen Sea is a critical location for meltwater input, a conclusion that is further supportedby the marked recovery within the WAISMAX experiment as soon as the Amundsen Sea sector flux ends. Thebehavior of the AMUN experiment most likely reflects two factors: first, the instantaneous application of afreshwater flux of 0.069 Sv into the Amundsen Sea; second, strong transport through the Antarctic coastalcounter current, which redistributes the enhanced freshwater toward the two important sectors of AABWformation, stratifying the ocean and rapidly reducing bottom water formation in both the Ross Sea and offGeorge V Coast (East Antarctica) (Figure 8).
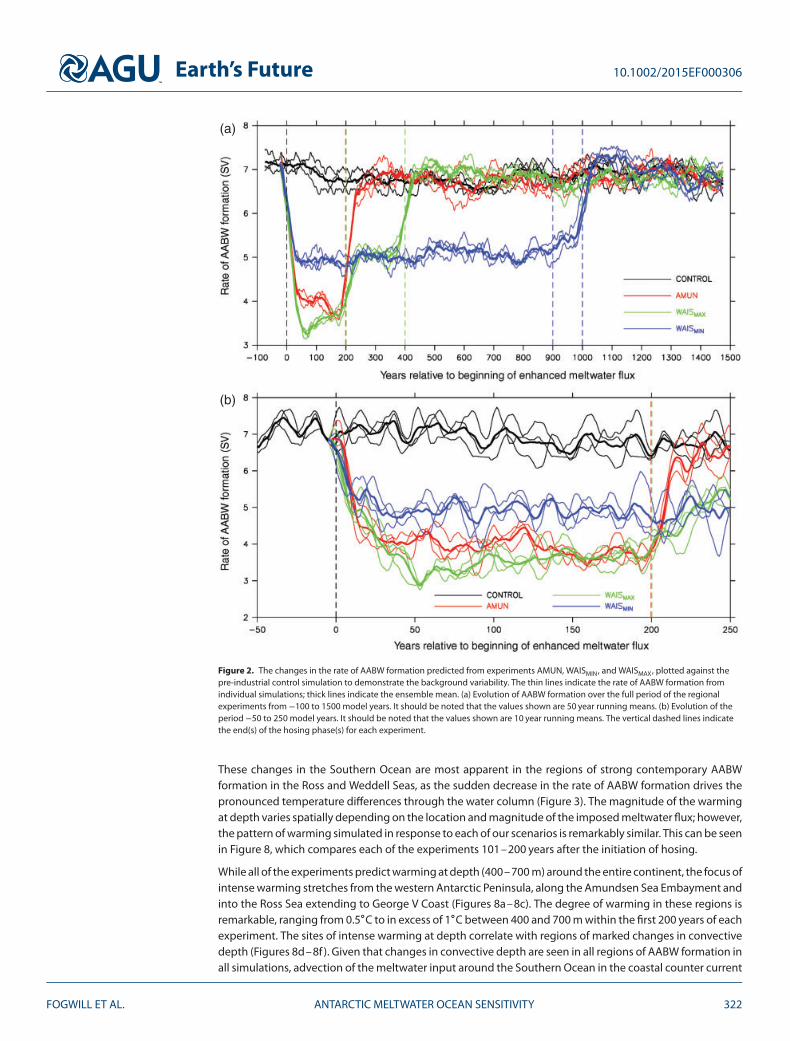
The reduced rate of exchange between the cold surface waters and the underlying warmer waters leadsto a rapid early regional warming, with the strongest temperature increases occurring at the depths ofthe grounding lines. This can be seen clearly in Figure 9, which shows warming at depth and temperaturechanges in the Amundsen, Ross, and Weddell Seas predicted from the AMUN experiment. Importantly, thesimulated warming is instantaneous and pervasive, remaining stable for several centuries throughout thewater column (Figure 3). It is also noted that the magnitude of the warming is of the order of that recorded
FOGWILL ET AL. ANTARCTIC MELTWATER OCEAN SENSITIVITY 325

Earth’s Future 10.1002/2015EF000306
(a) (b) (c)
(d) (e) (f)
Figure 8. Upper panels: Average mean ocean temperature anomaly (∘C), relative to the equivalent years of a pre-industrial controlsimulated, between 400 and 700 m for years 101–200 from experiment, (a) AMUN, (b) WAISMAX, and (c) WAISMIN. Lower panels: Averagemean convective depth anomaly (m), relative to the equivalent years of a pre-industrial control simulated, for years 101–200 fromexperiment, (d) AMUN, (e) WAISMAX, and (f ) WAISMIN.
in the ACC over recent decades [Boning et al., 2008], as well as locally in the Amundsen Sea. This is associ-ated with rapid ice sheet drawdown triggered by marine ice sheet instability (MISI) [Joughin and Alley, 2011;Shepherd et al., 2004].
Although our simulations project warming at several localities around the Southern Ocean—includingalong the Antarctic Peninsula—it is the marked warming along the fringes of the WAIS including Marie ByrdLand and in the Ross Sea that have significant implications for future ice sheet stability (Figure 1). Throughcomparison of the resultant warming predicted by the model, and the outputs from high-resolution icesheet modeling studies [Fogwill et al., 2014; Golledge et al., 2012; Golledge et al., 2015], we can see that thefoci of the ocean warming are adjacent to the sectors of the ice sheet that are predicted to respond mostrapidly to ocean forcing. These sites correspond with sectors of the WAIS—and potentially the EAIS—thatare drained by fast-flowing outlet glaciers, conduits which originate in the interior of the ice sheet.
Previous experiments suggest that these major arteries of the ice sheet are highly sensitive to changes inocean temperature and sea level at the periphery of the continent, and are able to induce drawdown fromthe WAIS and EAIS, transmitting changes felt in the ocean rapidly to the interior of the ice sheet [Golledgeet al., 2012]. The sensitivity of these sectors of the ice sheet relates to two major factors: the coincidenceof ice sheet basins with concave ice sheet surface profiles [Cuffey and Patterson, 2010], and an individualbasin’s connectivity to the ocean [Fogwill et al., 2014]. These conditions exist—and importantly may wellpersist due to hysteresis within ice sheets [Schoof , 2007]—across much of the WAIS, including the Siplecoast ice streams in the Ross Sea (Figure 1), but also in key sectors of the EAIS, namely the Byrd and Davidcatchments of the western Ross Sea. In common with many of the WAIS catchments, the David and Byrdcatchments currently exhibit concave profiles suggesting weakness at their bed and potential for high massflux [Fogwill et al., 2014]. Importantly, flux changes in the David and Byrd catchments have the potential tocause drawdown within the extensive Wilkes sub-glacial basin, supporting past studies that highlight apotential contribution to future global sea level from the EAIS [Fogwill et al., 2014; Fox, 2010; Mengel andLevermann, 2014; Miles et al., 2013].
To summarize, the changes in the properties of AABW triggered by increasing freshwater input in the South-ern Ocean surrounding Antarctica have critical implications for the dynamics of the Antarctic ice sheet.
FOGWILL ET AL. ANTARCTIC MELTWATER OCEAN SENSITIVITY 326
Earth’s Future 10.1002/2015EF000306
(a) (b)
Figure 9. (a) Average ocean temperature anomaly (∘C) between 400 and 700 m. (b) Detail of average zonal mean temperature anomaly(∘C) across the (i) Amundsen, (ii) Ross and (iii) Weddell Seas. All values shown are the mean for years 101–200 of experiment AMUN,relative to the equivalent years of a pre-industrial control simulation.
Intriguingly, several recent studies provide growing evidence of rapid contemporary changes in the proper-ties of AABW [Jacobs et al., 2002; Rhein et al., 2013; van Wijk and Rintoul, 2014]. Observations suggest that theAABW layer is warming, freshening, and contracting in volume [Jacobs et al., 2002], although the drivers ofthese changes are not yet clear. Our simulations and the mechanism described above suggests that contem-porary Southern Ocean freshening may already be occurring as a result of increasing delivery of meltwaterfrom Antarctic ice, with the possibility that a marked reduction in the rate of AABW production may beimminent [Purkey and Johnson, 2013; Rhein et al., 2013], triggering further warming at depth in the South-ern Ocean. When combined with uncertainties regarding potential increases in ocean temperatures dueto shifting winds and/or changing ocean circulation patterns, the potential for marked changes in oceanice sheet dynamics over the next century is high [Fogwill et al., 2014; Hellmer et al., 2012; Miles et al., 2013;Spence et al., 2014]. Our experiments provide a unique insight into potential future changes in the SouthernOcean that have important implications for the stability of the Antarctic ice sheets. This study examines justone of a number of strong feedback mechanisms operating at the ocean ice sheet interface that questioncurrent sea level rise projections; clearly, modeling studies will need to integrate these feedbacks to gain amore realistic picture of future change.
5. Conclusions
Our idealized experiments demonstrate that the stability and rate of AABW formation is highly sensitizedto surface salinity variations in the Southern Ocean at the periphery of the Antarctic ice sheets. Previousmodeling studies have demonstrated that this sensitivity may have been crucial in driving periods of pastrapid ice sheet change [Fogwill et al., 2014; Golledge et al., 2014]. Therefore, given current projections of icesheet change, this mechanism must be assessed to explore the potential feedback mechanisms that mayoccur in the next century and beyond. This study demonstrates that the impact on the rate and volume ofAABW formation due to enhanced localized meltwater is essentially instantaneous, experiencing significantreductions within decades of input, but with no apparent atmospheric response.
The simulated modeled rapid response of Southern Ocean circulation may explain the current reductionand contraction in AABW formation recorded since the 1950s [Rhein et al., 2013; Stocker et al., 2013; van Wijk
FOGWILL ET AL. ANTARCTIC MELTWATER OCEAN SENSITIVITY 327

Earth’s Future 10.1002/2015EF000306
and Rintoul, 2014]. This contrasts with the potential impacts of increasing CO2, which, despite the strengthof their forcing, are predicted to take some centuries to significantly impact AABW formation [Phipps et al.,2012]. Our experiments demonstrate clearly that even without CO2 forcing, changes in circulation driven bysurface salinity decreases in response to meltwater input lead to net warming in many sectors of the South-ern Ocean, ranging from 0.4 to in excess of ∼1∘C between 400 and 700 m within the first 200 years of eachexperiment (Figure 3; Figures S1 and S2, Supporting Information). With the location of this warming at thegrounding lines of portions of both the WAIS and EAIS, which are already sensitized to marine-driven insta-bility [Fogwill et al., 2014], this meltwater-ocean warming feedback provides an additional and importantmechanism that increases the likelihood of marine instability of large sectors of the Antarctic ice sheets.To better constrain sea level rise projections, future coupled ice sheet-ocean models must include thesenonlinear feedback mechanisms to better understand anomalous observations across the Southern Oceantoday.
ReferencesAbram, N. J., R. Mulvaney, F. Vimeux, S. J. Phipps, J. Turner, and M. H. England (2014), Evolution of the Southern Annular Mode during the
past millennium, Nat. Clim. Change, 4(7), 564–569.Bamber, J. L., R. E. M. Riva, B. L. A. Vermeersen, and A. M. LeBrocq (2009), Reassessment of the potential sea-level rise from a collapse of
the West Antarctic Ice Sheet, Science, 324(5929), 901–903.Bintanja, R., G. J. van Oldenborgh, S. S. Drijfhout, B. Wouters, and C. A. Katsman (2013), Important role for ocean warming and increased
ice-shelf melt in Antarctic sea-ice expansion, Nat. Geosci., 6(5), 376–379.Boning, C. W., A. Dispert, M. Visbeck, S. R. Rintoul, and F. U. Schwarzkopf (2008), The response of the Antarctic Circumpolar Current to
recent climate change, Nature, 1(12), 864–869.Collins, M., et al. (2013), Long-term climate change: Projections, commitments and irreversibility, in Climate Change 2013: The Physical
Science Basis. Contribution of Working Group I to the Fifth Assessment Report of the Intergovernmental Panel on Climate Change, edited byT. F. Stocker, D. Qin, G.-K. Plattner, M. Tignor, S. K. Allen, J. Boschung, A. Nauels, Y. Xia, V. Bex, and P. M. Midgley , pp. 1029–1136 ,Cambridge Univ. Press, Cambridge, U. K..
Connolley, W. M., and T. J. Bracegirdle (2007), An Antarctic assessment of IPCC AR4 coupled models, Geophys. Res. Lett., 34, L22505,doi:10.1029/2007GL031648.
Cuffey, K. M., and W. S. B. Patterson (2010), The Physics of Glaciers, 4th ed., 683 pp. , Elsevier, Burlington, Mass..de Lavergne, C., J. B. Palter, E. D. Galbraith, R. Bernardello, and I. Marinov (2014), Cessation of deep convection in the open Southern
Ocean under anthropogenic climate change, Nat. Clim. Change, 4(4), 278–282.Deschamps, P., N. Durand, E. Bard, B. Hamelin, G. Camoin, A. Thomas, G. Henderson, J. Okuno, and Y. Yokoyama (2012), Ice-sheet collapse
and sea-level rise at the Bø lling warming 14,600 years ago, Nature, 483, 559–564.Dutton, A., and K. Lambeck (2012), Ice volume and sea level during the last interglacial, Science, 337(6091), 216–219.Dutton, A., A. E. Carlson, A. J. Long, G. A. Milne, P. U. Clark, R. DeConto, B. P. Horton, S. Rahmstorf, and M. E. Raymo (2015), Sea-level rise
due to polar ice-sheet mass loss during past warm periods, Science, 349(6244), aaa4019.Fogwill, C. J., C. S. M. Turney, K. J. Meissner, N. R. Golledge, P. Spence, J. L. Roberts, M. H. England, R. T. Jones, and L. Carter (2014), Testing
the sensitivity of the East Antarctic Ice Sheet to Southern Ocean dynamics: Past changes and future implications, J. Quat. Sci., 29(1),91–98.
Fox, D. (2010), Could East Antarctica be headed for a big melt, Science, 328, 1630–1631.Golledge, N. R., C. J. Fogwill, A. N. Mackintosh, and K. M. Buckley (2012), Dynamics of the Last Glacial Maximum Antarctic ice-sheet and its
response to ocean forcing, Proc. Natl. Acad. Sci. U. S. A., 109, 16052–16056.Golledge, N. R., D. E. Kowalewski, T. R. Naish, R. H. Levy, C. J. Fogwill, and E. G. W. Gasson (2015), The multi-millennial Antarctic
commitment to future sea-level rise, Nature, 526, 421–425.Golledge, N. R., L. Menviel, L. Carter, C. J. Fogwill, M. H. England, G. Cortese, and R. H. Levy (2014), Antarctic contribution to meltwater
pulse 1A from reduced Southern Ocean overturning, Nat. Commun., 5, 5107.Hellmer, H. H., F. Kauker, R. Timmermann, J. Determann, and J. Rae (2012), Twenty-first-century warming of a large Antarctic ice-shelf
cavity by a redirected coastal current, Nature, 485(7397), 225–228.Holden, P. B., N. R. Edwards, E. W. Wolff, N. J. Lang, J. S. Singarayer, P. J. Valdes, and T. F. Stocker (2010), Interhemispheric coupling, the West
Antarctic Ice Sheet and warm Antarctic interglacials, Clim. Past, 6(4), 431–443.Jacobs, S. S., C. F. Giulivi, and P. A. Mele (2002), Freshening of the Ross Sea during the late 20th century, Nature, 297, 386–389.Joughin, I., and R. B. Alley (2011), Stability of the West Antarctic Ice Sheet in a warming world, Nat. Geosci., 4(8), 506–513.Joughin, I., B. E. Smith, and B. Medley (2014), Marine ice sheet collapse potentially under way for the Thwaites Glacier Basin, West
Antarctica, Science, 344(6185), 735–738.Kopp, R. E., F. J. Simons, J. X. Mitrovica, A. C. Maloof, and M. Oppenheimer (2009), Probabilistic assessment of sea level during the last
interglacial stage, Nature, 462, 863–867.Lenton, T. M., H. Held, E. Kriegler, J. W. Hall, W. Lucht, S. Rahmstorf, and H. J. Schellnhuber (2008), Tipping elements in the Earth’s climate
system, Proc. Natl. Acad. Sci. U. S. A., 105(6), 1786–1793.McGregor, H. V., M. J. Fischer, M. K. Gagan, D. Fink, S. J. Phipps, H. Wong, and C. D. Woodroffe (2013), A weak El Nino/Southern Oscillation
with delayed seasonal growth around 4,300 years ago, Nat. Geosci., 6(11), 949–953.Mengel, M., and A. Levermann (2014), Ice plug prevents irreversible discharge from East Antarctica, Nat. Clim. Change, 4(6), 451–455.Menviel, L., A. Timmermann, O. E. Timm, and A. Mouchet (2010), Climate and biogeochemical response to a rapid melting of the West
Antarctic Ice Sheet during interglacials and implications for future climate, Paleoceanography, 25(4), PA4231,doi:10.1029/2009PA001892.
Miles, B. W. J., C. R. Stokes, A. Vieli, and N. J. Cox (2013), Rapid, climate-driven changes in outlet glaciers on the Pacific coast of EastAntarctica, Nature, 500(7464), 563–566.
AcknowledgmentsThis work was supported by the Aus-tralian Research Council (FT120100004,FL100100195, and FT100100443). Thisresearch includes computations usingthe Linux computational cluster Katanasupported by the Faculty of Science,UNSW Australia. The simulationsexplored here are on the UNSW DataArchive.
FOGWILL ET AL. ANTARCTIC MELTWATER OCEAN SENSITIVITY 328

Earth’s Future 10.1002/2015EF000306
Morrison, A. K., M. H. England, and A. M. Hogg (2015), Response of Southern Ocean convection and abyssal overturning to surfacebuoyancy perturbations, J. Clim., 28(10), 4263–4278.
Orsi, A. H., G. C. Johnston, and J. L. Biullister (1999), Circulation, mixing, and production of Antarctic Bottom Water, Prog. Oceanogr., 43,55–109.
Phipps, S. J., L. D. Rotstayn, H. B. Gordon, J. L. Roberts, A. C. Hirst, and W. F. Budd (2011), The CSIRO Mk3L climate system model version1.0—Part 1: Description and evaluation, Geosci. Model Dev., 4, 483–509.
Phipps, S. J., L. D. Rotstayn, H. B. Gordon, J. L. Roberts, A. C. Hirst, and W. F. Budd (2012), The CSIRO Mk3L climate system model version1.0—Part 2: Response to external forcings, Geosci. Model Dev., 5, 649–682.
Phipps, S. J., H. V. McGregor, J. Gergis, A. J. E. Gallant, R. Neukom, S. Stevenson, D. Ackerley, J. R. Brown, M. J. Fischer, and T. D. van Ommen(2013), Paleoclimate data-model comparison and the role of climate forcings over the past 1500 years, J. Clim., 26, 6915–6936.
Pritchard, H. D., S. R. M. Ligtenberg, H. A. Fricker, D. G. Vaughan, M. R. van den Broeke, and L. Padman (2012), Antarctic ice-sheet lossdriven by basal melting of ice shelves, Nature, 484(7395), 502–505.
Purkey, S. G., and G. C. Johnson (2013), Antarctic bottom water warming and freshening: Contributions to sea level rise, ocean freshwaterbudgets, and global heat gain*, J. Clim., 26(16), 6105–6122.
Rhein, M., et al. (2013), Observations: Ocean, in Climate Change 2013: The Physical Science Basis. Contribution of Working Group I to the FifthAssessment Report of the Intergovernmental Panel on Climate Change, edited by T. F. Stocker, D. Qin, G.-K. Plattner, M. Tignor, S. K. Allen,J. Boschung, A. Nauels, Y. Xia, V. Bex, and P. M. Midgley, pp. 255–316, Cambridge Univ. Press, Cambridge, U. K.
Rignot, E., J. Mouginot, M. Morlighem, H. Seroussi, and B. Scheuchl (2014), Widespread, rapid grounding line retreat of Pine Island,Thwaites, Smith and Kohler glaciers, West Antarctica from 1992 to 2011, Geophys. Res. Lett., 41(10), 3502–3509,doi:10.1002/2014GL060140.
Rye, C. D., A. C. Naveira Garabato, P. R. Holland, M. P. Meredith, A. J. George Nurser, C. W. Hughes, A. C. Coward, and D. J. Webb (2014),Rapid sea-level rise along the Antarctic margins in response to increased glacial discharge, Nat. Geosci., 7(10), 732–735.
Schmidtko, S., K. J. Heywood, A. F. Thompson, and S. Aoki (2014), Multidecadal warming of Antarctic waters, Science, 346(6214),1227–1231.
Schoof, C. (2007), Ice sheet grounding line dynamics: Steady states, stability, and hysteresis, J. Geophys. Res., 112, F03S28,doi:10.1029/2006JF000664.
Shepherd, A., D. Wingham, and E. Rignot (2004), Warm ocean is eroding West Antarctic Ice Sheet, Geophys. Res. Lett., 31(23), L23402,doi:10.1029/2004GL021106.
Spence, P., J. C. Fyfe, A. Montenegro, and A. J. Weaver (2009), Southern Ocean response to strengthening winds in an eddy-permittingglobal climate model, J. Clim., 23, 5332–5343.
Spence, P., S. Griffies, M. England, A. Hogg, O. Saenko, and N. Jourdain (2014), Rapid subsurface warming and circulation changes ofAntarctic coastal waters by poleward shifting winds, Geophys. Res. Lett., 41(13), 4601–4610, doi:10.1002/2014GL060613.
Stocker, T. F., et al. (2013), Technical summary, in Climate Change 2013: The Physical Science Basis. Contribution of Working Group I to theFifth Assessment Report of the Intergovernmental Panel on Climate Change, edited by T. F. Stocker, D. Qin, G.-K. Plattner, M. Tignor, S. K.Allen, J. Boschung, A. Nauels, Y. Xia, V. Bex, and P. M. Midgley, pp. 33–115, Cambridge Univ. Press, Cambridge, U. K.
Swingedouw, D., T. Fichefet, P. Huybrechts, H. Goosse, E. Driesschaert, and M. F. Loutre (2008), Antarctic ice-sheet melting providesnegative feedbacks on future climate warming, Geophys. Res. Lett., 35(17), L17705, doi:10.1029/2008GL034410.
van Wijk, E. M., and S. R. Rintoul (2014), Freshening drives contraction of Antarctic Bottom Water in the Australian Antarctic Basin,Geophys. Res. Lett., 41(5), 1657–1664, doi:10.1002/2013GL058921.
Vaughan, D. G., et al. (2013), Observations: Cryosphere, in Climate Change 2013: The Physical Science Basis. Contribution of Working Group Ito the Fifth Assessment Report of the Intergovernmental Panel on Climate Change, edited by T. F. Stocker, D. Qin, G.-K. Plattner, M. Tignor,S. K. Allen, J. Boschung, A. Nauels, Y. Xia, V. Bex, and P. M. Midgley, pp. 317–382, Cambridge Univ. Press, Cambridge, U. K.
Weaver, A. J., O. A. Saenko, P. U. Clark, and J. X. Mitrovica (2003), Meltwater Pulse 1A from Antarctica as a Trigger of the Bølling-AllerødWarm Interval, Science, 299(5613), 1709–1713.
Weber, M. E., et al. (2014), Millennial-scale variability in Antarctic ice-sheet discharge during the last deglaciation, Nature, 510(7503),134–138.
FOGWILL ET AL. ANTARCTIC MELTWATER OCEAN SENSITIVITY 329