Embed Size (px)
Citation preview

General rights Copyright and moral rights for the publications made accessible in the public portal are retained by the authors and/or other copyright owners and it is a condition of accessing publications that users recognise and abide by the legal requirements associated with these rights.
• Users may download and print one copy of any publication from the public portal for the purpose of private study or research. • You may not further distribute the material or use it for any profit-making activity or commercial gain • You may freely distribute the URL identifying the publication in the public portal
If you believe that this document breaches copyright please contact us providing details, and we will remove access to the work immediately and investigate your claim.
Downloaded from orbit.dtu.dk on: Jul 14, 2018
Sensitivity and Dynamic Range Considerations for Homodyne Detection Systems
Jaggard, Dwight L.; King, Ray J
Published in:I E E E Transactions on Instrumentation and Measurement
Link to article, DOI:10.1109/TIM.1973.4314183
Publication date:1973
Document VersionPublisher's PDF, also known as Version of record
Link back to DTU Orbit
Citation (APA):Jaggard, D. L., & King, R. J. (1973). Sensitivity and Dynamic Range Considerations for Homodyne DetectionSystems. I E E E Transactions on Instrumentation and Measurement, 22(4), 331-338. DOI:10.1109/TIM.1973.4314183
IEEE TRANSACTIONS ON INSTRUMENTATION AND MEASUREMENT, VOL. IM-22, NO. 4, DECEMBER 1973
Sensitivity and Dynamic RangeConsiderations for Homodyne
Detection Systems
DWIGHT L. JAGGARD, STUDENT MEMBER, IEEE, AND RAY J. KING, MEMBER, IEEE
Abstract-The effects of modulation frequency, RF reference power,and external bias upon the sensitivity and dynamic range of microwavehomodyne detection systems was measured for point contact diodesand low l/f noise Schottky and backward diodes. The measurementswere made at 4.89 GHz using a signal to noise ratio of 3 dB and a de-tection system bandwidth of 10 Hz. Maximum sensitivities of -135,-150, and -145 dBm, and dynamic ranges of 92, 110, and 124 dB weremeasured for the point contact, Schottky, and backward diodes atmodulation frequencies of 30, 30, and 3 kHz, respectively. It wasfound that the level of RF reference signal needed to obtain the maxi-mum sensitivity was equal to or somewhat above the point where thediode changes from square law to linear detection. The results aresignificant in that previously reported homodyne sensitivities (notnecessarily maximum) were on the order of -90 to -130 dBm for pointcontact diodes and no data are available for Schottky and backwarddiodes. Significantly improved stability, sensitivity, and dynamicrange can be achieved using these low 1/f noise devices, the correct ex-ternal bias, and the optimum RF reference power.
I. INTRODUCTIONH OMODYNE (synchronous) detection is a process where-
by a modulated signal which is to be detected is mixedwith a CW reference signal of the same frequency in a non-linear device, and the output signal is bandpass filtered. Thedetection process is basically the same as heterodyne detectionexcept that the intermediate frequency (IF) is zero, and thedetected signal generally lies in the audio range. Low-frequency detector noise therefore plays a dominant role andconventional methods of specifying mixer diode character-istics are usually not very useful.Although comparisons of the operational characteristics of
various devices for video and heterodyne detection have ap-peared [1] -[5], little attention has been given to the opera-tional characteristics of these devices when used as homodynedetectors. Notable exceptions are the papers by Brodwin et al.[6], who studied the sensitivity characteristics of point contactdetectors as a function of reference signal amplitude, and by
Manuscript received May 1, 1973; revised August 7, 1973. This workwas supported by the Wisconsin Alumni Research Foundation and theNational Science Foundation under Grant GK-21218. This paper waspresented at the 1973 Electrical and Electronic Measurement and TestInstrument Conference (EEMTIC), Ottawa, Ont., Canada, May 15-17.D. L. Jaggard was with the Department of Electrical Engineering,
University of Wisconsin, Madison, Wis. 53706. He is now with theDivision of Engineering and Applied Science, Steel Laboratory, Cali-fornia Institute of Technology, Pasadena, Calif. 91109.R. J. King is with the Laboratory of Electromagnetic Theory, Techni-
cal University of Denmark, Lyngby, Denmark, on leave from the De-partment of Electrical Engineering, University of Wisconsin, Madison,Wis. 53706.
Mathers [7], Richmond [8], and O'Brien [9] who have giventypical sensitivities which were obtained using either pointcontact diodes or barretters. These early papers gave littleattention to such questions as the behavior of diode I/f or"flicker" noise at low frequencies and the effect of externallyapplied bias when detecting in the homodyne mode. Also,Schottky and backward diodes are two additional very usefullow noise detecting devices, and no evaluation of their homo-dyne detection characteristics has been made. To satisfy thisneed we have attempted to establish criteria for evaluatingthese three different diode types by investigating the quantita-tive effects of externally applied bias, modulation frequency,and reference signal level upon the sensitivity and dynamicrange of homodyne detection systems. These parameters werestudied using a radio frequency of 4.89 GHz. Although theresults depend to some degree upon the radio frequency, theparticular diode, its mount, and associated bias and outputcircuitry, they are generally adequate to show how the sensi-tivity and dynamic range of the homodyne detector can bemaximized.The results show maximum sensitivities Sm on the order of
-135, -150, and -145 dBm and maximum dynamic rangesDm of 92, 110, and 125 dB for the point contact, Schottky,and backward diodes at modulation frequencies of 30, 30, and3 kHz, respectively, using a bandwidth of 10 Hz. The sensi-tivity values for the point contact diode are 5 to 45 dB betterthan previously reported results [6]-[9].
II. THEORYConsider two signals of the same radian frequency X where
Vr = Aeiwt
Vi = b(l + m cos w.mt) ej(Wt+).(1)
(2)
The CW reference signal Vr is of amplitude A, the informationsignal Vi is of amplitude b and is double-sideband with carrier(DSBWC) amplitude modulated with modulation index m.The radian modulation frequency is com (&)m <<«), and Vidiffers in phase from Vr by phase angle 0. Using the phasordiagram shown in Fig. 1, and noting that at low levels the de-tector has a square-law response, the output is proportional toEt(= (Vr + Vj)2. Thus using the law of cosines and retainingonly those terms at com, the detected output is
Vo =KiAbm( +cos ) coscomt (3)
331
IEEE TRANSACTIONS ON INSTRUMENTATION AND MEASUREMENT, DECEMBER 1973
Fig. 1. Phasor diagram showing addition of reference signal A andDSBWC amplitude modulated information signal to yield total signalEt arriving at detector.
where K1 is the low level gain constant. The b/A term in (3)represents the effect of the unsuppressed carrier in the informa-tion signal which is given by the first term in (2), and contrib-utes to both phase [10]-[12] and amplitude measurementerrors [11], [13], [14]. Its presence is most objectionablewhen making phase measurements, wherein is adjusted inone of the channels by using a phase shifter so that (3) isnulled. The phase error can be made negligible small byrequiring b <<A, e.g., for b/A < - 30 dB the phase error isless 1.80. Thus the amount of phase error which can betolerated determines the lower level of A which in turn de-termines the upper bound on the dynamic range of b. In thefollowing we shall assume that b/A <-30 dB, and so the firstterm in (3) can be ignored. Alternatively, by using a balancedmodulator and/or mixer, a multiplying suppression factor willbe introduced to reduce this error term [11], [12]. Similarerrors using single sideband modulation have also been ana-
lyzed [11].At higher levels of A, the detector characteristic becomes
linear and simply detects the envelope of the total input Et.For b <<A, the output portion ofEt at cm is
VO = Khbm cos 0 cosCm t (4)
where Kh is the high level gain constant. The important dif-ference between (3) and (4) is that the output for linear de-tection is not a function of the reference signal amplitude Awhereas for square-law detection (3) shows that the output isa linear function of A [6], [11]. In either case, the output isdirectly proportional to b cos (assuming b <<A) and can
therefore be used to make phase and amplitude measurementson the information channel signal arriving at the detector.Here we are only concerned with the dynamic range of b andthe ability of the system to measure small values of b, i.e.,sensitivity, and so we shall always set cos = 1.Aside from the errors in phase and amplitude introduced by
not having b <<A, a second type of measurement error can
occur due to unwanted signals, e.g., leakage or reflection of a
portion of the modulated information signal into the referencechannel or vice versa. These errors can be minimized by usingisolators, circulators, well matched magic tees, directionalcouplers, attenuators, and tuners.The effect of the reference channel signal level A, the de-
tector noise and externally applied bias, and the modulationfrequency m are all important in homodyne detection. Ashould be large since a large dynamic range of b is desired, andsince b <<A must hold for error free phase measurements.But very large values can damage the diode, cause large lossesdue to extreme impedance mismatch, or cause the rectifiedsignal current to develop a reverse self-bias through the dc loadresistance. Another disadvantage arises from the increasedlow-frequency noise generated within the detector. Since theoutput becomes independent of A at high levels, a point isreached beyond which further increases in A simply increasethe conversion loss or add noise with a corresponding reduc-tion in the output signal to noise ratio. On the other hand,when A is decreased into the square-law region, the detectedsignal output decreases in direct proportion to A. Since thedetector noise is at its lowest value and essentially constant,the net result is again a reduction in the output signal to noiseratio. An optimum value ofA can therefore be found near orsomewhat above the transition region from square-law to lineardetection which will give the maximum sensitivity Sm. Thispoint will be dependent upon diode type and mount, externalbias and bias circuit impedance, and modulation frequency.Furthermore, it will be necessary to determine the tradeoffswhich can be made to yield the greatest dynamic range in b.Most readers are familiar with the characteristics of point
contact diodes when used as mixers [15], [16] and so themixing characteristics of the Schottky and backward diodeswill be briefly compared with this device. More comprehensivecomparisons are available [1], [31, [4]. First the advantages:because construction of the Schottky and backward diodes doesnot involve a metal whisker-semiconductor junction, they areinherently more stable with temperature and mechanical vi-brations, have a higher burnout rating, and can be operated athigher local oscillator power levels (A for homodyne applica-tions) without significantly increasing the diode noise. Stillanother advantage is that Schottky and backward diodesgenerate significantly lower noise (JO to 30 dB) at low IF (IFis zero for homodyne). The point contact diode has a 1/fnoise power spectrum below the noise corner which lies be-tween 100 kHz and 1 MHz. Above the noise corner the noiseis almost entirely shot and thermal which are constant forfrequencies up to 108 and 1013 Hz, respectively, and in therange the noise from the Schottky and backward diodes iscomparable to the point contact [1], [4], [17]. Moreimportantly for homodyne applications, the Schottky diodealso has a lff noise spectrum but has a considerably lowernoise corner which varies from 50 Hz to 30 kHz, while thebackward diode noise generally increases more slowly than l/fas the frequency is reduced, and the noise corner can be aslow as 1 kHz.In the disadvantages column, the Schottky diode requires a
small amount of external bias to conduct at low local oscil-lator power levels (A). Otherwise the Schottky and point
332
EtI
JAGGARD AND KING: HOMODYNE DETECTION SYSTEMS
contact diodes have comparable IF impedances (100 to 500Q2) and in many cases the Schottky can be used as a directreplacement for the point contact. However, special detectordesign considerations are required for the backward diodewhich is usually operated with zero bias and a very low im-pedance dc load. Furthermore, the IF impedance is quite low(40 to 100 Q), and so a special IF amplifier is usually needed,e.g., transformer [4] or low impedance transistor amplifier[5].Rough calculations using well-known formulas for receiver
sensitivity give maximum sensitivity values of- 127, -149, and- 153 dBm for the point contact, Schottky, and backwarddiodes, respectively, at a modulation frequency of 1 kHz.These values compare favorably with the experimental results.
III. THE EXPERIMENTFig. 2 shows the C-band (3.95 to 5.85 GHz) microwave
homodyne detection system that was used in the followingexperiments. The CW signal from the 1.5-W klystron wasdivided into the reference and information channels by magictee No. 1 which in conjunction with tuner TI, isolators, andattenuators in each channel, provided a high degree of isolationbetween channels. The reference channel provided a referencesignal Vr of amplitude A, while the information channel pro-vided a DSBWC amplitude modulated (m = 0.6) signal V, ofamplitude b (see (1) and (2)). These signals were combined bymagic tee No. 2, which, in conjunction with tuner T2 pro-vided additional isolation between channels. The variable at-tenuators set the power levels so that b <<A. The positionof the slotted line probe determined the phase angle 0 be-tween Vr and Vi, and was always adjusted so that cos 0 = 1.Since A >> b, Vr synchronously switches the detector diode,giving an output of the form of (3) or (4).The detector mount was coaxial and tunable with a dc re-
turn. It was observed that the optimum tuning of the mountwas not measureably changed for levels of A below or some-what above that which gave maximum sensitivity, and so thetuning was performed for A - 10 dBm and held fixed foreach diode at each external bias setting. The bias circuit hadan internal impedance of 100 k Q2, capable of supplying up to1 mA external bias. The chosen bias current remained con-stant until A exceeded its optimum value by about 5-10 dB.The medium impedance low-noise preamplifier provided a
voltage gain of 100 and had an input resistance of 100 k Q.This preamplifier, model 148L by Ithaco, was used for thepoint contact and Schottky diodes and had a noise figure of4 dB for a source resistance of 200 2 at 30 kHz. The additionof a resistive load in parallel with the preamplifier input onlydegraded the sensitivity and made the diode response more de-pendent upon the level of A. Therefore, no additional ex-ternal shunting load was used for any of the diode types.The low impedance low noise preamplifier which was used
for the backward diode provided a voltage gain of 1000 andhad a dc resistance of 2 Q due to the transformer coupledinput. The preamplifier, model G1 by Ithaco, had a noisefigure of 0.5 dB for a source resistance of 75 Q2 at 300 Hz, andprovided the proper resistive load and near zero bias.A compensated thermister bridge and power meter were
Fig. 2. Microwave homodyne system for testing detection characteris-tics of various diode types.
used to establish the power level of each channel at the detec-tor mount and the precision attenuators were used to vary Afrom +10 to -40 dBm and vary b from -90 to -140 dBm forthe point contact, or from - 110 to -160 dBm for the moresensitive Schottky and backward diodes.The first data taken from the point contact and Schottky
diodes established the minimum detectable signal b which was3 dB above noise as a function of A in the range -40 <A <+10 dB using external bias as the parameter. This gave infor-mation needed to determine the optimum bias. The modula-tion frequency fm was held fixed at 1 kHz, and the bandwidthAf at 10Hz.Next, data were taken to determine the output for fixed
b (= - 70 dBm) versus A using external bias as the parameter,and a fixed modulation frequency of 1 kHz. These resultsestablished the detector square law, transition, and linearresponse regions as a function of A and external bias. Theseregions are defined according to whether the output slope was+1 for the square-law region or zero for the linear region, andthe transition region was where the slope deviated more than1 dB from these values. The results of this second part of theexperiment were used to correlate the center of the transitionregion with AO, the optimum value of A which occurred atthe point of maximum sensitivity as previously suggested inSection II.In the third part of the experiment the minimum detectable
signal b was measured as a function ofA over the range -40 <A < +10 dBm, using the modulation frequency between 100Hz and 30 kHz as a parameter and the optimum bias foundfrom the first data. This established the maximum sensitivitySm and maximum dynamic range of b, Dm, as functions ofAand modulation frequency fin.In all of these experiments, errors due to attenuator settings
and unsteady meter readings were of the order of ±0.25 dBforA and ±1.0 dB for b.
IV. EXPERIMENTAL RESULTSTwo new notations will be useful in this and the following
sections. For a given modulation frequency and external bias,Ad refers to the value of A where the maximum dynamicrange Dm occurs, while ATR denotes the approximate centerof the transition region.
333
IEEE TRANSACTIONS ON INSTRUMENTATION AND MEASUREMENT, DECEMBER 1973
-5 u +5 +1U
_9
z
o -105m
EX) -I
-1
( -120
j -130
2-3
-i
-135
2
Fig. 3. Minimum detectable signal versus A with external bias as param-eter for point contact diode.
-40 -35 -30 -25 -20 -15 -10 -5
A (dBm)REFERENCE POWER
0 +5 +10
Fig. 4. Relative output of point contact diode versus A with externalbias as parameter and fixed information signal input (-70 dBm).
A. Point Contact Diode
Figs. 3-5 show the results of the three experimental pro-
cedures outlined previously using the point contact diode. Forfm = 1 kHz, Fig. 3 shows the minimum detectable signal as a
function of A with external bias as a parameter. It is apparentthat increasing the external bias increases both the maximumsensitivity and the dynamic range. It was observed that no
improvement in maximum sensitivity could be realized byincreasing the bias above 100 ,A, and so curves for larger biasare not shown.The upswing of the curves in Fig. 3 for A > Ao is largely due
to the onset of reverse self-bias which was caused by the flowof rectified RF current through the 100 k Q internal resistanceof the bias circuit. Of course, increased diode noise also playsa role. Consequently, if measures are taken to eliminate or
compensate the reverse self-bias, these curves would display a
somewhat broader minimum which would extend to highervalues of A. This broadening would probably not improvethe observed maximum sensitivity, but would increase themaximum dynamic range since A could then be set somewhatabove the optimum Ao as measured from Fig. 3.
40 - 35 - 30 -25 - 20 -15 -10A (dBmI
-5 0 +5 +10
REFERENCE POWER
Fig. 5. Minimum detectable signal for point contact diode versus Awith fixed external bias and modulation frequency fm as parameter.
TABLE IMAXIMUM SENSITIVITY AND DYNAMIC RANGE AS FUNCTION OF
MODULATION FREQUENCY FOR 1N23E CONTACT DIODE
f Maximum A Maximum Dynamic Am Sensitivity O Range d
(Hz) Sm(dBm) (dBm) Dm(d) (dBm)
100 -113 -17 67 -14300 -119 -16 74 -14
1 k -123 -16 79 -143 k -127 -16 82 -13
10 k -132 -16 88 -1230 k -135 -16 92 -11
Unfortunately, this reverse self-bias effect was not noticeduntil shortly before the final paper was due for printing, andso it was not possible to repeat the experiments to observethe increased dynamic range which could be achieved. How-ever, additional data are planned for a future note.
Fig. 4 shows the output of the diode as the level of A isvaried again using external bias as a parameter. For the100-,uA curve, the detector is square-law for A <-22 dBm,in the transition region for - 22 dBm <A < - I dBm andlinear for -11 dBm <A < +1 dBm. Note the broad transitionregion between the square-law and linear detection regions,especially for small bias. For A <0 dBm the reverse self-biasis not important here since the signal b (= -70 dBm) is wellabove the noise level. However, its effect is quite pronouncedfor A >0 dBm where the sharp drop-off in detected output isobserved.For homodyne systems, operation is normally in the region
where the curves in Fig. 4 begin to merge. Consequently, biasshould be chosen on the basis of maximum sensitivity and notmaximum output. According to Fig. 3, the optimum bias forthe point contact diode was therefore taken as 100 ,uA inFig. 5 which shows the minimum detectable signal as a func-tion of A using fm as the parameter. Table I summarizes theresuilts shown in Fig. 5.In Table I, Ad has been taken at the point where the slope
POINT CONTACT DIODE IN 23 Ef . 4.89 GHzf- .t kHzAf IOHz
0 0
Ronge of values<fl ~ ~~~~0°Zs for all externol
o bioses 5-lOO LA0
88o 0
0 o
vsi -95E
-i< -100z-
U -10
1-°>0
m_lI 1511
z -1202
-4u -35 -30 -2 -U -l: -IV
A (dBm)REFERENCE POWER
POINT CONTACT DIODE IN23E 0f * 4.89GHz o +
Af- IOHz 0
o External bios IOOIA0 ~~ ~~~~~~~~00o nO
o O0~ ~ ~ ~ ~ ~ 00 0 +
o °
+ °0 oD o0 o ++0 00
+++
O++ a
0 on0 0
+ + 0 +
0
- + +
0+ ++ 0
0 0 0°
0 00
I~~ ~~~ +.
0
m~-IC-
co(L -IC0
w -20
4-j
POINT CONTACT DIODE IN23Ef1 4.89 GHzfm. 1kHzAf- IOHzbm-7OdBm Q 8 E
ID
External bioses "x0-100 uA
o 8 o 0o a o
0 00 o0
_0A
00
I 12. -12^ ftfit %^ At 1- . . . I .,
.~~~~~~~~~~~~~~~~~~~~~~~~~~~~~~~~~~~~~~~~~~~~~~~~~~~~~~~~~~~~~~~~~~~~~~~~~~~~~~~~~~~~~
334
)F
--i
JAGGARD AND KING: HOMODYNE DETECTION SYSTEMS
begins to be greater than +1 and is therefore always somewhatgreater than A0. This is the point where any further increasein A tends to reduce the minimum detectable signal (determin-ing the low end of the dynamic range) at a rate which isgreater than the increase at the upper end of the dynamicrange, less 30 dB to assure that b «<A as discussed in SectionII. Symbolically,
Dm =Sd+Ad- 30dB
where Sd is the magnitude of the sensitivity at A = Ad. As inthe case of Fig. 3, Ad would be increased if reverse self-biasdoes not occur, giving a corresponding increase in Din.The noise corner is reached above fm = 30 kHz since the
curves of Fig. 5 are approximately equally spaced as themodulation frequency increases from 100 Hz to 30 kHz.(30 kHz was the largest modulation used since the frequencyrange of the wave analyzer was limited.) Theoretically, if only1/f noise is involved, the curves of Fig. 5 should be spaced4.8 dB apart for frequency multiples of 3, and spaced 5.2 dBapart for frequency multiples of 3.33. The slope of the curvesin Fig. 5 for A <Ao is approximately - 1, which would be ex-pected if the only effect of increasing A is to linearly increasethe output [see (3)] without significantly increasing noise.The slope for A » A0 is greater than +1, which is largelydue to the reverse self-bias effect already noted. Finally, Aoappears very close to the center of the transition region ATRas expected from the earlier discussion in Section II.
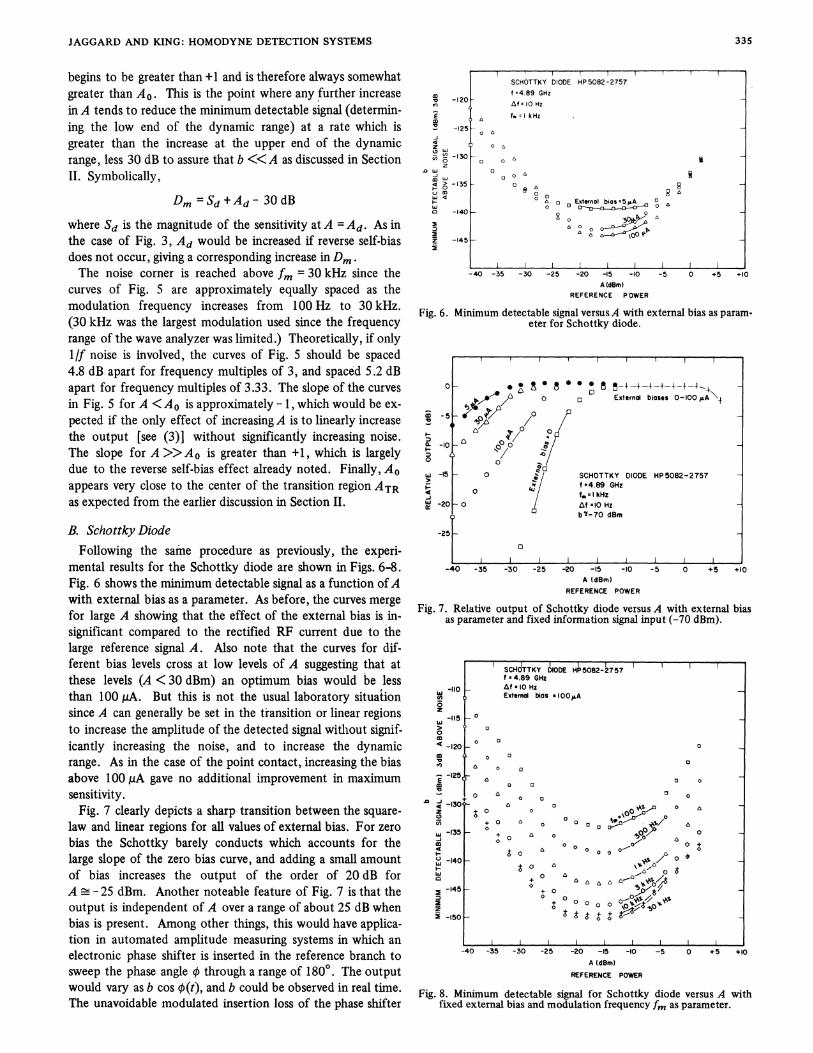
B. Schottky DiodeFollowing the same procedure as previously, the experi-
mental results for the Schottky diode are shown in Figs. 6-8.Fig. 6 shows the minimum detectable signal as a function of Awith external bias as a parameter. As before, the curves mergefor large A showing that the effect of the external bias is in-significant compared to the rectified RF current due to thelarge reference signal A. Also note that the curves for dif-ferent bias levels cross at low levels of A suggesting that atthese levels (A <30 dBm) an optimum bias would be lessthan 100,uiA. But this is not the usual laboratory situationsince A can generally be set in the transition or linear regionsto increase the amplitude of the detected signal withlout signif-icantly increasing the noise, and to increase the dynamicrange. As in the case of the point contact, increasing the biasabove 100 piA gave no additional improvement in maximumsensitivity.
Fig. 7 clearly depicts a sharp transition between the square-law and linear regions for all values of external bias. For zerobias the Schottky barely conducts which accounts for thelarge slope of the zero bias curve, and adding a small amountof bias increases the output of the order of 20 dB forA -25 dBm. Another noteable feature of Fig. 7 is that theoutput is independent of A over a range of about 25 dB whenbias is present. Among other things, this would have applica-tion in automated amplitude measuring systems in which anelectronic phase shifter is inserted in the reference branch tosweep the phase angle q5 through a range of 1800. The outputwould vary as b cos ¢(4t), and b could be observed in real time.The unavoidable modulated insertion loss of the phase shifter
X -I 25
0LJ-130
2u
42 > -135
a -140
z -145
-40 -35 -30 -25 -20 -15 -10A (dBm)l
REFERENICE POWER
-5 0 +5 +10
Fig. 6. Minimum detectable signal versus A with external bias as param-eter for Schottky diode.
o v -+-I-+-+-+--4-4t14y g o a0 Esternd biaises 0-IOO00 +
6O . 0 -8 H
gX-20-O f siO Hz0
-40 -35 -30 -25 -20 -15 -10 -5 0 +5 +10
A (dBNml
REFERENCE POWER
Fig. 7. Relative output of Schottky diode versus A with external bias
as parameter and fixed information signal input (-70 dBm).
(I,0l -§*
a2
< -120
E -125,m
= 130
w -135
1
~'-140
-145
SClHdTTKY I§IODE HP5082-2757 1 1f's4.89 GHz
_t 10 HzExternal bias * I00^A
o 0
0 0 ~~~~~~~~~~~~~~o0o
o o 0 0
+0 a o aoo o 6/
°b
0 ooH
-I-I5 -10 -5 0 +5
(dBml
RENCE POWERt
+10-40 -35 -30 -25 -20
Fig. 8. Minimum detectable signal for Schottky diode versus A with
fixed external bias and modulation frequency fm as parameter.
335
lISCHOTTKY DIODE HP 5082-2757f =4.89 GHziSf' 10 Hz
0 f.'I kHz
00a
00a
0 ~ oI bs Az 0 8 0
I.
°b!-70 dBm
0
v

IEEE TRANSACTIONS ON INSTRUMENTATION AND MEASUREMENT, DECEMBER 1973
TABLE IIMAXIMUM SENSITIVITY AND DYNAMIC RANGE AS FUNCTION OFMODULATION FREQUENCY FOR HP5082-2757 SCHOTTKY DIODE
f Maximum A Maximum Dynamic Am Sensitivity o Range d
(Hz) S (dBm) (dBm) Dm(dB) (dWm)
100 -134 -14 96 -6
300 -138 -14 98 -6 to 0
1 k -144 -16 106 -6 to -2
3 k -148 -16 108 -6 to -2
10 k -149 -14 to -18 109 -8 to +2
30 k -150 -14 to -18 110 -8 to +2
would then contribute insignificant error to the output signalamplitude. Finally, the sharp drop-off for A > 3 dBm is dueto the onset of severe reverse self-bias which also occurred forthe point contact as shown in Fig. 4.Using 100 ,uA bias, Fig. 8 displays the behavior of the maxi-
mum sensitivity and dynamic range as a function of A andthe modulation frequency, and Table II summarizes theseresults.Note that the noise corner of the Schottky diode is ap-
proached near 10 kHz as evidenced by the bunching of thecurves at the higher frequencies. For frequencies below 3 kHzthe curves are spread approximately 4.8 or 5.2 dB dependingupon the frequency change, which is as expected from the in-fluence of the /If noise. For A < Ao, the slope is steeper than- 1 which suggests that the conversion loss increases at lowlevels of A. At the higher levels, the slope is +1 near A = 0dBm, which when compared with Fig. 5 for the point contact,indicates that the upper limit of the dynamic range for theSchottky is about 10 dB greater. In general, comparingTables I and II, the sensitivity of the Schottky is 15 to 20 dBbetter than the point contact and the useable dynamic range isincreased 20 to 30 dB.
C. Backward Diode
Backward diodes normally operate with zero bias and a very
low dc load, and so the only results graphically displayed hereare those showing the minimum detectable signal versus Awith fm as a parameter (Fig. 9). The low source resistance ofthe backward diode required a special transformer inputcoupled preamplifier which only performed well for fm < 3kHz, but this was sufficiently high so that a good indicationof the system performance could be established. Since the dcimpedance of the transformer was only 2 2, reverse self-biaswas no problem.When the relative output was measured versus A (not shown),
it was found that the device is square law for A < - 6 dBm, andlinear for A> -2 dBm, with ATR -4 dBm. Furthermore,
the relative output was constant for - 2 <A < +10 dBm. Theexperiment was not continued for still larger A because of thedanger of burning the diode out. These facts suggest that thisdiode has a very large dynamic range. Indeed, this can beseen by inspecting Fig. 9 and the summarizing data in TableIII.The most notable features of the data in Fig. 9 are that the
point of maximum sensitivity Ao is much larger than thecorresponding points on Figs. 5 or 8 for the point contact or
Schottky diodes, respectively. Another is that for A <- 15
-105 _ o= Iv Hzw Externol bios -0
z-l1
B
< -1 15 - l--Ronge of values for
co frequencies 100 Hz - 3 k Hz
-120
D J-125
z~~~~~~~~~~~~~~~~~~ i
30
t-135 b0013
00
0 0- kH8-14 0
3 kH~z
-40 -35 -30 -25 -20 -15 -10 -5 0 +5 +10A (dBm)
REFERENCE POWER
Fig. 9. Minimum detectable signal for backward diode versus A withmodulation frequency fm as parameter.
TABLE IIIMAXIMUM SENSITIVITY AND DYNAMIC RANGE AS FUNCTION OF
MODULATION FREQUENCY FOR L4154 BACKWARD DIODE
dBm there is little spread in the curves as would normally beexpected from 1/f noise. For A > - 15 dBm, the spread isquite nonuniform which suggests that the noise behaves as
I/lf where n > 1. The bunching of the 1-kHz and 3-kHzcurves for large A could be due to an approaching noise corner
frequency, or perhaps is due to the difference in frequency re-
sponse of the transformer or different loading effects or a
combination of these. Comparing Fig. 9 and Table III withFig. 8 and Table II shows that the backward diode is capableof providing a dynamic range which is approximately 15 dBgreater than that for the Schottky diode, and maximum sensi-tivities which are approximately equal for the two diodes.A short final experiment confirmed the fact that the point
contact and the Schottky diodes both have a 1/f noise spec-trum and noise corners greater than 30 kHz and approximately8 kHz, respectively. The backward diode, however, has a
1/Ifl noise spectrum, which was also shown by Eng [17],and a noise corner greater than 3 kHz.
V. CONCLUSIONSince these experiments only involved one diode of each
type, generalizations to all other diodes of the same typeshould be made with some caution. However, trends andcertain individual results should be noted.
1) By paying careful attention to the various parameters,optimum sensitivities which greatly exceed previously reportedresults are possible. Table IV compares these previous data to
BACKWARD DIODE L4154f a 4.89 GHzA# :1 u,%Li
f Maximum A Maximum Dynamic Am Sensitivity o Range d
(Hz) S (dBm) (dBm) 0 (dBm) (dBm)_
M
100 -135 -8 to -4 105 + 8
300 -138 -6 to -4 112 +6 to +10
1 k -144 +4 to +6 122 > +10
3 k -145 +2 to +6 2124 > +10
336
JAGGARD AND KING: HOMODYNE DETECTION SYSTEMS
TABLE IVCOMPARISON OF HOMODYNE SYSTEM SENSITIVITIES OBTAINED BY
VARIOUS AUTHORS REFERRED TO 10-Hz BANDWIDTH
Mod. Freq. Sensitivity, S Ref. Signal, ACW f in Hz or or (Opt. Ref.) Exter-
Frequency Detector m & (Max. Sens, S ) Signal, A nalAuthor f Type (Mod. Type) dBm dBm Bias
Point 400 (DSBWC) (-97) (-20) 0Brodwin, 9 GHz Contact 2k (DSBWC) (-107) (-20) 0et al., [6] 24 GHz IN26 Point ? (DSBWC) (-115) (-10) 0
24 GBz Contact
X421APoint lk (SSBSC) (-105) (-15) 0Contact _______ _________ ______ ___
Mathers [7] X-band _
Barretter lk (SSBSC) -100 0 0
IN23 Point 1k (DSBSC) (-89) (-6) 0
Richmond [8] X-band Contact _821 Sperry lk (DSBSC) -91 +10 +5 MABarret ter
O'Brien [91 10 GHz Point (DSBSC) -130 -3 0
IN2 3E
CoIntac 30k (DSBWC) (-135) (-16) 100 PAContact(table 1)
Jaggard& ~HP5082-2757Jaggard & 4.89 GHlz Schottky 30k (DSBWC) (-150) (-18) to (-14) 100 pAKing (table 2)
L4154Backward 3k (DSBWC) (-145) (+2) to (+6) 0(table 3) _
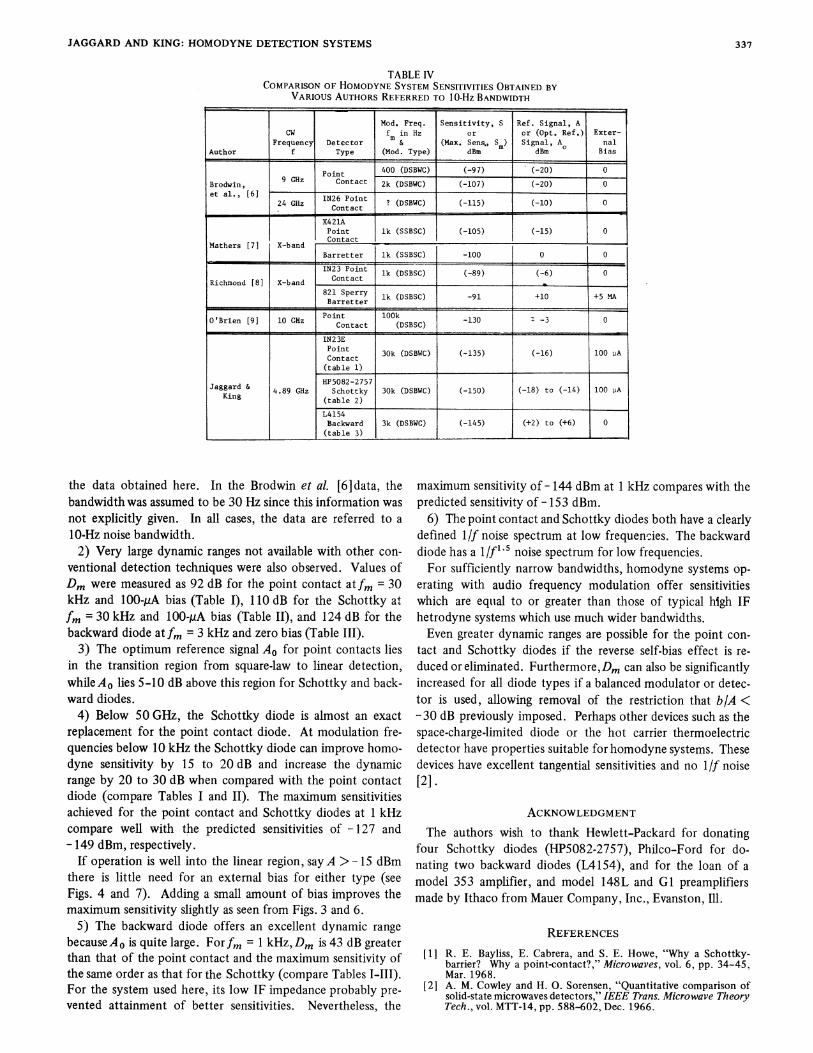
the data obtained here. In the Brodwin et al. [6]data, thebandwidth was assumed to be 30 Hz since this information wasnot explicitly given. In all cases, the data are referred to a10-Hz noise bandwidth.2) Very large dynamic ranges not available with other con-
ventional detection techniques were also observed. Values ofDm were measured as 92 dB for the point contact atfm = 30kHz and 100-,uA bias (Table I), 110 dB for the Schottky atfm = 30 kHz and 100-,uA bias (Table II), and 124 dB for thebackward diode at fm = 3 kHz and zero bias (Table III).
3) The optimum reference signal Ao for point contacts liesin the transition region from square-law to linear detection,whileA0 lies 5-10 dB above this region for Schottky and back-ward diodes.4) Below 50 GHz, the Schottky diode is almost an exact
replacement for the point contact diode. At modulation fre-quencies below 10 kHz the Schottky diode can improve homo-dyne sensitivity by 15 to 20 dB and increase the dynamicrange by 20 to 30 dB when compared with the point contactdiode (compare Tables I and II). The maximum sensitivitiesachieved for the point contact and Schottky diodes at 1 kHzcompare well with the predicted sensitivities of - 127 and-149 dBm, respectively.
If operation is well into the linear region, say A > - 15 dBmthere is little need for an external bias for either type (seeFigs. 4 and 7). Adding a small amount of bias improves themaximum sensitivity slightly as seen from Figs. 3 and 6.
5) The backward diode offers an excellent dynamic rangebecauseA0 is quite large. Forfm = 1 kHz, Dm is 43 dB greaterthan that of the point contact and the maximum sensitivity ofthe same order as that for the Schottky (compare Tables I-Ill).For the system used here, its low IF impedance probably pre-vented attainment of better sensitivities. Nevertheless, the
maximum sensitivity of - 144 dBm at 1 kHz compares with thepredicted sensitivity of - 153 dBm.6) The point contact and Schottky diodes both have a clearly
defined 1/f noise spectrum at low frequenclies. The backwarddiode has a I/fI noise spectrum for low frequencies.For sufficiently narrow bandwidths, homodyne systems op-
erating with audio frequency modulation offer sensitivitieswhich are equial to or greater than those of typical high IFhetrodyne systems which use much wider bandwidths.Even greater dynamic ranges are possible for the point con-
tact and Schottky diodes if the reverse self-bias effect is re-duced or eliminated. Furthermore,Dm can also be signifi1cantlyincreased for all diode types if a balanced modulator or detec-tor is used, allowing removal of the restriction that b/A <- 30 dB previously imposed. Perhaps other devices such as thespace-charge-limited diode or the hot carrier thermoelectricdetector have properties suitable for homodyne systems. Thesedevices have excellent tangential sensitivities and no 1/f noise[2].
ACKNOWLEDGMENTThe authors wish to thank Hewlett-Packard for donating
four Schottky diodes (HP5082-2757), Philco-Ford for do-nating two backward diodes (L4154), and for the loan of amodel 353 amplifier, and model 148L and GI preamplifiersmade by Ithaco from Mauer Company, Inc., Evanston, I11.
REFERENCES[1] R. E. Bayliss, E. Cabrera, and S. E. Howe, "Why a Schottky-
barrier? Why a point-contact?," Microwaves, vol. 6, pp. 34-45,Mar. 1968.
[2] A. M. Cowley and H. 0. Sorensen, "Quantitative comparison ofsolid-state microwaves detectors," IEEE Trans. Microwave TheoryTech., vol. MTT-14, pp. 588-602, Dec. 1966.
337
IEEE TRANSACTIONS ON INSTRUMENTATION AND MEASUREMENT, VOL. IM-22, NO. 4, DECEMBER 1973
[3] B. S. Siegal, "Schottky diodes-where we stand today," Micro-waves, vol. 10, pp. 44-46, Apr. 1971.
[4] R. 0. Wright, "The backward diode-when and how to use it,"Microwaves, vol. 3, pp. 22-27, Dec. 1964.
[5] -, "New twist for backward diode help from low-noise ampli-fier," Electronics, vol. 39, pp. 74-77, July 11, 1966.
[6] M. E. Brodwin, C. M. Johnson, and W. M. Waters, "Low levelsynchronous mixing," in IRE Nat. Conv. Rec., vol. 1, pt. 10, pp.52-57, Mar. 1953.
[7] G. W. C. Mathers, "Homodyne generator and detection system,"in IRE Wescon Conv. Rec., vol. 1, pt. 1, pp. 194-200, 1957.
[8] J. H. Richmond, "Measurement of time-quadrature componentsof microwave signals," IRE Trans. Microwave Theory Tech., vol.MTT-3, pp. 13-15, Apr. 1955.
[9] B. B. O'Brien, "A pseudo-superheterodyne receiver for measuringphase and amplitude," IEEE Trans. Instrum. Meas., vol. IM-16,pp. 124-128, June 1967.
[10] G. E. Schafer, "A modulated subcarrier technique of measuringmicrowave phase shifts," IRE Trans. Instrum., vol. 1-9, pp. 217-219, Sept. 1960.-
[11] R. J. King, "Real time measurement of microwave parameters
and EM fields," IEEE Trans. Instrum. Meas., vol. IM-21, pp. 2-10,Feb. 1972.
[12] B. A. Howarth and T. J. F. Pavlasek, "Analysis of automatichomodyne method amplitude and phase measurements," IEEETrans. Microwave Theory Tech., vol. MTT-20, pp. 623-626, Sept.1972.
[13] G. E. Schafer and R. R. Bowman, "A modulated sub-carriertechnique of measuring microwave attenuation," Proc. Inst. Elec.Eng., vol. 109B (23), pp. 783-786, May 1962.
[14] W. E. Little, "Further analysis of the modulated subcarrier tech-nique of attenuation measurement," IEEE Trans. Instrum. Meas.,vol. IM-13, pp. 71-76, June-Sept. 1964.
[15] H. C. Torrey and C. A. Whitmer, Crystal Rectifiers. New York:McGraw-Hill, 1948.
[16] G. C. Messenger and C. T. McCoy, "Theory and operation ofcrystal diodes as mixers," Proc. IRE, vol. 45, pp. 1269-1283,Sept. 1957.
[17] S. T. Eng, "Low-noise properties of microwave backward diodes,"IRE Trans. Microwave Theory Tech., vol. MTT-9, pp. 419-425,1961.
Automatic Test System for an Analog
ComputerJ. FRANK ROSS, DOUGLAS G. PINCOCK, MEMBER, IEEE, ROBERT J. KAVANAGH, AND DAVID M. WANAMAKER
Abstract-This paper describes the design, construction, and per-formance of an automatic test system for the analog portion of ahybrid computation system. The system, which is capable ofcarrying out complete dynamic testing of each analog component,uses the digital portion of the hybrid system to provide the desiredcontrol with the result that the requirement for sophisticated stimula-tion and measurement equipment is minimized. The hardware andsoftware of the system are both modular in nature in order to provideversatility and to facilitate modifications and additions as required. Thedesign philosophy is such that the methods used are not limited to aparticular analog computer. In fact, they have applications in thetesting of many types of electronic equipment.
I. INTRODUCTIONONE OF THE MAIN difficulties in making efficient use
of hybrid computation systems is the fact that failuresin the analog subsystem are relatively frequent. It is, of course,important that such failures be isolated before they introduceerrors into solutions. This can be accomplished to a certainextent through extensive use of static checks by programmers[1], [2]. These checks, however, provide no guarantee that
Manuscript received April 30, 1973; revised July 18, 1973. This workwas supported by the National Research Council of Canada underGrant A5155. This paper was presented at the 1973 Electrical andElectronic Measurement and Test Instrument Conference (EEMTIC),Ottawa, Ont., Canada, May 15-17.
J. F. Ross is with the Defense Research Establishment Valcartier,Defense Research Board, Valcartier, P.Q., Canada.D. G. Pincock, R. J. Kavanagh, and D. M. Wanamaker are with the
Electrical Engineering Department, University of New Brunswick,Fredericton, N.B., Canada.
components are operative in a dynamic sense, i.e., thatintegrators do in fact integrate, that nonlinear function gen-erators work in all quadrants, that the frequency response ofamplifiers is adequate, etc. Therefore, if users are to haveconfidence in a hybrid system, it is essential that frequentpreventative maintenance tests be carried out on all com-ponents. Unfortunately, such tests tend to be very timeconsuming and hence, are carried out relatively infrequently.Due to the presence of a general-purpose digital computer inthe hybrid configuration, it seems natural to investigate theuse of automatic testing as a solution to this problem. Thispaper describes the development of an automatic test systemfor the analog portion of the EAI 590 Hybrid Computationsystem at the University of New Brunswick, Fredericton,N.B., Canada.One of the main considerations in the design of the auto-
matic test system was to minimize costs by using the digitalcomputer as much as possible in place of sophisticatedstimulation and measurement equipment. In addition, bothhardware and software were designed to be modular in naturein order to provide versatility and facilitate modifications andadditions as required.
II. OVERVIEW OF THE TEST SYSTEMStuehler [3] divides any general automatic test system into
the following logical units, as shown in Fig. 1:
1) a unit which is under test (UUT);
338


![Oscillatory Stability and Eigenvalue Sensitivity Analysis ...orbit.dtu.dk/files/5449466/05678830[1].pdf · Oscillatory Stability and Eigenvalue Sensitivity ... in order to facilitate](https://img.pdfslide.us/doc/110x75/5abe3a997f8b9ab02d8c9ba4/oscillatory-stability-and-eigenvalue-sensitivity-analysis-orbitdtudkfiles5449466056788301pdfoscillatory.jpg)


![King’s Gambit rmblkansopopZpop0Z0Z0Z0ZZ0Z0o0Z0studimonetari.org/edg/latex/king.pdf · ECO: C30a [King’s Gambit] Generated by Scid 4.2.2, 2011.02.15rmblkansopopZpop0Z0Z0Z0ZZ0Z0o0Z0](https://img.pdfslide.us/doc/110x75/5aa8d6027f8b9a86188bfc47/kings-gambit-rmblkansopopzpop0z0z0z0zz-c30a-kings-gambit-generated-by-scid.jpg)