Embed Size (px)
Citation preview
Natural Gas TechnologyJuly 2011Carlos Alberto Dorao, EPT
Submission date:Supervisor:
Norwegian University of Science and TechnologyDepartment of Energy and Process Engineering
Sensitivity Analysis of Proposed LNGliquefaction Processes for LNG FPSO
Sultan Seif Pwaga

i
Sensitivity Analysis of the Proposed Liquefaction Processes
for LNG FPSO.
Sultan Pwaga
MSc in Natural Gas Technology
Submission : July 2011
Suprvisor : Dorao, Carlos A.
Research advisor : Luis Castillo and Roy Scott Heiersted
Norwegian University of Science and Technology
Department of Energy and Process Engineering
i
Problem Description
Background and objective
When selecting the right LNG FPSO process, some of the critical parameters are:
different compositions over time, lean-rich gas composition (GCV), nitrogen
content, thermodynamic efficiency etc. Other problems relates to: power and
heat system under extreme conditions regarding high CO2 content and low
feed gas pressure. For the case of LNG FPSO, there are several possible
technologies available, but the best candidates for LNG FPSO based on MRC
are Single Mixed Refrigerant (SMR) and Dual Mixed Refrigerant (DMR) while
based on expander cycle are NICHE and dual nitrogen expander. These
processes were identified in the previous project “Natural gas liquefaction
processes onboard an LNG FPSO” submitted January 2011.
The main object of this project is to carry out a sensitivity analysis of the
proposed liquefaction processes for LNG-FPSO and established a benchmarking
of the processes considering thermodynamics, energy analysis and process
design.
The following questions should be considered in the project work:
1. Developed a detail process model for each of the LNG technologies
2. Investigate the effect of quality of the feed gas composition, ambient
temperature, pressures, train capacity, product specifications, etc.
3. Developed an strategy for selecting a particular technology according to
the particular case scenario
ii
iii
iv
Preface
This thesis has been written as final part of master degree program in Natural
Gas Technology at Norwegian University of Science and Technology (NTNU),
Norway. The thesis involve Höegh LNG and NTNU and was a continuation of
semester project titled as “Natural Gas Liquefaction Process on Board an LNG-
FPSO” submitted January 2011 which proposed the liquefaction processes that
can be considered as good candidate for LNG FPSO. The main focus on thesis
was thermodynamic analysis of the proposed liquefaction processes for LNG-
FPSO and established a benchmarking of the processes considering energy
analysis and process design.
I would like to thank almighty God for his immeasurable blessings and mercy for
wonderful two years of stay in Norway. Second I would like to thank my
supervisor associate professor Dorao, Carlos A. and my Phd supervisor Luis
Castillo for their assistance from time I was doing semester project to the thesis.
Also I would like to thank all individual who in one way or another contributed to
the successively completion of this thesis.
v
Abstract
The four liquefaction processes proposed as a good candidate for LNG FPSO
are simulated and evaluated. These processes include a single mixed refrigerant
(SMR), dual mixed refrigerant (DMR), Niche LNG ( CH4 and N2 process) and dual
nitrogen expander. The steady state hysys simulation of the processes were
undertaken to ensure that each simulated liquefaction process was compared
on the identical parameters. An in-depth optimization has not been conducted
but the simulation was aimed at obtaining an optimal efficient processes based
on the simulated constraints.
This thesis presents the analysis of the effects of natural gas pressure,
temperature and composition on the proposed liquefaction processes for LNG
FPSO. During the simulations the effects were analyzed by examining specific
power, power consumption and refrigerant flow rate of the proposed processes.
To meet the demand of greater efficiency and large capacity for liquefaction
processes, thermodynamic analysis on the liquefaction processes for LNG FPSO
also has been evaluated.
The analysis of specific powers, power consumptions and refrigerant flow rates
on the proposed processes shows that DMR specific power is lower than that of
dual nitrogen expander by 50%, Niche LNG by 41.6% and SMR by 9.6%. The
power consumption of DMR is lower that of dual nitrogen expander by 54%,
Niche LNG by 47.8% and SMR by 9.6%. Also DMR has lowest refrigerant flow rate
than that of dual nitrogen expander by 157.6%, Niche LNG DMR by 96.4% and
SMR by 30.9%
The production capacity of simulated processes shows that DMR has higher
production capacity per train of (0.91MTPA/Train) and dual nitrogen expander
vi
has the lowest which is (0.61MTPA/Train) based on maximum duty of one LM6000
gas turbine. DMR production capacity exceeded that of dual nitrogen
expander by 33%, Niche LNG by 29.7% and SMR by 8.8%.
The analysis of effect of natural gas supply temperature on the proposed
processes shows that the change of natural gas supply temperature has major
effect of SMR process compared to other process. The analysis shows that when
natural gas supply temperature decreases from 15 to 50C SMR specific power
and power consumption decrease by 14.99% and 15.10% respectively and
when it is increases from 15 to 250C its specific power and power consumption
increases by 39.27% and 39.19 respectively.
The analysis of the effect of natural gas supply pressure on the proposed
processes shows that when natural gas supply pressure decrease dual nitrogen
expander has the highest effect with specific power and power consumption
increases by 22.41% and 23.25% respectively and when natural gas supply
pressure increases DMR has highest effect on specific power and power
consumption which are 13.06% and 13.67% respectively.
The effect of natural gas composition on the proposed natural gas liquefaction
processes for LNG FPSO shows that for all proposed processes the change in
natural gas composition may lead to increase or decrease of processes specific
power, power consumptions or refrigerant flow rates.
Energy efficiency is important to LNG production as feed gas is consumed in
order to carry out the liquefaction process .The exergy analysis of the proposed
process shows that shows that DMR process has highest useful exergy about 31%
compared to the other processes. Niche LNG and dual nitrogen expander has
almost same useful exergy.
vii
Contents 1. Introduction ..................................................................................................................................... 1
2. Theory ............................................................................................................................................... 4
2.1 Liquefaction of Natural Gas .................................................................................................. 4
2.1.1 Classification of natural gas liquefaction processes ................................................. 6
2.2.2 Type of LNG Plants ............................................................................................................ 8
2.2 Liquefaction and refrigeration .............................................................................................. 9
2.2.1 The effect of natural gas pressure on liquefaction processes ............................... 10
2.3 Exergy analysis of Natural gas Liquefaction Processes .................................................. 11
2.3.1 Exergy losses in natural gas liquefaction processes ................................................. 14
3. Proposed LNG liquefaction processes for FPSO .................................................................... 15
3.1 Single Mixed Refrigerant Process (SMR-PRICO) ............................................................... 15
3.2 Dual Mixed Refrigerant process (DMR) ............................................................................. 16
3.3 Dual nitrogen expander ....................................................................................................... 17
3.4 Nitrogen and methane Expander (Niche LNG) .............................................................. 18
4. Basis for simulation of proposed liquefaction processes for LNG FPSO ............................ 19
4.1 Assumptions ............................................................................................................................. 19
4.2 Methodology .......................................................................................................................... 21
5. Simulation of Single Mixed Refrigerant Process (SMR- PRICO ............................................. 23
5.1 Detailed description of SMR process ................................................................................. 23
5.2 Simulation Results for Single Mixed Refrigerant (SMR- PRICO) ...................................... 24
5.2.1 The effect of natural gas temperature on SMR PRICO process ............................ 25
5.2.2 The effect on Natural gas pressure on SMR-PRICO ................................................. 31
5.2.3 The effect of natural gas composition on SMR- PRICO .......................................... 37
5.2.4 Exegy analysis for SMR-PRICO ..................................................................................... 40
viii
5.2.5 Product quality and production capacity SMR-PRICO .......................................... 41
5.3 Summary of simulation results of SMR-PRICO ................................................................... 42
6. Simulation of Dual Mixed Refrigerant (DMR) Process .......................................................... 43
6.1 Detailed description of DMR process ................................................................................ 43
6.2 Simulation results for dual mixed refrigerant process (DMR) ......................................... 46
6.2.1 The effect of natural gas temperature on DMR process ........................................ 47
6.2.2 The effect of natural gas pressure on DMR Process ................................................ 53
6.2.3 The effect of natural gas composition DMR Process ............................................... 59
6.2.4 Exergy analysis for DMR process .................................................................................. 62
6.2.5 Product quality and production capacity of DMR .................................................. 63
6.3 Summary of simulation results for DMR Process ............................................................... 64
7. Simulation of Niche LNG process. ........................................................................................... 65
7.1 Process detailed description of Niche LNG Process ....................................................... 65
7.2 Simulation results for Niche LNG Process ........................................................................... 67
7.2.1 The effect of natural gas temperature on Niche LNG Process ............................. 68
7.2.2 The effect of natural gas Pressure on Niche LNG Process ...................................... 72
7.2.3 The effect of natural gas composition on Niche LNG Process .............................. 76
7.2.4 Exergy analysis for Niche LNG Process ....................................................................... 79
7.2.5 Product Quality and Production Capacity of Niche LNG Process ....................... 80
7.3 Summary of simulation results of Niche LNG process ..................................................... 81
8. Simulation of Dual Nitrogen expander Process ..................................................................... 82
8.1 Detailed Description of dual nitrogen expander process ............................................. 82
8.2 Simulation results for Dual Nitrogen expander ................................................................. 84
8.2.1 The effect of natural gas inlet temperature on dual nitrogen expander Process
...................................................................................................................................................... 85
ix
8.2.2 The effect of natural gas pressure on dual nitrogen expander process ............. 89
8.2.3 The effect of natural gas composition on dual nitrogen expander Process...... 93
8.2.4 Exergy analysis ................................................................................................................. 96
8.2.5 Product Quality and Production Capacity of dual nitrogen expander Process
...................................................................................................................................................... 97
8.3 Summary of simulation results of dual nitrogen expander Process ............................. 98
9. Discussion of results ...................................................................................................................... 99
10. Conclusions ............................................................................................................................... 107
11. References ................................................................................................................................ 109
12. Appendices............................................................................................................................... 112
Appendix A: Calculation of Product Quality. ..................................................................... 112
Appendix B: The effect of natural gas supply pressure on SMR process when it is
supplied at a temperature of 150C ........................................................................................ 113
Appendix C: Comparison of Natural gas pressure, temperature and specific power on
(SMR Process) .............................................................................................................................. 113
Appendix D: Comparison of Natural gas pressure, ambient temp and power
Consumption (SMR Process) .................................................................................................... 114
Appendix E: Comparison of natural gas pressure, ambient temp and refrigerant flow
(SMR Process) .............................................................................................................................. 114
Appendix F: The effect of natural gas supply pressure on DMR process when it is
supplied at temperature of 150C ............................................................................................ 115
Appendix G: Comparison of Natural gas pressure, temperature and specific power
on (DMR Process) ....................................................................................................................... 115
Appendix H: Comparison of Natural gas pressure, ambient temp and power
Consumption (DMR Process) ................................................................................................... 116
Appendix I: Comparison of natural gas pressure, ambient temp and refrigerant flow
(DMR Process) ............................................................................................................................. 116
x
Appendix J: The effect of natural gas supply pressure on Niche LNG process when it is
supplied at temperature of 150C ............................................................................................ 117
Appendix K: Comparison of Natural gas pressure, temperature and specific power on
(Niche LNG Process) .................................................................................................................. 117
Appendix L: Comparison of Natural gas pressure, ambient temp and power
Consumption (Niche LNG Process) ........................................................................................ 118
Appendix M: Comparison of natural gas pressure, ambient temp and refrigerant flow
(Niche LNG Process) .................................................................................................................. 118
Appendix N: The effect of natural gas supply pressure on dual nitrogen expander
process when it is supplied at temperature of 150C ........................................................... 119
Appendix O: Comparison of Natural gas pressure, temperature and specific power
on ( dual nitrogen expander Process)......................................................................... 119
Appendix P: Comparison of Natural gas pressure, ambient temp and power
Consumption (dual nitrogen expander) ............................................................................... 120
Appendix R: Comparison of natural gas pressure, ambient temp and refrigerant flow
(dual nitrogen expander) ......................................................................................................... 120
Appendix S: Effect of natural gas composition on proposed liquefaction Processes for
LNG FPSO ..................................................................................................................................... 121
Appendix T: Composite curve for DMR process .................................................................. 122
Appendix U: Composite curve for Niche LNG process ...................................................... 123
Appendix V: Composite curve for dual nitrogen expander process .............................. 124
Appendix W: Composite curve for SMR process ................................................................. 125
xi
List of Figures
Figure 1: Principal block diagram for Liquefied natural gas plant (source [15]) .................. 5
Figure 2: Classification of natural gas liquefaction processes (source [10]) .......................... 6
Figure 3: Flow diagram for single cycle refrigeration system (source [20]) ............................ 9
Figure 4:Temperature entropy diagram of natural gas with area showing heat removed
(Q) and ideal work for reversible liquefaction process (W) (source [20]) ............................ 10
Figure 5: Temperature/entropy diagram showing different losses in refrigeration cycle . 14
Figure 6: Principal flow diagram of SMR PRICO process (Source [20]) ................................. 16
Figure 7: Diagram of dual mixed refrigerant process (Source [16]) ...................................... 17
Figure 8: Diagram of dual nitrogen expander process (source [16]) .................................... 18
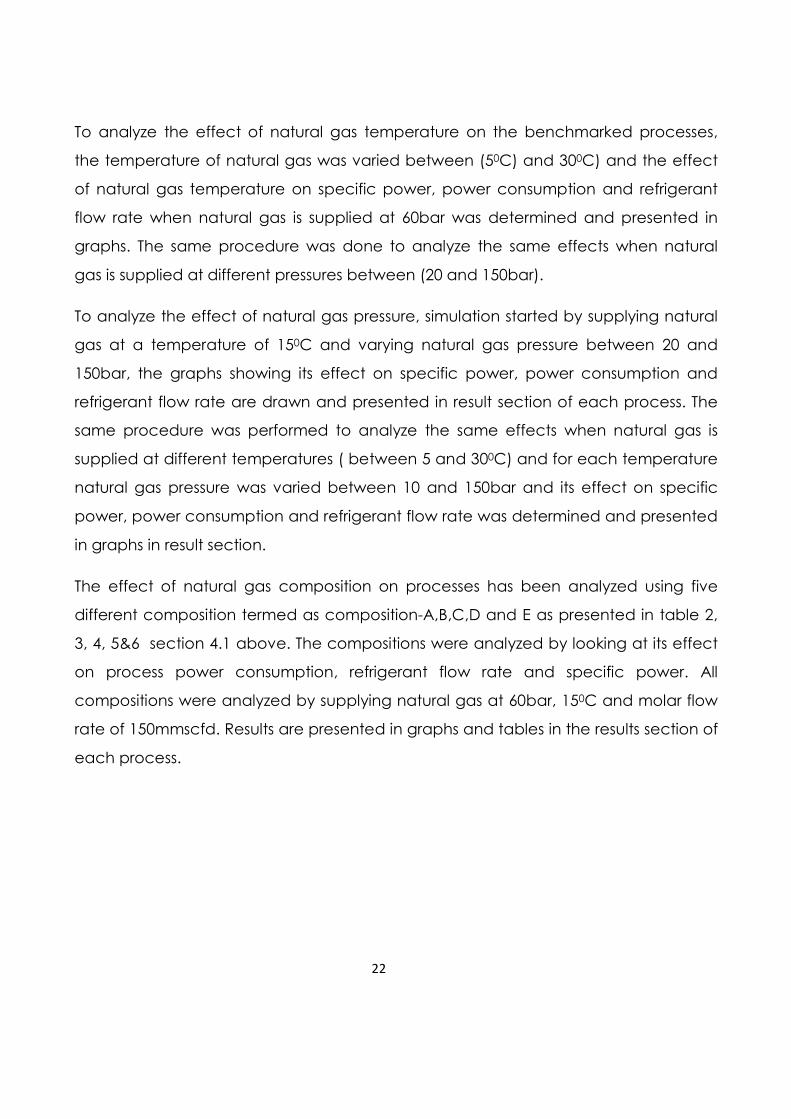
Figure 9: Process Flow Diagram of SMR (PRICO) ....................................................................... 23
Figure 10: The effect of natural gas supply temperature on specific power when natural
gas supplied at 60bar (SMR-PRICO) ............................................................................................. 25
Figure 11: The effect of natural gas supply temperature on specific power when natural
gas supplied at different pressures (SMR-PRICO) ...................................................................... 26
Figure 12: The effect of natural gas supply temperature on power consumption when
natura gas supplied at 60ba (SMR PRICO) ................................................................................ 27
Figure 13: The effect of natural gas inlet temperature on power consumption at
different Pressures (SMR PRICO) .................................................................................................... 28
Figure 14 : The effect of natural gas inlet temperature on refrigerant flow rate when
natural gas supplied at 60 bar (SMR PRICO) .............................................................................. 29
Figure 15: The effect of natural gas inlet temperature on refrigerant flow rate at different
natural gas supplied pressures (SMR- Process) ........................................................................... 30
Figure 16: The effect of natural gas pressure on specific power when natural gas
supplied at inlet temperature of 150C (SMR-PRICO) ................................................................ 31
Figure 17 : The effect of natural gas pressure on specific power when natural gas
supplied at different temperature (SMR-PRICO) ..................................................................... 32
xii
Figure 18: The effect of natural gas pressure on power consumption when natural gas
supplied at inlet temperature of 150C (SMR-PRICO) ................................................................ 33
Figure 19: The effect of Natural gas pressure on power consumption when natural gas
supplied at different temperatures (SMR-PRICO) ...................................................................... 34
Figure 20: The effect of natural gas pressure on refrigerant flow rate when natural gas
supplied at different temperatures (SMR-PRICO) ...................................................................... 35
Figure 21: The effect of natural gas pressure on refrigerant flow when natural gas
supplied at different temperatures (SMR-PRICO) ...................................................................... 36
Figure 22: The effect of natural gas composition on specific power (SMR-PROCO)......... 37
Figure 23: The Effect of natural gas composition on power consumption (SMR-PRICO) . 38
Figure 24: The effect of natural gas composition on refrigerant flow (SMR-PRICO) .......... 39
Figure 25: Distribution of Exergy losses on different components and useful exergy (SMR
PRICO) ................................................................................................................................................ 40
Figure 26: Production capacity of SMR process ........................................................................ 41
Figure 27: Process flow diagram for dual mixed refrigerant (DMR) ....................................... 43
Figure 28: The effect of natural gas temperature on specific power when natural gas
supplied at 60bar (DMR Process) .................................................................................................. 47
Figure 29: The effect of natural gas inlet temperature on specific power when natural
gas supplied at different pressures (DMR Process) ................................................................... 48
Figure 30 : The effect of natural gas temperature on power consumption when natural
gas supplied at 60bar (DMR Process) ...................................................................................... 49
Figure 31: The effect of natural gas temperature on power consumption when natural
gas supplied at different temperatures (DMR Process). .......................................................... 50
Figure 32 : The effect of natural gas inlet temperature on refrigerant flow rate when
natural gas supplied at 60bar (DMR Process) ............................................................................ 51
Figure 33: the effect of natural gas inlet temperature on power consumption when
natural gas supplied at different temperatures (DMR Process) ............................................. 52
Figure 34: The effect of natural gas pressure on specific power when natural gas
supplied at 60bar (DMR Process) .............................................................................................. 53
xiii
Figure 35 : The effect of natural gas pressure on specific power when natural gas
supplied at different temperatures (DMR Process) ................................................................... 54
Figure 36: The effect of natural gas pressure on power consumption when natural gas
supplied at 150C (DMR Process) ................................................................................................... 55
Figure 37: The effect of natural gas pressure on power consumption when natural gas
supplied supplied at different temperature (DMR Process) .................................................... 56
Figure 38: The effect of natural gas pressure on refrigerant flow rate when natural gas
supplied at inlet pressure of 150C (DMR Process) ...................................................................... 57
Figure 39: The effect of natural gas pressure on refrigerant flow when natural gas
supplied at different temperatures (DMR). ............................................................................... 58
Figure 40: The effect of natural gas composition on specific power (DMR Process) ........ 59
Figure 41: The effect of natural gas composition on power consumption (DMR Process)
.............................................................................................................................................................. 60
Figure 42 : The effect of natural gas composition on refrigerant flow rate (DMR Process)
.............................................................................................................................................................. 61
Figure 43: Distribution of exergy losses on different components and useful exergy (DMR)
.............................................................................................................................................................. 62
Figure 44: The production capacity of DMR............................................................................... 63
Figure 45: Process flow diagram for Niche LNG Process .......................................................... 65
Figure 46: The effect of natural gas inlet temperature on specific power when natural
gas supplied at 60bar (Niche LNG Process) ............................................................................... 68
Figure 47: The effect of natural gas temperature on specific power when natural gas
supplied at different pressures (Niche LNG Process) ................................................................ 69
Figure 48: The effect of natural gas inlet temperature of power consumption when
natural gas supplied at 60bar (Niche LNG) .............................................................................. 70
Figure 49: The effect of natural gas inlet temperature on power consumption when
natural gas supplied at different temperatures (Niche LNG) ............................................... 71
Figure 50: The effect of natural gas pressure on specific power when natural gas
supplied with inlet temperature of 150C (Niche LNG Process) ............................................... 72
xiv
Figure 51: The effect of natural gas pressure on specific power when natural gas
supplied at different temperature (Niche LNG Process) ......................................................... 73
Figure 52 : The effect of natural gas pressure on power consumption when natural gas
supplied at inlet temperature of 150C (Niche LNG Process)................................................... 74
Figure 53: The effect of natural gas pressure on power consumption when natural gas
supplied at different inlet temperatures (Niche LNG Process). .............................................. 75
Figure 54: The effect of natural gas composition on specific power (Niche LNG) ............ 76
Figure 55: The effect of natural gas composition on power consumption (Niche LNG
Process) .............................................................................................................................................. 77
Figure 56: the effect of natural gas composition on refrigerant flow rate (Niche LNG) ... 78
Figure 57: The distribution of exergy losses and useful effect in Niche LNG process ......... 79
Figure 58: The production capacity of Niche LNG Process ................................................... 80
Figure 59 : Process flow diagram of dual nitrogen expander process ................................. 82
Figure 60: The effect of natural gas inlet temperature on specific power when natural
gas supplied at 60bar (Dual N2 Expander Process). .............................................................. 85
Figure 61: The effect of natural gas inlet temperature on specific power when natural
gas supplied at different pressures (Dual Nitrogen Expander Process) ................................ 86
Figure 62: The effect of natural gas inlet temperature on power consumption when
natural gas supplied 60bar (Dual Nitrogen Expander Process) .......................................... 87
Figure 63: The effect of natural gas inlet temperature on power consumption when
natural gas supplied at different pressures (Dual Nitrogen Expander Process). ................. 88
Figure 64: The effect of natural gas pressure on specific power when natural gas
supplied at 150C (Dual nitrogen expander process) ............................................................. 89
Figure 65: The effect of natural gas pressure on specific power when natural gas
supplied at different inlet temperatures (Dual Nitrogen Expander Process). ...................... 90
Figure 66 : The effect of natural gas pressure on power consumption when natural gas
supplied at inlet temperature of 150C (Dual Nitrogen Expander Process). ......................... 91
Figure 67: The effect of natural gas pressure on power consumption when natural gas
supplied different temperatures (Dual nitrogen expander process). ................................... 92
xv
Figure 68: The effect of natural gas composition on specific power dual N2 expander
process ............................................................................................................................................... 93
Figure 69: The effect of natural gas composition on power consumption dual N2
expander Process............................................................................................................................. 94
Figure 70: The effect of natural gas composition on refrigerant flow rate dual N2
expander process ............................................................................................................................ 95
Figure 71: Exergy losses distribution at different component and useful effect (Dual N2
expander process) ........................................................................................................................... 96
Figure 72: Production capacity per train when natural gas supplied at 150C and
Different pressure (Dual Nitrogen Expander) ........................................................................... 97
Figure 73 : The comparison of the specific power of proposed liquefaction processes for
LNG FPSO ........................................................................................................................................... 99
Figure 74: Comparison of power consumption of the proposed liquefaction processes
for LNG FPSO ................................................................................................................................. 100
Figure 75: The comparison of refrigerant flow rate of the proposed LNG liquefaction
process for LNG FPSO .................................................................................................................... 101
Figure 76: The comparison of production capacity of the proposed LNG processes for
LNG FPSO ......................................................................................................................................... 102
xvi
List of Tables
Table 1 : Composition Reference ................................................................................................. 20
Table 2: Natural gas Compostion-A ............................................................................................. 20
Table 3: Natural Gas composition-B ............................................................................................. 20
Table 4: Natural gas composition-C ............................................................................................. 20
Table 5: Natural gas composition-D ............................................................................................. 20
Table 6: Natural gas composition-E .............................................................................................. 21
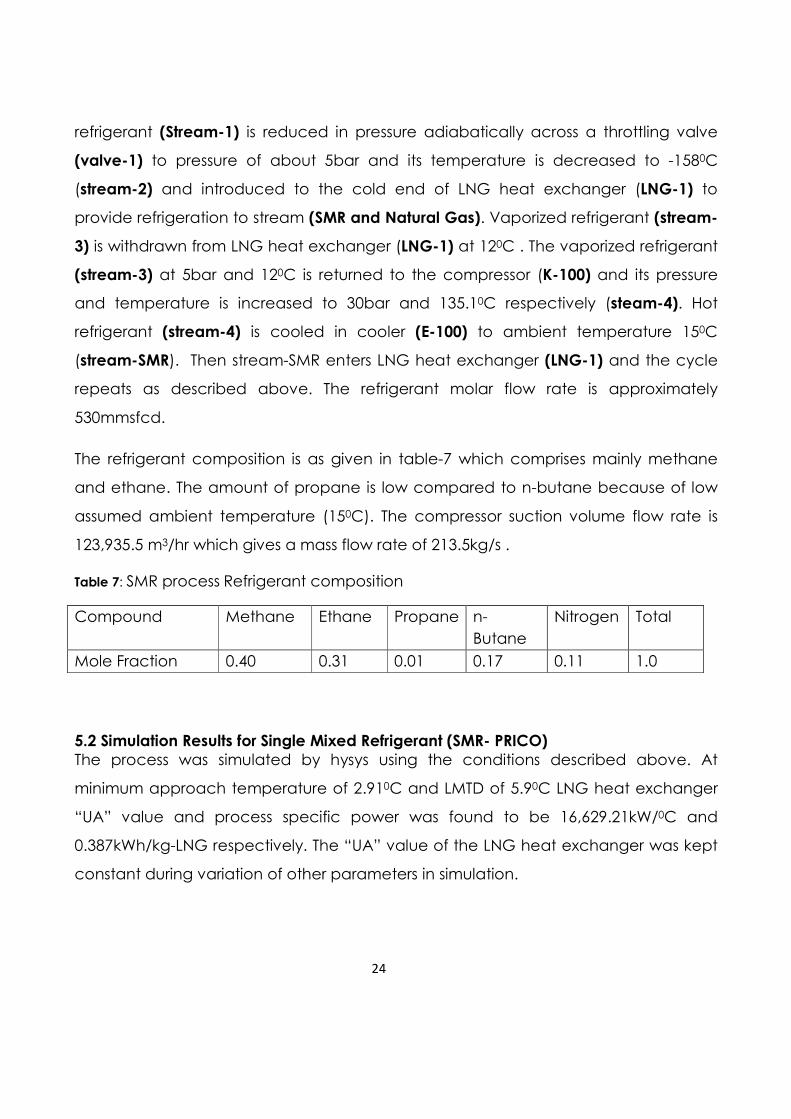
Table 7: SMR process Refrigerant composition .......................................................................... 24
Table 8: The effect of natural gas composition on specific power SMR process ............... 38
Table 9: The effect of natural gas composition on power consumption SMR process ..... 38
Table 10: The effect of natural gas composition on refrigerant flow rate SMR process.... 39
Table 11: Distribution of exergy Losses and useful exergy (SMR process) ............................. 40
Table 12: Summary of effect of natural gas supply temperature on SMR-PRICO Process 42
Table 13: Summary of effect of natural gas supply pressure on SMPR-PRICO Process ..... 42
Table 14: Low level refrigerant composition (DMR process) ................................................... 45
Table 15: High level refrigerant flow rate (DMR process) ......................................................... 45
Table 16 : The effect of natural gas composition on specific power DMR process ........... 60
Table 17: The effect of natural gas composition on power consumption DMR process .. 61
Table 18: The effect of natural gas compostion on refrigerant flow rate DMR process ... 61
Table 19: Distribution of exergy losses on different components and useful effect (DMR)
.............................................................................................................................................................. 62
Table 20: Summary of effect of natural gas temperature on DMR Process ........................ 64
Table 21: Summary of effect of natural gas pressure on DMR Process ................................. 64
Table 22:The effect of natural gas composition on specific power (Niche LNG) .............. 77
Table 23: The effect of natural gas composition on power consumption (Niche LNG) ... 77
xvii
Table 24: The effect of natural gas compositions on refrigerant flow rate (Niche LNG
Process) .............................................................................................................................................. 78
Table 25: The amount of exergy destroyed on each component and useful effect
(Niche LNG) ....................................................................................................................................... 79
Table 26: Summary of effect of natural gas temperature on Niche LNG process ............. 81
Table 27: Summary of effect of natural gas pressure on Niche LNG process ..................... 81
Table 28: The effect of natural gas composition on specific power dual N2 expander
process ............................................................................................................................................... 94
Table 29: The effect of natural gas composition on power consumption dual N2
expander process ............................................................................................................................ 94
Table 30: The effect of natural gas composition on refrigerant flow rate dual N2
expander process ............................................................................................................................ 95
Table 31: The amount of exergy destroyed on each component and useful effect (Dual
N2 Expander Process) ...................................................................................................................... 96
Table 32 : Summary of effect of natural gas temperature on dual nitrogen expander
Process ................................................................................................................................................ 98
Table 33 : Summary of effect of natural gas pressure on dual nitrogen expander Process
.............................................................................................................................................................. 98
Table 34: The comparison of specific power of the proposed liquefaction processes for
LNG FPSO ......................................................................................................................................... 100
Table 35: The comparison of power consumption of the proposed LNG liquefaction
process for LNG FPSO .................................................................................................................... 101
Table 36: The comparison of refrigerant flow rate of the proposed LNG liquefaction
Process for LNG FPSO .................................................................................................................... 102
Table 37: The comparison of production capacity of the proposed LNG liquefaction
processes for LNG FPSO ................................................................................................................ 103
Table 38: The comparison of LNG Heat exchangers “UA” values (kW/0C) for the
proposed liquefaction process for LNG FPSO .......................................................................... 103
Table 39: The comparison of the effect of natural gas temperature on specific power for
LNG liquefaction Processes proposed for LNG FPSO ............................................................. 104
xviii
Table 40: The comparison of the effect of natural gas supply temperature on power
consumption for LNG liquefaction processes proposed for LNG FPSO .............................. 104
Table 41: The comparison of the effect of natural gas pressure on specific power for the
proposed liquefaction process for LNG FPSO .......................................................................... 105
Table 42: The comparison of the effect of natural gas pressure on power consumption
for the proposed liquefaction process for LNG FPSO ............................................................. 105
Table 43 : The comparison of the effect of composition-E on specific power for
proposed liquefaction processes for LNG FPSO ...................................................................... 105
Table 44 : The comparison of the effect of composition-E on power consumption for
proposed liquefaction process for LNG FPSO .......................................................................... 106
Table 45 : The comparison of the effect of composition-E on refrigerant flow rate for
proposed liquefaction process for LNG FPSO .......................................................................... 106
Table 46: The comparison of useful exergy of proposed liquefaction processes for LNG
FPSO .................................................................................................................................................. 106

xix
Nomenclature
DMR Dual Mixer Refrigerant
FPSO Floating Production Storage and Offloading
HHC Heavy Hydro Carbon
HHV High Heating Value
LMTD Logarithimic Mean Temperature Difference
LNG Liquefied Natural Gas
LPG Liquefied Petroleum Gas
MFC Mixed Fluid Cascade
MRC Mixed Refrigerant Cycle
NGL Natural Gas Liquid
SMR Single Mixed Refrigerant
TCM Trillion Cubic Meters
“UA” Overall heat transfer multiply by Area
1
1. Introduction
About one-third of the world’s natural gas reserves (60 TCM) are found in offshore
fields [7] and 36% of the natural gas reserves are considered as stranded natural gas
and most of them are found offshore [8].To realize its value it has to be brought
onshore, to be processed to the required specification and sold to the transportation
and distribution networks. Lack of means to bring stranded natural gas to the market
leads to increase of remotely located natural gas reserves, flaring and re-injection of
associated gas from offshore fields [3]. Flaring of associated gas has become an
environmental issue with high degree of focus among approving authorities and oil
companies. Handling of associated gas for oil developments has become a more
critical issue than before. Therefore, this has led the oil and gas industry to seek
solutions that can handle the associated gas in an acceptable manner both
economically and environmentally. Due to the increasing demand for natural gas in
the world and growing demand for cleaner energy, the pressure to bring the
stranded natural gas to market is also increasing.
Companies and individuals are seeking full realization of offshore fields’ potential for
exploiting stranded natural gas. For many years’ industry has proposed LNG FPSO as
means of recovering and monetizing off-shore stranded natural gas [14]. Also many
studies concluded that offshore stranded natural gas will require off-shore solution
(LNG FPSO) to put the natural gas into exportable product. Industry has put attention
on LNG-FPSO due to lower investment, shorter building period and being easer to
move from one field to another [27]. Analyst estimated that the LNG-FPSO project
might be 20-30% cheaper than a same size project at onshore and the construction
time 25% faster compared to onshore plant which requires land acquisition [7, 27].
Four different natural gas liquefaction processes have been reported as suitable
candidate for LNG FPSO. These processes were identified in the semester project with
title “Natural gas liquefaction processes onboard an LNG FPSO” submitted January
2011[21]. The four processes considered as good candidates for LNG FPSO are single
2
mixed refrigerant (SMR), dual mixed refrigerant (DMR), dual nitrogen expander and
Niche LNG. These processes significantly differ in process designing and refrigerants.
All the processes claim reasonable efficiency, minimum capital cost and offshore
suitability
The main reasons for selecting SMR and DMR is its higher efficiency, being currently in
operation in onshore LNG production plants and also they have higher production
capacity per train. But the challenges are they are sensitive to changes in feed gas
conditions as they rely on small temperature differences between the composite
cooling and warming streams to give reasonable process efficiency. They also take
longer time to start-up and stabilize than expander plants because of the need for
precise blending of the refrigerant and also their refrigerants operate on liquid phase
hence the FPSO motion will cause mal-distribution in equipments and pipelines, which
will impact the performance of heat transfer.
The main reasons for selection of expander cycle are its refrigerants are in gaseous
form hence it has negligible impact from vessel motion and there is no need for
refrigerants storage thus increasing space availability. Expander cycle has high
inherent to safety as no storage of hydrocarbon refrigerant is required and has low
footprint. The major disadvantage is its relatively high power consumption.
Liquefaction process is one of the important part of LNG FPSO. There are many
processes for liquefying natural gas, but few of them are in use (onshore plants) and
many they do not have industrial reference. The liquefaction process cools natural
gas to liquid form using various methods of cryogenic processes and also expands
the liquefied natural gas to atmospheric conditions for easier and safer storage. The
liquefaction processes (technologies) are divided into three main cycles; cascade
cycle, mixed refrigerant cycle and expander cycle. Major factors which differentiate
technologies are setup and designing but they use the same fundamentals principles
[24].
3
Natural gas liquefaction process operates under low temperatures and the processes
features one or more refrigeration cycles to remove heat from natural gas. The
liquefaction process requires significant power demand for compression in
refrigeration cycle so it is very important to achieve energy efficiency in designing
and operation of refrigeration cycles [5, 9]. Energy efficiency is important to LNG
production as feed gas is consumed in order to carry out the liquefaction process.
However, the energy efficiency is not the only factor of importance, as any project
must be cost effective, reliable, and tolerant of reasonably foreseeable feed
changes. It must also be safely operated and maintained and for offshore, it should
also be relatively compact [5].
In order to meet a number of challenges including the demand of greater efficiency
and large capacity for liquefaction processes, thermodynamic analysis on the
liquefaction process for LNG FPSO must be evaluated. To lower input power for
natural gas liquefaction process it is crucial to reduce entropy generation due to
temperature difference between feed natural gas and refrigerants flow in LNG heat
exchangers. Natural gas is a mixture of different hydrocarbons and its specific heat
capacity varies considerably during its liquefaction process, hence a variety of
combined refrigerants are required to efficiently liquefy natural gas [5, 11, 18].
4
2. Theory
2.1 Liquefaction of Natural Gas
Natural gas liquefaction processes convert pre-treated natural gas into liquid suitable
for transportation or storage. The liquefied natural gas (LNG) has a temperature of -
1620C at atmospheric pressure [22]. The liquefaction of natural gas reduces the
volume of natural gas by a factor of 600 thus enabling transportation in tanks on
board specialized ship [5, 22, 20].
Natural gas entering a liquefaction plant must be pre-treated to remove impurities
such as water, acid gases (eg CO2 and H2S) and mercury to prevent freezing out in
process equipment, corrosion, depositions on heat exchangers surface and
controlling of heating values in the final product. Nitrogen is removed at end flash
while heavy hydrocarbons may be removed at pre-cooling stage because they are
valuable products as natural gas liquids (NGL), liquefied petroleum gas (LPG) and for
refrigerant makeup. The compositions of Natural gas suitable for liquefaction process
may contain a mixture of methane (about 85-95%), lighter hydrocarbons and small
fraction of nitrogen [5].
Generally natural gas liquefaction plants consist of two main sections, pre-treatment
and liquefaction. In the pre-treatment section, acidic gases (CO2 and H2S), water,
mercury and any other impurities that may solidify when natural gas is refrigerated
are removed and the liquefaction section removes sensible and latent heat from
natural gas before it is expanded to atmospheric pressure [4].
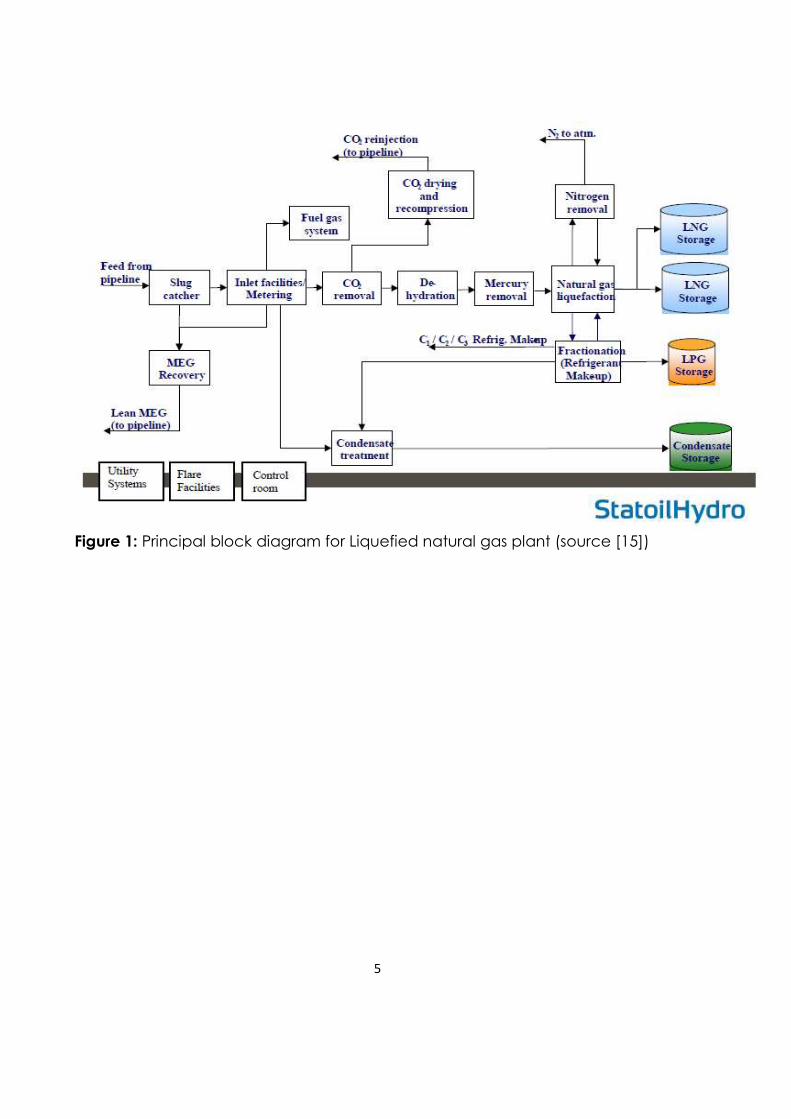
A block diagram showing some of the key sections of an LNG Plant is presented in
figure-1 below. The sections include gas reception (slug catcher), Pre-treatment
(which consist of acid gas removal, molecular sieve dehydration and mercury
removal) and liquefaction sections.
5
Figure 1: Principal block diagram for Liquefied natural gas plant (source [15])
6
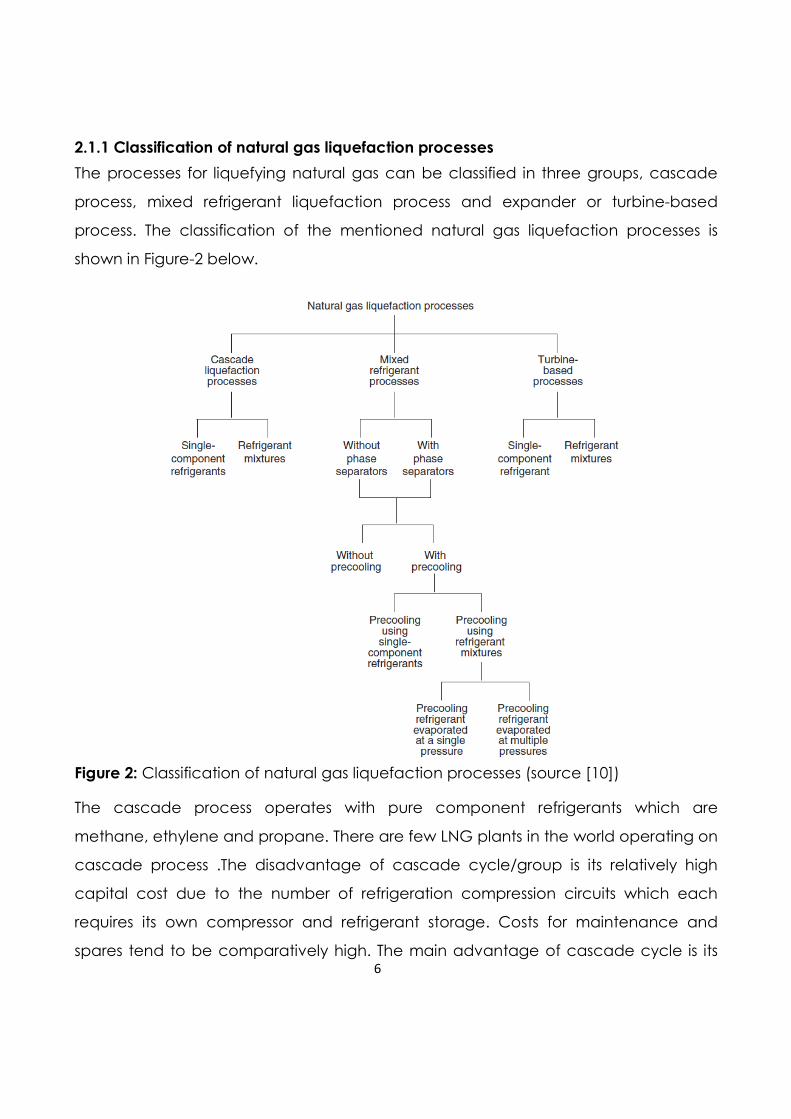
2.1.1 Classification of natural gas liquefaction processes
The processes for liquefying natural gas can be classified in three groups, cascade
process, mixed refrigerant liquefaction process and expander or turbine-based
process. The classification of the mentioned natural gas liquefaction processes is
shown in Figure-2 below.
Figure 2: Classification of natural gas liquefaction processes (source [10])
The cascade process operates with pure component refrigerants which are
methane, ethylene and propane. There are few LNG plants in the world operating on
cascade process .The disadvantage of cascade cycle/group is its relatively high
capital cost due to the number of refrigeration compression circuits which each
requires its own compressor and refrigerant storage. Costs for maintenance and
spares tend to be comparatively high. The main advantage of cascade cycle is its
7
less power requirement compared to other liquefaction cycle, mainly because the
flow of refrigerant is lower than in other cycles. It is also flexible in operation as each
refrigerant circuit can be controlled separately. The mean temperature differences
between the composite curves are wide relative to those of the mixed refrigerant
cycle. Economies of scale dictate that the cascade cycle is most suited to very large
train capacities where the low heat exchanger area and low power requirement
offset the cost of having multiple machines [21].
The mixed refrigerant cycle (MRC) uses a single mixed refrigerant instead of multiple
pure refrigerants as the cascade cycle. The mixed refrigerant normally consists of
nitrogen, ethane, propane, butane and pentane. Such a mixture evaporates over a
temperature trajectory instead of at a constant evaporating point and this has large
benefits for the total process. The refrigeration effect will be distributed over a range
of temperatures and accordingly the overall temperature difference between the
natural gas and mixed refrigerant is small. Small driving temperature differences give
operation nearer to reversibility; leading to a higher thermodynamic efficiency.
Simultaneously, the power requirement will be lower and the entire machinery smaller
[1,19] . Some of MRC technologies are; Single mixture process (SMR), Mixed
refrigerant with propane pre-cooling (C3/MR), Dual mixed refrigerant process (DMR),
Mixed fluid cascade process (MFC), AP-X and Small scale MRC . Most existing base-
load natural gas liquefaction plants operate on the mixed refrigerant processes, with
the propane pre-cooled mixed refrigerant process being the most widely used [10].
Expander cycle produces LNG by means of refrigeration generated by the isentropic
expansion of gases used as refrigerant. There are various expander technologies,
some of them use a single cycle, others use a dual expansion cycle and in other
cases a pre-cooling cycle is added to improve the overall efficiency [23]. In the
industry nitrogen expansion cycles have been used for low capacities LNG plant
(0.02- 0.14 MTPA) especially in peak-shaving plants and also in re-liquefaction units
located in very large LNG carriers [16, 23].
8
2.2.2 Type of LNG Plants
LNG plants can be group in three types Base-load, Peak-shaving and Small-scale
plants.
Base-load plants – These are large plants which are directly linked to a specific gas
field development, and serves to transport gas from the field. A base-load plant
typically has a production capacity of above 3 MTPA (million tons per annum) of
LNG. The main world-wide LNG production capacity comes from this type of plants
[20].
Peak-shaving plants – These are smaller plants that are connected to a gas network.
During periods of the year when gas demand is low, natural gas is liquefied and LNG
is stored as a gas buffer. LNG is vaporized during short periods when gas demand is
high. These plants have a relatively small liquefaction capacity (such as 200
tons/day) and large storage and vaporization capacity (such as 6000 tons/day).
Especially in the USA many such plants exist [20].
Small-scale plants - Small-scale plants are connected to a gas network for
continuous LNG production in a smaller scale. The LNG is distributed by LNG trucks or
small LNG carriers to various customers with a small to moderate need of energy or
fuel. This type of LNG plants typically has a production capacity below 500 000 TPA. In
Norway and China several plants within this category is in operation [20].
9
2.2 Liquefaction and refrigeration
Liquefaction of gas is done by refrigerating the gas to the temperature below its
critical conditions. Natural gas has a critical point at -80 to -900C and its liquefaction
cannot be done by pressurization and expansion alone [22]. The process requires a
refrigeration cycle that removes energy from natural gas in the form of sensible and
latent heat. Selection of best refrigeration cycle for liquefaction of natural gas can
be done after thorough study of local conditions [4].
The thermodynamic principles of liquefaction and refrigeration process are quite
similar but the designing of the two systems are different. The refrigeration
process/cycle for liquefaction of natural gas involves some equipment in which
refrigerant is compressed, cooled to reject heat at ambient conditions and
expanded to produce refrigerant capacity required. In refrigeration cycles which
operate as close loop, refrigerant is constantly circulating as working fluid and there is
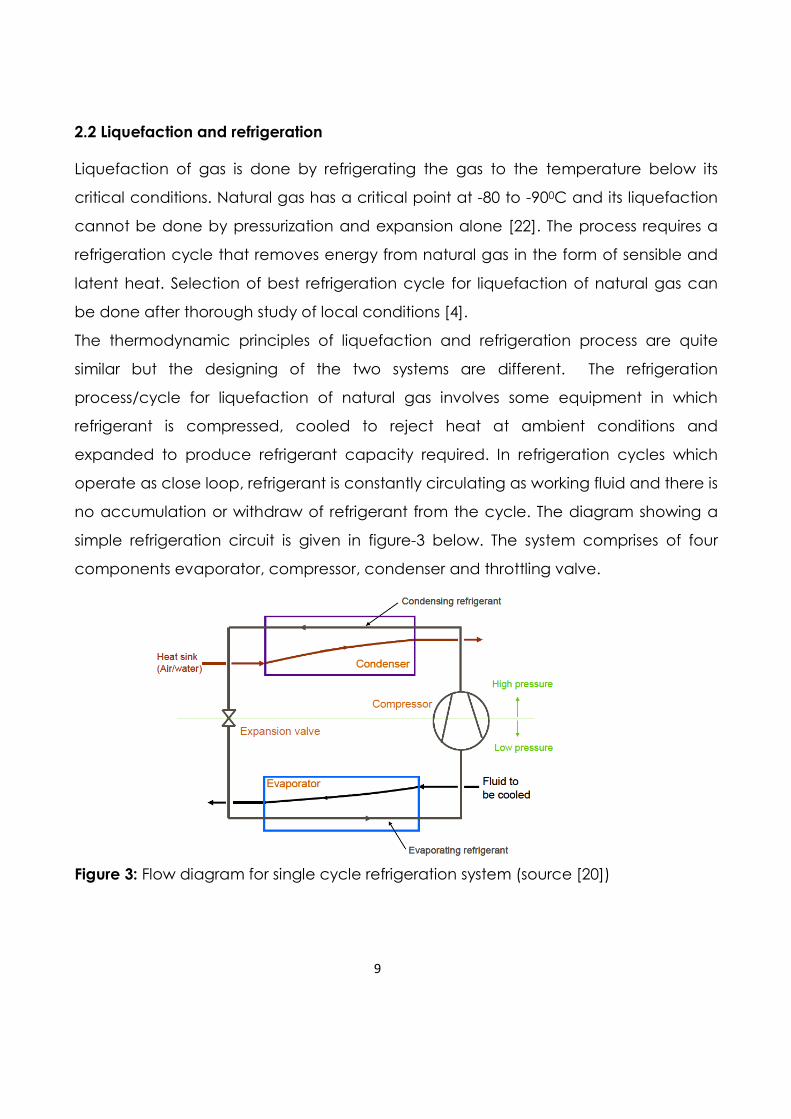
no accumulation or withdraw of refrigerant from the cycle. The diagram showing a
simple refrigeration circuit is given in figure-3 below. The system comprises of four
components evaporator, compressor, condenser and throttling valve.
Figure 3: Flow diagram for single cycle refrigeration system (source [20])
10
The refrigerant is in closed circuit and circulated by compressor. By keeping the
pressure of refrigerant low in evaporator, the refrigerant boil by absorbing heat from
the fluid to be cooled and at the same time it continues to remove the vaporized
refrigerant and compress it to the condensing pressure. The condensing pressure
must be higher enough to make refrigerant condense at ambient conditions using
water or air. Ambient temperature must be less than the critical temperature of the
refrigerant to effect condensation using the environment as a coolant. The
temperature of the evaporator is usually near the normal boiling point of the
refrigerant, so the pressure of the evaporator may be approximately atmospheric.
The throttling valve maintains a pressure difference between the higher and lower
side of the refrigeration cycle [20]. Note that the work supplied to the refrigeration
cycle increases with the temperature lift (difference from evaporating to condensing
temperature) [20].
2.2.1 The effect of natural gas pressure on liquefaction processes
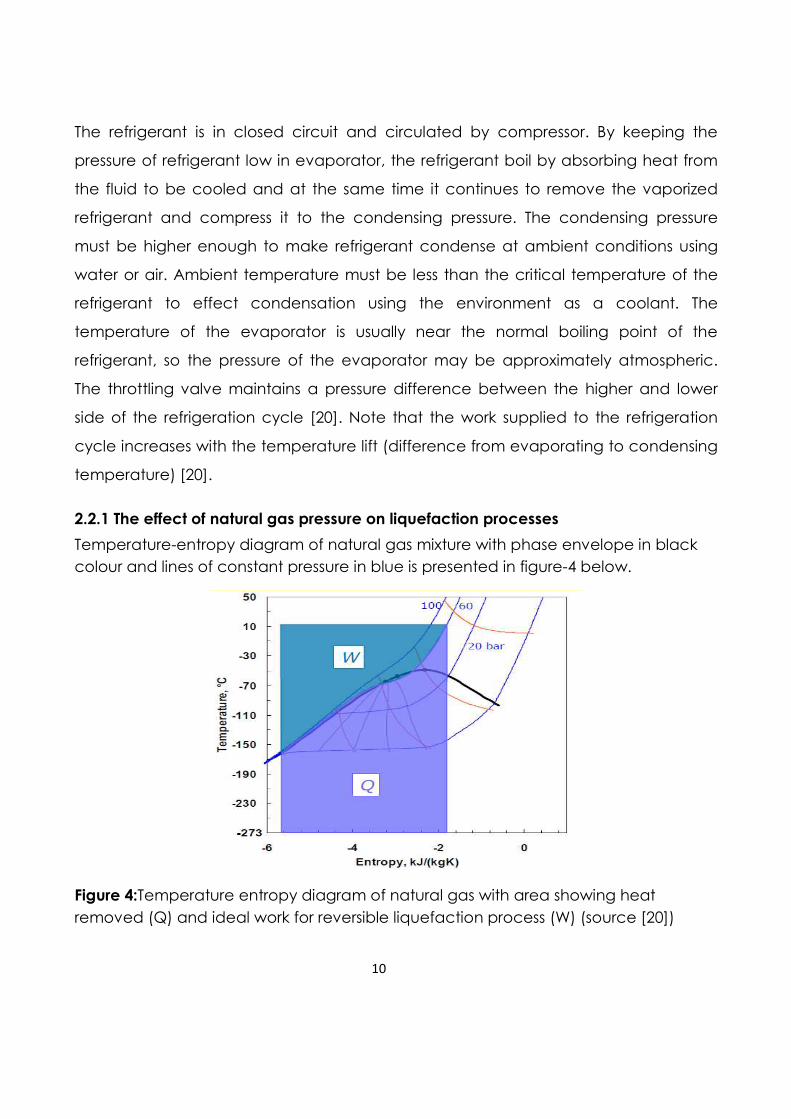
Temperature-entropy diagram of natural gas mixture with phase envelope in black
colour and lines of constant pressure in blue is presented in figure-4 below.
Figure 4:Temperature entropy diagram of natural gas with area showing heat
removed (Q) and ideal work for reversible liquefaction process (W) (source [20])
11
From the diagram it can observed that if natural gas is liquefied at low pressure, work
(area W) is increased and also there is some increase on amount of heat required to
be removed from natural gas (area Q). Thermodynamically it is useful to liquefy
natural gas at highest possible pressure so that work can be saved and reduce the
heat load. Practically there are some constrains for example it is required that natural
gas be below the critical pressure in order to obtain liquid/gas separation in the
heavy hydrocarbon removal column. Another limitation is equipment design pressure
eg. Heat exchangers hence natural gas pressure should be within heat exchanger
designed pressure.
2.3 Exergy analysis of Natural gas Liquefaction Processes
Exergy analysis can be described as thermodynamic analysis technique which is
based on the second law of thermodynamic and can provide alternative way of
assessing and comparing thermodynamic processes/system realistically and
significantly. Exergy analysis yields data/information’s which shows how the actual
performance of a thermodynamic system approaches the ideal. It also indicates
thermodynamic losses and the effect of built environment on natural environment.
Exergy analysis can describe how to design more energy efficient systems by
reducing different thermodynamic losses in the system [13].
Exergy can be defined as useful work of a given amount of energy at a specific state
or the work potential of energy contained in a system at specific state relative to a
reference state [13], or measure of maximum amount of useful energy that can be
extracted from a process stream when it is brought to equilibrium with its surroundings
in a hypothetical reversible process. It is a thermodynamic measure defined only in
terms of stream enthalpy and entropy for the given stream conditions relative to the
surroundings [5]
12
The exergy of a system at a given state depends on the condition of environment
and properties of the system; hence exergy is a combination of system and
environment. A system will be in dead state if it is in thermodynamic equilibrium with
its environment, at this state, the system is at temperature and pressure of its
environment and it has no kinetic or potential energy relative to its environment and
does not react with its environment. The properties of dead state can be denoted by
subscript zero (P0, T0, S0, h0,) unless specified otherwise. The idea is the system must go
to the dead state at the end of the process so that the work out put can be
maximized. This can be described by the assumption that if the system temperature
at the end of the process is greater than that of its environment, additional work can
be produced by running a heat engine between the two temperature levels or if the
end pressure of the system is higher than its environmental pressure, additional work
can be produced by letting the system expand [13].
It should be understood that exergy represents the maximum amount of work that a
device can deliver without violating any thermodynamic laws and does not
represent the amount of work that a work producing equipment will really deliver
upon installation. Therefore there will be a difference large or small between exergy
and actual work delivered by equipment. For example the internal energy and
enthalpy of a thermodynamic system are not entirely available for work but only a
portion of thermal energy of the system can be converted to work hence the exergy
of the system will be larger than thermal energy available [13].
The exergy or useful available work, of a stream is therefore expressed as [ 5],
Ex = (H – T0S)T,P – (H-T0S)T0,P0 ---------------------------------------------------------------------------(1)
When matter is taken from one state to another via a hypothetical reversible process,
the reference terms cancel out and the change in exergy is given by
∆Ex = (H – T0S)state 2 – (H-T0S)state1 -------------------------------------------------------------------(2)
This change in exergy represents the minimum amount of work to be added or
removed to change from state 1 to state 2 when there is an increase or decrease in
internal energy or enthalpy resulting from the change [5]
13
Lost work can thus be defined as the difference between the work involved with the
ideal reversible process and the real process chosen. Lost work, W-lost, can be
expressed as
Wlost = Wactual - ∆Ex---------------------------------------------------------------------------------------(3)
For a chosen feed condition and LNG product specification, the minimum possible
amount of work required to produce the LNG product is determined by the
difference in the exergy of the LNG and the feed. This can be expressed as [5]
Wrev = ∑(H-T0S)LNG - ∑(H-T0S)feed --------------------------------------------------------------------(4)
Energy can enter or exit the system by heat, work and mass. In the actual process
mass and energy are conserved while entropy is generated
Sin – Sout +Sgenerated = ∆Ssystem ------------------------------------------------------------------------(5)
Exin – Exout – Exdestroyed = ∆Exsystem ------------------------------------------------------------------(6) Exergy can be transferred from any system by heat, mass and work. Irreversibility’s
such as chemical reaction, heat transfer through finite temperature, friction,
unrestrained expansion, mixing and anything that generates entropy destroys exergy.
The exergy destroyed is proportional to entropy generated [13].
Exdestroyed = T0Sgenerated --------------------------------------------------------------------------------(7)
14
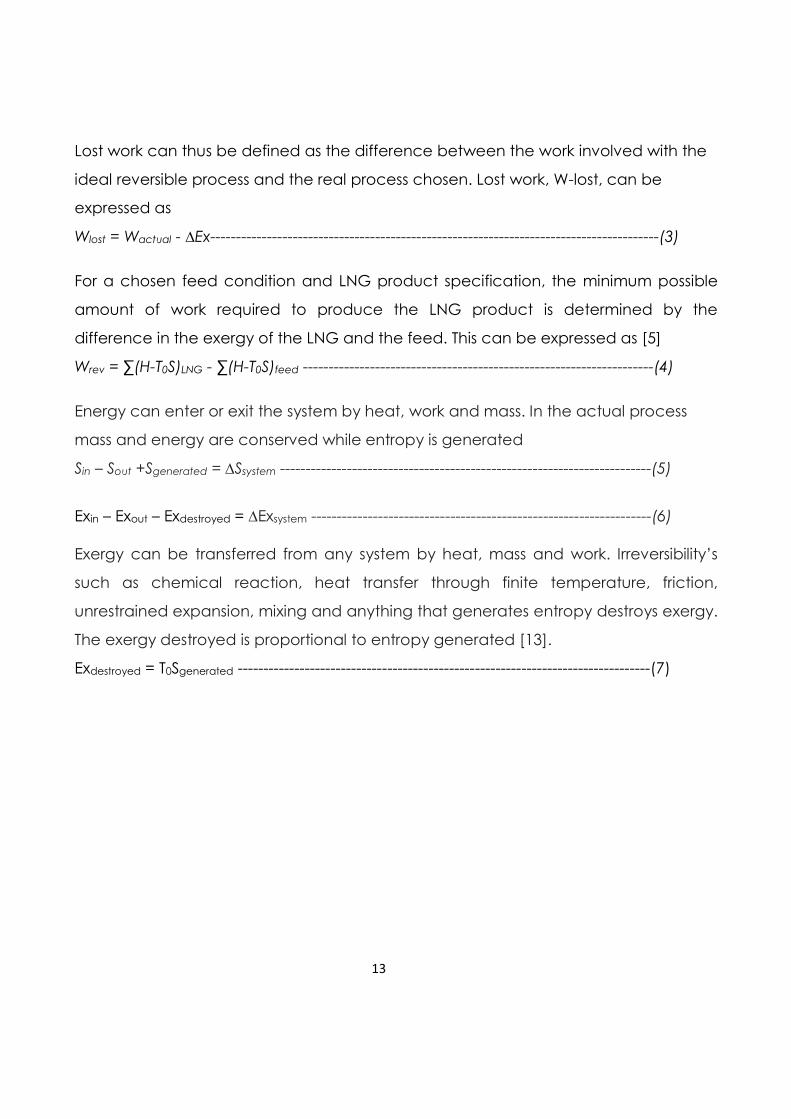
2.3.1 Exergy losses in natural gas liquefaction processes
Exergy losses in natural gas liquefaction process are important parameters since such
losses are to be compensated by more work or power input. The major losses are
within the compression system (Compressors), heat transfer in heat exchangers (LNG
heat exchanger and after coolers), losses due to refrigerant letdown and super
heating of refrigerant (compressor discharge temperature). The losses can be
categorized in three groups, heat transfer loss which includes losses in LNG heat
exchangers and after collars, process losses which includes letdown losses and super
heating of refrigerant and compressor losses [5]. Temperature entropy diagram
showing the different losses is presented in figure-5 below.
Figure 5: Temperature/entropy diagram showing different losses in refrigeration cycle
∆Wvv = Heat transfer loss
∆Wstr = Expansion
∆Woh = Super heating loss
∆Wk = Compressor loss
15
3. Proposed LNG liquefaction processes for FPSO
There are several technologies for liquefaction of natural gas, but for FPSO LNG the
most proposed technology are based on mixed refrigerant cycle (MRC) which
includes Single Mixed Refrigerant (SMR) and Dual Mixed Refrigerant (DMR) and
expander based cycle which include Niche LNG (CH4 and N2) and dual nitrogen
expander [21].
The proposed natural gas liquefaction cycles vary in both sophistication and power
consumption. Choosing the optimum cycle for FPSO LNG is crucial and many factors
are involved. Some of the major factors are [1, 2, 26];
a) LNG-FPSO liquefaction process should be light and compact due to the space
and weight limitations
b) Should be adaptable/flexible to varying natural gas compositions,
c) Rapid start-up and shutdown in a safe and controlled manner, due to unstable
condition at offshore. There is high probability of having many stops due to
weather.
d) Ease operation and high uptime
e) Low requirement for handling potentially hazardous refrigerant
f) Reliable and insensitive to the motion of LNG-FPSO (minimize weather related
downtime)
g) The process should also be low-cost and easy to maintain
h) Optimal power requirements to increase LNG production efficiency
i) Process option to recover LPG and NGL
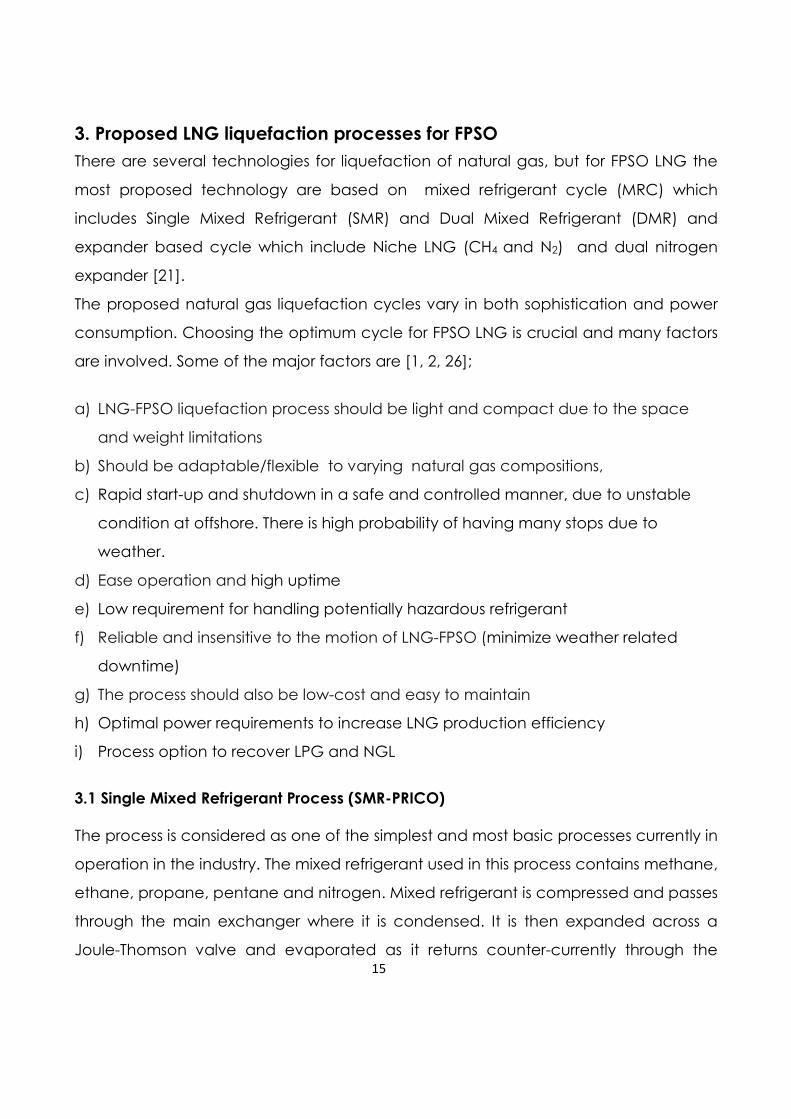
3.1 Single Mixed Refrigerant Process (SMR-PRICO)
The process is considered as one of the simplest and most basic processes currently in
operation in the industry. The mixed refrigerant used in this process contains methane,
ethane, propane, pentane and nitrogen. Mixed refrigerant is compressed and passes
through the main exchanger where it is condensed. It is then expanded across a
Joule-Thomson valve and evaporated as it returns counter-currently through the
16
exchanger back to the compressor. The simplest flow diagram of SMR is shown as
figure-6 below. The process is simple and requires small equipment number but its
capacity is limited to 1.2 MTPA per train, though the setup reduces capital costs
significantly [25].
There is a considerable amount of refrigerant used in the process to facilitate the
cooling of the natural gas which leads to a lot of compression work needed. Its low
production capacity can be considered a disadvantage because more trains will be
required to produce in high capacities. The production rate closely mirrors the capital
cost not allowing for future improvement options without a total overhaul [25].
Figure 6: Principal flow diagram of SMR PRICO process (Source [20])
3.2 Dual Mixed Refrigerant process (DMR)
This process contains two refrigeration cycles. The refrigerant used in the first cycle is a
mixture of ethane and propane while in the second cycle is a mixture of nitrogen,
methane, ethane, propane and butane. The process is licensed by Shell Global
Solutions and its capacity is reported at about 4.5 MTPA. The principles of the Shell-
developed dual mixed refrigerant process is illustrates figure-7 below [25].
17
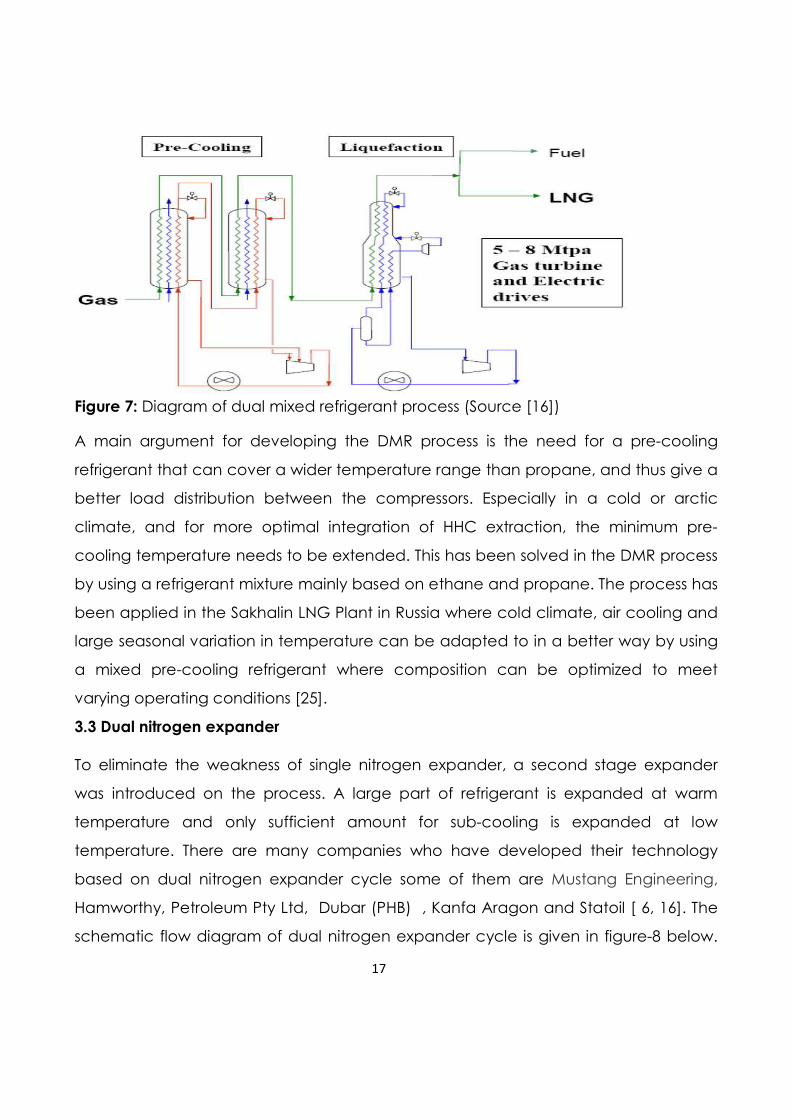
Figure 7: Diagram of dual mixed refrigerant process (Source [16])
A main argument for developing the DMR process is the need for a pre-cooling
refrigerant that can cover a wider temperature range than propane, and thus give a
better load distribution between the compressors. Especially in a cold or arctic
climate, and for more optimal integration of HHC extraction, the minimum pre-
cooling temperature needs to be extended. This has been solved in the DMR process
by using a refrigerant mixture mainly based on ethane and propane. The process has
been applied in the Sakhalin LNG Plant in Russia where cold climate, air cooling and
large seasonal variation in temperature can be adapted to in a better way by using
a mixed pre-cooling refrigerant where composition can be optimized to meet
varying operating conditions [25].
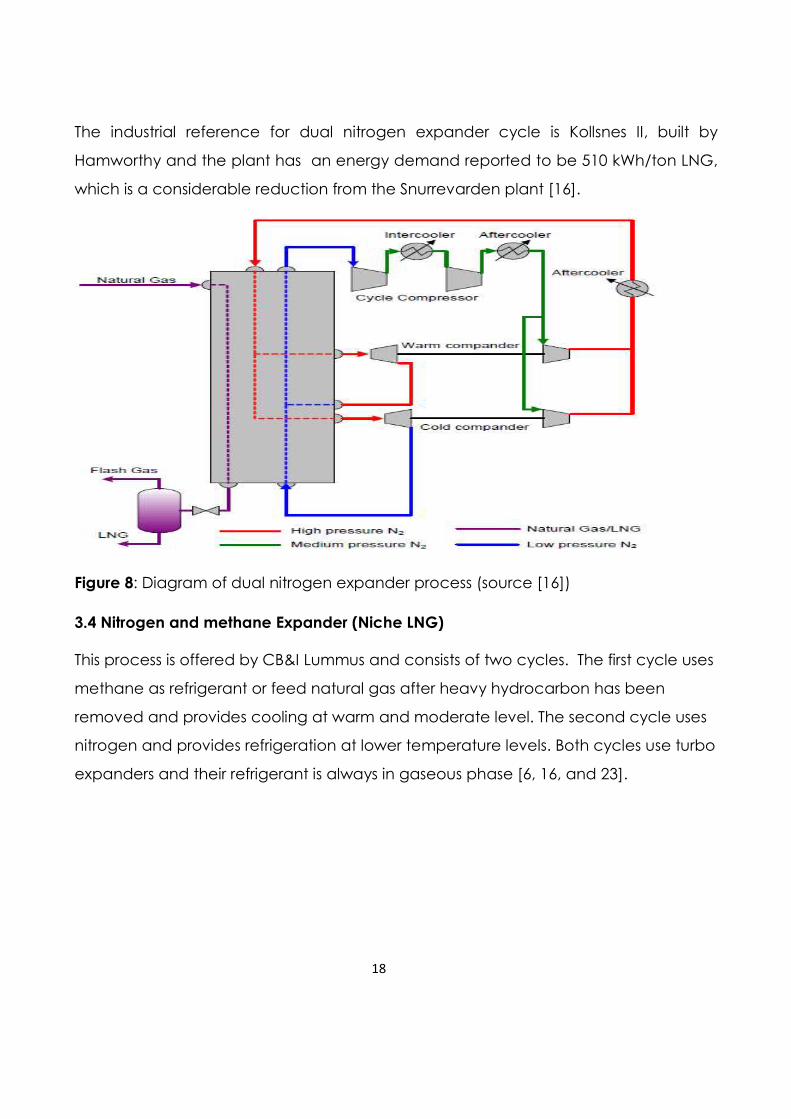
3.3 Dual nitrogen expander
To eliminate the weakness of single nitrogen expander, a second stage expander
was introduced on the process. A large part of refrigerant is expanded at warm
temperature and only sufficient amount for sub-cooling is expanded at low
temperature. There are many companies who have developed their technology
based on dual nitrogen expander cycle some of them are Mustang Engineering,
Hamworthy, Petroleum Pty Ltd, Dubar (PHB) , Kanfa Aragon and Statoil [ 6, 16]. The
schematic flow diagram of dual nitrogen expander cycle is given in figure-8 below.
18
The industrial reference for dual nitrogen expander cycle is Kollsnes II, built by
Hamworthy and the plant has an energy demand reported to be 510 kWh/ton LNG,
which is a considerable reduction from the Snurrevarden plant [16].
Figure 8: Diagram of dual nitrogen expander process (source [16])
3.4 Nitrogen and methane Expander (Niche LNG)
This process is offered by CB&I Lummus and consists of two cycles. The first cycle uses
methane as refrigerant or feed natural gas after heavy hydrocarbon has been
removed and provides cooling at warm and moderate level. The second cycle uses
nitrogen and provides refrigeration at lower temperature levels. Both cycles use turbo
expanders and their refrigerant is always in gaseous phase [6, 16, and 23].
19
4. Basis for simulation of proposed liquefaction processes for LNG FPSO
As described in previous sections, four LNG liquefaction process have been proposed
as good candidates for LNG FPSO, the proposed processes are single mixed
refrigerant (SMR-PRICO), dual mixed refrigerant (DMR), dual nitrogen expander and
Niche LNG (CH4 and N2 liquefaction process). This chapter describes the assumptions
for simulations, thermodynamic parameters simulated for each process and
methodology used during simulation. An in-depth optimization has not been
conducted but the simulation was aimed at obtaining an optimal efficient process
based on the simulated constraints. The processes were simulated based on natural
gas supplied at flow rate of 150mmscfd.
The effects of natural gas pressure, temperature and composition on the proposed
liquefaction processes for LNG FPSO were investigated in the simulation. During the
simulations the effects were analyzed by examining specific power, power
consumption and refrigerant flow rate of the proposed processes. The results of each
process are plotted in graphs and are presented in the chapter of results of each
process. All four processes were simulated using commercial mass and energy
balance software (hysys) with the Peng–Robinson equation of state.
4.1 Assumptions
The benchmarked simulation of each proposed liquefaction cycle was based on
natural gas supplied at 60bar and ambient temperature of 150C. The ambient
condition was assumed as natural gas inlet/supply temperature throughout the
simulation. The refrigerant conditions and operation parameters of each process
were found from patents and are presented in the detailed description chapters of
each process. The simulated processes based on the above description were used as
benchmark for all other simulated conditions and parameters.
Generally prior to liquefaction, the natural gas feed is pre-treated to remove acid
gases (such as carbon dioxide and hydrogen sulfide), water, mercury and portion of
20
heavier hydrocarbons. The pretreatment process is not covered in this thesis hence
the natural gas feed used in simulation is assumed to be pretreated natural gas.
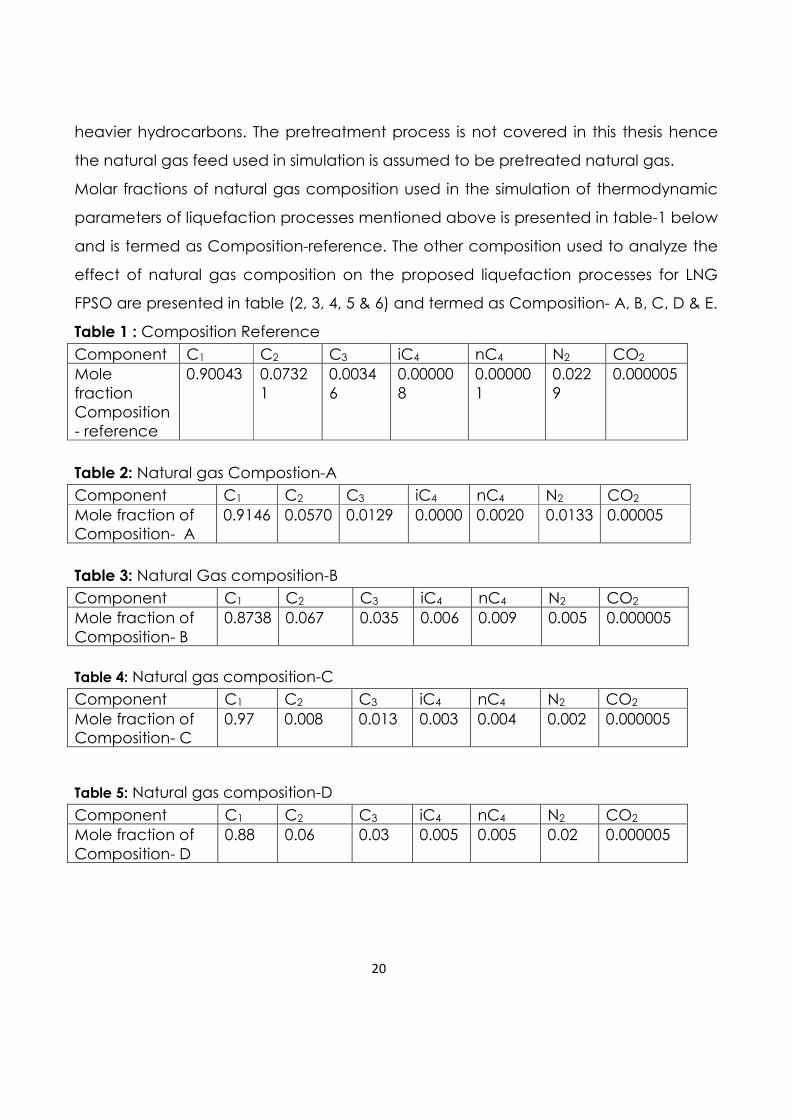
Molar fractions of natural gas composition used in the simulation of thermodynamic
parameters of liquefaction processes mentioned above is presented in table-1 below
and is termed as Composition-reference. The other composition used to analyze the
effect of natural gas composition on the proposed liquefaction processes for LNG
FPSO are presented in table (2, 3, 4, 5 & 6) and termed as Composition- A, B, C, D & E.
Table 1 : Composition Reference
Component C1 C2 C3 iC4 nC4 N2 CO2 Mole fraction Composition- reference
0.90043 0.07321
0.00346
0.000008
0.000001
0.0229
0.000005
Table 2: Natural gas Compostion-A
Component C1 C2 C3 iC4 nC4 N2 CO2 Mole fraction of Composition- A
0.9146 0.0570 0.0129 0.0000 0.0020 0.0133 0.00005
Table 3: Natural Gas composition-B
Component C1 C2 C3 iC4 nC4 N2 CO2 Mole fraction of Composition- B
0.8738 0.067 0.035 0.006 0.009 0.005 0.000005
Table 4: Natural gas composition-C
Component C1 C2 C3 iC4 nC4 N2 CO2 Mole fraction of Composition- C
0.97 0.008 0.013 0.003 0.004 0.002 0.000005
Table 5: Natural gas composition-D
Component C1 C2 C3 iC4 nC4 N2 CO2 Mole fraction of Composition- D
0.88 0.06 0.03 0.005 0.005 0.02 0.000005
21
Table 6: Natural gas composition-E
Component C1 C2 C3 iC4 nC4 N2 CO2 Mole fraction of Composition- E
0.82 0.112 0.04 0.012 0.009 0.007 0.000005
4.2 Methodology
The literature review on the patents of each proposed liquefaction process was
conducted and one patent for each process was selected. The detailed description
of each process based on the selected patent is presented in detailed description
chapter of each process.
Based on the selected patent conditions and parameters the liquefaction processes
were built on hysys using natural gas with composition presented in table-1 and
supplied at pressure of 60bar, temperature of 150C and flow rate of 150 mmscfd. The
processes were optimized by varying refrigerant flow rate to obtain the proposed
minimum approach temperatures and LMTD. After optimization of the processes the
key parameter recorded were “UA” values of LNG heat exchangers, power
consumption, refrigerant flow rate and specific power. The simulated processes
based on above conditions were taken as benchmark during variation of other
parameters to analyze the effect of pressure, temperature and composition on the
processes
The calculated “UA” value of all LNG heat exchangers was kept constant during
variation of natural gas pressure, temperature and composition. The reason for
keeping the calculated “UA” value constant is that, in real plant the designed “UA”
of LNG heat exchanger cannot be changers unless you modify or replace heat
exchanger. The optimization of processes was performed by varying refrigerant flow
rate and refrigerant evaporating pressure to ensure “UA” values of LNG heat
exchangers are kept constant as in the benchmarked process.
22
To analyze the effect of natural gas temperature on the benchmarked processes,
the temperature of natural gas was varied between (50C) and 300C) and the effect
of natural gas temperature on specific power, power consumption and refrigerant
flow rate when natural gas is supplied at 60bar was determined and presented in
graphs. The same procedure was done to analyze the same effects when natural
gas is supplied at different pressures between (20 and 150bar).
To analyze the effect of natural gas pressure, simulation started by supplying natural
gas at a temperature of 150C and varying natural gas pressure between 20 and
150bar, the graphs showing its effect on specific power, power consumption and
refrigerant flow rate are drawn and presented in result section of each process. The
same procedure was performed to analyze the same effects when natural gas is
supplied at different temperatures ( between 5 and 300C) and for each temperature
natural gas pressure was varied between 10 and 150bar and its effect on specific
power, power consumption and refrigerant flow rate was determined and presented
in graphs in result section.
The effect of natural gas composition on processes has been analyzed using five
different composition termed as composition-A,B,C,D and E as presented in table 2,
3, 4, 5&6 section 4.1 above. The compositions were analyzed by looking at its effect
on process power consumption, refrigerant flow rate and specific power. All
compositions were analyzed by supplying natural gas at 60bar, 150C and molar flow
rate of 150mmscfd. Results are presented in graphs and tables in the results section of
each process.
23
5. Simulation of Single Mixed Refrigerant Process (SMR- PRICO)
5.1 Detailed description of SMR process
The single mixed refrigerant (SMR) process with single compressor has been simulated
and the effect of natural gas pressure, temperature and composition on the process
is analyzed also useful exergy and exergy losses on the process are determined. The
process flow diagram of the simulated SMR is presented in figure-9 below. The
simulated process was based on patent with reference [19].
Figure 9: Process Flow Diagram of SMR (PRICO)
Referring to figure-9 above, Pre-treated natural gas (stream natural gas) at 60bar
and 150C is cooled in LNG heat exchanger (LNG-1) to temperature of about -1550C
(stream-10) by vaporizing mixed refrigerant (stream-2). Cooled natural gas (stream-
10) at -1550C and 60bar is expanded in throttling valve (VLV-2) to -162.90C and
1.05bar (stream-11). The Produced LNG (stream-11) is sent to flash tank where LNG
and Flash gas can be separated. The ratio of flash gas to inlet natural gas is 0.076, this
means that 92.4% of natural gas is converted to LNG.
The mixed refrigerant (stream-SMR) enters LNG heat exchanger (LNG-1) at ambient
temperature 150C and pressure 30bar and is cooled to -1550C (stream-1). Cooled
24
refrigerant (Stream-1) is reduced in pressure adiabatically across a throttling valve
(valve-1) to pressure of about 5bar and its temperature is decreased to -1580C
(stream-2) and introduced to the cold end of LNG heat exchanger (LNG-1) to
provide refrigeration to stream (SMR and Natural Gas). Vaporized refrigerant (stream-
3) is withdrawn from LNG heat exchanger (LNG-1) at 120C . The vaporized refrigerant
(stream-3) at 5bar and 120C is returned to the compressor (K-100) and its pressure
and temperature is increased to 30bar and 135.10C respectively (steam-4). Hot
refrigerant (stream-4) is cooled in cooler (E-100) to ambient temperature 150C
(stream-SMR). Then stream-SMR enters LNG heat exchanger (LNG-1) and the cycle
repeats as described above. The refrigerant molar flow rate is approximately
530mmsfcd.
The refrigerant composition is as given in table-7 which comprises mainly methane
and ethane. The amount of propane is low compared to n-butane because of low
assumed ambient temperature (150C). The compressor suction volume flow rate is
123,935.5 m3/hr which gives a mass flow rate of 213.5kg/s .
Table 7: SMR process Refrigerant composition
Compound Methane Ethane Propane n-
Butane
Nitrogen Total
Mole Fraction 0.40 0.31 0.01 0.17 0.11 1.0
5.2 Simulation Results for Single Mixed Refrigerant (SMR- PRICO)
The process was simulated by hysys using the conditions described above. At
minimum approach temperature of 2.910C and LMTD of 5.90C LNG heat exchanger
“UA” value and process specific power was found to be 16,629.21kW/0C and
0.387kWh/kg-LNG respectively. The “UA” value of the LNG heat exchanger was kept
constant during variation of other parameters in simulation.
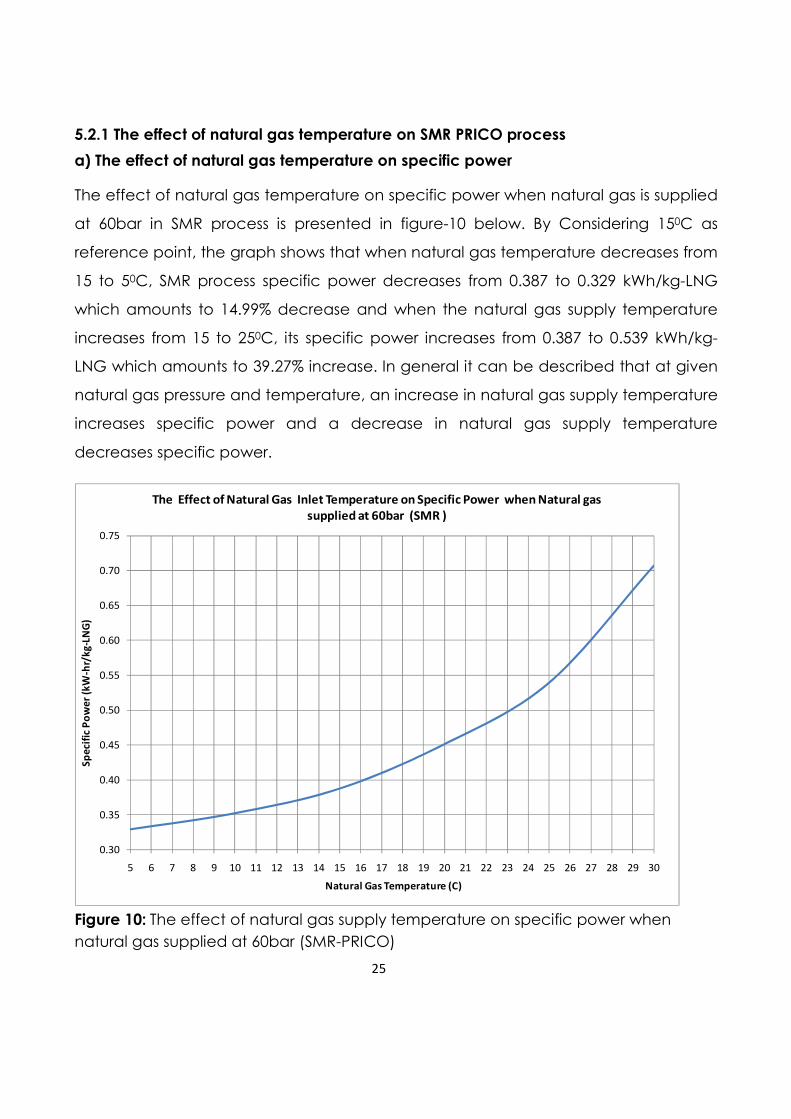
25
5.2.1 The effect of natural gas temperature on SMR PRICO process
a) The effect of natural gas temperature on specific power
The effect of natural gas temperature on specific power when natural gas is supplied
at 60bar in SMR process is presented in figure-10 below. By Considering 150C as
reference point, the graph shows that when natural gas temperature decreases from
15 to 50C, SMR process specific power decreases from 0.387 to 0.329 kWh/kg-LNG
which amounts to 14.99% decrease and when the natural gas supply temperature
increases from 15 to 250C, its specific power increases from 0.387 to 0.539 kWh/kg-
LNG which amounts to 39.27% increase. In general it can be described that at given
natural gas pressure and temperature, an increase in natural gas supply temperature
increases specific power and a decrease in natural gas supply temperature
decreases specific power.
0.30
0.35
0.40
0.45
0.50
0.55
0.60
0.65
0.70
0.75
5 6 7 8 9 10 11 12 13 14 15 16 17 18 19 20 21 22 23 24 25 26 27 28 29 30
Sp
eci
fic
Po
we
r (k
W-h
r/k
g-L
NG
)
Natural Gas Temperature (C)
The Effect of Natural Gas Inlet Temperature on Specific Power when Natural gas
supplied at 60bar (SMR )
Figure 10: The effect of natural gas supply temperature on specific power when
natural gas supplied at 60bar (SMR-PRICO)
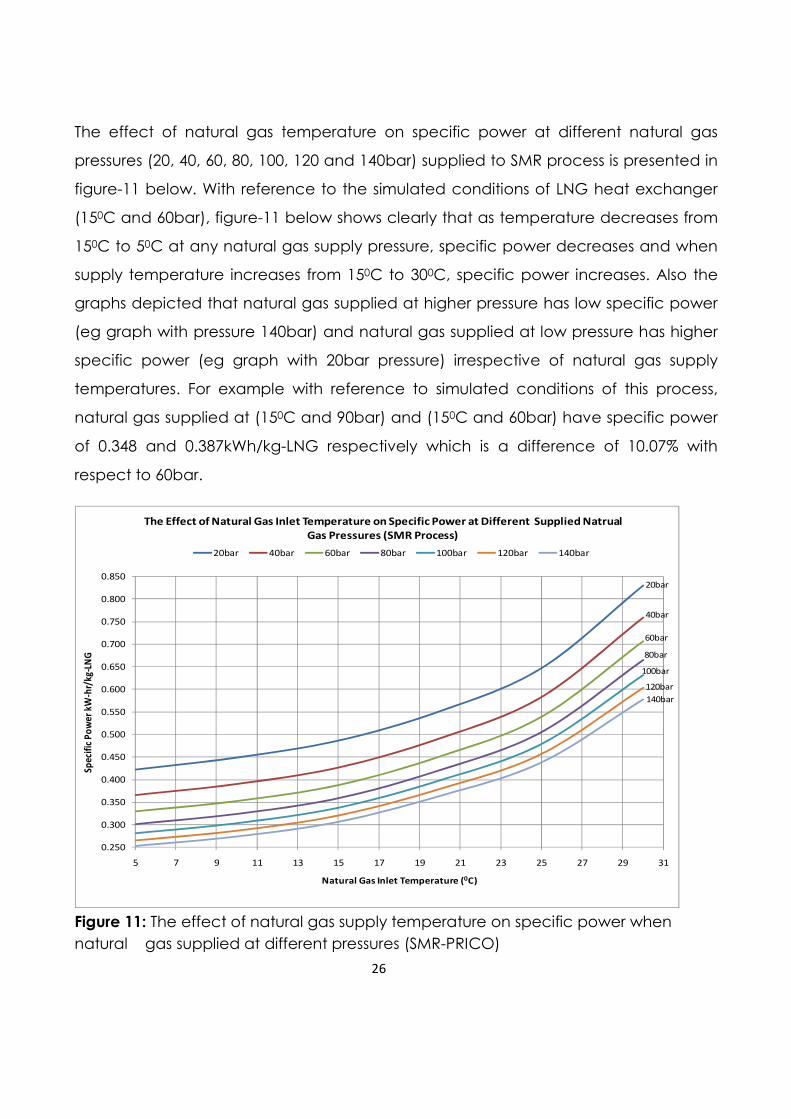
26
The effect of natural gas temperature on specific power at different natural gas
pressures (20, 40, 60, 80, 100, 120 and 140bar) supplied to SMR process is presented in
figure-11 below. With reference to the simulated conditions of LNG heat exchanger
(150C and 60bar), figure-11 below shows clearly that as temperature decreases from
150C to 50C at any natural gas supply pressure, specific power decreases and when
supply temperature increases from 150C to 300C, specific power increases. Also the
graphs depicted that natural gas supplied at higher pressure has low specific power
(eg graph with pressure 140bar) and natural gas supplied at low pressure has higher
specific power (eg graph with 20bar pressure) irrespective of natural gas supply
temperatures. For example with reference to simulated conditions of this process,
natural gas supplied at (150C and 90bar) and (150C and 60bar) have specific power
of 0.348 and 0.387kWh/kg-LNG respectively which is a difference of 10.07% with
respect to 60bar.
0.250
0.300
0.350
0.400
0.450
0.500
0.550
0.600
0.650
0.700
0.750
0.800
0.850
5 7 9 11 13 15 17 19 21 23 25 27 29 31
Spec
ific
Po
we
r kW
-hr/
kg-L
NG
Natural Gas Inlet Temperature (0C)
The Effect of Natural Gas Inlet Temperature on Specific Power at Different Supplied Natrual
Gas Pressures (SMR Process)
20bar 40bar 60bar 80bar 100bar 120bar 140bar
20bar
80bar
40bar
60bar
120bar
100bar
140bar
Figure 11: The effect of natural gas supply temperature on specific power when
natural gas supplied at different pressures (SMR-PRICO)
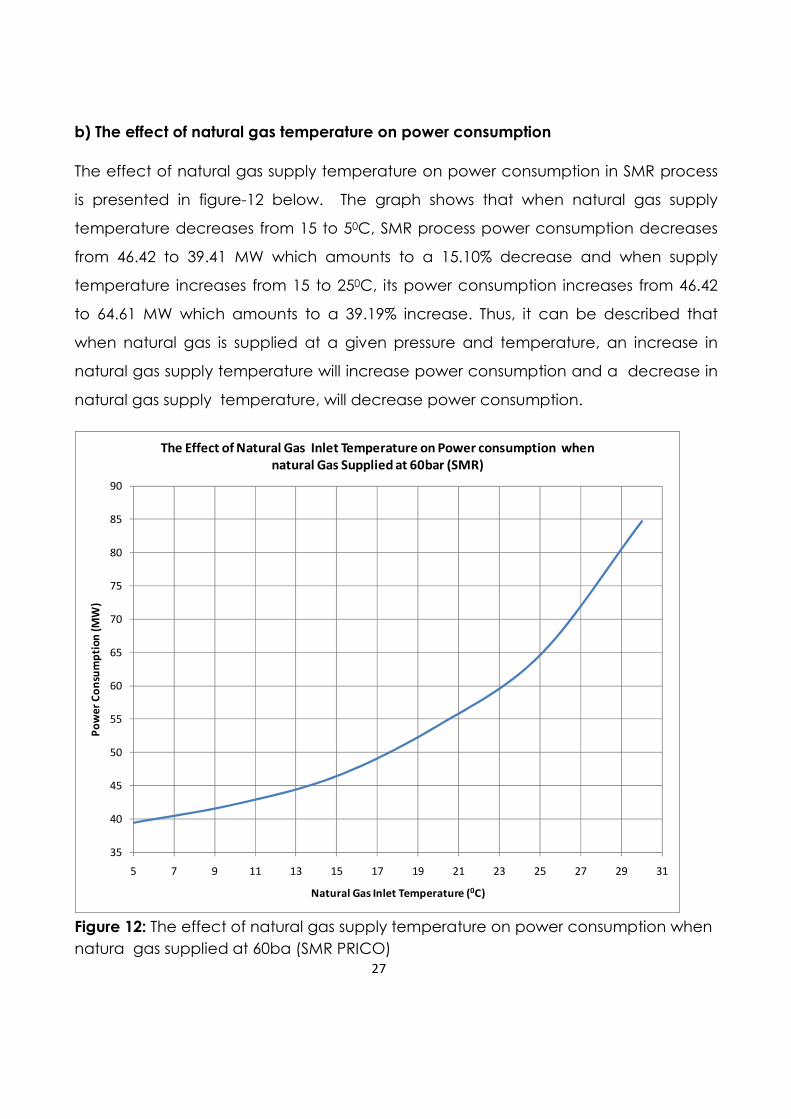
27
b) The effect of natural gas temperature on power consumption
The effect of natural gas supply temperature on power consumption in SMR process
is presented in figure-12 below. The graph shows that when natural gas supply
temperature decreases from 15 to 50C, SMR process power consumption decreases
from 46.42 to 39.41 MW which amounts to a 15.10% decrease and when supply
temperature increases from 15 to 250C, its power consumption increases from 46.42
to 64.61 MW which amounts to a 39.19% increase. Thus, it can be described that
when natural gas is supplied at a given pressure and temperature, an increase in
natural gas supply temperature will increase power consumption and a decrease in
natural gas supply temperature, will decrease power consumption.
35
40
45
50
55
60
65
70
75
80
85
90
5 7 9 11 13 15 17 19 21 23 25 27 29 31
Po
we
r C
on
sum
pti
on
(M
W)
Natural Gas Inlet Temperature (0C)
The Effect of Natural Gas Inlet Temperature on Power consumption when
natural Gas Supplied at 60bar (SMR)
Figure 12: The effect of natural gas supply temperature on power consumption when
natura gas supplied at 60ba (SMR PRICO)
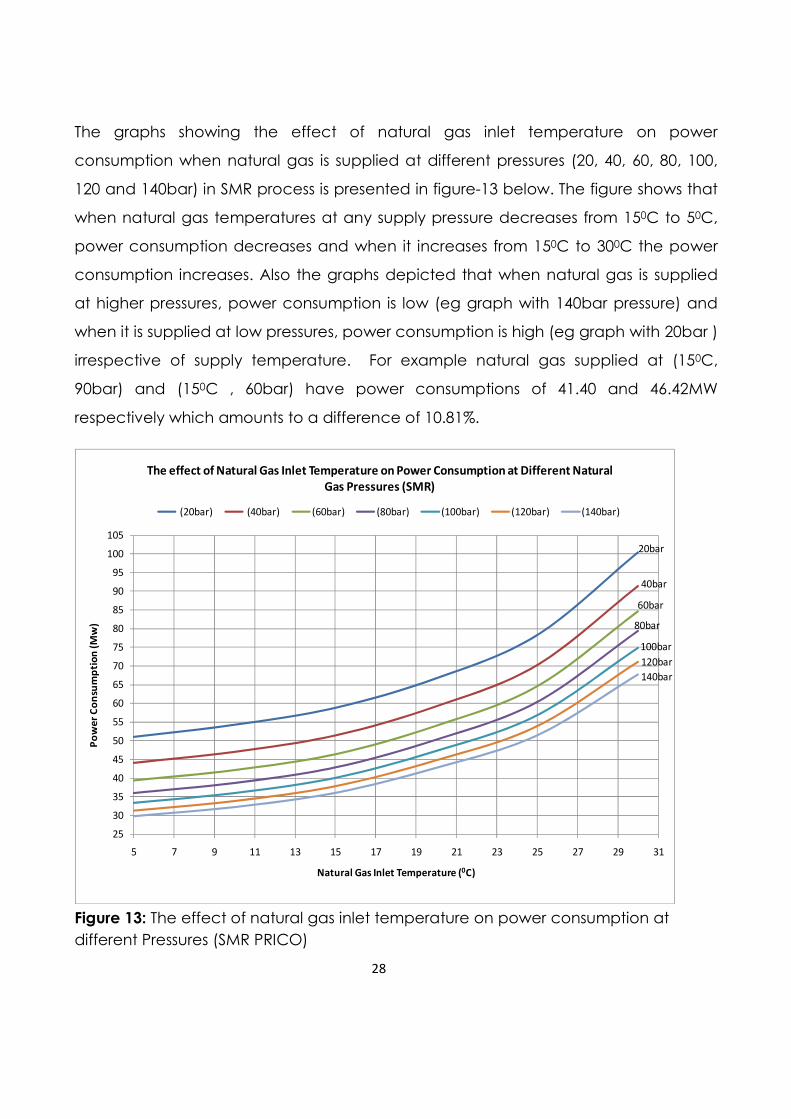
28
The graphs showing the effect of natural gas inlet temperature on power
consumption when natural gas is supplied at different pressures (20, 40, 60, 80, 100,
120 and 140bar) in SMR process is presented in figure-13 below. The figure shows that
when natural gas temperatures at any supply pressure decreases from 150C to 50C,
power consumption decreases and when it increases from 150C to 300C the power
consumption increases. Also the graphs depicted that when natural gas is supplied
at higher pressures, power consumption is low (eg graph with 140bar pressure) and
when it is supplied at low pressures, power consumption is high (eg graph with 20bar )
irrespective of supply temperature. For example natural gas supplied at (150C,
90bar) and (150C , 60bar) have power consumptions of 41.40 and 46.42MW
respectively which amounts to a difference of 10.81%.
25
30
35
40
45
50
55
60
65
70
75
80
85
90
95
100
105
5 7 9 11 13 15 17 19 21 23 25 27 29 31
Po
we
r C
on
sum
pti
on
(M
w)
Natural Gas Inlet Temperature (0C)
The effect of Natural Gas Inlet Temperature on Power Consumption at Different Natural
Gas Pressures (SMR)
(20bar) (40bar) (60bar) (80bar) (100bar) (120bar) (140bar)
140bar
20bar
40bar
60bar
80bar
100bar
120bar
Figure 13: The effect of natural gas inlet temperature on power consumption at
different Pressures (SMR PRICO)
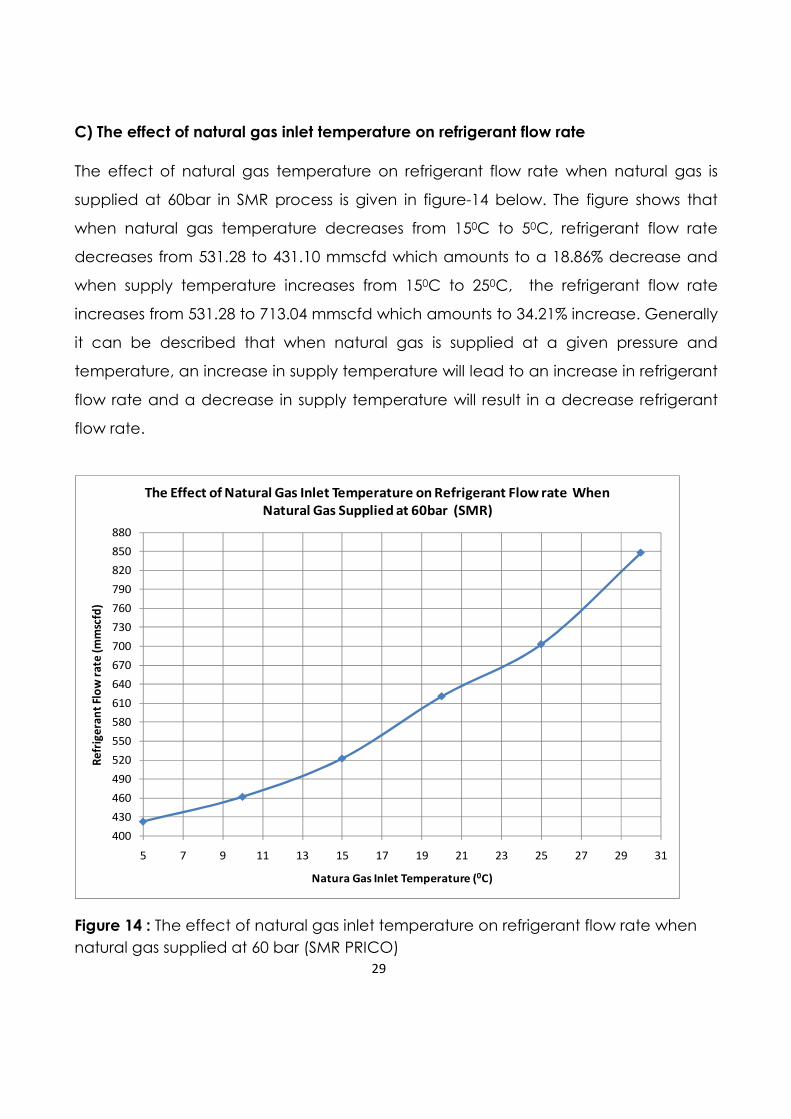
29
C) The effect of natural gas inlet temperature on refrigerant flow rate
The effect of natural gas temperature on refrigerant flow rate when natural gas is
supplied at 60bar in SMR process is given in figure-14 below. The figure shows that
when natural gas temperature decreases from 150C to 50C, refrigerant flow rate
decreases from 531.28 to 431.10 mmscfd which amounts to a 18.86% decrease and
when supply temperature increases from 150C to 250C, the refrigerant flow rate
increases from 531.28 to 713.04 mmscfd which amounts to 34.21% increase. Generally
it can be described that when natural gas is supplied at a given pressure and
temperature, an increase in supply temperature will lead to an increase in refrigerant
flow rate and a decrease in supply temperature will result in a decrease refrigerant
flow rate.
400
430
460
490
520
550
580
610
640
670
700
730
760
790
820
850
880
5 7 9 11 13 15 17 19 21 23 25 27 29 31
Re
frig
era
nt
Flo
w r
ate
(m
msc
fd)
Natura Gas Inlet Temperature (0C)
The Effect of Natural Gas Inlet Temperature on Refrigerant Flow rate When
Natural Gas Supplied at 60bar (SMR)
Figure 14 : The effect of natural gas inlet temperature on refrigerant flow rate when
natural gas supplied at 60 bar (SMR PRICO)
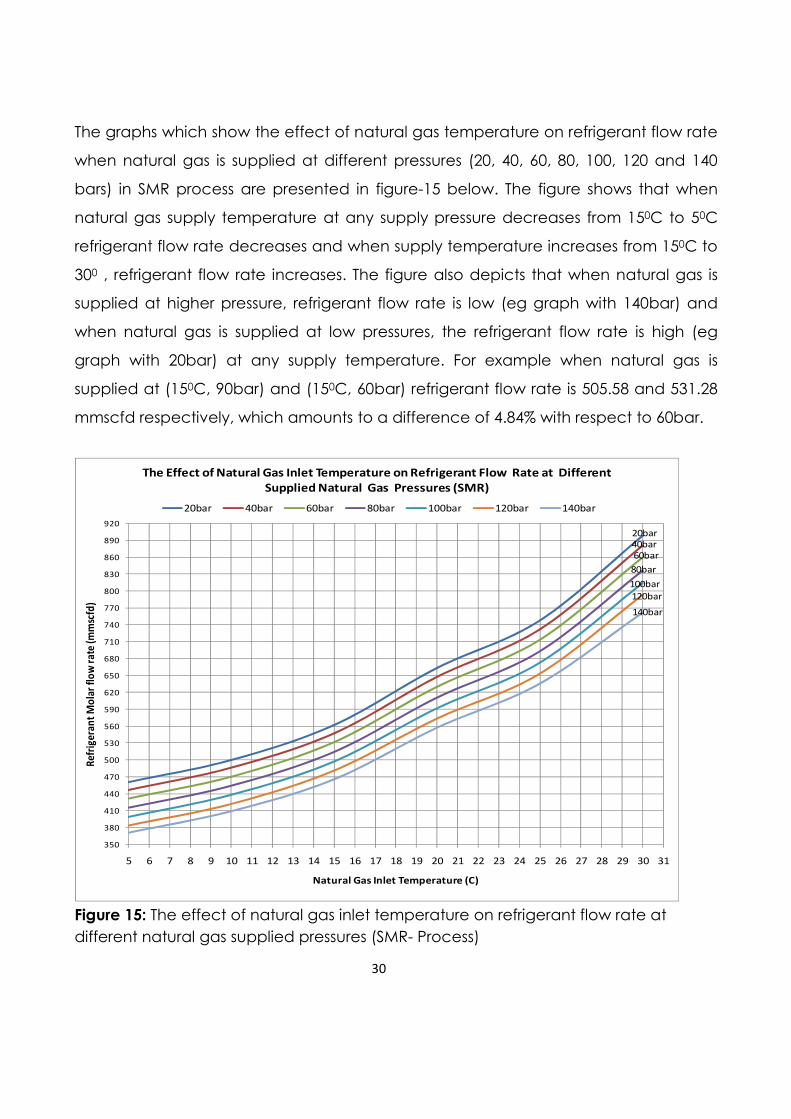
30
The graphs which show the effect of natural gas temperature on refrigerant flow rate
when natural gas is supplied at different pressures (20, 40, 60, 80, 100, 120 and 140
bars) in SMR process are presented in figure-15 below. The figure shows that when
natural gas supply temperature at any supply pressure decreases from 150C to 50C
refrigerant flow rate decreases and when supply temperature increases from 150C to
300 , refrigerant flow rate increases. The figure also depicts that when natural gas is
supplied at higher pressure, refrigerant flow rate is low (eg graph with 140bar) and
when natural gas is supplied at low pressures, the refrigerant flow rate is high (eg
graph with 20bar) at any supply temperature. For example when natural gas is
supplied at (150C, 90bar) and (150C, 60bar) refrigerant flow rate is 505.58 and 531.28
mmscfd respectively, which amounts to a difference of 4.84% with respect to 60bar.
350
380
410
440
470
500
530
560
590
620
650
680
710
740
770
800
830
860
890
920
5 6 7 8 9 10 11 12 13 14 15 16 17 18 19 20 21 22 23 24 25 26 27 28 29 30 31
Ref
rige
ran
t M
ola
r fl
ow
rat
e (m
msc
fd)
Natural Gas Inlet Temperature (C)
The Effect of Natural Gas Inlet Temperature on Refrigerant Flow Rate at Different
Supplied Natural Gas Pressures (SMR)
20bar 40bar 60bar 80bar 100bar 120bar 140bar
20bar
40bar
60bar
80bar
100bar
120bar
140bar
Figure 15: The effect of natural gas inlet temperature on refrigerant flow rate at
different natural gas supplied pressures (SMR- Process)
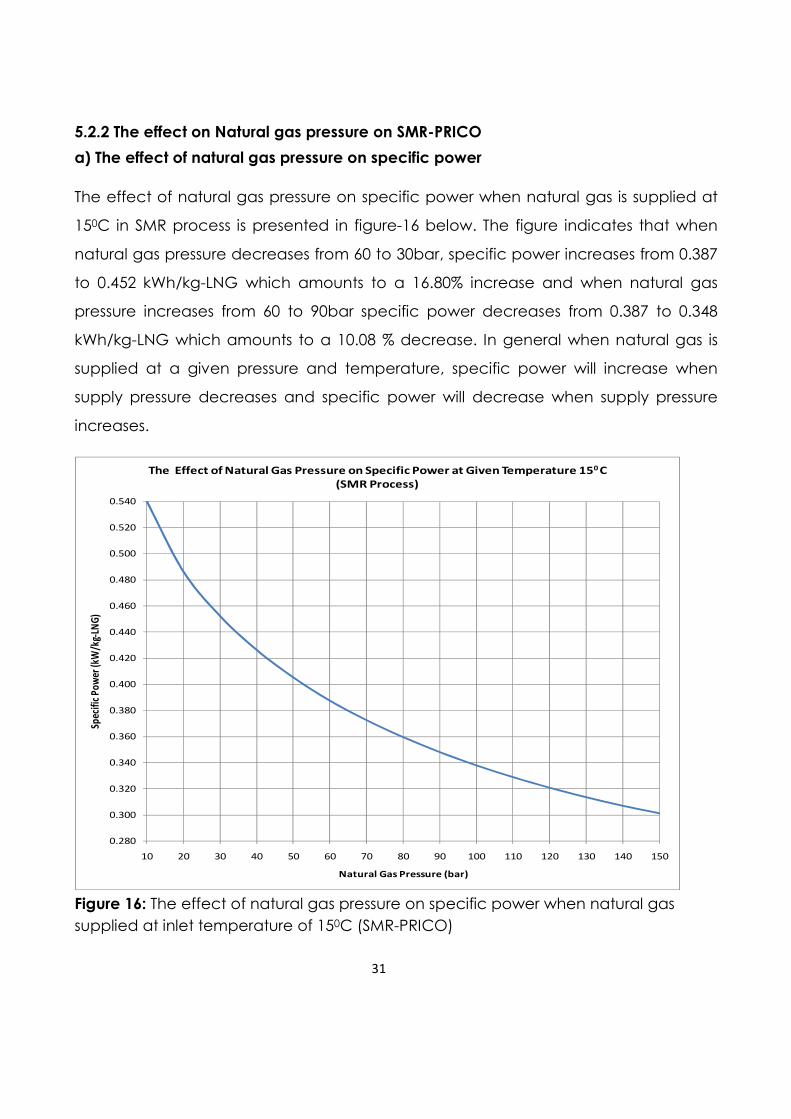
31
5.2.2 The effect on Natural gas pressure on SMR-PRICO
a) The effect of natural gas pressure on specific power
The effect of natural gas pressure on specific power when natural gas is supplied at
150C in SMR process is presented in figure-16 below. The figure indicates that when
natural gas pressure decreases from 60 to 30bar, specific power increases from 0.387
to 0.452 kWh/kg-LNG which amounts to a 16.80% increase and when natural gas
pressure increases from 60 to 90bar specific power decreases from 0.387 to 0.348
kWh/kg-LNG which amounts to a 10.08 % decrease. In general when natural gas is
supplied at a given pressure and temperature, specific power will increase when
supply pressure decreases and specific power will decrease when supply pressure
increases.
0.280
0.300
0.320
0.340
0.360
0.380
0.400
0.420
0.440
0.460
0.480
0.500
0.520
0.540
10 20 30 40 50 60 70 80 90 100 110 120 130 140 150
Spec
ific
Po
wer
(kW
/kg-
LNG
)
Natural Gas Pressure (bar)
The Effect of Natural Gas Pressure on Specific Power at Given Temperature 150 C
(SMR Process)
Figure 16: The effect of natural gas pressure on specific power when natural gas
supplied at inlet temperature of 150C (SMR-PRICO)
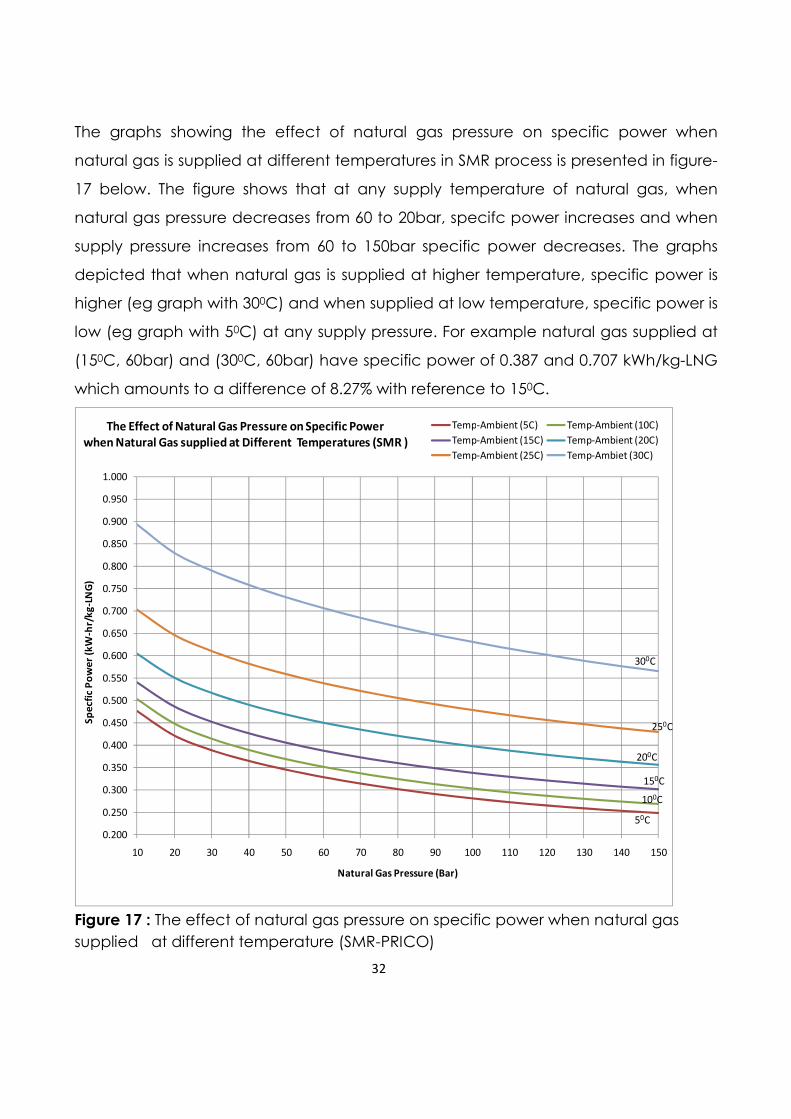
32
The graphs showing the effect of natural gas pressure on specific power when
natural gas is supplied at different temperatures in SMR process is presented in figure-
17 below. The figure shows that at any supply temperature of natural gas, when
natural gas pressure decreases from 60 to 20bar, specifc power increases and when
supply pressure increases from 60 to 150bar specific power decreases. The graphs
depicted that when natural gas is supplied at higher temperature, specific power is
higher (eg graph with 300C) and when supplied at low temperature, specific power is
low (eg graph with 50C) at any supply pressure. For example natural gas supplied at
(150C, 60bar) and (300C, 60bar) have specific power of 0.387 and 0.707 kWh/kg-LNG
which amounts to a difference of 8.27% with reference to 150C.
0.200
0.250
0.300
0.350
0.400
0.450
0.500
0.550
0.600
0.650
0.700
0.750
0.800
0.850
0.900
0.950
1.000
10 20 30 40 50 60 70 80 90 100 110 120 130 140 150
Sp
ecfi
c P
ow
er
(kW
-hr/
kg
-LN
G)
Natural Gas Pressure (Bar)
The Effect of Natural Gas Pressure on Specific Power
when Natural Gas supplied at Different Temperatures (SMR )
Temp-Ambient (5C) Temp-Ambient (10C)
Temp-Ambient (15C) Temp-Ambient (20C)
Temp-Ambient (25C) Temp-Ambiet (30C)
300C
150C
250C
200C
100C
50C
Figure 17 : The effect of natural gas pressure on specific power when natural gas
supplied at different temperature (SMR-PRICO)
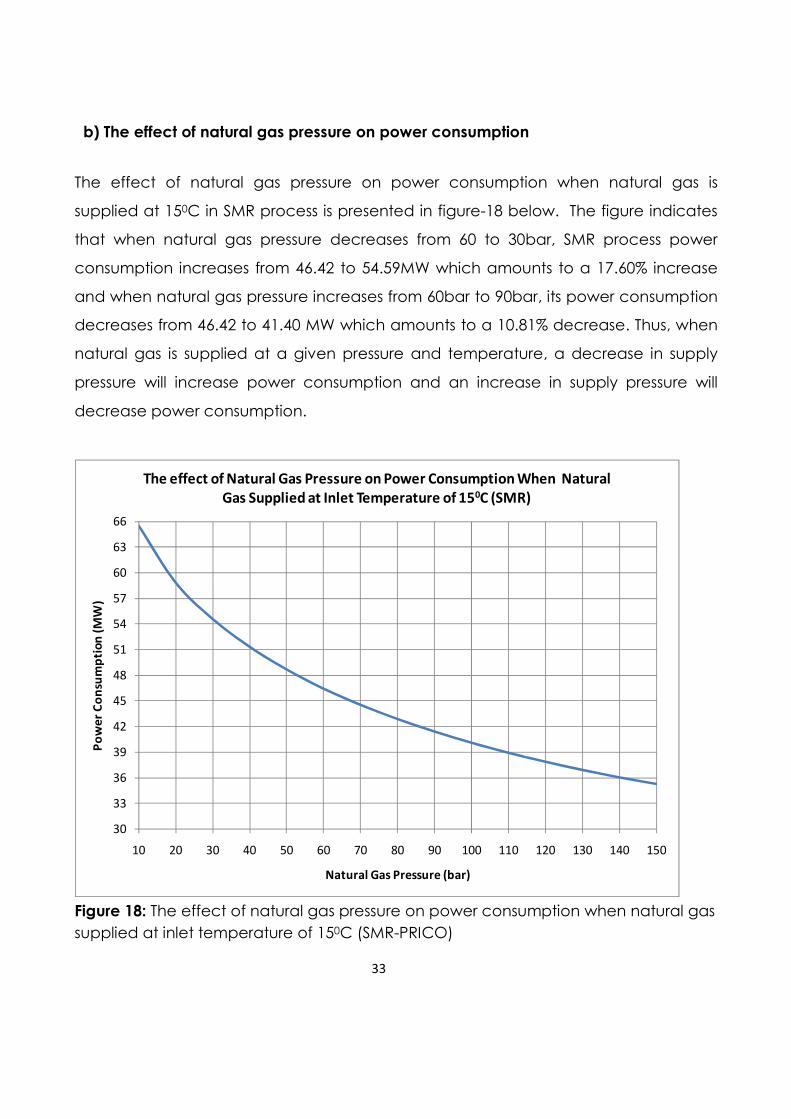
33
b) The effect of natural gas pressure on power consumption
The effect of natural gas pressure on power consumption when natural gas is
supplied at 150C in SMR process is presented in figure-18 below. The figure indicates
that when natural gas pressure decreases from 60 to 30bar, SMR process power
consumption increases from 46.42 to 54.59MW which amounts to a 17.60% increase
and when natural gas pressure increases from 60bar to 90bar, its power consumption
decreases from 46.42 to 41.40 MW which amounts to a 10.81% decrease. Thus, when
natural gas is supplied at a given pressure and temperature, a decrease in supply
pressure will increase power consumption and an increase in supply pressure will
decrease power consumption.
30
33
36
39
42
45
48
51
54
57
60
63
66
10 20 30 40 50 60 70 80 90 100 110 120 130 140 150
Po
we
r C
on
sum
pti
on
(M
W)
Natural Gas Pressure (bar)
The effect of Natural Gas Pressure on Power Consumption When Natural
Gas Supplied at Inlet Temperature of 150C (SMR)
Figure 18: The effect of natural gas pressure on power consumption when natural gas
supplied at inlet temperature of 150C (SMR-PRICO)
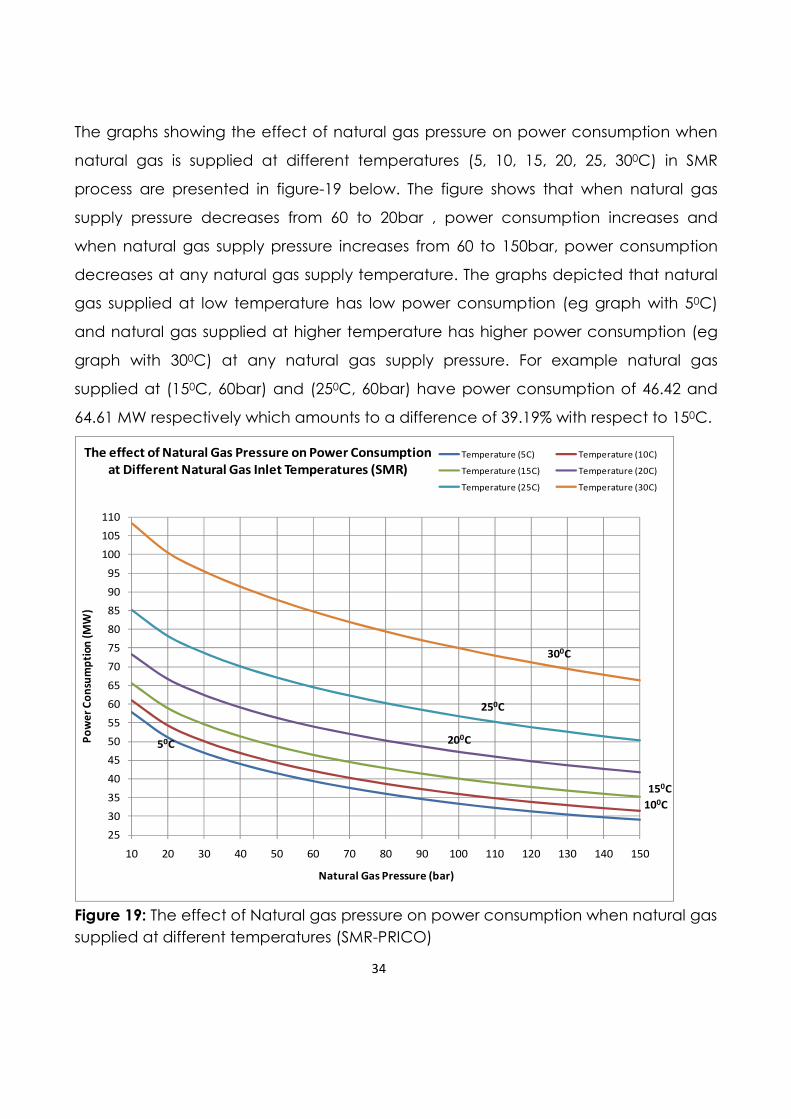
34
The graphs showing the effect of natural gas pressure on power consumption when
natural gas is supplied at different temperatures (5, 10, 15, 20, 25, 300C) in SMR
process are presented in figure-19 below. The figure shows that when natural gas
supply pressure decreases from 60 to 20bar , power consumption increases and
when natural gas supply pressure increases from 60 to 150bar, power consumption
decreases at any natural gas supply temperature. The graphs depicted that natural
gas supplied at low temperature has low power consumption (eg graph with 50C)
and natural gas supplied at higher temperature has higher power consumption (eg
graph with 300C) at any natural gas supply pressure. For example natural gas
supplied at (150C, 60bar) and (250C, 60bar) have power consumption of 46.42 and
64.61 MW respectively which amounts to a difference of 39.19% with respect to 150C.
25
30
35
40
45
50
55
60
65
70
75
80
85
90
95
100
105
110
10 20 30 40 50 60 70 80 90 100 110 120 130 140 150
Po
we
r C
on
sum
pti
on
(M
W)
Natural Gas Pressure (bar)
The effect of Natural Gas Pressure on Power Consumption
at Different Natural Gas Inlet Temperatures (SMR)
Temperature (5C) Temperature (10C)
Temperature (15C) Temperature (20C)
Temperature (25C) Temperature (30C)
300C
250C
200C
150C
50C
100C
Figure 19: The effect of Natural gas pressure on power consumption when natural gas
supplied at different temperatures (SMR-PRICO)
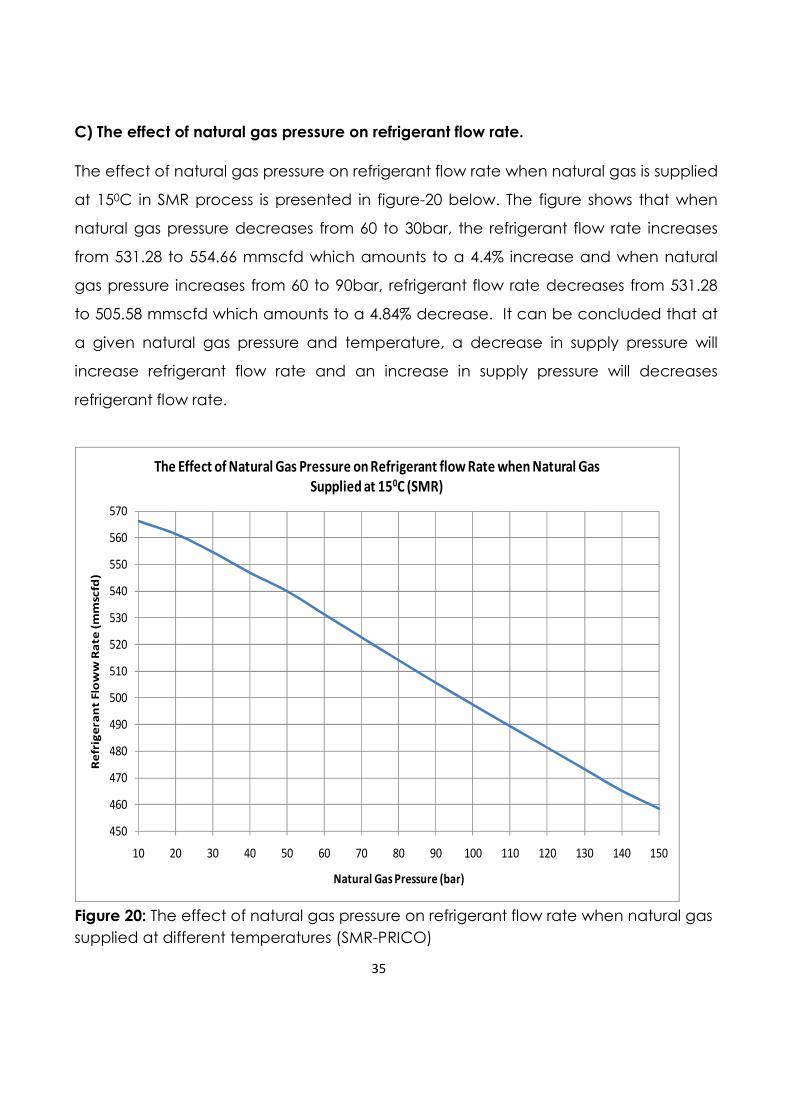
35
C) The effect of natural gas pressure on refrigerant flow rate.
The effect of natural gas pressure on refrigerant flow rate when natural gas is supplied
at 150C in SMR process is presented in figure-20 below. The figure shows that when
natural gas pressure decreases from 60 to 30bar, the refrigerant flow rate increases
from 531.28 to 554.66 mmscfd which amounts to a 4.4% increase and when natural
gas pressure increases from 60 to 90bar, refrigerant flow rate decreases from 531.28
to 505.58 mmscfd which amounts to a 4.84% decrease. It can be concluded that at
a given natural gas pressure and temperature, a decrease in supply pressure will
increase refrigerant flow rate and an increase in supply pressure will decreases
refrigerant flow rate.
450
460
470
480
490
500
510
520
530
540
550
560
570
10 20 30 40 50 60 70 80 90 100 110 120 130 140 150
Re
frig
era
nt
Flo
ww
Ra
te (
mm
scfd
)
Natural Gas Pressure (bar)
The Effect of Natural Gas Pressure on Refrigerant flow Rate when Natural Gas
Supplied at 150C (SMR)
Figure 20: The effect of natural gas pressure on refrigerant flow rate when natural gas
supplied at different temperatures (SMR-PRICO)
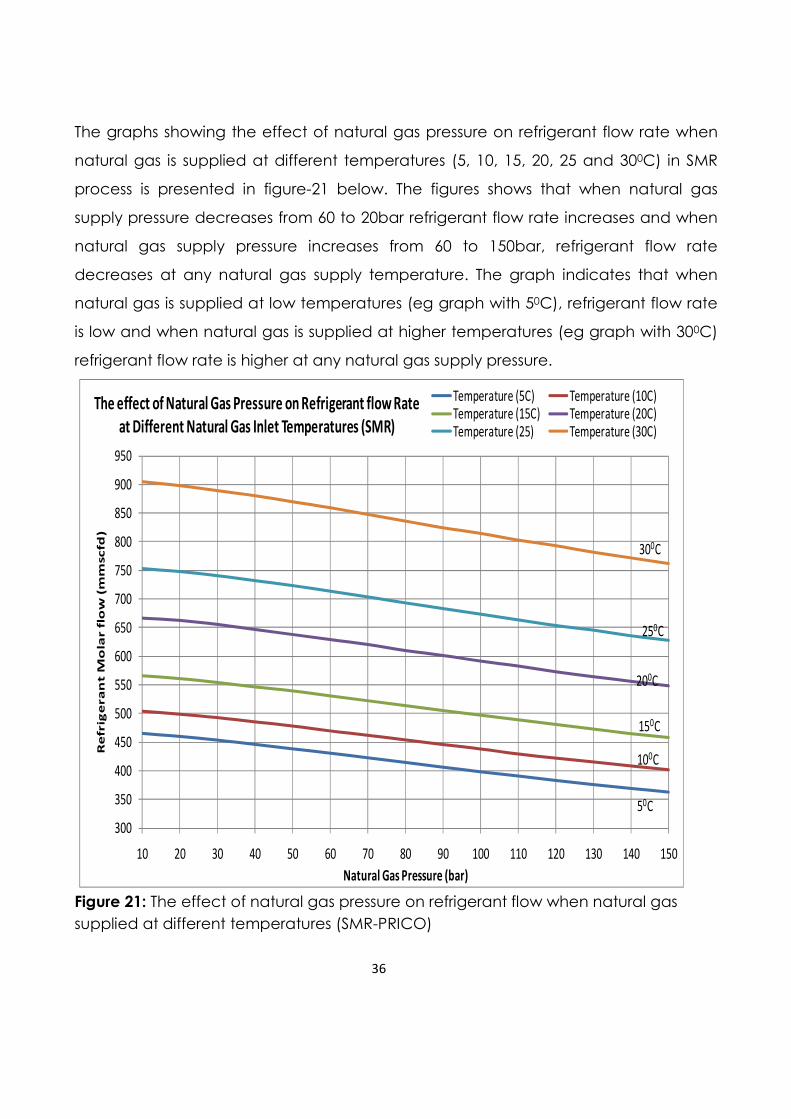
36
The graphs showing the effect of natural gas pressure on refrigerant flow rate when
natural gas is supplied at different temperatures (5, 10, 15, 20, 25 and 300C) in SMR
process is presented in figure-21 below. The figures shows that when natural gas
supply pressure decreases from 60 to 20bar refrigerant flow rate increases and when
natural gas supply pressure increases from 60 to 150bar, refrigerant flow rate
decreases at any natural gas supply temperature. The graph indicates that when
natural gas is supplied at low temperatures (eg graph with 50C), refrigerant flow rate
is low and when natural gas is supplied at higher temperatures (eg graph with 300C)
refrigerant flow rate is higher at any natural gas supply pressure.
300
350
400
450
500
550
600
650
700
750
800
850
900
950
10 20 30 40 50 60 70 80 90 100 110 120 130 140 150
Re
frig
era
nt M
ola
r f
low
(m
mscfd
)
Natural Gas Pressure (bar)
The effect of Natural Gas Pressure on Refrigerant flow Rate
at Different Natural Gas Inlet Temperatures (SMR)
Temperature (5C) Temperature (10C)
Temperature (15C) Temperature (20C)
Temperature (25) Temperature (30C)
300C
250C
200C
150C
100C
50C
Figure 21: The effect of natural gas pressure on refrigerant flow when natural gas
supplied at different temperatures (SMR-PRICO)
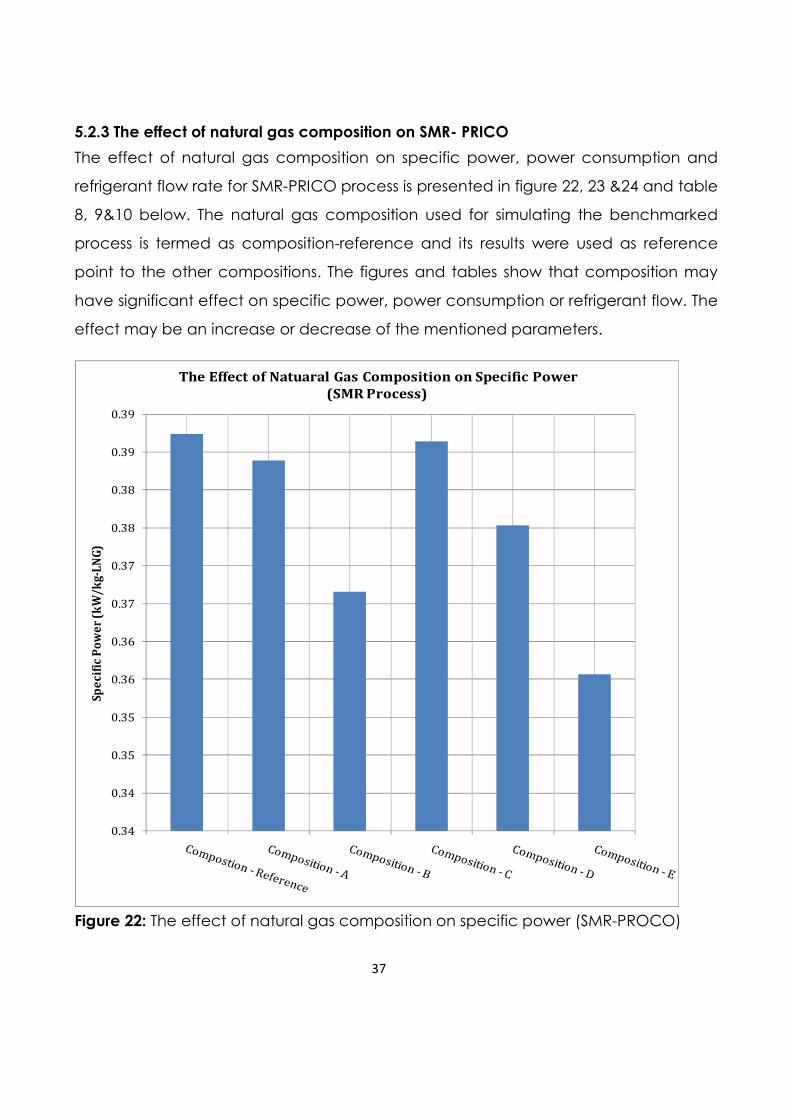
37
5.2.3 The effect of natural gas composition on SMR- PRICO
The effect of natural gas composition on specific power, power consumption and
refrigerant flow rate for SMR-PRICO process is presented in figure 22, 23 &24 and table
8, 9&10 below. The natural gas composition used for simulating the benchmarked
process is termed as composition-reference and its results were used as reference
point to the other compositions. The figures and tables show that composition may
have significant effect on specific power, power consumption or refrigerant flow. The
effect may be an increase or decrease of the mentioned parameters.
0.34
0.34
0.35
0.35
0.36
0.36
0.37
0.37
0.38
0.38
0.39
0.39
Sp
ec
ific
Po
we
r (k
W/
kg
-LN
G)
The Effect of Natuaral Gas Composition on Specific Power
(SMR Process)
Figure 22: The effect of natural gas composition on specific power (SMR-PROCO)
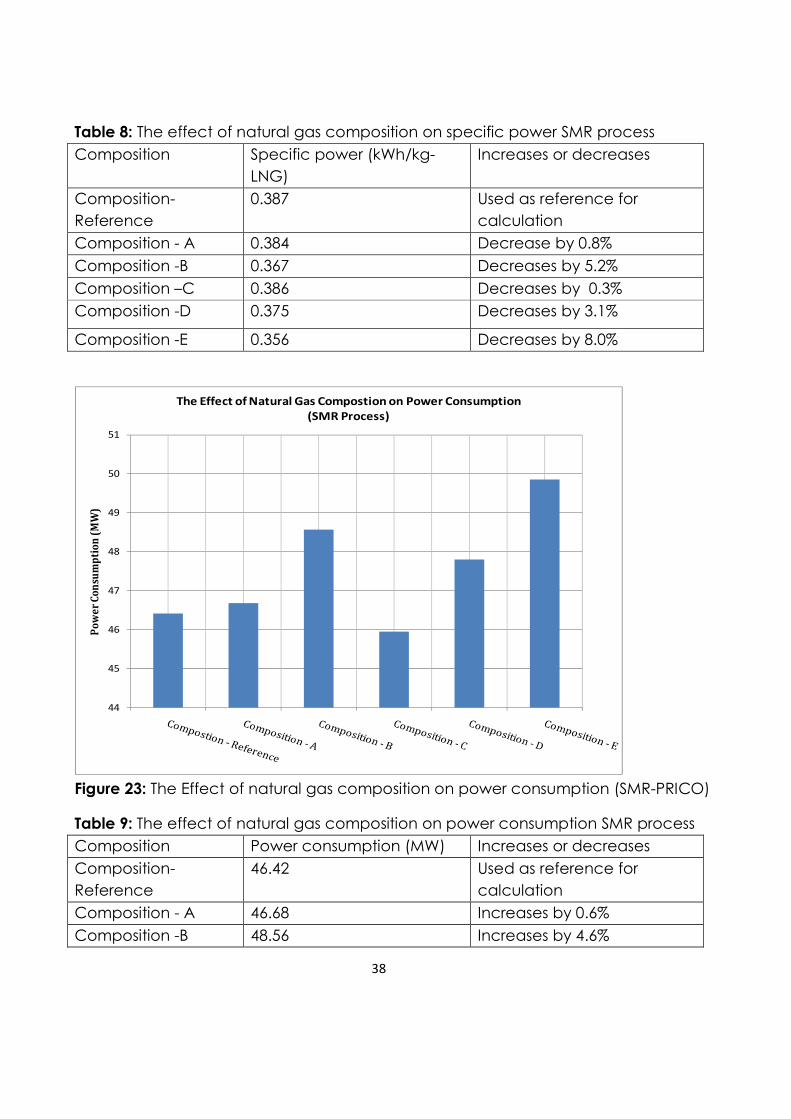
38
Table 8: The effect of natural gas composition on specific power SMR process
Composition Specific power (kWh/kg-
LNG)
Increases or decreases
Composition-
Reference
0.387 Used as reference for
calculation
Composition - A 0.384 Decrease by 0.8%
Composition -B 0.367 Decreases by 5.2%
Composition –C 0.386 Decreases by 0.3%
Composition -D 0.375 Decreases by 3.1%
Composition -E 0.356 Decreases by 8.0%
44
45
46
47
48
49
50
51
Po
we
r C
on
sum
pti
on
(M
W)
The Effect of Natural Gas Compostion on Power Consumption
(SMR Process)
Figure 23: The Effect of natural gas composition on power consumption (SMR-PRICO)
Table 9: The effect of natural gas composition on power consumption SMR process
Composition Power consumption (MW) Increases or decreases
Composition-
Reference
46.42 Used as reference for
calculation
Composition - A 46.68 Increases by 0.6%
Composition -B 48.56 Increases by 4.6%
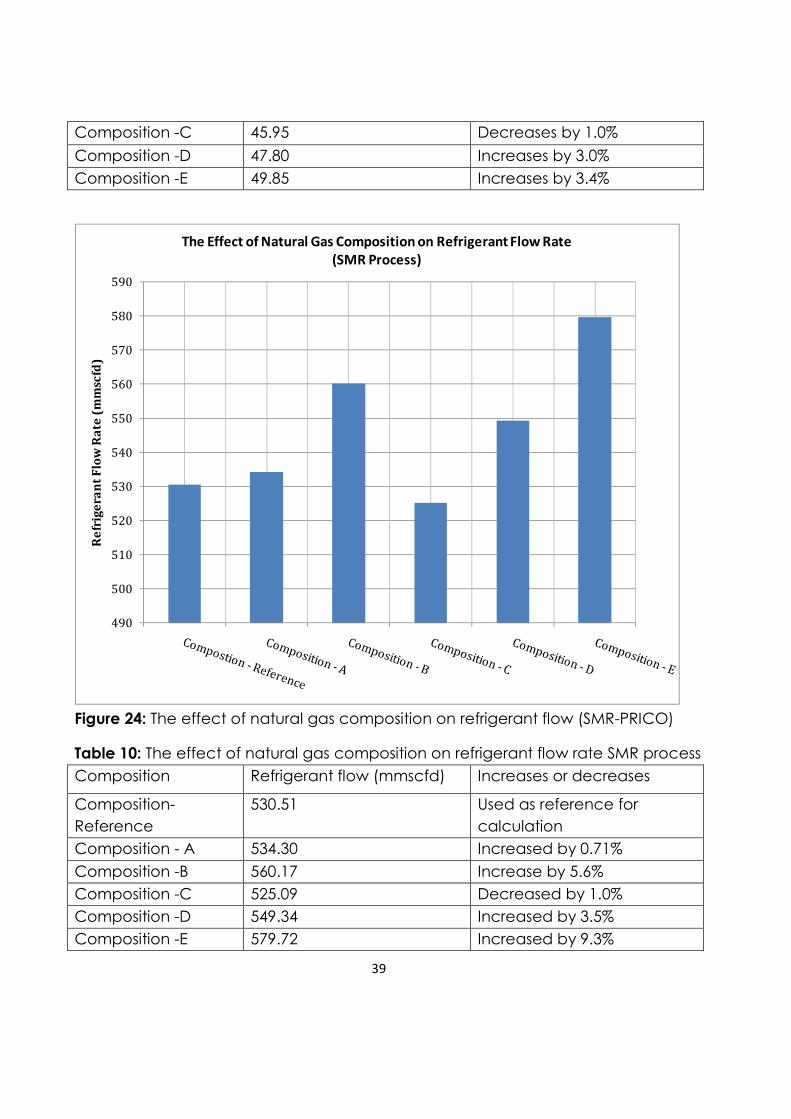
39
Composition -C 45.95 Decreases by 1.0%
Composition -D 47.80 Increases by 3.0%
Composition -E 49.85 Increases by 3.4%
490
500
510
520
530
540
550
560
570
580
590
Re
frig
era
nt
Flo
w R
ate
(m
msc
fd)
The Effect of Natural Gas Composition on Refrigerant Flow Rate
(SMR Process)
Figure 24: The effect of natural gas composition on refrigerant flow (SMR-PRICO)
Table 10: The effect of natural gas composition on refrigerant flow rate SMR process
Composition Refrigerant flow (mmscfd) Increases or decreases
Composition-
Reference
530.51 Used as reference for
calculation
Composition - A 534.30 Increased by 0.71%
Composition -B 560.17 Increase by 5.6%
Composition -C 525.09 Decreased by 1.0%
Composition -D 549.34 Increased by 3.5%
Composition -E 579.72 Increased by 9.3%
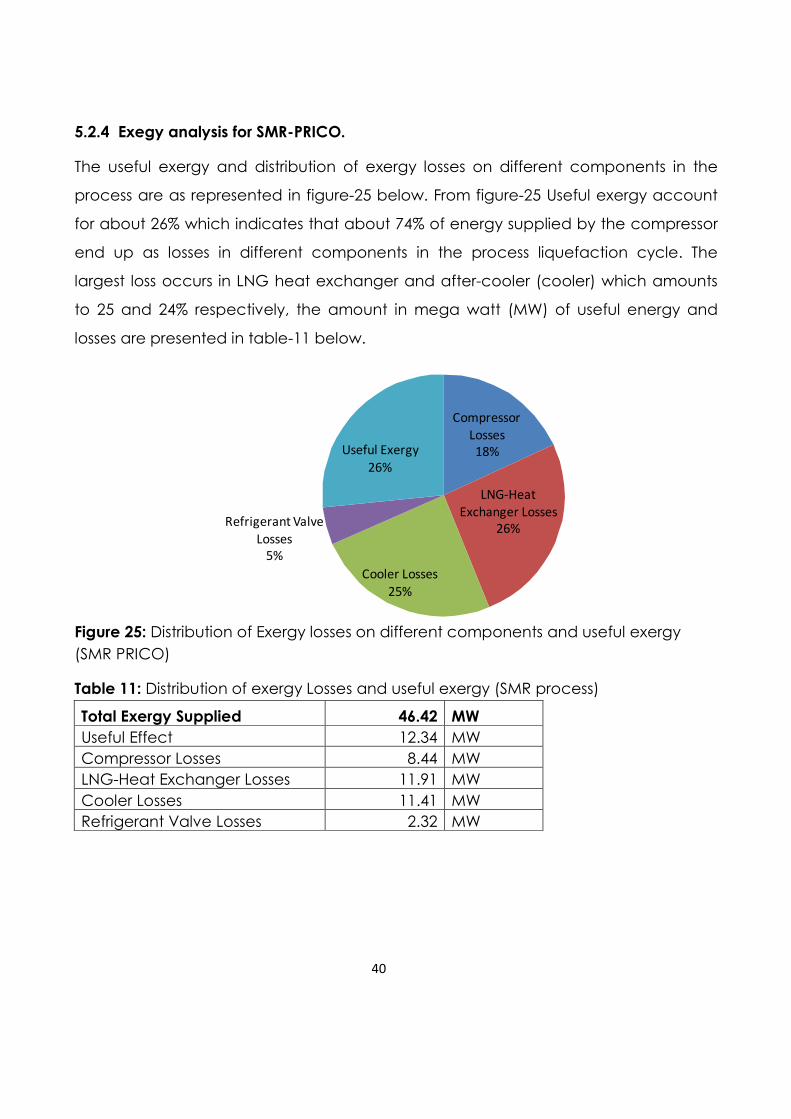
40
5.2.4 Exegy analysis for SMR-PRICO.
The useful exergy and distribution of exergy losses on different components in the
process are as represented in figure-25 below. From figure-25 Useful exergy account
for about 26% which indicates that about 74% of energy supplied by the compressor
end up as losses in different components in the process liquefaction cycle. The
largest loss occurs in LNG heat exchanger and after-cooler (cooler) which amounts
to 25 and 24% respectively, the amount in mega watt (MW) of useful energy and
losses are presented in table-11 below.
Compressor
Losses
18%
LNG-Heat
Exchanger Losses
26%
Cooler Losses
25%
Refrigerant Valve
Losses
5%
Useful Exergy
26%
Figure 25: Distribution of Exergy losses on different components and useful exergy
(SMR PRICO)
Table 11: Distribution of exergy Losses and useful exergy (SMR process)
Total Exergy Supplied 46.42 MW
Useful Effect 12.34 MW
Compressor Losses 8.44 MW
LNG-Heat Exchanger Losses 11.91 MW
Cooler Losses 11.41 MW
Refrigerant Valve Losses 2.32 MW
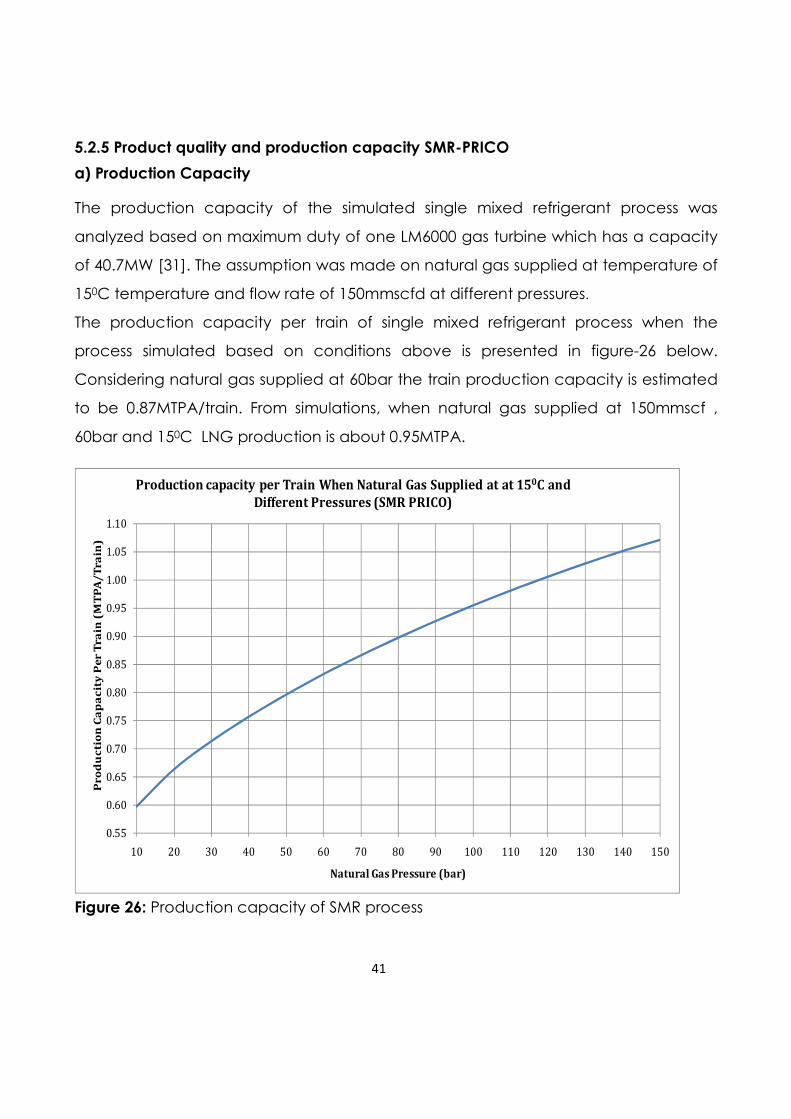
41
5.2.5 Product quality and production capacity SMR-PRICO
a) Production Capacity
The production capacity of the simulated single mixed refrigerant process was
analyzed based on maximum duty of one LM6000 gas turbine which has a capacity
of 40.7MW [31]. The assumption was made on natural gas supplied at temperature of
150C temperature and flow rate of 150mmscfd at different pressures.
The production capacity per train of single mixed refrigerant process when the
process simulated based on conditions above is presented in figure-26 below.
Considering natural gas supplied at 60bar the train production capacity is estimated
to be 0.87MTPA/train. From simulations, when natural gas supplied at 150mmscf ,
60bar and 150C LNG production is about 0.95MTPA.
0.55
0.60
0.65
0.70
0.75
0.80
0.85
0.90
0.95
1.00
1.05
1.10
10 20 30 40 50 60 70 80 90 100 110 120 130 140 150
Pr
od
uc
tio
n C
ap
ac
ity
Pe
r T
ra
in (
MT
PA
/T
ra
in)
Natural Gas Pressure (bar)
Production capacity per Train When Natural Gas Supplied at at 150C and
Different Pressures (SMR PRICO)
Figure 26: Production capacity of SMR process
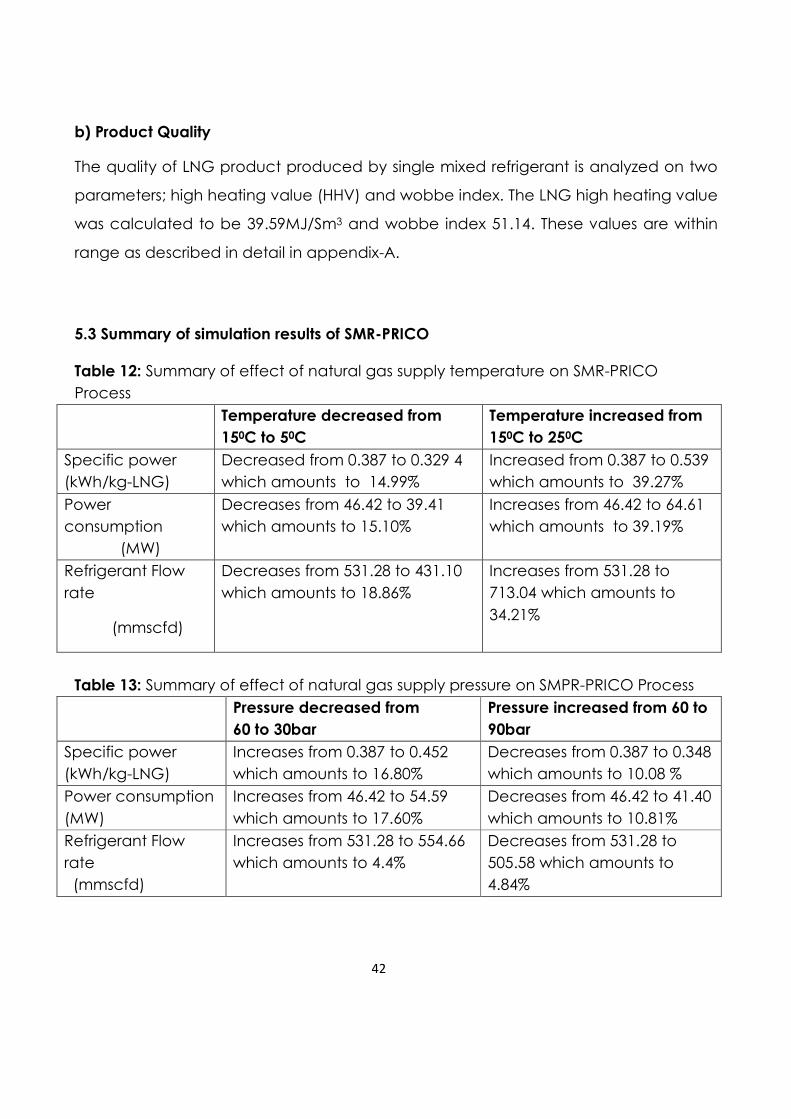
42
b) Product Quality
The quality of LNG product produced by single mixed refrigerant is analyzed on two
parameters; high heating value (HHV) and wobbe index. The LNG high heating value
was calculated to be 39.59MJ/Sm3 and wobbe index 51.14. These values are within
range as described in detail in appendix-A.
5.3 Summary of simulation results of SMR-PRICO
Table 12: Summary of effect of natural gas supply temperature on SMR-PRICO
Process
Temperature decreased from
150C to 50C
Temperature increased from
150C to 250C
Specific power
(kWh/kg-LNG)
Decreased from 0.387 to 0.329 4
which amounts to 14.99%
Increased from 0.387 to 0.539
which amounts to 39.27%
Power
consumption
(MW)
Decreases from 46.42 to 39.41
which amounts to 15.10%
Increases from 46.42 to 64.61
which amounts to 39.19%
Refrigerant Flow
rate
(mmscfd)
Decreases from 531.28 to 431.10
which amounts to 18.86%
Increases from 531.28 to
713.04 which amounts to
34.21%
Table 13: Summary of effect of natural gas supply pressure on SMPR-PRICO Process
Pressure decreased from
60 to 30bar
Pressure increased from 60 to
90bar
Specific power
(kWh/kg-LNG)
Increases from 0.387 to 0.452
which amounts to 16.80%
Decreases from 0.387 to 0.348
which amounts to 10.08 %
Power consumption
(MW)
Increases from 46.42 to 54.59
which amounts to 17.60%
Decreases from 46.42 to 41.40
which amounts to 10.81%
Refrigerant Flow
rate
(mmscfd)
Increases from 531.28 to 554.66
which amounts to 4.4%
Decreases from 531.28 to
505.58 which amounts to
4.84%
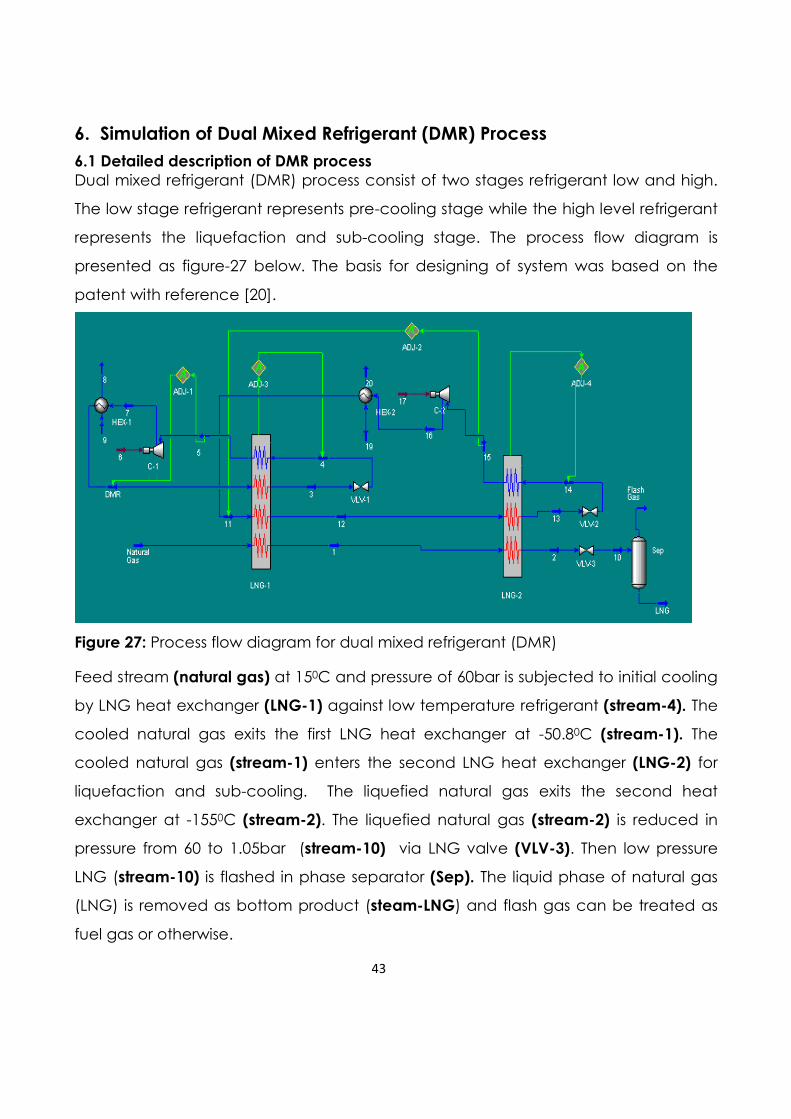
43
6. Simulation of Dual Mixed Refrigerant (DMR) Process
6.1 Detailed description of DMR process
Dual mixed refrigerant (DMR) process consist of two stages refrigerant low and high.
The low stage refrigerant represents pre-cooling stage while the high level refrigerant
represents the liquefaction and sub-cooling stage. The process flow diagram is
presented as figure-27 below. The basis for designing of system was based on the
patent with reference [20].
Figure 27: Process flow diagram for dual mixed refrigerant (DMR)
Feed stream (natural gas) at 150C and pressure of 60bar is subjected to initial cooling
by LNG heat exchanger (LNG-1) against low temperature refrigerant (stream-4). The
cooled natural gas exits the first LNG heat exchanger at -50.80C (stream-1). The
cooled natural gas (stream-1) enters the second LNG heat exchanger (LNG-2) for
liquefaction and sub-cooling. The liquefied natural gas exits the second heat
exchanger at -1550C (stream-2). The liquefied natural gas (stream-2) is reduced in
pressure from 60 to 1.05bar (stream-10) via LNG valve (VLV-3). Then low pressure
LNG (stream-10) is flashed in phase separator (Sep). The liquid phase of natural gas
(LNG) is removed as bottom product (steam-LNG) and flash gas can be treated as
fuel gas or otherwise.

44
The low level or pre-cooling refrigerant passes only in the first stage LNG heat
exchanger (LNG-1). The low level refrigerant (stream-DMR) enters the first stage LNG
heat exchanger at 150C and 40bar and its temperature is reduced to -50.80C
(stream-3) by low temperature refrigerant (steam-4) . The cooled refrigerant
(stream-3) is reduced in pressure from 40 to 3.069bar and its temperature decreases
from -50.80C to -53.710C respectively via throttling through the valve (VLV-1). The low
pressure and temperature refrigerant (stream-4) enters LNG heat exchanger (LNG-1)
and is evaporated by absorbing heat from three streams, warm low level refrigerant
(stream-DMR), warm high level refrigerant (stream-11) and natural gas (stream-
natural gas) . The vaporized refrigerant (stream-5) at 100C returns to the compressor
(C-1) , pressure and temperature are increased to 40bar and 151.10C respectively.
The high pressure and temperature refrigerant is cooled to 150C in heat exchanger
(HEX-1) and enters LNG heat exchanger (LNG-1) as warm refrigerant (stream-DMR).
The low level cycle is repeated as described above. The refrigerant flow rate for low
level cycle is 181mmscfd.
The high level refrigerant at 30bar and 150C (stream-11) enters the first stage LNG
heat exchange (LNG-1) and cooled to -50.80C (stream-12) by low temperature
refrigerant (stream-4). The pre-cooled high level refrigerant (stream-12) enters the
second stage LNG heat exchanger (LNG-2) and is further cooled to -1550C (stream-
13). The pressure of (stream-13) is reduced to 2.99bar and its temperature decreased
to -157.90C (stream-14). The low temperature high level refrigerant (stream-14) enters
the second LNG heat (LNG-2) exchanger and is vaporized by absorbing heat from
two streams, pre-cooled high level refrigerant (stream-12) and natural gas (stream-
1). The vaporized high level refrigerant (stream-15) returns to the compressor (C-2),
pressure and temperature are increased to 30bar and 108.70C respectively. The high
pressure and temperature refrigerant (stream-16) is cooled in heat exchanger (HEX-
2) to 150C (stream-11). Stream-11 enters first stage LNG heat exchanger (LNG-1) and
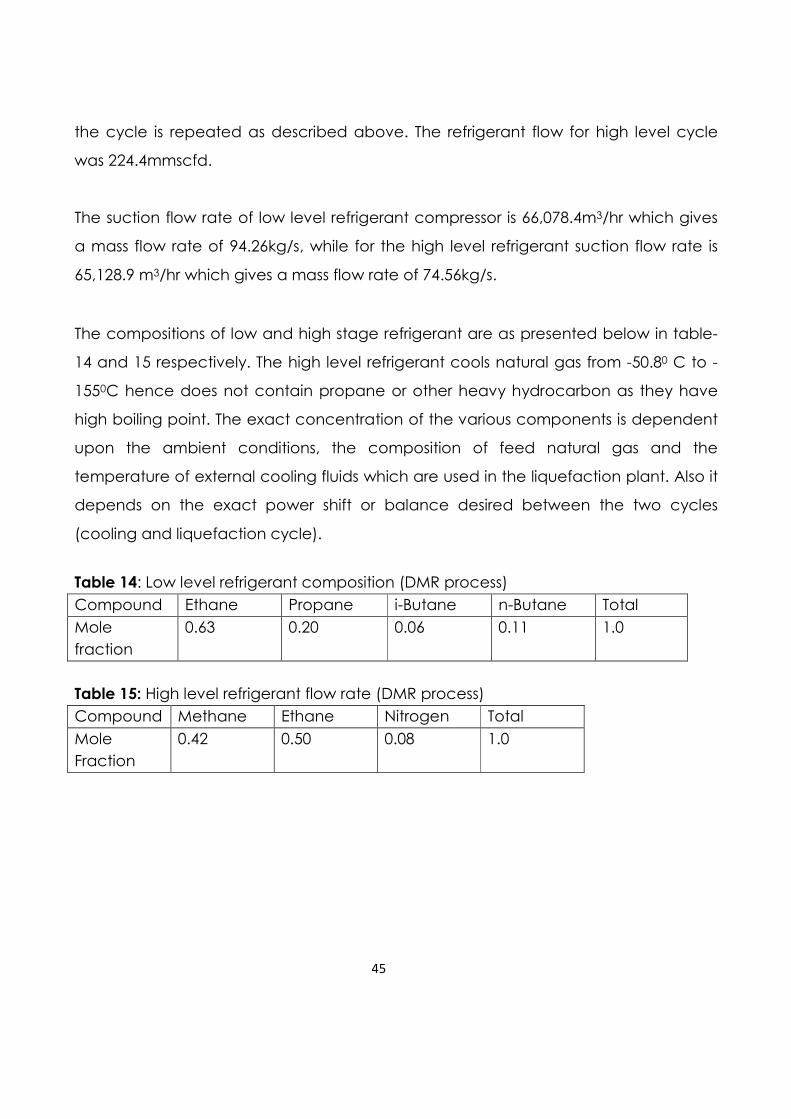
45
the cycle is repeated as described above. The refrigerant flow for high level cycle
was 224.4mmscfd.
The suction flow rate of low level refrigerant compressor is 66,078.4m3/hr which gives
a mass flow rate of 94.26kg/s, while for the high level refrigerant suction flow rate is
65,128.9 m3/hr which gives a mass flow rate of 74.56kg/s.
The compositions of low and high stage refrigerant are as presented below in table-
14 and 15 respectively. The high level refrigerant cools natural gas from -50.80 C to -
1550C hence does not contain propane or other heavy hydrocarbon as they have
high boiling point. The exact concentration of the various components is dependent
upon the ambient conditions, the composition of feed natural gas and the
temperature of external cooling fluids which are used in the liquefaction plant. Also it
depends on the exact power shift or balance desired between the two cycles
(cooling and liquefaction cycle).
Table 14: Low level refrigerant composition (DMR process)
Compound Ethane Propane i-Butane n-Butane Total
Mole
fraction
0.63 0.20 0.06 0.11 1.0
Table 15: High level refrigerant flow rate (DMR process)
Compound Methane Ethane Nitrogen Total
Mole
Fraction
0.42 0.50 0.08 1.0
46
6.2 Simulation results for dual mixed refrigerant process (DMR)
The hysys simulation of DMR process was based on detailed descriptions as presented
on section 6.1 above. In the simulation LNG heat exchangers “UA” values was
calculated to be 5,213.25kW/0C for LNG heat exchanger LNG-1 and 4,691.53kW/0C
for LNG heat exchanger LNG-2 at minimum approach temperature of 2.90C for both
LNG heat exchangers and LMTD of 9.4 and 10.20C for LNG-1 and LNG-2 respectively.
The specific power of the process based on the simulated conditions was calculated
to 0.353kWh/kg-LNG. The calculated “UA” values of the LNG heat exchangers were
kept constant during simulation by varying refrigerant flow rate and refrigerant
evaporating pressure.
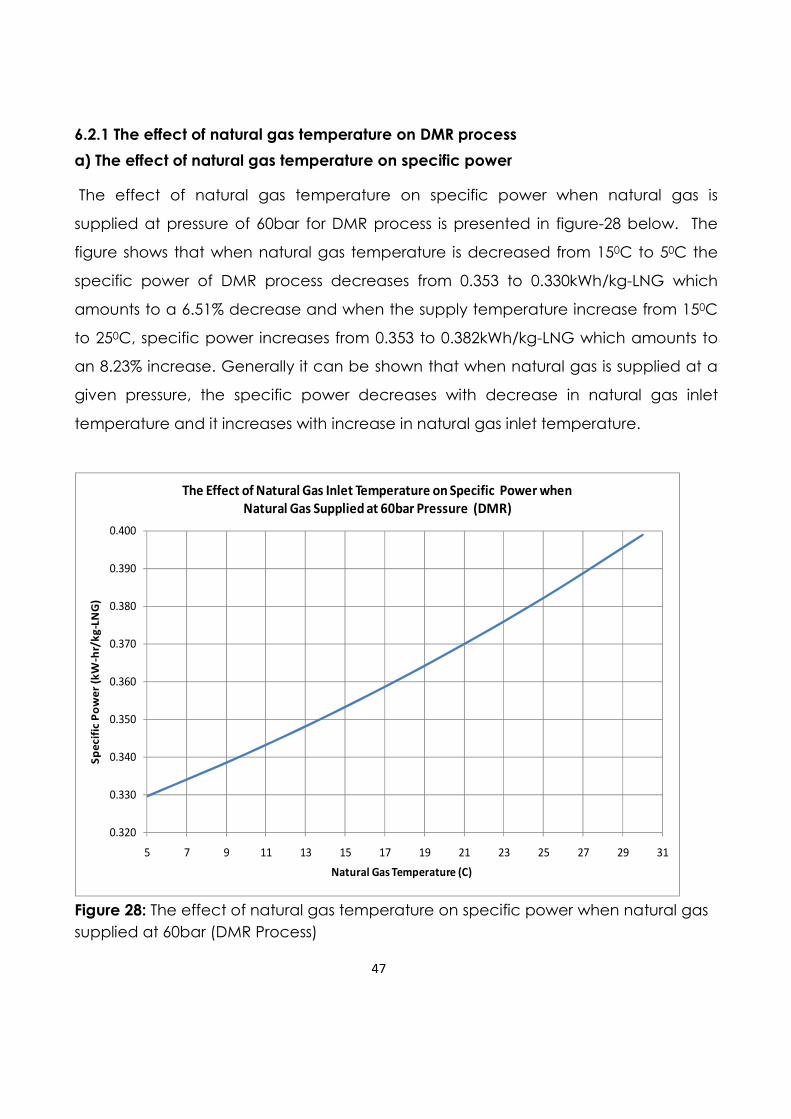
47
6.2.1 The effect of natural gas temperature on DMR process
a) The effect of natural gas temperature on specific power
The effect of natural gas temperature on specific power when natural gas is
supplied at pressure of 60bar for DMR process is presented in figure-28 below. The
figure shows that when natural gas temperature is decreased from 150C to 50C the
specific power of DMR process decreases from 0.353 to 0.330kWh/kg-LNG which
amounts to a 6.51% decrease and when the supply temperature increase from 150C
to 250C, specific power increases from 0.353 to 0.382kWh/kg-LNG which amounts to
an 8.23% increase. Generally it can be shown that when natural gas is supplied at a
given pressure, the specific power decreases with decrease in natural gas inlet
temperature and it increases with increase in natural gas inlet temperature.
0.320
0.330
0.340
0.350
0.360
0.370
0.380
0.390
0.400
5 7 9 11 13 15 17 19 21 23 25 27 29 31
Sp
ecif
ic P
ow
er
(kW
-hr/
kg
-LN
G)
Natural Gas Temperature (C)
The Effect of Natural Gas Inlet Temperature on Specific Power when
Natural Gas Supplied at 60bar Pressure (DMR)
Figure 28: The effect of natural gas temperature on specific power when natural gas
supplied at 60bar (DMR Process)
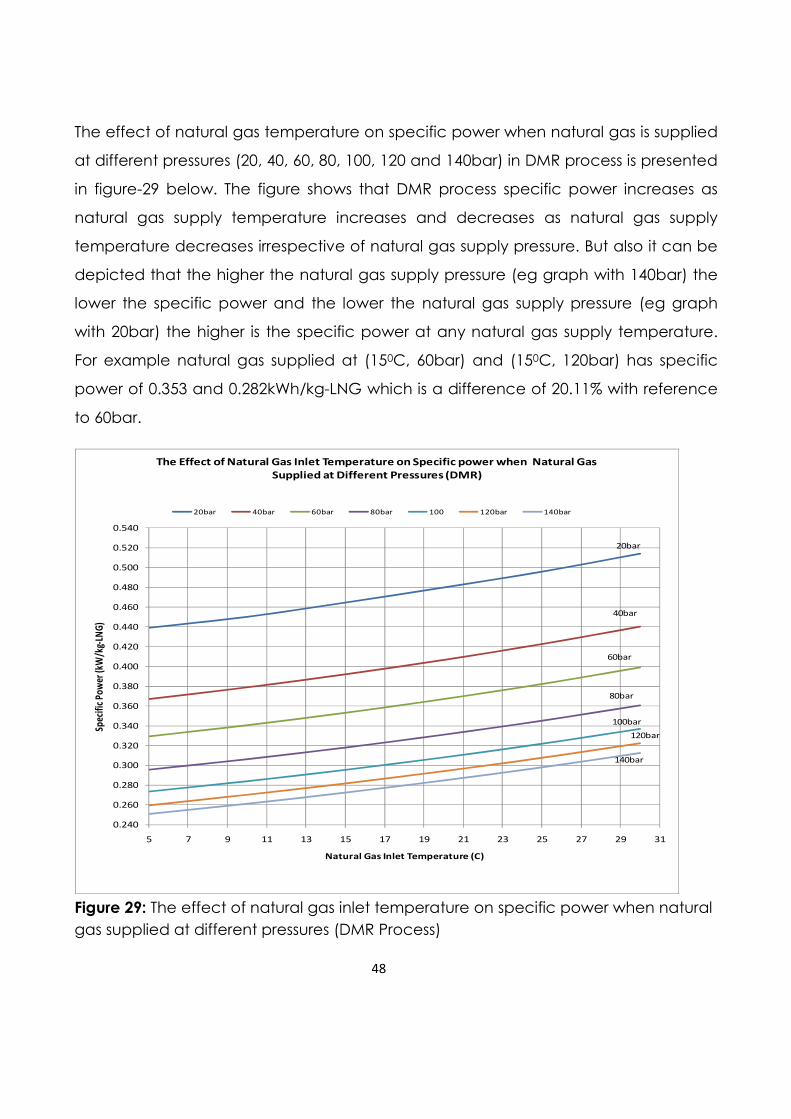
48
The effect of natural gas temperature on specific power when natural gas is supplied
at different pressures (20, 40, 60, 80, 100, 120 and 140bar) in DMR process is presented
in figure-29 below. The figure shows that DMR process specific power increases as
natural gas supply temperature increases and decreases as natural gas supply
temperature decreases irrespective of natural gas supply pressure. But also it can be
depicted that the higher the natural gas supply pressure (eg graph with 140bar) the
lower the specific power and the lower the natural gas supply pressure (eg graph
with 20bar) the higher is the specific power at any natural gas supply temperature.
For example natural gas supplied at (150C, 60bar) and (150C, 120bar) has specific
power of 0.353 and 0.282kWh/kg-LNG which is a difference of 20.11% with reference
to 60bar.
0.240
0.260
0.280
0.300
0.320
0.340
0.360
0.380
0.400
0.420
0.440
0.460
0.480
0.500
0.520
0.540
5 7 9 11 13 15 17 19 21 23 25 27 29 31
Spec
ific
Pow
er (k
W/k
g-LN
G)
Natural Gas Inlet Temperature (C)
The Effect of Natural Gas Inlet Temperature on Specific power when Natural Gas
Supplied at Different Pressures (DMR)
20bar 40bar 60bar 80bar 100 120bar 140bar
20bar
40bar
60bar
80bar
100bar
120bar
140bar
Figure 29: The effect of natural gas inlet temperature on specific power when natural
gas supplied at different pressures (DMR Process)
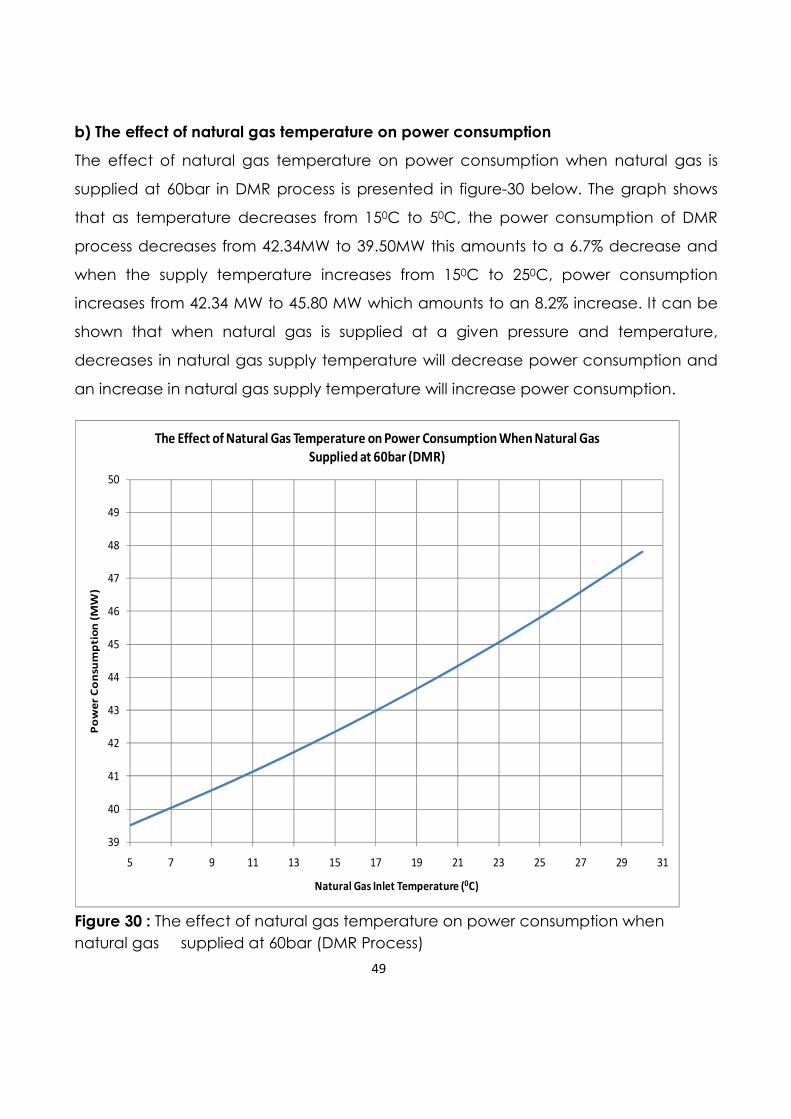
49
b) The effect of natural gas temperature on power consumption
The effect of natural gas temperature on power consumption when natural gas is
supplied at 60bar in DMR process is presented in figure-30 below. The graph shows
that as temperature decreases from 150C to 50C, the power consumption of DMR
process decreases from 42.34MW to 39.50MW this amounts to a 6.7% decrease and
when the supply temperature increases from 150C to 250C, power consumption
increases from 42.34 MW to 45.80 MW which amounts to an 8.2% increase. It can be
shown that when natural gas is supplied at a given pressure and temperature,
decreases in natural gas supply temperature will decrease power consumption and
an increase in natural gas supply temperature will increase power consumption.
39
40
41
42
43
44
45
46
47
48
49
50
5 7 9 11 13 15 17 19 21 23 25 27 29 31
Po
we
r C
on
sum
pti
on
(M
W)
Natural Gas Inlet Temperature (0C)
The Effect of Natural Gas Temperature on Power Consumption When Natural Gas
Supplied at 60bar (DMR)
Figure 30 : The effect of natural gas temperature on power consumption when
natural gas supplied at 60bar (DMR Process)
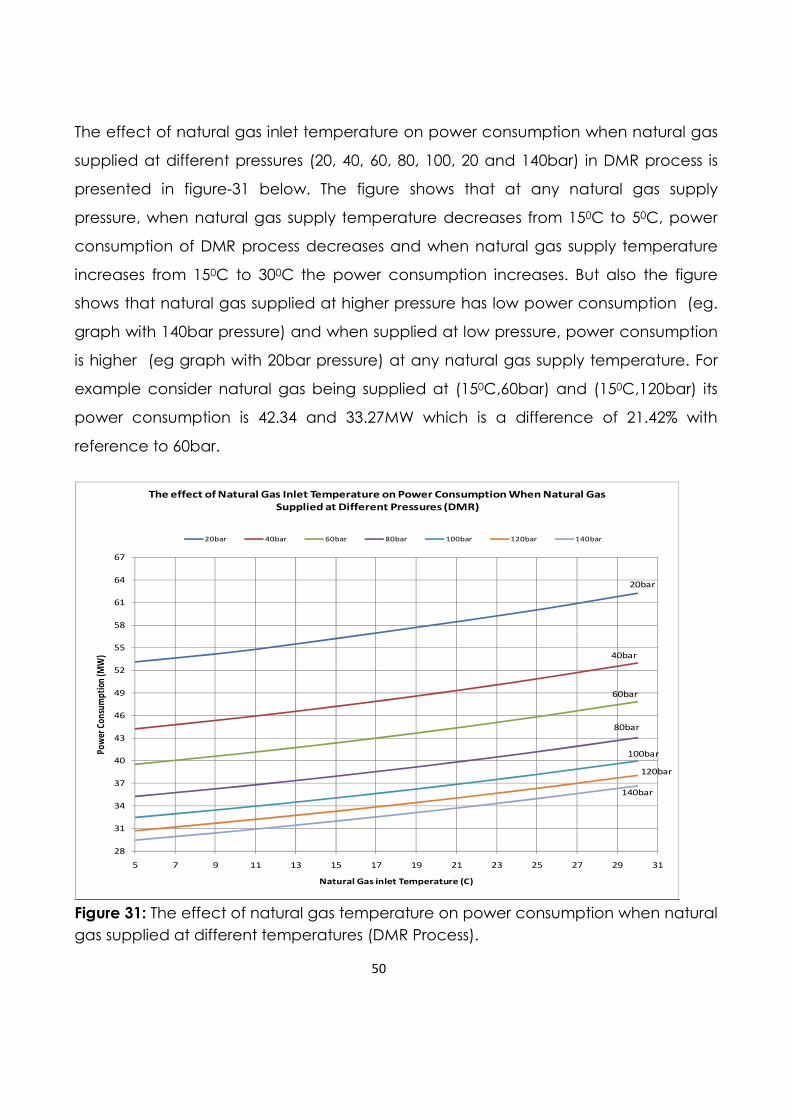
50
The effect of natural gas inlet temperature on power consumption when natural gas
supplied at different pressures (20, 40, 60, 80, 100, 20 and 140bar) in DMR process is
presented in figure-31 below. The figure shows that at any natural gas supply
pressure, when natural gas supply temperature decreases from 150C to 50C, power
consumption of DMR process decreases and when natural gas supply temperature
increases from 150C to 300C the power consumption increases. But also the figure
shows that natural gas supplied at higher pressure has low power consumption (eg.
graph with 140bar pressure) and when supplied at low pressure, power consumption
is higher (eg graph with 20bar pressure) at any natural gas supply temperature. For
example consider natural gas being supplied at (150C,60bar) and (150C,120bar) its
power consumption is 42.34 and 33.27MW which is a difference of 21.42% with
reference to 60bar.
28
31
34
37
40
43
46
49
52
55
58
61
64
67
5 7 9 11 13 15 17 19 21 23 25 27 29 31
Pow
er C
on
sum
pti
on (M
W)
Natural Gas inlet Temperature (C)
The effect of Natural Gas Inlet Temperature on Power Consumption When Natural Gas
Supplied at Different Pressures (DMR)
20bar 40bar 60bar 80bar 100bar 120bar 140bar
20bar
40bar
60bar
80bar
100bar
140bar
120bar
Figure 31: The effect of natural gas temperature on power consumption when natural
gas supplied at different temperatures (DMR Process).
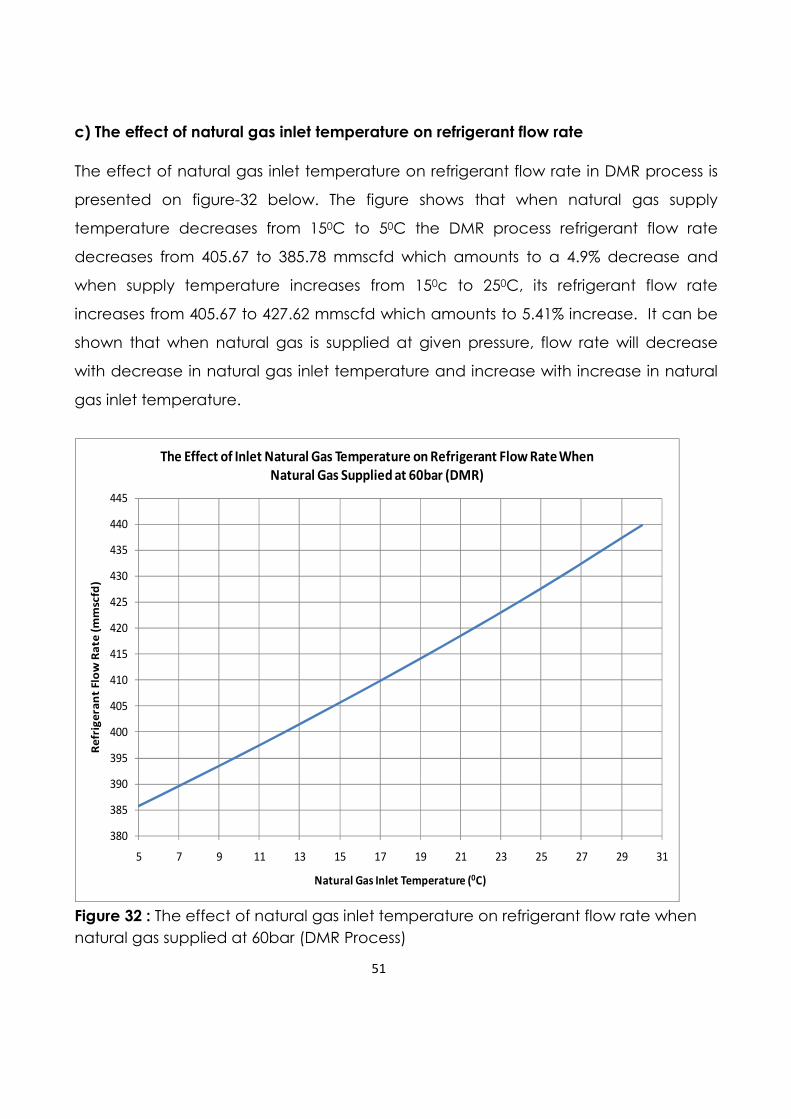
51
c) The effect of natural gas inlet temperature on refrigerant flow rate
The effect of natural gas inlet temperature on refrigerant flow rate in DMR process is
presented on figure-32 below. The figure shows that when natural gas supply
temperature decreases from 150C to 50C the DMR process refrigerant flow rate
decreases from 405.67 to 385.78 mmscfd which amounts to a 4.9% decrease and
when supply temperature increases from 150c to 250C, its refrigerant flow rate
increases from 405.67 to 427.62 mmscfd which amounts to 5.41% increase. It can be
shown that when natural gas is supplied at given pressure, flow rate will decrease
with decrease in natural gas inlet temperature and increase with increase in natural
gas inlet temperature.
380
385
390
395
400
405
410
415
420
425
430
435
440
445
5 7 9 11 13 15 17 19 21 23 25 27 29 31
Re
frig
era
nt
Flo
w R
ate
(m
msc
fd)
Natural Gas Inlet Temperature (0C)
The Effect of Inlet Natural Gas Temperature on Refrigerant Flow Rate When
Natural Gas Supplied at 60bar (DMR)
Figure 32 : The effect of natural gas inlet temperature on refrigerant flow rate when
natural gas supplied at 60bar (DMR Process)
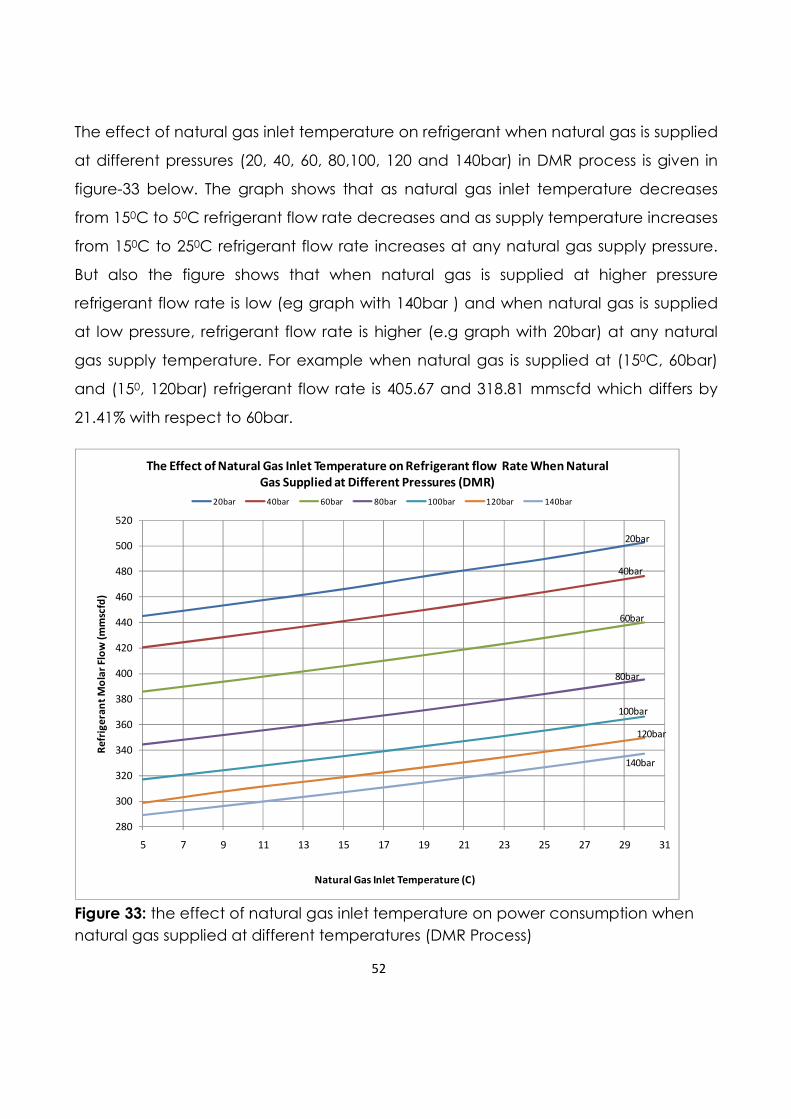
52
The effect of natural gas inlet temperature on refrigerant when natural gas is supplied
at different pressures (20, 40, 60, 80,100, 120 and 140bar) in DMR process is given in
figure-33 below. The graph shows that as natural gas inlet temperature decreases
from 150C to 50C refrigerant flow rate decreases and as supply temperature increases
from 150C to 250C refrigerant flow rate increases at any natural gas supply pressure.
But also the figure shows that when natural gas is supplied at higher pressure
refrigerant flow rate is low (eg graph with 140bar ) and when natural gas is supplied
at low pressure, refrigerant flow rate is higher (e.g graph with 20bar) at any natural
gas supply temperature. For example when natural gas is supplied at (150C, 60bar)
and (150, 120bar) refrigerant flow rate is 405.67 and 318.81 mmscfd which differs by
21.41% with respect to 60bar.
280
300
320
340
360
380
400
420
440
460
480
500
520
5 7 9 11 13 15 17 19 21 23 25 27 29 31
Re
frig
era
nt
Mo
lar
Flo
w (
mm
scfd
)
Natural Gas Inlet Temperature (C)
The Effect of Natural Gas Inlet Temperature on Refrigerant flow Rate When Natural
Gas Supplied at Different Pressures (DMR)
20bar 40bar 60bar 80bar 100bar 120bar 140bar
20bar
40bar
60bar
80bar
100bar
120bar
140bar
Figure 33: the effect of natural gas inlet temperature on power consumption when
natural gas supplied at different temperatures (DMR Process)
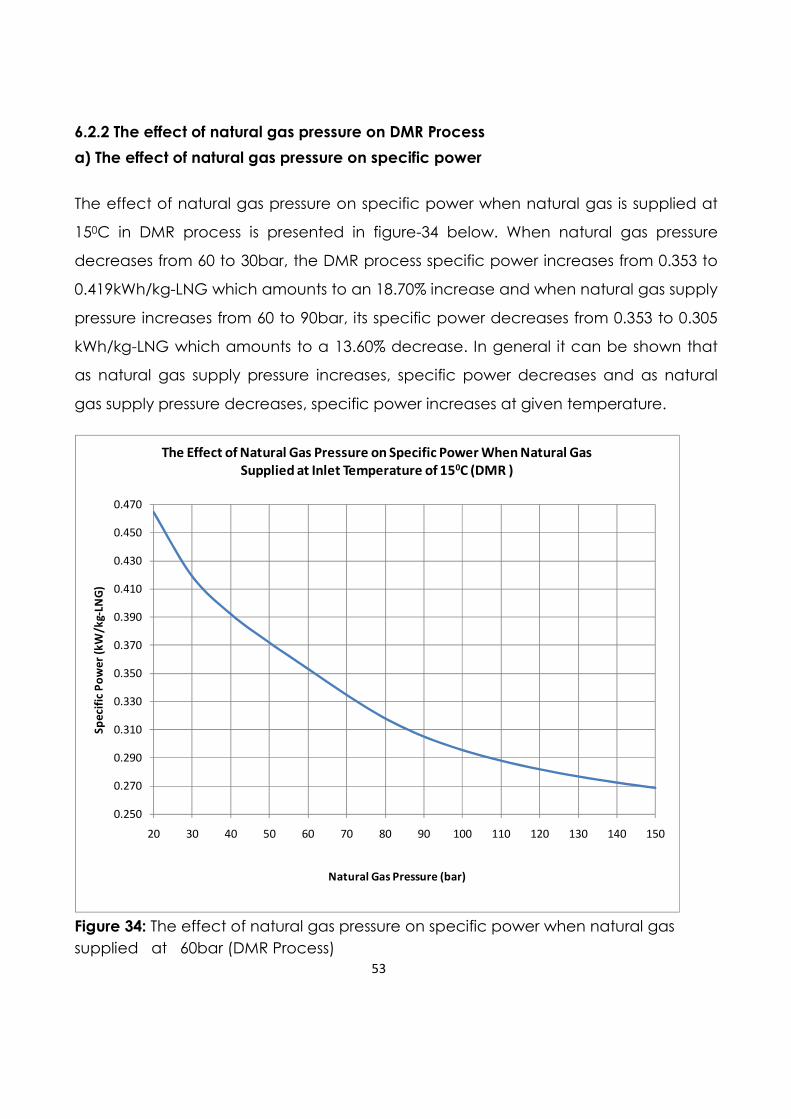
53
6.2.2 The effect of natural gas pressure on DMR Process
a) The effect of natural gas pressure on specific power
The effect of natural gas pressure on specific power when natural gas is supplied at
150C in DMR process is presented in figure-34 below. When natural gas pressure
decreases from 60 to 30bar, the DMR process specific power increases from 0.353 to
0.419kWh/kg-LNG which amounts to an 18.70% increase and when natural gas supply
pressure increases from 60 to 90bar, its specific power decreases from 0.353 to 0.305
kWh/kg-LNG which amounts to a 13.60% decrease. In general it can be shown that
as natural gas supply pressure increases, specific power decreases and as natural
gas supply pressure decreases, specific power increases at given temperature.
0.250
0.270
0.290
0.310
0.330
0.350
0.370
0.390
0.410
0.430
0.450
0.470
20 30 40 50 60 70 80 90 100 110 120 130 140 150
Sp
eci
fic
Po
we
r (k
W/k
g-LN
G)
Natural Gas Pressure (bar)
The Effect of Natural Gas Pressure on Specific Power When Natural Gas
Supplied at Inlet Temperature of 150C (DMR )
Figure 34: The effect of natural gas pressure on specific power when natural gas
supplied at 60bar (DMR Process)
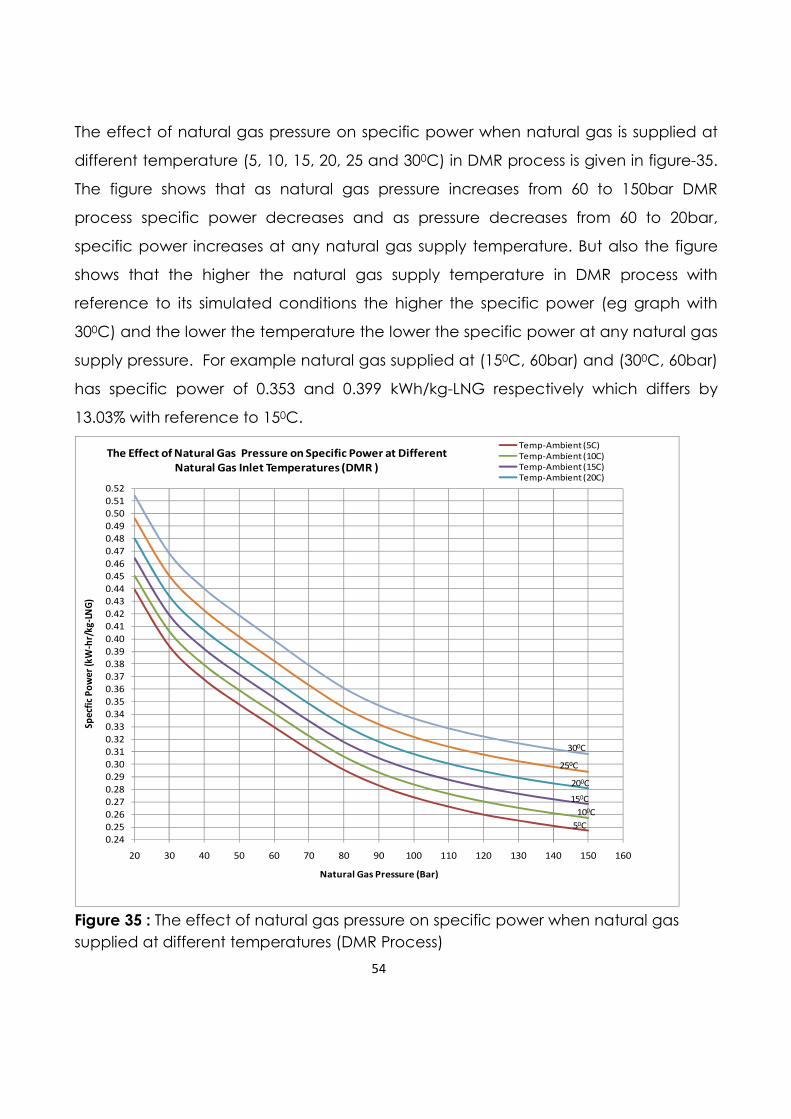
54
The effect of natural gas pressure on specific power when natural gas is supplied at
different temperature (5, 10, 15, 20, 25 and 300C) in DMR process is given in figure-35.
The figure shows that as natural gas pressure increases from 60 to 150bar DMR
process specific power decreases and as pressure decreases from 60 to 20bar,
specific power increases at any natural gas supply temperature. But also the figure
shows that the higher the natural gas supply temperature in DMR process with
reference to its simulated conditions the higher the specific power (eg graph with
300C) and the lower the temperature the lower the specific power at any natural gas
supply pressure. For example natural gas supplied at (150C, 60bar) and (300C, 60bar)
has specific power of 0.353 and 0.399 kWh/kg-LNG respectively which differs by
13.03% with reference to 150C.
0.24
0.25
0.26
0.27
0.28
0.29
0.30
0.31
0.32
0.33
0.34
0.35
0.36
0.37
0.38
0.39
0.40
0.41
0.42
0.43
0.44
0.45
0.46
0.47
0.48
0.49
0.50
0.51
0.52
20 30 40 50 60 70 80 90 100 110 120 130 140 150 160
Sp
ecf
ic P
ow
er
(kW
-hr/
kg
-LN
G)
Natural Gas Pressure (Bar)
The Effect of Natural Gas Pressure on Specific Power at Different
Natural Gas Inlet Temperatures (DMR )
Temp-Ambient (5C)
Temp-Ambient (10C)
Temp-Ambient (15C)
Temp-Ambient (20C)
250C
300C
200C
150C
50C
100C
Figure 35 : The effect of natural gas pressure on specific power when natural gas
supplied at different temperatures (DMR Process)
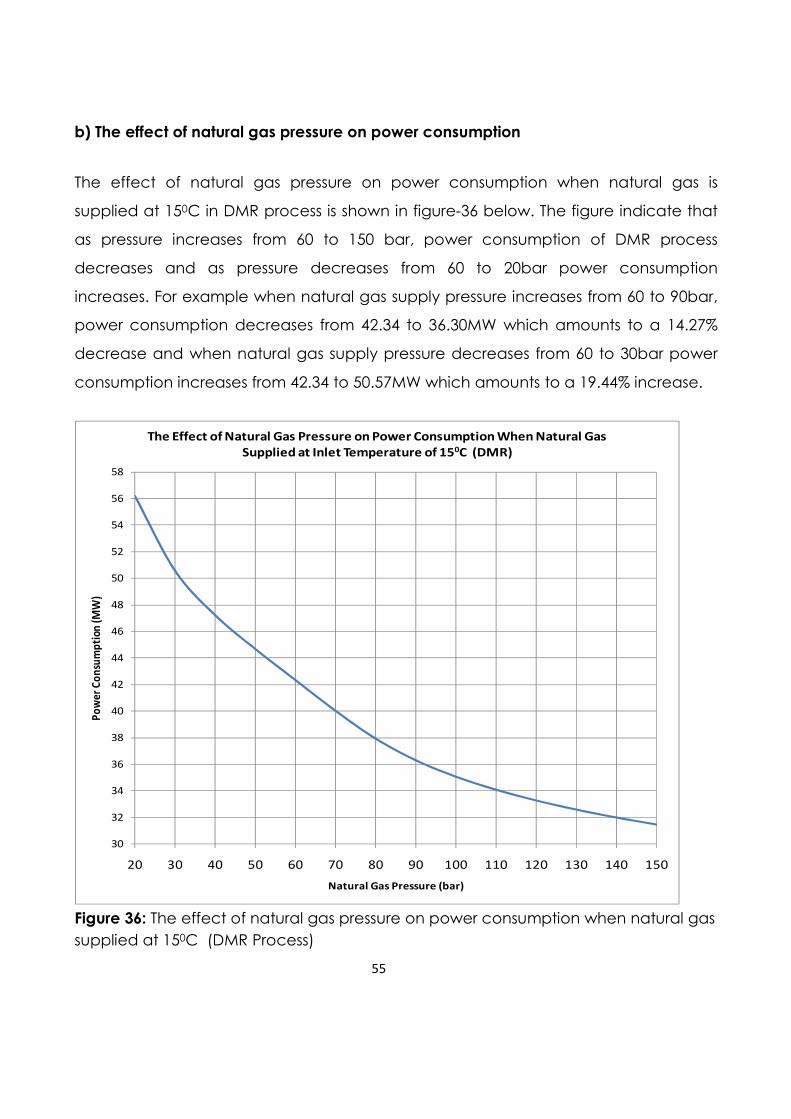
55
b) The effect of natural gas pressure on power consumption
The effect of natural gas pressure on power consumption when natural gas is
supplied at 150C in DMR process is shown in figure-36 below. The figure indicate that
as pressure increases from 60 to 150 bar, power consumption of DMR process
decreases and as pressure decreases from 60 to 20bar power consumption
increases. For example when natural gas supply pressure increases from 60 to 90bar,
power consumption decreases from 42.34 to 36.30MW which amounts to a 14.27%
decrease and when natural gas supply pressure decreases from 60 to 30bar power
consumption increases from 42.34 to 50.57MW which amounts to a 19.44% increase.
30
32
34
36
38
40
42
44
46
48
50
52
54
56
58
20 30 40 50 60 70 80 90 100 110 120 130 140 150
Po
we
r C
on
sum
pti
on (
MW
)
Natural Gas Pressure (bar)
The Effect of Natural Gas Pressure on Power Consumption When Natural Gas
Supplied at Inlet Temperature of 150C (DMR)
Figure 36: The effect of natural gas pressure on power consumption when natural gas
supplied at 150C (DMR Process)
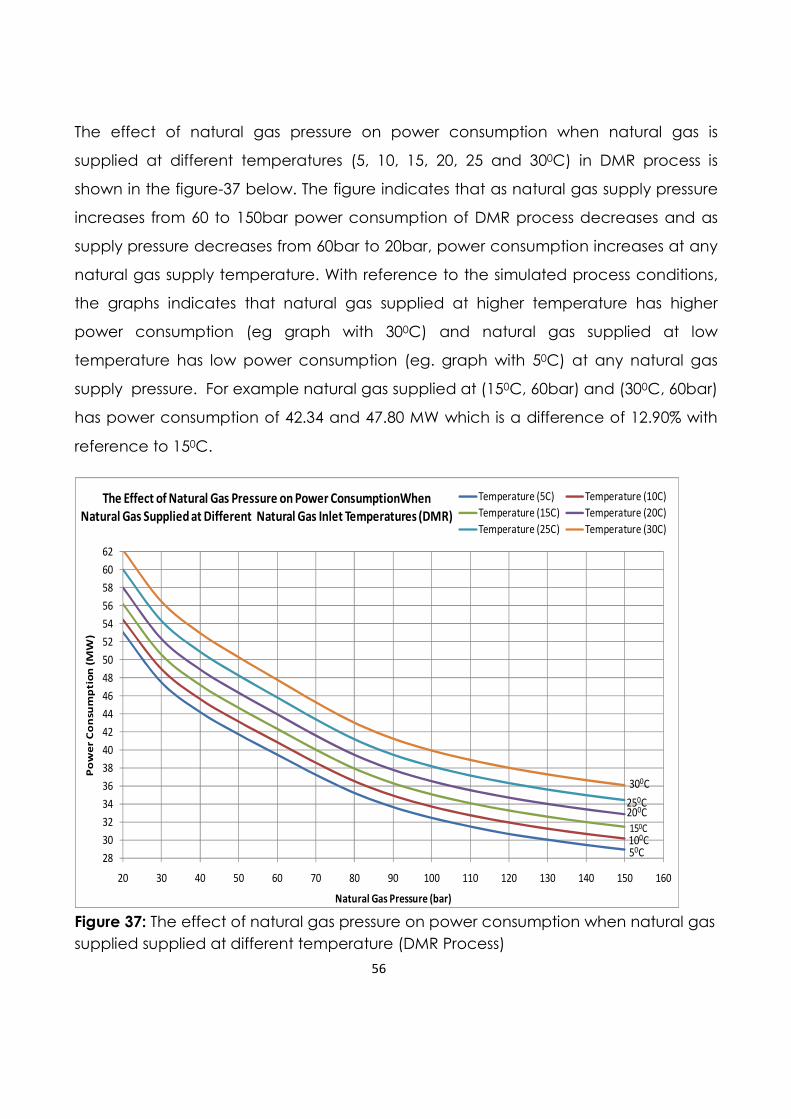
56
The effect of natural gas pressure on power consumption when natural gas is
supplied at different temperatures (5, 10, 15, 20, 25 and 300C) in DMR process is
shown in the figure-37 below. The figure indicates that as natural gas supply pressure
increases from 60 to 150bar power consumption of DMR process decreases and as
supply pressure decreases from 60bar to 20bar, power consumption increases at any
natural gas supply temperature. With reference to the simulated process conditions,
the graphs indicates that natural gas supplied at higher temperature has higher
power consumption (eg graph with 300C) and natural gas supplied at low
temperature has low power consumption (eg. graph with 50C) at any natural gas
supply pressure. For example natural gas supplied at (150C, 60bar) and (300C, 60bar)
has power consumption of 42.34 and 47.80 MW which is a difference of 12.90% with
reference to 150C.
28
30
32
34
36
38
40
42
44
46
48
50
52
54
56
58
60
62
20 30 40 50 60 70 80 90 100 110 120 130 140 150 160
Po
we
r C
on
sum
ptio
n (
MW
)
Natural Gas Pressure (bar)
The Effect of Natural Gas Pressure on Power ConsumptionWhen
Natural Gas Supplied at Different Natural Gas Inlet Temperatures (DMR)
Temperature (5C) Temperature (10C)
Temperature (15C) Temperature (20C)
Temperature (25C) Temperature (30C)
300C
250C200C
150C100C50C
Figure 37: The effect of natural gas pressure on power consumption when natural gas
supplied supplied at different temperature (DMR Process)
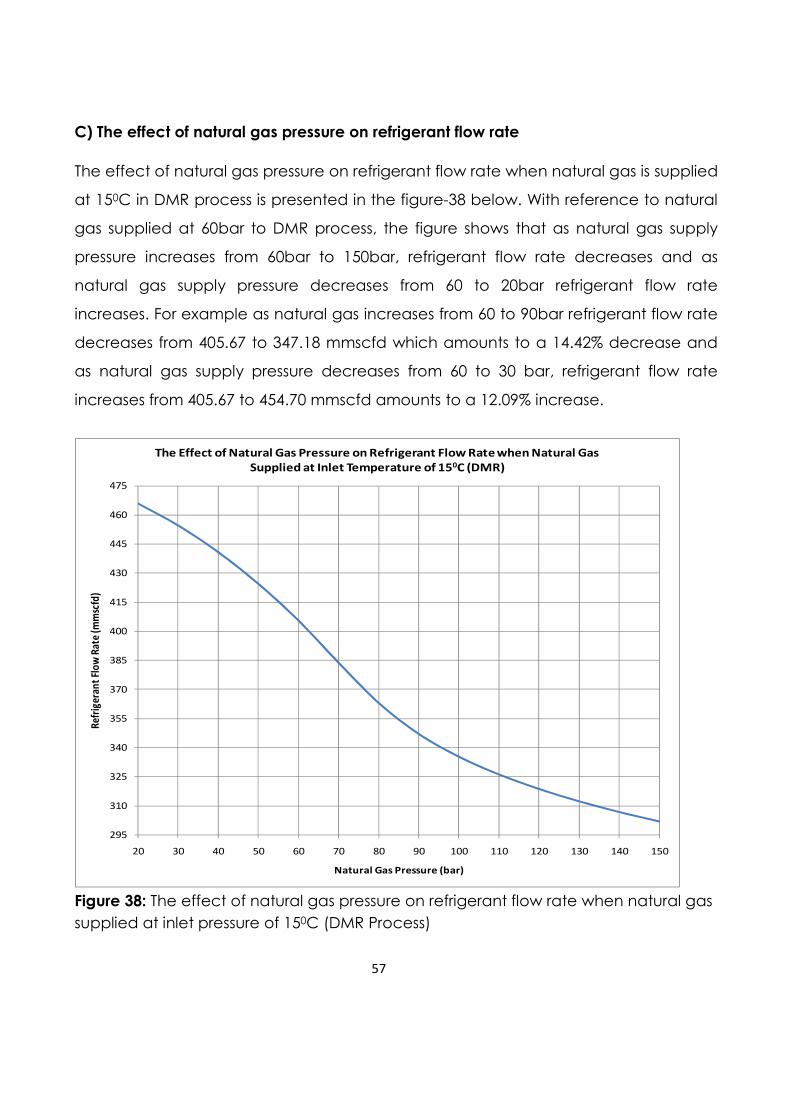
57
C) The effect of natural gas pressure on refrigerant flow rate
The effect of natural gas pressure on refrigerant flow rate when natural gas is supplied
at 150C in DMR process is presented in the figure-38 below. With reference to natural
gas supplied at 60bar to DMR process, the figure shows that as natural gas supply
pressure increases from 60bar to 150bar, refrigerant flow rate decreases and as
natural gas supply pressure decreases from 60 to 20bar refrigerant flow rate
increases. For example as natural gas increases from 60 to 90bar refrigerant flow rate
decreases from 405.67 to 347.18 mmscfd which amounts to a 14.42% decrease and
as natural gas supply pressure decreases from 60 to 30 bar, refrigerant flow rate
increases from 405.67 to 454.70 mmscfd amounts to a 12.09% increase.
295
310
325
340
355
370
385
400
415
430
445
460
475
20 30 40 50 60 70 80 90 100 110 120 130 140 150
Ref
rige
ran
t Fl
ow
Rat
e (m
msc
fd)
Natural Gas Pressure (bar)
The Effect of Natural Gas Pressure on Refrigerant Flow Rate when Natural Gas
Supplied at Inlet Temperature of 150C (DMR)
Figure 38: The effect of natural gas pressure on refrigerant flow rate when natural gas
supplied at inlet pressure of 150C (DMR Process)
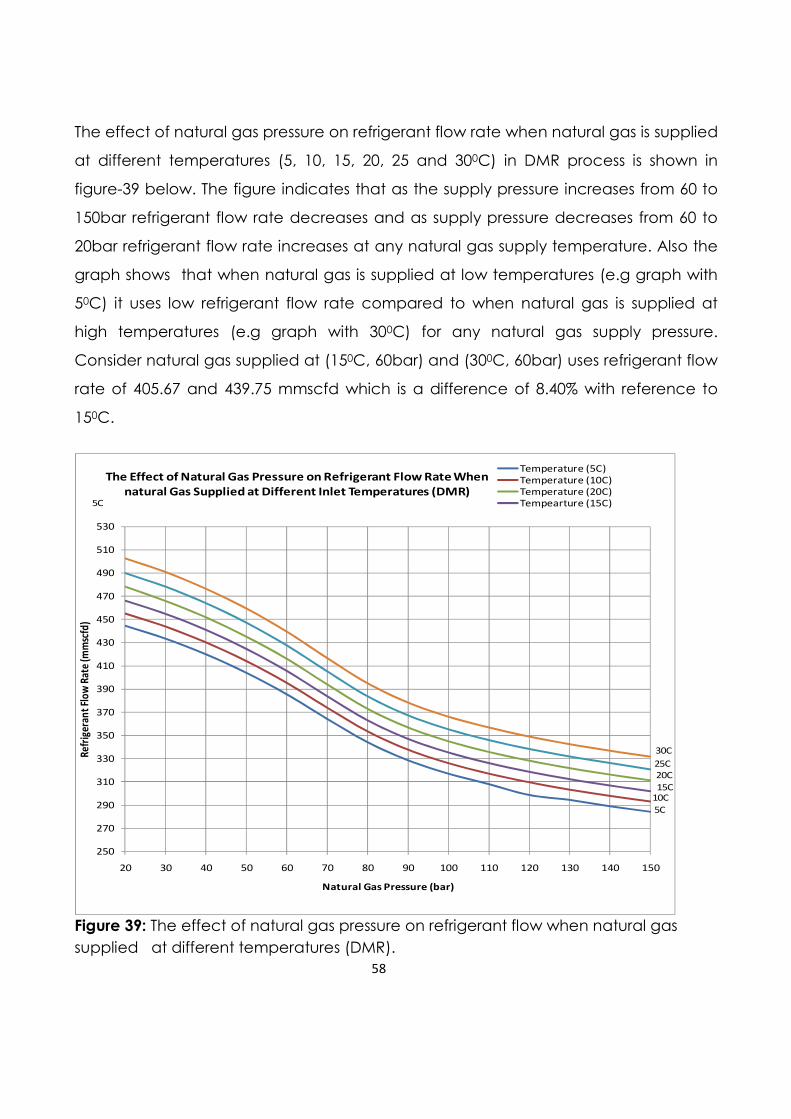
58
The effect of natural gas pressure on refrigerant flow rate when natural gas is supplied
at different temperatures (5, 10, 15, 20, 25 and 300C) in DMR process is shown in
figure-39 below. The figure indicates that as the supply pressure increases from 60 to
150bar refrigerant flow rate decreases and as supply pressure decreases from 60 to
20bar refrigerant flow rate increases at any natural gas supply temperature. Also the
graph shows that when natural gas is supplied at low temperatures (e.g graph with
50C) it uses low refrigerant flow rate compared to when natural gas is supplied at
high temperatures (e.g graph with 300C) for any natural gas supply pressure.
Consider natural gas supplied at (150C, 60bar) and (300C, 60bar) uses refrigerant flow
rate of 405.67 and 439.75 mmscfd which is a difference of 8.40% with reference to
150C.
250
270
290
310
330
350
370
390
410
430
450
470
490
510
530
20 30 40 50 60 70 80 90 100 110 120 130 140 150
Ref
rige
ran
t Fl
ow
Rat
e (m
msc
fd)
Natural Gas Pressure (bar)
The Effect of Natural Gas Pressure on Refrigerant Flow Rate When
natural Gas Supplied at Different Inlet Temperatures (DMR)
Temperature (5C)
Temperature (10C)
Temperature (20C)
Tempearture (15C)5C
30C
25C
20C
15C10C
5C
Figure 39: The effect of natural gas pressure on refrigerant flow when natural gas
supplied at different temperatures (DMR).
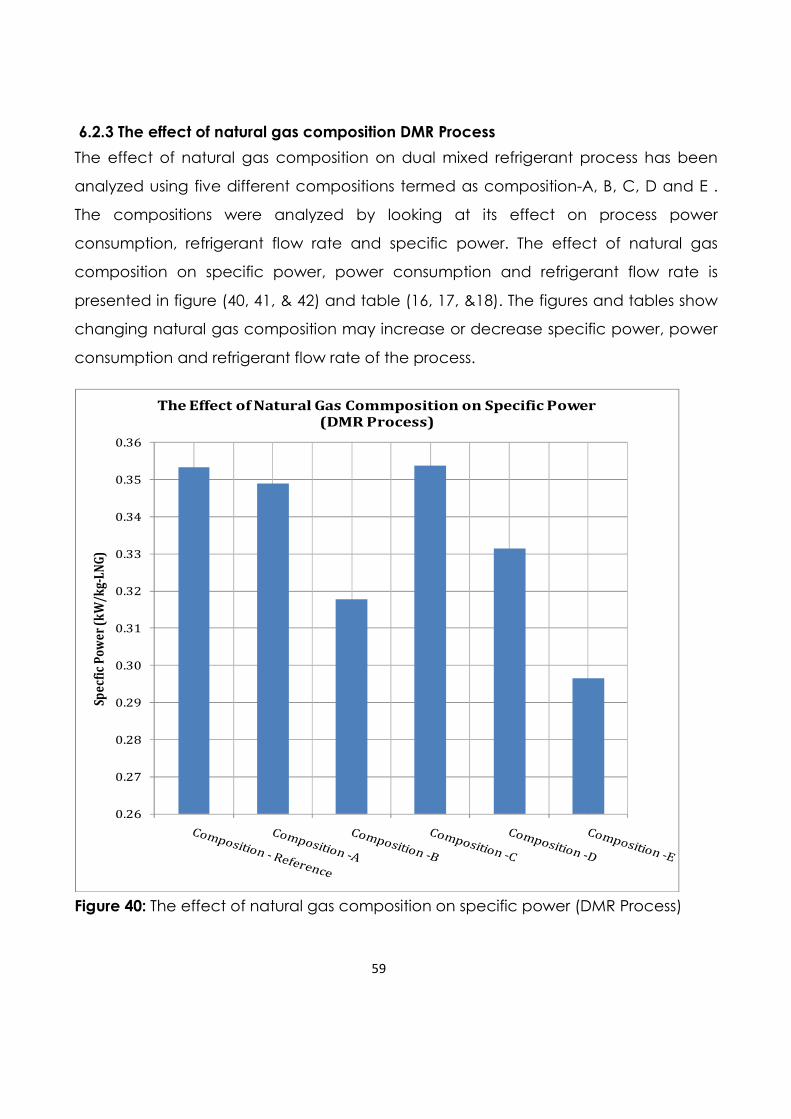
59
6.2.3 The effect of natural gas composition DMR Process
The effect of natural gas composition on dual mixed refrigerant process has been
analyzed using five different compositions termed as composition-A, B, C, D and E .
The compositions were analyzed by looking at its effect on process power
consumption, refrigerant flow rate and specific power. The effect of natural gas
composition on specific power, power consumption and refrigerant flow rate is
presented in figure (40, 41, & 42) and table (16, 17, &18). The figures and tables show
changing natural gas composition may increase or decrease specific power, power
consumption and refrigerant flow rate of the process.
0.26
0.27
0.28
0.29
0.30
0.31
0.32
0.33
0.34
0.35
0.36
Spe
cfic
Po
we
r (k
W/k
g-L
NG
)
The Effect of Natural Gas Commposition on Specific Power
(DMR Process)
Figure 40: The effect of natural gas composition on specific power (DMR Process)
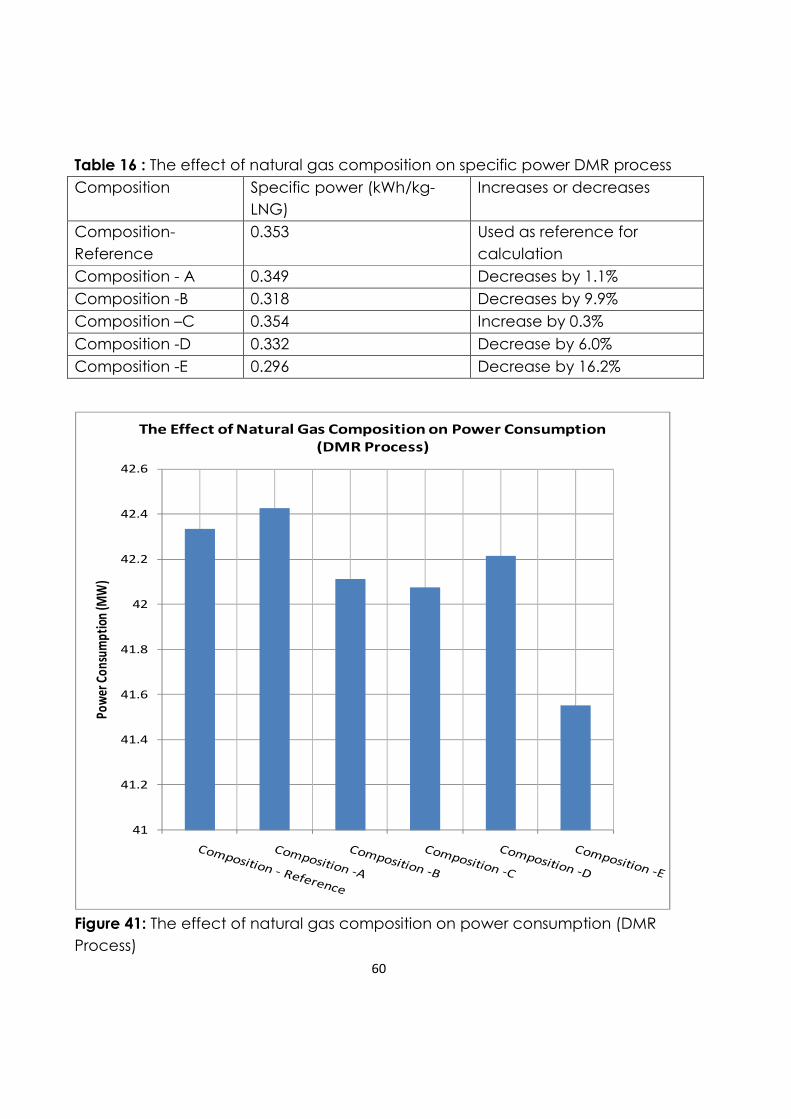
60
Table 16 : The effect of natural gas composition on specific power DMR process
Composition Specific power (kWh/kg-
LNG)
Increases or decreases
Composition-
Reference
0.353 Used as reference for
calculation
Composition - A 0.349 Decreases by 1.1%
Composition -B 0.318 Decreases by 9.9%
Composition –C 0.354 Increase by 0.3%
Composition -D 0.332 Decrease by 6.0%
Composition -E 0.296 Decrease by 16.2%
41
41.2
41.4
41.6
41.8
42
42.2
42.4
42.6
Pow
er C
ons
ump
tion
(MW
)
The Effect of Natural Gas Composition on Power Consumption
(DMR Process)
Figure 41: The effect of natural gas composition on power consumption (DMR
Process)
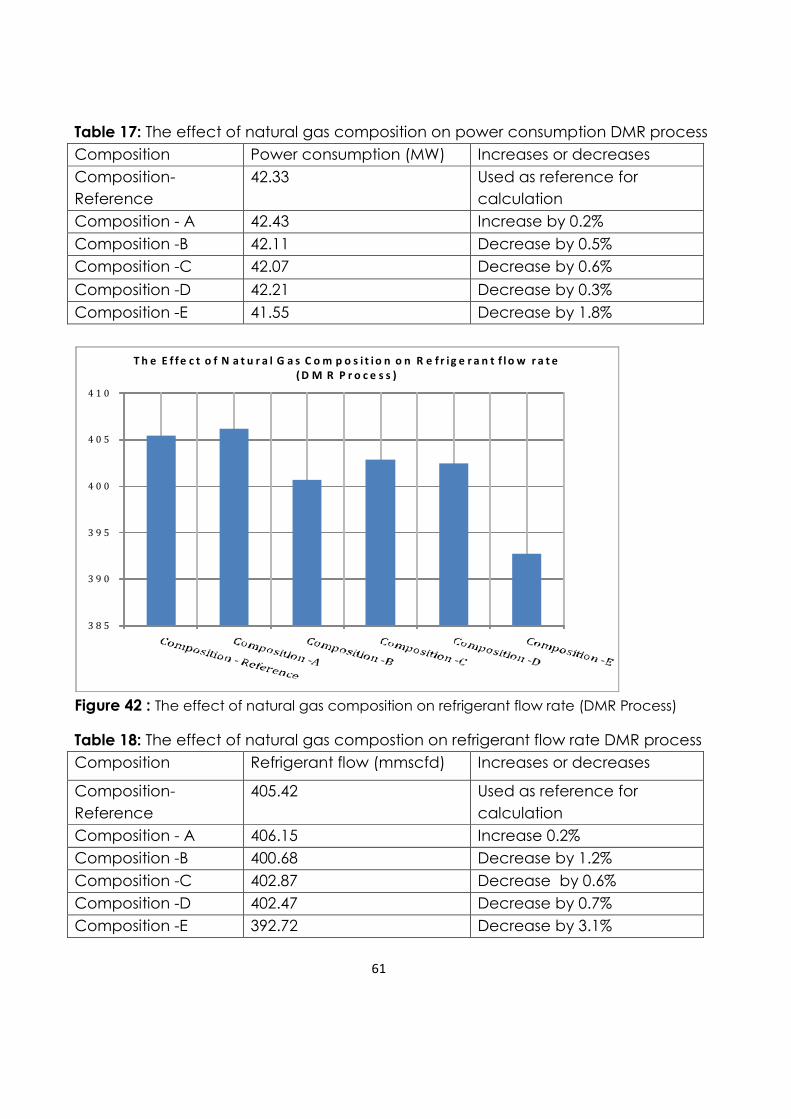
61
Table 17: The effect of natural gas composition on power consumption DMR process
Composition Power consumption (MW) Increases or decreases
Composition-
Reference
42.33 Used as reference for
calculation
Composition - A 42.43 Increase by 0.2%
Composition -B 42.11 Decrease by 0.5%
Composition -C 42.07 Decrease by 0.6%
Composition -D 42.21 Decrease by 0.3%
Composition -E 41.55 Decrease by 1.8%
3 8 5
3 9 0
3 9 5
4 0 0
4 0 5
4 1 0
T h e E f f e c t o f N a t u r a l G a s C o m p o s i t i o n o n R e f r i g e r a n t f l o w r a t e
( D M R P r o c e s s )
Figure 42 : The effect of natural gas composition on refrigerant flow rate (DMR Process)
Table 18: The effect of natural gas compostion on refrigerant flow rate DMR process
Composition Refrigerant flow (mmscfd) Increases or decreases
Composition-
Reference
405.42 Used as reference for
calculation
Composition - A 406.15 Increase 0.2%
Composition -B 400.68 Decrease by 1.2%
Composition -C 402.87 Decrease by 0.6%
Composition -D 402.47 Decrease by 0.7%
Composition -E 392.72 Decrease by 3.1%
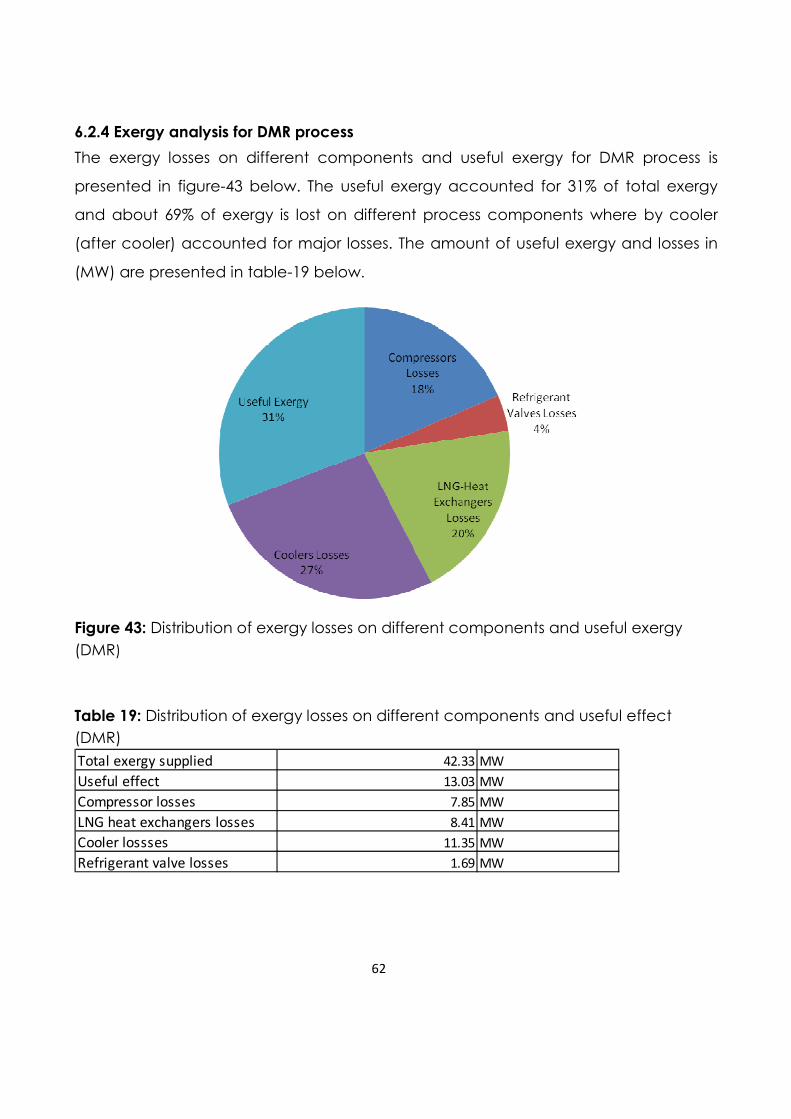
62
6.2.4 Exergy analysis for DMR process
The exergy losses on different components and useful exergy for DMR process is
presented in figure-43 below. The useful exergy accounted for 31% of total exergy
and about 69% of exergy is lost on different process components where by cooler
(after cooler) accounted for major losses. The amount of useful exergy and losses in
(MW) are presented in table-19 below.
Figure 43: Distribution of exergy losses on different components and useful exergy
(DMR)
Table 19: Distribution of exergy losses on different components and useful effect
(DMR)
Total exergy supplied 42.33 MW
Useful effect 13.03 MW
Compressor losses 7.85 MW
LNG heat exchangers losses 8.41 MW
Cooler lossses 11.35 MW
Refrigerant valve losses 1.69 MW
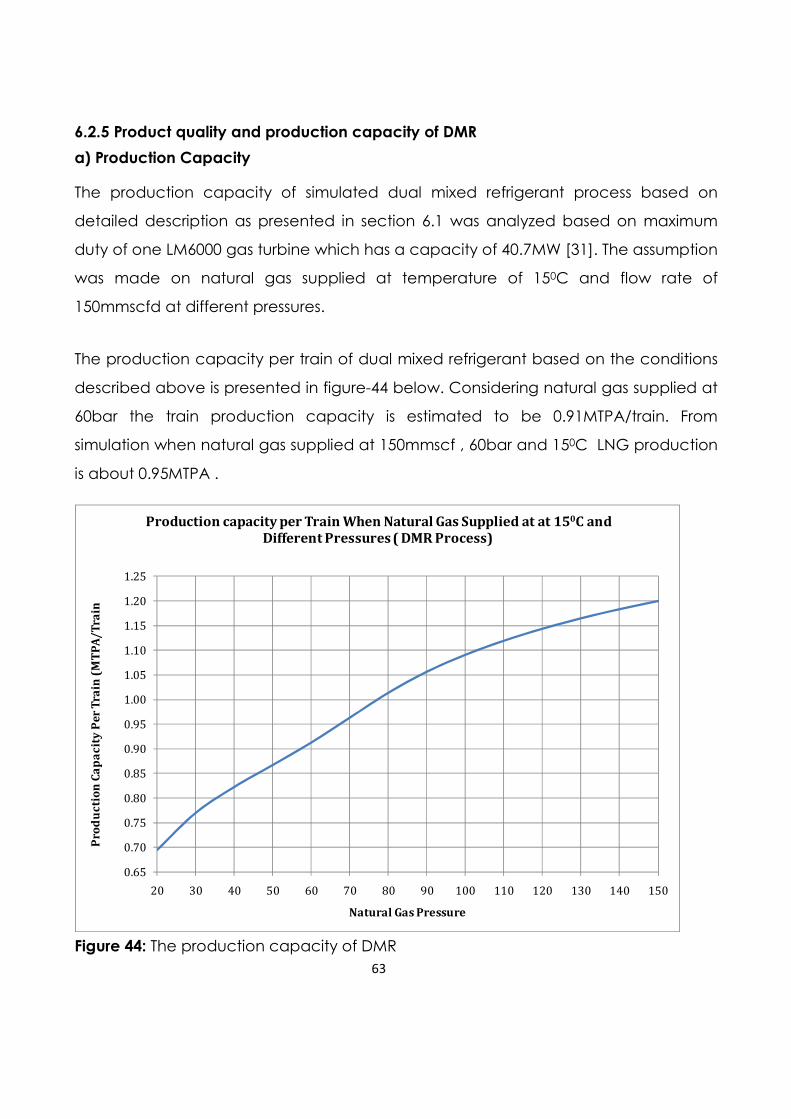
63
6.2.5 Product quality and production capacity of DMR
a) Production Capacity
The production capacity of simulated dual mixed refrigerant process based on
detailed description as presented in section 6.1 was analyzed based on maximum
duty of one LM6000 gas turbine which has a capacity of 40.7MW [31]. The assumption
was made on natural gas supplied at temperature of 150C and flow rate of
150mmscfd at different pressures.
The production capacity per train of dual mixed refrigerant based on the conditions
described above is presented in figure-44 below. Considering natural gas supplied at
60bar the train production capacity is estimated to be 0.91MTPA/train. From
simulation when natural gas supplied at 150mmscf , 60bar and 150C LNG production
is about 0.95MTPA .
0.65
0.70
0.75
0.80
0.85
0.90
0.95
1.00
1.05
1.10
1.15
1.20
1.25
20 30 40 50 60 70 80 90 100 110 120 130 140 150
Pro
du
cti
on
Ca
pa
cit
y P
er
Tra
in (
MT
PA
/T
rain
Natural Gas Pressure
Production capacity per Train When Natural Gas Supplied at at 150C and
Different Pressures ( DMR Process)
Figure 44: The production capacity of DMR
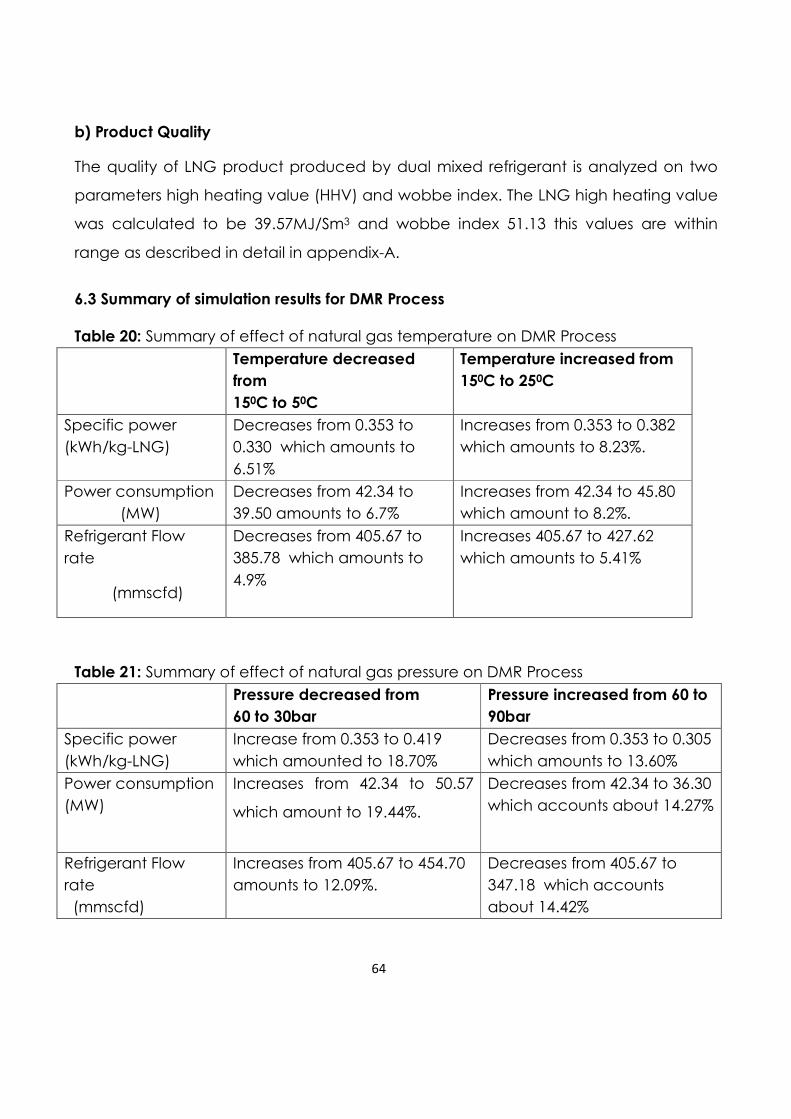
64
b) Product Quality
The quality of LNG product produced by dual mixed refrigerant is analyzed on two
parameters high heating value (HHV) and wobbe index. The LNG high heating value
was calculated to be 39.57MJ/Sm3 and wobbe index 51.13 this values are within
range as described in detail in appendix-A.
6.3 Summary of simulation results for DMR Process
Table 20: Summary of effect of natural gas temperature on DMR Process
Temperature decreased
from
150C to 50C
Temperature increased from
150C to 250C
Specific power
(kWh/kg-LNG)
Decreases from 0.353 to
0.330 which amounts to
6.51%
Increases from 0.353 to 0.382
which amounts to 8.23%.
Power consumption
(MW)
Decreases from 42.34 to
39.50 amounts to 6.7%
Increases from 42.34 to 45.80
which amount to 8.2%.
Refrigerant Flow
rate
(mmscfd)
Decreases from 405.67 to
385.78 which amounts to
4.9%
Increases 405.67 to 427.62
which amounts to 5.41%
Table 21: Summary of effect of natural gas pressure on DMR Process
Pressure decreased from
60 to 30bar
Pressure increased from 60 to
90bar
Specific power
(kWh/kg-LNG)
Increase from 0.353 to 0.419
which amounted to 18.70%
Decreases from 0.353 to 0.305
which amounts to 13.60%
Power consumption
(MW)
Increases from 42.34 to 50.57
which amount to 19.44%.
Decreases from 42.34 to 36.30
which accounts about 14.27%
Refrigerant Flow
rate
(mmscfd)
Increases from 405.67 to 454.70
amounts to 12.09%.
Decreases from 405.67 to
347.18 which accounts
about 14.42%
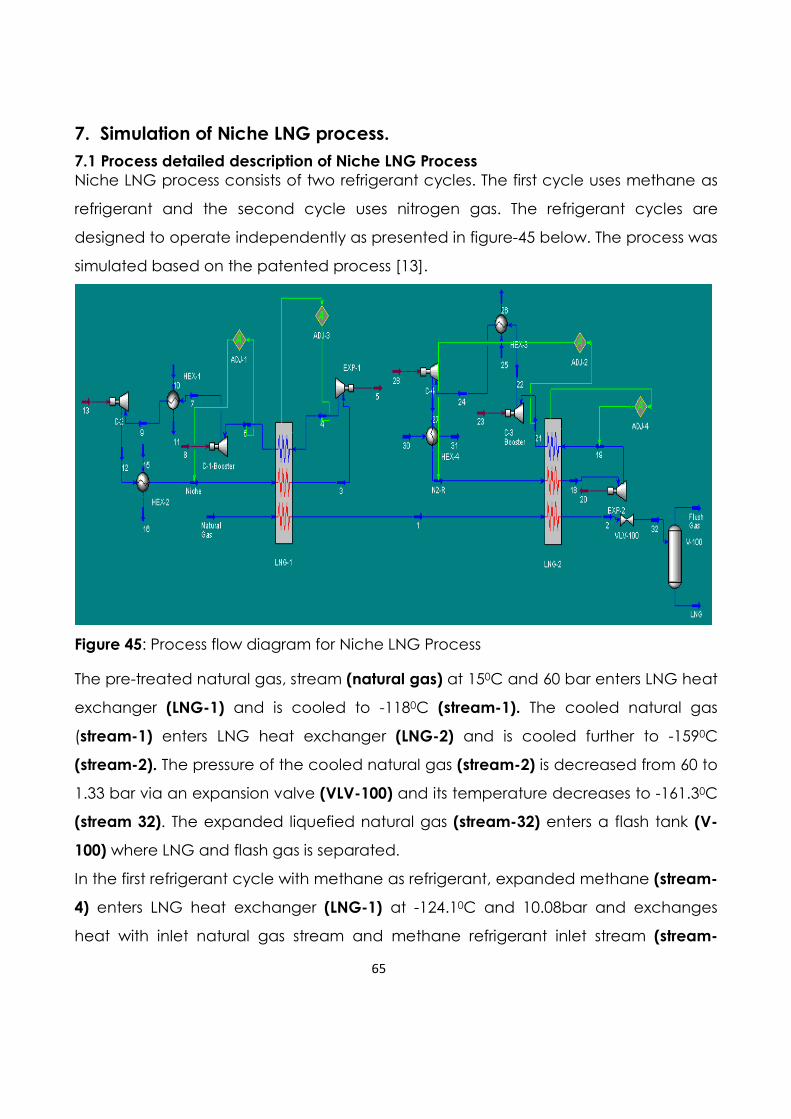
65
7. Simulation of Niche LNG process.
7.1 Process detailed description of Niche LNG Process
Niche LNG process consists of two refrigerant cycles. The first cycle uses methane as
refrigerant and the second cycle uses nitrogen gas. The refrigerant cycles are
designed to operate independently as presented in figure-45 below. The process was
simulated based on the patented process [13].
Figure 45: Process flow diagram for Niche LNG Process
The pre-treated natural gas, stream (natural gas) at 150C and 60 bar enters LNG heat
exchanger (LNG-1) and is cooled to -1180C (stream-1). The cooled natural gas
(stream-1) enters LNG heat exchanger (LNG-2) and is cooled further to -1590C
(stream-2). The pressure of the cooled natural gas (stream-2) is decreased from 60 to
1.33 bar via an expansion valve (VLV-100) and its temperature decreases to -161.30C
(stream 32). The expanded liquefied natural gas (stream-32) enters a flash tank (V-
100) where LNG and flash gas is separated.
In the first refrigerant cycle with methane as refrigerant, expanded methane (stream-
4) enters LNG heat exchanger (LNG-1) at -124.10C and 10.08bar and exchanges
heat with inlet natural gas stream and methane refrigerant inlet stream (stream-
66
Niche) and exits LNG heat exchanger (LNG-1) at 100C (stream-6). The warmed
methane refrigerant (stream-6) is partially compressed in the first compressor (C-1)
from 10 to 30bar (stream-7) and is cooled to ambient conditions in HEX-1 (stream-9).
The partially compressed and cooled methane (Stream-9) is then compressed in the
second compressor (C-2) from 30 to 80bar (stream-12) and cooled to ambient
temperature in HEX-2 (stream-Niche). Stream Niche is the starting point of the
methane refrigerant cycle and it enters LNG heat exchanger (LNG-1) at 100C and
80bar and is cooled in LNG heat exchanger (LNG-1) to -250C (steam-3) . The cooled
methane refrigerant (stream-3) is reduced in pressure by expansion in expander
(EXP-1) from 80 to 10bar and its temperature decreases to -124.10C (stream-4) .
Stream-4 is returned to the LNG heat exchanger (LNG-1) and the cycle is repeated
as described above.
In the second refrigerant cycle with nitrogen refrigerant, expanded nitrogen (stream-
19) at -168.70C and 10bar enters LNG heat exchanger (LNG-2) and exchanges heat
with pre-cooled natural gas (stream-1) and inlet stream of nitrogen refrigerant
(stream N2-R) and exits LNG heat exchanger (LNG-2) at 100C (stream-21). The
warmed nitrogen refrigerant (stream-21) is first compressed in the first compressor (C-
1) from 10 to 30bar and cooled to 150C in HEX-3 (stream-24) then compressed in the
second compressor from 30 to 80bar and cooled to 150C in HEX-4 (stream-N2-R).
Stream N2-R enters LNG heat exchanger (LNG-2), is cooled to -900C (stream-18),
expanded in expander (EXP-2) from 80 to 10bar and its temperature decreases to -
168.70C (stream-19) and the cycle is repeated as described above. Refrigerant flow
rate in the first cycle is about 569.4 mmscfd and in the second cycle 225.1 mmscfd.
Expander power generated EXP-1 is 13.59MW and EXP-2 3.88MW.
The suction flow rate of methane refrigerant cycle in the first stage compressor was
64,486.54 m3/hr which gives mass flow of 126.4kg/s and nitrogen refrigerant cycle first
stage compressor has suction flow rate of 25897.09m3/hr which gives mass flow rate
of 87.04kg/s.
67
7.2 Simulation results for Niche LNG Process
Based on detailed description of the process and conditions described above the
processes were simulated and LNG heat exchangers “UA” values found to be
2256.84kW/C for LNG heat exchanger (LNG-1) and 1684.190.07kW/C for LNG heat
exchanger (LNG-2) at minimum approach temperature of 50C for LNG heat
exchanger (LNG-1) and 3.50C for LNG heat exchanger (LNG-2). The LMTD found to
be 17.180C for LNG heat exchanger (LNG-1) and 10.220C for LNG-2 respectively .
The specific power of the process at above conditions was found to be 0.500kWh/kg-
LNG. The LNG heat exchangers “UA” calculated at above was kept constant in
simulation by adjusting refrigerant flow rate and refrigerant evaporating pressure
during variation of natural gas pressure, temperature and composition.
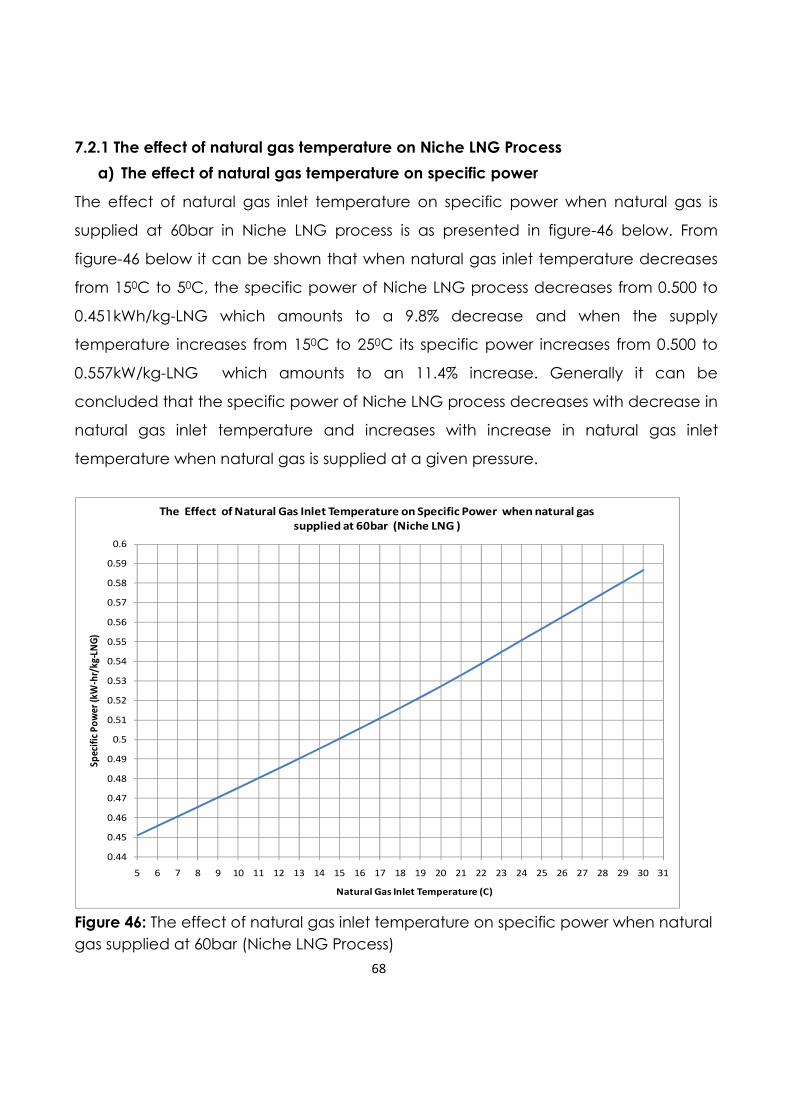
68
7.2.1 The effect of natural gas temperature on Niche LNG Process
a) The effect of natural gas temperature on specific power
The effect of natural gas inlet temperature on specific power when natural gas is
supplied at 60bar in Niche LNG process is as presented in figure-46 below. From
figure-46 below it can be shown that when natural gas inlet temperature decreases
from 150C to 50C, the specific power of Niche LNG process decreases from 0.500 to
0.451kWh/kg-LNG which amounts to a 9.8% decrease and when the supply
temperature increases from 150C to 250C its specific power increases from 0.500 to
0.557kW/kg-LNG which amounts to an 11.4% increase. Generally it can be
concluded that the specific power of Niche LNG process decreases with decrease in
natural gas inlet temperature and increases with increase in natural gas inlet
temperature when natural gas is supplied at a given pressure.
0.44
0.45
0.46
0.47
0.48
0.49
0.5
0.51
0.52
0.53
0.54
0.55
0.56
0.57
0.58
0.59
0.6
5 6 7 8 9 10 11 12 13 14 15 16 17 18 19 20 21 22 23 24 25 26 27 28 29 30 31
Sp
ecif
ic P
ow
er
(kW
-hr/
kg-
LNG
)
Natural Gas Inlet Temperature (C)
The Effect of Natural Gas Inlet Temperature on Specific Power when natural gas
supplied at 60bar (Niche LNG )
Figure 46: The effect of natural gas inlet temperature on specific power when natural
gas supplied at 60bar (Niche LNG Process)
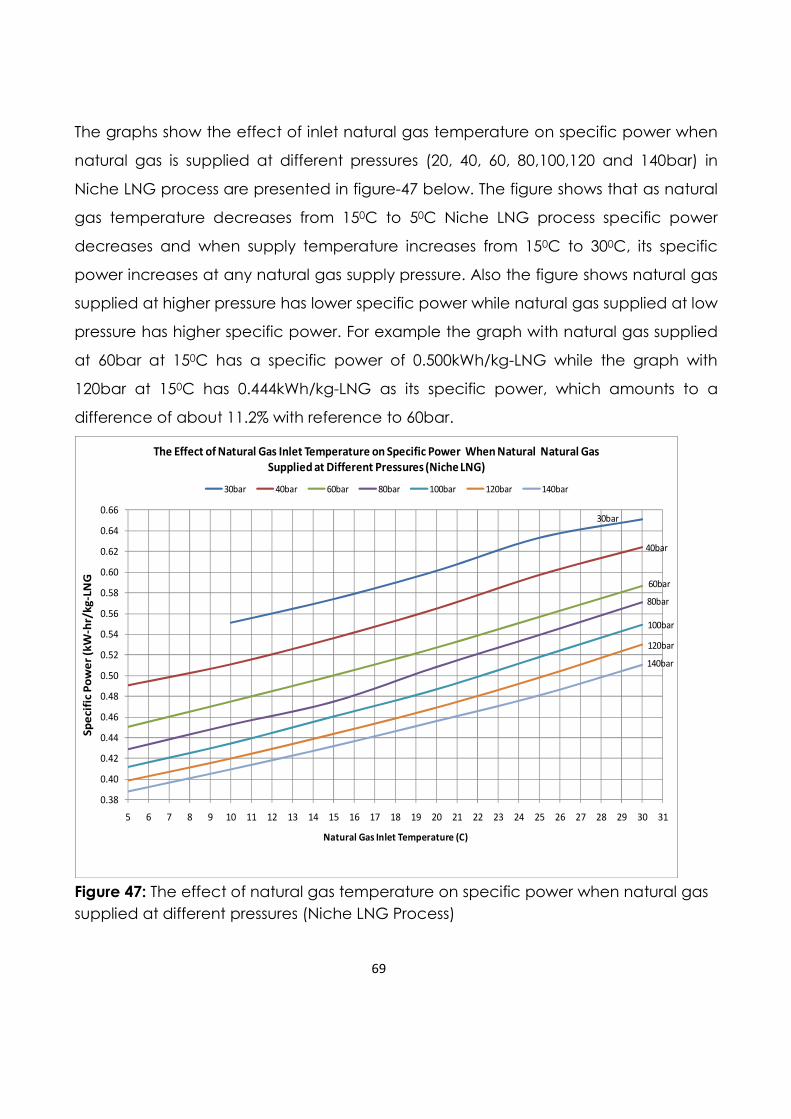
69
The graphs show the effect of inlet natural gas temperature on specific power when
natural gas is supplied at different pressures (20, 40, 60, 80,100,120 and 140bar) in
Niche LNG process are presented in figure-47 below. The figure shows that as natural
gas temperature decreases from 150C to 50C Niche LNG process specific power
decreases and when supply temperature increases from 150C to 300C, its specific
power increases at any natural gas supply pressure. Also the figure shows natural gas
supplied at higher pressure has lower specific power while natural gas supplied at low
pressure has higher specific power. For example the graph with natural gas supplied
at 60bar at 150C has a specific power of 0.500kWh/kg-LNG while the graph with
120bar at 150C has 0.444kWh/kg-LNG as its specific power, which amounts to a
difference of about 11.2% with reference to 60bar.
0.38
0.40
0.42
0.44
0.46
0.48
0.50
0.52
0.54
0.56
0.58
0.60
0.62
0.64
0.66
5 6 7 8 9 10 11 12 13 14 15 16 17 18 19 20 21 22 23 24 25 26 27 28 29 30 31
Sp
eci
fic
Po
we
r (k
W-h
r/k
g-L
NG
Natural Gas Inlet Temperature (C)
The Effect of Natural Gas Inlet Temperature on Specific Power When Natural Natural Gas
Supplied at Different Pressures (Niche LNG)
30bar 40bar 60bar 80bar 100bar 120bar 140bar
30bar
40bar
60bar
80bar
100bar
120bar
140bar
Figure 47: The effect of natural gas temperature on specific power when natural gas
supplied at different pressures (Niche LNG Process)

70
b) The effect of natural gas inlet temperature on power consumption
The effect of natural gas inlet temperature on power consumption when natural gas
is supplied at 60bar in Niche LNG process is presented in figure-48 below. The figure
shows that when natural gas supply temperature decreases from 150C to 50C, power
consumption of Niche LNG process decreases from 62.59 to 56.40MW which amounts
to a 9.9% decrease and when natural gas supply temperature increases from 150C to
250C, the power consumption increases from 62.59 to 69.64MW which amounts to an
11.3% increase. Generally the figure shows that power consumption of Niche LNG
process decreases with decrease in natural gas supply temperature and increases
with increase in natural gas supply temperature.
56
57
58
59
60
61
62
63
64
65
66
67
68
69
70
71
72
73
74
5 7 9 11 13 15 17 19 21 23 25 27 29 31
Po
we
r C
on
sum
pti
on
(M
W)
Natural Gas Inlet Temperature (0C)
The Effect of Natural Gas Inlet Temperature on Power Consumption When
Natural Gas Supplied at 60bar (Niche LNG)
Figure 48: The effect of natural gas inlet temperature of power consumption when
natural gas supplied at 60bar (Niche LNG)
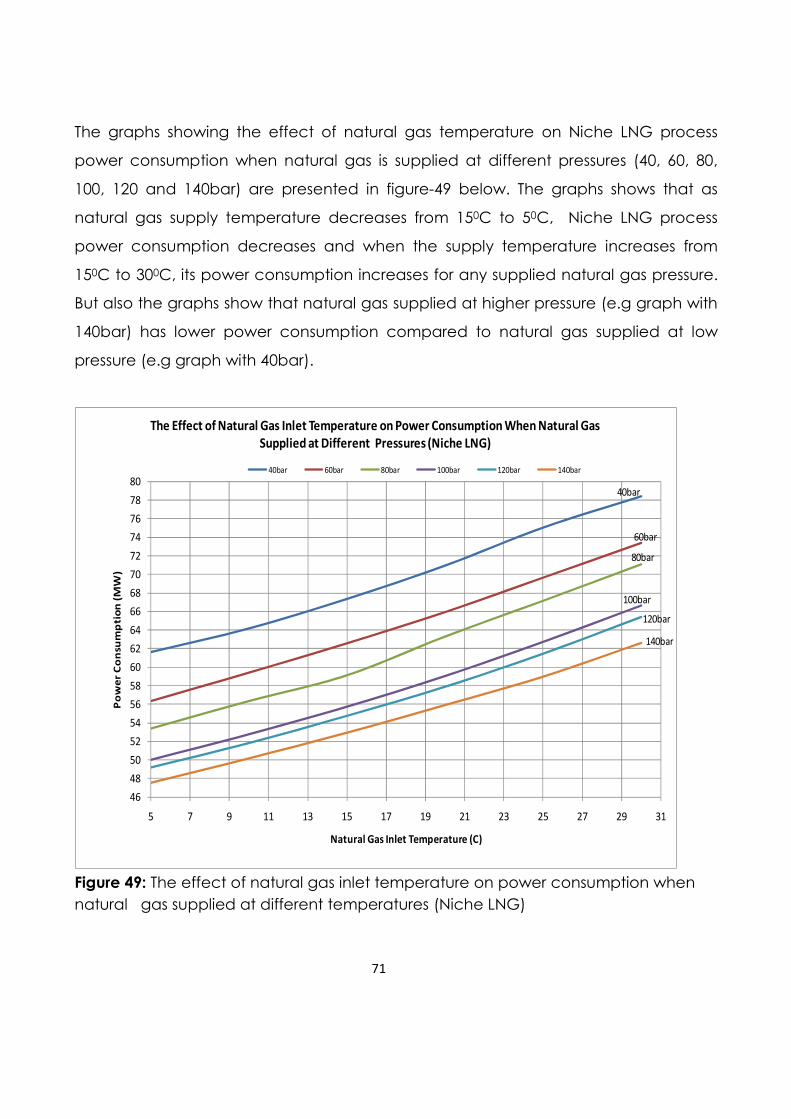
71
The graphs showing the effect of natural gas temperature on Niche LNG process
power consumption when natural gas is supplied at different pressures (40, 60, 80,
100, 120 and 140bar) are presented in figure-49 below. The graphs shows that as
natural gas supply temperature decreases from 150C to 50C, Niche LNG process
power consumption decreases and when the supply temperature increases from
150C to 300C, its power consumption increases for any supplied natural gas pressure.
But also the graphs show that natural gas supplied at higher pressure (e.g graph with
140bar) has lower power consumption compared to natural gas supplied at low
pressure (e.g graph with 40bar).
46
48
50
52
54
56
58
60
62
64
66
68
70
72
74
76
78
80
5 7 9 11 13 15 17 19 21 23 25 27 29 31
Po
we
r C
on
sum
pti
on
(M
W)
Natural Gas Inlet Temperature (C)
The Effect of Natural Gas Inlet Temperature on Power Consumption When Natural Gas
Supplied at Different Pressures (Niche LNG)
40bar 60bar 80bar 100bar 120bar 140bar
60bar
40bar
80bar
100bar
120bar
140bar
Figure 49: The effect of natural gas inlet temperature on power consumption when
natural gas supplied at different temperatures (Niche LNG)
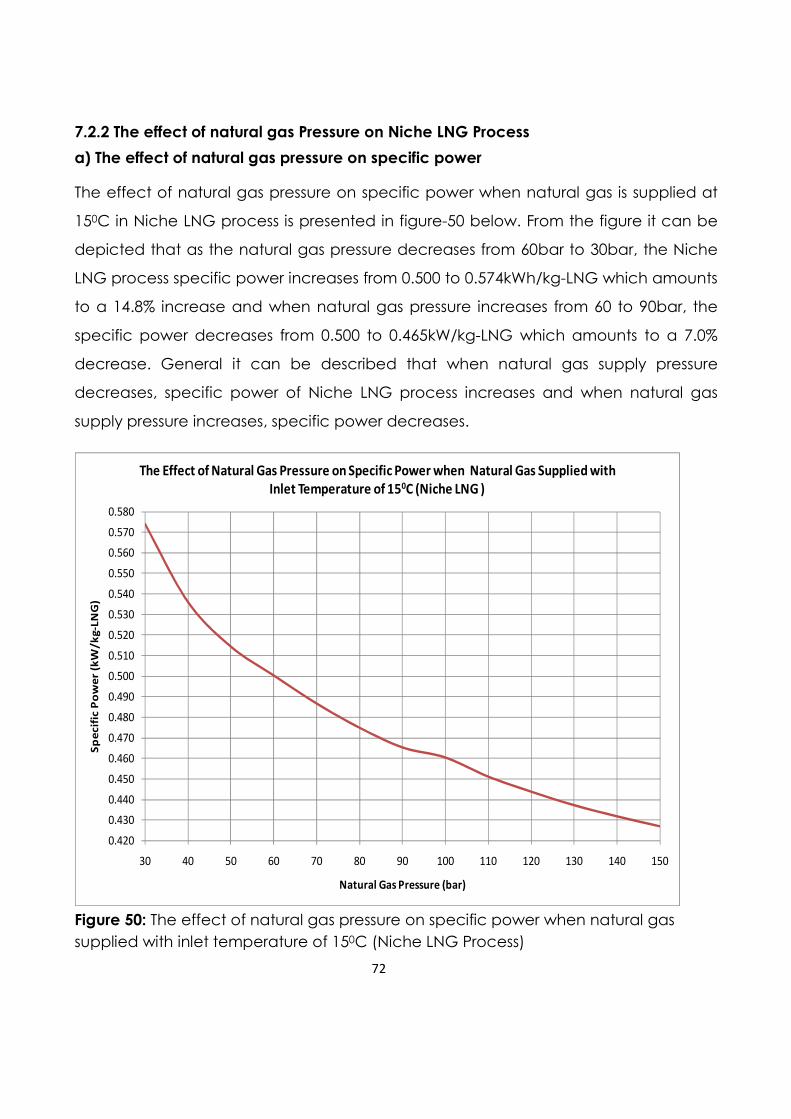
72
7.2.2 The effect of natural gas Pressure on Niche LNG Process
a) The effect of natural gas pressure on specific power
The effect of natural gas pressure on specific power when natural gas is supplied at
150C in Niche LNG process is presented in figure-50 below. From the figure it can be
depicted that as the natural gas pressure decreases from 60bar to 30bar, the Niche
LNG process specific power increases from 0.500 to 0.574kWh/kg-LNG which amounts
to a 14.8% increase and when natural gas pressure increases from 60 to 90bar, the
specific power decreases from 0.500 to 0.465kW/kg-LNG which amounts to a 7.0%
decrease. General it can be described that when natural gas supply pressure
decreases, specific power of Niche LNG process increases and when natural gas
supply pressure increases, specific power decreases.
0.420
0.430
0.440
0.450
0.460
0.470
0.480
0.490
0.500
0.510
0.520
0.530
0.540
0.550
0.560
0.570
0.580
30 40 50 60 70 80 90 100 110 120 130 140 150
Sp
ecif
ic P
ow
er
(kW
/k
g-L
NG
)
Natural Gas Pressure (bar)
The Effect of Natural Gas Pressure on Specific Power when Natural Gas Supplied with
Inlet Temperature of 150C (Niche LNG )
Figure 50: The effect of natural gas pressure on specific power when natural gas
supplied with inlet temperature of 150C (Niche LNG Process)
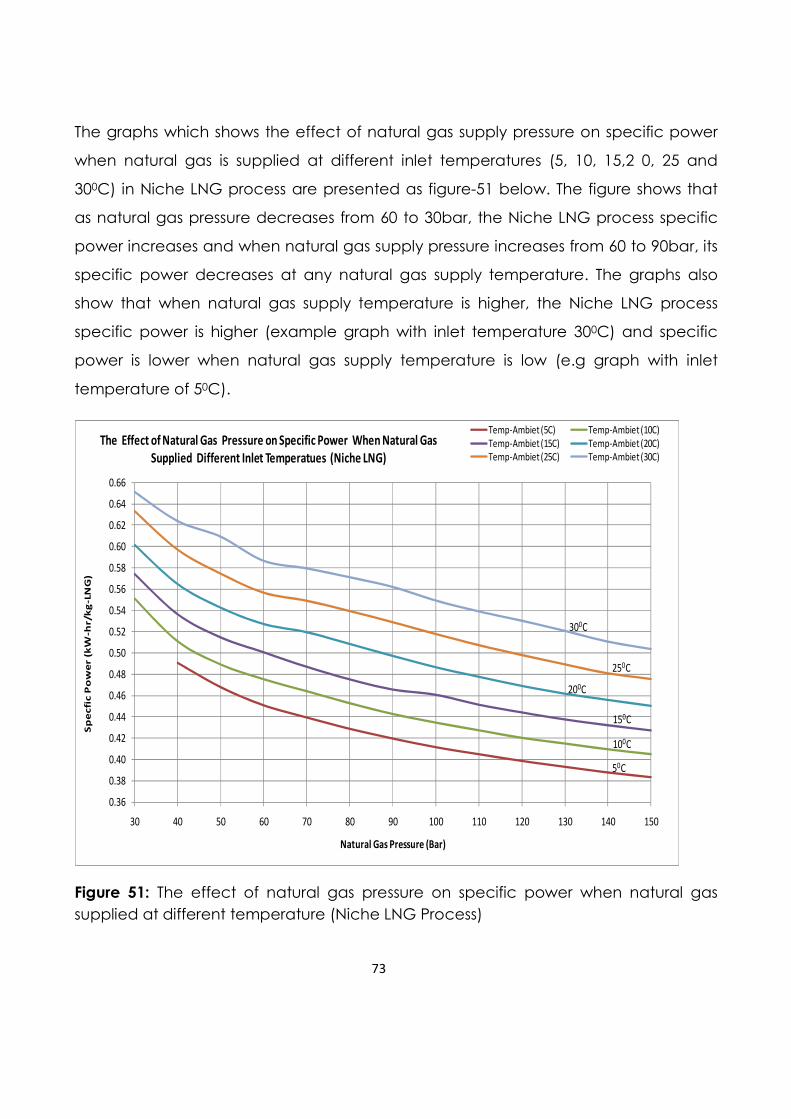
73
The graphs which shows the effect of natural gas supply pressure on specific power
when natural gas is supplied at different inlet temperatures (5, 10, 15,2 0, 25 and
300C) in Niche LNG process are presented as figure-51 below. The figure shows that
as natural gas pressure decreases from 60 to 30bar, the Niche LNG process specific
power increases and when natural gas supply pressure increases from 60 to 90bar, its
specific power decreases at any natural gas supply temperature. The graphs also
show that when natural gas supply temperature is higher, the Niche LNG process
specific power is higher (example graph with inlet temperature 300C) and specific
power is lower when natural gas supply temperature is low (e.g graph with inlet
temperature of 50C).
0.36
0.38
0.40
0.42
0.44
0.46
0.48
0.50
0.52
0.54
0.56
0.58
0.60
0.62
0.64
0.66
30 40 50 60 70 80 90 100 110 120 130 140 150
Sp
ecfi
c P
ow
er (
kW
-hr/k
g-L
NG
)
Natural Gas Pressure (Bar)
The Effect of Natural Gas Pressure on Specific Power When Natural Gas
Supplied Different Inlet Temperatues (Niche LNG)
Temp-Ambiet (5C) Temp-Ambiet (10C)
Temp-Ambiet (15C) Temp-Ambiet (20C)
Temp-Ambiet (25C) Temp-Ambiet (30C)
300C
250C
200C
150C
100C
50C
Figure 51: The effect of natural gas pressure on specific power when natural gas
supplied at different temperature (Niche LNG Process)
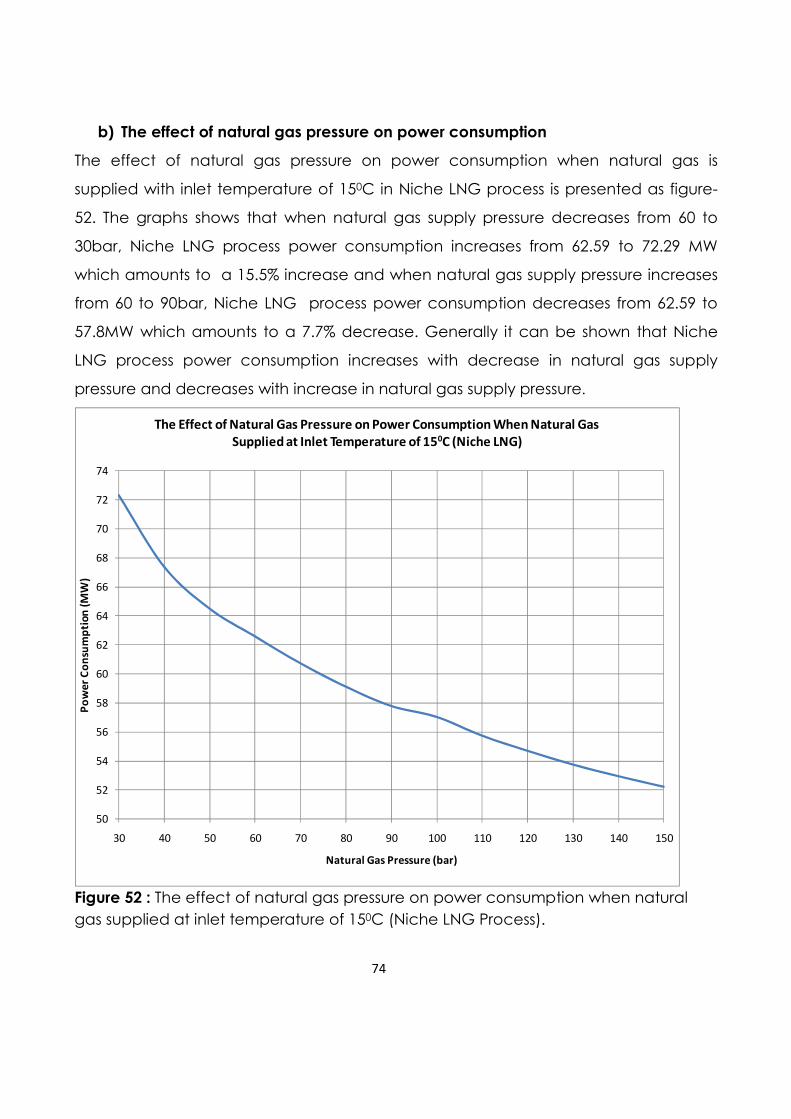
74
b) The effect of natural gas pressure on power consumption
The effect of natural gas pressure on power consumption when natural gas is
supplied with inlet temperature of 150C in Niche LNG process is presented as figure-
52. The graphs shows that when natural gas supply pressure decreases from 60 to
30bar, Niche LNG process power consumption increases from 62.59 to 72.29 MW
which amounts to a 15.5% increase and when natural gas supply pressure increases
from 60 to 90bar, Niche LNG process power consumption decreases from 62.59 to
57.8MW which amounts to a 7.7% decrease. Generally it can be shown that Niche
LNG process power consumption increases with decrease in natural gas supply
pressure and decreases with increase in natural gas supply pressure.
50
52
54
56
58
60
62
64
66
68
70
72
74
30 40 50 60 70 80 90 100 110 120 130 140 150
Po
we
r C
on
sum
pti
on
(M
W)
Natural Gas Pressure (bar)
The Effect of Natural Gas Pressure on Power Consumption When Natural Gas
Supplied at Inlet Temperature of 150C (Niche LNG)
Figure 52 : The effect of natural gas pressure on power consumption when natural
gas supplied at inlet temperature of 150C (Niche LNG Process).
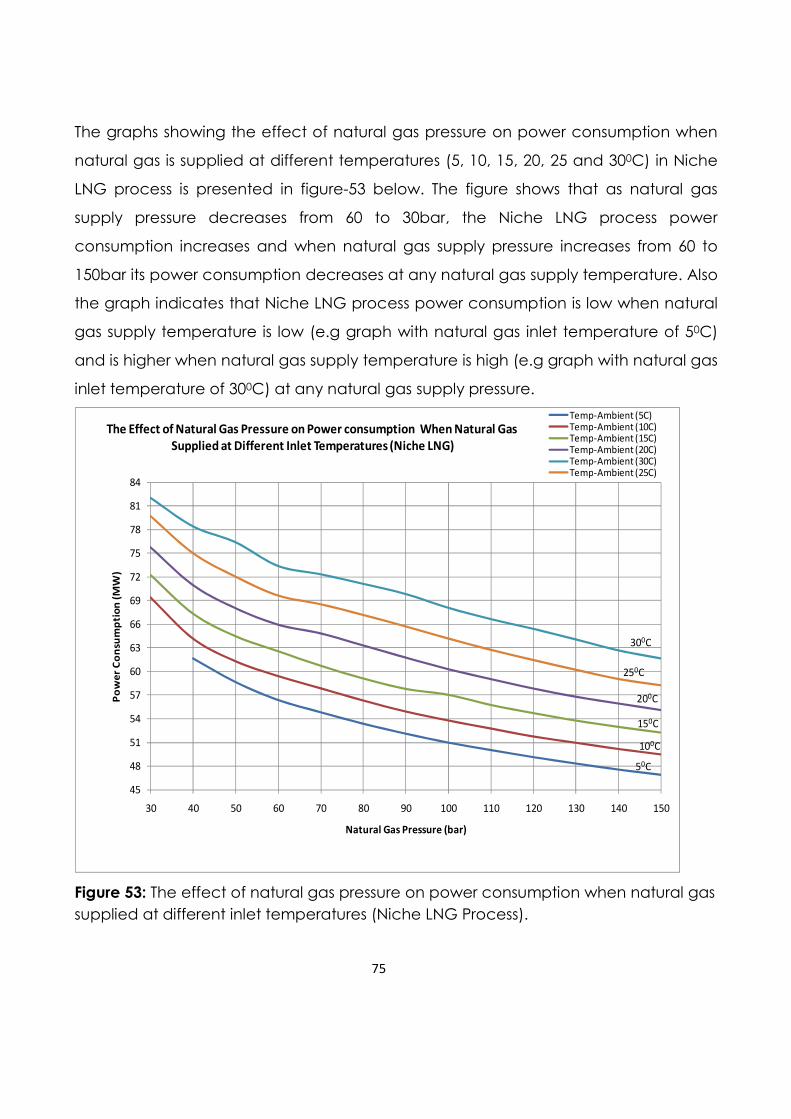
75
The graphs showing the effect of natural gas pressure on power consumption when
natural gas is supplied at different temperatures (5, 10, 15, 20, 25 and 300C) in Niche
LNG process is presented in figure-53 below. The figure shows that as natural gas
supply pressure decreases from 60 to 30bar, the Niche LNG process power
consumption increases and when natural gas supply pressure increases from 60 to
150bar its power consumption decreases at any natural gas supply temperature. Also
the graph indicates that Niche LNG process power consumption is low when natural
gas supply temperature is low (e.g graph with natural gas inlet temperature of 50C)
and is higher when natural gas supply temperature is high (e.g graph with natural gas
inlet temperature of 300C) at any natural gas supply pressure.
45
48
51
54
57
60
63
66
69
72
75
78
81
84
30 40 50 60 70 80 90 100 110 120 130 140 150
Po
we
r C
on
sum
pti
on
(M
W)
Natural Gas Pressure (bar)
The Effect of Natural Gas Pressure on Power consumption When Natural Gas
Supplied at Different Inlet Temperatures (Niche LNG)
Temp-Ambient (5C)Temp-Ambient (10C)Temp-Ambient (15C)Temp-Ambient (20C)Temp-Ambient (30C)Temp-Ambient (25C)
50C
100C
150C
200C
250C
300C
Figure 53: The effect of natural gas pressure on power consumption when natural gas
supplied at different inlet temperatures (Niche LNG Process).
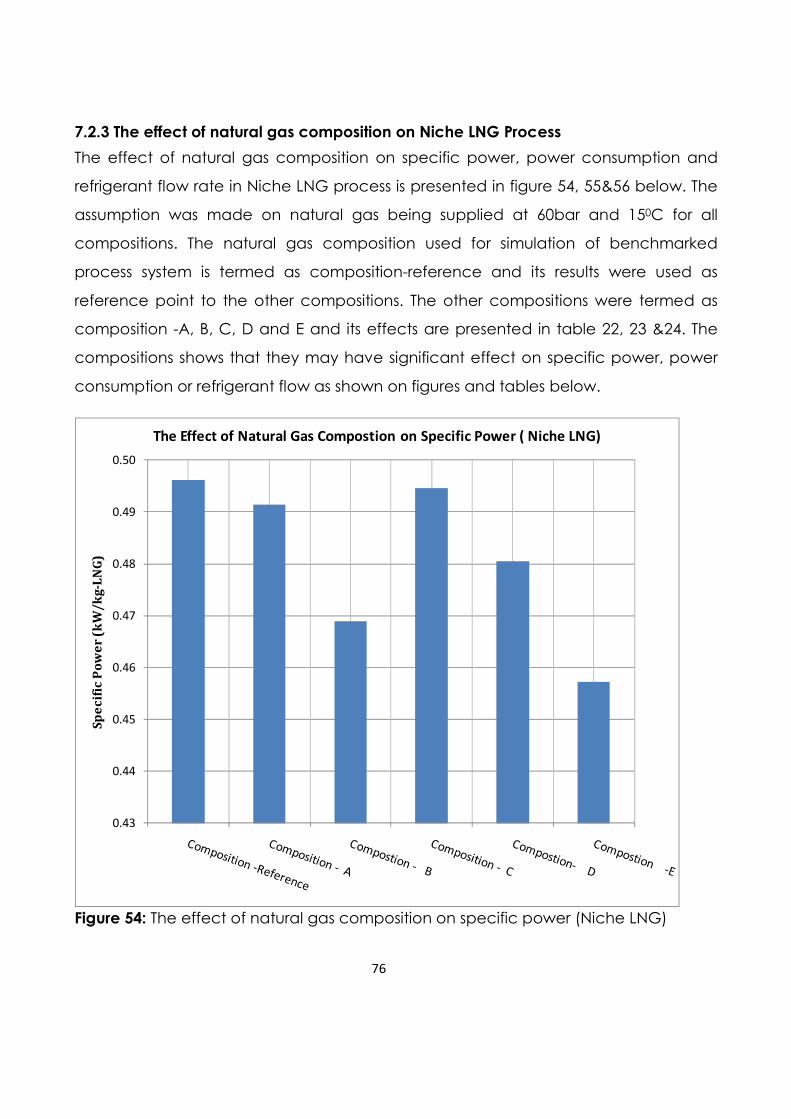
76
7.2.3 The effect of natural gas composition on Niche LNG Process
The effect of natural gas composition on specific power, power consumption and
refrigerant flow rate in Niche LNG process is presented in figure 54, 55&56 below. The
assumption was made on natural gas being supplied at 60bar and 150C for all
compositions. The natural gas composition used for simulation of benchmarked
process system is termed as composition-reference and its results were used as
reference point to the other compositions. The other compositions were termed as
composition -A, B, C, D and E and its effects are presented in table 22, 23 &24. The
compositions shows that they may have significant effect on specific power, power
consumption or refrigerant flow as shown on figures and tables below.
0.43
0.44
0.45
0.46
0.47
0.48
0.49
0.50
Sp
ec
ific
Po
we
r (k
W/
kg
-LN
G)
The Effect of Natural Gas Compostion on Specific Power ( Niche LNG)
Figure 54: The effect of natural gas composition on specific power (Niche LNG)
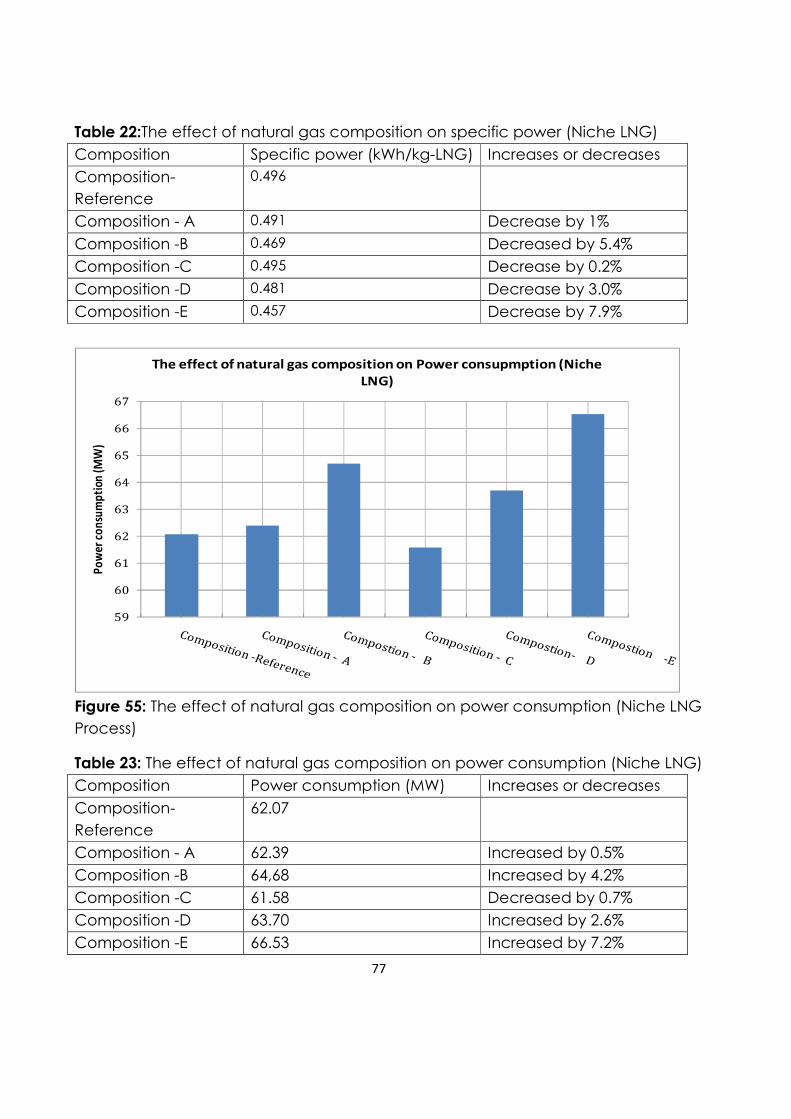
77
Table 22:The effect of natural gas composition on specific power (Niche LNG)
Composition Specific power (kWh/kg-LNG) Increases or decreases
Composition-
Reference
0.496
Composition - A 0.491 Decrease by 1%
Composition -B 0.469 Decreased by 5.4%
Composition -C 0.495 Decrease by 0.2%
Composition -D 0.481 Decrease by 3.0%
Composition -E 0.457 Decrease by 7.9%
59
60
61
62
63
64
65
66
67
Po
wer
co
nsu
mp
tion
(MW
)
The effect of natural gas composition on Power consupmption (Niche
LNG)
Figure 55: The effect of natural gas composition on power consumption (Niche LNG
Process)
Table 23: The effect of natural gas composition on power consumption (Niche LNG)
Composition Power consumption (MW) Increases or decreases
Composition-
Reference
62.07
Composition - A 62.39 Increased by 0.5%
Composition -B 64,68 Increased by 4.2%
Composition -C 61.58 Decreased by 0.7%
Composition -D 63.70 Increased by 2.6%
Composition -E 66.53 Increased by 7.2%
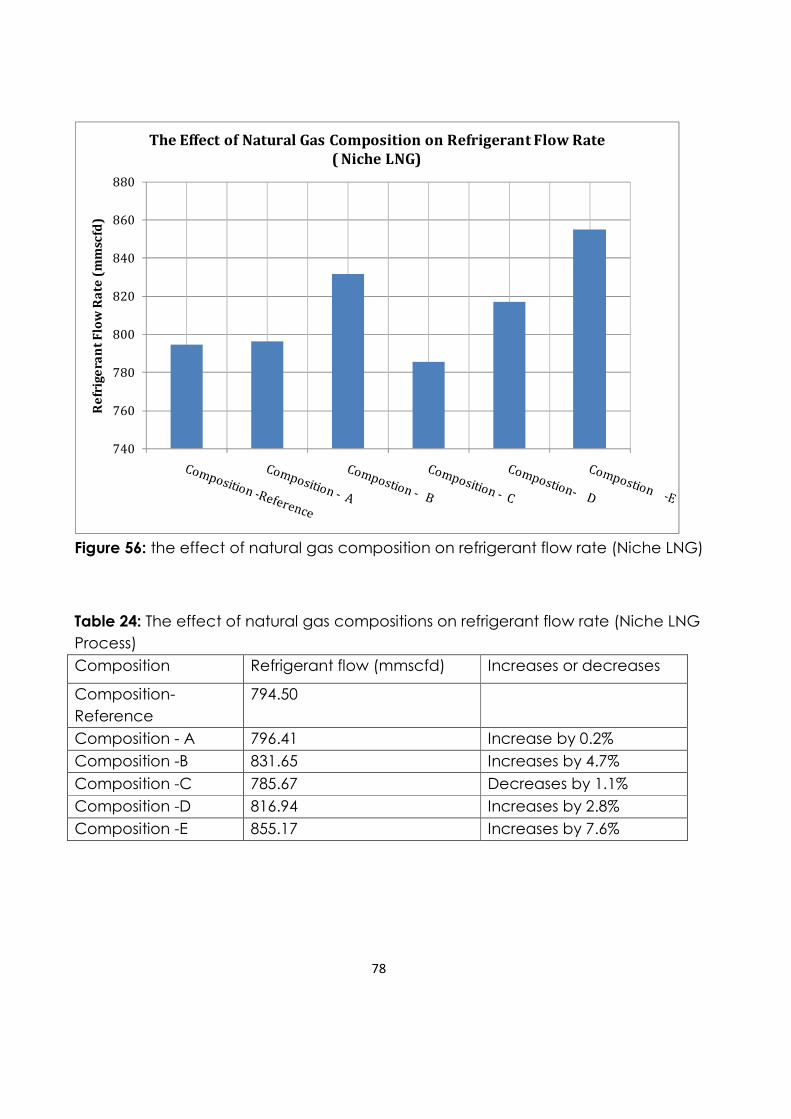
78
740
760
780
800
820
840
860
880
Re
frig
era
nt
Flo
w R
ate
(m
msc
fd)
The Effect of Natural Gas Composition on Refrigerant Flow Rate
( Niche LNG)
Figure 56: the effect of natural gas composition on refrigerant flow rate (Niche LNG)
Table 24: The effect of natural gas compositions on refrigerant flow rate (Niche LNG
Process)
Composition Refrigerant flow (mmscfd) Increases or decreases
Composition-
Reference
794.50
Composition - A 796.41 Increase by 0.2%
Composition -B 831.65 Increases by 4.7%
Composition -C 785.67 Decreases by 1.1%
Composition -D 816.94 Increases by 2.8%
Composition -E 855.17 Increases by 7.6%
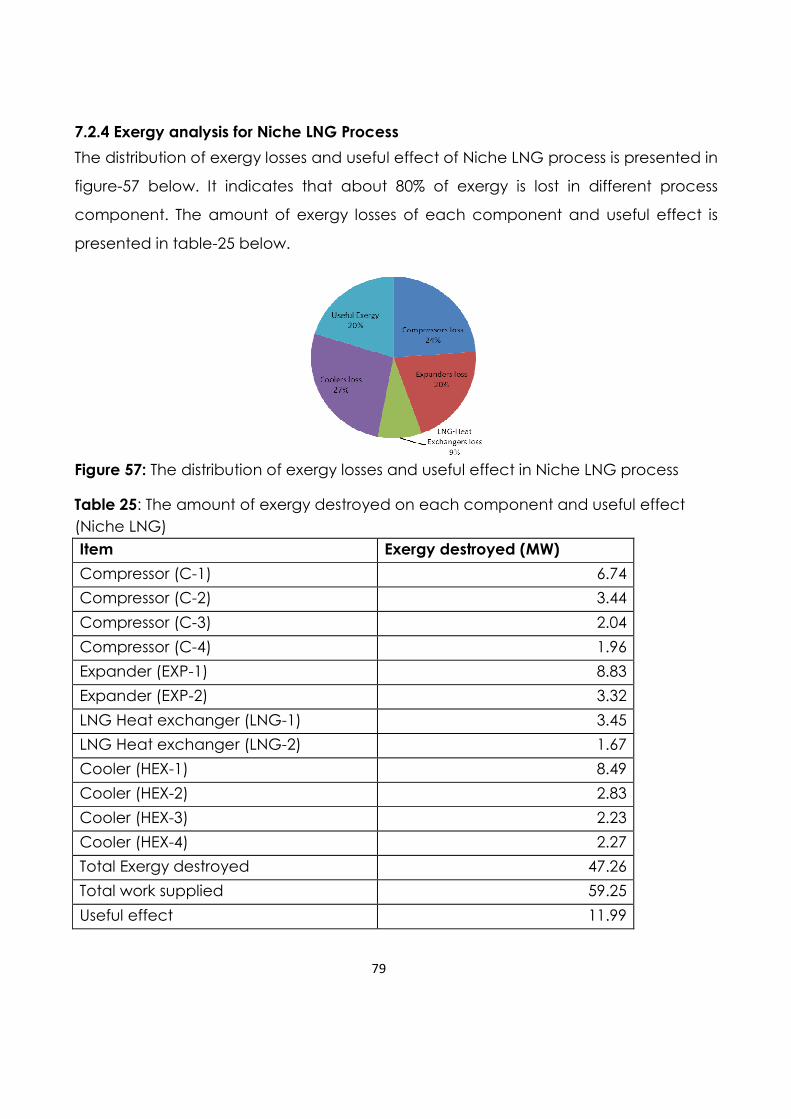
79
7.2.4 Exergy analysis for Niche LNG Process
The distribution of exergy losses and useful effect of Niche LNG process is presented in
figure-57 below. It indicates that about 80% of exergy is lost in different process
component. The amount of exergy losses of each component and useful effect is
presented in table-25 below.
Figure 57: The distribution of exergy losses and useful effect in Niche LNG process
Table 25: The amount of exergy destroyed on each component and useful effect
(Niche LNG)
Item Exergy destroyed (MW)
Compressor (C-1) 6.74
Compressor (C-2) 3.44
Compressor (C-3) 2.04
Compressor (C-4) 1.96
Expander (EXP-1) 8.83
Expander (EXP-2) 3.32
LNG Heat exchanger (LNG-1) 3.45
LNG Heat exchanger (LNG-2) 1.67
Cooler (HEX-1) 8.49
Cooler (HEX-2) 2.83
Cooler (HEX-3) 2.23
Cooler (HEX-4) 2.27
Total Exergy destroyed 47.26
Total work supplied 59.25
Useful effect 11.99
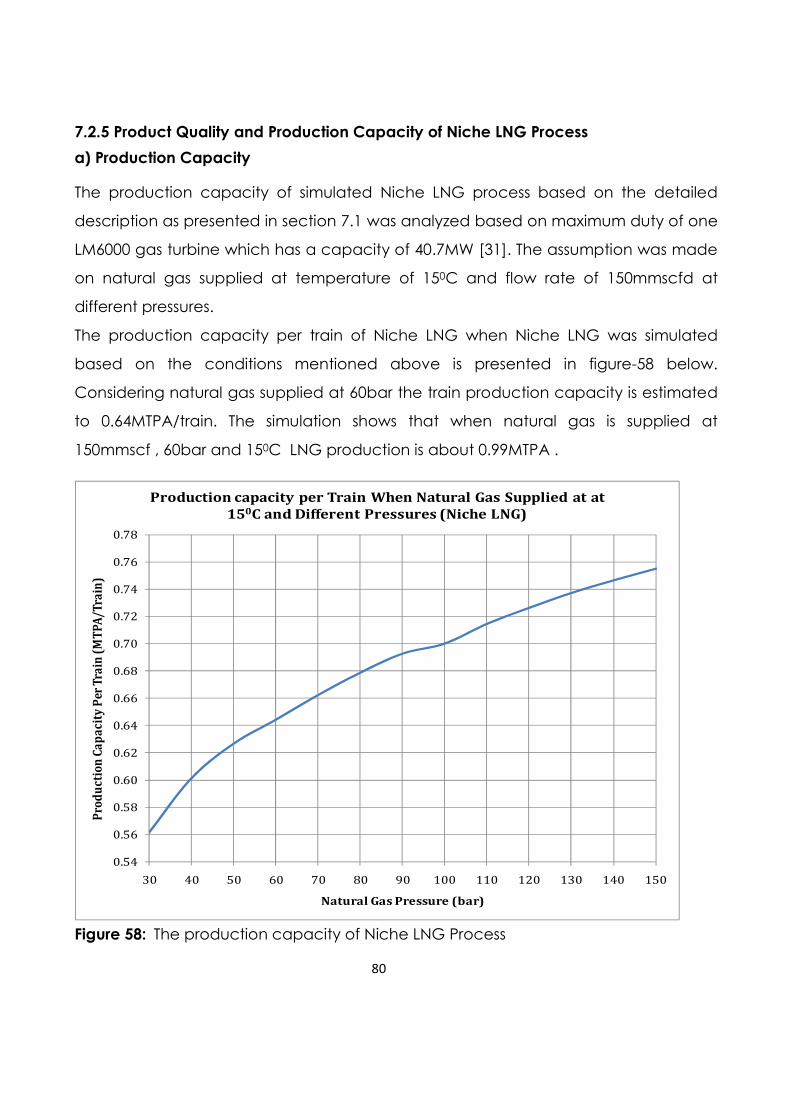
80
7.2.5 Product Quality and Production Capacity of Niche LNG Process
a) Production Capacity
The production capacity of simulated Niche LNG process based on the detailed
description as presented in section 7.1 was analyzed based on maximum duty of one
LM6000 gas turbine which has a capacity of 40.7MW [31]. The assumption was made
on natural gas supplied at temperature of 150C and flow rate of 150mmscfd at
different pressures.
The production capacity per train of Niche LNG when Niche LNG was simulated
based on the conditions mentioned above is presented in figure-58 below.
Considering natural gas supplied at 60bar the train production capacity is estimated
to 0.64MTPA/train. The simulation shows that when natural gas is supplied at
150mmscf , 60bar and 150C LNG production is about 0.99MTPA .
0.54
0.56
0.58
0.60
0.62
0.64
0.66
0.68
0.70
0.72
0.74
0.76
0.78
30 40 50 60 70 80 90 100 110 120 130 140 150
Pro
du
ctio
n C
ap
aci
ty P
er T
rain
(M
TP
A/T
rain
)
Natural Gas Pressure (bar)
Production capacity per Train When Natural Gas Supplied at at
150C and Different Pressures (Niche LNG)
Figure 58: The production capacity of Niche LNG Process
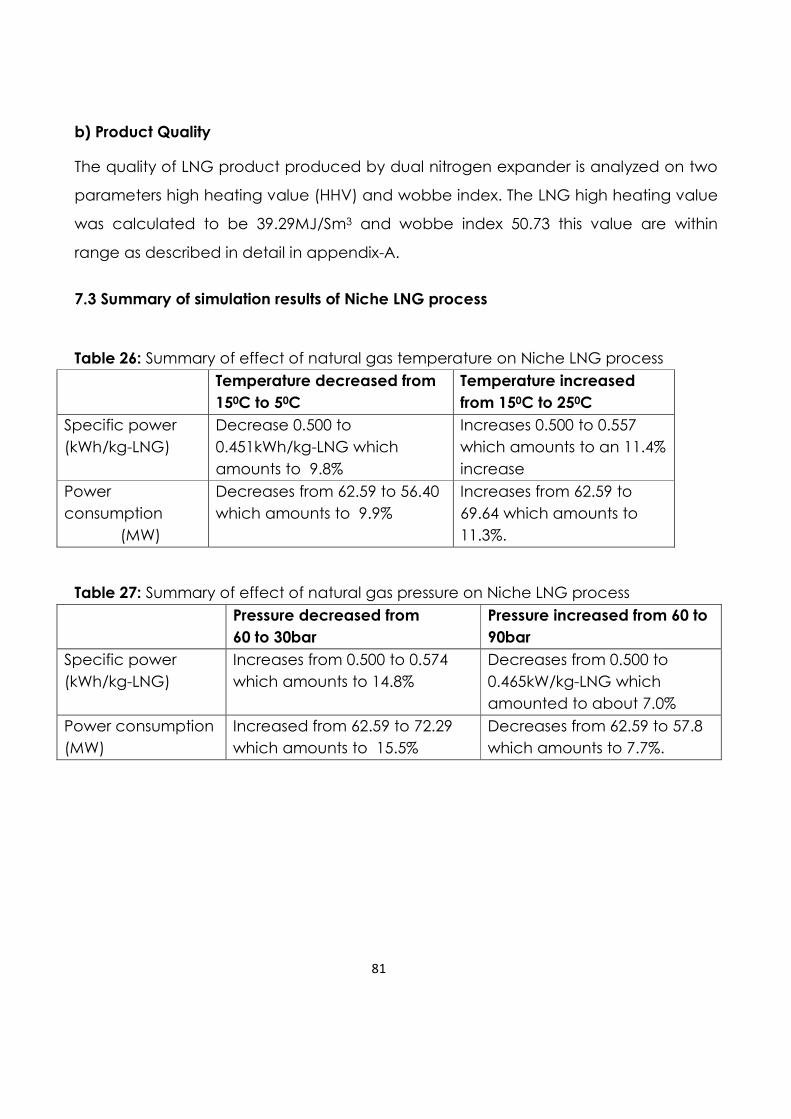
81
b) Product Quality
The quality of LNG product produced by dual nitrogen expander is analyzed on two
parameters high heating value (HHV) and wobbe index. The LNG high heating value
was calculated to be 39.29MJ/Sm3 and wobbe index 50.73 this value are within
range as described in detail in appendix-A.
7.3 Summary of simulation results of Niche LNG process
Table 26: Summary of effect of natural gas temperature on Niche LNG process
Temperature decreased from
150C to 50C
Temperature increased
from 150C to 250C
Specific power
(kWh/kg-LNG)
Decrease 0.500 to
0.451kWh/kg-LNG which
amounts to 9.8%
Increases 0.500 to 0.557
which amounts to an 11.4%
increase
Power
consumption
(MW)
Decreases from 62.59 to 56.40
which amounts to 9.9%
Increases from 62.59 to
69.64 which amounts to
11.3%.
Table 27: Summary of effect of natural gas pressure on Niche LNG process
Pressure decreased from
60 to 30bar
Pressure increased from 60 to
90bar
Specific power
(kWh/kg-LNG)
Increases from 0.500 to 0.574
which amounts to 14.8%
Decreases from 0.500 to
0.465kW/kg-LNG which
amounted to about 7.0%
Power consumption
(MW)
Increased from 62.59 to 72.29
which amounts to 15.5%
Decreases from 62.59 to 57.8
which amounts to 7.7%.
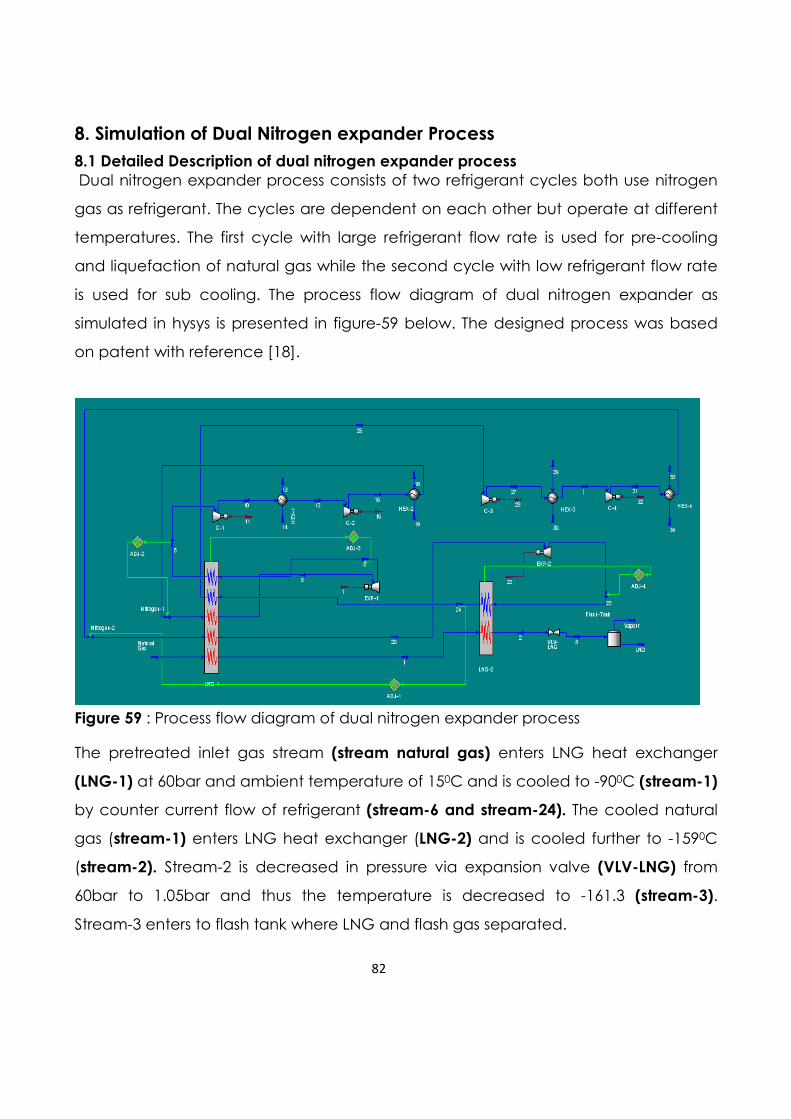
82
8. Simulation of Dual Nitrogen expander Process
8.1 Detailed Description of dual nitrogen expander process
Dual nitrogen expander process consists of two refrigerant cycles both use nitrogen
gas as refrigerant. The cycles are dependent on each other but operate at different
temperatures. The first cycle with large refrigerant flow rate is used for pre-cooling
and liquefaction of natural gas while the second cycle with low refrigerant flow rate
is used for sub cooling. The process flow diagram of dual nitrogen expander as
simulated in hysys is presented in figure-59 below. The designed process was based
on patent with reference [18].
Figure 59 : Process flow diagram of dual nitrogen expander process
The pretreated inlet gas stream (stream natural gas) enters LNG heat exchanger
(LNG-1) at 60bar and ambient temperature of 150C and is cooled to -900C (stream-1)
by counter current flow of refrigerant (stream-6 and stream-24). The cooled natural
gas (stream-1) enters LNG heat exchanger (LNG-2) and is cooled further to -1590C
(stream-2). Stream-2 is decreased in pressure via expansion valve (VLV-LNG) from
60bar to 1.05bar and thus the temperature is decreased to -161.3 (stream-3).
Stream-3 enters to flash tank where LNG and flash gas separated.
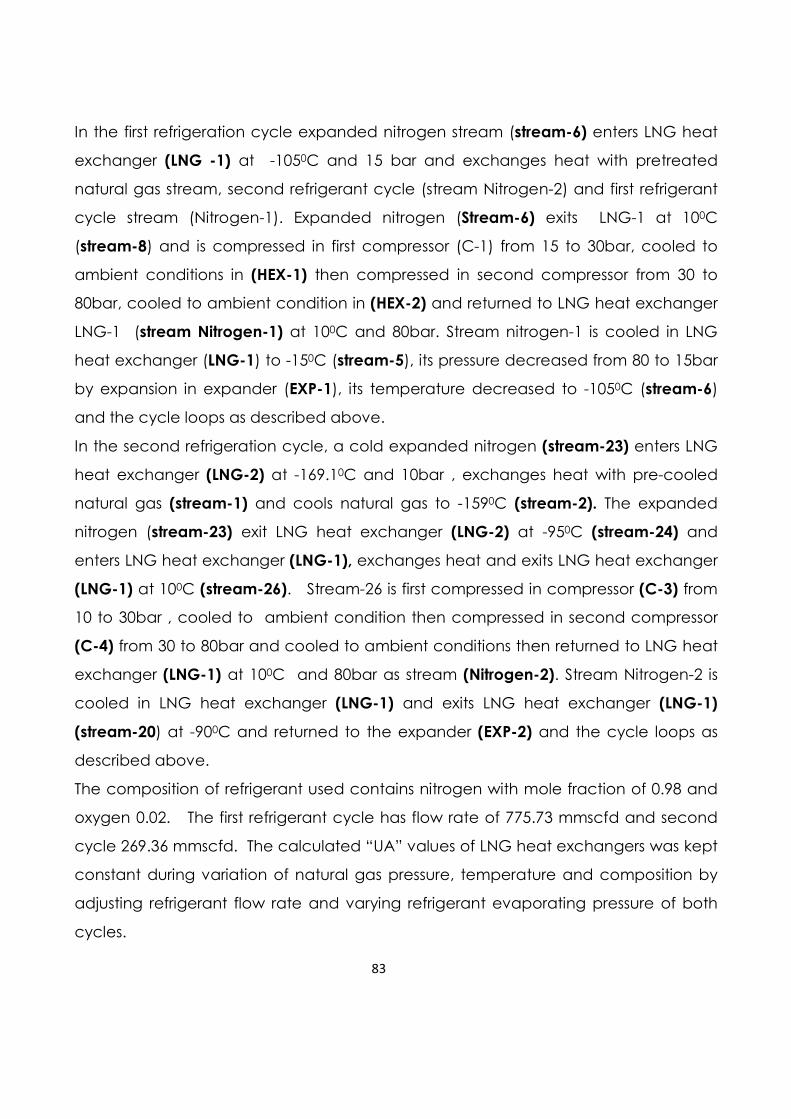
83
In the first refrigeration cycle expanded nitrogen stream (stream-6) enters LNG heat
exchanger (LNG -1) at -1050C and 15 bar and exchanges heat with pretreated
natural gas stream, second refrigerant cycle (stream Nitrogen-2) and first refrigerant
cycle stream (Nitrogen-1). Expanded nitrogen (Stream-6) exits LNG-1 at 100C
(stream-8) and is compressed in first compressor (C-1) from 15 to 30bar, cooled to
ambient conditions in (HEX-1) then compressed in second compressor from 30 to
80bar, cooled to ambient condition in (HEX-2) and returned to LNG heat exchanger
LNG-1 (stream Nitrogen-1) at 100C and 80bar. Stream nitrogen-1 is cooled in LNG
heat exchanger (LNG-1) to -150C (stream-5), its pressure decreased from 80 to 15bar
by expansion in expander (EXP-1), its temperature decreased to -1050C (stream-6)
and the cycle loops as described above.
In the second refrigeration cycle, a cold expanded nitrogen (stream-23) enters LNG
heat exchanger (LNG-2) at -169.10C and 10bar , exchanges heat with pre-cooled
natural gas (stream-1) and cools natural gas to -1590C (stream-2). The expanded
nitrogen (stream-23) exit LNG heat exchanger (LNG-2) at -950C (stream-24) and
enters LNG heat exchanger (LNG-1), exchanges heat and exits LNG heat exchanger
(LNG-1) at 100C (stream-26). Stream-26 is first compressed in compressor (C-3) from
10 to 30bar , cooled to ambient condition then compressed in second compressor
(C-4) from 30 to 80bar and cooled to ambient conditions then returned to LNG heat
exchanger (LNG-1) at 100C and 80bar as stream (Nitrogen-2). Stream Nitrogen-2 is
cooled in LNG heat exchanger (LNG-1) and exits LNG heat exchanger (LNG-1)
(stream-20) at -900C and returned to the expander (EXP-2) and the cycle loops as
described above.
The composition of refrigerant used contains nitrogen with mole fraction of 0.98 and
oxygen 0.02. The first refrigerant cycle has flow rate of 775.73 mmscfd and second
cycle 269.36 mmscfd. The calculated “UA” values of LNG heat exchangers was kept
constant during variation of natural gas pressure, temperature and composition by
adjusting refrigerant flow rate and varying refrigerant evaporating pressure of both
cycles.

84
8.2 Simulation results for Dual Nitrogen expander
The hysys simulation of dual nitrogen expander process was based on process
detailed description as presented in section 8.1 above. During the simulation some of
the key parameters calculated were LNG heat exchangers “UA” values which was
found to be 4,195.67kW/0C for LNG heat exchanger LNG-1 and 852.094kW/C for
LNG heat exchanger LNG-2 at minimum approach temperature of 50C for both heat
exchanger and LMTD of 10.90C for both heat exchangers. The specific power of the
process based on above conditions was found to be 0.531kWh/kg-LNG.
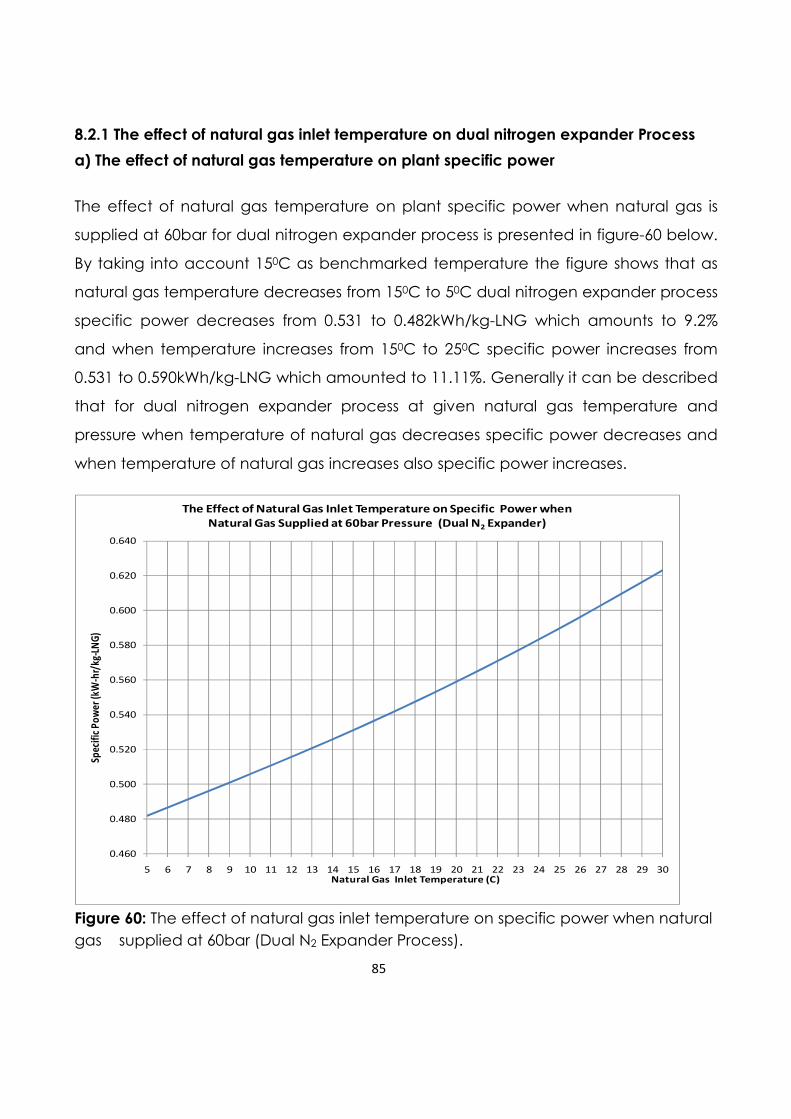
85
8.2.1 The effect of natural gas inlet temperature on dual nitrogen expander Process
a) The effect of natural gas temperature on plant specific power
The effect of natural gas temperature on plant specific power when natural gas is
supplied at 60bar for dual nitrogen expander process is presented in figure-60 below.
By taking into account 150C as benchmarked temperature the figure shows that as
natural gas temperature decreases from 150C to 50C dual nitrogen expander process
specific power decreases from 0.531 to 0.482kWh/kg-LNG which amounts to 9.2%
and when temperature increases from 150C to 250C specific power increases from
0.531 to 0.590kWh/kg-LNG which amounted to 11.11%. Generally it can be described
that for dual nitrogen expander process at given natural gas temperature and
pressure when temperature of natural gas decreases specific power decreases and
when temperature of natural gas increases also specific power increases.
0.460
0.480
0.500
0.520
0.540
0.560
0.580
0.600
0.620
0.640
5 6 7 8 9 10 11 12 13 14 15 16 17 18 19 20 21 22 23 24 25 26 27 28 29 30
Spec
ific
Po
wer
(kW
-hr/
kg-L
NG
)
Natural Gas Inlet Temperature (C)
The Effect of Natural Gas Inlet Temperature on Specific Power when
Natural Gas Supplied at 60bar Pressure (Dual N2 Expander)
Figure 60: The effect of natural gas inlet temperature on specific power when natural
gas supplied at 60bar (Dual N2 Expander Process).
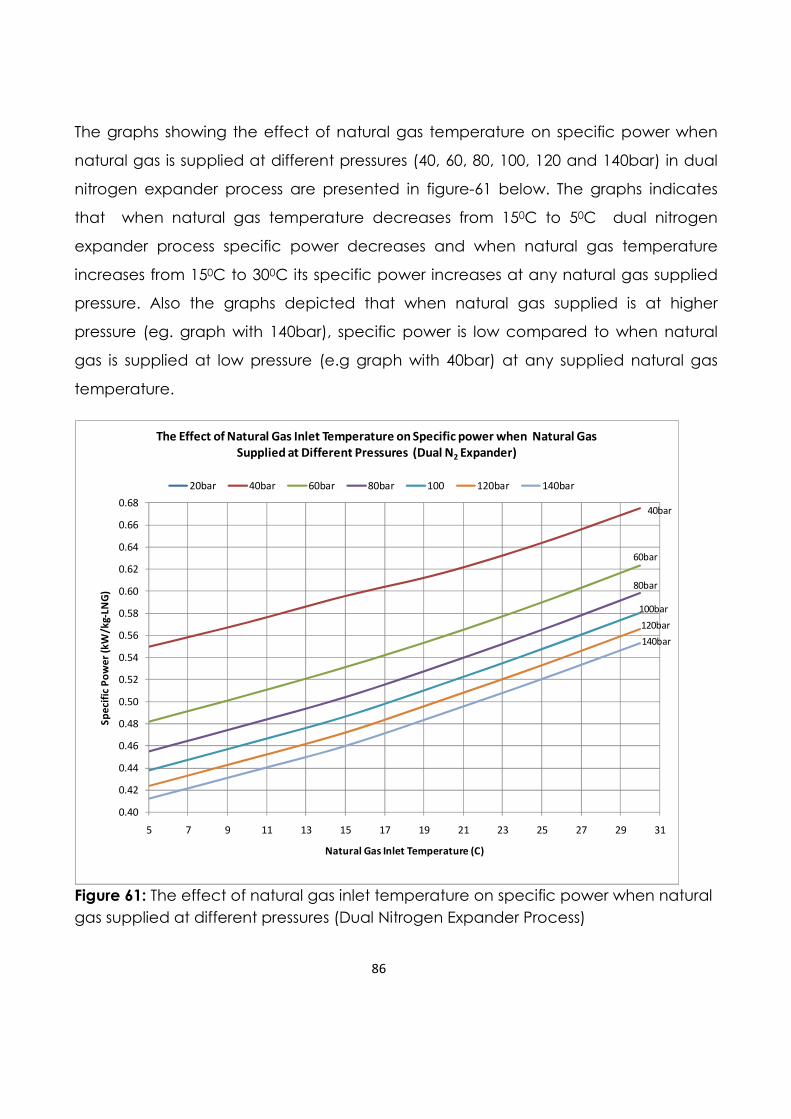
86
The graphs showing the effect of natural gas temperature on specific power when
natural gas is supplied at different pressures (40, 60, 80, 100, 120 and 140bar) in dual
nitrogen expander process are presented in figure-61 below. The graphs indicates
that when natural gas temperature decreases from 150C to 50C dual nitrogen
expander process specific power decreases and when natural gas temperature
increases from 150C to 300C its specific power increases at any natural gas supplied
pressure. Also the graphs depicted that when natural gas supplied is at higher
pressure (eg. graph with 140bar), specific power is low compared to when natural
gas is supplied at low pressure (e.g graph with 40bar) at any supplied natural gas
temperature.
0.40
0.42
0.44
0.46
0.48
0.50
0.52
0.54
0.56
0.58
0.60
0.62
0.64
0.66
0.68
5 7 9 11 13 15 17 19 21 23 25 27 29 31
Sp
eci
fic
Po
we
r (k
W/k
g-LN
G)
Natural Gas Inlet Temperature (C)
The Effect of Natural Gas Inlet Temperature on Specific power when Natural Gas
Supplied at Different Pressures (Dual N2 Expander)
20bar 40bar 60bar 80bar 100 120bar 140bar
40bar
60bar
80bar
100bar
120bar
140bar
Figure 61: The effect of natural gas inlet temperature on specific power when natural
gas supplied at different pressures (Dual Nitrogen Expander Process)
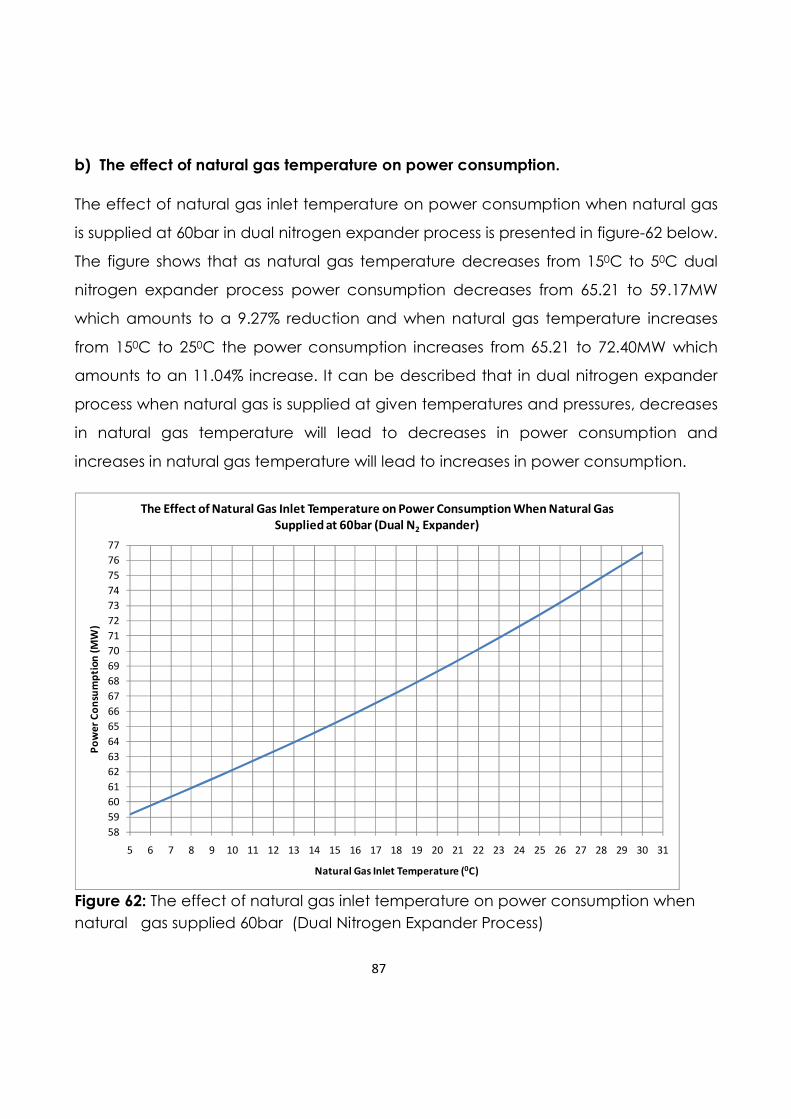
87
b) The effect of natural gas temperature on power consumption.
The effect of natural gas inlet temperature on power consumption when natural gas
is supplied at 60bar in dual nitrogen expander process is presented in figure-62 below.
The figure shows that as natural gas temperature decreases from 150C to 50C dual
nitrogen expander process power consumption decreases from 65.21 to 59.17MW
which amounts to a 9.27% reduction and when natural gas temperature increases
from 150C to 250C the power consumption increases from 65.21 to 72.40MW which
amounts to an 11.04% increase. It can be described that in dual nitrogen expander
process when natural gas is supplied at given temperatures and pressures, decreases
in natural gas temperature will lead to decreases in power consumption and
increases in natural gas temperature will lead to increases in power consumption.
58
59
60
61
62
63
64
65
66
67
68
69
70
71
72
73
74
75
76
77
5 6 7 8 9 10 11 12 13 14 15 16 17 18 19 20 21 22 23 24 25 26 27 28 29 30 31
Po
we
r C
on
sum
pti
on
(M
W)
Natural Gas Inlet Temperature (0C)
The Effect of Natural Gas Inlet Temperature on Power Consumption When Natural Gas
Supplied at 60bar (Dual N2 Expander)
Figure 62: The effect of natural gas inlet temperature on power consumption when
natural gas supplied 60bar (Dual Nitrogen Expander Process)
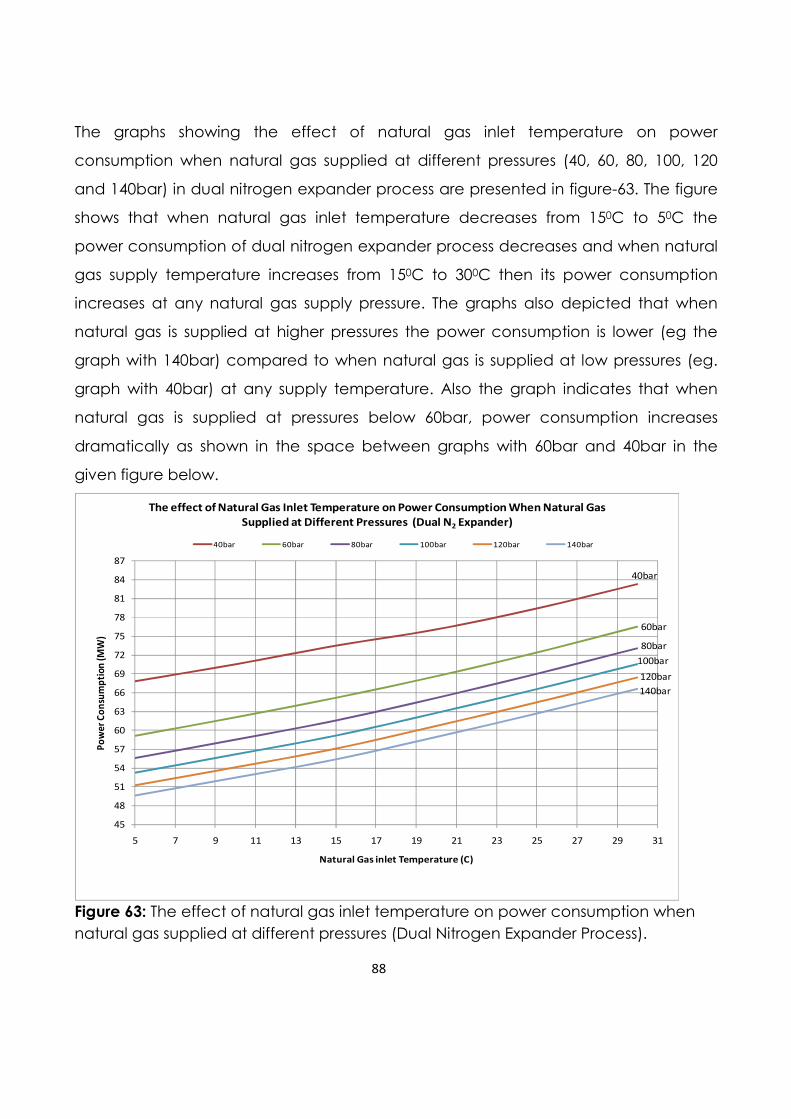
88
The graphs showing the effect of natural gas inlet temperature on power
consumption when natural gas supplied at different pressures (40, 60, 80, 100, 120
and 140bar) in dual nitrogen expander process are presented in figure-63. The figure
shows that when natural gas inlet temperature decreases from 150C to 50C the
power consumption of dual nitrogen expander process decreases and when natural
gas supply temperature increases from 150C to 300C then its power consumption
increases at any natural gas supply pressure. The graphs also depicted that when
natural gas is supplied at higher pressures the power consumption is lower (eg the
graph with 140bar) compared to when natural gas is supplied at low pressures (eg.
graph with 40bar) at any supply temperature. Also the graph indicates that when
natural gas is supplied at pressures below 60bar, power consumption increases
dramatically as shown in the space between graphs with 60bar and 40bar in the
given figure below.
45
48
51
54
57
60
63
66
69
72
75
78
81
84
87
5 7 9 11 13 15 17 19 21 23 25 27 29 31
Po
we
r C
on
sum
pti
on
(M
W)
Natural Gas inlet Temperature (C)
The effect of Natural Gas Inlet Temperature on Power Consumption When Natural Gas
Supplied at Different Pressures (Dual N2 Expander)
40bar 60bar 80bar 100bar 120bar 140bar
40bar
60bar
80bar
100bar
140bar
120bar
Figure 63: The effect of natural gas inlet temperature on power consumption when
natural gas supplied at different pressures (Dual Nitrogen Expander Process).
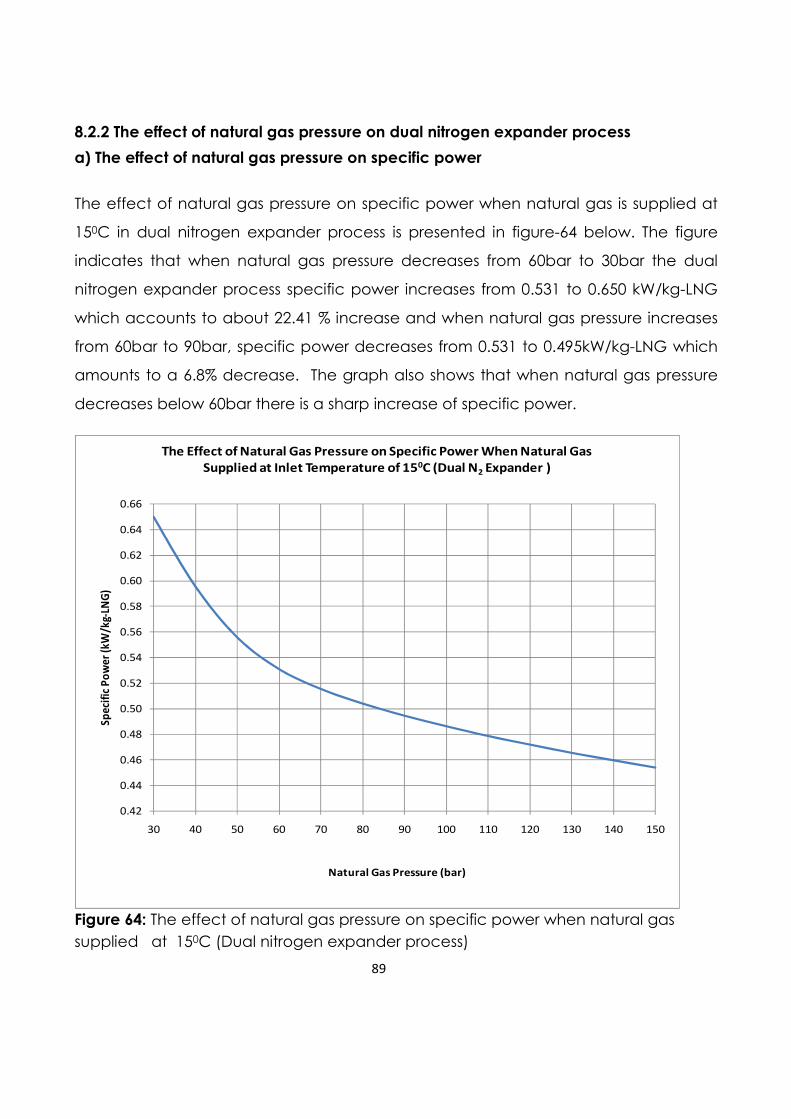
89
8.2.2 The effect of natural gas pressure on dual nitrogen expander process
a) The effect of natural gas pressure on specific power
The effect of natural gas pressure on specific power when natural gas is supplied at
150C in dual nitrogen expander process is presented in figure-64 below. The figure
indicates that when natural gas pressure decreases from 60bar to 30bar the dual
nitrogen expander process specific power increases from 0.531 to 0.650 kW/kg-LNG
which accounts to about 22.41 % increase and when natural gas pressure increases
from 60bar to 90bar, specific power decreases from 0.531 to 0.495kW/kg-LNG which
amounts to a 6.8% decrease. The graph also shows that when natural gas pressure
decreases below 60bar there is a sharp increase of specific power.
0.42
0.44
0.46
0.48
0.50
0.52
0.54
0.56
0.58
0.60
0.62
0.64
0.66
30 40 50 60 70 80 90 100 110 120 130 140 150
Sp
eci
fic
Po
we
r (k
W/k
g-LN
G)
Natural Gas Pressure (bar)
The Effect of Natural Gas Pressure on Specific Power When Natural Gas
Supplied at Inlet Temperature of 150C (Dual N2 Expander )
Figure 64: The effect of natural gas pressure on specific power when natural gas
supplied at 150C (Dual nitrogen expander process)
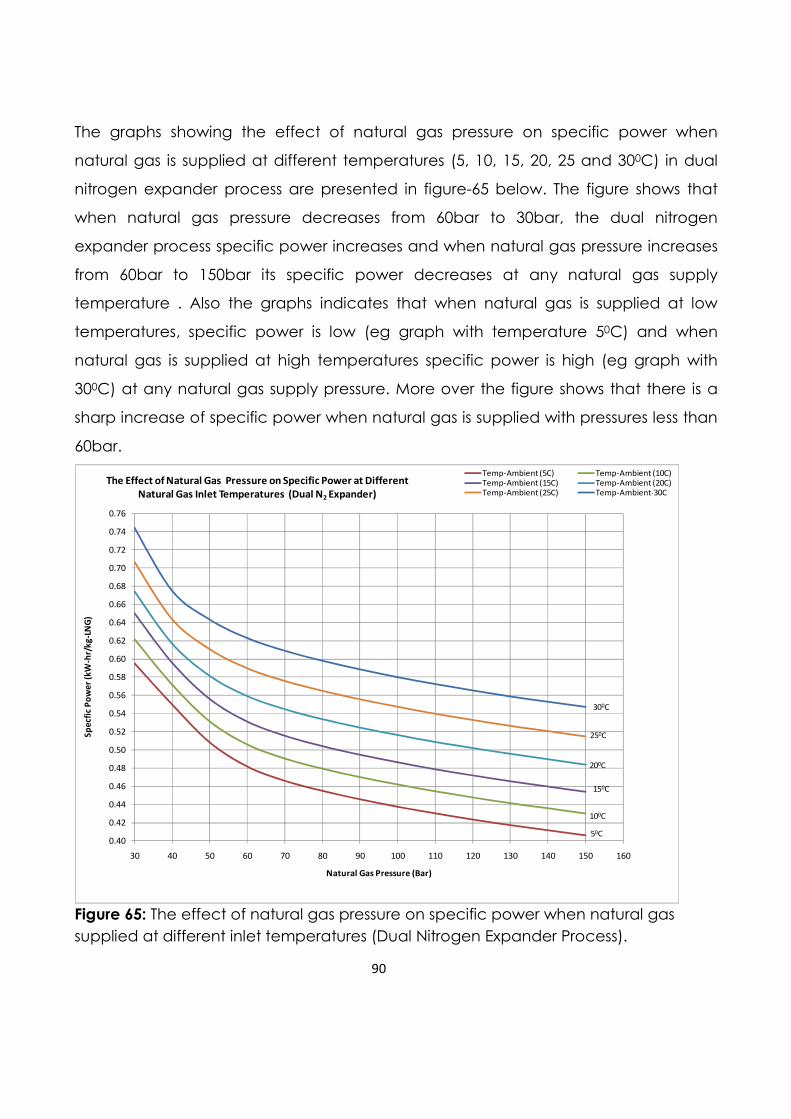
90
The graphs showing the effect of natural gas pressure on specific power when
natural gas is supplied at different temperatures (5, 10, 15, 20, 25 and 300C) in dual
nitrogen expander process are presented in figure-65 below. The figure shows that
when natural gas pressure decreases from 60bar to 30bar, the dual nitrogen
expander process specific power increases and when natural gas pressure increases
from 60bar to 150bar its specific power decreases at any natural gas supply
temperature . Also the graphs indicates that when natural gas is supplied at low
temperatures, specific power is low (eg graph with temperature 50C) and when
natural gas is supplied at high temperatures specific power is high (eg graph with
300C) at any natural gas supply pressure. More over the figure shows that there is a
sharp increase of specific power when natural gas is supplied with pressures less than
60bar.
0.40
0.42
0.44
0.46
0.48
0.50
0.52
0.54
0.56
0.58
0.60
0.62
0.64
0.66
0.68
0.70
0.72
0.74
0.76
30 40 50 60 70 80 90 100 110 120 130 140 150 160
Sp
ecf
ic P
ow
er
(kW
-hr/
kg
-LN
G)
Natural Gas Pressure (Bar)
The Effect of Natural Gas Pressure on Specific Power at Different
Natural Gas Inlet Temperatures (Dual N2 Expander)
Temp-Ambient (5C) Temp-Ambient (10C)
Temp-Ambient (15C) Temp-Ambient (20C)
Temp-Ambient (25C) Temp-Ambient-30C
250C
300C
200C
150C
50C
100C
Figure 65: The effect of natural gas pressure on specific power when natural gas
supplied at different inlet temperatures (Dual Nitrogen Expander Process).
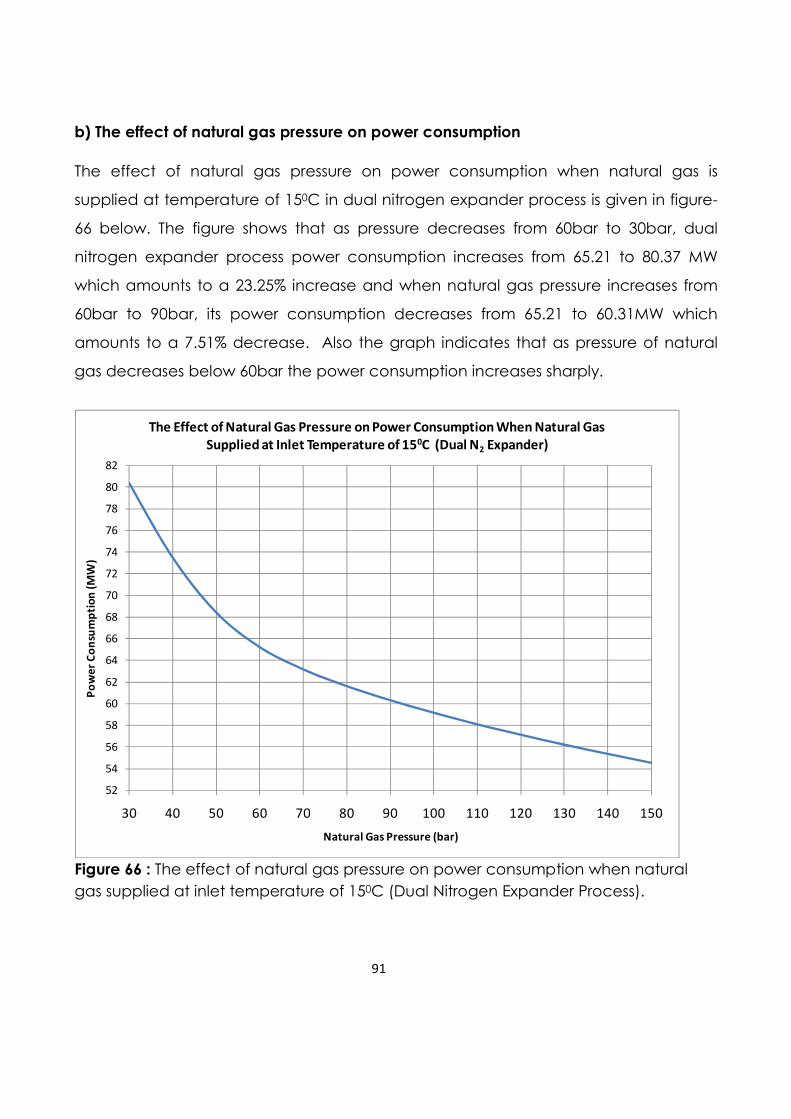
91
b) The effect of natural gas pressure on power consumption
The effect of natural gas pressure on power consumption when natural gas is
supplied at temperature of 150C in dual nitrogen expander process is given in figure-
66 below. The figure shows that as pressure decreases from 60bar to 30bar, dual
nitrogen expander process power consumption increases from 65.21 to 80.37 MW
which amounts to a 23.25% increase and when natural gas pressure increases from
60bar to 90bar, its power consumption decreases from 65.21 to 60.31MW which
amounts to a 7.51% decrease. Also the graph indicates that as pressure of natural
gas decreases below 60bar the power consumption increases sharply.
52
54
56
58
60
62
64
66
68
70
72
74
76
78
80
82
30 40 50 60 70 80 90 100 110 120 130 140 150
Po
we
r C
on
sum
pti
on
(M
W)
Natural Gas Pressure (bar)
The Effect of Natural Gas Pressure on Power Consumption When Natural Gas
Supplied at Inlet Temperature of 150C (Dual N2 Expander)
Figure 66 : The effect of natural gas pressure on power consumption when natural
gas supplied at inlet temperature of 150C (Dual Nitrogen Expander Process).
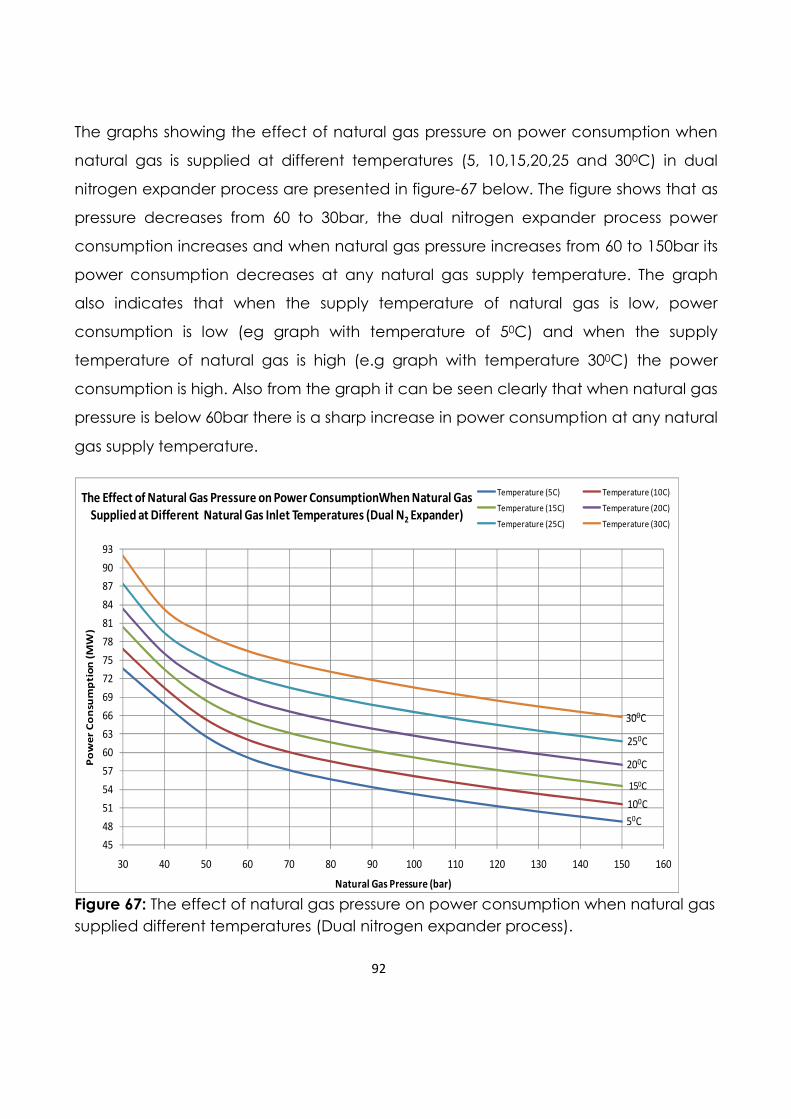
92
The graphs showing the effect of natural gas pressure on power consumption when
natural gas is supplied at different temperatures (5, 10,15,20,25 and 300C) in dual
nitrogen expander process are presented in figure-67 below. The figure shows that as
pressure decreases from 60 to 30bar, the dual nitrogen expander process power
consumption increases and when natural gas pressure increases from 60 to 150bar its
power consumption decreases at any natural gas supply temperature. The graph
also indicates that when the supply temperature of natural gas is low, power
consumption is low (eg graph with temperature of 50C) and when the supply
temperature of natural gas is high (e.g graph with temperature 300C) the power
consumption is high. Also from the graph it can be seen clearly that when natural gas
pressure is below 60bar there is a sharp increase in power consumption at any natural
gas supply temperature.
45
48
51
54
57
60
63
66
69
72
75
78
81
84
87
90
93
30 40 50 60 70 80 90 100 110 120 130 140 150 160
Po
we
r C
on
sum
pti
on
(M
W)
Natural Gas Pressure (bar)
The Effect of Natural Gas Pressure on Power ConsumptionWhen Natural Gas
Supplied at Different Natural Gas Inlet Temperatures (Dual N2 Expander)
Temperature (5C) Temperature (10C)
Temperature (15C) Temperature (20C)
Temperature (25C) Temperature (30C)
300C
250C
200C
150C
100C
50C
Figure 67: The effect of natural gas pressure on power consumption when natural gas
supplied different temperatures (Dual nitrogen expander process).
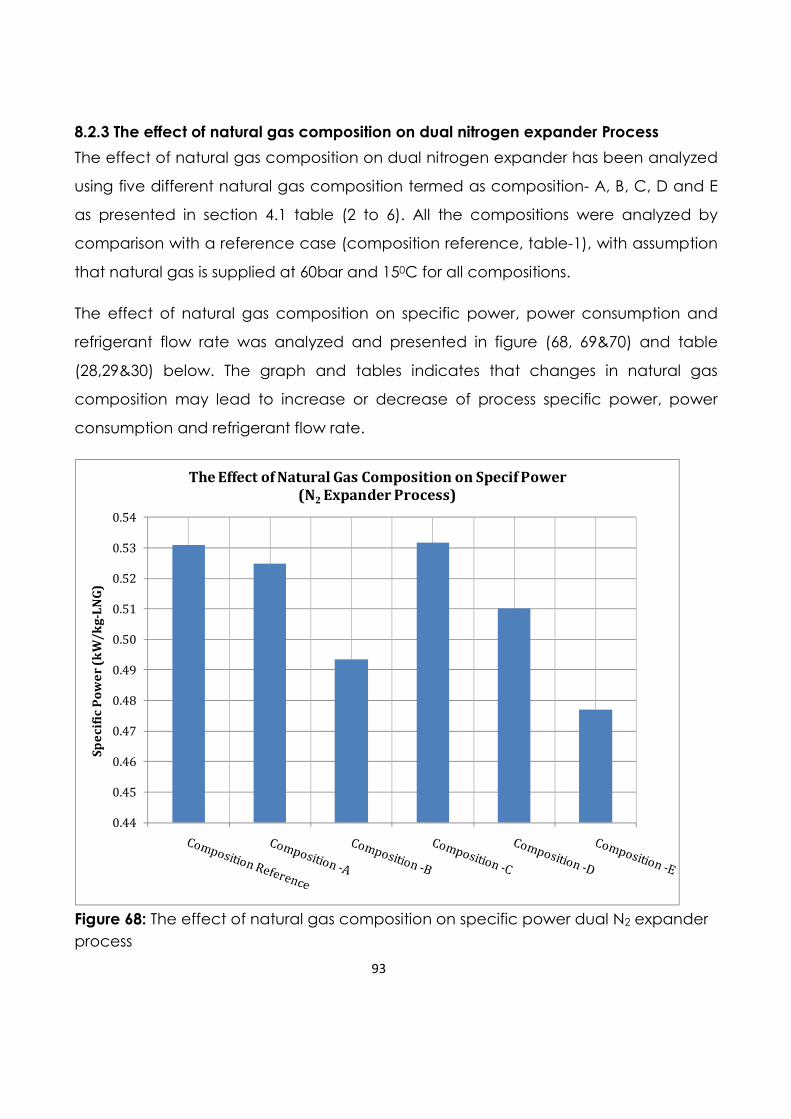
93
8.2.3 The effect of natural gas composition on dual nitrogen expander Process
The effect of natural gas composition on dual nitrogen expander has been analyzed
using five different natural gas composition termed as composition- A, B, C, D and E
as presented in section 4.1 table (2 to 6). All the compositions were analyzed by
comparison with a reference case (composition reference, table-1), with assumption
that natural gas is supplied at 60bar and 150C for all compositions.
The effect of natural gas composition on specific power, power consumption and
refrigerant flow rate was analyzed and presented in figure (68, 69&70) and table
(28,29&30) below. The graph and tables indicates that changes in natural gas
composition may lead to increase or decrease of process specific power, power
consumption and refrigerant flow rate.
0.44
0.45
0.46
0.47
0.48
0.49
0.50
0.51
0.52
0.53
0.54
Sp
ec
ific
Po
we
r (k
W/
kg
-LN
G)
The Effect of Natural Gas Composition on Specif Power
(N2 Expander Process)
Figure 68: The effect of natural gas composition on specific power dual N2 expander
process
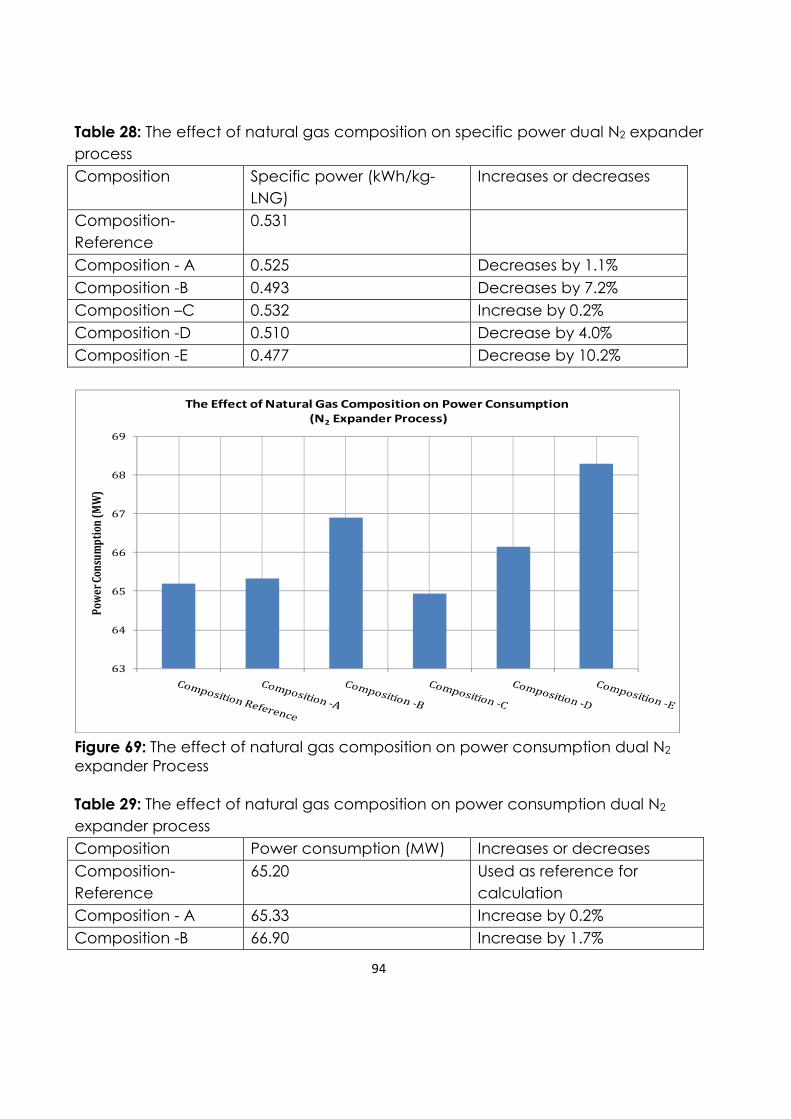
94
Table 28: The effect of natural gas composition on specific power dual N2 expander
process
Composition Specific power (kWh/kg-
LNG)
Increases or decreases
Composition-
Reference
0.531
Composition - A 0.525 Decreases by 1.1%
Composition -B 0.493 Decreases by 7.2%
Composition –C 0.532 Increase by 0.2%
Composition -D 0.510 Decrease by 4.0%
Composition -E 0.477 Decrease by 10.2%
63
64
65
66
67
68
69
Pow
er C
onsu
mp
tion
(M
W)
The Effect of Natural Gas Composition on Power Consumption
(N2 Expander Process)
Figure 69: The effect of natural gas composition on power consumption dual N2 expander Process Table 29: The effect of natural gas composition on power consumption dual N2
expander process
Composition Power consumption (MW) Increases or decreases
Composition-
Reference
65.20 Used as reference for
calculation
Composition - A 65.33 Increase by 0.2%
Composition -B 66.90 Increase by 1.7%
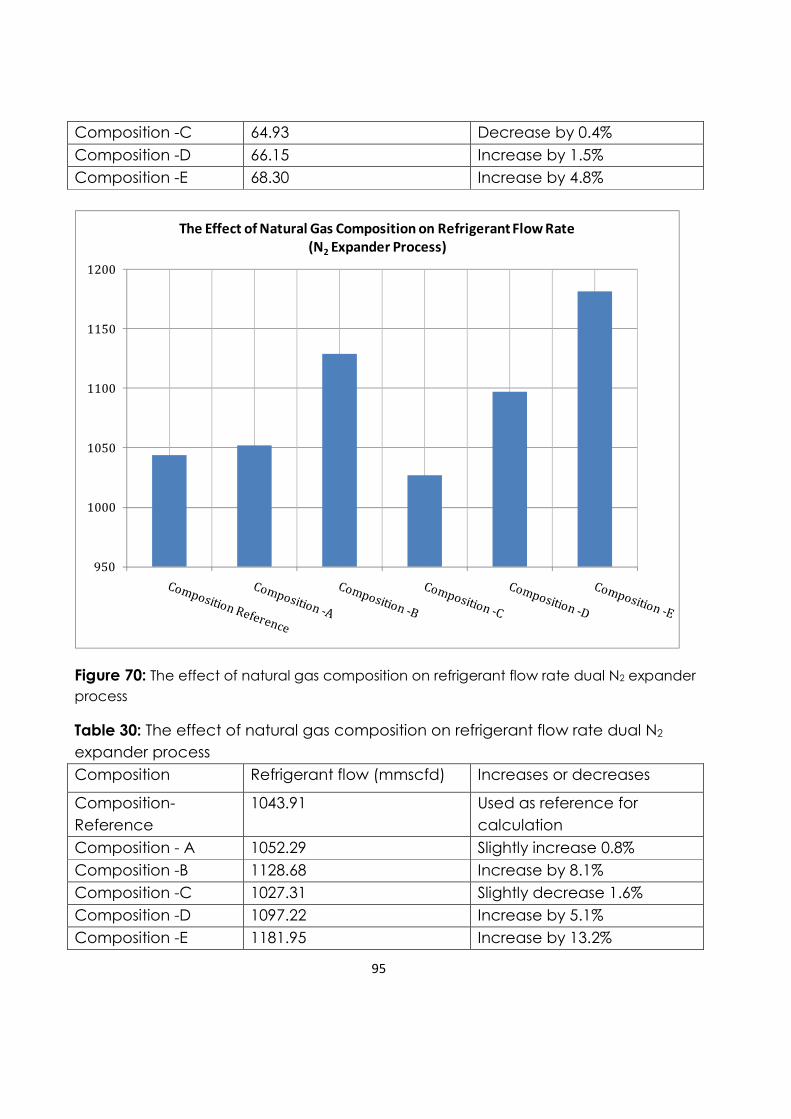
95
Composition -C 64.93 Decrease by 0.4%
Composition -D 66.15 Increase by 1.5%
Composition -E 68.30 Increase by 4.8%
950
1000
1050
1100
1150
1200
The Effect of Natural Gas Composition on Refrigerant Flow Rate
(N2 Expander Process)
Figure 70: The effect of natural gas composition on refrigerant flow rate dual N2 expander
process
Table 30: The effect of natural gas composition on refrigerant flow rate dual N2
expander process
Composition Refrigerant flow (mmscfd) Increases or decreases
Composition-
Reference
1043.91 Used as reference for
calculation
Composition - A 1052.29 Slightly increase 0.8%
Composition -B 1128.68 Increase by 8.1%
Composition -C 1027.31 Slightly decrease 1.6%
Composition -D 1097.22 Increase by 5.1%
Composition -E 1181.95 Increase by 13.2%
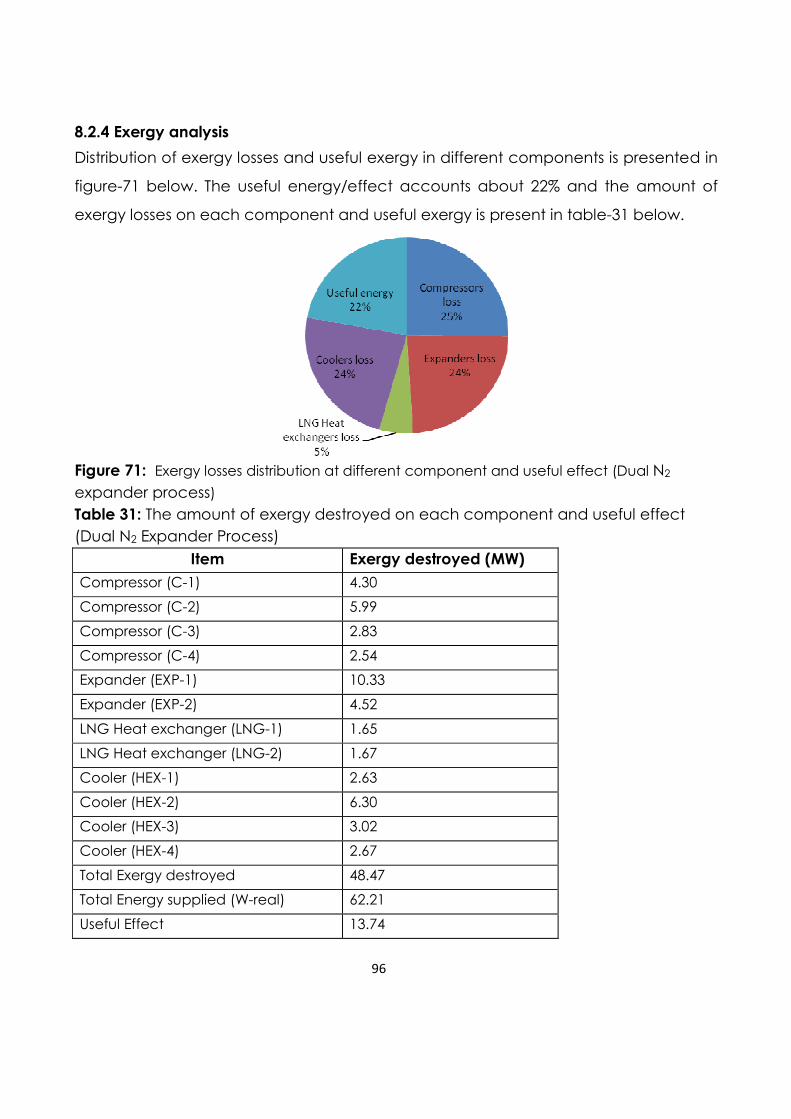
96
8.2.4 Exergy analysis
Distribution of exergy losses and useful exergy in different components is presented in
figure-71 below. The useful energy/effect accounts about 22% and the amount of
exergy losses on each component and useful exergy is present in table-31 below.
Figure 71: Exergy losses distribution at different component and useful effect (Dual N2
expander process)
Table 31: The amount of exergy destroyed on each component and useful effect
(Dual N2 Expander Process)
Item Exergy destroyed (MW)
Compressor (C-1) 4.30
Compressor (C-2) 5.99
Compressor (C-3) 2.83
Compressor (C-4) 2.54
Expander (EXP-1) 10.33
Expander (EXP-2) 4.52
LNG Heat exchanger (LNG-1) 1.65
LNG Heat exchanger (LNG-2) 1.67
Cooler (HEX-1) 2.63
Cooler (HEX-2) 6.30
Cooler (HEX-3) 3.02
Cooler (HEX-4) 2.67
Total Exergy destroyed 48.47
Total Energy supplied (W-real) 62.21
Useful Effect 13.74
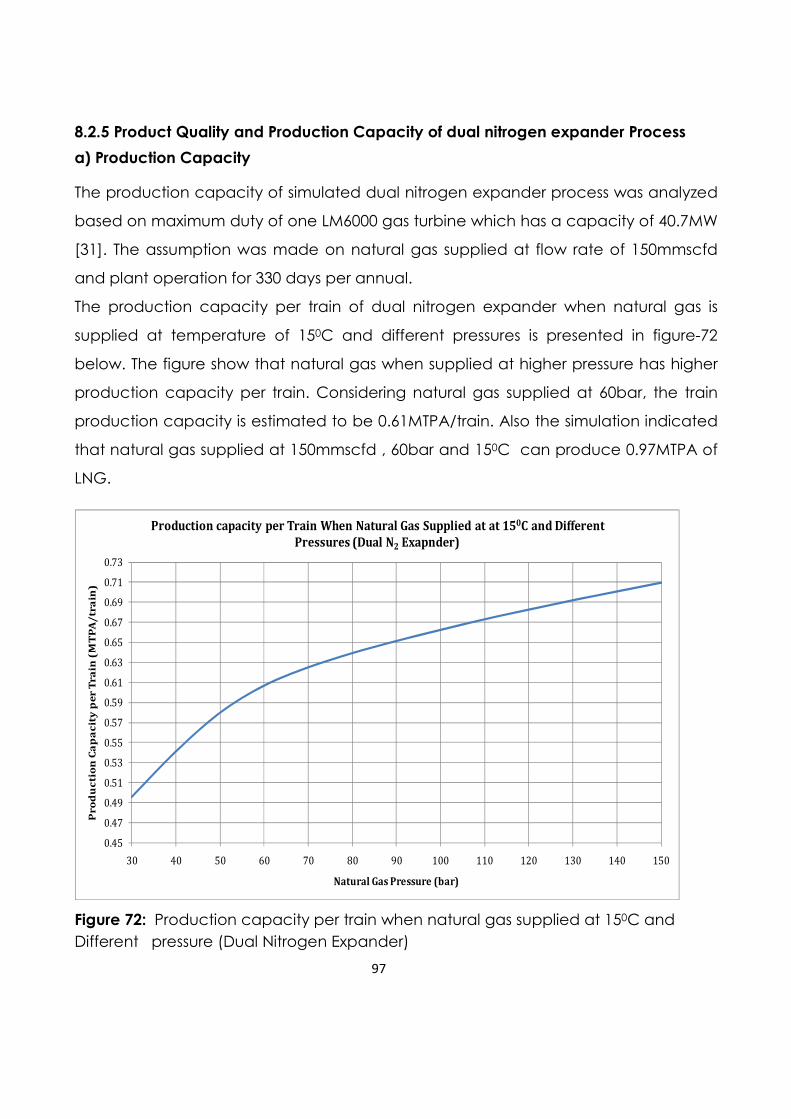
97
8.2.5 Product Quality and Production Capacity of dual nitrogen expander Process
a) Production Capacity
The production capacity of simulated dual nitrogen expander process was analyzed
based on maximum duty of one LM6000 gas turbine which has a capacity of 40.7MW
[31]. The assumption was made on natural gas supplied at flow rate of 150mmscfd
and plant operation for 330 days per annual.
The production capacity per train of dual nitrogen expander when natural gas is
supplied at temperature of 150C and different pressures is presented in figure-72
below. The figure show that natural gas when supplied at higher pressure has higher
production capacity per train. Considering natural gas supplied at 60bar, the train
production capacity is estimated to be 0.61MTPA/train. Also the simulation indicated
that natural gas supplied at 150mmscfd , 60bar and 150C can produce 0.97MTPA of
LNG.
0.45
0.47
0.49
0.51
0.53
0.55
0.57
0.59
0.61
0.63
0.65
0.67
0.69
0.71
0.73
30 40 50 60 70 80 90 100 110 120 130 140 150
Pr
od
uc
tio
n C
ap
ac
ity
pe
r T
ra
in (
MT
PA
/tr
ain
)
Natural Gas Pressure (bar)
Production capacity per Train When Natural Gas Supplied at at 150C and Different
Pressures (Dual N2 Exapnder)
Figure 72: Production capacity per train when natural gas supplied at 150C and
Different pressure (Dual Nitrogen Expander)
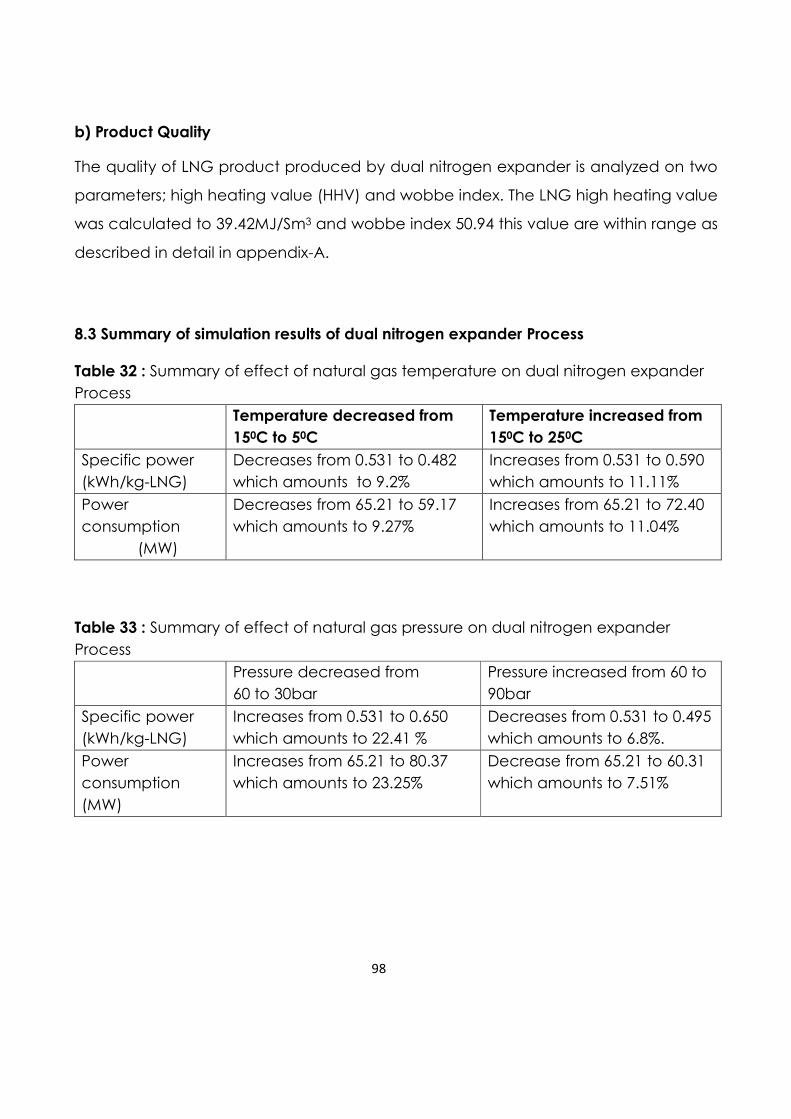
98
b) Product Quality
The quality of LNG product produced by dual nitrogen expander is analyzed on two
parameters; high heating value (HHV) and wobbe index. The LNG high heating value
was calculated to 39.42MJ/Sm3 and wobbe index 50.94 this value are within range as
described in detail in appendix-A.
8.3 Summary of simulation results of dual nitrogen expander Process
Table 32 : Summary of effect of natural gas temperature on dual nitrogen expander
Process
Temperature decreased from
150C to 50C
Temperature increased from
150C to 250C
Specific power
(kWh/kg-LNG)
Decreases from 0.531 to 0.482
which amounts to 9.2%
Increases from 0.531 to 0.590
which amounts to 11.11%
Power
consumption
(MW)
Decreases from 65.21 to 59.17
which amounts to 9.27%
Increases from 65.21 to 72.40
which amounts to 11.04%
Table 33 : Summary of effect of natural gas pressure on dual nitrogen expander
Process
Pressure decreased from
60 to 30bar
Pressure increased from 60 to
90bar
Specific power
(kWh/kg-LNG)
Increases from 0.531 to 0.650
which amounts to 22.41 %
Decreases from 0.531 to 0.495
which amounts to 6.8%.
Power
consumption
(MW)
Increases from 65.21 to 80.37
which amounts to 23.25%
Decrease from 65.21 to 60.31
which amounts to 7.51%
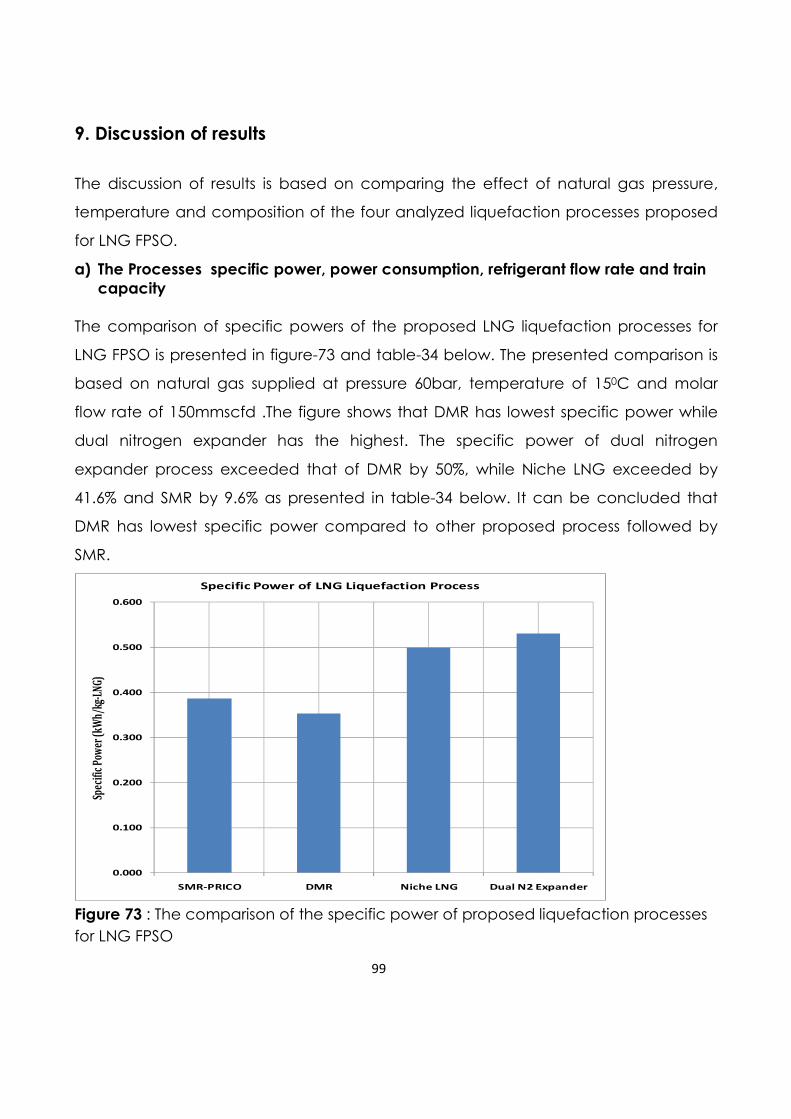
99
9. Discussion of results
The discussion of results is based on comparing the effect of natural gas pressure,
temperature and composition of the four analyzed liquefaction processes proposed
for LNG FPSO.
a) The Processes specific power, power consumption, refrigerant flow rate and train
capacity
The comparison of specific powers of the proposed LNG liquefaction processes for
LNG FPSO is presented in figure-73 and table-34 below. The presented comparison is
based on natural gas supplied at pressure 60bar, temperature of 150C and molar
flow rate of 150mmscfd .The figure shows that DMR has lowest specific power while
dual nitrogen expander has the highest. The specific power of dual nitrogen
expander process exceeded that of DMR by 50%, while Niche LNG exceeded by
41.6% and SMR by 9.6% as presented in table-34 below. It can be concluded that
DMR has lowest specific power compared to other proposed process followed by
SMR.
0.000
0.100
0.200
0.300
0.400
0.500
0.600
SMR-PRICO DMR Niche LNG Dual N2 Expander
Spec
ific
Pow
er (k
Wh/
kg-L
NG)
Specific Power of LNG Liquefaction Process
Figure 73 : The comparison of the specific power of proposed liquefaction processes
for LNG FPSO
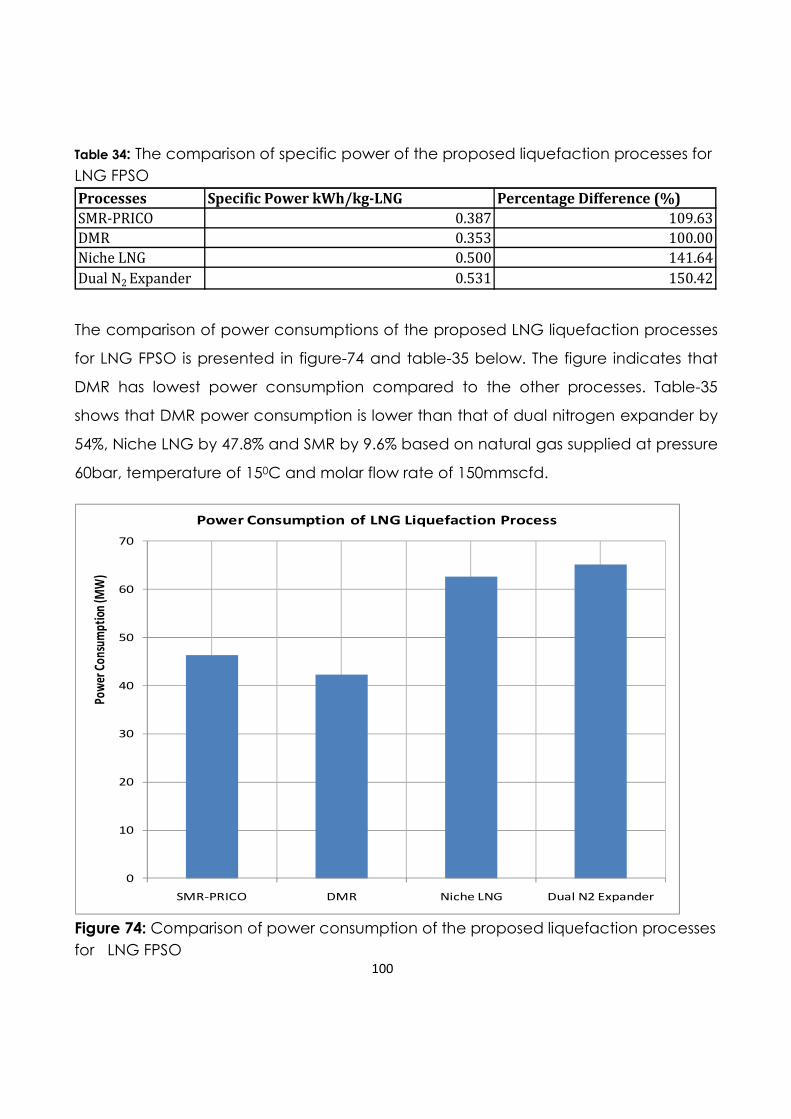
100
Table 34: The comparison of specific power of the proposed liquefaction processes for
LNG FPSO
Processes Specific Power kWh/kg-LNG Percentage Difference (%)
SMR-PRICO 0.387 109.63
DMR 0.353 100.00
Niche LNG 0.500 141.64
Dual N2 Expander 0.531 150.42
The comparison of power consumptions of the proposed LNG liquefaction processes
for LNG FPSO is presented in figure-74 and table-35 below. The figure indicates that
DMR has lowest power consumption compared to the other processes. Table-35
shows that DMR power consumption is lower than that of dual nitrogen expander by
54%, Niche LNG by 47.8% and SMR by 9.6% based on natural gas supplied at pressure
60bar, temperature of 150C and molar flow rate of 150mmscfd.
0
10
20
30
40
50
60
70
SMR-PRICO DMR Niche LNG Dual N2 Expander
Pow
er C
onsu
mpt
ion
(MW
)
Power Consumption of LNG Liquefaction Process
Figure 74: Comparison of power consumption of the proposed liquefaction processes
for LNG FPSO
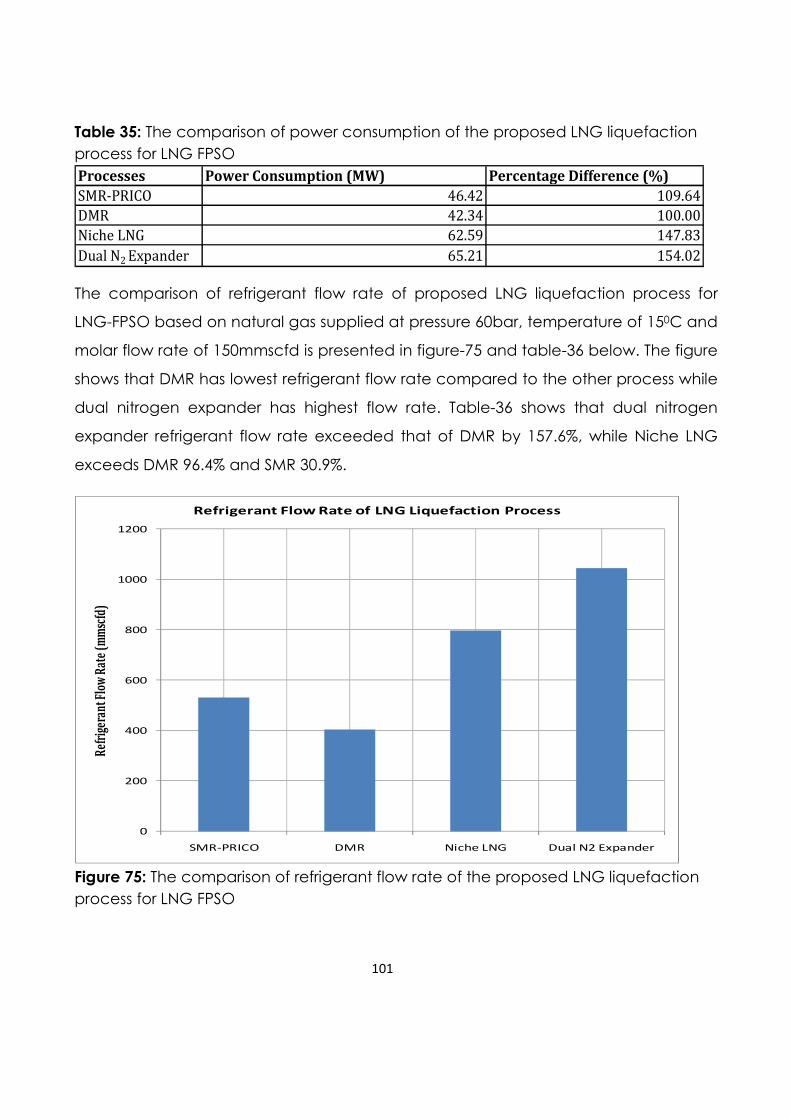
101
Table 35: The comparison of power consumption of the proposed LNG liquefaction
process for LNG FPSO
Processes Power Consumption (MW) Percentage Difference (%)
SMR-PRICO 46.42 109.64
DMR 42.34 100.00
Niche LNG 62.59 147.83
Dual N2 Expander 65.21 154.02
The comparison of refrigerant flow rate of proposed LNG liquefaction process for
LNG-FPSO based on natural gas supplied at pressure 60bar, temperature of 150C and
molar flow rate of 150mmscfd is presented in figure-75 and table-36 below. The figure
shows that DMR has lowest refrigerant flow rate compared to the other process while
dual nitrogen expander has highest flow rate. Table-36 shows that dual nitrogen
expander refrigerant flow rate exceeded that of DMR by 157.6%, while Niche LNG
exceeds DMR 96.4% and SMR 30.9%.
0
200
400
600
800
1000
1200
SMR-PRICO DMR Niche LNG Dual N2 Expander
Ref
rige
rant
Flo
w R
ate
(mm
scfd
)
Refrigerant Flow Rate of LNG Liquefaction Process
Figure 75: The comparison of refrigerant flow rate of the proposed LNG liquefaction
process for LNG FPSO
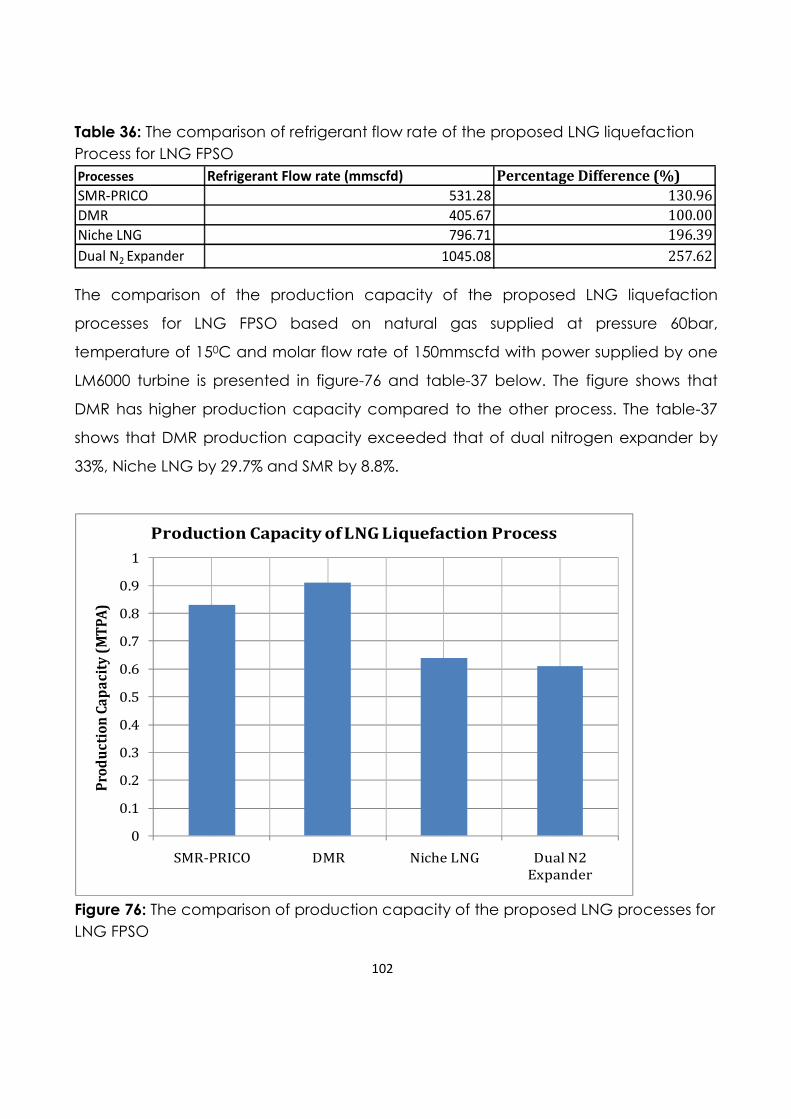
102
Table 36: The comparison of refrigerant flow rate of the proposed LNG liquefaction
Process for LNG FPSO
Processes Refrigerant Flow rate (mmscfd) Percentage Difference (%)
SMR-PRICO 531.28 130.96
DMR 405.67 100.00
Niche LNG 796.71 196.39
Dual N2 Expander 1045.08 257.62
The comparison of the production capacity of the proposed LNG liquefaction
processes for LNG FPSO based on natural gas supplied at pressure 60bar,
temperature of 150C and molar flow rate of 150mmscfd with power supplied by one
LM6000 turbine is presented in figure-76 and table-37 below. The figure shows that
DMR has higher production capacity compared to the other process. The table-37
shows that DMR production capacity exceeded that of dual nitrogen expander by
33%, Niche LNG by 29.7% and SMR by 8.8%.
0
0.1
0.2
0.3
0.4
0.5
0.6
0.7
0.8
0.9
1
SMR-PRICO DMR Niche LNG Dual N2
Expander
Pro
du
cti
on
Ca
pa
city
(M
TP
A)
Production Capacity of LNG Liquefaction Process
Figure 76: The comparison of production capacity of the proposed LNG processes for
LNG FPSO
103
Table 37: The comparison of production capacity of the proposed LNG liquefaction
processes for LNG FPSO
Processes Production Per train (MTPA/Train) Percentage Difference (%)
SMR-PRICO 0.83 91.21
DMR 0.91 100.00
Niche LNG 0.64 70.33
Dual N2 Expander 0.61 67.03
b) The proposed Liquefaction process LNG heat exchangers “UA” values
Based on the benchmarked simulated processes the LNG heat exchangers “UA”
values of each process was calculated and are presented in table-38 below. The
table shows that dual nitrogen expander LNG heat exchangers have lowest “UA”
value while MSR LNG heat exchanger has the highest values.
Table 38: The comparison of LNG Heat exchangers “UA” values (kW/0C) for the proposed liquefaction process for LNG FPSO Process LNG-1 (UA
Value)(kW/C) LNG-2 (UA-Value) Total (UA-Value)
SMR-PRICO 16,629. 21 - 16,629.21
DMR 5,213.25 4,691.53 9,904.78 Niche LNG 8,122.290 6,064.18 14,186.47 Dual N2 Expander 4,414.55 841.10 5,255.65
c) The effect of natural gas temperature on the proposed liquefaction processes for
LNG FPSO
The effect of natural gas temperature on specific power and power consumption for
the proposed liquefaction processes for LNG FPSO with assumption that natural gas is
at 60bar is presented in table 39 & 40 below. The tables shows that when natural gas
supply temperature decreases from 15 to 50C the processes specific power and
power consumption decreases at different magnitude and when it increases from 15
to 250C the processes specific power and power consumption increases. The tables
show that change in natural gas supply temperature has high effect on SMR process
compared to the other processes based on process specific power and power
consumption.
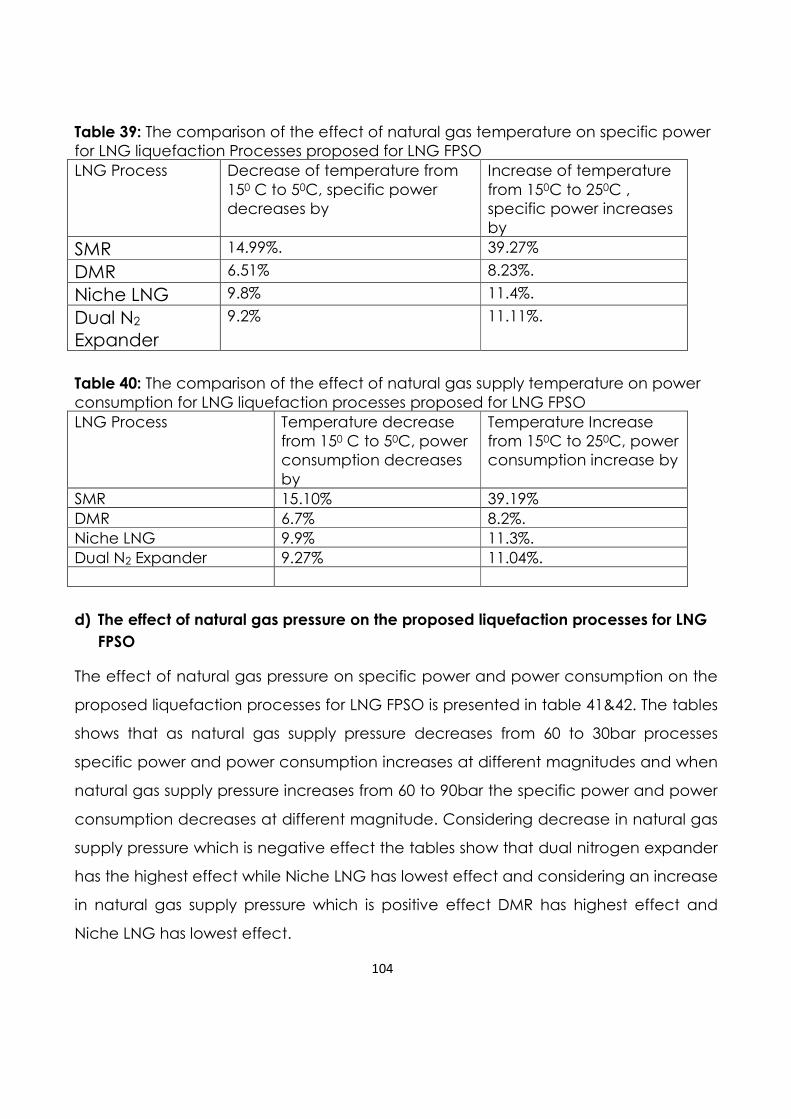
104
Table 39: The comparison of the effect of natural gas temperature on specific power for LNG liquefaction Processes proposed for LNG FPSO LNG Process Decrease of temperature from
150 C to 50C, specific power decreases by
Increase of temperature from 150C to 250C , specific power increases by
SMR 14.99%. 39.27%
DMR 6.51% 8.23%.
Niche LNG 9.8% 11.4%.
Dual N2 Expander
9.2% 11.11%.
Table 40: The comparison of the effect of natural gas supply temperature on power consumption for LNG liquefaction processes proposed for LNG FPSO LNG Process Temperature decrease
from 150 C to 50C, power consumption decreases by
Temperature Increase from 150C to 250C, power consumption increase by
SMR 15.10% 39.19% DMR 6.7% 8.2%. Niche LNG 9.9% 11.3%. Dual N2 Expander 9.27% 11.04%.
d) The effect of natural gas pressure on the proposed liquefaction processes for LNG
FPSO
The effect of natural gas pressure on specific power and power consumption on the
proposed liquefaction processes for LNG FPSO is presented in table 41&42. The tables
shows that as natural gas supply pressure decreases from 60 to 30bar processes
specific power and power consumption increases at different magnitudes and when
natural gas supply pressure increases from 60 to 90bar the specific power and power
consumption decreases at different magnitude. Considering decrease in natural gas
supply pressure which is negative effect the tables show that dual nitrogen expander
has the highest effect while Niche LNG has lowest effect and considering an increase
in natural gas supply pressure which is positive effect DMR has highest effect and
Niche LNG has lowest effect.
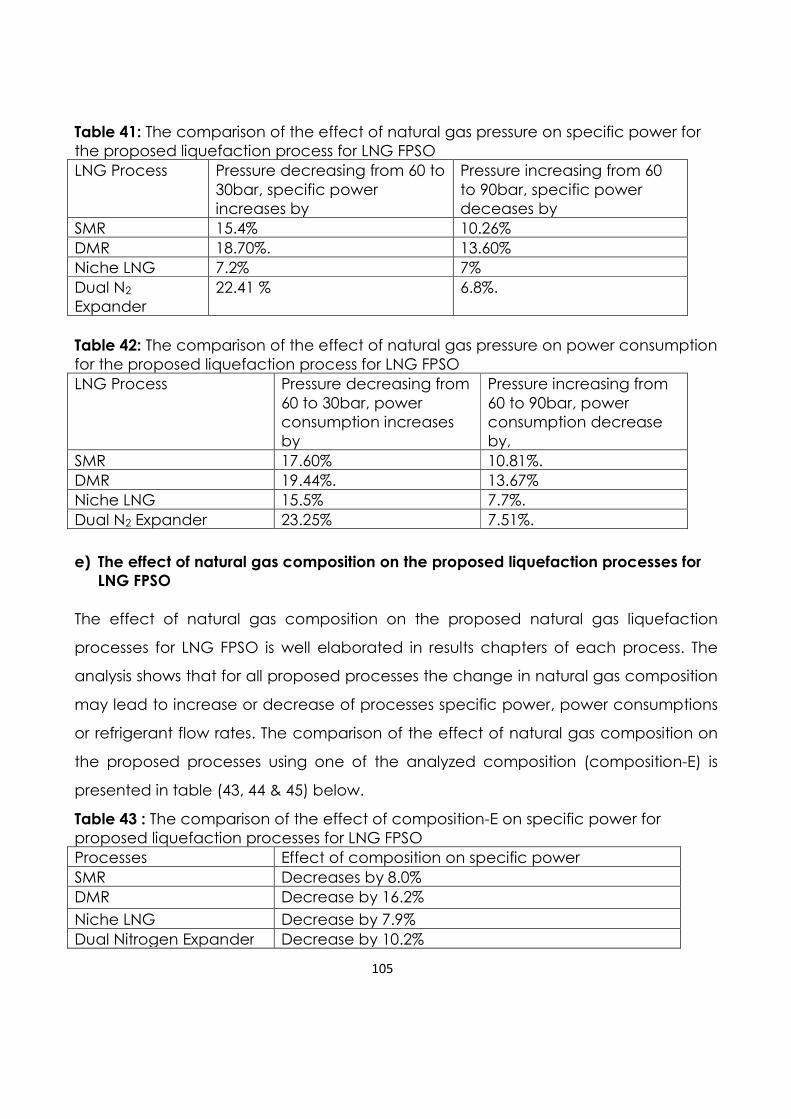
105
Table 41: The comparison of the effect of natural gas pressure on specific power for the proposed liquefaction process for LNG FPSO LNG Process Pressure decreasing from 60 to
30bar, specific power increases by
Pressure increasing from 60 to 90bar, specific power deceases by
SMR 15.4% 10.26% DMR 18.70%. 13.60% Niche LNG 7.2% 7% Dual N2 Expander
22.41 % 6.8%.
Table 42: The comparison of the effect of natural gas pressure on power consumption for the proposed liquefaction process for LNG FPSO LNG Process Pressure decreasing from
60 to 30bar, power consumption increases by
Pressure increasing from 60 to 90bar, power consumption decrease by,
SMR 17.60% 10.81%. DMR 19.44%. 13.67% Niche LNG 15.5% 7.7%. Dual N2 Expander 23.25% 7.51%.
e) The effect of natural gas composition on the proposed liquefaction processes for
LNG FPSO
The effect of natural gas composition on the proposed natural gas liquefaction
processes for LNG FPSO is well elaborated in results chapters of each process. The
analysis shows that for all proposed processes the change in natural gas composition
may lead to increase or decrease of processes specific power, power consumptions
or refrigerant flow rates. The comparison of the effect of natural gas composition on
the proposed processes using one of the analyzed composition (composition-E) is
presented in table (43, 44 & 45) below.
Table 43 : The comparison of the effect of composition-E on specific power for proposed liquefaction processes for LNG FPSO Processes Effect of composition on specific power SMR Decreases by 8.0% DMR Decrease by 16.2%
Niche LNG Decrease by 7.9% Dual Nitrogen Expander Decrease by 10.2%
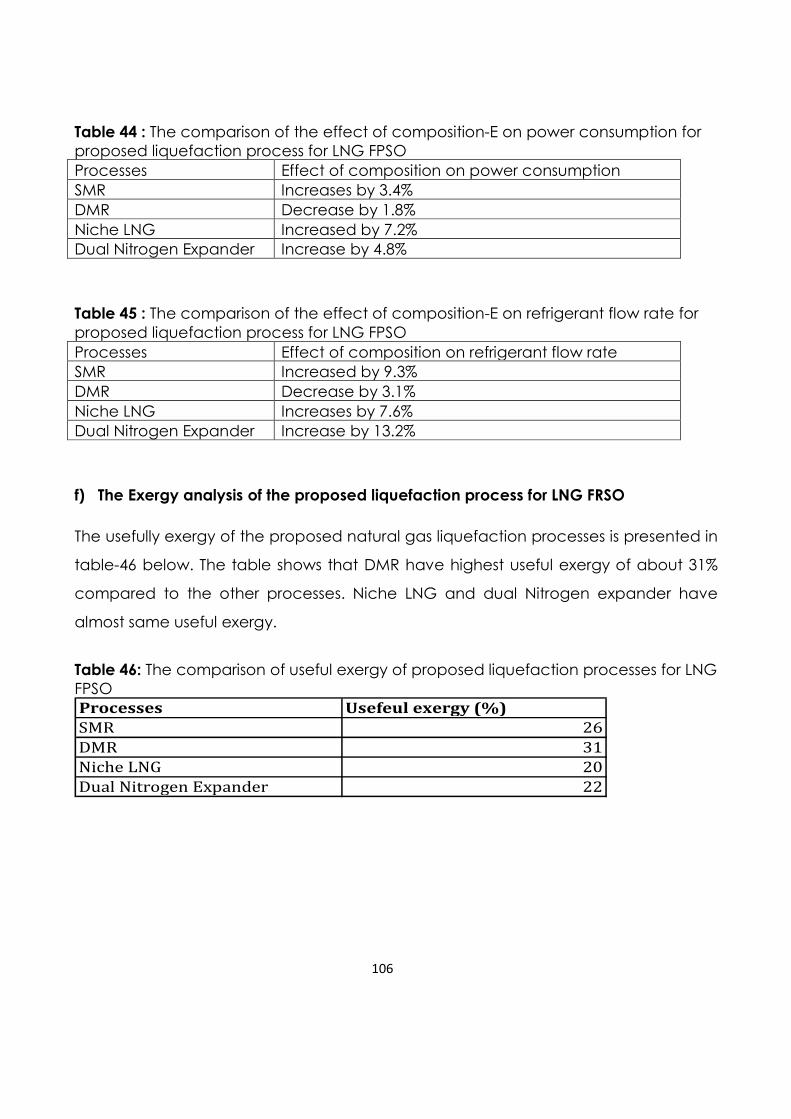
106
Table 44 : The comparison of the effect of composition-E on power consumption for proposed liquefaction process for LNG FPSO Processes Effect of composition on power consumption SMR Increases by 3.4% DMR Decrease by 1.8% Niche LNG Increased by 7.2% Dual Nitrogen Expander Increase by 4.8%
Table 45 : The comparison of the effect of composition-E on refrigerant flow rate for proposed liquefaction process for LNG FPSO Processes Effect of composition on refrigerant flow rate SMR Increased by 9.3% DMR Decrease by 3.1% Niche LNG Increases by 7.6% Dual Nitrogen Expander Increase by 13.2%
f) The Exergy analysis of the proposed liquefaction process for LNG FRSO
The usefully exergy of the proposed natural gas liquefaction processes is presented in
table-46 below. The table shows that DMR have highest useful exergy of about 31%
compared to the other processes. Niche LNG and dual Nitrogen expander have
almost same useful exergy.
Table 46: The comparison of useful exergy of proposed liquefaction processes for LNG FPSO Processes Usefeul exergy (%)
SMR 26
DMR 31
Niche LNG 20
Dual Nitrogen Expander 22
107
10. Conclusions
The comparison of specific powers, power consumption, refrigerant flow rate and
production capacity concluded that DMR is the best compared to the other process.
The specific power of DMR is lower than that of dual nitrogen expander process by
50%, Niche LNG by 41.6% and SMR by 9.6%. Its power consumption is lower than that
of dual nitrogen expander 54%, Niche LNG 47.8% and SMR 9.6%. Also its refrigerant
flow rate is lower than that of dual nitrogen expander by 157.6%, Niche LNG 96.4%
and SMR 30.9%. More over its
Production capacity based on natural gas supplied at pressure power supplied by
one LM6000 turbine is lower than that of dual nitrogen expander by 33%, Niche LNG
by 29.7% and SMR by 8.8%. Based on analyzed parameters above DMR may consider
as good candidate for LNG FPSO compared to the other processes if any only if the
arguments on the impact of vessel motion and inherent to safety on hydrocarbon
refrigerant proved to have negligible effect.
All process proved that natural gas supply temperature and pressure has significant
impact. The impacts may be in positive or negative way depends on increase on
decrease of supply temperature or pressure. One of the analyzed condition show
that when natural gas supply temperature decreases from 15 to 50C SMR specific
power and power consumption decrease by 14.99% and 15.10% respectively and
when it is increases from 15 to 250C its specific power and power consumption
increases by 39.27% and 39.19 respectively. Other analyzed condition on pressure
shows that when natural gas supply decrease dual nitrogen expander has the
highest effect with specific power and power consumption increases by 22.41% and
23.25% respectively and when natural gas supply increases DMR has highest effect
on specific power and power consumption which are 13.06% and 13.67%
respectively.

108
The effect of natural gas composition shows that for all proposed processes the
change in natural gas composition may lead to increase or decrease of processes
specific power, power consumptions or refrigerant flow rates.
Energy efficiency is important to LNG production as feed gas is consumed in order to
carry out the liquefaction process.The exergy analysis of the proposed process shows
that shows that DMR process has highest useful exergy about 31% compared to the
other processes. Niche LNG and dual nitrogen expander has almost same useful
exergy.
109
11. References
[1] Adrian J. Finn, “floating LNG plants – scale-up of familiar technology”, GPA 88th Annual Convention, March 9th -11th, 2009, San Antonio Marriott River Center [2] Adrian J Finn, Grant L Johnson and Terry R Tomlinson “LNG technology for offshore and mid-scale plants” March 2000, Atlanta, 79th Annual GPA convention, 13th -15th [3] Behnam, K. “GTL as a Potential Source of Future Clean Transportation Fuels” University of Technology; Calgary, Alberta,Canada, June 10 – 12, 2003
[4] Charles P. Ivey; “Liquefied Natural Gas (LNG)”; Aiken Global Environmental/FT Benning DPW, Fort Benning, Georgia, U.S.A. [5] C.W. Remeljeja, A.F.A. Hoadleyb; “An exergy analysis of small-scale liquefied Natural gas (LNG) liquefaction processes” aBHP Billiton, 180 Lonsdale Street, Melbourne, Vic. 3000, Australia bDepartment of Chemical Engineering, Building 36, Clayton Campus, Monash University, Vic. 3800, Australia Received 20 October 2004 [6] David Wood, “LNG-FPSOs competing technology are ,making progress” Presentation, 2nd June 2009, Energy Institute, London, www.dwasolutions.com/images/DWoodLNGFPSOEI2Jun09.pdf, [7] Elena Voskresenskaya “Potential Application of Floating LNG”;; Clausthal University of Technology, Germany; GCREEDER 2009, Amman-Jordan, March 31st – April 2nd 2009
[8] Eni’s World Oil & Gas Review, 2006 http://www.eniirl.com/downloads/wogr2006.pdf (10/11/2010)
[9] Frank Del Nogal, Jin-Kuk Kim,* Simon Perry, and Robin Smith; “Optimal design of mixed refrigerant cycles”; Centre for Process Integration, School of Chemical Engineering and Analytical Science, The UniVersity of Manchester, PO Box 88, Manchester, M60 1QD, U.K.; Ind. Eng. Chem. Res. 2008, 47, 8724–8740
[10] Gadhiraju Venkatarathnam; “Cryogenic mixed refrigerant processes”; Department of Mechanical Engineering Indian Institute of Technology Madras Chennai – 600036 India, [email protected]; publisher (Springer Science+Business Media, LLC, 233 Spring Street, New York, NY 10013, USA)

110
[ 11] Ho-Myung Chang a*,, Myung Jin Chung a, Sanggyu Lee b, Kun Hyung Choe b ; “ An efficient multi-stage Brayton–JT cycle for liquefaction of natural gas” a Hong Ik University, Seoul 121-791, Republic of Korea ,b Korea Gas Corporation, Incheon 406-130, Republic of Korea Journal homepage: www.elsevier.com/locate/cryogenics
[12] http://en.wikipedia.org/wiki/General_Electric_LM6000 (25/06/2011)
[13 ] Ibrahim Dincer and Mehmet Kano˘glu ; “Refrigeration Systems and Applications, Second edition” ; Faculty of Engineering and Applied Science University of Ontario Institute of Technology (UOIT) and Department of Mechanical Engineering University of Gaziantep; A John Wiley and Sons, Ltd.,2010 , © 2010 John Wiley & Sons [14] Jorge H. Foglietta; “LNG production using dual independent expander refrigeration cycle,” Patent, serial No.60/273, field on April 6, 2001;
[15] John A. Sheffield and John M Campbell, “Off-Shore LNG Production How to make it happen” GPA Europ Annual Conference, 21st - 23rd September 2005, Warsaw [16] Jostein Pettersen “Natural Gas Liquefaction” Gas Processing and LNG (TEP 08), November 2010, harmerfes [17] Knut Arild Maråk and Bengt Olav Neeraas, “ Comparison of expander processes For natural gas liquefaction” Statoil Research Center Trondheim, Norway www.kgu.or.kr/download.php?tb=bbs_017&fn=PO1-5...p... (20/11/2010)
[18] Marcus Lang and Marc Schier , “Consider Mid-Scale LNG to Monetize Natural Gas” 24th World Gas Conference Buenos Aires, Argentina 5 - 9 October 2009 ... www.igu.org/html/wgc2009web/default.htm [ 19] Mark Julian, Rakesh Agrawal and Lynn Daugherty; “single mixed refrigerant gas liquefaction process”; paten, filed October 12, 1999 with application No 09/415,636;
[20] Mark Julian and Rakesh Agrawal “dual mixed refrigerant cycle for gas liquefaction”; patent, filed December 9, 1998 with application No.09/208,562.
111
[21] Mehmet, Kanoglu*; “Exergy analysis of multistage cascade refrigeration cycle used for natural gas liquefaction” Department of Mechanical Engineering, University of Gaziantep, 27310 Gaziantep, Turkey; International journal of energy research, Int. J. Energy res. 2002; 26:763–774 [22] Michael Barclay and Tariq Shukri “ Single mixed refrigerant process has appeal For growing offshore market” LNG Journal, June 2007 http://www.fwc.com/publications/tech_papers/getpapers.cfm?cat=4
(29/12/2010) [23] NTNU lectures “LNG compendium”, TEP4185 - fall semester 2009 [24] Pwaga, Sultan; semester project titled as “Natural Gas Liquefaction Process on Board an LNG-FPSO” ; NTNU, submitted January 2011. [ 25]Rødum, Kristian; master thesis titled as “Development of small scale LNG plants” ; NTNU; submitted July 2009. [26] Silvia Pérez 1, Rocío Díez 2 “opportunities of monetising natural gas reserves using smal to medium scale lng technologies” 24th World gas conference (WGC 2009), Buenos Aires, Argentina, 5-9 October 2009 [27] Valerie Rivera ,Ayema Aduku and Oluwaseun Harris, “Evaluation of LNG Technologies”, April 30, 2008 www.lngpedia.com/.../Evaluation_of_LNG_Production_Technologies_- _Univ_of_Oklahoma.pdf [28] Verghese, J.T. “ Options for exploiting stranded gas – An overview of issues,
opportunitiesand solutions”( SPE 84250-MS, Denver, Colorado, USA):
5-8 October 2003
[29] Yan GU and Yonglin JU, “LNG-FPSO: Offshore LNG solution” 249–255, DOI
10.1007/s11708-008- 0050- Higher Education Press and Springer-Verlag 2008
[30] Y.L. Ju,“Design and analysis of liquefaction process for offshore associated gas
resources” Shanghai Jiao Tong University, Institute of Refrigeration and
Cryogenics, Shanghai 200240, China; journal homepage:
www.elsevier.com/locate/apthermeng, Available online 27 July 2010
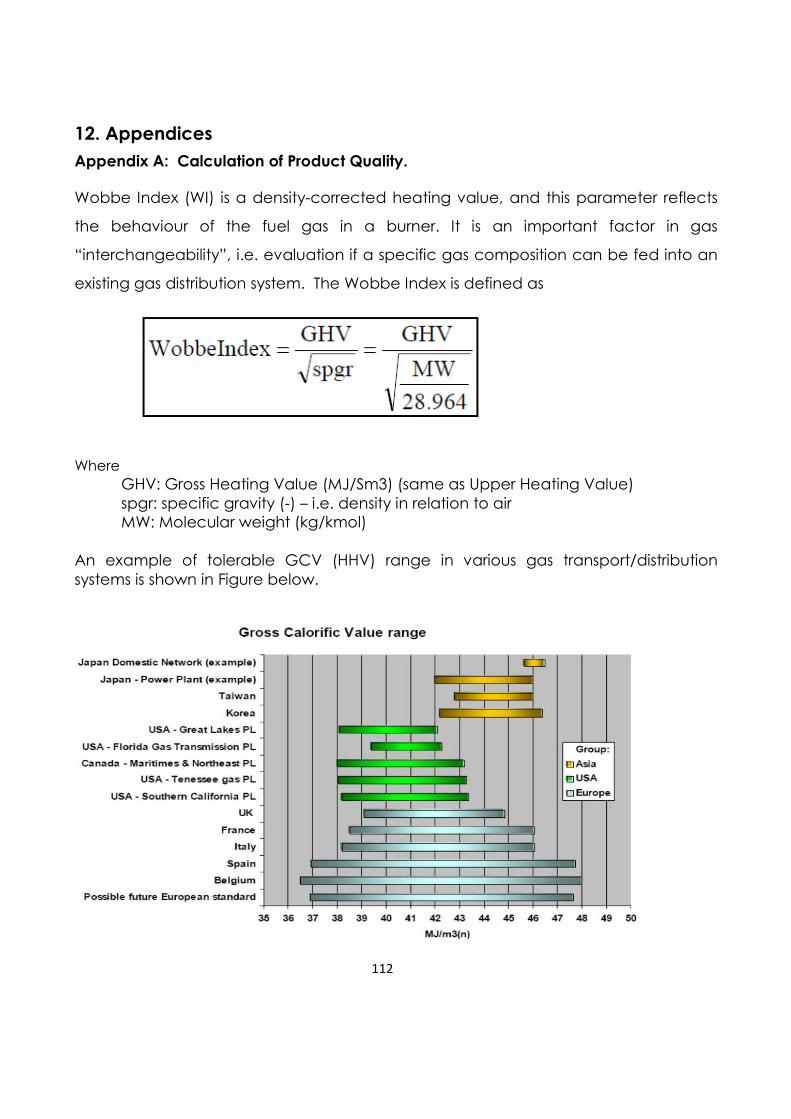
112
12. Appendices
Appendix A: Calculation of Product Quality.
Wobbe Index (WI) is a density-corrected heating value, and this parameter reflects
the behaviour of the fuel gas in a burner. It is an important factor in gas
“interchangeability”, i.e. evaluation if a specific gas composition can be fed into an
existing gas distribution system. The Wobbe Index is defined as
Where
GHV: Gross Heating Value (MJ/Sm3) (same as Upper Heating Value) spgr: specific gravity (-) – i.e. density in relation to air MW: Molecular weight (kg/kmol)
An example of tolerable GCV (HHV) range in various gas transport/distribution systems is shown in Figure below.
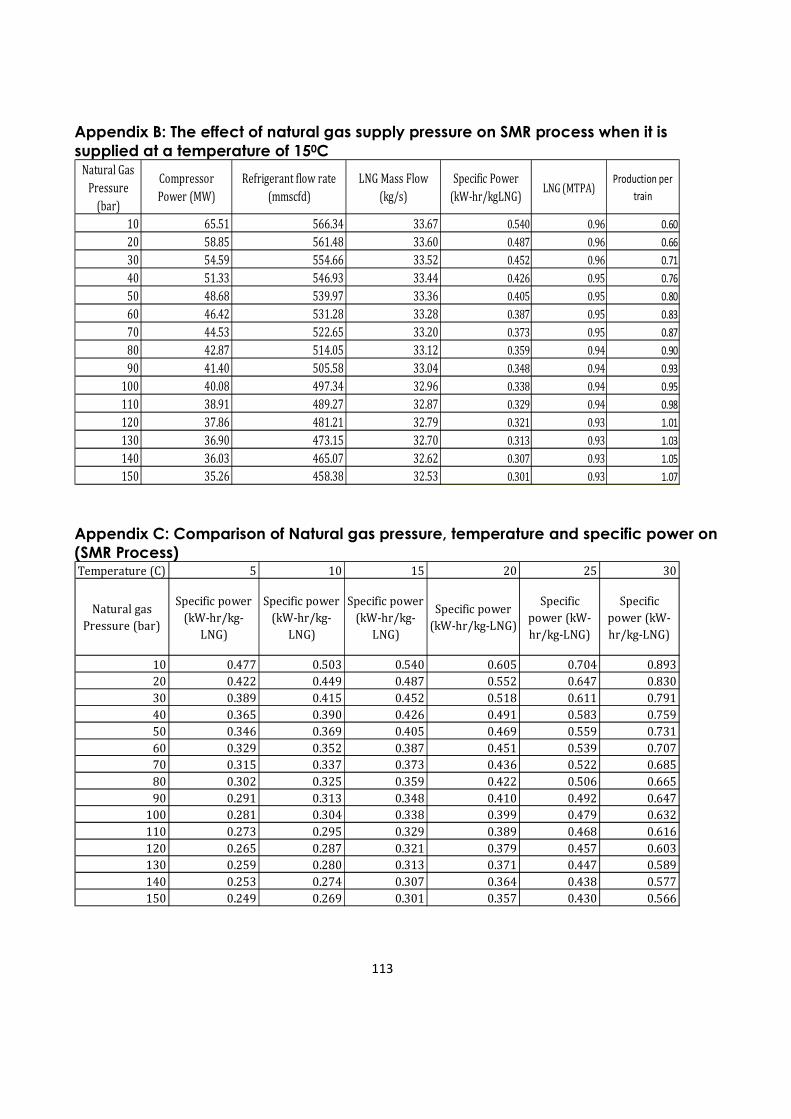
113
Appendix B: The effect of natural gas supply pressure on SMR process when it is
supplied at a temperature of 150C Natural Gas
Pressure
(bar)
Compressor
Power (MW)
Refrigerant flow rate
(mmscfd)
LNG Mass Flow
(kg/s)
Specific Power
(kW-hr/kgLNG)LNG (MTPA)
Production per
train
10 65.51 566.34 33.67 0.540 0.96 0.60
20 58.85 561.48 33.60 0.487 0.96 0.66
30 54.59 554.66 33.52 0.452 0.96 0.71
40 51.33 546.93 33.44 0.426 0.95 0.76
50 48.68 539.97 33.36 0.405 0.95 0.80
60 46.42 531.28 33.28 0.387 0.95 0.83
70 44.53 522.65 33.20 0.373 0.95 0.87
80 42.87 514.05 33.12 0.359 0.94 0.90
90 41.40 505.58 33.04 0.348 0.94 0.93
100 40.08 497.34 32.96 0.338 0.94 0.95
110 38.91 489.27 32.87 0.329 0.94 0.98
120 37.86 481.21 32.79 0.321 0.93 1.01
130 36.90 473.15 32.70 0.313 0.93 1.03
140 36.03 465.07 32.62 0.307 0.93 1.05
150 35.26 458.38 32.53 0.301 0.93 1.07 Appendix C: Comparison of Natural gas pressure, temperature and specific power on
(SMR Process) Temperature (C) 5 10 15 20 25 30
Natural gas
Pressure (bar)
Specific power
(kW-hr/kg-
LNG)
Specific power
(kW-hr/kg-
LNG)
Specific power
(kW-hr/kg-
LNG)
Specific power
(kW-hr/kg-LNG)
Specific
power (kW-
hr/kg-LNG)
Specific
power (kW-
hr/kg-LNG)
10 0.477 0.503 0.540 0.605 0.704 0.893
20 0.422 0.449 0.487 0.552 0.647 0.830
30 0.389 0.415 0.452 0.518 0.611 0.791
40 0.365 0.390 0.426 0.491 0.583 0.759
50 0.346 0.369 0.405 0.469 0.559 0.731
60 0.329 0.352 0.387 0.451 0.539 0.707
70 0.315 0.337 0.373 0.436 0.522 0.685
80 0.302 0.325 0.359 0.422 0.506 0.665
90 0.291 0.313 0.348 0.410 0.492 0.647
100 0.281 0.304 0.338 0.399 0.479 0.632
110 0.273 0.295 0.329 0.389 0.468 0.616
120 0.265 0.287 0.321 0.379 0.457 0.603
130 0.259 0.280 0.313 0.371 0.447 0.589
140 0.253 0.274 0.307 0.364 0.438 0.577
150 0.249 0.269 0.301 0.357 0.430 0.566
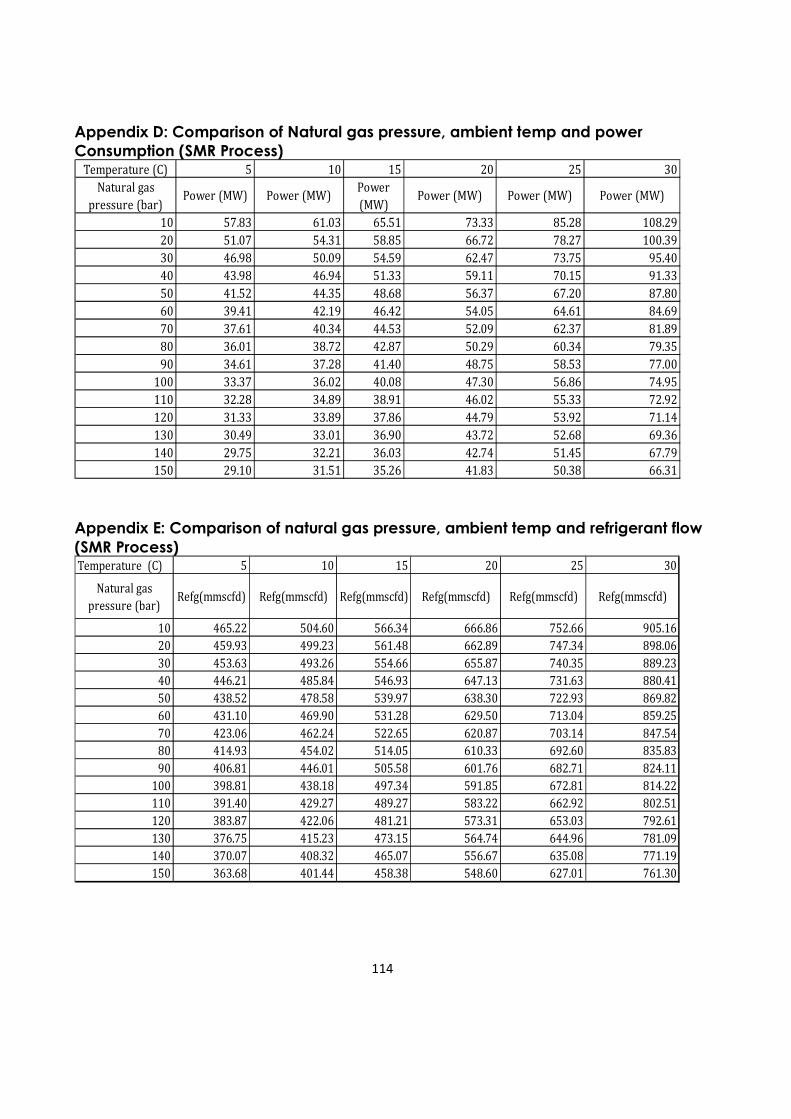
114
Appendix D: Comparison of Natural gas pressure, ambient temp and power
Consumption (SMR Process) Temperature (C) 5 10 15 20 25 30
Natural gas
pressure (bar)Power (MW) Power (MW)
Power
(MW)Power (MW) Power (MW) Power (MW)
10 57.83 61.03 65.51 73.33 85.28 108.29
20 51.07 54.31 58.85 66.72 78.27 100.39
30 46.98 50.09 54.59 62.47 73.75 95.40
40 43.98 46.94 51.33 59.11 70.15 91.33
50 41.52 44.35 48.68 56.37 67.20 87.80
60 39.41 42.19 46.42 54.05 64.61 84.69
70 37.61 40.34 44.53 52.09 62.37 81.89
80 36.01 38.72 42.87 50.29 60.34 79.35
90 34.61 37.28 41.40 48.75 58.53 77.00
100 33.37 36.02 40.08 47.30 56.86 74.95
110 32.28 34.89 38.91 46.02 55.33 72.92
120 31.33 33.89 37.86 44.79 53.92 71.14
130 30.49 33.01 36.90 43.72 52.68 69.36
140 29.75 32.21 36.03 42.74 51.45 67.79
150 29.10 31.51 35.26 41.83 50.38 66.31
Appendix E: Comparison of natural gas pressure, ambient temp and refrigerant flow
(SMR Process) Temperature (C) 5 10 15 20 25 30
Natural gas
pressure (bar)Refg(mmscfd) Refg(mmscfd) Refg(mmscfd) Refg(mmscfd) Refg(mmscfd) Refg(mmscfd)
10 465.22 504.60 566.34 666.86 752.66 905.16
20 459.93 499.23 561.48 662.89 747.34 898.06
30 453.63 493.26 554.66 655.87 740.35 889.23
40 446.21 485.84 546.93 647.13 731.63 880.41
50 438.52 478.58 539.97 638.30 722.93 869.82
60 431.10 469.90 531.28 629.50 713.04 859.25
70 423.06 462.24 522.65 620.87 703.14 847.54
80 414.93 454.02 514.05 610.33 692.60 835.83
90 406.81 446.01 505.58 601.76 682.71 824.11
100 398.81 438.18 497.34 591.85 672.81 814.22
110 391.40 429.27 489.27 583.22 662.92 802.51
120 383.87 422.06 481.21 573.31 653.03 792.61
130 376.75 415.23 473.15 564.74 644.96 781.09
140 370.07 408.32 465.07 556.67 635.08 771.19
150 363.68 401.44 458.38 548.60 627.01 761.30
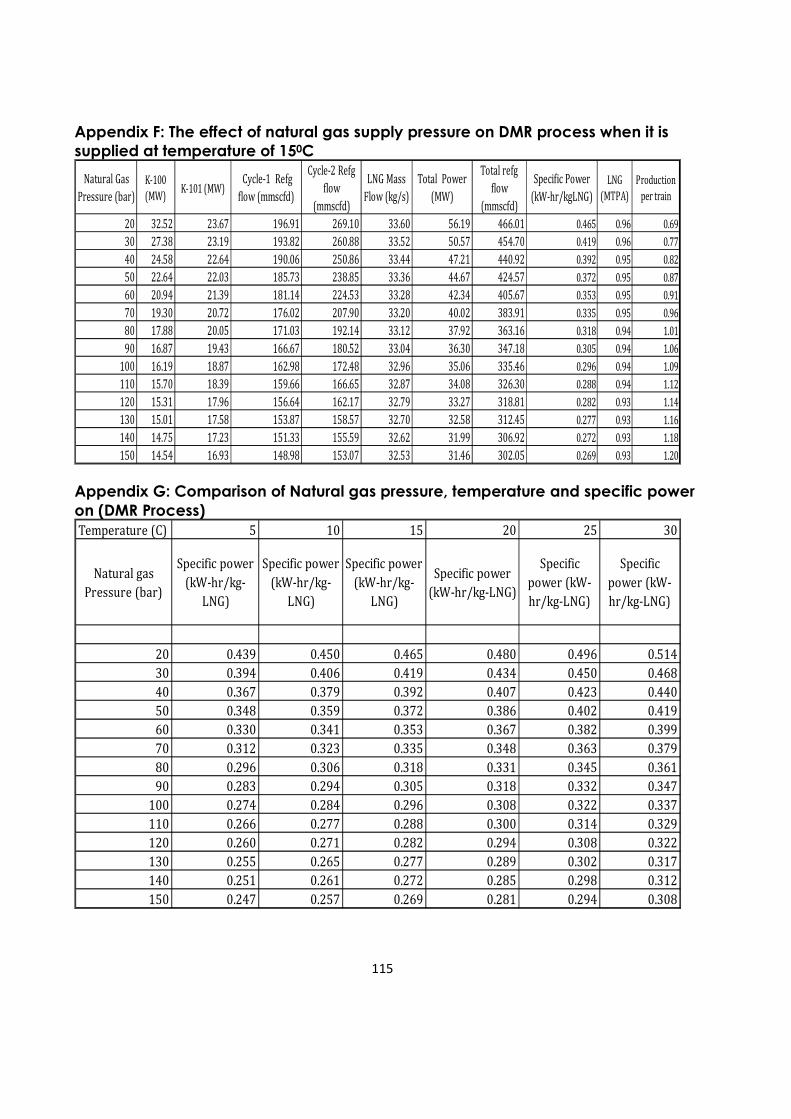
115
Appendix F: The effect of natural gas supply pressure on DMR process when it is
supplied at temperature of 150C
Natural Gas
Pressure (bar)
K-100
(MW)K-101 (MW)
Cycle-1 Refg
flow (mmscfd)
Cycle-2 Refg
flow
(mmscfd)
LNG Mass
Flow (kg/s)
Total Power
(MW)
Total refg
flow
(mmscfd)
Specific Power
(kW-hr/kgLNG)
LNG
(MTPA)
Production
per train
20 32.52 23.67 196.91 269.10 33.60 56.19 466.01 0.465 0.96 0.69
30 27.38 23.19 193.82 260.88 33.52 50.57 454.70 0.419 0.96 0.77
40 24.58 22.64 190.06 250.86 33.44 47.21 440.92 0.392 0.95 0.82
50 22.64 22.03 185.73 238.85 33.36 44.67 424.57 0.372 0.95 0.87
60 20.94 21.39 181.14 224.53 33.28 42.34 405.67 0.353 0.95 0.91
70 19.30 20.72 176.02 207.90 33.20 40.02 383.91 0.335 0.95 0.96
80 17.88 20.05 171.03 192.14 33.12 37.92 363.16 0.318 0.94 1.01
90 16.87 19.43 166.67 180.52 33.04 36.30 347.18 0.305 0.94 1.06
100 16.19 18.87 162.98 172.48 32.96 35.06 335.46 0.296 0.94 1.09
110 15.70 18.39 159.66 166.65 32.87 34.08 326.30 0.288 0.94 1.12
120 15.31 17.96 156.64 162.17 32.79 33.27 318.81 0.282 0.93 1.14
130 15.01 17.58 153.87 158.57 32.70 32.58 312.45 0.277 0.93 1.16
140 14.75 17.23 151.33 155.59 32.62 31.99 306.92 0.272 0.93 1.18
150 14.54 16.93 148.98 153.07 32.53 31.46 302.05 0.269 0.93 1.20
Appendix G: Comparison of Natural gas pressure, temperature and specific power
on (DMR Process)
Temperature (C) 5 10 15 20 25 30
Natural gas
Pressure (bar)
Specific power
(kW-hr/kg-
LNG)
Specific power
(kW-hr/kg-
LNG)
Specific power
(kW-hr/kg-
LNG)
Specific power
(kW-hr/kg-LNG)
Specific
power (kW-
hr/kg-LNG)
Specific
power (kW-
hr/kg-LNG)
20 0.439 0.450 0.465 0.480 0.496 0.514
30 0.394 0.406 0.419 0.434 0.450 0.468
40 0.367 0.379 0.392 0.407 0.423 0.440
50 0.348 0.359 0.372 0.386 0.402 0.419
60 0.330 0.341 0.353 0.367 0.382 0.399
70 0.312 0.323 0.335 0.348 0.363 0.379
80 0.296 0.306 0.318 0.331 0.345 0.361
90 0.283 0.294 0.305 0.318 0.332 0.347
100 0.274 0.284 0.296 0.308 0.322 0.337
110 0.266 0.277 0.288 0.300 0.314 0.329
120 0.260 0.271 0.282 0.294 0.308 0.322
130 0.255 0.265 0.277 0.289 0.302 0.317
140 0.251 0.261 0.272 0.285 0.298 0.312
150 0.247 0.257 0.269 0.281 0.294 0.308
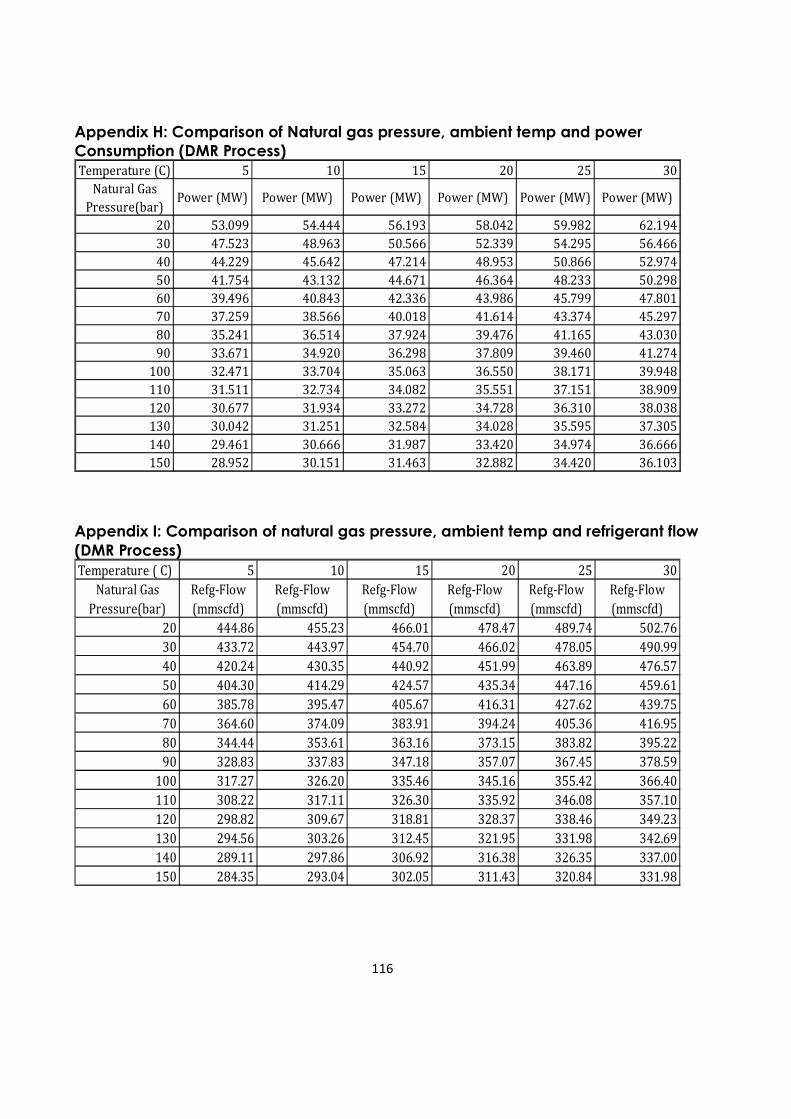
116
Appendix H: Comparison of Natural gas pressure, ambient temp and power
Consumption (DMR Process)
Temperature (C) 5 10 15 20 25 30
Natural Gas
Pressure(bar)Power (MW) Power (MW) Power (MW) Power (MW) Power (MW) Power (MW)
20 53.099 54.444 56.193 58.042 59.982 62.194
30 47.523 48.963 50.566 52.339 54.295 56.466
40 44.229 45.642 47.214 48.953 50.866 52.974
50 41.754 43.132 44.671 46.364 48.233 50.298
60 39.496 40.843 42.336 43.986 45.799 47.801
70 37.259 38.566 40.018 41.614 43.374 45.297
80 35.241 36.514 37.924 39.476 41.165 43.030
90 33.671 34.920 36.298 37.809 39.460 41.274
100 32.471 33.704 35.063 36.550 38.171 39.948
110 31.511 32.734 34.082 35.551 37.151 38.909
120 30.677 31.934 33.272 34.728 36.310 38.038
130 30.042 31.251 32.584 34.028 35.595 37.305
140 29.461 30.666 31.987 33.420 34.974 36.666
150 28.952 30.151 31.463 32.882 34.420 36.103
Appendix I: Comparison of natural gas pressure, ambient temp and refrigerant flow
(DMR Process)
Temperature ( C) 5 10 15 20 25 30
Natural Gas
Pressure(bar)
Refg-Flow
(mmscfd)
Refg-Flow
(mmscfd)
Refg-Flow
(mmscfd)
Refg-Flow
(mmscfd)
Refg-Flow
(mmscfd)
Refg-Flow
(mmscfd)
20 444.86 455.23 466.01 478.47 489.74 502.76
30 433.72 443.97 454.70 466.02 478.05 490.99
40 420.24 430.35 440.92 451.99 463.89 476.57
50 404.30 414.29 424.57 435.34 447.16 459.61
60 385.78 395.47 405.67 416.31 427.62 439.75
70 364.60 374.09 383.91 394.24 405.36 416.95
80 344.44 353.61 363.16 373.15 383.82 395.22
90 328.83 337.83 347.18 357.07 367.45 378.59
100 317.27 326.20 335.46 345.16 355.42 366.40
110 308.22 317.11 326.30 335.92 346.08 357.10
120 298.82 309.67 318.81 328.37 338.46 349.23
130 294.56 303.26 312.45 321.95 331.98 342.69
140 289.11 297.86 306.92 316.38 326.35 337.00
150 284.35 293.04 302.05 311.43 320.84 331.98
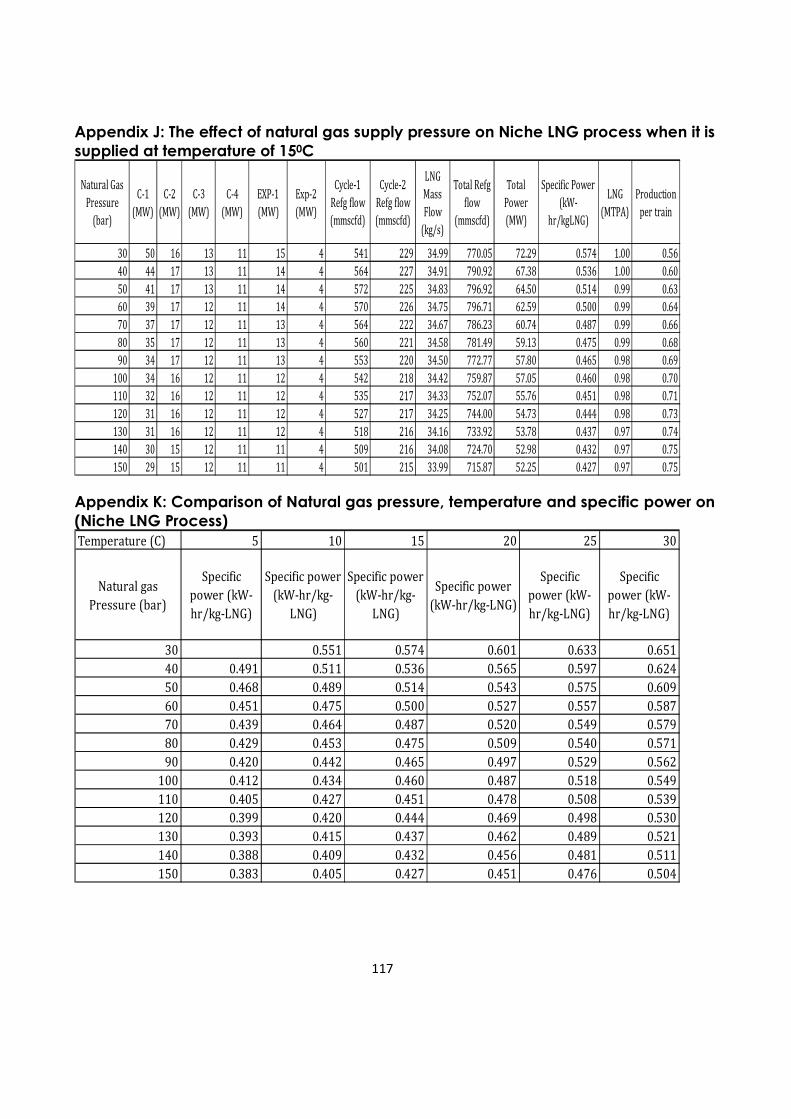
117
Appendix J: The effect of natural gas supply pressure on Niche LNG process when it is
supplied at temperature of 150C
Natural Gas
Pressure
(bar)
C-1
(MW)
C-2
(MW)
C-3
(MW)
C-4
(MW)
EXP-1
(MW)
Exp-2
(MW)
Cycle-1
Refg flow
(mmscfd)
Cycle-2
Refg flow
(mmscfd)
LNG
Mass
Flow
(kg/s)
Total Refg
flow
(mmscfd)
Total
Power
(MW)
Specific Power
(kW-
hr/kgLNG)
LNG
(MTPA)
Production
per train
30 50 16 13 11 15 4 541 229 34.99 770.05 72.29 0.574 1.00 0.56
40 44 17 13 11 14 4 564 227 34.91 790.92 67.38 0.536 1.00 0.60
50 41 17 13 11 14 4 572 225 34.83 796.92 64.50 0.514 0.99 0.63
60 39 17 12 11 14 4 570 226 34.75 796.71 62.59 0.500 0.99 0.64
70 37 17 12 11 13 4 564 222 34.67 786.23 60.74 0.487 0.99 0.66
80 35 17 12 11 13 4 560 221 34.58 781.49 59.13 0.475 0.99 0.68
90 34 17 12 11 13 4 553 220 34.50 772.77 57.80 0.465 0.98 0.69
100 34 16 12 11 12 4 542 218 34.42 759.87 57.05 0.460 0.98 0.70
110 32 16 12 11 12 4 535 217 34.33 752.07 55.76 0.451 0.98 0.71
120 31 16 12 11 12 4 527 217 34.25 744.00 54.73 0.444 0.98 0.73
130 31 16 12 11 12 4 518 216 34.16 733.92 53.78 0.437 0.97 0.74
140 30 15 12 11 11 4 509 216 34.08 724.70 52.98 0.432 0.97 0.75
150 29 15 12 11 11 4 501 215 33.99 715.87 52.25 0.427 0.97 0.75
Appendix K: Comparison of Natural gas pressure, temperature and specific power on
(Niche LNG Process)
Temperature (C) 5 10 15 20 25 30
Natural gas
Pressure (bar)
Specific
power (kW-
hr/kg-LNG)
Specific power
(kW-hr/kg-
LNG)
Specific power
(kW-hr/kg-
LNG)
Specific power
(kW-hr/kg-LNG)
Specific
power (kW-
hr/kg-LNG)
Specific
power (kW-
hr/kg-LNG)
30 0.551 0.574 0.601 0.633 0.651
40 0.491 0.511 0.536 0.565 0.597 0.624
50 0.468 0.489 0.514 0.543 0.575 0.609
60 0.451 0.475 0.500 0.527 0.557 0.587
70 0.439 0.464 0.487 0.520 0.549 0.579
80 0.429 0.453 0.475 0.509 0.540 0.571
90 0.420 0.442 0.465 0.497 0.529 0.562
100 0.412 0.434 0.460 0.487 0.518 0.549
110 0.405 0.427 0.451 0.478 0.508 0.539
120 0.399 0.420 0.444 0.469 0.498 0.530
130 0.393 0.415 0.437 0.462 0.489 0.521
140 0.388 0.409 0.432 0.456 0.481 0.511
150 0.383 0.405 0.427 0.451 0.476 0.504
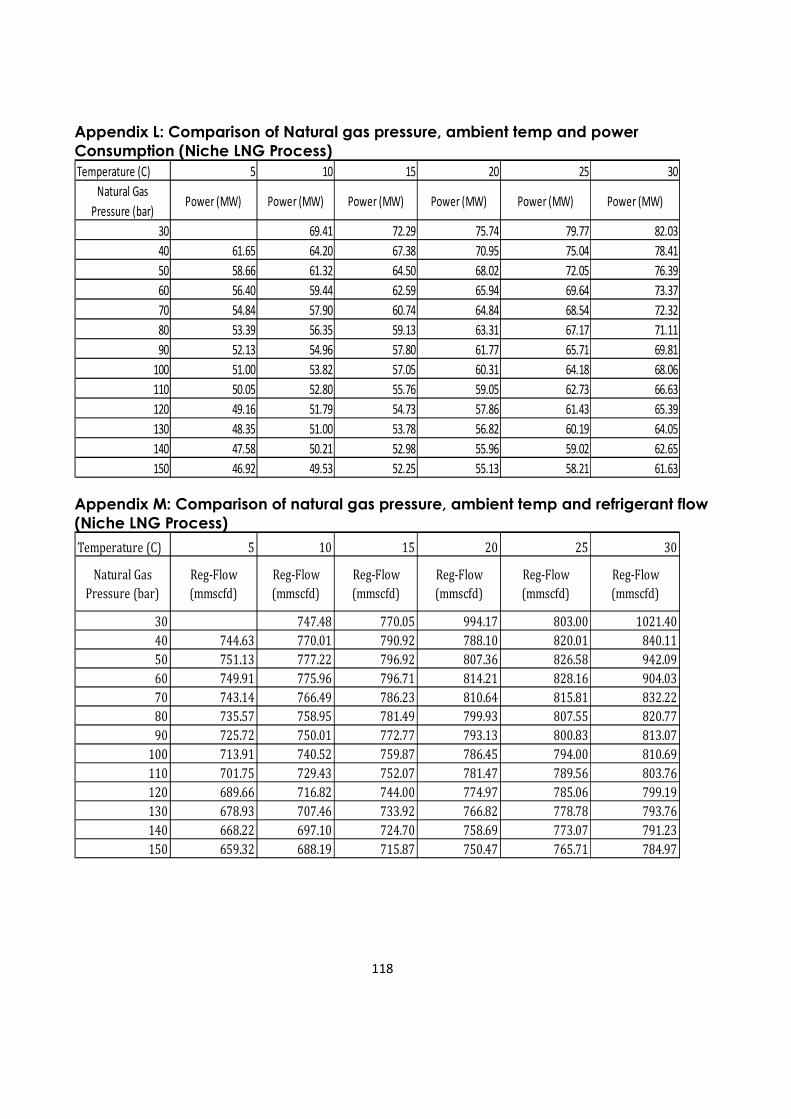
118
Appendix L: Comparison of Natural gas pressure, ambient temp and power
Consumption (Niche LNG Process)
Temperature (C) 5 10 15 20 25 30
Natural Gas
Pressure (bar)Power (MW) Power (MW) Power (MW) Power (MW) Power (MW) Power (MW)
30 69.41 72.29 75.74 79.77 82.03
40 61.65 64.20 67.38 70.95 75.04 78.41
50 58.66 61.32 64.50 68.02 72.05 76.39
60 56.40 59.44 62.59 65.94 69.64 73.37
70 54.84 57.90 60.74 64.84 68.54 72.32
80 53.39 56.35 59.13 63.31 67.17 71.11
90 52.13 54.96 57.80 61.77 65.71 69.81
100 51.00 53.82 57.05 60.31 64.18 68.06
110 50.05 52.80 55.76 59.05 62.73 66.63
120 49.16 51.79 54.73 57.86 61.43 65.39
130 48.35 51.00 53.78 56.82 60.19 64.05
140 47.58 50.21 52.98 55.96 59.02 62.65
150 46.92 49.53 52.25 55.13 58.21 61.63
Appendix M: Comparison of natural gas pressure, ambient temp and refrigerant flow
(Niche LNG Process)
Temperature (C) 5 10 15 20 25 30
Natural Gas
Pressure (bar)
Reg-Flow
(mmscfd)
Reg-Flow
(mmscfd)
Reg-Flow
(mmscfd)
Reg-Flow
(mmscfd)
Reg-Flow
(mmscfd)
Reg-Flow
(mmscfd)
30 747.48 770.05 994.17 803.00 1021.40
40 744.63 770.01 790.92 788.10 820.01 840.11
50 751.13 777.22 796.92 807.36 826.58 942.09
60 749.91 775.96 796.71 814.21 828.16 904.03
70 743.14 766.49 786.23 810.64 815.81 832.22
80 735.57 758.95 781.49 799.93 807.55 820.77
90 725.72 750.01 772.77 793.13 800.83 813.07
100 713.91 740.52 759.87 786.45 794.00 810.69
110 701.75 729.43 752.07 781.47 789.56 803.76
120 689.66 716.82 744.00 774.97 785.06 799.19
130 678.93 707.46 733.92 766.82 778.78 793.76
140 668.22 697.10 724.70 758.69 773.07 791.23
150 659.32 688.19 715.87 750.47 765.71 784.97
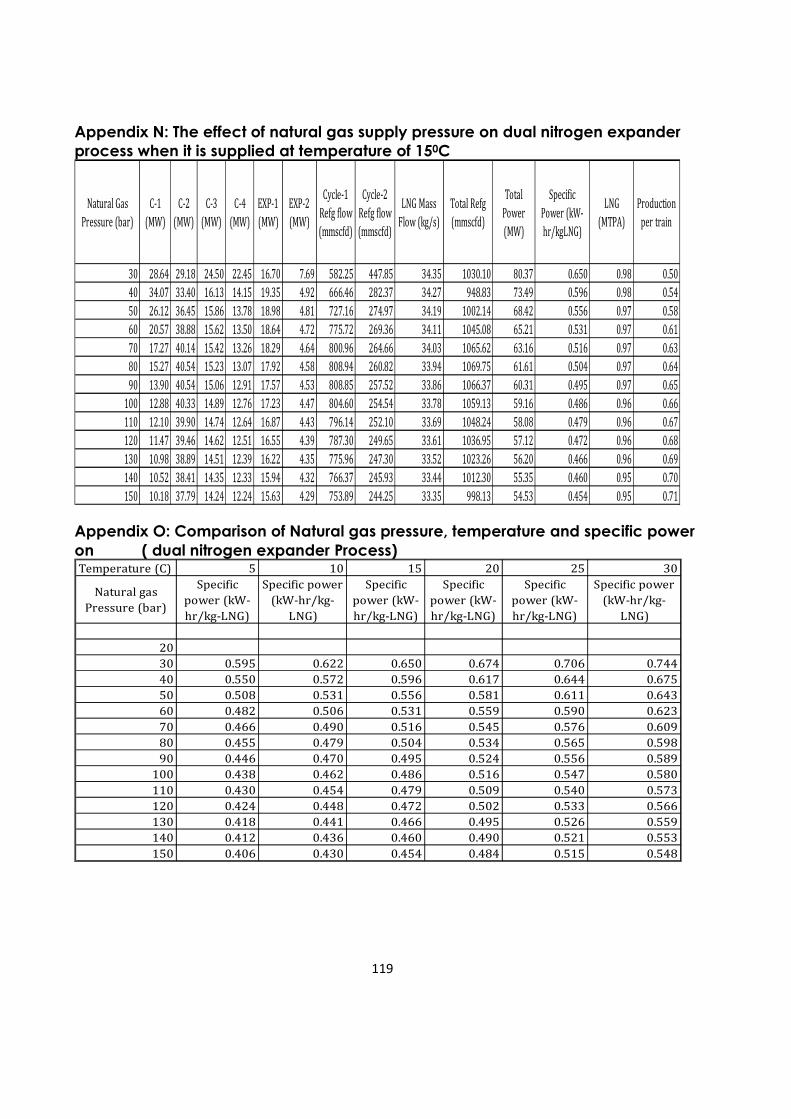
119
Appendix N: The effect of natural gas supply pressure on dual nitrogen expander
process when it is supplied at temperature of 150C
Natural Gas
Pressure (bar)
C-1
(MW)
C-2
(MW)
C-3
(MW)
C-4
(MW)
EXP-1
(MW)
EXP-2
(MW)
Cycle-1
Refg flow
(mmscfd)
Cycle-2
Refg flow
(mmscfd)
LNG Mass
Flow (kg/s)
Total Refg
(mmscfd)
Total
Power
(MW)
Specific
Power (kW-
hr/kgLNG)
LNG
(MTPA)
Production
per train
30 28.64 29.18 24.50 22.45 16.70 7.69 582.25 447.85 34.35 1030.10 80.37 0.650 0.98 0.50
40 34.07 33.40 16.13 14.15 19.35 4.92 666.46 282.37 34.27 948.83 73.49 0.596 0.98 0.54
50 26.12 36.45 15.86 13.78 18.98 4.81 727.16 274.97 34.19 1002.14 68.42 0.556 0.97 0.58
60 20.57 38.88 15.62 13.50 18.64 4.72 775.72 269.36 34.11 1045.08 65.21 0.531 0.97 0.61
70 17.27 40.14 15.42 13.26 18.29 4.64 800.96 264.66 34.03 1065.62 63.16 0.516 0.97 0.63
80 15.27 40.54 15.23 13.07 17.92 4.58 808.94 260.82 33.94 1069.75 61.61 0.504 0.97 0.64
90 13.90 40.54 15.06 12.91 17.57 4.53 808.85 257.52 33.86 1066.37 60.31 0.495 0.97 0.65
100 12.88 40.33 14.89 12.76 17.23 4.47 804.60 254.54 33.78 1059.13 59.16 0.486 0.96 0.66
110 12.10 39.90 14.74 12.64 16.87 4.43 796.14 252.10 33.69 1048.24 58.08 0.479 0.96 0.67
120 11.47 39.46 14.62 12.51 16.55 4.39 787.30 249.65 33.61 1036.95 57.12 0.472 0.96 0.68
130 10.98 38.89 14.51 12.39 16.22 4.35 775.96 247.30 33.52 1023.26 56.20 0.466 0.96 0.69
140 10.52 38.41 14.35 12.33 15.94 4.32 766.37 245.93 33.44 1012.30 55.35 0.460 0.95 0.70
150 10.18 37.79 14.24 12.24 15.63 4.29 753.89 244.25 33.35 998.13 54.53 0.454 0.95 0.71
Appendix O: Comparison of Natural gas pressure, temperature and specific power
on ( dual nitrogen expander Process) Temperature (C) 5 10 15 20 25 30
Natural gas
Pressure (bar)
Specific
power (kW-
hr/kg-LNG)
Specific power
(kW-hr/kg-
LNG)
Specific
power (kW-
hr/kg-LNG)
Specific
power (kW-
hr/kg-LNG)
Specific
power (kW-
hr/kg-LNG)
Specific power
(kW-hr/kg-
LNG)
20
30 0.595 0.622 0.650 0.674 0.706 0.744
40 0.550 0.572 0.596 0.617 0.644 0.675
50 0.508 0.531 0.556 0.581 0.611 0.643
60 0.482 0.506 0.531 0.559 0.590 0.623
70 0.466 0.490 0.516 0.545 0.576 0.609
80 0.455 0.479 0.504 0.534 0.565 0.598
90 0.446 0.470 0.495 0.524 0.556 0.589
100 0.438 0.462 0.486 0.516 0.547 0.580
110 0.430 0.454 0.479 0.509 0.540 0.573
120 0.424 0.448 0.472 0.502 0.533 0.566
130 0.418 0.441 0.466 0.495 0.526 0.559
140 0.412 0.436 0.460 0.490 0.521 0.553
150 0.406 0.430 0.454 0.484 0.515 0.548
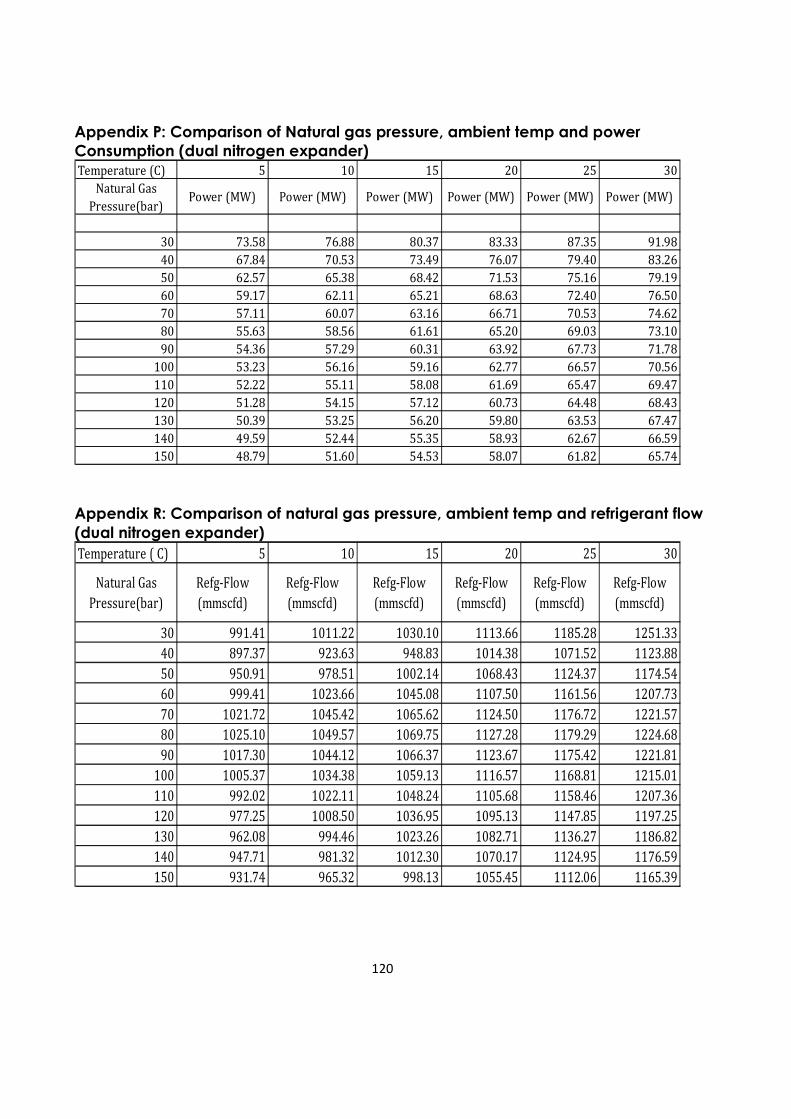
120
Appendix P: Comparison of Natural gas pressure, ambient temp and power
Consumption (dual nitrogen expander)
Temperature (C) 5 10 15 20 25 30
Natural Gas
Pressure(bar)Power (MW) Power (MW) Power (MW) Power (MW) Power (MW) Power (MW)
30 73.58 76.88 80.37 83.33 87.35 91.98
40 67.84 70.53 73.49 76.07 79.40 83.26
50 62.57 65.38 68.42 71.53 75.16 79.19
60 59.17 62.11 65.21 68.63 72.40 76.50
70 57.11 60.07 63.16 66.71 70.53 74.62
80 55.63 58.56 61.61 65.20 69.03 73.10
90 54.36 57.29 60.31 63.92 67.73 71.78
100 53.23 56.16 59.16 62.77 66.57 70.56
110 52.22 55.11 58.08 61.69 65.47 69.47
120 51.28 54.15 57.12 60.73 64.48 68.43
130 50.39 53.25 56.20 59.80 63.53 67.47
140 49.59 52.44 55.35 58.93 62.67 66.59
150 48.79 51.60 54.53 58.07 61.82 65.74
Appendix R: Comparison of natural gas pressure, ambient temp and refrigerant flow
(dual nitrogen expander)
Temperature ( C) 5 10 15 20 25 30
Natural Gas
Pressure(bar)
Refg-Flow
(mmscfd)
Refg-Flow
(mmscfd)
Refg-Flow
(mmscfd)
Refg-Flow
(mmscfd)
Refg-Flow
(mmscfd)
Refg-Flow
(mmscfd)
30 991.41 1011.22 1030.10 1113.66 1185.28 1251.33
40 897.37 923.63 948.83 1014.38 1071.52 1123.88
50 950.91 978.51 1002.14 1068.43 1124.37 1174.54
60 999.41 1023.66 1045.08 1107.50 1161.56 1207.73
70 1021.72 1045.42 1065.62 1124.50 1176.72 1221.57
80 1025.10 1049.57 1069.75 1127.28 1179.29 1224.68
90 1017.30 1044.12 1066.37 1123.67 1175.42 1221.81
100 1005.37 1034.38 1059.13 1116.57 1168.81 1215.01
110 992.02 1022.11 1048.24 1105.68 1158.46 1207.36
120 977.25 1008.50 1036.95 1095.13 1147.85 1197.25
130 962.08 994.46 1023.26 1082.71 1136.27 1186.82
140 947.71 981.32 1012.30 1070.17 1124.95 1176.59
150 931.74 965.32 998.13 1055.45 1112.06 1165.39
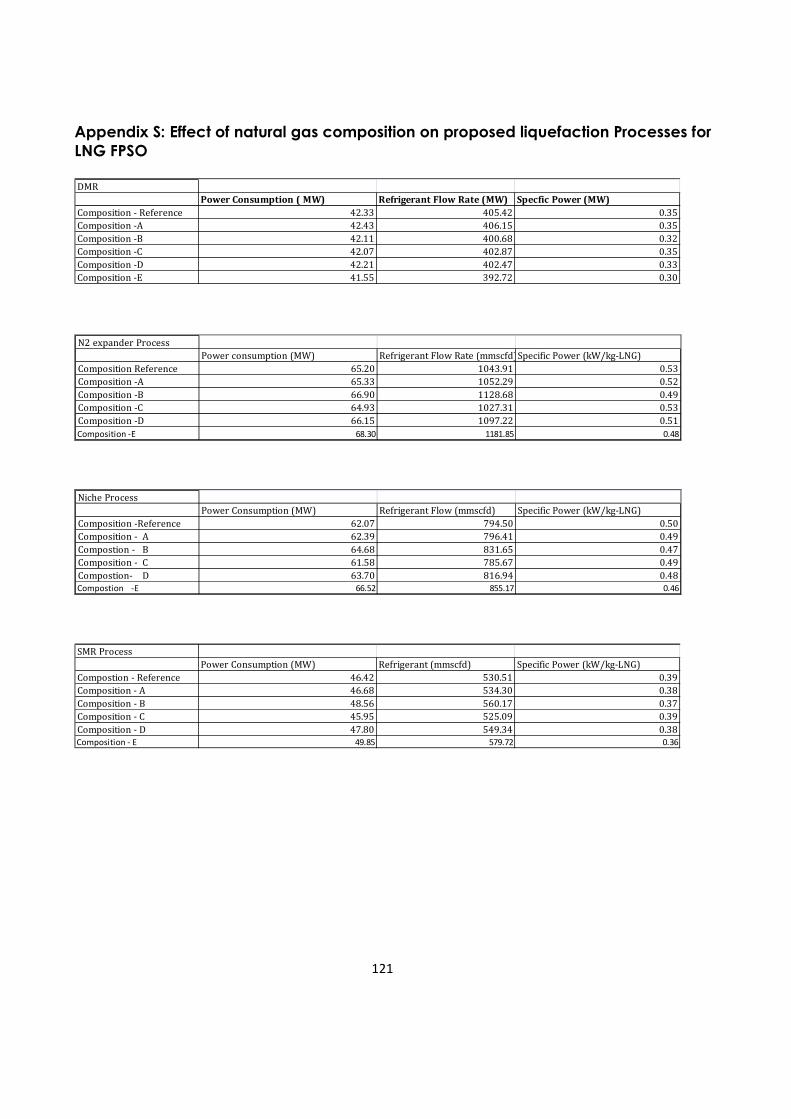
121
Appendix S: Effect of natural gas composition on proposed liquefaction Processes for
LNG FPSO
DMR
Power Consumption ( MW) Refrigerant Flow Rate (MW) Specfic Power (MW)
Composition - Reference 42.33 405.42 0.35
Composition -A 42.43 406.15 0.35
Composition -B 42.11 400.68 0.32
Composition -C 42.07 402.87 0.35
Composition -D 42.21 402.47 0.33
Composition -E 41.55 392.72 0.30
N2 expander Process
Power consumption (MW) Refrigerant Flow Rate (mmscfd)Specific Power (kW/kg-LNG)
Composition Reference 65.20 1043.91 0.53
Composition -A 65.33 1052.29 0.52
Composition -B 66.90 1128.68 0.49
Composition -C 64.93 1027.31 0.53
Composition -D 66.15 1097.22 0.51
Composition -E 68.30 1181.85 0.48
Niche Process
Power Consumption (MW) Refrigerant Flow (mmscfd) Specific Power (kW/kg-LNG)
Composition -Reference 62.07 794.50 0.50
Composition - A 62.39 796.41 0.49
Compostion - B 64.68 831.65 0.47
Composition - C 61.58 785.67 0.49
Compostion- D 63.70 816.94 0.48
Compostion -E 66.52 855.17 0.46
SMR Process
Power Consumption (MW) Refrigerant (mmscfd) Specific Power (kW/kg-LNG)
Compostion - Reference 46.42 530.51 0.39
Composition - A 46.68 534.30 0.38
Composition - B 48.56 560.17 0.37
Composition - C 45.95 525.09 0.39
Composition - D 47.80 549.34 0.38
Composition - E 49.85 579.72 0.36
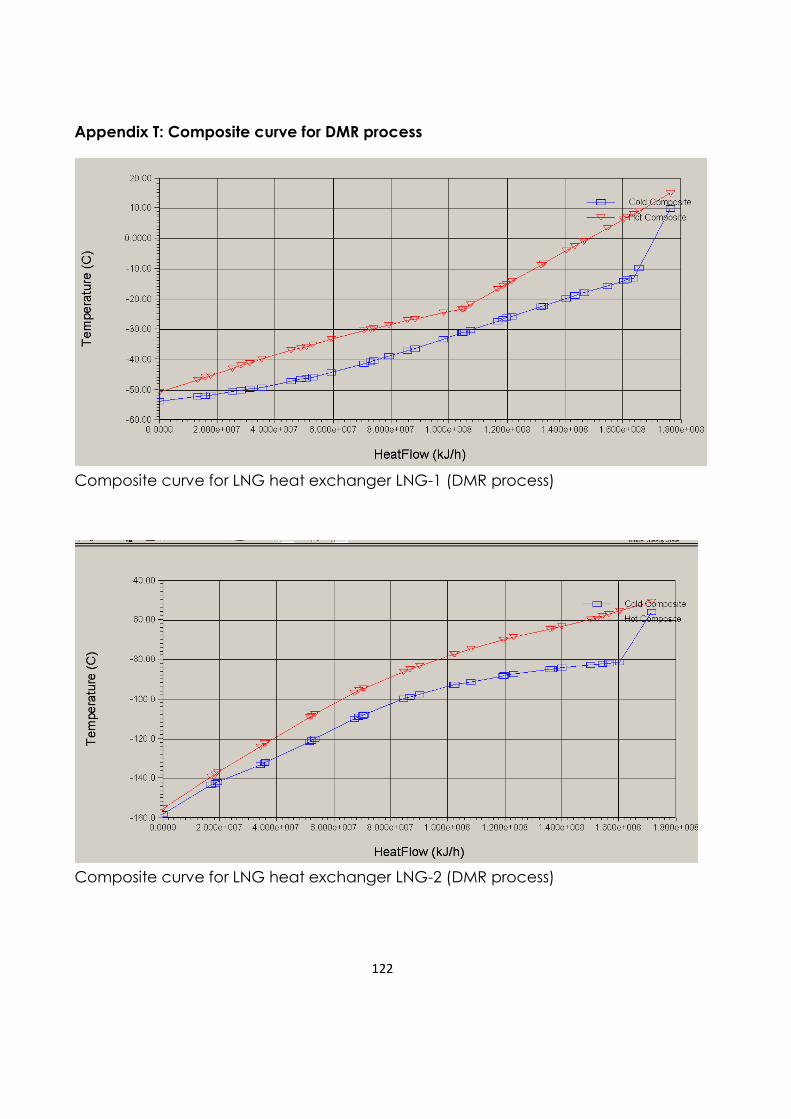
122
Appendix T: Composite curve for DMR process
Composite curve for LNG heat exchanger LNG-1 (DMR process)
Composite curve for LNG heat exchanger LNG-2 (DMR process)
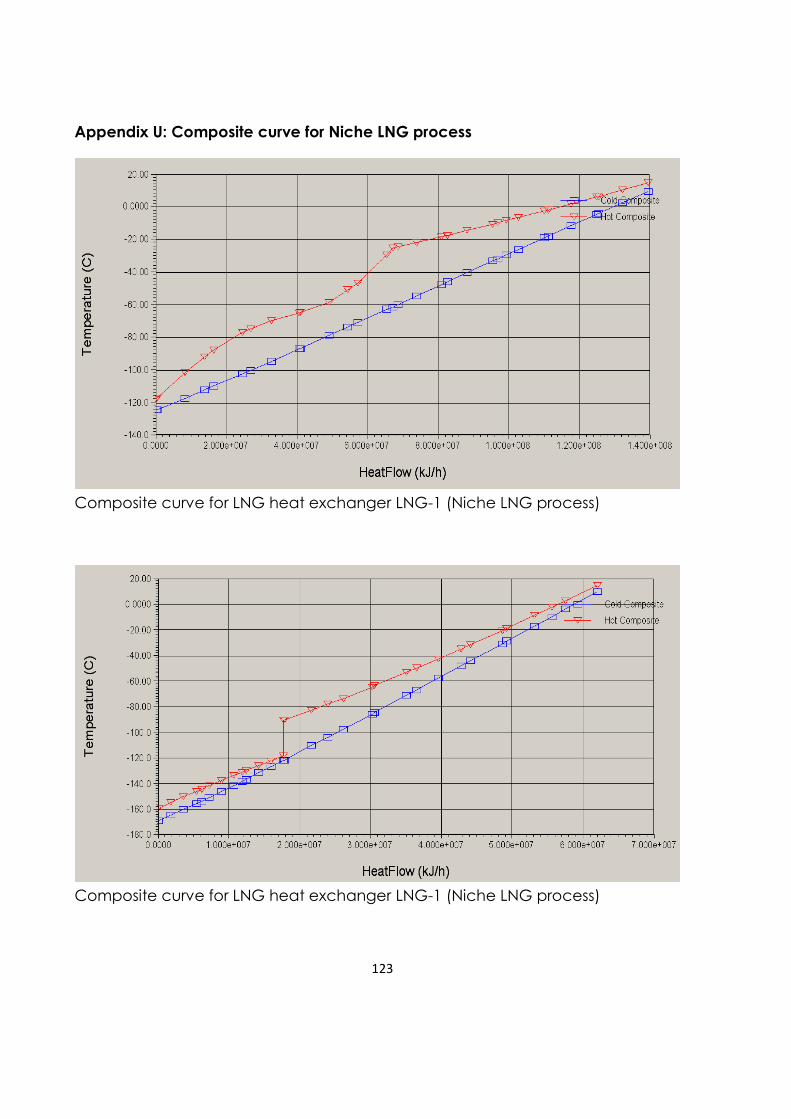
123
Appendix U: Composite curve for Niche LNG process
Composite curve for LNG heat exchanger LNG-1 (Niche LNG process)
Composite curve for LNG heat exchanger LNG-1 (Niche LNG process)
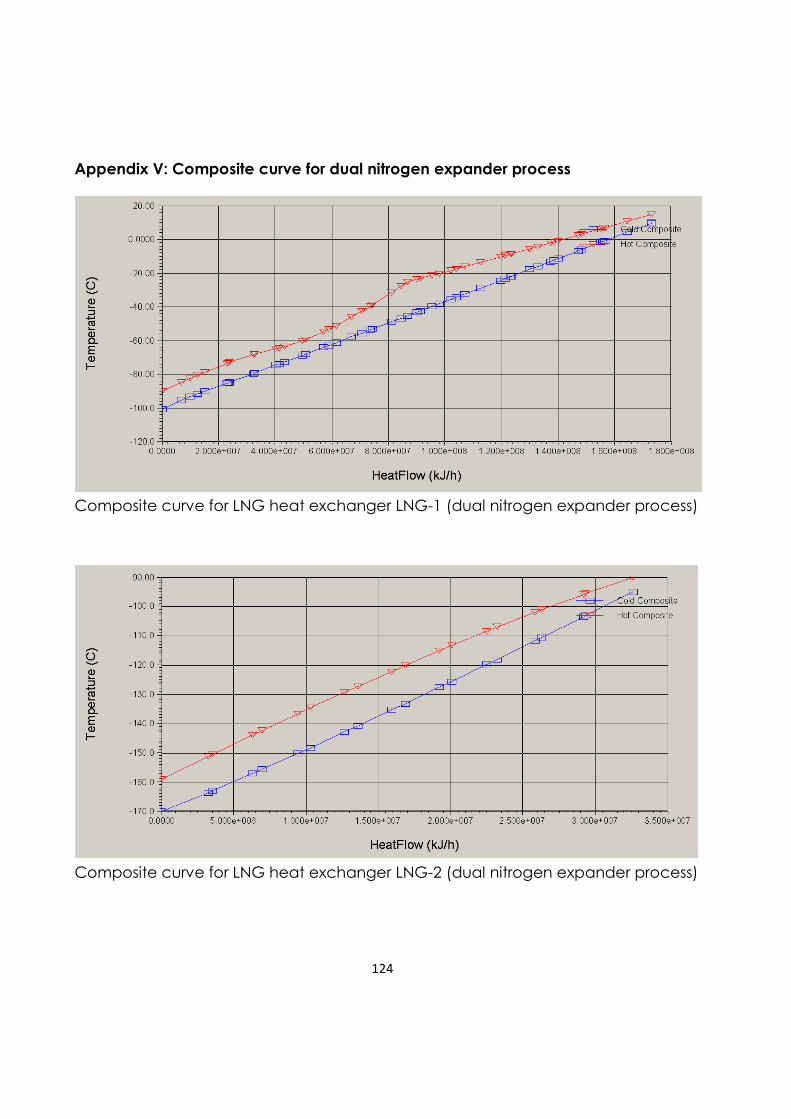
124
Appendix V: Composite curve for dual nitrogen expander process
Composite curve for LNG heat exchanger LNG-1 (dual nitrogen expander process)
Composite curve for LNG heat exchanger LNG-2 (dual nitrogen expander process)
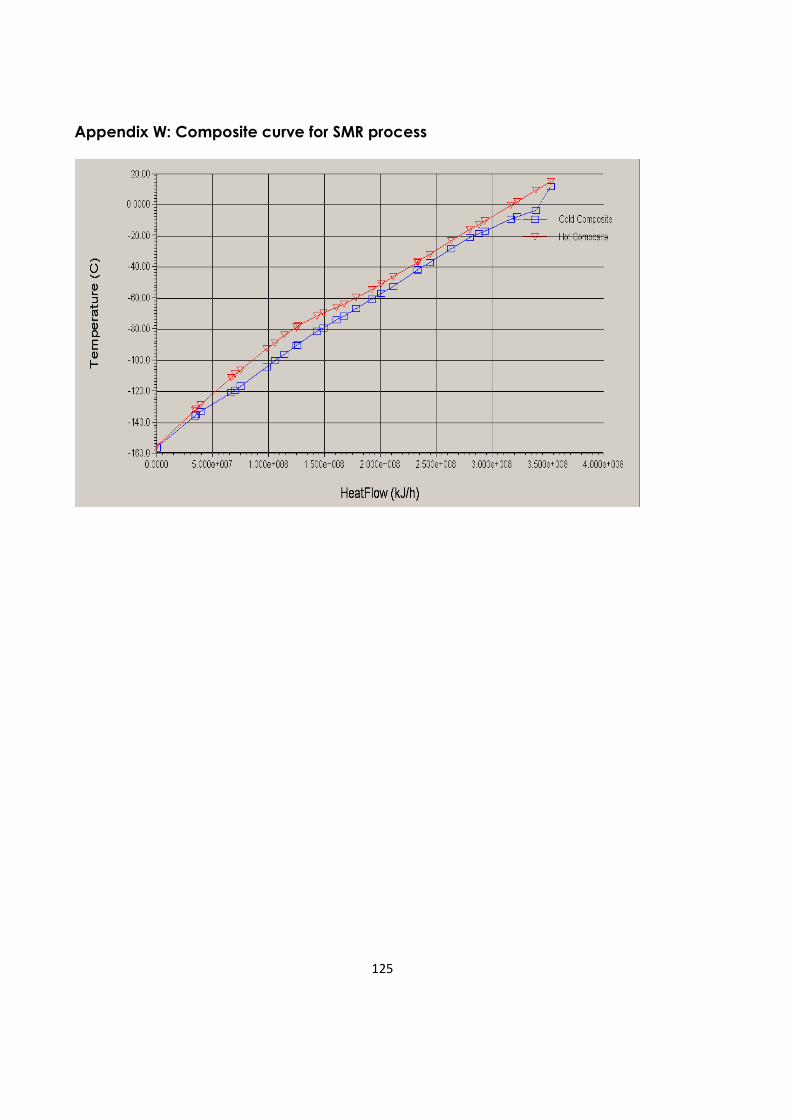
125
Appendix W: Composite curve for SMR process