Embed Size (px)
Citation preview
8/3/2019 Sensitivity Analysis of a 500 W Proton Exchange Membrane Fuel Cell Stack by Design of Experiments
http://slidepdf.com/reader/full/sensitivity-analysis-of-a-500-w-proton-exchange-membrane-fuel-cell-stack-by 1/9
Sensitivity Analysis of a 500 W Proton Exchange Membrane Fuel
Cell Stack by Design of experiments
Document by: Bharadwaj
Visit my website
www.engineeringpapers.blogspot.com
More papers and Presentations available on above site
In this paper, the influences on fuel cell performance of gas pressure and flow rate parameters are studied. The fuel
cell is operated at various pressure and gas flow rates are regulated by mass flow controllers placed upstream of thestack. In this study, four types of control factors considered are pressures of the fuel and oxidant and the flow rates
of the fuel and oxidant to select the optimized conditions for fuel cell operation. Each factor has two levels, leadinga full factorial design requiring 24 experiments leading to 16 experiments and fractional factorial experiments, 24-1,
leading to 8 experiments. The experimental data collected were analyzed by statistical sensitivity analysis by
checking the effect of one variable parameter on the other. The mixed interaction between the factors was also
considered along with main interaction to explain the model developed using the design of experiments. From the
analysis maximum fuel cell performance was found to be hydrogen flow rate, oxygen flow rate and the interaction
between the hydrogen pressure and oxygen flow rate compared to all other factors and their interactions. Thesefractional factorial experiments, presently applied to fuel cell systems, can be extended to other ranges and factors
with various levels, with a goal to minimize the variation caused by various factors that influence the fuel cell performance but with less number of trials compared to full factorial experiments.
Keywords: PEMFC, statistical analysis, ANOVA, factorial design, stack.
1. Introduction:
Polymer electrolyte membrane fuel cell (PEMFC) is
the most promising system among several differentkinds of fuel cells due to their various advantages
such as easy start-up, room temperature operation, no
liquid electrolyte, and high current density. To
achieve high current density, the optimal operating
conditions need to be identified for fuel cell systems
in addition to design parameters such as membrane,
catalyst particle size, quantity, and nature of gas
diffusion layers. There are many variables in theoperation of fuel cell systems, viz., fuel cell
temperature, reactant pressure, reactant flow, relativehumidity, and load. These parameters are related
among themselves to nonlinear relations, leading to
an impact on the fuel cell voltage [1, 4]. This is
concerned with minimizing the effect of uncertainty
or variation in design parameters on a design without
eliminating the source of the uncertainty or variation.
The robust design is less sensitive to variation in
uncontrollable design parameters than the traditionaloptimal designs. Robust design has found many
successful applications in engineering and is presently expanded to fuel cell systems with a goal to
minimize the variation caused by uncontrollable
noise factors such as ambient temperature, operating
environment, and natural phenomena that are difficult
to control [5-8]. The robust design can also help to
minimize the caused by control factors such as
pressure, flow rate and humidity. Improvement of
power and stabilization of cell performance under different operating conditions are important for
developing a practical PEMFC system. In general
these desirable parameters combinations were
decided by one factor experiments and the analysis is
done by fixing the other parameters, where theinfluence of other parameters is not considered. In
addition, a large number of experiments are needed to
analyze the performances of a given fuel cell systemare to identify the parameters of a physical model. In
order to evaluate the impacts of the physical control parameters on the fuel cell operation, the design of
experiment (DOE) method, developed by Fisher [9,
10], is being used, in particular, to reduce the number
of tests when many parameters were considered.

8/3/2019 Sensitivity Analysis of a 500 W Proton Exchange Membrane Fuel Cell Stack by Design of Experiments
http://slidepdf.com/reader/full/sensitivity-analysis-of-a-500-w-proton-exchange-membrane-fuel-cell-stack-by 2/9
Recently, this method is being used by many
researchers in fuel cell technology for the
development of fuel cells, materials for fuel cells, and
optimal solution for operating conditions, which
determine the most significant parameters [11-14].Grujicic et al. [15] studied the cathode and optimized
the distributor geometry by analysis of variance(ANOVA) method. The effect of material and
manufacturing variations on membrane electrode
assembly pressure distribution has been analyzed by
Vlahanos et al. [16]. The experimental analysis of
combined heat and power performance of a PEMFC
stack of 800 w capacity has been studied by factorialdesign method and showed that cathode
stoichiometry has a positive effect on electrical
power and negative effect on thermal power [17]. In
another detailed study by Guvelioglu and Stenger
[18], the main and interaction effects of PEMFC
design parameters have been studied with five factors
such as channel width, GDL thickness, GDL
conductivity, and GDL porosity. They found that thestrongest interaction occur between the channel size
and the GDL conductivity, while the weakestinteraction effects are observed between the GDL
thickness and the porosity.
2. Experimental
2.1 Experimental setup:
The Proton Exchange Membrane Fuel Cell
(PEMFC) stack was developed at the GASHUB,
Singapore by making use of 20 membrane electrode
assemblies [MEAs] made by a proprietary processand graphite plates with triple serpentine channel
geometry. The MEAs were made using a treated
Toray paper as a gas diffusion electrode and 20%
Pt/C as electro catalysts for both anode and cathode
and NafionTM membrane 111 from DuPont denomour
as an electrolyte. The area of each electrode was
found to be 100 cm2. The coolant circuit was also
introduced in the system manifold for the removal of heat. The heat developed by the stack is removed by
the water cooled system. The details of the stack are
given in table 1.
2.2 Test station:
The PEMFC test bench, used for the cell
management, was developed by K-Pas InstronicEngineers, Chennai which has partially designed in
our laboratory.
Table 1 Technical specifications of fuel cell
Number of cells 20
Cell area(cm2) 100
Operating temperature(0C) 30
Operating pressure max. 3 bar
Media inlet:
Cathode humidified oxygen
Anode humidified hydrogen
cooling Demineralised water
The apparatus consists of gas flow control systems,
temperature control, pressure control and humidifier
systems, electronic-load bank, milliohm meter for the
resistance measurement and a icomputerized dataacquisition system. All the settings of the test bench
concerning gas flow, temperature, humidity and gas
pressure were controlled through the data acquisitionsystem connected to the computer. Fig. 1 presents a
schematic diagram of the experimental apparatus.
Hydrogen in the anode side and oxygen or air in the
cathode side was provided from a pack of pressurised
gas tanks. The fuel gas flow rates were regulatedwith electronic thermal mass flow controllers. Both
the anode and cathode fuel gases were humidified by
forcing the gas through a gas–liquid equilibrium
stage. In order to maintain uniform cell and
humidifiers temperatures, three heaters driven with a
National Instruments Field Point controller were
used. The temperatures of the cell, the anode and of
the cathode humidifiers were measured through threethermocouples. Furthermore, two thermocouples
were also located near the gas inlet lines. Theelectric load bank was a semiconductor device that
allows high currents to be drawn at low voltages.
The load was air-cooled and rated at 2000W. A
digital AC milliohm meter was placed in parallel both
to the electric load and the fuel cell. This device
provided a quick and accurate measurement of the
total impedance magnitude of the cell and the load at
a specific frequency. The ohmic resistance of the cellcan be extracted after correction of the impedance of
the load. During the fuel cell operation, the wet
gases were fed to the fuel cell and then diffused to the
MEA through the gas diffusion layers (GDLs) whilecirculating in the gas channel. The un-reacted gases
and the water produced during the electrochemical
reactions were released from the fuel cell. The
exhausted gases pass through the backpressureregulators and then exit through the vent. A personal
computer running Windows XP2000 and a Scada-
based software with a variety control, data logging

8/3/2019 Sensitivity Analysis of a 500 W Proton Exchange Membrane Fuel Cell Stack by Design of Experiments
http://slidepdf.com/reader/full/sensitivity-analysis-of-a-500-w-proton-exchange-membrane-fuel-cell-stack-by 3/9
and displaying features were employed for the
experimental monitoring and controlling.
Table 2 Measurement ranges and accuracy of
measurement devices of test facility
Measurementdevices(Make:K-Pas
Instronic Engineers)
Measurement range and
accuracy
Power station
electronic load
Input:230v, AC50Hz Voltage:
0-100ADC
Capacity:2000Watts Features:
3 ½ Digital meter for volts-
19.99volts 4
½ Digital meter for Amps-
19.999 Amps
Flow measuring
device (Mass flowcontroller)
Control range: 2–100% of full
scaleAccuracy: 1 % of full scale
PID controller Temperature controller withsensors
Range:0-1000C
Operating voltage: 230v AC
Type of thermocouple : J Type
Figure 1 Diagram of Experimental Apparatus for the
PEMFC Testing
Figure 2 Experimental setup of fuel cell test station
Range of parameters studied in the experiments:
In this study considered the effect of four variables,
pressures of the fuel (H2), pressure of oxygen (O2),
flow rate of the fuel and flow rate of the oxidant.
These variables are studied an objective to select the
optimized conditions for fuel cell operation. For each
variable experiment were conducted at lower and
Factors
Levels
Low High
A : hydrogen pressure (bar) 1.7 2.15
B: oxygen pressure (bar) 2.15 2.78
C: hydrogen flow rate(lpm) 0.88 1.81
D: oxygen flow rate (lpm) 0.95 1.91
8/3/2019 Sensitivity Analysis of a 500 W Proton Exchange Membrane Fuel Cell Stack by Design of Experiments
http://slidepdf.com/reader/full/sensitivity-analysis-of-a-500-w-proton-exchange-membrane-fuel-cell-stack-by 4/9
higher levels (two levels). A full factorial design
required 2n experiments, where 2 is the level of the
variable and n is the number of variables considered,
leads to 16 experiments and the fractional factorial
experiments, 24-1, leading to 8 experiments. Therange of parameters is listed in Table 3.
Table 3 The range of parameters studied in theexperiment
2.2. Experimental procedure:
The 500 W Proton Exchange membraneFuel cell stack was connected to the power station
and the gas connections were given to the stack. Test
station was turned on and gas lines were opened.
Before starting the process Fuel cell was purged with
Nitrogen gas to remove any impurities in the stack.
Initially from the literature and by conducting the
preliminary tests the variable levels were found as,
the fuel (H2) pressure range 1.70–2.15 bar, oxidant(O2) in the pressure range 2.15 – 2.78 bar, the fuel
(H2) flow rate is ranging from 0.88 to 1.81 lpm and
flow rate of oxidant (O2) ranging from 0.95 to 1.91
lpm. These four factors were considered at two
levels i.e... Low level and high level, like wise 16
experiments were conducted and temperature of stack
was maintained at 300c. After continuous operation
of stack by supplying fuel and oxidant at givenlevels, open circuit voltage (OCV) was reached to 18
volts without load for about 1 hr. When we draw the
load as a current mode by step by step for given
current set point for the given ranges of flow rates
and pressures of fuel and oxidant. It was observedthat, when current increases the voltage decrease
proportionally and increase the power. To maintain
the temperature at 300C heat was removed by water
circulation system showed in figure 2. When it
reached the minimum voltage 10 volts, it was trip off and the load was off. Like wise 16 experiments were
carried out to maximize the performance of fuel cell
stack. Experimental data was analyzed by using
design of experiment technique - full factorial design
and fractional factorial design methods.
2.3 Design of Experiments.
The design of Experiments (DOE) method
has been adapted to achieve the objectives by setting
the limits for the pressure and flow rate for the
reactants. The influence of these parameters on the
fuel cell is critical. For the method of factorial design
the experiments were conducted for four variables at
two different levels. The four factors are fuel
pressure, fuel flow rate, oxidant pressure, and oxidantflow rate. The DOE experiments were conducted for
the fuel (H2) pressure range 1.70–2.15 bar, oxidant
(O2) pressure range 2.15 – 2.78 bar, the fuel (H2) flow
rate range from 0.88 to 1.81 lpm and flow rate of
oxidant (O2) range from 0.95 to 1.91 lpm. The
observations were made at all the combinations of 24
experiments that can be formed for different levels of
the factors, called treatment combinations. Thefactors that were set at the low level, indicated as
(−1) and those at the high level as (+1). The
particular combination of treatments was made using
the Yates notation. In the fractional factorial method,
the number of observations was reduced to 24−1
(eight) treatment combinations. The response of theobservations was power (watts) with factors such as
reactant pressure and flow rate at two different levels.
3. RESULTS AND DISCUSSIONS
The fuel cell stack of 500 W capacities was
presented with humidified reactants (hydrogen and
Oxygen) at the open circuit potential for about 1 hr.
The stack was operating when the stack was reached
the open circuit voltage as 18 volts. Load was turnedon with increase of current step by step for 30mts and
subsequently voltage was decreased with increasing
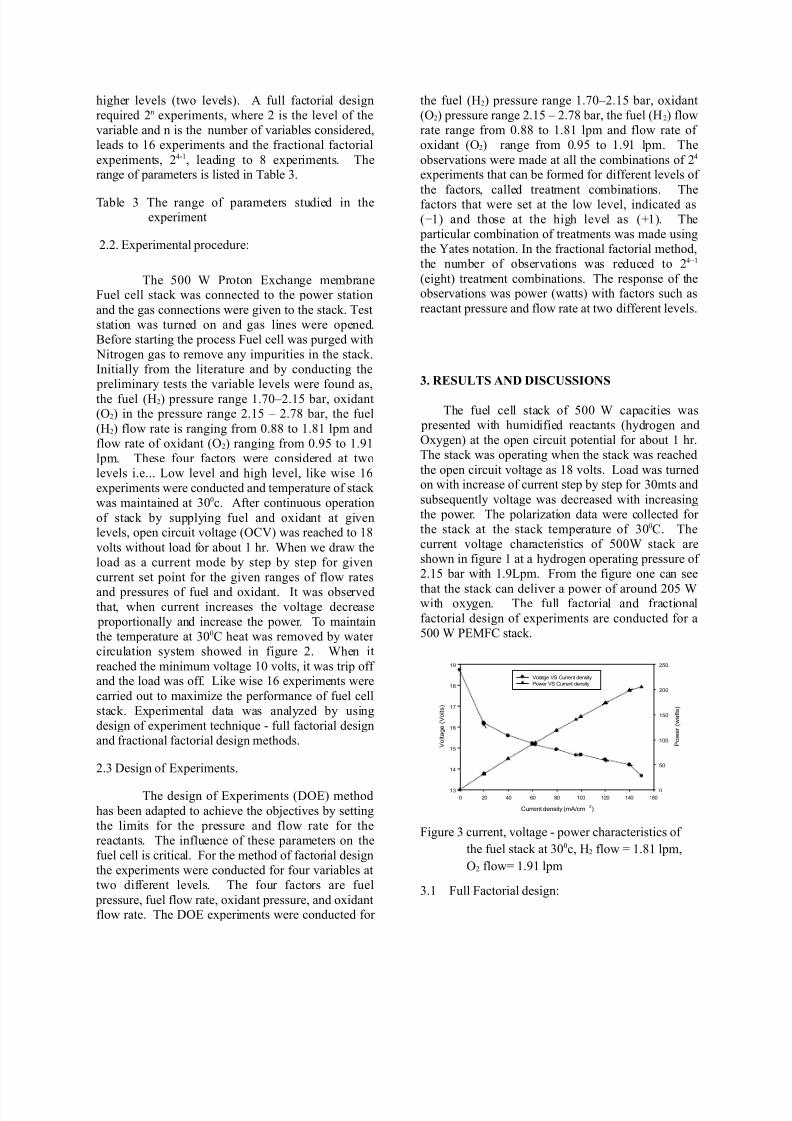
the power. The polarization data were collected for
the stack at the stack temperature of 300C. The
current voltage characteristics of 500W stack are
shown in figure 1 at a hydrogen operating pressure of
2.15 bar with 1.9Lpm. From the figure one can see
that the stack can deliver a power of around 205 Wwith oxygen. The full factorial and fractional
factorial design of experiments are conducted for a
500 W PEMFC stack.
Current density (mA/cm2)
0 20 40 60 80 100 120 140 160
V o l t a g e ( V o l t s )
13
14
15
16
17
18
19
P o w e r ( w a t t s )
0
50
100
150
200
250
Volatge VS Current density
Power VS Current density
Figure 3 current, voltage - power characteristics of
the fuel stack at 300c, H2 flow = 1.81 lpm,
O2 flow= 1.91 lpm
3.1 Full Factorial design:

8/3/2019 Sensitivity Analysis of a 500 W Proton Exchange Membrane Fuel Cell Stack by Design of Experiments
http://slidepdf.com/reader/full/sensitivity-analysis-of-a-500-w-proton-exchange-membrane-fuel-cell-stack-by 5/9
For the Design of experiments (DOE), the
response considered here is the fuel cell power output
as a function of pressure and flow rates of reactants
(Hydrogen and Oxygen). Four types of control
factors namely, the pressure of the Hydrogen, the pressure of the oxygen, the flow rate of the Hydrogen
and the flow rate of the oxygen are considered toselect the optimized conditions for fuel cell operation
as given in table 3.
The levels and factors were chosen by taking into
account the limits of the fuel cell stack and also the
test bench. However, the linearities for these factors
and levels are considered in the specified range. Thefull factorial design for the four factors with various
treatment combinations is shown in table 4.
The Analysis Of Variance (ANOVA) is a commonly
used tool to study and estimate the factor that
influence the process. Initially, ANOVA is performed
for the main effects, pressure of the Hydrogen (A),
pressure of the oxygen (B), flow rate of the Hydrogen
(C) and the flow rate of the oxygen (D). Thenanalysed for interaction effects of two factors like
AB, AC, AD, BC, BD, CD, interaction effects of three factors, ABC, BCD, CDA, DAB and interaction
effects of four factors, ABCD and analysis results are
summed in table 5.
Table 4. Full Factorial design format for four factors
The main eight effects of the four factorsare shown in figure 4 for comparison
called graph of the average effects.
H2 pressure (A)
-1.5 -1.0 -0.5 0.0 0.5 1.0 1.5
M e a n o f P o w e r ( W )
100
120
140
160
180
200
220
O2
Pressure (B)
-1.5 -1.0 -0.5 0.0 0.5 1.0 1.5
M e a n O f t h e P o w e r ( W )
100
120
140
160
180
200
220
H2
Flow (C)
-1.5 -1.0 -0.5 0.0 0.5 1.0 1.5
M e a n o f P o w e r ( W )
100
120
140
160
180
200
220
O2 Flow (D)
-1.5 -1.0 -0.5 0.0 0.5 1.0 1.5
M e a n o f P o w e r ( W )
100
120
140
160
180
200
220
Figure 4 Influence of Four Factors on Power(Y)
Table 5 Analysis of variance for power including
main and interaction effects for 24experiments
The four graphs represent the maximum power
obtained from the 16 experiments as well as the
average of these 16Y values and the average of the
stack power, when the x factor is at two levels,
namely, low and high. From these graphs we can
observe that the factor with a greater slope is the
most significant factor for getting maximum power .
S.NO.Hydrogen
Pressure (A)
Oxyge Pressure
(B)
Hydrogen
Flow rate (C)
oxygen Flow
rate (D)
1 1.7 2.15 0.88 0.95
2 2.15 2.15 0.88 0.95
3 1.7 2.78 0.88 0.95
4 2.15 2.78 0.88 0.95
5 1.7 2.15 1.81 0.95
6 2.15 2.15 1.81 0.95
7 1.7 2.78 1.81 0.95
8 2.15 2.78 1.81 0.95
9 1.7 2.15 0.88 1.91
10 2.15 2.15 0.88 1.91
11 1.7 2.78 0.88 1.91
12 2.15 2.78 0.88 1.91
13 1.7 2.15 1.81 1.91
14 2.15 2.15 1.81 1.91
15 1.7 2.78 1.81 1.91
16 2.15 2.78 1.81 1.91
Source Effect
Sum of
squares
%
contribution
Degrees
of
Freedom
Mean
Square F p
A
-
11.375517.5625 2.155707 1 517.56252.853746 0.152
B -2.625 27.5625 0.114801 1 27.5625 0.151975 0.712
C 64.12516448.06 68.50807 1 16448.0690.69164 0
D 14.875 885.0625 3.686387 1 885.0625 4.880074 0.078
AB -0.375 0.5625 0.002343 1 0.5625 0.003102 0.958
AC
-
13.625742.5625 3.092858 1 742.56254.094355 0.098
AD 14.625855.5625 3.563516 1 855.56254.7174170.0819
BC -2.875 33.0625 0.137709 1 33.0625 0.182301 0.687
BD 0.375 0.5625 0.002343 1 0.5625 0.003102 0.958
CD 13.625742.5625 3.092858 1 742.56254.094355 0.098
Error 906.8125 5 181.3625

8/3/2019 Sensitivity Analysis of a 500 W Proton Exchange Membrane Fuel Cell Stack by Design of Experiments
http://slidepdf.com/reader/full/sensitivity-analysis-of-a-500-w-proton-exchange-membrane-fuel-cell-stack-by 6/9
It can be seen from the graphs that the slope of factor
C, which is Hydrogen flow, is higher compared to all
other factors and hence it is very significant on the
cell performance. The most insignificant factor in
this set of experiments is the oxygen pressure (B), asthe graph is almost parallel to X axis. The
contribution from each factor can be obtained fromthe ANOVA table as shown in table 5 representing
the source of variability, degrees of freedom
associated with each factor, sum of squares, and
mean squares due to each factor.
Fisher statistics shows the ratio of meansquares with the factor and the p value for the Fisher
statistics. The p value determines whether the factor
is statistically significant or not. Generally, the mean
values are significant if the p value is less than 0.05.
From the table 5 we can see that the C factor
contribution is more around 68% and the next
contributor is Oxygen flow rate (D) factor, which is
around 4%. From the p value one can also find thatthe C factor is statistically significant, as it is less
than 0.05. The model equation can be written asequation (3.1) shows the fitted parameters for the
analysis of mean interactions. Hence the first order
interactions effects were also considered and are
tabulated in table 5.
The average two factor interactive effects are shown
in figure 5. It is observed that the interactive effects
of Hydrogen pressure - Hydrogen flow (AC),
Hydrogen pressure - oxygen flow (AD) and hydrogenflow - oxygen flow (CD) are significant compared to
the other two factor interactive effects, AB, BC and
BD.AB interaction
A
-1 .5 -1.0 -0.5 0.0 0.5 1.0 1.5
p o w e r ( W )
100
120
140
160
180
200
220
B -
B +
A C in t e rac t ion
A
-1.5 -1.0 -0.5 0.0 0.5 1 .0 1.5
p o w e r , ( W )
100
120
140
160
180
200
220
C -
C+
AD In teract ion
A
-1 .5 -1 .0 -0 .5 0.0 0.5 1 .0 1 .5
P o w e r ( W )
100
120
140
160
180
200
220
D -
D +
BC in te ract ion
B
-1.5 -1 .0 -0 .5 0 .0 0 .5 1.0 1 .5
p o w e r ( W )
10 0
12 0
14 0
16 0
18 0
20 0
22 0
C -
C +
BD Interaction
B
-1.5 -1.0 -0.5 0.0 0.5 1.0 1.5
p o w e r ( W )
100
120
140
160
180
200
220
D -
D +
C D In te ra ct ion
C
-1 .5 -1 .0 -0 .5 0 .0 0 .5 1 .0 1 .5
p o w e r ( W )
100
120
140
160
180
200
220
D -
D +
Figure 5 Interaction effects of four factors at two
levels on the fuel cell stack Performance.
Figure 6 (a) and 6 (b) shows the normal
probability plots of the data collected i.e. effect and
for residual respectively, considering both the mainand interaction effects. It can be inferred from the
above figures that the data follow the normaldistribution and the interaction effects in the residual
plots are random.
Effect
-20 0 20 40 60 80
N o r m a l % p r o b a b i l i t y
0.001
0.01
0.050.10.20.5
12
5
10
2030
50
70
80
90
95
9899
99.899.9
99.95
99.99
99.999
AC
ABC
B ABC
ABCD
AB
ABDBD
BCD
CD
ADD
ACD
C
(a)
Residual
-40 -30 -20 -10 0 10 20 30
N o r m a l % p r o b a b i l i t y
1
2
5
10
20
30
50
70
80
90
95
98
99
(b)
Figure 6(a) Normal probability plot of the effects of the 24
Factorial, 6 (b) Normal probability plot of Residuals
From table 6 it can be observed that theaverage three factor interactive effect of Hydrogen
pressure - Hydrogen flow - oxygen flow (ACD) is
contribute 3.686 % and the remaining three factor
interactive effects, ABC, ABD and BCD contribute
less than 0.1%. Hence ACD effect will be significant

8/3/2019 Sensitivity Analysis of a 500 W Proton Exchange Membrane Fuel Cell Stack by Design of Experiments
http://slidepdf.com/reader/full/sensitivity-analysis-of-a-500-w-proton-exchange-membrane-fuel-cell-stack-by 7/9
compared to the remaining factors. The four factor
interactive effect of Hydrogen pressure – oxygen
pressure - Hydrogen flow - oxygen flow (ABCD) is
contributed 0.006508 %. Hence its effect is
insignificant.
Hence it can be concluded that the effect of C and D are significant compared to A and B.
The ANOVA is also carried out by using
MINITAB statistical software. The data developed
from this MINITAB statistical software was
presented in the figures 7, 8 and 9.
The data collected for the fuel cell power
response followed the normal distribution
as shown in figure 7 (a) and the graphical
summary shown in figure 7 (b). The box
plot shows the pattern of variation in the
experimental data and also shows thatthere are no outliers or extreme values or
unusual observation.
Table 6 Analysis of variance data for the factors A, C
and D
25020015010050
99
95
90
80
70
60
50
40
30
20
10
5
1
power (watts)
P e r c e n t
Mean 152. 4
StDev 37.56
N 16
AD 1.834
P-Value <0.005
Normal
Probability Plot of power
210200190180170160150140130120
power (watts)
Boxplot of power
Figure 7 (a) Probability plot of the fuel cell power (b) Box plot of the experimental data.
40200-20-40
99
90
50
10
1
Residual
P e r c e n t
200175150125100
20
0
-20
-40
Fitted Value
R e s i d u a l
20100-10-20-30
6.0
4.5
3.0
1.5
0.0
Residual
F r e q u e n c y
16151413121110987654321
20
0
-20
-40
Observation Order
R e s i d u a l
Normal Probability Plot of residuals residual versus Fitted values
Histogram of residuals residual Versus Order of the data
Residual Plots for power
Figure 8 Residual plots of the main and interaction
effects of a 500W stack
Figure 8 shows the residual, histogram, and
probability plots of the data collected, considering
both the main and interaction effects. It can be
inferred from the figure that the data follow the
normal distribution and the interaction effects in the
residual plots are random. The graph effects using
the ANOVA general linear model also show that the
factors C and D are significant compared to A and B,
as shown in Figure 9.
Source
Sum Of
Squares
%
Contributio
n
Degree
s Of
Freedo
m
Mean
Square F P
A 517.5625 2.155707 1 517.5625 49.58683 0.000108
C 16448.06 68.50807 1 16448.06 1575.862 0
D 885.0625 3.686387 1 885.0625 84.79641 0.000016
AC 742.5625 3.092858 1 742.5625 71.14371 0.00003
AD 855.5625 3.563516 1 855.5625 81.97006 0.000018
CD 742.5625 3.092858 1 742.5625 71.14371 0.00003
ACD 885.0625 3.686387 1 885.0625 84.79641 0.000016
ERROR 83.5 8 10.4375

8/3/2019 Sensitivity Analysis of a 500 W Proton Exchange Membrane Fuel Cell Stack by Design of Experiments
http://slidepdf.com/reader/full/sensitivity-analysis-of-a-500-w-proton-exchange-membrane-fuel-cell-stack-by 8/9
.
1-1
180
165
150
135
120
1-1
1-1
180
165
150
135
120
1-1
A
M e a n
B
C D
Main Effects Plot for powerData Means
1-1 1-1 1-1
200
160
120200
160
120
200
160
120
A
B
C
D
-1
1
A
-1
1
B
-1
1
C
Interaction Plot for powerData Means
.Figure 9 Main and interaction effects of the four
factors at two levels on the fuel cell stack
performance
The model equation can be written after
inclusion of interaction effects as
)( X*)( X*( A D / 2 )
+)( X*( D / 2 )+)( X*( C / 2 )+)( X*( A / 2 )+5 2 . 4 3 7 51
41
431
^
=Y
Here estimated power is calculated from the model
using three significant terms A, C and D. X1, X3 and
X4 are levels of the factors A, C and D corresponding
to experiments.
This model accounts for 99.6% variation
and also one can see that the main interaction
contributor arises from the C and D factors, which
are Flow rate of the Hydrogen and the flow rate of
oxygen.
Present experimental data of voltage current
characteristics is compared with the experimental
data of K.S.Dathatreyan et al. [19] and is shown in
Figure 10. It shows the good agreement with the data
of K.S.Dathatreyan et al. for the fuel cell stack with
electrode area of 100 cm2 with 9 cell stack.
current density, mA/cm2
0 20 40 60 80 100 120 140 160
s
t a c k p o t e n t i a l , V o l t s
4
6
8
10
12
14
16
18
20
ExperimentalElectrode Area - 100cm
2
stack size=20cells
K.S. Dhathathreyan et al.
Electrode Area - 100cm2
Figure 10 Comparison of voltage current
Characteristics of experimental data with
K.S.Dhatatreyan et al .
4. Conclusions
The Design of experiment methodology with its
statistical techniques is then well-suited to analyse
the tests conducted on Fuel cells. Indeed, the DOEmethodology offers a wide range of practical tools,
graphical representations and techniques that can be
suitable mediums for FC experimenters and
developers. The DOE approach leads to simple and
precise models which highlight the impacts of the
factors on the response and detect possible
interactions between parameters. Factorial method
has been applied to the 500W PEMFC stack for
statistical sensitivity analysis. The conditions for operating the stack with respect to pressure and flow
rate of the reactants were identified by design of
experiments method. The effects of interactions
among the various factors at two different levels werealso identified along with the major contributor by
sensitivity analysis by statistical methods. From the
experiments and statistical analysis method, it has
been observed that Hydrogen flow plays a major rolefor getting the maximum performance from the fuel
cell stack and this has got a physical significance in
terms of water removal and un reacted nitrogen
blanket removal from the reaction site. In the
fractional factorial experiments the number of
experiments was reduced, also showed the same
results revealing that fractional factorial experiments
can be applied for getting the major contributor
among the various variables for fuel cell stack performance with respect to obtaining maximum
power. It is also observed that the number of
experiments can be reduced to evaluate the
robustness of the stack with respect to operating
conditions, thereby saving time and materials. It is
also observed that the experimental design
methodology is a suitable tool for the improvement
of fuel cell systems.

8/3/2019 Sensitivity Analysis of a 500 W Proton Exchange Membrane Fuel Cell Stack by Design of Experiments
http://slidepdf.com/reader/full/sensitivity-analysis-of-a-500-w-proton-exchange-membrane-fuel-cell-stack-by 9/9
References
1. Larmine, J., and Dicks, A., Fuel Cell Systems
Explained , Wiley, New York (2000).
2. Frano Barbir, PEM Fuel Cells: Theory and Practice,
Elsevier Academic Press, New York (2005).
3. Haolin Tang , Shenlong Wang , San Ping Jiang, Mu
Pana, , “ A comparative study of CCM and hot-pressed MEAs for PEM fuel cells”, Journal of Power Sources,vol. 170, pp. 140–144 (2007).
4. Scholta, J., Berg, N., Wilde, P., and Jorissen, L.,
“Development and Performance of a 10 kW PEMFC
Stack,” J. Power Sources, 127, pp. 206–212 (2004).
5. Bendell, A., Disney, J., and Pridmore, W. A., Taguchi
Methods, Applications in World Industry, IFS, Bedbord,
UK (1989).
6. Esue, R., Tamaki, H., and Yano, H., “Centrifugal
Compressor Design Using Simulation Method-Analysis
by Purposire Functions,” J. Qual. Eng. Forum, 14(2), pp. 80–87 (2006).
7. Fujimoto, R., “Application of Taguchi’s Methods to
Aero-Engine Engineering Development,” IHI Eng.Rev., 36(3), pp. 168–172 (2003).
8. Parkinson, A., “Robust Mechanical Design Using
Engineering Models,” ASME J. Mech. Des., 117, pp.
48–54 (1995).
9. Montgomerry, D., Design and Analysis of Experiments,
Wiley, New York (1983).
10.Zivorad R. Lazic, “Design of Experiments in Chemical
Engineering”, WILEY-VCH, Weinheim (2004).
11.Rahman, S. U., Al. Saleh, M. A., and Al-Zakari, A. S.,
“Parametric Study of the Preparation of Gas Diffusion
Electrodes for Alkaline Fuel Cells by a Filtration
Method,” J. Power Sources, 72, pp. 71–76 (1998).
12.Shigyo, K., and Nishiguchi, H., “Development of
Catalyst and Gas Diffusing MEA Layers for PEFCUsing Taguchi’s Method,” ECS Trans., 3, pp. 337–345
(2006).
13. Rajalakshmi, N., Velayutham, G. and Dhathathreyan,
K. S., “Sensitivity Analysis of a 2.5 kW Proton
Exchange Membrane Fuel Cell Stack by StatisticalMethod,” Journal of Fuel Cell Science and
Technology, Vol. 6 (2009).
14. Wahdame, B., Candusso, D., and Kauffmann, J. M.,
“Study of Gas Pressure and Flow Rate Influences on a
500 W PEM Fuel Cell, Thanks to the Experimental
Design Methodology,” J. Power Sources, 156, pp. 92–
99 (2006).
15. Grujicic, M., Zhao, C. L., Chittajallu, K. M., and
Ochterbeck, J. M., “Cathode and Interdigitated Air
Distributor Geometry Optimization in Polymer
Electrolyte Membrane Fuel Cells,” Mater. Sci. Eng., B,108, pp. 241–252 (2004).
16. Vlahinos, A., Kelly, K., D’Aleo, J., and Stathopoulos,
J., “Effect of Material and Manufacturing Variations on
Membrane Electrode Assembly Pressure Distribution,”
Proceedings of the First International Conference on Fuel Cell Science Engineering and Technology, New
York, April (2003).
17. Torchio, M. F., Santarelli, M. G., and Nicali, A.,
“Experimental Analysis of the CHP Performance of a
PEMFC Stack by a 24 Factorial Design,” J. Power
Sources, 149, pp. 33–43 (2005).
18. Guvelioglu, G. H., and Stenger, H. G., “Main and
Interaction Effects of PEM Fuel Cell Design
Parameters,” J. Power Sources, 156, pp. 424–433
(2006).
19.Dhathathreyan. K.S. Sridhar. P, Sasikumar. G,.Ghosh.
K.K, Velayutham. G, Rajalakshmi. N, Subramaniam.
C.K., Raja. M.and Ramya. K, “Development of
polymer electrolyte membrane fuel cell stack”,International Journal of Hydrogen Energy, Vol.24,
pp.1107-1115 (1999).