Embed Size (px)
Citation preview
Application Note
Food Testing & Agriculture
AuthorsAnastasia A. Andrianova and Jessica L. Westland Agilent Technologies, Inc. Wilmington, DE, USA
Melissa Churley Agilent Technologies, Inc. Santa Clara, CA, USA
AbstractAt the present time, many U.S. state-regulated pesticide lists for cannabis can be analyzed exclusively by LC/MS/MS. Notable exceptions include California, Florida, and Nevada, where GC/MS/MS is also required. The number of states requiring GC/MS is expected to grow as more compounds and lower detection limits are required.
Quantifying pesticides at low levels in cannabis is possible with the Agilent standardized sample preparation procedure for cannabis combined with Agilent's 8890 GC System and 7010B Triple Quadrupole Mass Spectrometer. The Agilent MassHunter Pesticide and Environmental Pollutant MRM Database includes information on pesticides from the California target list, and retention time locking enables simple and rapid system setup. At the same time, longer column life and less frequent source cleaning can be achieved with midcolumn backflushing.
Using this approach, 43 GC-amenable pesticides regulated by the Bureau of Cannabis Control in California met the established limits of quantitation (LOQs) with LOQs for 36 pesticides at ≤0.08 ppb in-vial (≤10 ppb in dried cannabis plant material, assuming 100 % pesticide recovery), and all 43 pesticides at LOQs ≤0.8 ppb in-vial (≤100 ppb in cannabis plant material).
Sensitive and Robust Detection of Pesticides Regulated in California in Dried Cannabis Plant Material

2
IntroductionBy the end of 2018, the recreational use of cannabis became legal in nine states and Washington, DC in the U.S., and in all provinces in Canada. The global movement for cannabis legalization drives the demand for cannabis analytical testing methods for the detection of pesticide residues. Licensed retailers are required to have the cannabis goods analyzed for regulatory compliance testing. In the U.S., cannabis regulations vary from state to state, with California currently having the largest target list of pesticides tested in recreational cannabis1. The Canadian target list mandated by Health Canada generally exhibits lower required LOQs than any U.S. state2. The described methodology for pesticide residues in cannabis addresses the analytical challenge with a defined sample preparation procedure and state-of-the-art GC and LC triple quadrupole mass spectrometry3.
The analysis of pesticides in cannabis is challenging due to high concentrations (percentage by weight) of endogenous chemicals such as cannabinoids and terpenes that interfere even with MS/MS processes. High-boiling matrix that elutes after the analytes requires extended bakeout times to prevent carryover and ghost peaks in subsequent runs. The highest boiling contaminants can deposit in the head of the column, requiring more frequent column trimming and adjustment of MRM and data analysis time windows due to retention time shifting. Following the Agilent recommended sample preparation procedure, the use of midcolumn backflush and retention time locking (RTL), quantifying pesticides at state-regulated limits is easily achieved.
This Application Note focuses on the triple quadrupole GC/MS analysis of GC-amenable pesticides regulated by the
California Bureau of Cannabis Control, highlighting the pesticides that are commonly found to present a challenge for LC/MS analysis: for example, captan, chlordane, and pentachloronitrobenzene. The California LOQs were successfully met for 43 pesticides. The rest of the pesticides regulated in California are analyzed at the action level by LC/MS, as reported elsewhere3.
ExperimentalThe Agilent system was configured to achieve the highest sensitivity, and minimize potential problems with pesticide analysis in high-matrix cannabis samples. Most importantly:
• High-efficiency source (HES)delivers confident trace analysis for ultratrace level applications by creating of up to 20x more ions.
• Midcolumn backflushing was used after the MS data were collected, the oven was held at the final temperature in post run mode, and the carrier gas flow through the first column was reversed. This reversed flow carried any high boilers that were in the column at the end of data collection out of the head of the column and into the split vent trap. The capability to reverse the flow is provided by the Agilent purged ultimate union (PUU). The PUU is a tee that is inserted, in this case, between two identical 15 m columns. During the analysis, a small makeup flow of carrier gas from Agilent's 8890 GC Pneumatic Switching Device (PSD) module is used to sweep the connection. During backflushing, the makeup flow from the PSD is raised to a much higher value, sweeping high boilers backwards out of the first column and forwards from the second. For this configuration, the backflushing time was 1.3 minutes.
• Pulsed splitless injection maximizes the transfer of analytes from the inlet onto the GC column. A pulsing pressure of 50 psi allowed for an injection volume of 3 µL of ACN, thus enabling lower limits of detection (LODs) in cannabis samples.
• The PSD is an Agilent 8890 GC pneumatics module optimized for backflushing applications. At high pressures during backflushing, the fixed restrictor can have hundreds of mL/min of wasted flow. The PSD will stay at the user-defined setpoint (default 3 mL/min) even at high pressures, which significantly reduces the required gas flow. Also, when the PSD is present in a midcolumn backflush configuration, the setup for pulsed splitless mode is simplified as the column flow for both column 1 and column 2 will be increased respectively during the pulse.
• The Agilent MassHunter Pesticide and Environmental Pollutant MRM Database includes up to eight MRM transitions per analyte, allowing users to simplify building acquisition methods for pesticide analysis. The database includes retention times for retention time-locked methods.
• Dynamic MRM mode creates a capability to tackle large multi-analyte assays and to accurately quantitate narrow peaks by an automated and most-efficient dwell time distribution.
• Retention time locking allows a new column or instrument to have retention times that match the MRM database or an existing method. This simplifies method maintenance and system setup.

3
• The Agilent MassHunter Optimizer for GC/TQ enables an automated optimization of MRM transitions, including precursor and product ion choice, and collision energy optimization. The Optimizer was used to optimize the MRM transitions for kinoprene, a pesticide from the Canadian target list.
Figure 1 shows the system configuration used for this application.
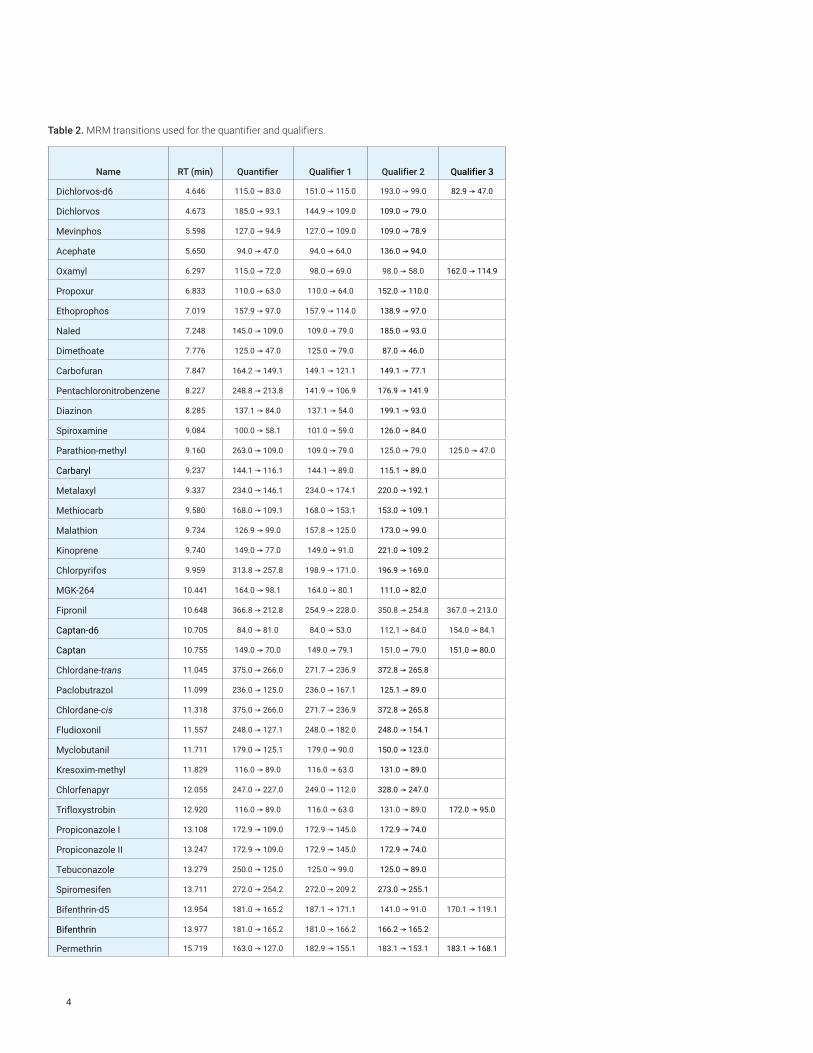
Tables 1 and 2 list the instrument operating parameters. MRM transitions for all pesticides, except for kinoprene and the deuterated internal standards, were provided by the MassHunter Pesticide and Environmental Pollutant MRM Database.
Figure 1. System configuration.
Agilent's 8890 GC System
Liquidinjector
Multimodeinlet (helium)
Agilent's 7010B Triple Quadrupole GC/MS
EI high efficiency
source (HES) 15 m
HP-5ms UI
15 m
HP-5ms UI
PSD(Helium)
Table 1. GC and MS conditions for the pesticide analysis.
Agilent's 8890 GC System with fast oven, autoinjector, and tray
Inlet Multimode inlet (MMI)
Mode Pulsed splitless
Injection Pulse Pressure 50 psi for 0.75 minutes
Purge Flow To Split Vent 50 mL/min at 0.7 minutes
Septum Purge Flow Mode Switched
Injection Volume 3.0 µL
Injection Type Reversed two-layer sandwich
L1 Airgap 0.2 µL
L2 Injection Volume 0.4 µL
L2 Airgap 0.2 µL
Inlet Temperature 280 °C
Carrier Gas Helium
Inlet Liner Agilent 4 mm single taper, with glass wool (p/n 5190-2293)
Oven
Initial Oven Temperature 60 °C
Initial Oven Hold 1 minute
Ramp Rate 1 40 °C/min
Final Temperature 1 170 °C
Final Hold 1 0 minutes
Ramp Rate 2 10 °C/min
Final Temperature 2 310 °C
Final Hold 2 3 minutes
Total Run Time 20.75 minutes
Post Run Time 1.3 minutes
Equilibration Time 0.5 minutes
Column 1 HP-5MS UI, 15 m × 0.25 mm, 0.25 µm (p/n 19091S-431UI)
Control Mode Constant flow
Flow 1.091 mL/min
Inlet Connection MMI
Outlet Connection PSD (PUU)
Post Run Flow (Backflushing) –12.906 mL/min
Column 2 HP-5MS UI, 15 m × 0.25 mm, 0.25 µm (p/n 19091S-431UI)
Control Mode Constant flow
Flow 1.291 mL/min
Inlet Connection PSD (PUU)
Outlet Connection MSD
Post Run Flow (Backflushing) 13.429 mL/min
MS
Model Agilent's 7010B Triple Quadrupole GC/MS
Source High-efficiency source
Vacuum Pump Performance Turbo
Tune File Atunes.eihs.tune.xml
Mode dMRM
Solvent Delay 3 minutes
EM Voltage Gain Mode 10
Quadrupole Temperature (MS1 and MS2)
150 °C
Source Temperature 280 °C
Transfer Lne Temperature 280 °C
He Quench Gas 2.25 mL/min
N2 Collision Gas 1.5 mL/min
4
Table 2. MRM transitions used for the quantifier and qualifiers.
Name RT (min) Quantifier Qualifier 1 Qualifier 2 Qualifier 3
Dichlorvos-d6 4.646 115.0 & 83.0 151.0 & 115.0 193.0 & 99.0 82.9 & 47.0
Dichlorvos 4.673 185.0 & 93.1 144.9 & 109.0 109.0 & 79.0
Mevinphos 5.598 127.0 & 94.9 127.0 & 109.0 109.0 & 78.9
Acephate 5.650 94.0 & 47.0 94.0 & 64.0 136.0 & 94.0
Oxamyl 6.297 115.0 & 72.0 98.0 & 69.0 98.0 & 58.0 162.0 & 114.9
Propoxur 6.833 110.0 & 63.0 110.0 & 64.0 152.0 & 110.0
Ethoprophos 7.019 157.9 & 97.0 157.9 & 114.0 138.9 & 97.0
Naled 7.248 145.0 & 109.0 109.0 & 79.0 185.0 & 93.0
Dimethoate 7.776 125.0 & 47.0 125.0 & 79.0 87.0 & 46.0
Carbofuran 7.847 164.2 & 149.1 149.1 & 121.1 149.1 & 77.1
Pentachloronitrobenzene 8.227 248.8 & 213.8 141.9 & 106.9 176.9 & 141.9
Diazinon 8.285 137.1 & 84.0 137.1 & 54.0 199.1 & 93.0
Spiroxamine 9.084 100.0 & 58.1 101.0 & 59.0 126.0 & 84.0
Parathion-methyl 9.160 263.0 & 109.0 109.0 & 79.0 125.0 & 79.0 125.0 & 47.0
Carbaryl 9.237 144.1 & 116.1 144.1 & 89.0 115.1 & 89.0
Metalaxyl 9.337 234.0 & 146.1 234.0 & 174.1 220.0 & 192.1
Methiocarb 9.580 168.0 & 109.1 168.0 & 153.1 153.0 & 109.1
Malathion 9.734 126.9 & 99.0 157.8 & 125.0 173.0 & 99.0
Kinoprene 9.740 149.0 & 77.0 149.0 & 91.0 221.0 & 109.2
Chlorpyrifos 9.959 313.8 & 257.8 198.9 & 171.0 196.9 & 169.0
MGK-264 10.441 164.0 & 98.1 164.0 & 80.1 111.0 & 82.0
Fipronil 10.648 366.8 & 212.8 254.9 & 228.0 350.8 & 254.8 367.0 & 213.0
Captan-d6 10.705 84.0 & 81.0 84.0 & 53.0 112.1 & 84.0 154.0 & 84.1
Captan 10.755 149.0 & 70.0 149.0 & 79.1 151.0 & 79.0 151.0 & 80.0
Chlordane-trans 11.045 375.0 & 266.0 271.7 & 236.9 372.8 & 265.8
Paclobutrazol 11.099 236.0 & 125.0 236.0 & 167.1 125.1 & 89.0
Chlordane-cis 11.318 375.0 & 266.0 271.7 & 236.9 372.8 & 265.8
Fludioxonil 11.557 248.0 & 127.1 248.0 & 182.0 248.0 & 154.1
Myclobutanil 11.711 179.0 & 125.1 179.0 & 90.0 150.0 & 123.0
Kresoxim-methyl 11.829 116.0 & 89.0 116.0 & 63.0 131.0 & 89.0
Chlorfenapyr 12.055 247.0 & 227.0 249.0 & 112.0 328.0 & 247.0
Trifloxystrobin 12.920 116.0 & 89.0 116.0 & 63.0 131.0 & 89.0 172.0 & 95.0
Propiconazole I 13.108 172.9 & 109.0 172.9 & 145.0 172.9 & 74.0
Propiconazole II 13.247 172.9 & 109.0 172.9 & 145.0 172.9 & 74.0
Tebuconazole 13.279 250.0 & 125.0 125.0 & 99.0 125.0 & 89.0
Spiromesifen 13.711 272.0 & 254.2 272.0 & 209.2 273.0 & 255.1
Bifenthrin-d5 13.954 181.0 & 165.2 187.1 & 171.1 141.0 & 91.0 170.1 & 119.1
Bifenthrin 13.977 181.0 & 165.2 181.0 & 166.2 166.2 & 165.2
Permethrin 15.719 163.0 & 127.0 182.9 & 155.1 183.1 & 153.1 183.1 & 168.1

5
Matrix-matched calibration standards were prepared in extracts of dried cannabis flower grown without pesticides. Figure 2 shows the Agilent recommended sample preparation procedure.
Results and Discussion
Forty-three GC-amenable pesticides met LOQs established in CaliforniaThe LOQs required in California were successfully met for 43 pesticides. Forty-two had LOQs ≤0.8 ppb in-vial (≤100 ppb in dried cannabis plant material), and 36 of the 42 pesticides had LOQs ≤0.08 ppb in-vial (≤10 ppb in dried cannabis plant material, where ppb in plant material corresponds to ng/g). Captan, cis- and trans-chlordane, and pentachloronitrobenzene (highlighted in Table 3) commonly present a challenge for LC/MS analysis, whereas they met the established LOQs with this method.
Pyridaben 15.761 147.2 & 117.1 147.2 & 132.2 147.2 & 105.1
Coumaphos 15.840 361.9 & 109.0 210.0 & 154.1 225.9 & 198.1 225.9 & 163.1
Cyfluthrin 16.244 163.0 & 127.0 162.9 & 90.9 206.0 & 150.0
Boscalid 16.561 140.0 & 76.0 140.0 & 112.0 111.9 & 76.0
Cypermethrin 16.563 163.0 & 127.0 163.0 & 91.0 181.0 & 152.1
Ethofenprox 16.770 163.0 & 107.1 163.0 & 135.1 135.0 & 107.0
Azoxystrobin-d4 18.426 348.2 & 333.1 348.2 & 183.1 348.2 & 172.0 348.2 & 156.0
Azoxystrobin 18.445 344.1 & 171.9 344.1 & 182.9 344.1 & 329.0
Dimethomorph 18.433 300.9 & 165.0 302.9 & 164.9 386.8 & 300.9
Figure 2. Schematic representation of sample preparation procedure for GC/MS/MS analysis. * Dilution solvent acidified with 0.1 % formic acid.
1. Weigh 1.0 g of chopped cannabis flower into a 50 mL tube. Add two ceramic homogenizer pellets, and shake for five minutes at 3,000 rpm.
3. Decant the supernatant solvent into an unconditioned SampliQ C18 EC cartridge (p/n 5982-1365). Keep the 50 mL tube with the pellets for Step 4. Gravity elute into a clean 50 mL tube.
5. Decant the supernatant solvent into the SampliQ C18 EC cartridge used in Step 3. Gravity elute. Keep the 50 mL tube with the pellets for Step 6.
7. Bring the collected eluent (extract) up to 25 mL with acetonitrile (25-fold dilution).
2. Add 15 mL of acetonitrile, and shake for five minutes at 3,000 rpm.
4. Add 5 mL of acetonitrile, and shake for five minutes at 3,000 rpm.
6. Rinse the centrifuge tube with 5 mL of acetonitrile, and pass through supernatant into the same SPE cartridge used in Steps 3 and 5.
8. Mix 100 µL of extract with 400 µL of acidified 50:50 hexane:acetone (v:v) (125-fold dilution*). Vortex for 10 seconds, and cap. Samples are now ready for GC/MS/MS analysis.

6
Table 3. Selected GC-amenable pesticides that meet LOQs established in California.
CompoundRT
(min)
Reporting limit in California (ppb in dried cannabis plant
material)
Reporting limit in Canada (ppb in dried cannabis plant
material)
LOQ* (8890/7010) (ppb in dried cannabis plant
material)LOQ
(ppb in vial)
High calibration limit
(ppb in vial) R2
Acephate 5.650 100 20 100 0.8 10 0.9978
Azoxystrobin 18.445 100 20 10 0.08 5 0.9945
Bifenthrin 13.977 3,000 Under development (100) 100 0.8 50 0.9971
Boscalid 16.561 100 20 6.25 0.05 5 0.9960
Captan 10.755 700 N/A 100 0.8 25 0.9997
Carbaryl 9.237 500 50 10 0.08 25 0.9986
Carbofuran 7.847 100 20 10 0.08 5 0.9947
Chlordane-cis 11.318 100 N/A 6.25 0.05 5 0.9996
Chlordane-trans 11.045 100 N/A 6.25 0.05 5 0.9995
Chlorfenapyr 12.055 100 Under development (100) 6.25 0.05 5 0.9948
Chlorpyrifos 9.959 100 Under development (10) 6.25 0.05 5 0.9982
Coumaphos 15.840 100 20 6.25 0.05 5 0.9985
Cyfluthrin 16.244 2,000 Under development (3,750) 6.25 0.05 5 0.9976
Cypermethrin 16.563 1,000 Under development (3,750) 10 0.08 25 0.9981
Diazinon 8.285 100 Under development (10) 6.25 0.05 5 0.9985
Dichlorvos 4.673 100 100 6.25 0.05 5 0.9933
Dimethoate 7.776 100 20 6.25 0.05 5 0.9940
Dimethomorph 18.433 2,000 N/A 6.25 0.05 25 0.9992
Ethoprophos 7.019 100 20 6.25 0.05 5 0.9977
Etofenprox 16.770 100 Under development 10 0.08 5 0.9997
Fipronil 10.648 100 60 6.25 0.05 5 0.9907
Fludioxonil 11.557 100 20 6.25 0.05 5 0.9933
Kinoprene 9.740 N/A Under development 100 0.8 25 0.9998
Kresoxim-methyl 11.829 100 Under development (10) 6.25 0.05 5 0.9980
Malathion 9.734 500 20 6.25 0.05 25 0.9998
Metalaxyl 9.337 2,000 20 6.25 0.05 25 0.9997
Methiocarb 9.580 100 20 6.25 0.05 5 0.9965
Methyl-parathion 9.160 100 Under development 6.25 0.05 5 0.9924
Mevinphos 5.598 100 50 6.25 0.05 5 0.9927
MGK-264 10.441 100 Under development 6.25 0.05 5 0.9982
Myclobutanil 11.711 100 20 100 0.8 10 0.9964
Naled 7.248 100 Under development 18.75 0.15 5 0.9935
Oxamyl 6.297 500 3,000 312.5 2.5 50 0.9995
Paclobutrazol 11.099 100 20 6.25 0.05 5 0.9932
Pentachloronitrobenzene 8.227 100 N/A 6.25 0.05 5 0.9994
Permethrin 15.719 500 Under development (500) 6.25 0.05 25 0.9993
Propiconazole I 13.108 100 Under development (10) 6.25 0.05 5 0.9920
Propiconazole II 13.247 100 Under development (10) 6.25 0.05 5 0.9937
Propoxur 6.833 100 20 6.25 0.05 5 0.9955
Pyridaben 15.761 100 50 6.25 0.05 5 0.9992
Spiromesifen 13.711 100 3000 6.25 0.05 5 0.9953
Spiroxamine 9.084 100 Under development 6.25 0.05 5 0.9987

7
Successful GC/MS analysis of pesticides known to be challenging in LC/MS analysisFigure 3 shows GC/MS MRM chromatograms at LOQ level for pentachloronitrobenzene, chlordane-trans, chlordane-cis, and captan. These pesticides are commonly challenging for LC/MS analysis. With the GC/MS method described here, these pesticides had LOQs lower than those established in California.
Reported LOQs were based on 10 replicate sequential injections at a given concentration level with %RSD <20. Instrument detection limits (IDLs) in fg on-column for each pesticide were determined by performing 10 replicate sequential injections of the matrix-matched calibration standard at the LOQ level, as shown in Figure 3. Calculations of IDL were made according to Formula 1. The value of t-test statistics for 10 measurements at a 99 % confidence interval (tα) was 2.821. Table 3 presents the determined IDLs.
IDL = (tα)(RSD)(amount of standard on‑column)/100 %Formula 1.
* LOQs in dried cannabis plant material were determined assuming a 100 % pesticide recovery. Internal standard (ISTD) matrix-matched calibration was performed for dichlorovos, captan, bifenthrin, and azoxystrobin. ISTDs were added by sandwich injection. External standard (ESTD) matrix-matched calibration was performed for the rest of the analyzed pesticides. The high end of the calibration range was chosen based on the required LOQ for the pesticide.
Acquisition time (min)
Acquisition time (min)
Acquisition time (min)
8.14 8.16 8.18 8.2 8.22 8.24 8.26 8.28 8.30
Pentachloronitrobenzene
LOQ 0.05 ppb in vial (6.25 ppb in cannabis)RSD 3.1 %IDL in post spiked matrix 13 fg on-column
Captan
LOQ 0.8 ppb in vial (100 ppb in cannabis)RSD 8.6 %IDL in post spiked matrix 584 fg on-column
1. Chlordane-trans
LOQ 0.05 ppb in vial (6.25 ppb in cannabis)RSD 12.0 %IDL in post spiked matrix 51 fg on-column
LOQ required in CA: 100 ppb
10.68 10.70 10.72 10.74 10.76 10.78
LOQ required in CA: 700 ppb
1
2
10.6 10.7 10.8 10.9 11.0 11.1 11.2 11.3 11.4
LOQ required in CA: 100 ppb
LOQ required in CA: 100 ppb
A
B
C
2. Chlordane-cis
LOQ 0.05 ppb in vial (6.25 ppb in cannabis)RSD 18.4 %IDL in post spiked matrix 78 fg on-column
Figure 3. MRM chromatograms of 10 sequential injections for for pentachloronitrobenzene (quintozene), captan, chlordane-trans, and chlordane-cis at LOQ level.
Tebuconazole 13.279 100 Under development (10) 6.25 0.05 5 0.9963
Trifloxystrobin 12.920 100 20 100 0.8 10 0.9968
8
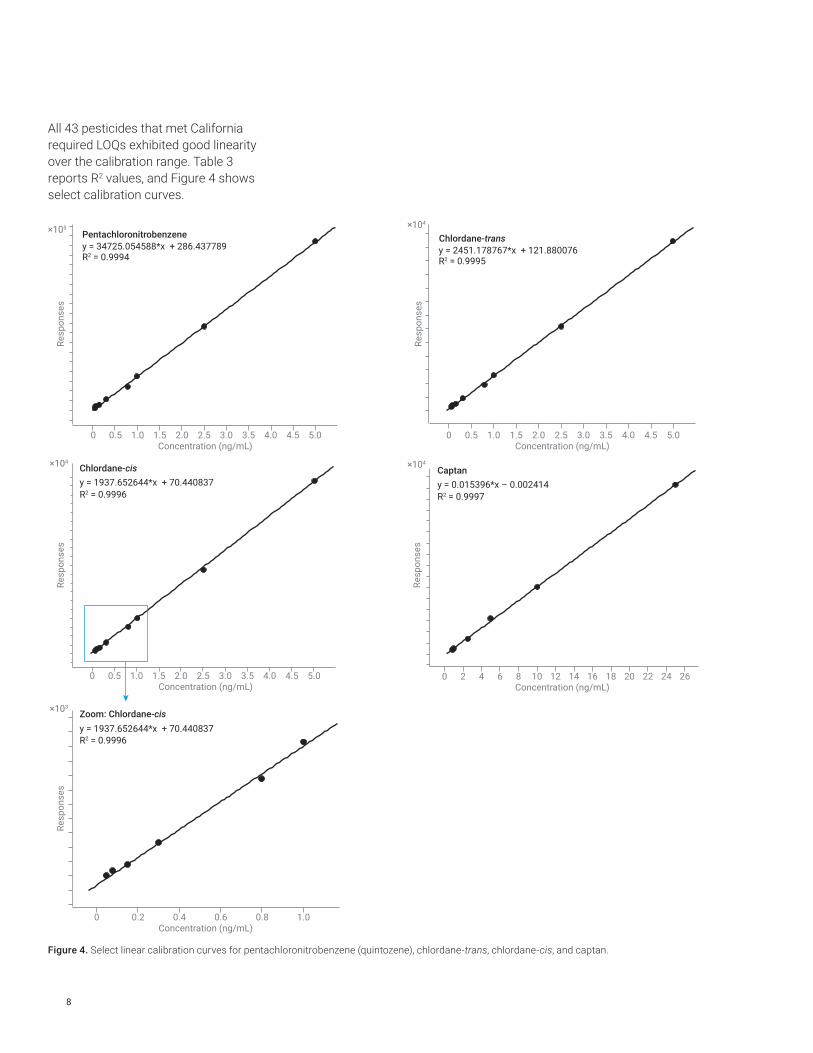
All 43 pesticides that met California required LOQs exhibited good linearity over the calibration range. Table 3 reports R2 values, and Figure 4 shows select calibration curves.
Figure 4. Select linear calibration curves for pentachloronitrobenzene (quintozene), chlordane-trans, chlordane-cis, and captan.
Chlordane-transy = 2451.178767*x + 121.880076R2 = 0.9995
Pentachloronitrobenzene
Concentration (ng/mL)0 0.5 1.0 1.5 2.0 2.5 3.0 3.5 4.0 4.5 5.0
Concentration (ng/mL)
Concentration (ng/mL)
0 0.5 1.0 1.5 2.0 2.5 3.0 3.5 4.0 4.5 5.0
Concentration (ng/mL)
Concentration (ng/mL)
0 0.5 1.0 1.5 2.0 2.5 3.0 3.5 4.0 4.5 5.0
y = 34725.054588*x + 286.437789R2 = 0.9994
Re
sp
on
se
s
Re
sp
on
se
s
Re
sp
on
se
sR
es
po
ns
es
Re
sp
on
se
s
Captan
0 2 4 6 8 10 12 14 16 18 20 22 24 26
y = 0.015396*x – 0.002414
R2 = 0.9997
0 0.2 0.4 0.6 0.8 1.0
y = 1937.652644*x + 70.440837R2 = 0.9996
Chlordane-cis
Zoom: Chlordane-cis
y = 1937.652644*x + 70.440837
R2 = 0.9996
×105 ×104
×104×104
×103

9
Thirty GC-amenable pesticides met LOQs currently established in CanadaRequired LOQs for pesticides in cannabis established in Canada2 are generally lower than those established in the U.S. Table 3 shows that 30 pesticides met the established and proposed LOQs in Canada. For 24 of those pesticides, LOQs mandated in Canada were lower than LOQs required in California. For example, the LOQ established by Health Canada for metalaxyl is 100-fold lower, and is 20 ppb compared to 2 ppm. The mandated LOQ was successfully met with Agilent's 8890 GC System in combination with Agilent's 7010B Triple Quadrupole GC/MS when using the analytical method described in this work.
Quantitation of kinoprene: a challenging pesticide regulated in CanadaSimilar to captan, chlordane, and pentachloronitrobenzene, kinoprene is known to present a challenge for LC/MS analysis. It is also one of the challenging compounds for GC/MS. Currently, kinoprene is regulated only in Canada in fresh cannabis and plants, and in cannabis oil; however, the environmental assessment by the USEPA classifies kinoprene as highly toxic4.
Figure 5 shows that Agilent's 8890 GC System in combination with Agilent's 7010B Triple Quadrupole GC/MS allowed for kinoprene quantitation with an LOQ of 0.8 ppb in-vial (100 ppb in dried cannabis plant material). MRM transitions for kinoprene were optimized in cannabis matrix with the the MassHunter Optimizer for GC/TQ.
Figure 5. Ten overlaid sequential kinoprene MRM chromatograms at LOQ, and a linear calibration curve.
+EI EIC MRM (149.1, 149.0 & 77.0)
* 9.721
Acquisition time (min)
Co
un
ts
9.50 9.55 9.60 9.65 9.70 9.75 9.80 9.85
KinopreneLOQ 0.8 ppb in vial (100 ppb in cannabis)
RSD 6.9 %
Kinoprene
0 2 4 6 8 10 12 14 16 18 20 22 24 26
y = 21325.318412*x – 10026.239695
R2 = 0.9998
Concentration (ng/mL)
Re
sp
on
se
s
×105
A
B
10
Optimized sample preparation that enables the lowest LOQsCompared to other plants and vegetables, cannabis has higher amounts of potential interferences and notably high concentrations of terpenes, cannabinoids, flavonoids, phenols, and fatty acids. The complexity of the cannabis matrix makes detection and accurate quantification of trace levels of pesticides more challenging. The Agilent recommended sample preparation approach was developed for simplicity, quick turnaround time, and to provide enough cleanup for improved sensitivity
and system uptime at the same time.
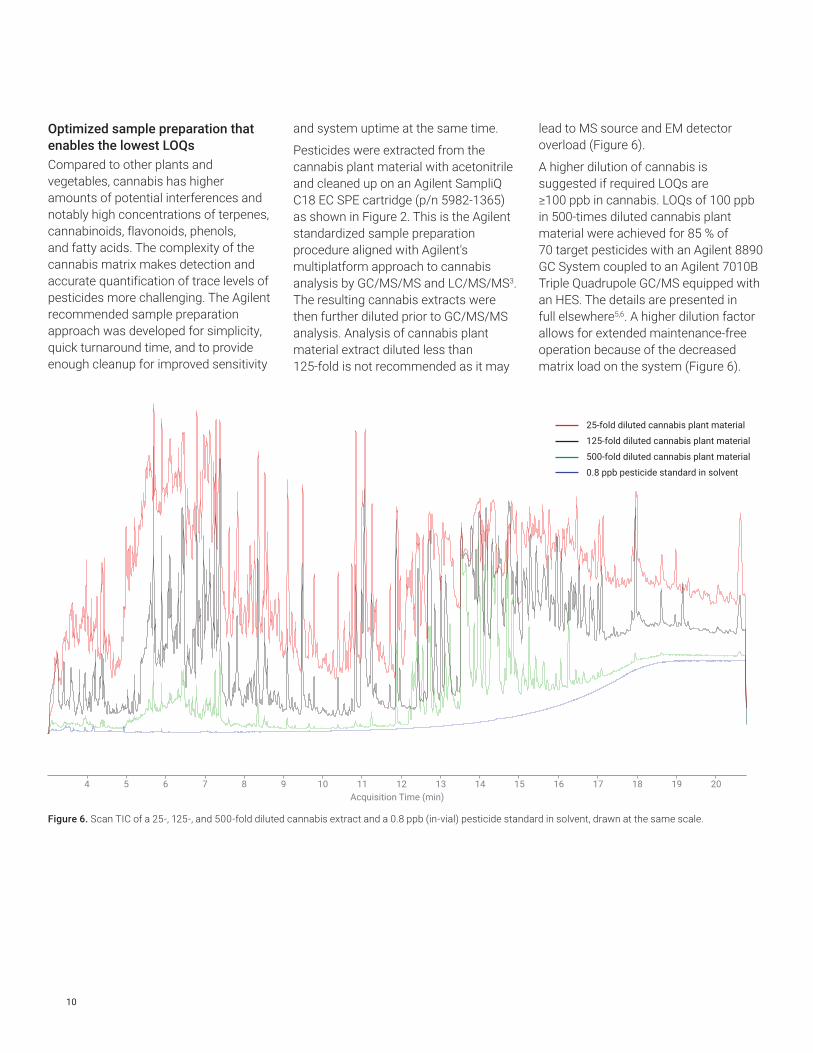
Pesticides were extracted from the cannabis plant material with acetonitrile and cleaned up on an Agilent SampliQ C18 EC SPE cartridge (p/n 5982-1365) as shown in Figure 2. This is the Agilent standardized sample preparation procedure aligned with Agilent's multiplatform approach to cannabis analysis by GC/MS/MS and LC/MS/MS3. The resulting cannabis extracts were then further diluted prior to GC/MS/MS analysis. Analysis of cannabis plant material extract diluted less than 125-fold is not recommended as it may
lead to MS source and EM detector overload (Figure 6).
A higher dilution of cannabis is suggested if required LOQs are ≥100 ppb in cannabis. LOQs of 100 ppb in 500-times diluted cannabis plant material were achieved for 85 % of 70 target pesticides with an Agilent 8890 GC System coupled to an Agilent 7010B Triple Quadrupole GC/MS equipped with an HES. The details are presented in full elsewhere5,6. A higher dilution factor allows for extended maintenance-free operation because of the decreased matrix load on the system (Figure 6).
Acquisition Time (min)
4 5 6 7 8 9 10 11 12 13 14 15 16 17 18 19 20
25-fold diluted cannabis plant material
125-fold diluted cannabis plant material
500-fold diluted cannabis plant material
0.8 ppb pesticide standard in solvent
Figure 6. Scan TIC of a 25-, 125-, and 500-fold diluted cannabis extract and a 0.8 ppb (in-vial) pesticide standard in solvent, drawn at the same scale.
11
ConclusionMRM transitions for the majority of pesticides from the California target list are included in the MassHunter Pesticide and Environmental Pollutant MRM Database that greatly simplified building acquisition methods. The MassHunter Optimizer for GC/TQ enabled MRM development for new compounds of interest. Backflushing reduced the need for system maintenance, which is a welcome productivity improvement for the lab. The PSD of Agilent's 8890 GC System simplifies pulsed splitless injection mode for use with column backflushing, and significantly reduces the flow of helium, conserving gas and lowering operating cost. Agilent's 7010B Triple Quadrupole GC/MS provides excellent sensitivity and selectivity in the analysis of pesticides in a complex cannabis matrix.
The LOQs established in California were met for 43 GC-amenable pesticides regulated by the Bureau of Cannabis Control. LOQs for 36 pesticides were ≤0.08 ppb in-vial (≤10 ppb in dried cannabis plant material, assuming 100 % pesticide recovery), and 43 pesticides had LOQs ≤0.8 ppb in-vial (≤100 ppb in dried cannabis plant material) when analyzing a 125-fold diluted cannabis extract.
AcknowledgementThe authors would like to thank Bruce Quimby, Ron Honnold, and Pete Stone for their valuable contributions to this work.
References1. Bureau of Cannabis Control.
California Code of Regulations. Title 16, Division 42. Regular Regulations Text. October 2018.
2. Pest Control Products Act. Government of Canada (S.C. 2002, c. 28), Current to October 3, 2018. http://laws-lois.justice.gc.ca/eng/acts/P-9.01/page-1.html
3. Roy, J-F.; et al. A Sensitive and Robust Workflow to Measure Residual Pesticides and Mycotoxins From the Canadian Target List in Dry Cannabis Flower. Agilent Technologies Application Note, publication number 5994-0429EN, In press, 2018.
4. United States Environmental Protection Agency. Prevention, Pesticides and Toxic Substances (7508W).
5. Asanuma, L.; et al. A novel comprehensive strategy for residual pesticide analysis in cannabis flower. Agilent Technologies, publication number 5991-9030, 2018.
6. Churley, M.; et al. A Novel Approach to Sensitive Pesticide Analysis in Cannabis by GC/MS/MS. Poster #60 NACRW 2017.

www.agilent.com/chem
This information is subject to change without notice.
© Agilent Technologies, Inc. 2019 Printed in the USA, April 16, 2019 5994-0568EN
Agilent products and solutions are intended to be used for cannabis quality control and safety testing in laboratories where such use is permitted under state/country law.