Embed Size (px)
Citation preview
Sensing Data Centers for Energy
Efficiency
ByJie Liu Andreas Terzis
Microsoft Research Johns Hopkins University
Abstract
Data centers are large energy consumers today and their consumption is ex-pected to increase further, driven by the growth in cloud services. The large costsand the environmental impact of this consumption have motivated data center op-erators to optimize data center operations. We argue that one of the underlyingreasons for the low energy utilization is the lack of visibility into a data center’shighly dynamic operating conditions. Wireless sensor networks promise to removethis veil of uncertainty by delivering large volumes of data collected at high spatialand temporal fidelities. The paper summarizes data center operations in order todescribe the parameters that a data center sensing network would need to collectand motivate the challenges that such a network would face. We present technicalapproaches for the problems of data collection and management and close with anoverview of Data Center Genome, an end-to-end data center sensing system.
1. Introduction
Internet services, such as news, e-mail, on-line storage, social networking, entertain-ment, e-commerce, search and advertising, have become intrinsic parts of people’slives. As a result, the IT infrastructure that powers these services is experiencinga rapid growth in recent years. A central part of this IT infrastructure are datacenters, hosting servers and storage devices. According to an EPA survey, in 2006,the total energy consumption for data centers in the US was 61 billion kWh, enoughto power 5.8 million US households [65]. Perhaps more importantly, IT power con-sumption is the fastest growing sector and is expected to double by 2011. Thus,improving data center efficiency not only reduces a company’s operating cost butcan also be considered as part of its social responsibility.
Data centers can have drastically different sizes and form factors, from a fewserver cabinets, to shipping containers, to dedicated warehouse-size buildings. Thelargest of data centers can consume more than 100 MW of electricity and cost afew hundred million dollars to build. Roughly speaking a dedicated data centerhas three main subsystems, data systems, including servers, storage, and networkinfrastructure, power systems, including transformers, energy storage units, backupgenerators, and the power distribution network, and cooling systems, including chillwater towers, computer room air conditioning (CRAC) units, and air ducts.
Data centers have been traditionally over-provisioned: the power system is undersubscribed; server rooms (called colocations, or colos for short) are over cooled; and
Article submitted to Royal Society TEX Test Paper
2Jie Liu Andreas Terzis
Microsoft Research Johns Hopkins University
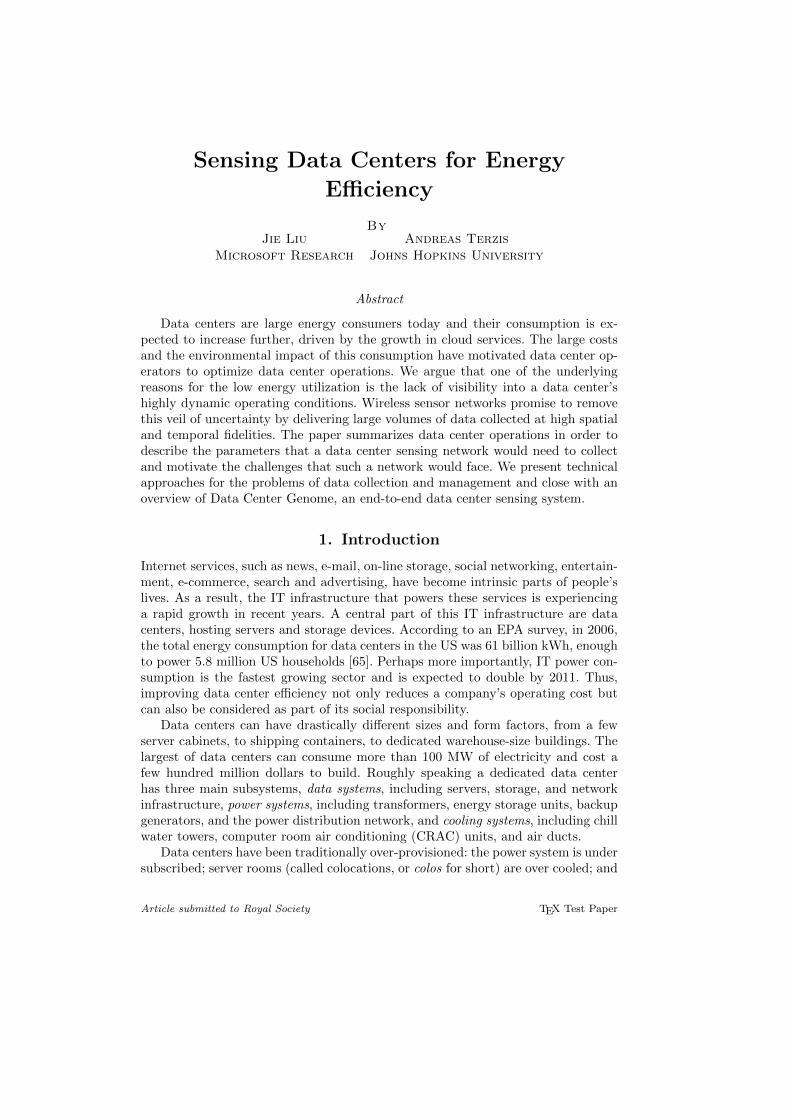
server utilization is low on average. As a quantitative metric of this condition, thePower Utilization Efficiency (PUE), defined as the total facility power divided bythe total power used by the data systems, of some data centers is greater than 2. Inan effort to reduce operation overhead the data center industry is exploring ways tobring PUE as close to 1 as possible and to increase computing resource utilizationas much as possible. Doing so requires the operators to have a detailed and up todate understanding of where and how power is consumed within a data center andspecifically where heat is generated and how equipment are cooled.
Maintaining an up to date image of a data center is complicated by the observa-tion that a data center’s operating conditions are not static. Servers have typicallythree to five years of lifetime to leverage the latest innovations in hardware. More-over, the services deployed on these servers change over time—some of the largestonline services have continuous release cycles [40]. Last but not least, service work-load varies driven by user demands [10, 11]. For example, twice as many users arelogged in the Windows Live Messenger service during peak time, compared to off-peak periods. In turn, this workload variation causes the power consumption andheat output of the servers to vary. Typically, a heavy loaded server may consumetwice as much power as an idle server. Therefore, depending on the physical layoutand load distribution in a data center, the power and cooling systems are stressedat different times and locations. The existence of these data center dynamics intro-duces challenges to some of the most important decisions that operators have tomake, including:
• Capacity Planning : While online services continue to grow, the more serversan existing data center can host, the fewer data centers need to be built.Given the immense capital costs of building new data centers and the inherentfacility overhead in power consumption, improving the utilization of existingfacilities is crucial.
• Change Management : Hardware and software components in data centerschange over time. In this context, data center operators need to make in-formed decisions about where to place new equipment and replace existingones to optimally use the space. In cloud computing and other online services,the management software needs to decide where to place virtual machines(VMs), applications, and user workload. In addition to server capacity andavailability, power distribution and cooling availability are key factors thatinfluence management decisions.
• Real-time Control : Given the reduced safety margins associated with aggres-sive power, cooling, and workload optimization, the role of real-time controlis critical. The massive spatial distribution of physical variables and the in-teraction between physical and cyber activities make the control problemchallenging.
• Diagnostics: Unsafe operating conditions, such as high temperatures, fasttemperature variations and excessive vibrations, may lead to server perfor-mance throttling and degraded equipment reliability. Failures in some casesdevelop over long periods of time. For this reason, accumulating long termdata about operating conditions and performance statistics can power ret-
Article submitted to Royal Society
Sensing Data Centers for Energy Efficiency 3
rospective analyses that help identify the failures’ root causes and improvefuture operations.
While cyber-properties such as server workload, network traffic, and applica-tion performance are routinely monitored in software, the visibility into data centerphysical conditions and the cyber-physical interactions is rather poor. Traditionaldata centers have a small number of sensors associated with key pieces of equip-ment and inside the colos. These sensors however do not provide the granularitythat is necessary to capture the physical conditions at the rack or server level andanswer the previously mentioned questions. We argue that improving data centerutilization and efficiency, requires a marked increase in our ability to sense physicalconditions in side and across data centers – including space configuration, powerconsumption, air temperature, humidity, air flow speed, chill water temperature,and AC utilization – together with performance and workload management.
In this paper, we summarize data center operations in Section 2 and discuss thechallenges of data center sensing in Section 3. Section 4 presents systems for datacenter sensing, data stream management as well as decision and control. Section 5presents a case study, while Section 6 reviews some the other work in this area. Weconclude in Section 7.
2. Data Center Background
To motivate the need for fine-grained data center sensing, we first describe a datacenter’s physical infrastructure and discuss the dynamics of physical propertiesdriven by computing and environmental variations.
(a) Power Distribution and Cost
A Tier-2 data center, which includes N+1 redundant infrastructure componentsproviding 99.741% availability [25], is typical for hosting Internet services. In thesedata centers, power drawn from the grid is transformed and conditioned to chargethe UPS system (based on batteries or flywheels). The un-interrupted power isdistributed through Power Distribution Units (PDUs) to supply power to the serverand networking racks. This portion of power is called the critical power, since itis used to perform “useful work.” Power is also used by water chillers, computerroom air conditioning (CRAC) systems, and humidifiers to provide appropriatetemperature and humidity conditions for IT equipment.
The power capacity of a data center is primarily defined by the capacity of itsUPS system, both in terms of the steady load that it can handle as well as thesurges that it can withstand. For well-managed data centers, it is the maximuminstantaneous power consumption from all servers allocated to each UPS unit thatdetermines how may servers a data center can host.
The availability and cost of electricity may vary over time. For example, localgreen energy production such as from solar or wind can change daily or seasonally.Electricity price fluctuate dramatically in the real-time market. While data centerssign bulk rate contracts with utility companies, exceeding power cap can introducehuge financial cost. With proper sensing and control, a collaborative group of geo-distributed data centers can take advantage of energy price variation to reduce thetotal energy expense [48].
Article submitted to Royal Society
4Jie Liu Andreas Terzis
Microsoft Research Johns Hopkins University
T
Floor vent
Floor plenum
RacksCRAC
(AC units)
Return air Cool
Hot
Chilled water supply
Hot aisle Cold aisle
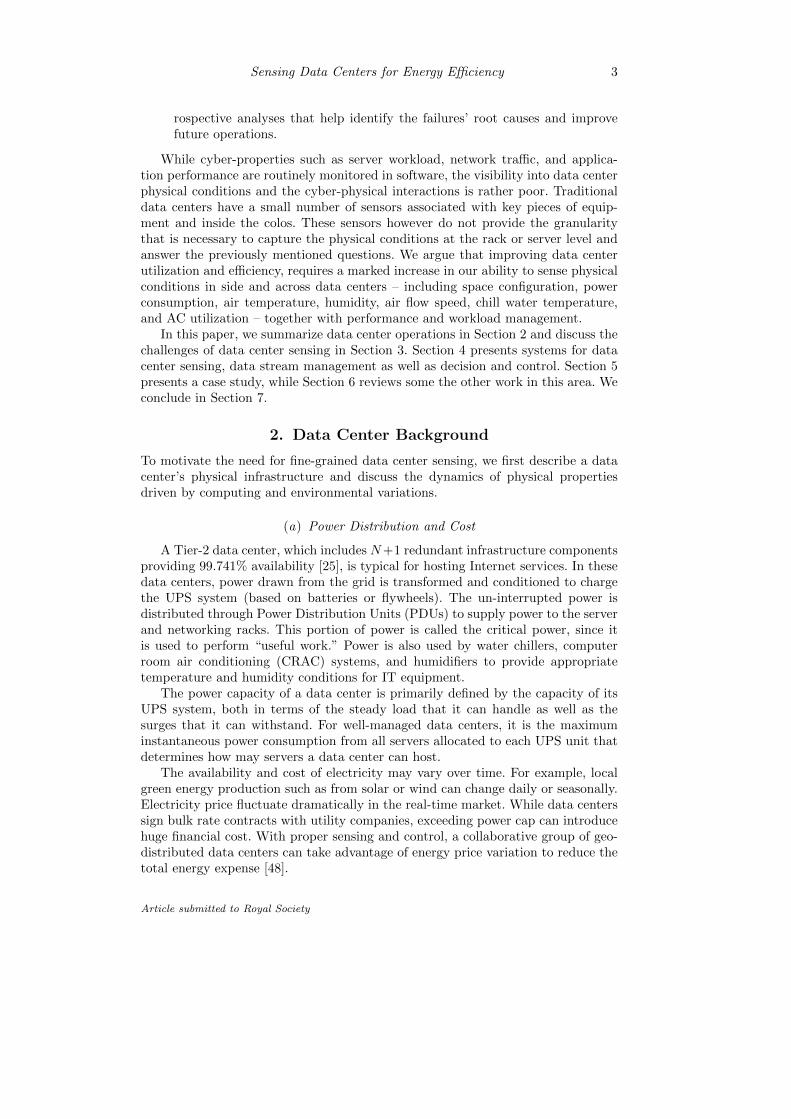
Figure 1. An illustration of an air-cooled data center on raised floors.
(b) Cooling System
Most data centers are air cooled, i.e. blowing cold air through the servers tomaintain the electronic components within their operating ranges for temperatureand humidity. Figure 1 shows the cross section of a typical data center with a cold-aisle-hot-aisle arrangement on a raised floor. The CRACs in the room draw warmair into the AC unit, where heat is exchanged with chilled water, and cold air isblown to the sub-floor. Perforated tiles allow the cold air to flow into the room,from where server fans drive it through the servers’ chassis to cool key components.
Air cooling systems have slow dynamics. To avoid over-reaction and oscillations,CRAC units usually react every 15 minutes. Furthermore, their actions reach theservers after long propagation delays, depending on air dynamics, the volume of airin the room, and the thermal properties of servers and the building’s materials.
Appropriate temperature and humidity ranges are important to maintain serversin reliable working conditions. Servers have protective temperature sensors whichwill throttle the CPU or even shut down the server if key components overheat. Toprevent such overheating events from happening and considering the lack of fine-grain information about their environmental conditions, most data centers operatewith conservative temperature and humidity settings. The American Society ofHeating, Refrigerating, and Air-Conditioning Engineers (ASHREA) recommendsthat data centers operate between 20oC to 25oC and 30% to 45% relative humidity.However, excessive cooling does not necessarily improve reliability or reduce devicefailure rates [47]. Morden data centers start to agressively relax operation conditionsand use ambient air to cool data centers directly as much as possible.
(c) Workload Dynamics
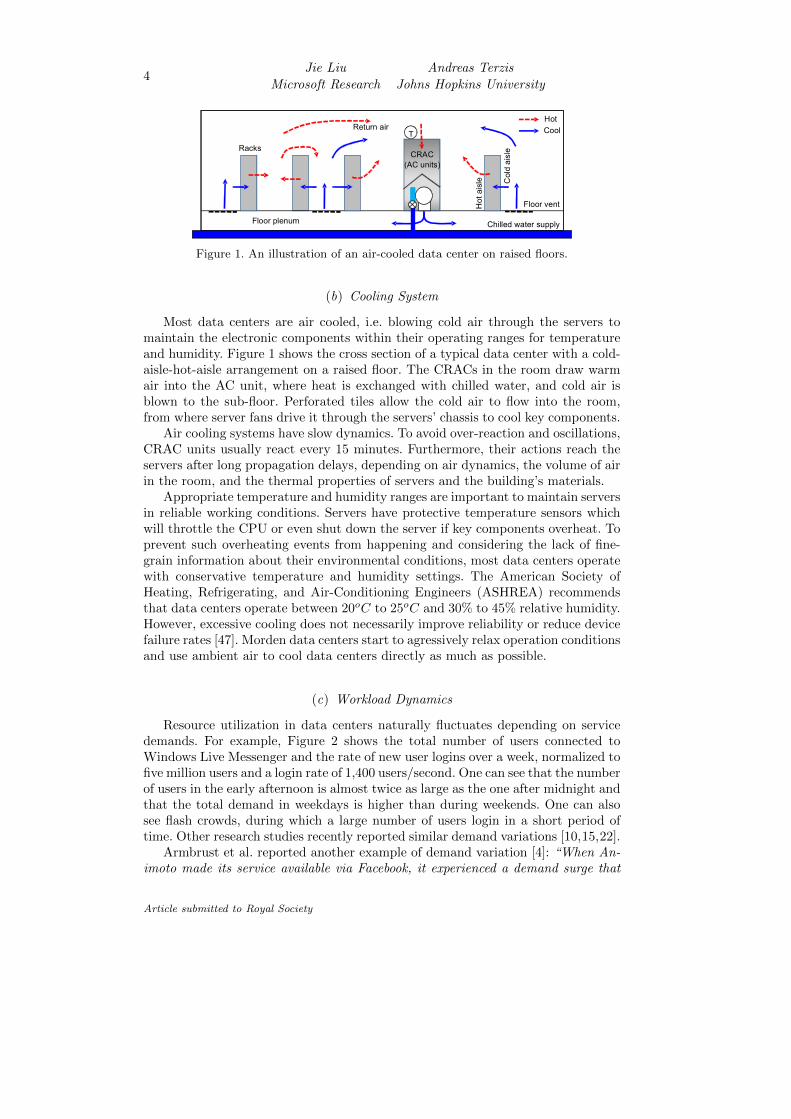
Resource utilization in data centers naturally fluctuates depending on servicedemands. For example, Figure 2 shows the total number of users connected toWindows Live Messenger and the rate of new user logins over a week, normalized tofive million users and a login rate of 1,400 users/second. One can see that the numberof users in the early afternoon is almost twice as large as the one after midnight andthat the total demand in weekdays is higher than during weekends. One can alsosee flash crowds, during which a large number of users login in a short period oftime. Other research studies recently reported similar demand variations [10,15,22].
Armbrust et al. reported another example of demand variation [4]: “When An-imoto made its service available via Facebook, it experienced a demand surge that
Article submitted to Royal Society
Sensing Data Centers for Energy Efficiency 5
0 20 40 60 80 100 120 140 160200
400
600
800
1000
1200
1400
Time in hours
Logi
n ra
te (p
er s
econ
d)
Login RateConnections
0
1
2
3
4
5
Num
ber o
f con
nect
ions
(milli
ons)
Figure 2. Load variation, in terms of total number of users and rate of new user logins,for the Microsoft Live Messenger service, normalized to 5 million users.
resulted in growing from 50 servers to 3500 servers in three days... After the peaksubsided, traffic fell to a level that was well below the peak.”
As a rough approximation, current servers consume ∼ 60% of their peak powerwhen idle and power consumption above this point scales linearly with CPU uti-lization [5]. It is then easy to see that service type and workload variations causethe servers’ power consumption to change and consequently impact the amount ofheat they generate.
(d) Interaction Between Cyber and Physical Systems
The heat the servers generate does not dissipate evenly over space. Instead, atypical server’s 4 to 10 fans direct heat towards its rear side. These air streamscoupled with those generated by CRAC ventilation fans, generate complex air flowpatterns within a data center.
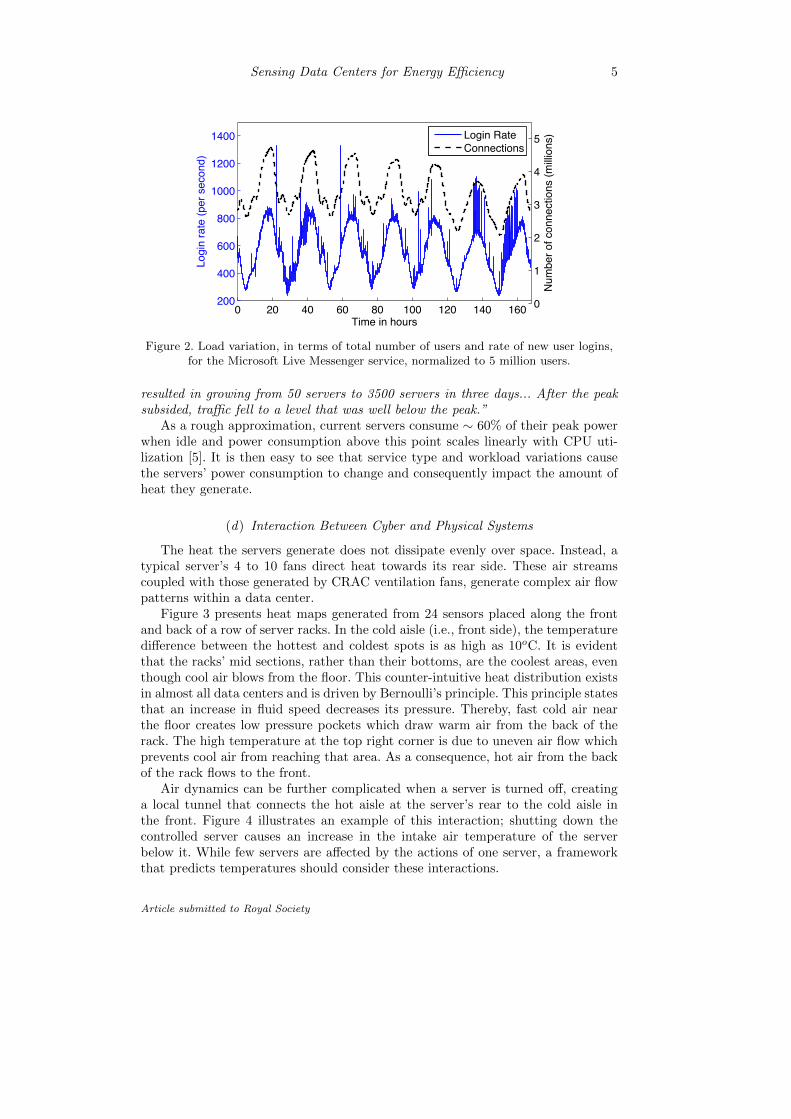
Figure 3 presents heat maps generated from 24 sensors placed along the frontand back of a row of server racks. In the cold aisle (i.e., front side), the temperaturedifference between the hottest and coldest spots is as high as 10oC. It is evidentthat the racks’ mid sections, rather than their bottoms, are the coolest areas, eventhough cool air blows from the floor. This counter-intuitive heat distribution existsin almost all data centers and is driven by Bernoulli’s principle. This principle statesthat an increase in fluid speed decreases its pressure. Thereby, fast cold air nearthe floor creates low pressure pockets which draw warm air from the back of therack. The high temperature at the top right corner is due to uneven air flow whichprevents cool air from reaching that area. As a consequence, hot air from the backof the rack flows to the front.
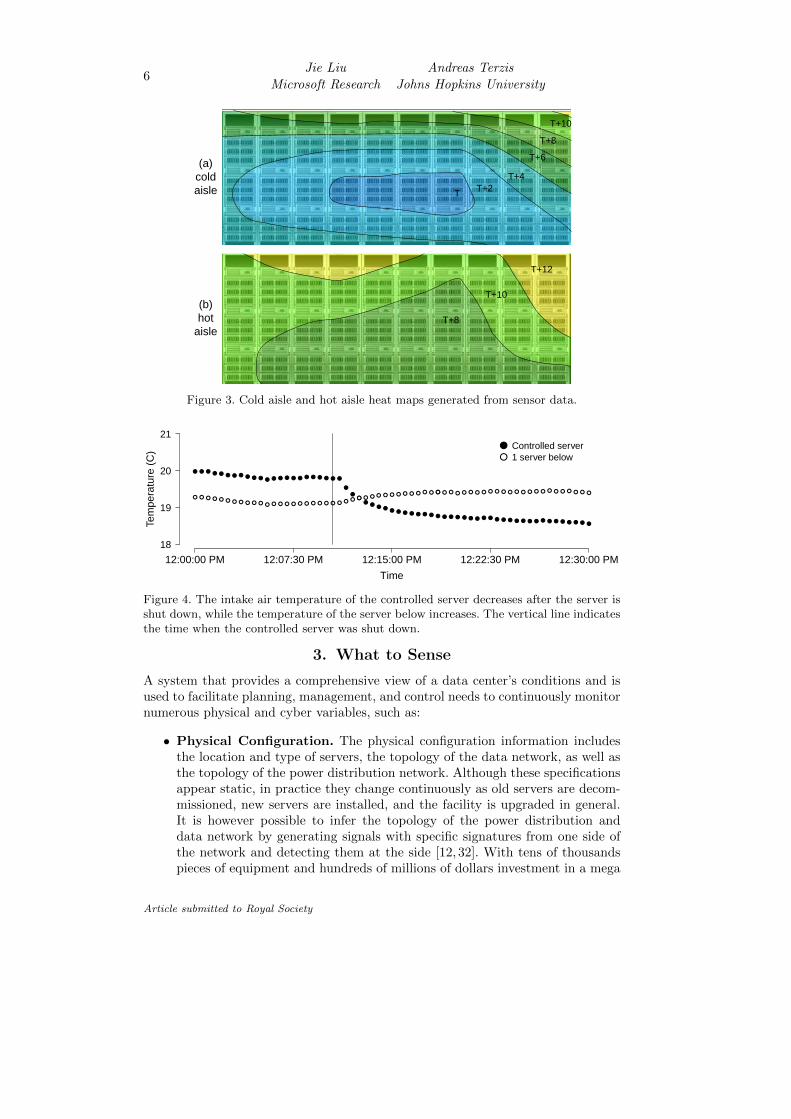
Air dynamics can be further complicated when a server is turned off, creatinga local tunnel that connects the hot aisle at the server’s rear to the cold aisle inthe front. Figure 4 illustrates an example of this interaction; shutting down thecontrolled server causes an increase in the intake air temperature of the serverbelow it. While few servers are affected by the actions of one server, a frameworkthat predicts temperatures should consider these interactions.
Article submitted to Royal Society
6Jie Liu Andreas Terzis
Microsoft Research Johns Hopkins University
(a)
cold
aisle
(b)
hot
aisle
TT+2
T+4
T+6
T+8
T+10
T+10
T+12
T+8
Figure 3. Cold aisle and hot aisle heat maps generated from sensor data.
Time
Tem
pera
ture
(C
)
● ● ● ● ● ● ● ● ● ● ● ● ● ● ● ● ● ● ● ● ● ● ●
●
●●
●●
● ●● ● ● ● ● ● ● ● ● ● ● ● ● ● ● ● ● ● ● ● ● ● ● ● ● ● ● ● ● ● ●
● ● ● ● ● ● ● ● ● ● ● ● ● ● ● ● ● ● ● ● ● ● ● ● ● ● ● ● ● ● ● ● ● ● ● ● ●● ● ● ● ● ● ● ● ● ● ● ● ● ● ● ● ● ● ● ● ● ● ● ● ●
18
19
20
21
12:00:00 PM 12:07:30 PM 12:15:00 PM 12:22:30 PM 12:30:00 PM
●
●
Controlled server1 server below
Figure 4. The intake air temperature of the controlled server decreases after the server isshut down, while the temperature of the server below increases. The vertical line indicatesthe time when the controlled server was shut down.
3. What to Sense
A system that provides a comprehensive view of a data center’s conditions and isused to facilitate planning, management, and control needs to continuously monitornumerous physical and cyber variables, such as:
• Physical Configuration. The physical configuration information includesthe location and type of servers, the topology of the data network, as well asthe topology of the power distribution network. Although these specificationsappear static, in practice they change continuously as old servers are decom-missioned, new servers are installed, and the facility is upgraded in general.It is however possible to infer the topology of the power distribution anddata network by generating signals with specific signatures from one side ofthe network and detecting them at the side [12, 32]. With tens of thousandspieces of equipment and hundreds of millions of dollars investment in a mega
Article submitted to Royal Society
Sensing Data Centers for Energy Efficiency 7
data center, asset management should be highly reliable and low cost. Tradi-tional RFID technologies face challenges since data center environments arenot RF-friendly due to multiple metal barriers.
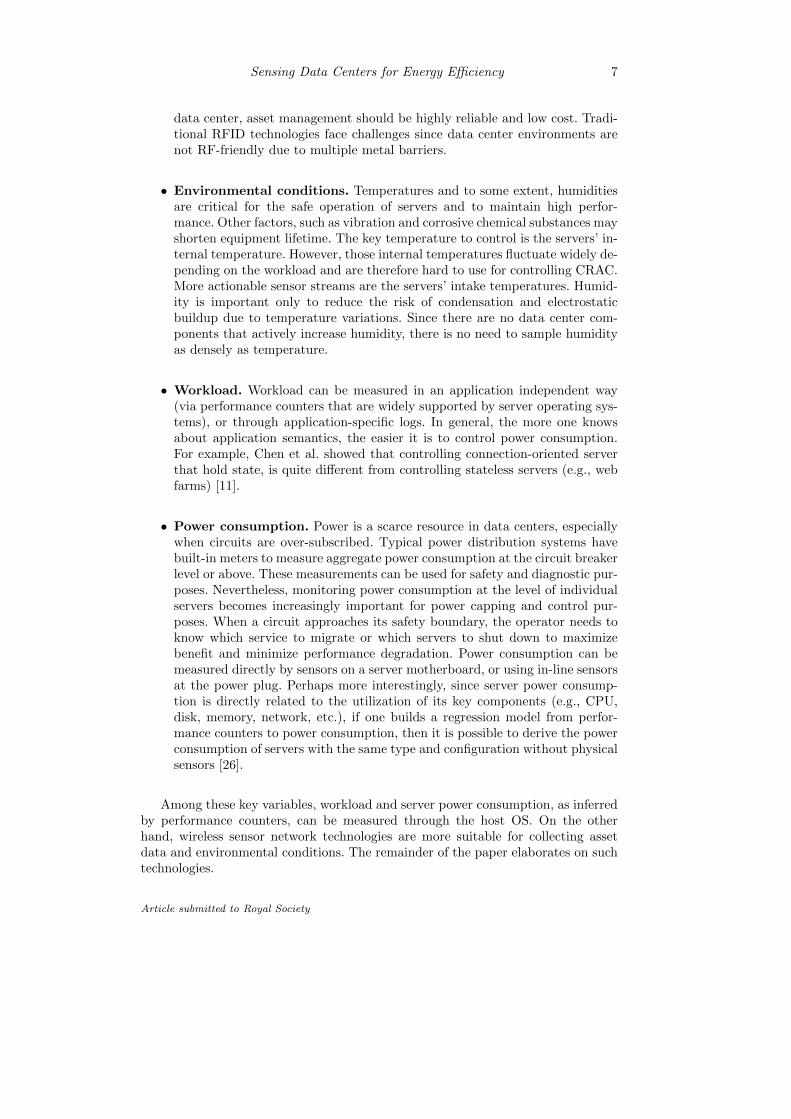
• Environmental conditions. Temperatures and to some extent, humiditiesare critical for the safe operation of servers and to maintain high perfor-mance. Other factors, such as vibration and corrosive chemical substances mayshorten equipment lifetime. The key temperature to control is the servers’ in-ternal temperature. However, those internal temperatures fluctuate widely de-pending on the workload and are therefore hard to use for controlling CRAC.More actionable sensor streams are the servers’ intake temperatures. Humid-ity is important only to reduce the risk of condensation and electrostaticbuildup due to temperature variations. Since there are no data center com-ponents that actively increase humidity, there is no need to sample humidityas densely as temperature.
• Workload. Workload can be measured in an application independent way(via performance counters that are widely supported by server operating sys-tems), or through application-specific logs. In general, the more one knowsabout application semantics, the easier it is to control power consumption.For example, Chen et al. showed that controlling connection-oriented serverthat hold state, is quite different from controlling stateless servers (e.g., webfarms) [11].
• Power consumption. Power is a scarce resource in data centers, especiallywhen circuits are over-subscribed. Typical power distribution systems havebuilt-in meters to measure aggregate power consumption at the circuit breakerlevel or above. These measurements can be used for safety and diagnostic pur-poses. Nevertheless, monitoring power consumption at the level of individualservers becomes increasingly important for power capping and control pur-poses. When a circuit approaches its safety boundary, the operator needs toknow which service to migrate or which servers to shut down to maximizebenefit and minimize performance degradation. Power consumption can bemeasured directly by sensors on a server motherboard, or using in-line sensorsat the power plug. Perhaps more interestingly, since server power consump-tion is directly related to the utilization of its key components (e.g., CPU,disk, memory, network, etc.), if one builds a regression model from perfor-mance counters to power consumption, then it is possible to derive the powerconsumption of servers with the same type and configuration without physicalsensors [26].
Among these key variables, workload and server power consumption, as inferredby performance counters, can be measured through the host OS. On the otherhand, wireless sensor network technologies are more suitable for collecting assetdata and environmental conditions. The remainder of the paper elaborates on suchtechnologies.
Article submitted to Royal Society
8Jie Liu Andreas Terzis
Microsoft Research Johns Hopkins University
Time (minutes)
Load
(%
)
● ● ● ● ●
●
●
●
●
●
●
●
●
●
●
●
●
●
●
●
●
●
●
●
●
●
●
●
●
●
●
●
●
●
●
●
●
●
●
●
●
●
●
● ●
● ●
●
● ●
●
● ●
● ● ●
● System loadCPU board tempCPU 1 temp
IO Board tempIntake air tempOutput air temp
1 6 11 16 21 26 31 36 41 46 51 560
10
20
30
40
50
60
70
80
90
0
10
20
30
40
50
60
70
80
90
Tem
pera
ture
(C
)
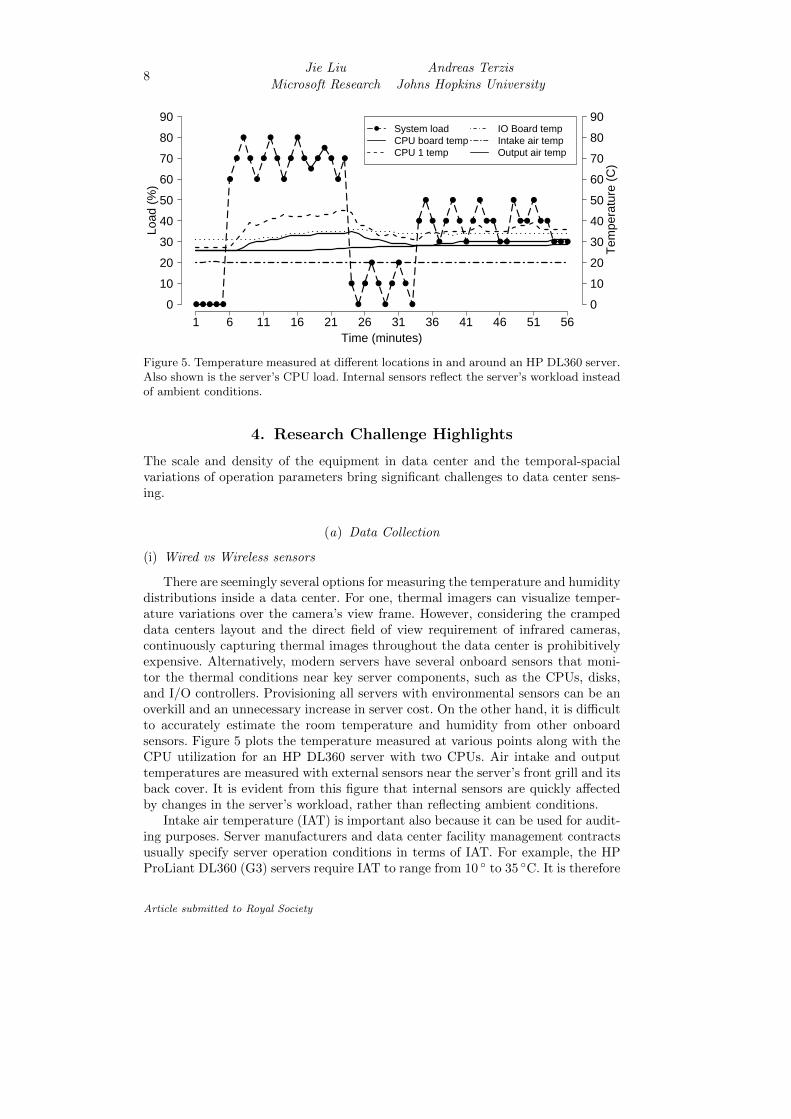
Figure 5. Temperature measured at different locations in and around an HP DL360 server.Also shown is the server’s CPU load. Internal sensors reflect the server’s workload insteadof ambient conditions.
4. Research Challenge Highlights
The scale and density of the equipment in data center and the temporal-spacialvariations of operation parameters bring significant challenges to data center sens-ing.
(a) Data Collection
(i) Wired vs Wireless sensors
There are seemingly several options for measuring the temperature and humiditydistributions inside a data center. For one, thermal imagers can visualize temper-ature variations over the camera’s view frame. However, considering the crampeddata centers layout and the direct field of view requirement of infrared cameras,continuously capturing thermal images throughout the data center is prohibitivelyexpensive. Alternatively, modern servers have several onboard sensors that moni-tor the thermal conditions near key server components, such as the CPUs, disks,and I/O controllers. Provisioning all servers with environmental sensors can be anoverkill and an unnecessary increase in server cost. On the other hand, it is difficultto accurately estimate the room temperature and humidity from other onboardsensors. Figure 5 plots the temperature measured at various points along with theCPU utilization for an HP DL360 server with two CPUs. Air intake and outputtemperatures are measured with external sensors near the server’s front grill and itsback cover. It is evident from this figure that internal sensors are quickly affectedby changes in the server’s workload, rather than reflecting ambient conditions.
Intake air temperature (IAT) is important also because it can be used for audit-ing purposes. Server manufacturers and data center facility management contractsusually specify server operation conditions in terms of IAT. For example, the HPProLiant DL360 (G3) servers require IAT to range from 10 ◦ to 35 ◦C. It is therefore
Article submitted to Royal Society
Sensing Data Centers for Energy Efficiency 9
necessary to place external sensors at regular intervals across the servers’ air intakegrills to monitor IAT.
More importantly, the communication mechanism used to retrieve the collectedmeasurements is the other crucial aspect of the system design. Options in this caseare divided in two categories: in-band vs. out-of-band. In-band data collection routesmeasurements through the server’s operating system to the data center’s (wired)IP network. The advantage of this approach is that the network infrastructure is(in theory) available and the only additional hardware necessary are relatively in-expensive USB-based sensors. However, data center networks are in reality complexand fragile. They can be divided into several independent domains not connectedby gateways. Traversing network boundaries can lead to serious security violations.Finally, the in-band approach requires the host OS to be always on to performcontinuous monitoring. Doing so however would prevent turning off unused serversto save energy.
Out-of-band solutions use separate devices to perform the measurements and aseparate network to collect them. Self contained devices provide higher flexibilityin terms of sensor placement, while a separate network does not interfere with datacenter operations. However, deploying a wired network that would connect eachsensing point is undesirable as it would add thousands of network endpoints andmiles of cables to an already cramped data center.
For this reason, wireless networks are an attractive method for collecting thedesired environmental conditions. Moreover, networks based on IEEE 802.15.4 ra-dios [24] (or 15.4 for short) are more attractive compared to Bluetooth or WiFiradios. The key advantage is that 15.4 networks have simpler network stacks com-pared to the alternatives. This simplicity has multiple implications. First, sensingdevices need only a low-end MCU such as the MSP430 [62] thus reducing the totalcost of ownership and implementation complexity. Second, the combination of low-power 15.4 radios and low-power MCUs leads to lower overall power consumption.
At the same time, there are significant challenges when using 15.4 networksfor data center sensing, due to low data throughput and high packet loss rate. Themaximum transmission rate of a 15.4 link is 250 Kbps, while effective data rates areusually much lower due to MAC overhead and multi-hop forwarding. Furthermore,the lower transmission power� can lead to high bit error rates especially in RF-challenging environments such as data centers. In fact, a quantitative survey of theRF environment in a data center by Liang et al. showed that significant challengesexist [29]. The following paragraphs summarize the results of that study.
(ii) Data center RF environment
Data centers present a radio environment different from the ones that previoussensor network deployments faced. This is intuitively true as metals are the domi-nant materials in a data center. In addition to switches, servers, racks, and cables,other metallic obstacles include cooling ducts, power distribution systems, and cablerails. Given this departure from RF environments studied in the past (e.g., [56,68]),characterizing this environment is crucial to understanding the challenges it posesto reliable data collection protocols.
� The TI CC2420 802.15.4 radio we use, transmits at 0 dBm, or 1 mW [61].
Article submitted to Royal Society
10Jie Liu Andreas Terzis
Microsoft Research Johns Hopkins University
PRR (%)
Fre
quen
cy (
%)
0 10 20 30 40 50 60 70 80 90 100
010
2030
4050
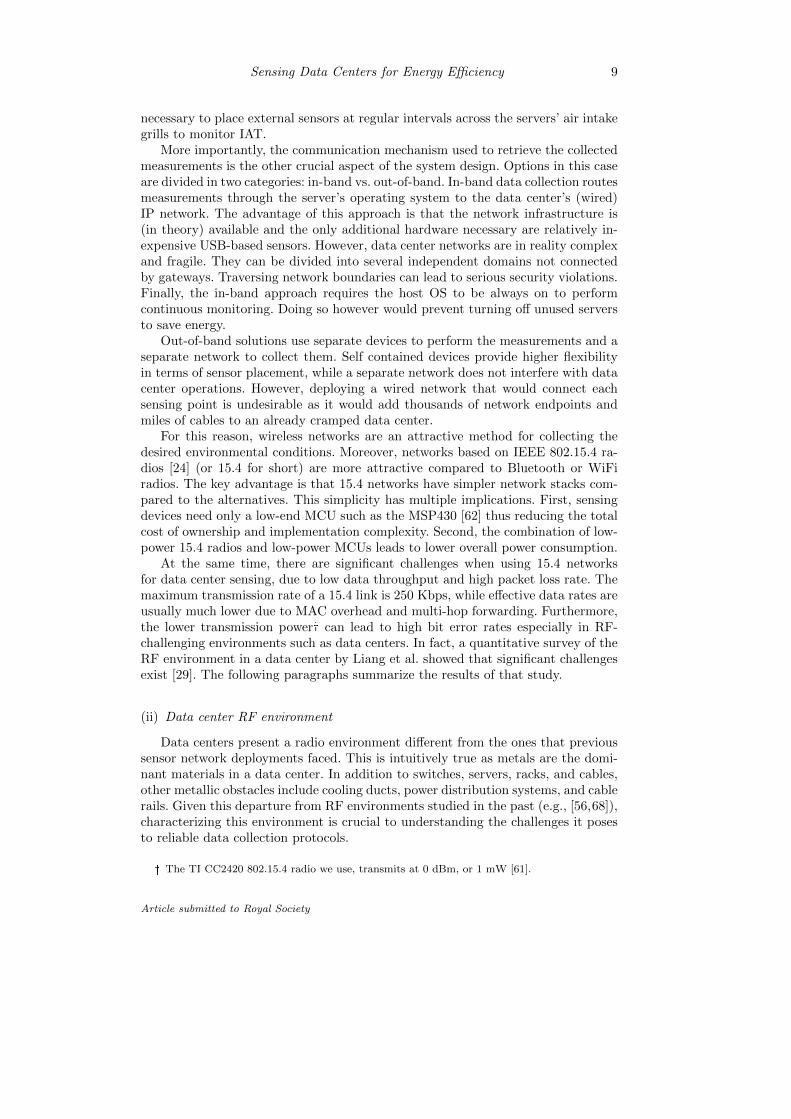
Figure 6. Distribution of packet reception ratios (PRR) across all the links from a 52-nodedata center site survey described in [29]. A large percentage of the network’s links exhibitnon-trivial loss rates.
For this reason Liang et al. performed a site survey by uniformly distributing 52motes in an production data center spanning an area of approximately 1,100 m2 [29].The motes were placed at the top of the racks, following a regular grid pattern withadjacent nodes approximately 10m from each other. During the experiment, allnodes took turns broadcasting 1,000 128-byte packets with an inter-packet intervalof 50 ms. All nodes used the 802.15.4 frequency channel 26 and transmitted theirpackets without performing any link-layer backoffs. Upon receiving a packet, eachreceiver logged the Received Signal Strength Indication (RSSI), the Link QualityIndicator (LQI), the packet sequence number, and whether the packet passed theCRC check.
We summarize the results from this survey below:Neighborhood Size. The survey found that on average 50% of all the nodes
are within a node’s communication range and that a node’s neighborhood caninclude as many as 65% of the network’s nodes. Moreover, the neighborhood size inproduction deployments will be significantly higher as they consist of hundreds ofnodes deployed over the same space. It is thereby imperative to devise mechanismsthat minimize packet losses due to contention and interference.
Packet Loss Rate. Figure 6 illustrates the distribution of packet receptionratios (PRR) over all the network links. While the majority of the links have lowloss rate (i.e., < 10%), a significant percentage of links experience high numberof losses. This observation suggests that even in dense networks data collectionprotocols must discover high-quality links to build end-to-end paths with low lossrates.
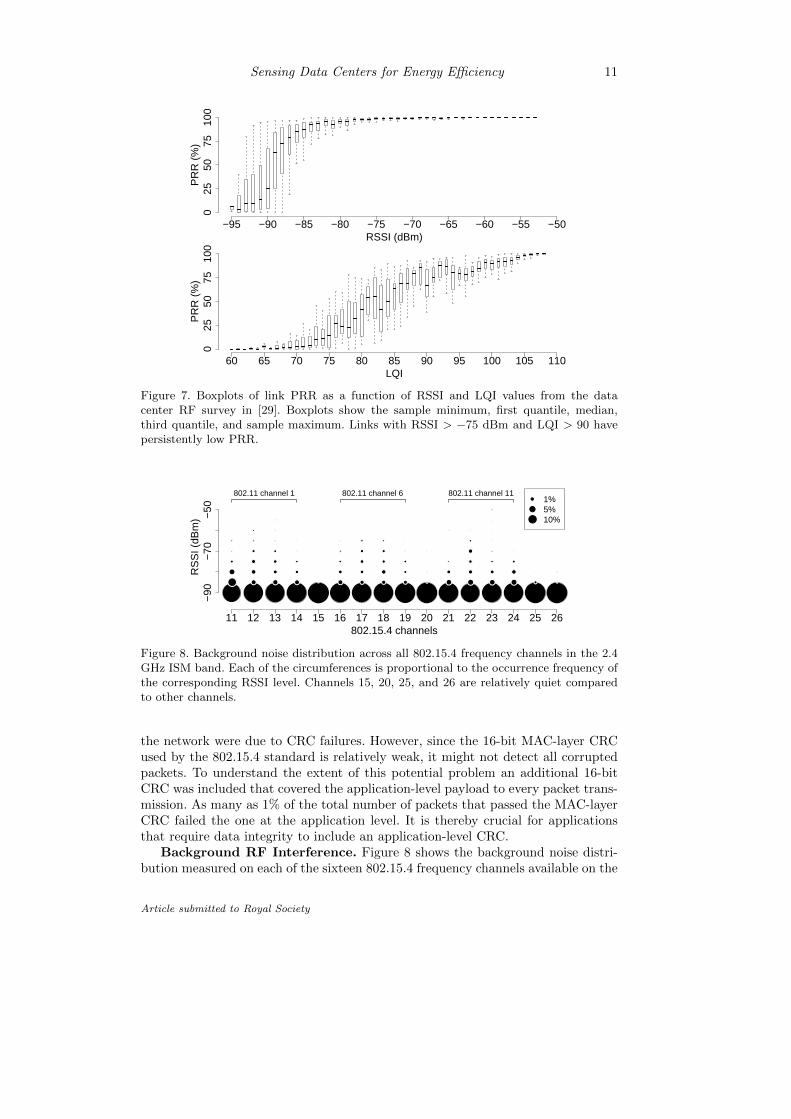
Link Qualities. Both RSSI and LQI measurements have been used to estimatelink qualities [57, 64]. RSSI measures the signal power for received packets, whileLQI is related to the chip error rate over the packet’s first eight symbols (802.15.4radios use a Direct Sequence Spread Spectrum encoding scheme). Indeed, the resultsshown in Figure 7 indicate that there is a strong correlation between RSSI/LQI andpacket reception rates. Based on these results, one can use an RSSI threshold of -75dBm to filter out potential weak links. Selecting this conservative threshold removesa large number of links. Fortunately, the network remains connected because eachnode has many neighbors with high RSSI links.
The results of the site survey also revealed that approximately 3.43% of losses in
Article submitted to Royal Society
Sensing Data Centers for Energy Efficiency 11
RSSI (dBm)
PR
R (
%)
−95 −90 −85 −80 −75 −70 −65 −60 −55 −50
025
5075
100
LQI
PR
R (
%)
60 65 70 75 80 85 90 95 100 105 110
025
5075
100
Figure 7. Boxplots of link PRR as a function of RSSI and LQI values from the datacenter RF survey in [29]. Boxplots show the sample minimum, first quantile, median,third quantile, and sample maximum. Links with RSSI > −75 dBm and LQI > 90 havepersistently low PRR.
802.15.4 channels
RS
SI (
dBm
)
●●
●
●
●
●
●
●
●
●
●
●
●
●
●
●
●
●
●
●
●
●
●
●
●
●
●
●
●
●
●
●
●
●
●
●
●
●
●
●
●
●
●
●
●
●
●
●
●
●
●
●
●
●
●
●
●
●
●
●
●
●
●
●
●
●
●
●
●
●
●
●
●
●
●
●
●
●
●
●
●
●
●
●
●
●
●
●
●
●
●
●
●
●
●
●
●
●
●
●
●
●
●
●
●
●
●
●
●
802.11 channel 1 802.11 channel 6 802.11 channel 11●
●
●
1%5%10%
11 12 13 14 15 16 17 18 19 20 21 22 23 24 25 26
−90
−70
−50
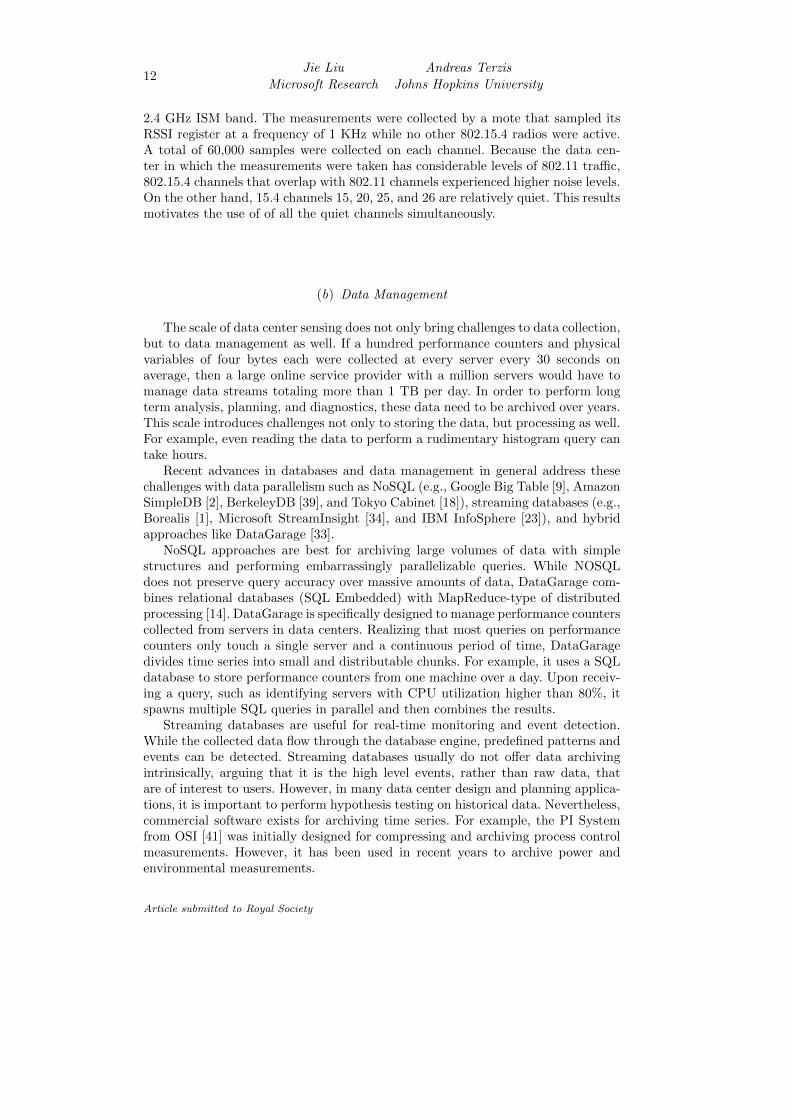
Figure 8. Background noise distribution across all 802.15.4 frequency channels in the 2.4GHz ISM band. Each of the circumferences is proportional to the occurrence frequency ofthe corresponding RSSI level. Channels 15, 20, 25, and 26 are relatively quiet comparedto other channels.
the network were due to CRC failures. However, since the 16-bit MAC-layer CRCused by the 802.15.4 standard is relatively weak, it might not detect all corruptedpackets. To understand the extent of this potential problem an additional 16-bitCRC was included that covered the application-level payload to every packet trans-mission. As many as 1% of the total number of packets that passed the MAC-layerCRC failed the one at the application level. It is thereby crucial for applicationsthat require data integrity to include an application-level CRC.
Background RF Interference. Figure 8 shows the background noise distri-bution measured on each of the sixteen 802.15.4 frequency channels available on the
Article submitted to Royal Society
12Jie Liu Andreas Terzis
Microsoft Research Johns Hopkins University
2.4 GHz ISM band. The measurements were collected by a mote that sampled itsRSSI register at a frequency of 1 KHz while no other 802.15.4 radios were active.A total of 60,000 samples were collected on each channel. Because the data cen-ter in which the measurements were taken has considerable levels of 802.11 traffic,802.15.4 channels that overlap with 802.11 channels experienced higher noise levels.On the other hand, 15.4 channels 15, 20, 25, and 26 are relatively quiet. This resultsmotivates the use of of all the quiet channels simultaneously.
(b) Data Management
The scale of data center sensing does not only bring challenges to data collection,but to data management as well. If a hundred performance counters and physicalvariables of four bytes each were collected at every server every 30 seconds onaverage, then a large online service provider with a million servers would have tomanage data streams totaling more than 1 TB per day. In order to perform longterm analysis, planning, and diagnostics, these data need to be archived over years.This scale introduces challenges not only to storing the data, but processing as well.For example, even reading the data to perform a rudimentary histogram query cantake hours.
Recent advances in databases and data management in general address thesechallenges with data parallelism such as NoSQL (e.g., Google Big Table [9], AmazonSimpleDB [2], BerkeleyDB [39], and Tokyo Cabinet [18]), streaming databases (e.g.,Borealis [1], Microsoft StreamInsight [34], and IBM InfoSphere [23]), and hybridapproaches like DataGarage [33].
NoSQL approaches are best for archiving large volumes of data with simplestructures and performing embarrassingly parallelizable queries. While NOSQLdoes not preserve query accuracy over massive amounts of data, DataGarage com-bines relational databases (SQL Embedded) with MapReduce-type of distributedprocessing [14]. DataGarage is specifically designed to manage performance counterscollected from servers in data centers. Realizing that most queries on performancecounters only touch a single server and a continuous period of time, DataGaragedivides time series into small and distributable chunks. For example, it uses a SQLdatabase to store performance counters from one machine over a day. Upon receiv-ing a query, such as identifying servers with CPU utilization higher than 80%, itspawns multiple SQL queries in parallel and then combines the results.
Streaming databases are useful for real-time monitoring and event detection.While the collected data flow through the database engine, predefined patterns andevents can be detected. Streaming databases usually do not offer data archivingintrinsically, arguing that it is the high level events, rather than raw data, thatare of interest to users. However, in many data center design and planning applica-tions, it is important to perform hypothesis testing on historical data. Nevertheless,commercial software exists for archiving time series. For example, the PI Systemfrom OSI [41] was initially designed for compressing and archiving process controlmeasurements. However, it has been used in recent years to archive power andenvironmental measurements.
Article submitted to Royal Society
Sensing Data Centers for Energy Efficiency 13
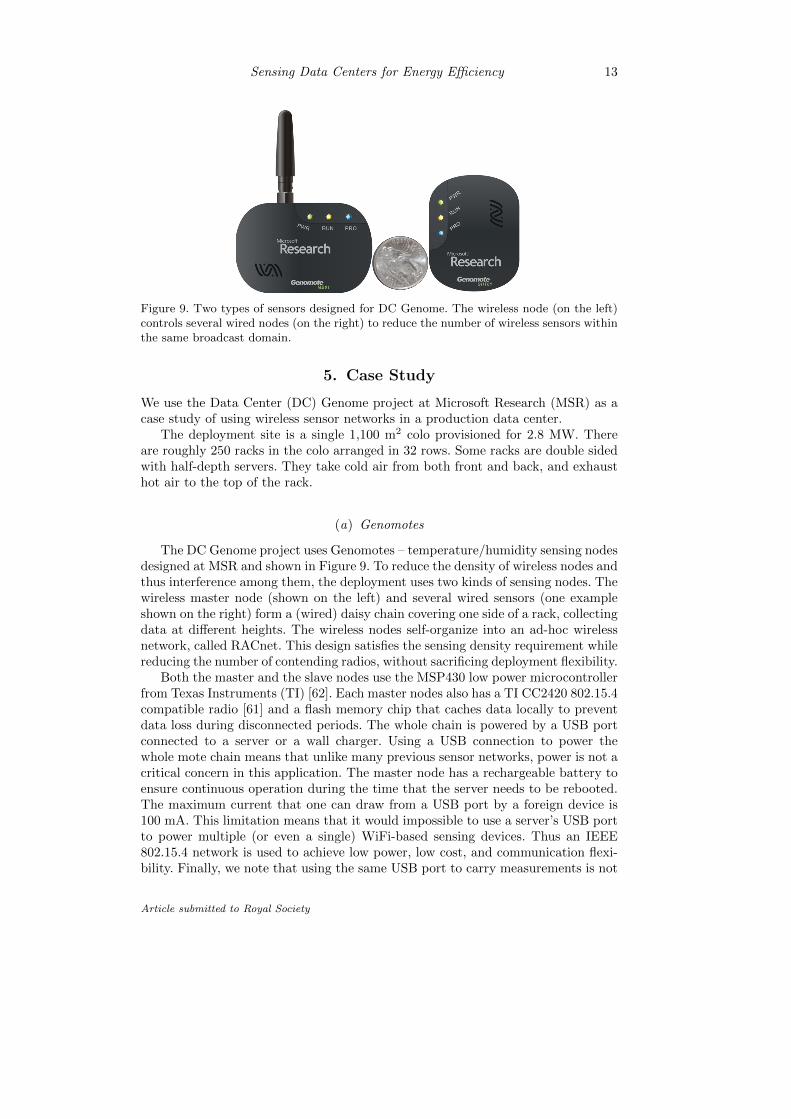
Figure 9. Two types of sensors designed for DC Genome. The wireless node (on the left)controls several wired nodes (on the right) to reduce the number of wireless sensors withinthe same broadcast domain.
5. Case Study
We use the Data Center (DC) Genome project at Microsoft Research (MSR) as acase study of using wireless sensor networks in a production data center.
The deployment site is a single 1,100 m2 colo provisioned for 2.8 MW. Thereare roughly 250 racks in the colo arranged in 32 rows. Some racks are double sidedwith half-depth servers. They take cold air from both front and back, and exhausthot air to the top of the rack.
(a) Genomotes
The DC Genome project uses Genomotes – temperature/humidity sensing nodesdesigned at MSR and shown in Figure 9. To reduce the density of wireless nodes andthus interference among them, the deployment uses two kinds of sensing nodes. Thewireless master node (shown on the left) and several wired sensors (one exampleshown on the right) form a (wired) daisy chain covering one side of a rack, collectingdata at different heights. The wireless nodes self-organize into an ad-hoc wirelessnetwork, called RACnet. This design satisfies the sensing density requirement whilereducing the number of contending radios, without sacrificing deployment flexibility.
Both the master and the slave nodes use the MSP430 low power microcontrollerfrom Texas Instruments (TI) [62]. Each master nodes also has a TI CC2420 802.15.4compatible radio [61] and a flash memory chip that caches data locally to preventdata loss during disconnected periods. The whole chain is powered by a USB portconnected to a server or a wall charger. Using a USB connection to power thewhole mote chain means that unlike many previous sensor networks, power is not acritical concern in this application. The master node has a rechargeable battery toensure continuous operation during the time that the server needs to be rebooted.The maximum current that one can draw from a USB port by a foreign device is100 mA. This limitation means that it would impossible to use a server’s USB portto power multiple (or even a single) WiFi-based sensing devices. Thus an IEEE802.15.4 network is used to achieve low power, low cost, and communication flexi-bility. Finally, we note that using the same USB port to carry measurements is not
Article submitted to Royal Society
14Jie Liu Andreas Terzis
Microsoft Research Johns Hopkins University
Time (days)
Net
wor
k Y
ield
(%
)
1 3 5 7 9 11 13 15 17 19 21
9798
9910
0
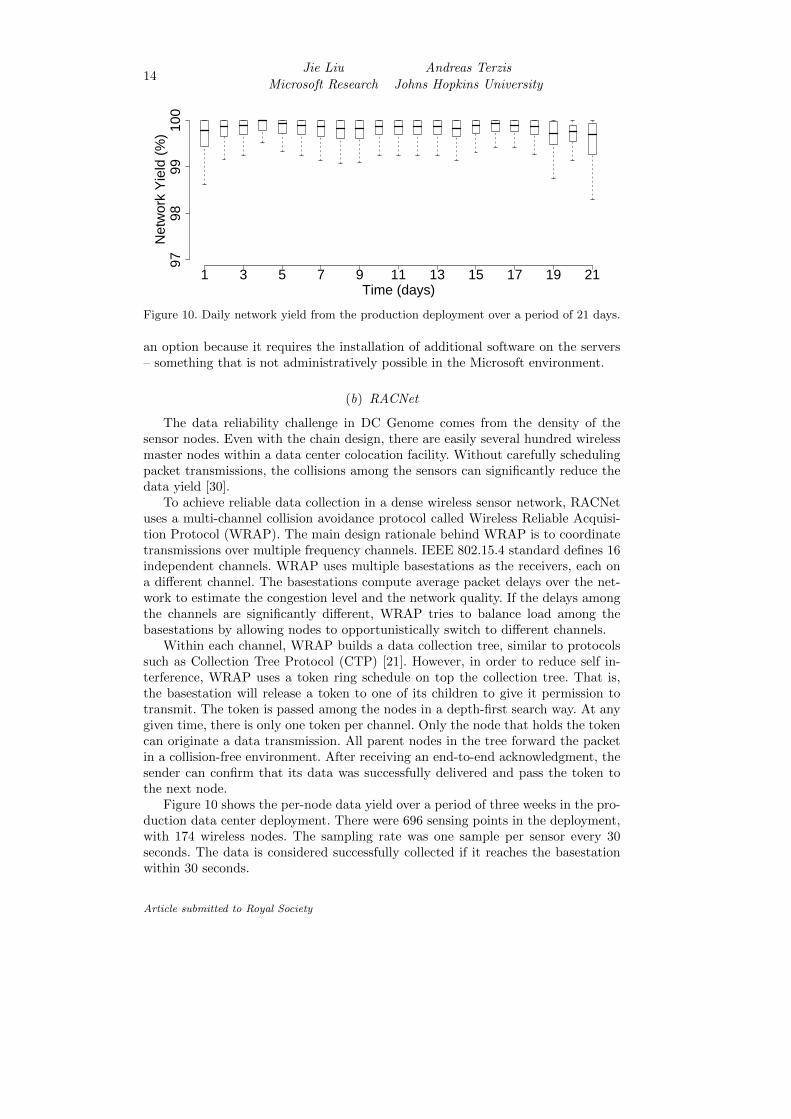
Figure 10. Daily network yield from the production deployment over a period of 21 days.
an option because it requires the installation of additional software on the servers– something that is not administratively possible in the Microsoft environment.
(b) RACNet
The data reliability challenge in DC Genome comes from the density of thesensor nodes. Even with the chain design, there are easily several hundred wirelessmaster nodes within a data center colocation facility. Without carefully schedulingpacket transmissions, the collisions among the sensors can significantly reduce thedata yield [30].
To achieve reliable data collection in a dense wireless sensor network, RACNetuses a multi-channel collision avoidance protocol called Wireless Reliable Acquisi-tion Protocol (WRAP). The main design rationale behind WRAP is to coordinatetransmissions over multiple frequency channels. IEEE 802.15.4 standard defines 16independent channels. WRAP uses multiple basestations as the receivers, each ona different channel. The basestations compute average packet delays over the net-work to estimate the congestion level and the network quality. If the delays amongthe channels are significantly different, WRAP tries to balance load among thebasestations by allowing nodes to opportunistically switch to different channels.
Within each channel, WRAP builds a data collection tree, similar to protocolssuch as Collection Tree Protocol (CTP) [21]. However, in order to reduce self in-terference, WRAP uses a token ring schedule on top the collection tree. That is,the basestation will release a token to one of its children to give it permission totransmit. The token is passed among the nodes in a depth-first search way. At anygiven time, there is only one token per channel. Only the node that holds the tokencan originate a data transmission. All parent nodes in the tree forward the packetin a collision-free environment. After receiving an end-to-end acknowledgment, thesender can confirm that its data was successfully delivered and pass the token tothe next node.
Figure 10 shows the per-node data yield over a period of three weeks in the pro-duction data center deployment. There were 696 sensing points in the deployment,with 174 wireless nodes. The sampling rate was one sample per sensor every 30seconds. The data is considered successfully collected if it reaches the basestationwithin 30 seconds.
Article submitted to Royal Society
Sensing Data Centers for Energy Efficiency 15
The median yield across all days was above 99.5%, while the lowest yield wasalways above 98%. This small packet loss is due to the fact that WRAP limits thenumber of end-to-end retransmission requests to five before it stops the attemptto recover the packet. Note that even though some data are not delivery by thedeadline, they are saved locally in the master nodes’ flash memory, and are retrievedat a later time.
(c) Data compression and analysis
A key insight when dealing with massive time-series datasets such as thosecollected in DC Genome is that not all queries look for precise answers. For example,when computing histograms, or performing trending analyses and classifications,users can often tolerate a certain degree of inaccuracy in exchange for promptanswers.
Cypress [52] is a system designed to compress and archive time series by de-composing them in both the frequency and time domains seeking for sparse repre-sentations. The decomposed time series are called trickles. An interesting featureof Cypress is that common queries such as histograms and correlations can be an-swered directly using compressed data. Furthermore, by using trickles, the searchspace of signals with high pairwise correlation can be drastically reduced, acceler-ating processing of such queries [38].
(d) Using The Data
We give one example of how the data collected by RACNet is used for analyzingdata center operations.
Thermal runaway is a critical operation parameter, which refers to the temper-ature changes when a data center loses cool air supply. Predicting thermal runawaytemperatures through simulations is very hard because their accuracy depends onthe thermal properties of IT equipment that are difficult to obtain. On the otherhand, RACNet collected actual thermal runaway data, during an instance when aCRAC was temporarily shut down for maintenance.
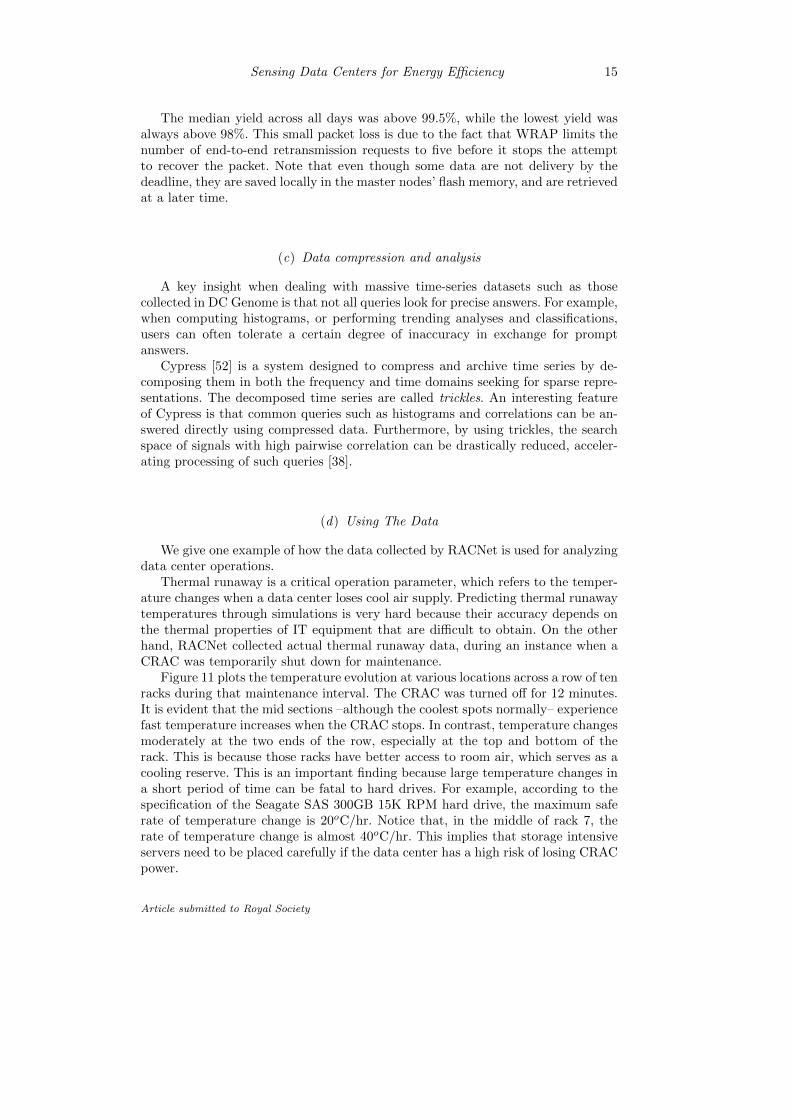
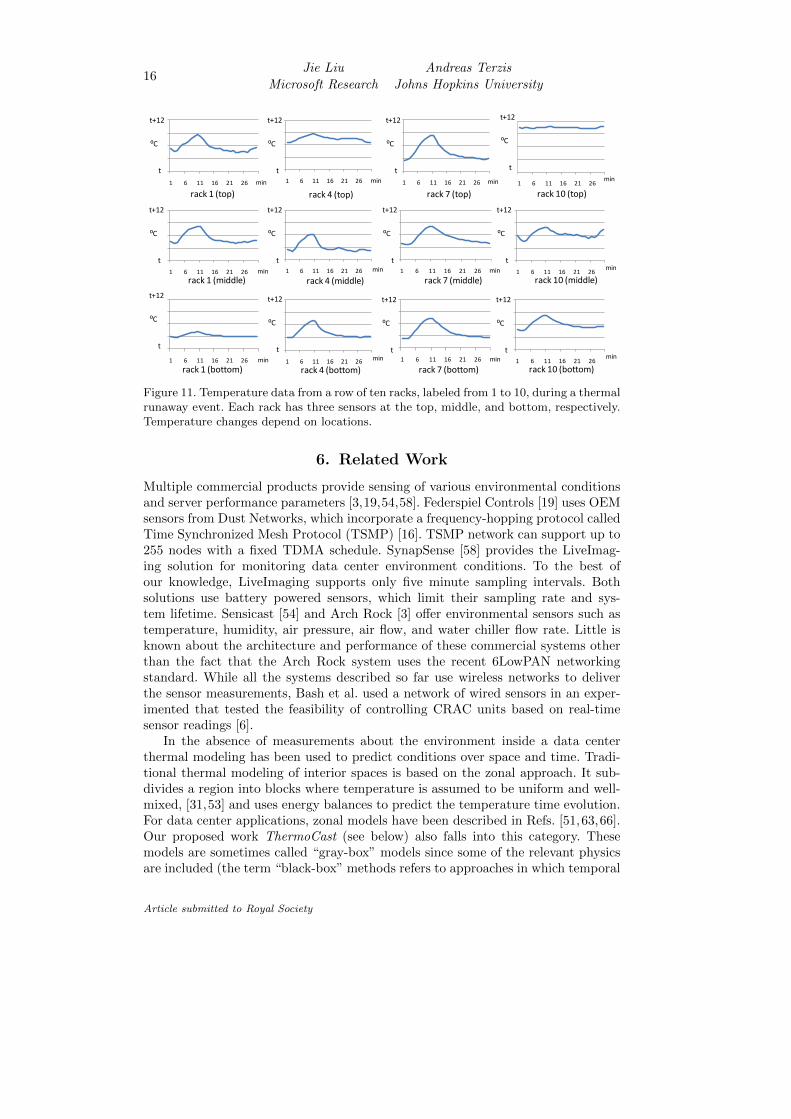
Figure 11 plots the temperature evolution at various locations across a row of tenracks during that maintenance interval. The CRAC was turned off for 12 minutes.It is evident that the mid sections –although the coolest spots normally– experiencefast temperature increases when the CRAC stops. In contrast, temperature changesmoderately at the two ends of the row, especially at the top and bottom of therack. This is because those racks have better access to room air, which serves as acooling reserve. This is an important finding because large temperature changes ina short period of time can be fatal to hard drives. For example, according to thespecification of the Seagate SAS 300GB 15K RPM hard drive, the maximum saferate of temperature change is 20oC/hr. Notice that, in the middle of rack 7, therate of temperature change is almost 40oC/hr. This implies that storage intensiveservers need to be placed carefully if the data center has a high risk of losing CRACpower.
Article submitted to Royal Society
16Jie Liu Andreas Terzis
Microsoft Research Johns Hopkins University
58
63
68
73
78
1 6 11 16 21 26
58
63
68
73
78
1 6 11 16 21 26
58
63
68
73
78
1 6 11 16 21 26
58
63
68
73
78
1 6 11 16 21 26
58
63
68
73
78
1 6 11 16 21 26
58
63
68
73
78
1 6 11 16 21 26
58
63
68
73
78
1 6 11 16 21 26
58
63
68
73
78
1 6 11 16 21 26
58
63
68
73
78
1 6 11 16 21 26
58
63
68
73
78
1 6 11 16 21 26
58
63
68
73
78
1 6 11 16 21 26
58
63
68
73
78
1 6 11 16 21 26
t
t+12
⁰C
t
t+12
⁰C
t
t+12
⁰C
t
t+12
⁰C
t
t+12
⁰C
t
t+12
⁰C
t
t+12
⁰C
t
t+12
⁰C
t
t+12
⁰C
t
t+12
⁰C
t
t+12
⁰C
t
t+12
⁰C
rack 1 (top)
min
min
min
min
min
min
min
min
min
min
min
min
rack 1 (middle)
rack 1 (bottom)
rack 4 (top)
rack 4 (middle)
rack 4 (bottom)
rack 7 (top)
rack 7 (middle)
rack 7 (bottom)
rack 10 (top)
rack 10 (middle)
rack 10 (bottom)
Figure 11. Temperature data from a row of ten racks, labeled from 1 to 10, during a thermalrunaway event. Each rack has three sensors at the top, middle, and bottom, respectively.Temperature changes depend on locations.
6. Related Work
Multiple commercial products provide sensing of various environmental conditionsand server performance parameters [3,19,54,58]. Federspiel Controls [19] uses OEMsensors from Dust Networks, which incorporate a frequency-hopping protocol calledTime Synchronized Mesh Protocol (TSMP) [16]. TSMP network can support up to255 nodes with a fixed TDMA schedule. SynapSense [58] provides the LiveImag-ing solution for monitoring data center environment conditions. To the best ofour knowledge, LiveImaging supports only five minute sampling intervals. Bothsolutions use battery powered sensors, which limit their sampling rate and sys-tem lifetime. Sensicast [54] and Arch Rock [3] offer environmental sensors such astemperature, humidity, air pressure, air flow, and water chiller flow rate. Little isknown about the architecture and performance of these commercial systems otherthan the fact that the Arch Rock system uses the recent 6LowPAN networkingstandard. While all the systems described so far use wireless networks to deliverthe sensor measurements, Bash et al. used a network of wired sensors in an exper-imented that tested the feasibility of controlling CRAC units based on real-timesensor readings [6].
In the absence of measurements about the environment inside a data centerthermal modeling has been used to predict conditions over space and time. Tradi-tional thermal modeling of interior spaces is based on the zonal approach. It sub-divides a region into blocks where temperature is assumed to be uniform and well-mixed, [31,53] and uses energy balances to predict the temperature time evolution.For data center applications, zonal models have been described in Refs. [51,63,66].Our proposed work ThermoCast (see below) also falls into this category. Thesemodels are sometimes called “gray-box” models since some of the relevant physicsare included (the term “black-box” methods refers to approaches in which temporal
Article submitted to Royal Society
Sensing Data Centers for Energy Efficiency 17
data mining is used to generate thermal response models without any reference tothe underlying physics [37,45,59]).
Often, it is also important to predict the spatial patterns of cooling airflow,especially when buoyant motions occur, or when highly three-dimensional currentsresult from aggregate effects of many fans. Thus, modeling of airflow and heattransfer in data centers using Computational Fluid Dynamics and Heat Transfer(CFD/HT) has played an increasingly important role in their design and ther-mal optimization (e.g., [17, 44, 49, 50, 55]). Rambo & Joshi [50] provide a reviewof modeling approaches of the various layouts and tools employed. Most modelsrely on standard Reynolds averaged Navier-Stokes solvers with the k− ε turbulencemodel to account for turbulence. A detailed analysis coupled with multi-variableoptimization is presented in Ref. [8]. The objective function of their optimizationprocess was to minimize the rack inlet air temperature. Prior works often motivatethe simulations by the need to gain detailed insights into flow and thermal stateinside data centers, since little actual data is normally available. Also, they sim-ulate steady-state conditions and do not take into account time-dependencies anddynamical effects.
Responsive thermal monitoring will enable us to understand and respond tomachine room dynamics at time and space scales not previously realized. Previousstudies of the interaction between workload placement, machine configuration, andthe data center heat load have ignored that data centers are complex thermo-fluidsystems. Current approaches use the global energy balance—inputs and outputsat nodes/chassis and the CRAC—to characterize the entire machine room. Initialefforts examined the contribution of components by permutation of components [7],or by modeling the data center as a linear combination of zones [36]. Some systemsenhance global energy with heat-flow models across individual nodes [60], includinga circuit representations of nodes [67]. Several represent the machine room as a setof chassis and model interactions among them as a cross inference problem [42,66].Some insight into spatial properties can be realized by creating thermal maps usingmachine learning techniques applied to temperature data collected inside processingnodes [35]. Systems that do use fluid and heat models have explored configurationsoffline to determine the effect of failed components in a single rack [13] or machineroom [7].
The relationship between workload placement, performance, and total energyuse is poorly understood. The simplest issues are controversial, e.g. how does oneplace a fixed set of jobs across racks in order to minimize overall power consumption.Intuition dictates that since each active rack has fixed power costs (including PDUsand networking) jobs should be placed densely on racks to minimize fixed costs.Heat-flow based on global energy balance [66] has this property. However, measure-ments have shown that low-density job placement across many racks reduces nodetemperature and, thus, decreases cooling load and improves performance [27]. Webelieve that both of these guidelines apply, but to different thermal configurationsthat can only be resolved by sensing and modeling. Moreover, this example showshow the goals of reducing compute power and cooling power conflict at times andmotivates the need for unified power management for all components in the datacenter.
Modeling and sensing will provide insight into the spatial and temporal distribu-tion of energy and how to resolve the tension between cooling and performance. The
Article submitted to Royal Society
18Jie Liu Andreas Terzis
Microsoft Research Johns Hopkins University
potential savings are large and many different factors interact to govern power us-age. Under certain conditions, active management of data centers at runtime savesup to 20% [43], dynamically sizing the allocation of nodes saves up to 20% [28],shaping/scaling workload on each node can save 20% [20], and an optimized datacenter can be more than 50% [46] more efficient. Because the heating and cool-ing system is turbulent, small changes can have large effects on energy draw andsystem performance [7]. Sensing and modeling will allow us to uncover the smallconfiguration and workload modifications to realize energy savings.
7. Summary
The rapid growth in cloud services coupled with the large energy consumption ofexisting data centers has motivated data center operators to optimize their oper-ations. In this paper we argue that one of the underlying reasons for the existinginefficient use of energy is the lack of visibility into a data center’s operating con-ditions. However, recent innovations in wireless sensor networks can lift the veilof uncertainty, providing streams of measurements with high temporal and spatialfidelities. We present the requirements for such sensor networks and outline someof the technical challenges data center sensing introduces. Finally, we present DCGenome, an end-to-end data center sensing system deployed at a Microsoft datacenter.
References
[1] D. J. Abadi, Y. Ahmad, M. Balazinska, U. Cetintemel, M. Cherniack, J.-H. Hwang,W. Lindner, A. S. Maskey, A. Rasin, E. Ryvkina, N. Tatbul, Y. Xing, and S. Zdonik.The design of the borealis stream processing engine. In 2nd Biennial Conference onInnovative Data Systems Research (CIDR), 2005.
[2] Amazon Web Services LLC. Available from: http://aws.amazon.com/simpledb/, 2011.
[3] Arch Rock Corporation. Arch Rock Energy Optimizer. Available at: http://www.
archrock.com/downloads/datasheet/AREO_DS_web.pdf, 2010.
[4] M. Armbrust, A. Fox, R. Griffith, A. D. Joseph, R. H. Katz, A. Konwinski, G. Lee,D. A. Patterson, A. Rabkin, I. Stoica, and M. Zaharia. Above the clouds: A berkeleyview of cloud computing. Technical Report UCB/EECS-2009-28, EECS Department,University of California, Berkeley, Feb 2009.
[5] L. A. Barroso and U. Holzle. The case for energy-proportional computing. IEEEComputer, 40:33–37, December 2007.
[6] C. Bash, C. Patel, and R. Sharma. Dynamic thermal management of air cooled datacenters. In The Tenth Intersociety Conference on Thermal and ThermomechanicalPhenomena in Electronics Systems (ITHERM), pages 452–461, June 2006.
[7] A. H. Beitelmal and C. D. Patel. Thermo-fluids provisioning of a high performance highdensity data center. Distributed and Parallel Databases, 21:227–238, 2007.
[8] S. Bhopte, D. Agonafer, R. Schmidt, and B. Sammakia. Optimization of data centerroom layout to minimize rack inlet air temperature. Transactions of the ASME, 128:380–387, 2006.
[9] F. Chang, J. Dean, S. Ghemawat, W. C. Hsieh, D. A. Wallach, M. Burrows, T. Chandra,A. Fikes, and R. E. Gruber. Bigtable: A distributed storage system for structured data.In Seventh Symposium on Operating System Design and Implementation (OSDI), 2006.
Article submitted to Royal Society
Sensing Data Centers for Energy Efficiency 19
[10] J. Chase, D. Anderson, P. Thakar, A. Vahdat, and R. Doyle. Managing energy andserver resources in hosting centers. In Proceedings of the ACM Symposium on OperatingSystems Principles (SOSP), 2001.
[11] G. Chen, W. He, J. Liu, S. Nath, L. Rigas, L. Xiao, and F. Zhao. Energy-aware serverprovisioning and load dispatching for connection-intensive internet services. In Proceed-ings of the 5th USENIX Symposium on Networked Systems Design and Implementation(NSDI), pages 337–350, Berkeley, CA, USA, 2008. USENIX Association.
[12] K. Chen, C. Guo, H. Wu, J. Yuan, Z. Feng, Y. Chen, S. Lu, and W. Wu. Generic andautomatic address configuration for data center networks. In ACM SIGCOMM, 2010.
[13] J. Choi, Y. Kim, A. Sivasubramaniam, J. Srebric, Q. Wang, and J. Lee. A CFD-based tool for studying temperature in rack-mounted servers. IEEE Transactions onComputers, 57, 2008.
[14] J. Dean and S. Ghemawat. MapReduce: Simplified Data Processing on Large Clusters.In Sixth Symposium on Operating System Design and Implementation, 2004.
[15] R. Doyle, J. Chase, O. Asad, W. Jin, and A. Vahdat. Model-Based Resource Provi-sioning in a Web Service Utility. In In Proceedings of the 4th USENIX Symposium onInternet Technologies and Systems, 2003.
[16] I. Dust Networks. Technical overview of time synchronized mesh protocol(tsmp). Available at: http://www.dustnetworks.com/sites/default/files/TSMP_
Whitepaper.pdf, 2006.
[17] E.Samadiani, Y. Joshi, and F. Mistree. The thermal design of a next generation datacenter: A conceptual exposition. Journal of Electronic Packaging, 130, 2008.
[18] FAL Labs. Available from: http://fallabs.com/tokyocabinet/, 2011.
[19] Federspiel Controls. Optimizing data center uptime with dynamic cooling.
[20] V. W. Freeh, N. Kappiah, D. K. Lowenthal, and T. K. Bletsch. Just-in-time dynamicvoltage scaling: Exploiting inter-node slack to save energy in MPI programs. Journalof Parallel and Distributed Computing, 68(9):1175–1185, Sept. 2008.
[21] O. Gnawali, R. Fonseca, K. Jamieson, D. Moss, and P. Levis. Collection Tree Protocol.In Proceedings of the 7th ACM Conference on Embedded Networked Sensor Systems(SenSys), pages 1–14, Nov 2009.
[22] T. Heath, B. Diniz, E. V. Carrera, W. M. Jr., and R. Bianchini. Energy conservationin heterogeneous server clusters. In Proceedings of ACM SIGPLAN Symposium onPrinciples and Practice of Parallel Programming (PPoPP), 2005.
[23] IBM Corp. InfoSphere Streams. Avaiblable from: http://www-01.ibm.com/software/data/infosphere/streams/, 2011.
[24] IEEE Standard for Information technology – Telecommunications and information ex-change between systems – Local and metropolitan area networks. Specific requirements– Part 15.4: Wireless Medium Access Control (MAC) and Physical Layer (PHY) Spec-ifications for Low-Rate Wireless Personal Area Networks (LR-WPANs). Available athttp://www.ieee802.org/15/pub/TG4.html, May 2003.
[25] W. P. T. IV and K. G. Brill. Tier classifications define site infrastructure performance.Technical report, Uptime Institute, White Paper, 2008.
[26] A. Kansal, F. Zhao, J. Liu, N. Kothari, and A. Bhattacharya. Virtual machine powermetering and provisioning. In ACM Symposium on Cloud Computing (SOCC), 2010.
[27] K. Karavanic. Scalable methods for performance and power data collection and anal-ysis. In Los Alamos Computer Science Symposium, 2009.
[28] J. Leverich and C. Kozyrakis. On the energy (in)efficiency of hadoop clusters. InProceedings of HotPower, 2009.
[29] C.-J. M. Liang, J. Liu, L. Luo, A. Terzis, and F. Zhao. RACNet: a high-fidelitydata center sensing network. In Proceedings of the 7th ACM Conference on EmbeddedNetworked Sensor Systems (Sensys), pages 15–28, 2009.
Article submitted to Royal Society
20Jie Liu Andreas Terzis
Microsoft Research Johns Hopkins University
[30] C.-J. M. Liang, J. Liu, L. Luo, A. Terzis, and F. Zhao. Racnet: A high-fidelity datacenter sensing network. In Proceedings of The 7th ACM Conference on Embedded Net-worked Sensor Systems (SenSys 2009), 2009.
[31] P. Linden. The fluid mechanics of natural ventilation. Annual Review of Fluid Me-chanics, 31:201–238, 1999.
[32] J. Liu. Automatic server to circuit mapping with the red pills. In Workshop on PowerAware Computing and Systems (HotPower ’10), 2010.
[33] C. Loboz, S. Smyl, , and S. Nath. DataGarage: Warehousing Massive PerformanceData on Commodity Servers. In 36th International Conference on Very Large DataBases, Very Large Data Bases (VLDB), 2010.
[34] Microsoft Corp. Microsoft StreamInsight. Available from: http://msdn.microsoft.com/en-us/library/ee362541.aspx, 2011.
[35] J. Moore, J. Chase, and P. Ragananthan. Consil: Low-cost thermal mapping of datacenters. In Workshop on Tackling Computer Systems Problems with Machine LearningTechniques, 2006.
[36] J. Moore, J. Chase, P. Ranganathan, and R. Sharma. Making scheduling ”cool”:temperature-aware workload placement in data centers. In USENIX Annual TechnicalConference, 2005.
[37] J. Moore, J. S. Chase, and P. Ranganathan. Weatherman: Automated, online andpredictive thermal mapping and management for data centers. In Proceedings of the2006 IEEE International Conference on Autonomic Computing, 2006.
[38] A. Mueen, S. Nath, and J. Liu. Fast approximate correlation for massive time-seriesdata. In Proceedings of the 2010 ACM SIGMOD international conference on Manage-ment of data (SIGMOD), 2010.
[39] Oracle. Oracle Berkeley DB 11g. Available from: http://www.oracle.com/
technetwork/database/berkeleydb/overview/index.html.
[40] T. O’Reilly. What is Web 2.0: Design Patterns and Business Models for the NextGeneration of Software. Communications & Strategies Magazine, (1), 2007.
[41] OSISoft. The PI System. Available from: http://www.osisoft.com/
software-support/what-is-pi/What_Is_PI.aspx, 2011.
[42] E. Pakbaznia, M. Ghasemazar, and M. Pedram. Temperature-aware dynamic resourceprovisioning in a power-optimized datacenter. In Proceedings of Design, Automation,and Test in Europe, 2010.
[43] L. Parolini, N. Tolia, B. Sinopoli, and B. H. Krogh. A cyber-physical systems approachto energy management in data centers. In Proceedings of the International Conferenceon Cyber-Physical Systems, 2010.
[44] C. Patel, C. E. Bash, C. Belady, L. Stahl, and D. Sullivan. Computational fluiddynamics modeling of high compute density data centers to assure system inlet airspecifications. In Proceedings of IPACK, 2001.
[45] D. Patnaik, M. Marwah, R. Sharma, and N. Ramakrishnan. Sustainable operationand management of data center chillers using temporal data mining. In Proceedings ofKDD, 2009.
[46] S. Pelley, D. Meisner, T. F. Wenisch, and J. W. VanGilder. Understanding and ab-stracting total data center power. In In Proceedings of the Workshop on Energy EfficientDesign, 2009.
[47] E. Pinheiro, W.-D. Weber, and L. A. Barroso. Failure trends in a large disk drive pop-ulation. In Proceedings of the 5th USENIX Conference on File and Storage Technologies(FAST 2007), February 2007.
[48] A. Qureshi, R. Weber, H. Balakrishnan, J. Guttag, and B. Maggs. Cutting the electricbill for internet-scale systems. In Proceedings of ACM SIGCOMM 2009, New York, NY,USA, 2009. ACM.
Article submitted to Royal Society
Sensing Data Centers for Energy Efficiency 21
[49] J. Rambo and Y. Joshi. Reduced order modeling of steady turbulent flows using thepod. In Proceedings of HT2005, ASME, 2005.
[50] J. Rambo and Y. Joshi. Modeling of data center airflow and heat transfer: State ofthe art and future trends. Distributed and Parallel Databases, 21:193–225, 2007.
[51] L. Ramos and R. Bianchini. C-Oracle: Predictive thermal management for data cen-ters. In Proceedings of the 14th IEEE International Symposium on High PerformanceComputer Architecture (HPCA), 2008.
[52] G. Reeves, J. Liu, S. Nath, and F. Zhao. Managing massive time series streams withmulti-scale compressed trickles. In VLDB’2009: Proceedings of 35th Conference on VeryLarge Data Bases, August 2009.
[53] P. Riederer, D. Marchio, J. Visie, A. Husaunndee, and R. Lahrech. Room thermal mod-elling adapted to the test of hvac control system. Building and Environment, 37:777–790,2002.
[54] Sensicast, Inc. Sensinet. Available at: http://www.sensicast.com/data_center.php.
[55] A. Shah, V. Carey, C. Bash, and C. Patel. Exergy analysis of data center thermalmanagement systems. Journal of Heat Transfer, 130, 2008.
[56] K. Srinivasan, P. Dutta, A. Tavakoli, and P. Levis. Some implications of low powerwireless to IP networking. In HotNets ’06, Nov. 2006.
[57] K. Srinivasan and P. Levis. RSSI is Under Appreciated. In EmNets ’06, May 2006.
[58] SynapSense Corporation. LiveImaging: Wireless Instrumentation Solutions. Availableat: http://www.synapsense.com/, 2008.
[59] Q. Tang, S. K. S. Gupta, and G. Varsamopoulos. Energy-efficient thermal-aware taskscheduling for homogeneous high-performance computing data centers: A cyber-physicalapproach. IEEE Transactions on Parallel and Distributed Systems, 19:1458–1472, 2008.
[60] Q. Tang, T. Mukherjee, S. K. S. Gupta, and P. Cayton. Sensor-based fast thermalevaluation model for energy efcient high-performance datacenters. In Intelligent Sensingand Information Processing, 2006.
[61] Texas Instruments. 2.4 GHz IEEE 802.15.4 / ZigBee-ready RF Transceiver. Availableat http://www.chipcon.com/files/CC2420_Data_Sheet_1_3.pdf, 2006.
[62] Texas Instruments. MSP430x1xx Family User’s Guide (Rev. F). Available at http:
//www.ti.com/litv/pdf/slau049f, 2006.
[63] T.Heath, A.P.Centeno, P.George, L.Ramos, Y.Jaluria, and R. Bianchini. Mercury andfreon: Temperature emulation and management for server systems. In Proceedings ofASPLOS, 2006.
[64] TinyOS. MultiHopLQI. Available from: http://www.tinyos.net/tinyos-1.x/tos/lib/MultiHopLQI, 2004.
[65] U.S. Environmental Protection Agency. EPA Report on Server and Data Center En-ergy Efficiency: ENERGY STAR Program, 2007.
[66] N. Vasic, T. Scherer, and W. Schott. Thermal-aware workload scheduling for energyefficient data centers. In Proceedings of International Conference on Autonomic Com-puting, 2010.
[67] L. Wang, G. von Laszewski, J. Dayal, X. He, A. J. Younge, and T. R. Furlani. Towardsthermal aware workload scheduling in a data center. In Proceedings of the Symposiumon Pervasive Systems, Algorithms and Networks, 2009.
[68] J. Zhao and R. Govindan. Understanding Packet Delivery Performance In DenseWireless Sensor Networks. In Sensys ’03, 2003.
Article submitted to Royal Society