Embed Size (px)
Citation preview
Sensible – DELIVERABLE
D5.4 Energy market interaction of business models
This project has received funding from the European Union's Horizon 2020 research and
innovation programme under Grant Agreement No. 645963.
Deliverable number: D5.4
Due date: 31.12.2017
Nature1: R
Dissemination Level1: PU
Work Package: 5
Lead Beneficiary: Empower
Contributing Beneficiaries: EDP, INDRA, INESC, USE
Editor(s): Olli Kilkki, Empower
Reviewer(s): André Leonide, Siemens
1 Nature: R = Report, P = Prototype, D = Demonstrator, O = Other
Dissemination level PU = Public PP = Restricted to other programme participants (including the Commission Services) RE = Restricted to a group specified by the consortium (including the Commission Services) CO = Confidential, only for members of the consortium (including the Commission Services) Restraint UE = Classified with the classification level "Restraint UE" according to Commission Deci-sion 2001/844 and amendments Confidential UE = Classified with the mention of the classification level "Confidential UE" according to Commission Decision 2001/844 and amendments Secret UE = Classified with the mention of the classification level "Secret UE" according to Commis-sion Decision 2001/844 and amendments
DOCUMENT HISTORY
D5 4_SENSIBLE_Deliverable_final
Version Date Description
0.10 14.06.2015 First version by EMP
0.20 29.1.2016 Reviewed ToC by EMP
0.30 26.4.2016 Detailed planning by EMP
0.40 26.8.2016 Sections 4.2 and 4.3 by USE
0.50 14.9.2016 Sections 4.1 and 5.2 by EDP/Indra
0.60 24.2.2017 Sections 2, 3 and 5 by EMP
1.0 27.2.2017 Final version by EMP
1.1 14.03.2017 Review done for first version by M.
Metzger (Siemens AG)
1.2 29.3.2017 Updates based on the review by EMP
and EDP
1.3 3.11.2017 Initial second version by EMP
1.4 17.11.2017 Final version by EMP
1.5 27.11.2017 Included further energy market contribu-
tions from EDP
1.6 7.12.2017 Updated based on review by André Le-
onide (Siemens AG)
TABLE OF CONTENT
C O N F I D E N T I A L until public release by the SENSIBLE project consortium
D5 4_SENSIBLE_Deliverable_final
1 Introduction 5
1.1 Purpose and Scope of the Deliverable ......................................... 5
1.2 References ..................................................................................... 6
1.3 Acronyms ..................................................................................... 10
2 State-of-the-Art of the energy markets 11
2.1 Market participants ...................................................................... 11
2.2 Market levels ................................................................................ 14
2.3 Energy market in the European Union ....................................... 27
3 Business model framework overview 41
3.1 Framework overview ................................................................... 41
3.2 Overview of the stakeholders ..................................................... 42
4 Enabling new energy market services 44
4.1 A framework for new electricity market products ..................... 44
4.2 Automatic market decision system ............................................ 51
4.3 Definition and design of new ancillary grid services ................ 54
5 Energy market connectivity of the business models 57
5.1 Connected energy market processes......................................... 57
5.2 Market interfaces ......................................................................... 65
6 Market structure development to enable new business models 68
6.1 Smart Building services .............................................................. 68
6.2 Microgrids and community services .......................................... 69
6.3 Distribution grid services ............................................................ 70
7 Conclusions 71
EXECUTIVE SUMMARY
D5 4_SENSIBLE_Deliverable_final 4/71
Executive Summary
This deliverable studies the connectivity and function of storage enabled energy busi-
ness models in the energy markets and is the outcome of task 5.4 Energy market inter-
action of business models. The results highlighted in this document continue the work of
deliverables D5.1 Storage enabled energy business model framework for demonstration
and D5.2a Storage enabled energy business models (preliminary analysis). D5.1 intro-
duced the key value propositions and stakeholders of the developed 11 business models
and in D5.2a the strengths, weaknesses and business environment specific aspects of
the business models were analyzed. The goal of this deliverable is to show how the
developed business models could interact with the energy markets.
D5.4 provides an overview of the market connectivity issues and requirements, and will
analyze the different market connectivity issues from the demonstrators’ point of views
in more detail. In addition, solutions for market connectivity are proposed and new market
structures will be analyzed that could potentially stimulate and foster the introduction of
new energy business models.
In this document, the energy market connectivity requirements were divided into five
categories: 1. Balance management; 2. Energy measurement; 3. Balance settlement; 4.
Customer information management and billing; 5. Trading. It was identified that the dy-
namic and distributed nature of the business models put pressure on the market partici-
pation scenarios. The new business models introduce new market players (consumers,
prosumers, buildings etc.) that will interact either locally amongst themselves or at the
centralized markets. Either way, this requires new approach to enable more transactive
customer information management, formation of balancing areas and trading frame-
works. The new business models also have more distributed resources that will be con-
trolled. This affects how energy measurement should be managed and how the meas-
urement data is handled amongst the market parties.
However, the energy market structures are currently under transition and several aspects
have to be addressed when considering the implementation of the business models. The
energy market transition affects the business model cases in multiple domains such as
the smart building services, microgrids and community services and distribution grid ser-
vices.
INTRODUCTION
D5 4_SENSIBLE_Deliverable_final 5/71
1 Introduction
1.1 Purpose and Scope of the Deliverable
This deliverable is the outcome of the task 5.4 Energy market interaction of business
models. In this document, an analysis is provided on how the business models devel-
oped in D5.1 and D5.2a can be connected to the different levels of the energy markets.
The document has been divided into five main sections. In Chapter 2, the State-of-the-
Art solutions and processes of the energy markets have been described. Chapter 3 gives
an overview of the business models that have been defined earlier in WP5. The main
stakeholders and value propositions are identified, in order to understand who needs to
interact with the energy markets and how. Based on the business models, chapter 4
describes a framework for new ancillary services. In Chapter 5 the energy market con-
nectivity requirements of the business models will be evaluated. Finally, in Chapter 6,
energy market structure developments to enable new business models are analyzed.
The D5.4 considers the energy market interaction of the business models. The purpose
is to identify all the relevant requirements for the energy market interaction of the busi-
ness models. In addition, the business models and demonstrators, and how they meet
the requirements of the energy market interaction, are evaluated.
INTRODUCTION
D5 4_SENSIBLE_Deliverable_final 6/71
1.2 References
1.2.1 Internal documents
D1.1 Energy storage domain roles & classification
D5.1 Storage enabled energy business model framework for demonstration
D5.2a Storage enabled energy business models (preliminary analysis)
1.2.2 External documents
[1] Power Market Players. https://www.next-kraftwerke.be/en/knowledge-hub/players-in-the-belgian-power-
market/
[2] What does a transmission system operator do? 2013. http://www.statnett.no/en/Market-and-operati-
ons/Market-information/Market-functions/What-does-a-transmission-system-operator-do/
[3] http://www.eurelectric.org/media/44143/role_of_dsos_as_information_hubs_final_draft_10-06-10-2010-
200-0001-01-e.pdf
[4] The Role of Distribution System Operators (DSOs) as Information Hubs. 2010. http://ec.eu-
ropa.eu/energy/en/news/commission-proposes-new-rules-consumer-centred-clean-energy-transition
[5] Imbalances (Electricity Balancing Market). 2017. http://www.emissions-euets.com/internal-electricity-
market-glossary/572-imbalances#yvComment572
[6] Balancing Service Provider (BSP). 2017. http://www.emissions-euets.com/-balancing-service-provider-
bsp
[7] Facts about the energy markets. 2010. https://corporate.vattenfall.com/about-energy/energy-markets/
[8] About the European Energy Regulators. http://www.ceer.eu/portal/page/por-
tal/EER_HOME/EER_ABOUT
[9] Wholesale market: Timeframes. 2016. https://www.nve.no/energy-market-and-regulation/wholesale-
market/wholesale-market-timeframes/
[10] Financial market. http://www.nordpoolspot.com/How-does-it-work/Financial-market/
[11] Day-ahead market. http://www.nordpoolspot.com/How-does-it-work/Day-ahead-market-Elspot-/
[12] Intraday market. http://www.nordpoolspot.com/How-does-it-work/Intraday-market/
[13] Balancing and Ancillary Services Markets. 2015. https://www.entsoe.eu/about-entso-e/market/balanc-
ing-and-ancillary-services-markets/Pages/default.aspx
[14] Imbalance Settlement (Electricity Balancing Market). 2017. http://www.emissions-euets.com/imbal-
ance-settlement
[15] Fingrid. Market places. 2015. http://www.fingrid.fi/EN/ELECTRICITY-MARKET/DEMAND-SIDE_MAN-
AGEMENT/MARKET_PLACES/Pages/default.aspx
[16] Market Design for Demand Side Response. 2015. https://www.entsoe.eu/Documents/Publications/Po-
sition%20papers%20and%20reports/entsoe_pp_dsr_web.pdf
[17] ENERGY STORAGE AND STORAGE SERVICES. 2016. https://www.entsoe.eu/Documents/Publica-
tions/Position%20papers%20and%20reports/entsoe_pp_storage_web.pdf
INTRODUCTION
D5 4_SENSIBLE_Deliverable_final 7/71
[18] Energy storage. 2017. https://ec.europa.eu/energy/en/topics/technology-and-innovation/energy-stor-
age
[19] Eyer, J. & Garth C. (2010) Energy Storage for Electricity Grid: Benefits and Market Potential Assess-
ment Guide - A Study for the DOE Energy Storage Systems Program [Online] Albuquerque, N.M.: Sandia
National Laboratories. Available from: http://www.sandia.gov/ess/publications/SAND2010-0815.pdf
[20] Rastler D. (2010) Electricity Energy Storage Technology Options - A White Paper Primer on Applica-
tions, Costs, and Benefits [Online]. Palo Alto, CA: EPRI – Electric Power Research Institute. Available
from: http://www.epri.com/abstracts/Pages/ProductAbstract.aspx?ProductId=000000000001020676
[21] PRICES AND COSTS OF EU ENERGY. 2016. https://ec.europa.eu/energy/sites/ener/files/docu-
ments/report_ecofys2016.pdf
[22] EU:n sähkön vähittäismarkkinat. 2015.
http://188.117.57.25/sites/default/files/erikoistyo_raininkonayttoversio.pdf
[23] Electricity prices for industrial consumers, second half 2015. 2016. http://ec.europa.eu/eurostat/statis-
tics-explained/index.php/File:Electricity_prices_for_industrial_consumers,_sec-
ond_half_2015_(%C2%B9)_(EUR_per_kWh)_YB16.png
[24] Iberian Electricity Market. http://www.mibel.com/index.php?lang=en
[25] The Iberian Energy Derivatives Exchange. http://www.omip.pt/
[26] The Iberian Energy Derivatives Exchange. http://www.omie.es/en/inicio
[27] Intraday market in MIBEL. http://www.omie.es/en/home/markets-and-products/electricity-market/our-
electricity-markets/daily-and-intradaily
[28] Redes Energéticas Nacionais. http://www.ren.pt/
[29] Red Eléctrica de España. http://ree.es/en
[30] Interruptibility Service. http://www.mercado.ren.pt/EN/Electr/ActivitiesServices/Interruptibil-
ity/Pages/default.aspx
[31] Interruptibility Service. http://www.ree.es/en/activities/operation-of-the-electricity-system/interruptibil-
ity-service
[32] C. M. Gouveia, Carlos L.; Lopes, João A. P.; Varajão, Diogo; Araújo, Rui E. (2013, 12 December
2013) Microgrid Service Restoration - The Role of Plugged-In Electric Vehicles. IEEE Industrial Electronics
Magazine. 26-41.
[33] Z. Wang, J. Zhong, D. Chen, Y. Lu, and K. Men, "A Multi-Period Optimal Power Flow Model Including
Battery Energy Storage," presented at the IEEE Power & Energy Society General Meeting, Vancouver,
BC, 2013.
[34] P. Wang, D. H. Liang, J. Yi, P. F. Lyons, P. J. Davison, and P. C. Taylor, "Integrating Electrical Energy
Storage Into Coordinated Voltage Control Schemes for Distribution Networks," IEEE Transactions on
Smart Grid, vol. 5, pp. 1018-1032, 2014.
[35] The Future Role of DSOs, A CEER Public Consultation Paper; Council of European Energy Regula-
tors, December 2014
[36] State of the art and trends review of Smart metering in electricity grdis, Noelia Uribe-Pérez, Luis Her-
nández, David de la Vega and Itziar Angulo, 2016.
INTRODUCTION
D5 4_SENSIBLE_Deliverable_final 8/71
[37] MODERNIZING THE ELECTRIC GRID (Chapter 3 – QER Report: Energy Transmission, Storage, and
Distribution Infrastructure, April 2015)
[38] DOE/EPRI 2013 Electricity Storage Handbook in Collaboration with NRECA. 2013.
http://www.epri.com/Pages/Understanding-the-Cost-Effectiveness-of-Energy-Storage.aspx
[39] Energy Management Control to meet MTRs in PV plants, Víctor Andrés Díaz, José Ramón Gordillo,
Carlos Infante and Manuel Lagares (http://www.greenpower.es/en/communication/new-detail/Energy-
Management-Control-to-meet-MTRs-in-PV-plants/)
[40] California Independent System Operator - Integration of Renewable Resources. 2007.
http://www.caiso.com/1ca5/1ca5a7a026270.pdf
[41] Control for Renewable Energy and Smart Grids. 2011. http://ieeecss.org/sites/ieeecss.org/files/docu-
ments/IoCT-Part1-06RESG.pdf
[42] Flexibility and Aggregation Requirements for their interaction in the market. 2014. http://www.eurelec-
tric.org/media/115877/tf_bal-agr_report_final_je_as-2014-030-0026-01-e.pdf
[43] Regulatory Recommendations for the Deployment of Flexibility. 2015. http://ec.europa.eu/en-
ergy/sites/ener/files/documents/EG3%20Final%20-%20January%202015.pdf
[44] DOE/EPRI 2013 Electricity storage Handbook in collaboration with NRECA, Abbas A.Akhil, Geor-
gianne Huff, Aileen B. Currier, Benjamin C. Kaun, Dan M. Rastler, Stella Bingqing Chen, Andrew L. Cotter,
Dale T. Bradshaw, and William D. Gauntlett.
[45] The economics of battery energy storage, how multi-use, customer-sited batteries deliver the most
services and value to customers and the grid, 2015
[46] Study on future information exchange solutions in the electricity retail market. 2014. http://www.fin-
grid.fi/fi/asiakkaat/asiakasliitteet/Datahub/Datahub_final_en.pdf
[47] DR pooli, 2015. Kysynnän jousto - Suomeen soveltuvat käytännön ratkaisut ja vaikutukset
verkkoyhtiöille (DR pooli). https://tutcris.tut.fi/portal/files/4776899/kysynnan_jousto_loppuraportti.pdf)
[48] Statnett, Fingrid, Svenska Kraftnät, Energinet.dk, 2016a, Nordic project on finer time resolution – In-
formation to stakeholders. November 2016. http://www.fingrid.fi/fi/ajankohtaista/Ajankohtaista%20liit-
teet/Ajankohtaisten%20liitteet/2016/Finer%20time%20resolution_information%20to%20stakeholders_No-
vember%202016_Final.pdf
[49] European Commission, 2016c, Commission regulation establishing a guideline on electricity balanc-
ing, EB – Version 10.10.2016. https://ec.europa.eu/energy/sites/ener/files/documents/informal_service_le-
vel_ebgl_10-10-2016nov.pdf
[50] Energy Authority, 2016, National Report 2016 to the Agency for the Cooperation of Energy Regulators
and to the European Commission, Finland. http://www.ceer.eu/portal/page/por-
tal/EER_HOME/EER_PUBLICATIONS/NATIONAL_REPORTS/National_Report-
ing_2016/NR_En/C16_NR_Finland-EN.pdf
[51] SGTF-EG3, 2015, Regulatory recommendations for the deployment of flexibility, January 2015.
https://ec.europa.eu/energy/sites/ener/files/documents/EG3%20Final%20-%20January%202015.pdf
[52] https://ec.europa.eu/energy/sites/ener/files/documents/2008_eu_wholesale_energy_market_histori-
cal.pdf
INTRODUCTION
D5 4_SENSIBLE_Deliverable_final 9/71
[53] Guidelines Facilitating Access to and Participation in GME’s Electricity Market. 2016. http://www.mer-
catoelettrico.org/en/MenuBiblioteca/Documenti/20041011GuidaMe.pdf
[54] Energy market trading systems in G6 countries. http://www.cs.rug.nl/~andrea/publications/ener-
gyMarketG6.pdf
[55] TRADING DOCUMENTS. 2017. http://www.epexspot.com/en/extras/download-center/trading_docu-
ments
[56] API. http://www.nordpoolspot.com/TAS/api/
[57] STORAGE BUSINESS MODELS IN THE GB MARKET. 2014. http://www.poyry.com/sites/de-
fault/files/374_elexon_storagebusinessmodelsandgbmarket_v2_0.pdf
[58] MARKET AND POLICY BARRIERS TO ENERGY STORAGE DEPLOYMENT. 2013. http://www.san-
dia.gov/ess/publications/SAND2013-7606.pdf
[59] Transactive Energy. 2014. www.cpuc.ca.gov/NR/rdonlyres/F67634A7.../PPDTransactiveEn-
ergy_30Oct14.pdf
[60] Smart Grid Security. 2012. https://www.enisa.europa.eu/topics/critical-information-infrastructures-and-
services/smart-grids/smart-grids-and-smart-metering/ict-inderdependencies-of-the-smart-grid
[61] How renewables will change electricity markets in the next five years. Energy policy 48 (2012): 64-75.
Schleicher-Tappeser, Ruggero.
[62] Best practices on Renewable Energy Self-consumption, EC, http://eur-lex.europa.eu/legal-con-
tent/LV/TXT/?uri=CELEX%3A52015SC0141
[63] Designing fair and equitable market rules for demand response aggregation, 2015, Eurelectric
http://www.eurelectric.org/media/169872/0310_missing_links_paper_final_ml-2015-030-0155-01-e.pdf
[64] Overview of Current Microgrid Policies, Incentives and Barriers in the European Union, United States
and China. Ali, Amjad, et al, Sustainability 9.7 (2017): 1146.
[65] Development options for distribution tariff structures in Finland, Honkapuro, Samuli, et al., European
Energy Market (EEM), 2017 14th International Conference on the. IEEE, 2017.
[66] DSO – tariffs: Current issues in Finland, Energiavirasto / Energy authority (Finland)
http://www.nordicenergyregulators.org/wp-content/uploads/2017/02/DSO-tariffs-in-Finland.pdf
INTRODUCTION
D5 4_SENSIBLE_Deliverable_final 10/71
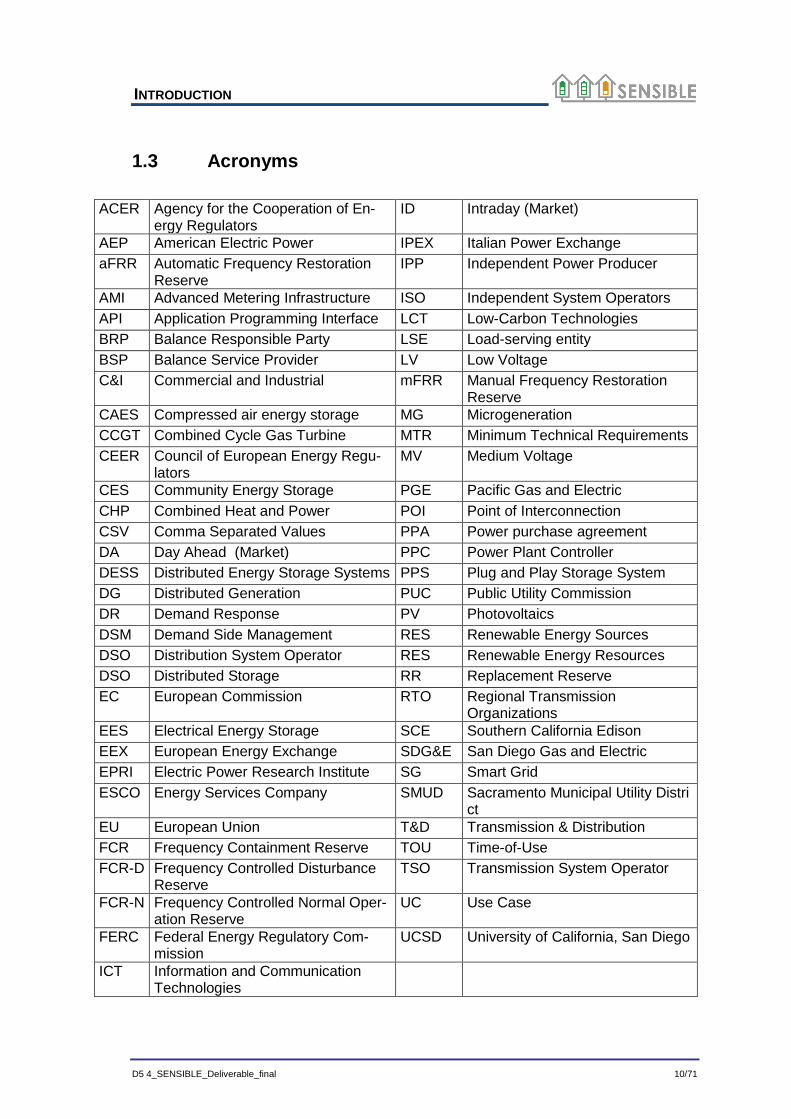
1.3 Acronyms
ACER Agency for the Cooperation of En-ergy Regulators
ID Intraday (Market)
AEP American Electric Power IPEX Italian Power Exchange
aFRR Automatic Frequency Restoration Reserve
IPP Independent Power Producer
AMI Advanced Metering Infrastructure ISO Independent System Operators
API Application Programming Interface LCT Low-Carbon Technologies
BRP Balance Responsible Party LSE Load-serving entity
BSP Balance Service Provider LV Low Voltage
C&I Commercial and Industrial mFRR Manual Frequency Restoration Reserve
CAES Compressed air energy storage MG Microgeneration
CCGT Combined Cycle Gas Turbine MTR Minimum Technical Requirements
CEER Council of European Energy Regu-lators
MV Medium Voltage
CES Community Energy Storage PGE Pacific Gas and Electric
CHP Combined Heat and Power POI Point of Interconnection
CSV Comma Separated Values PPA Power purchase agreement
DA Day Ahead (Market) PPC Power Plant Controller
DESS Distributed Energy Storage Systems PPS Plug and Play Storage System
DG Distributed Generation PUC Public Utility Commission
DR Demand Response PV Photovoltaics
DSM Demand Side Management RES Renewable Energy Sources
DSO Distribution System Operator RES Renewable Energy Resources
DSO Distributed Storage RR Replacement Reserve
EC European Commission RTO Regional Transmission Organizations
EES Electrical Energy Storage SCE Southern California Edison
EEX European Energy Exchange SDG&E San Diego Gas and Electric
EPRI Electric Power Research Institute SG Smart Grid
ESCO Energy Services Company SMUD Sacramento Municipal Utility District
EU European Union T&D Transmission & Distribution
FCR Frequency Containment Reserve TOU Time-of-Use
FCR-D Frequency Controlled Disturbance Reserve
TSO Transmission System Operator
FCR-N Frequency Controlled Normal Oper-ation Reserve
UC Use Case
FERC Federal Energy Regulatory Com-mission
UCSD University of California, San Diego
ICT Information and Communication Technologies
STATE-OF-THE-ART OF THE ENERGY MARKETS
D5 4_SENSIBLE_Deliverable_final 11/71
2 State-of-the-Art of the energy markets
In order to understand the energy market interaction of new storage enabled business
models, one has to be familiar with the market levels and participants. The markets can
be divided into wholesale and retail markets that have been described in sections 2.2.1
and 2.2.2. Both of the market levels have specific participants or stakeholders that are
active in the markets. These will be described in section 2.1 together with the partner
specific requirements and responsibilities.
2.1 Market participants
An overview of the different market participants and their roles/responsibilities has been
provided below in Table 1. The table introduces the main market participants that will
have an impact in the business models. The participants may be the owners of the busi-
ness models or they may influence them e.g. through regulation.
Table 1 Overview of the market participants
Market
Party
Role of the Party
(requirements/responsibilities)
TSO Transmission System Operator (TSO) is responsible for transmitting elec-
tricity generated in large power plants over long distances using high volt-
age lines [1]. TSOs are responsible for keeping the national power sys-
tems in balance, and thus responsible for the overall physical manage-
ment and control of the national power system. Technically this means
that the frequency is maintained at 50 Hz [2]. To maintain balance, TSOs
issue a reserve market where the required power can be exchanged. The
volume of power that TSOs trade in this manner is called regulating/bal-
ancing power [2]. The TSOs choose who will change their production or
consumption based on a price offer that the producers and consumers
have given for this. The producer or consumer who has given the lowest
price for the change that is required will be chosen [2]. Furthermore, TSOs
facilitate the power market by making it physically possible to transport
power from sellers to buyers. This is achieved by taking into account phys-
ical laws, which dictate for example that there must be balance between
the production and consumption of power at all times [2].
DSO Distribution System Operator (DSO) is responsible for distributing elec-
tricity to end customers typically at medium and low voltage levels [1].
Electricity distribution (and transmission) is considered to be a "natural
monopoly" activity, meaning that on this specific market segment one firm
can produce a desired output at a lower social cost than two or more firms
because of both high fixed costs and economies of scale [3]. This explains
why distribution tariffs are regulated by the national regulatory authorities
STATE-OF-THE-ART OF THE ENERGY MARKETS
D5 4_SENSIBLE_Deliverable_final 12/71
who also define approved level of profits that DSOs are allowed to make
[3]. Articles 15-20 of the 2003/54/EC Directive has set a requirement that
distribution of electricity has to be separated from other segments of the
electricity value chain i.e. generation and supply. DSOs have a key role
to play in enabling competitive retail markets in Europe since they facili-
tate supplier changes, renewables/DER integration in the grid, consum-
ers’ participation at the centralized markets and transparent/non-discrim-
inatory access to network and customer information [3]. DSOs are typi-
cally also responsible for metering services in their respective grid area.
DSOs measure the actual consumed and produced energy in the delivery
points and the data is afterwards used for billing and balance settlement
purposes.
BRP Balance Responsible Party (BRP) is a market participant or its chosen
representative responsible for its imbalances in the electricity market [4].
Electricity imbalance most commonly means deviations between genera-
tion, consumption and commercial transactions of a BRP within a given
imbalance settlement period [5]. More formally, imbalance is an energy
volume calculated for a BRP and representing the difference between the
allocated volume attributed to that BRP, and the final position of that BRP
and any imbalance adjustment applied to that BRP, within a given imbal-
ance settlement period [5]. Any imbalances after the closure of the intra-
day market should be balanced by TSOs within the regulating market
timeframe [5]. An Imbalance has a size and a direction, indicating the di-
rection of the settlement transaction between BRP and TSO, with nega-
tive indicating BRP's shortage, and positive indicating BRP’s surplus [5].
Each party injecting to or taking from the grid needs to have a BRP [1].
Each access point has to be assigned to a balancing group (also balanc-
ing perimeter) of a BRP. The BRP is responsible for quarter-hourly (or
hourly) balance between total injections and total offtakes (measurements
at all assigned access points, trades on the power markets, cross-border
import/export and power exchanges with other BRPs) [1].
BSP Balance Service Provider (BSP) is a market participant providing balanc-
ing services to its connecting TSO [6]. This can be either balancing energy
and/or balancing capacity [4]. Each balancing energy bid from a BSP has
to be assigned to one or more BRP [6]. Settlements between TSOs and
BSPs are among tasks and functions that are fundamental to the core
objectives of ensuring operational security and integrating the balancing
market. These tasks include the calculation of activated volume of bal-
ancing energy and for invoicing purposes also price information about
each activation needs to be included [6].
Aggrega-
tor
An aggregator is a market participant who combines several decentral-
ized production and demand units in one portfolio. The aggregator can
STATE-OF-THE-ART OF THE ENERGY MARKETS
D5 4_SENSIBLE_Deliverable_final 13/71
then operate the portfolio in a coordinated manner and deliver the same
services as a large central power plant. This gives access to markets (re-
serve power and electricity markets) that cannot be entered by individual
units of the portfolio. This way the portfolio can be traded on the relevant
markets while furthermore system services can be offered to the TSO or
DSO supporting overall grid operation and integration of renewables. [1]
Producer Typically, producers refer to parties who generate electricity/energy in
large centralized power plants. This can be a nuclear, coal fired, natural
gas, offshore wind park, CHP etc. [1]. In addition to power generation,
producers can offer ancillary services to TSOs to help them maintain the
balance on the transmission grid. Most important ancillary services are
reserve products (frequency containment and restoration reserves), volt-
age regulation and black-start capability. [1]
Energy
supplier
Like it was written earlier, articles 15-20 of the 2003/54/EC Directive has
set a requirement that different electricity segments of the electricity value
chain i.e. generation, distribution and supply have to be separated from
each other [3]. This has led to the introduction of energy suppliers who
sell the electricity to the end-consumer [1]. Consumers can choose which
supplier they prefer (depending on the tariffs and services offered) [1].
Each supplier has to have a BRP to manage the energy balance of the
supplier.
Con-
sumer
An end-user (industrial, commercial or residential) that uses electricity to
drive industrial processes, household appliances, provide lighting or heat-
ing etc. [1]. Acquires electricity through a supplier. Access point to the grid
facilitated by the DSOs who measure and settle the use of electricity.
Prosumer Prosumers are consumers who also have their own production of electric-
ity. Prosumers can take electricity from the grid when their own production
is not sufficient or inject electricity into the grid when they are self-suffi-
cient. Likewise, prosumers can have storage resources and the use of
electricity can be managed for example by aggregators in relation to mar-
ket prices.
Power
exchange In Europe, there are more than twenty different energy exchanges. The
most liquid exchanges are the European Energy Exchange (EEX) and the
Nord Pool Spot / Nasdaq Omx Commodities [7]. The main markets within
an energy exchange are the spot market, for short-term trading, and the
forward market, where the physical delivery of, for example, electricity or
gas takes place at a future date [7]. The actors on the spot market are
producers, retailers and traders as well as large end users [7]. Power Ex-
changes are used for anonymous and transparent energy trading. A mul-
tilateral trading platform is set up, where market participants submit de-
mand or supply bids. The market operator will aggregate all the demand
STATE-OF-THE-ART OF THE ENERGY MARKETS
D5 4_SENSIBLE_Deliverable_final 14/71
bids and all supply bids and clear the market once every 15min (in Bel-
gium). The products offered on the power exchanges are standard prod-
ucts for which the demand is high enough to ensure liquidity and a good
price. [1]
Trader/
broker
Energy trader/broker is a company or a division of a supplier that assists
in procuring of electricity (or natural gas). Traders do not own or distribute
energy nor are they allowed to sell energy to customers. They are simply
participants that act on the markets and can influence market prices.
Regulator Since the transmission and distribution grid are operated as natural mo-
nopoly, there has to be an independent party, which checks the TSO and
DSO are not abusing their market power. They also keep an eye on pro-
ducers and consumers, to make sure (large) players do not try to influence
the prices. [1] The independent national regulators cooperate on Euro-
pean level through Agency for the Cooperation of Energy Regulators
(ACER) and the Council of European Energy Regulators (CEER). ACER’s
focus is on what is required in the legislation and CEER does everything
else in energy regulation [8].
2.2 Market levels
2.2.1 Wholesale markets
2.2.1.1 Traditional power markets
The wholesale electricity markets can be divided into four main categories. These cate-
gories enable the stakeholders to plan and manage their energy production and con-
sumption on both long and short term. The four main markets are: First, the financial
forward market; Second, the Day-Ahead Market; Third, the Intraday Market; Finally the
balancing markets. In addition to these four, the participants may also have bilateral con-
tracts with each other.
The financial forward market is regulated by the Financial Supervisory Authorities and
is placed under financial legislation. The financial market enables market participants to
secure their positions months or even several years ahead of the delivery day [9]. In the
Nord Pool for example, the contracts have a time horizon up to six years, covering daily,
weekly, monthly, quarterly and annual contracts [10]. There is no physical delivery for
financial power market contracts. Cash settlement takes place throughout trading and/or
the delivery period, starting at the due date of each contract, depending on whether the
product is a futures or a forward [10]. Technical conditions such as grid congestion and
access to capacity are not taken into consideration when entering financial contracts.
However, buyers and sellers can with the help of the financial (forward) power market

STATE-OF-THE-ART OF THE ENERGY MARKETS
D5 4_SENSIBLE_Deliverable_final 15/71
manage the risks associated to the physical market prices. [10] A well-functioning finan-
cial market and trade with power derivatives is important for market participants in the
physical power market because it allows them to off-set their positions and hedge future
income to adjust their risk profile. [9]
The Day-Ahead Market is the main arena for trading power. There, contracts are made
between seller and buyer for the delivery of power the following day, the price is set and
the trade is agreed. [11] The trading happens through a so-called implicit auction where
price and volume are calculated for every hour for the following day. This auction is based
on bids from both producers and consumers, and takes into account physical constraints
of cross-zonal capacity [9]. Consumers (typically suppliers) assess how much energy
they will need to meet demand the following day, and how much they are willing to pay
for this volume, hour by hour. The producers, on the other hand, assess how much power
they can deliver and at what price [11]. The bids are delivered through a trading system,
which feeds the information into a specialist computer system, which calculates the price.
Simply, the price is set where the curves for sell price and buy price meet. [11] By setting
price and volume for each bidding zone, the auction also determines the scheduled day-
ahead flows between bidding zones. The TSOs rely on the market clearing results when
planning next day’s operation of the grid. [9]
Figure 1 Formation of day-ahead electricity price
The system price is calculated based on the day-ahead market results and it represents
the unconstrained equilibrium price, i.e. by assuming there are no congestions in the
transmission grid. This price is used as reference for price setting in the financial market,
as well as for bilateral contracts and retail contracts in the market. The area specific
STATE-OF-THE-ART OF THE ENERGY MARKETS
D5 4_SENSIBLE_Deliverable_final 16/71
prices, i.e. the day-ahead price for each bidding zone take into account the restrictions
in the transmission grid. These capacities are given daily by the TSOs. [9]
The Intraday Market supplements the day-ahead market and helps secure the neces-
sary balance between supply and demand [12]. Market participants can trade until one
hour before the production hour in order to correct possible imbalances (such as if it
becomes colder or more windy than anticipated) [9]. The market opens once the day-
ahead market has closed, for example in Nord Pool three hours after the day-ahead
market closure [9]. Different to the day-ahead market, the intraday market has continu-
ous trading and trading takes place every day around the clock until one hour before
delivery [9,12]. Prices are set based on a first-come, first-served principle, where best
prices come first – highest buy price and lowest sell price [12]. The intraday market is
getting increasingly important as more intermittent wind and solar power, which is pre-
dictable only with uncertainty, is introduced to the markets [12]. In this sense, the market
plays a key role enabling larger shares of renewables in the grids.
The balancing (regulating) markets are operated by the TSOs who are responsible for
balancing the system [9]. According to ENTSO-E, balancing refers to the situation after
markets have closed (gate closure) in which a TSO acts to ensure that demand is equal
to supply, in and near real time [13]. Efficient balancing markets ensure the security of
supply at the least cost and decrease the need of back-up generation [13]. Within Eu-
rope, there is a will to harmonize the balancing markets in order to increase competition,
liquidity and efficiency [13]. Balancing also includes ancillary services, which refers to a
range of functions, which TSOs contract so that they can guarantee system operation.
These include [13]:
- black start capability (the ability to restart a grid following a blackout)
- frequency response (to maintain system frequency with automatic and very fast
responses. Includes Frequency Containment Reserve (FCR) and Automatic Fre-
quency Restoration Reserve (aFRR))
- fast disturbance reserve and strategic reserves (which can provide additional en-
ergy when needed. Includes Manual Frequency Restoration Reserve (mFRR)
and Replacement Reserve (RR))
- the provision of reactive power (provided only locally and not traded) and various
other services
The balancing markets can be accessed by both generators and demand response [13].
The ancillary services/markets defined above, can be divided into primary reserves
(FCR), secondary reserves (aFRR) and tertiary reserves (mFRR, RR) [9]. FCR and
aFRR are activated automatically while mFRR is activated manually. Furthermore, FCR
is the fastest, while mFRR is the slowest with a response deadline of 15 minutes. mFRR
is activated depending on need and with an hourly price resolution. Gate closure time for
STATE-OF-THE-ART OF THE ENERGY MARKETS
D5 4_SENSIBLE_Deliverable_final 17/71
bids in the balancing market is 45 minutes before time of production, but since mFRR
has a response time of 15 minutes, activation can happen within the production hour. [9]
An important aspect in the balancing markets is the imbalance settlement, which takes
place after the operational hour and is a TSO responsibility [9]. Imbalance settlement
means a financial settlement mechanism aiming at charging or paying Balance Respon-
sible Parties for their imbalances for each imbalance settlement period [14]. The general
principle of imbalance settlement is that all injections and all withdrawals should be cov-
ered by balancing responsibility and, depending on the state of the system, an imbalance
charge is imposed per imbalance settlement period on the BRPs that are not in balance
[14]. It typically aims at recovering the costs of balancing the system and include incen-
tives for the market to reduce imbalances while transferring the financial risk of imbal-
ances to BRPs [14]. This is especially important aspect also for storage enabled busi-
ness models and demand response. It is crucial to understand that all actions, made for
example by aggregators, affect the BRPs position and may cause it to be imbalance.
In addition to mentioned four marketplaces, power can also be exchanged through bi-
lateral contracts. A bilateral contract in the wholesale market is a market based contract
between a buyer and a seller with an agreed price, volume and time period [9]. Tradi-
tionally, power in the wholesale market was bought and sold through bilateral physical
contracts – both in short and long-term [9]. After the introduction of power exchange,
trading moved away from the physical bilateral contracts. However, there are still many
bilateral long-term contracts in the market, but most of these are financially settled [9].
For example in the Nordic countries, over 90 % of the physical power is traded through
Nord Pool and the Day-Ahead Market [9].
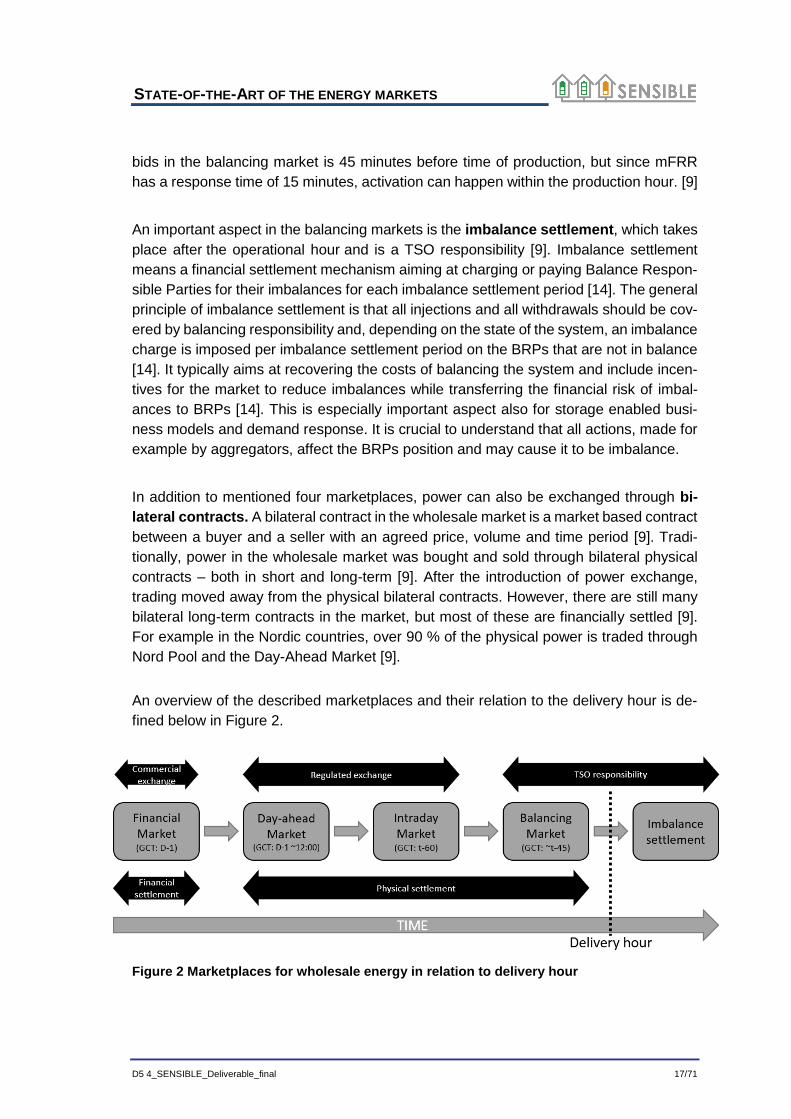
An overview of the described marketplaces and their relation to the delivery hour is de-
fined below in Figure 2.
Figure 2 Marketplaces for wholesale energy in relation to delivery hour
STATE-OF-THE-ART OF THE ENERGY MARKETS
D5 4_SENSIBLE_Deliverable_final 18/71
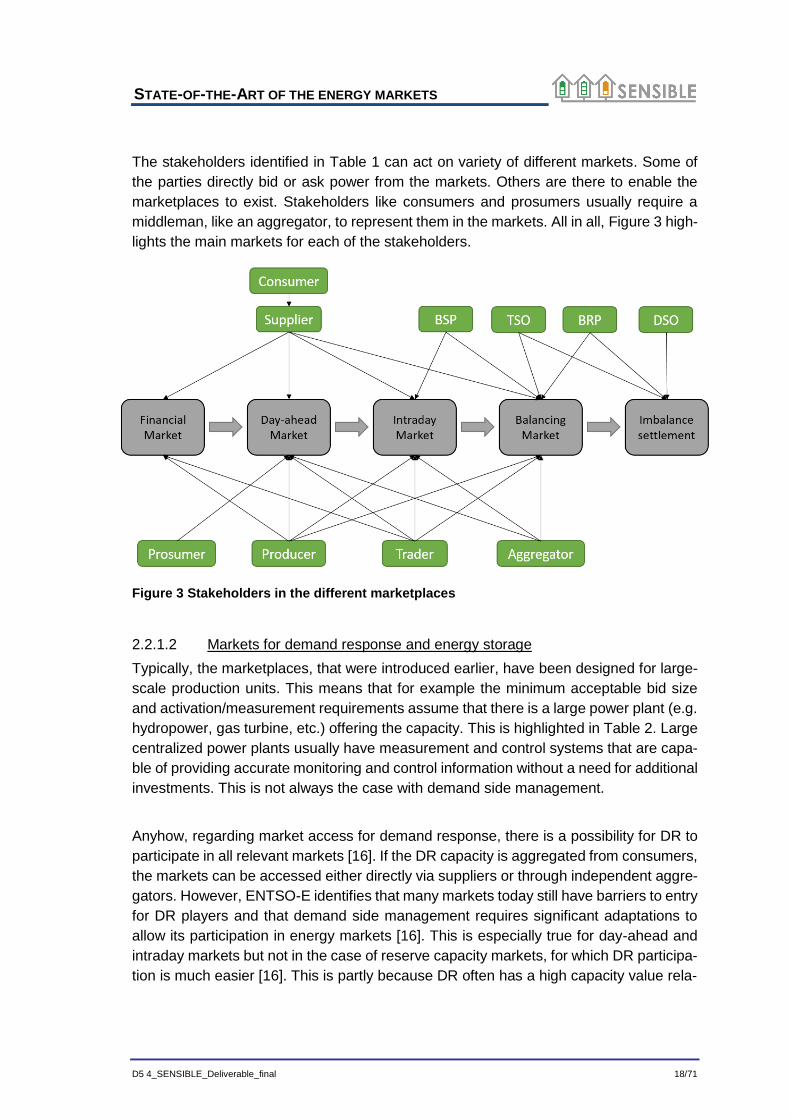
The stakeholders identified in Table 1 can act on variety of different markets. Some of
the parties directly bid or ask power from the markets. Others are there to enable the
marketplaces to exist. Stakeholders like consumers and prosumers usually require a
middleman, like an aggregator, to represent them in the markets. All in all, Figure 3 high-
lights the main markets for each of the stakeholders.
Figure 3 Stakeholders in the different marketplaces
2.2.1.2 Markets for demand response and energy storage
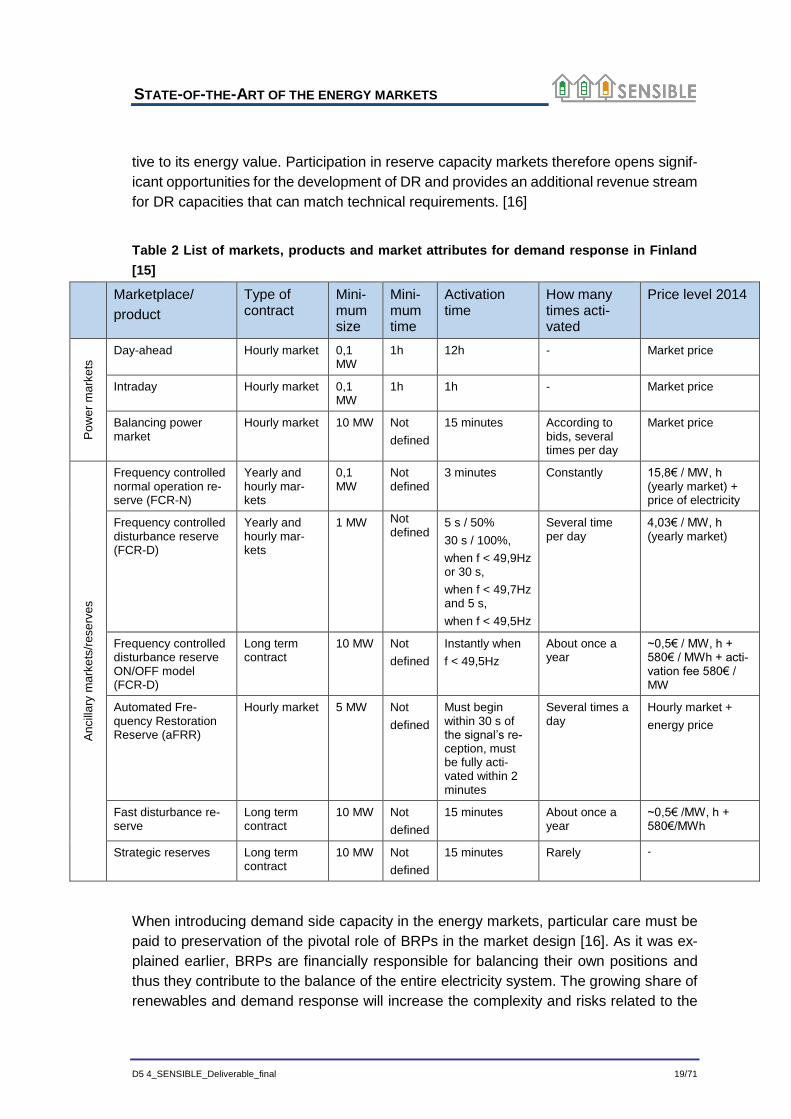
Typically, the marketplaces, that were introduced earlier, have been designed for large-
scale production units. This means that for example the minimum acceptable bid size
and activation/measurement requirements assume that there is a large power plant (e.g.
hydropower, gas turbine, etc.) offering the capacity. This is highlighted in Table 2. Large
centralized power plants usually have measurement and control systems that are capa-
ble of providing accurate monitoring and control information without a need for additional
investments. This is not always the case with demand side management.
Anyhow, regarding market access for demand response, there is a possibility for DR to
participate in all relevant markets [16]. If the DR capacity is aggregated from consumers,
the markets can be accessed either directly via suppliers or through independent aggre-
gators. However, ENTSO-E identifies that many markets today still have barriers to entry
for DR players and that demand side management requires significant adaptations to
allow its participation in energy markets [16]. This is especially true for day-ahead and
intraday markets but not in the case of reserve capacity markets, for which DR participa-
tion is much easier [16]. This is partly because DR often has a high capacity value rela-
STATE-OF-THE-ART OF THE ENERGY MARKETS
D5 4_SENSIBLE_Deliverable_final 19/71
tive to its energy value. Participation in reserve capacity markets therefore opens signif-
icant opportunities for the development of DR and provides an additional revenue stream
for DR capacities that can match technical requirements. [16]
Table 2 List of markets, products and market attributes for demand response in Finland
[15]
Marketplace/
product
Type of contract
Mini-mum size
Mini-mum time
Activation time
How many times acti-vated
Price level 2014
Po
we
r m
ark
ets
Day-ahead Hourly market 0,1 MW
1h 12h - Market price
Intraday Hourly market 0,1 MW
1h 1h - Market price
Balancing power market
Hourly market 10 MW Not
defined
15 minutes According to bids, several times per day
Market price
An
cill
ary
ma
rke
ts/r
ese
rves
Frequency controlled normal operation re-serve (FCR-N)
Yearly and hourly mar-kets
0,1 MW
Not defined
3 minutes Constantly 15,8€ / MW, h (yearly market) + price of electricity
Frequency controlled disturbance reserve (FCR-D)
Yearly and hourly mar-kets
1 MW Not defined
5 s / 50%
30 s / 100%,
when f < 49,9Hz or 30 s,
when f < 49,7Hz and 5 s,
when f < 49,5Hz
Several time per day
4,03€ / MW, h (yearly market)
Frequency controlled disturbance reserve ON/OFF model (FCR-D)
Long term contract
10 MW Not
defined
Instantly when
f < 49,5Hz
About once a year
~0,5€ / MW, h + 580€ / MWh + acti-vation fee 580€ / MW
Automated Fre-quency Restoration Reserve (aFRR)
Hourly market 5 MW Not
defined
Must begin within 30 s of the signal’s re-ception, must be fully acti-vated within 2 minutes
Several times a day
Hourly market +
energy price
Fast disturbance re-serve
Long term contract
10 MW Not
defined
15 minutes About once a year
~0,5€ /MW, h + 580€/MWh
Strategic reserves Long term contract
10 MW Not
defined
15 minutes Rarely -
When introducing demand side capacity in the energy markets, particular care must be
paid to preservation of the pivotal role of BRPs in the market design [16]. As it was ex-
plained earlier, BRPs are financially responsible for balancing their own positions and
thus they contribute to the balance of the entire electricity system. The growing share of
renewables and demand response will increase the complexity and risks related to the
STATE-OF-THE-ART OF THE ENERGY MARKETS
D5 4_SENSIBLE_Deliverable_final 20/71
responsibilities of BRPs. Therefore, it is essential that BRPs are correctly informed about
the demand response actions so that they are able to fulfill their role and thereby avoid
counterbalancing and ensure proper forecasting. [16]
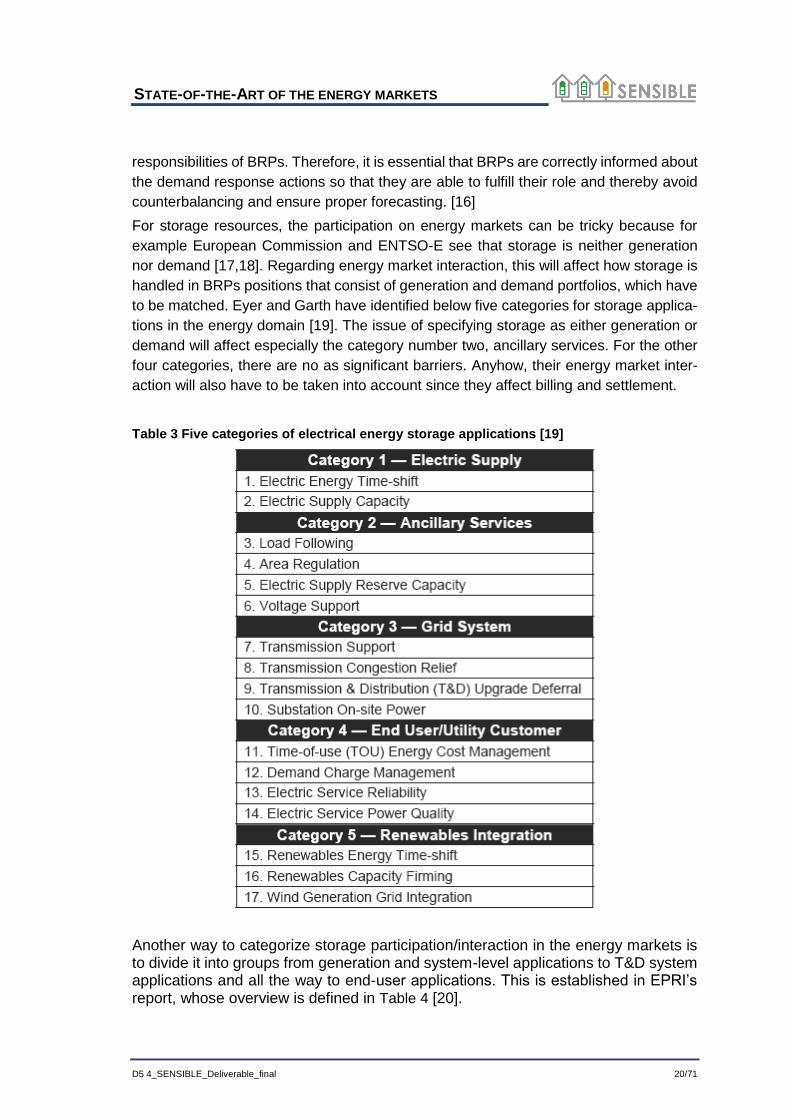
For storage resources, the participation on energy markets can be tricky because for
example European Commission and ENTSO-E see that storage is neither generation
nor demand [17,18]. Regarding energy market interaction, this will affect how storage is
handled in BRPs positions that consist of generation and demand portfolios, which have
to be matched. Eyer and Garth have identified below five categories for storage applica-
tions in the energy domain [19]. The issue of specifying storage as either generation or
demand will affect especially the category number two, ancillary services. For the other
four categories, there are no as significant barriers. Anyhow, their energy market inter-
action will also have to be taken into account since they affect billing and settlement.
Table 3 Five categories of electrical energy storage applications [19]
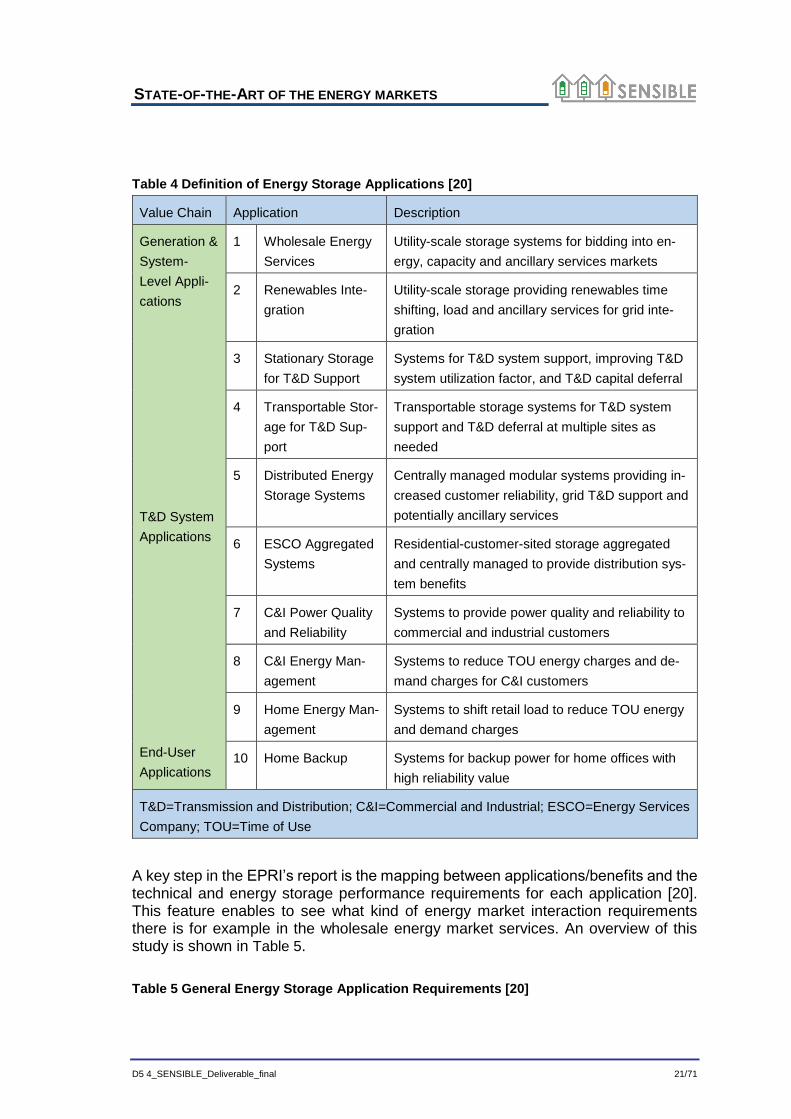
Another way to categorize storage participation/interaction in the energy markets is to divide it into groups from generation and system-level applications to T&D system applications and all the way to end-user applications. This is established in EPRI’s report, whose overview is defined in Table 4 [20].
STATE-OF-THE-ART OF THE ENERGY MARKETS
D5 4_SENSIBLE_Deliverable_final 21/71
Table 4 Definition of Energy Storage Applications [20]
Value Chain Application Description
Generation &
System-
Level Appli-
cations
T&D System
Applications
End-User
Applications
1 Wholesale Energy
Services
Utility-scale storage systems for bidding into en-
ergy, capacity and ancillary services markets
2 Renewables Inte-
gration
Utility-scale storage providing renewables time
shifting, load and ancillary services for grid inte-
gration
3 Stationary Storage
for T&D Support
Systems for T&D system support, improving T&D
system utilization factor, and T&D capital deferral
4 Transportable Stor-
age for T&D Sup-
port
Transportable storage systems for T&D system
support and T&D deferral at multiple sites as
needed
5 Distributed Energy
Storage Systems
Centrally managed modular systems providing in-
creased customer reliability, grid T&D support and
potentially ancillary services
6 ESCO Aggregated
Systems
Residential-customer-sited storage aggregated
and centrally managed to provide distribution sys-
tem benefits
7 C&I Power Quality
and Reliability
Systems to provide power quality and reliability to
commercial and industrial customers
8 C&I Energy Man-
agement
Systems to reduce TOU energy charges and de-
mand charges for C&I customers
9 Home Energy Man-
agement
Systems to shift retail load to reduce TOU energy
and demand charges
10 Home Backup Systems for backup power for home offices with
high reliability value
T&D=Transmission and Distribution; C&I=Commercial and Industrial; ESCO=Energy Services
Company; TOU=Time of Use
A key step in the EPRI’s report is the mapping between applications/benefits and the technical and energy storage performance requirements for each application [20]. This feature enables to see what kind of energy market interaction requirements there is for example in the wholesale energy market services. An overview of this study is shown in Table 5.
Table 5 General Energy Storage Application Requirements [20]

STATE-OF-THE-ART OF THE ENERGY MARKETS
D5 4_SENSIBLE_Deliverable_final 22/71
Application Description Size Duration Cycles Desired
Lifetime
Wholesale
Energy Ser-
vices
Arbitrage 10-300 MW 2-10 hr 300-400/yr
Ancillary Services See note 2 See note 2 See note 2 See note 2
Frequency regulation 1-100 MW 15 min >8000/yr 15 yr
Spinning reserve 10-100 MW 1-5 hr 20 yr
Renewables
Integration
Wind integration: ramp
& voltage support
1-10 MW
distributed
100-400 MW
centralized
15 min 5000/yr
10,000 full
energy cy-
cles
20 yr
Wind integration: off-
peak storage
100-400 MW 5-10 hr 300-500/yr 20 yr
Photovoltaic integra-
tion: time-shift, voltage
sag, rapid demand sup-
port
1-2 MW 15 min-4 hr >4000 15 yr
Stationary
T&D Support
Urban and rural T&D
deferral. Also ISO con-
gestion mgt.
10-100 MW 2-6 hr 300-500/yr 15-20 yr
Transporta-
ble T&D
Support
Urban and rural T&D
deferral. Also ISO con-
gestion mgt.
1-10 MW 2-6 hr 300-500/yr 15-20 yr
Distributed
Energy Stor-
age Systems
(DESS)
Utility-sponsored; on
utility side of meter,
feeder line, substation.
75-85% ac-ac- effi-
cient.
25-200 kW 1-phase
25-75 kW 3-phase
Small footprint
2-4 hr 100-150/yr 10-15 yr
C&I Power
Quality
Provide solutions to
avoid voltage sags and
momentary outages.
50-500 kW <15 min <50/yr 10 yr
1000 kW >15 min
C&I Power
Reliability
Provide UPS bridge to
backup power, outage
ride-through.
50-1000 kW 4-10 hr <50/yr 10 yr
C&I Energy
Management
Reduce energy costs,
increase reliability. Size
50-1000 kW
Small footprint
3-4 hr 400-
1500/yr
15 yr

STATE-OF-THE-ART OF THE ENERGY MARKETS
D5 4_SENSIBLE_Deliverable_final 23/71
varies by market seg-
ment.
1 MW 4-6 hr
Home En-
ergy Man-
agement
Efficiency, cost-sav-
ings
2-5 kW
Small footprint
2-4 hr 150-400/yr 10-15 yr
Home
Backup
Reliability 2-5 kW
Small footprint
2-4 hr 150-400/yr 10-15 yr
1. Size, duration, and cycle assumptions are based on EPRI’s generalized performance specifications
and requirements for each application, and are for the purpose of board comparison only. Data may
vary greatly based on specific situations, applications, site selection, business environment, etc.
2. Ancillary services encompass many market functions, such as black start capability and ramping ser-
vices, that have a wide range of characteristics and requirements.
2.2.2 Retail markets
2.2.2.1 Roles and responsibilities
After the liberalization of energy markets, the supply of electricity was separated from
generation and distribution. This has led to multiple stakeholders in the retail markets.
The main relevant stakeholders in the storage enabled business models are retailers,
DSOs, industrial/commercial clients and prosumers/consumers.
In the business models and on retail markets in general, retailers are responsible for
supply/sales of electricity to end customers. The retailers procure electricity from the
wholesale markets and supply that to the households or commercial/industrial custom-
ers. In addition to that, retailers may provide additional services like flexibility manage-
ment, like it is done in the Évora demonstrator.
Distribution System Operators are responsible for delivering the electricity to end cus-
tomers. An important responsibility for DSOs, regarding retail markets, is to measure the
actual consumption and production amounts in the delivery points. This information is
used for invoicing and balance settlement purposes. Likewise, in the integration of re-
newables, DSOs play a key role, since most of the capacity is connected to medium or
low voltage levels.
Large industrial or commercial companies are an important stakeholder in the retail
markets as they consume a significant part of the overall electricity. They can acquire
electricity either through retailers or they may be independent by procuring electricity
directly from the wholesale markets. Large companies or sites are also able to provide
substantial amounts of flexibility to the markets, like is the case in Nuremberg demon-
strator.
STATE-OF-THE-ART OF THE ENERGY MARKETS
D5 4_SENSIBLE_Deliverable_final 24/71
The European Commission identifies in their new winter package that consum-
ers/prosumers will play a key role in the future energy systems [4]. Consumers will not
only use electricity but they will introduce renewables in the distribution grids and thus
affect the retail market. The regulation and subsidies for renewables will have an impact
on consumer behaviour and the way in which new technology and services will be
launched.
2.2.2.2 Pricing and tariffs
Since the retail markets’ main task is to enable end customers to consume electricity, it
is natural that the corresponding pricing structures and tariffs are considered. The pricing
structures affect how people consume electricity, how energy efficiency and demand re-
sponse services are conceived and how attracting it is to develop new technology for the
energy markets.
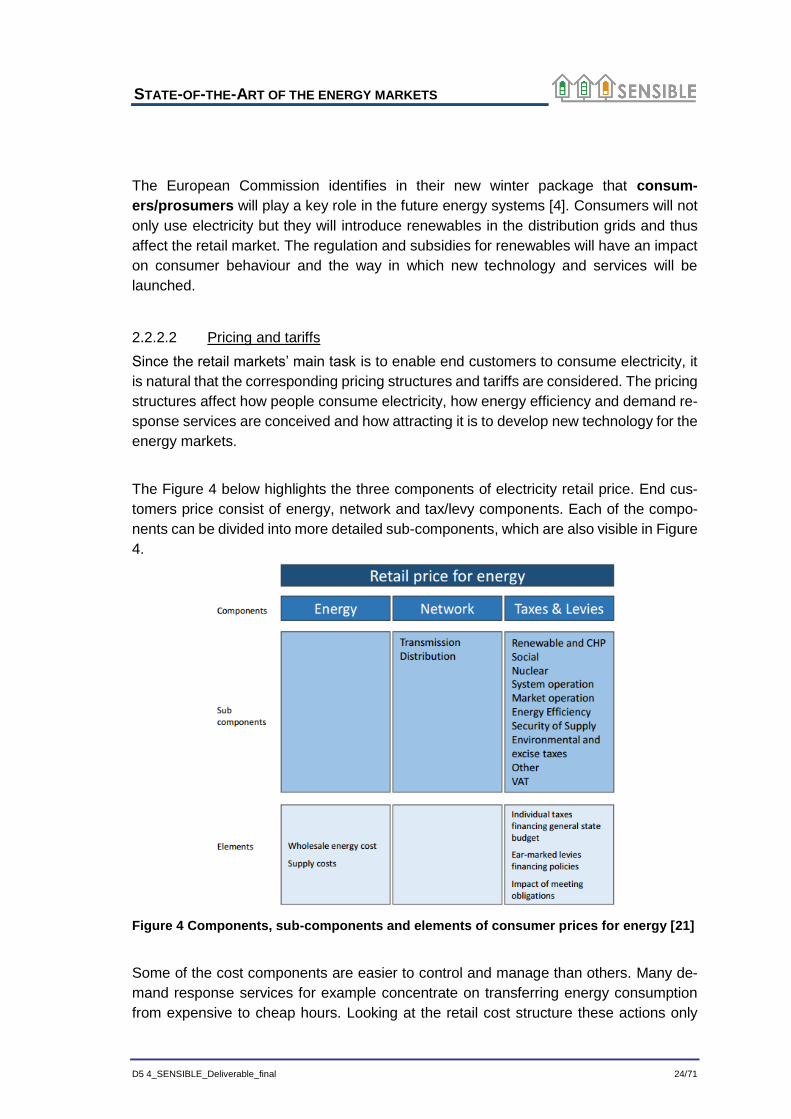
The Figure 4 below highlights the three components of electricity retail price. End cus-
tomers price consist of energy, network and tax/levy components. Each of the compo-
nents can be divided into more detailed sub-components, which are also visible in Figure
4.
Figure 4 Components, sub-components and elements of consumer prices for energy [21]
Some of the cost components are easier to control and manage than others. Many de-
mand response services for example concentrate on transferring energy consumption
from expensive to cheap hours. Looking at the retail cost structure these actions only
STATE-OF-THE-ART OF THE ENERGY MARKETS
D5 4_SENSIBLE_Deliverable_final 25/71
address one of the three components, namely the energy part. Therefore, for the end
customer it is significantly more profitable if the storage enabled business models can
tackle also network and tax components by decreasing the overall intake from the grid.
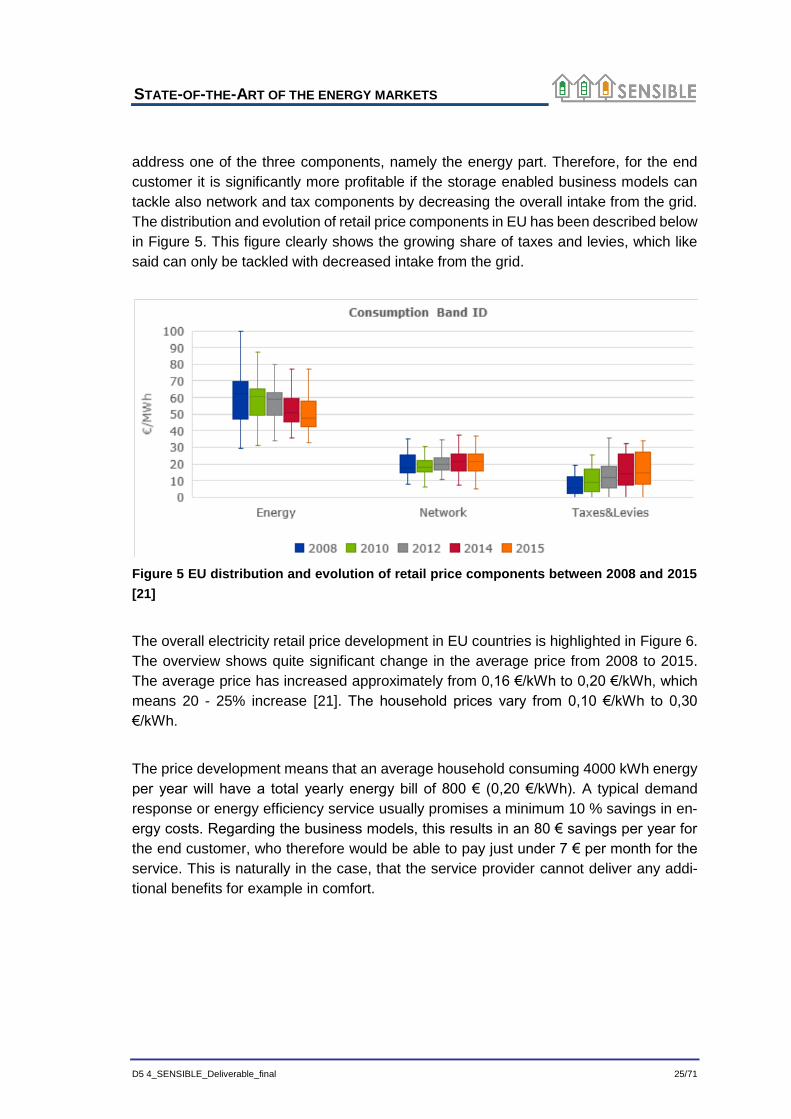
The distribution and evolution of retail price components in EU has been described below
in Figure 5. This figure clearly shows the growing share of taxes and levies, which like
said can only be tackled with decreased intake from the grid.
Figure 5 EU distribution and evolution of retail price components between 2008 and 2015
[21]
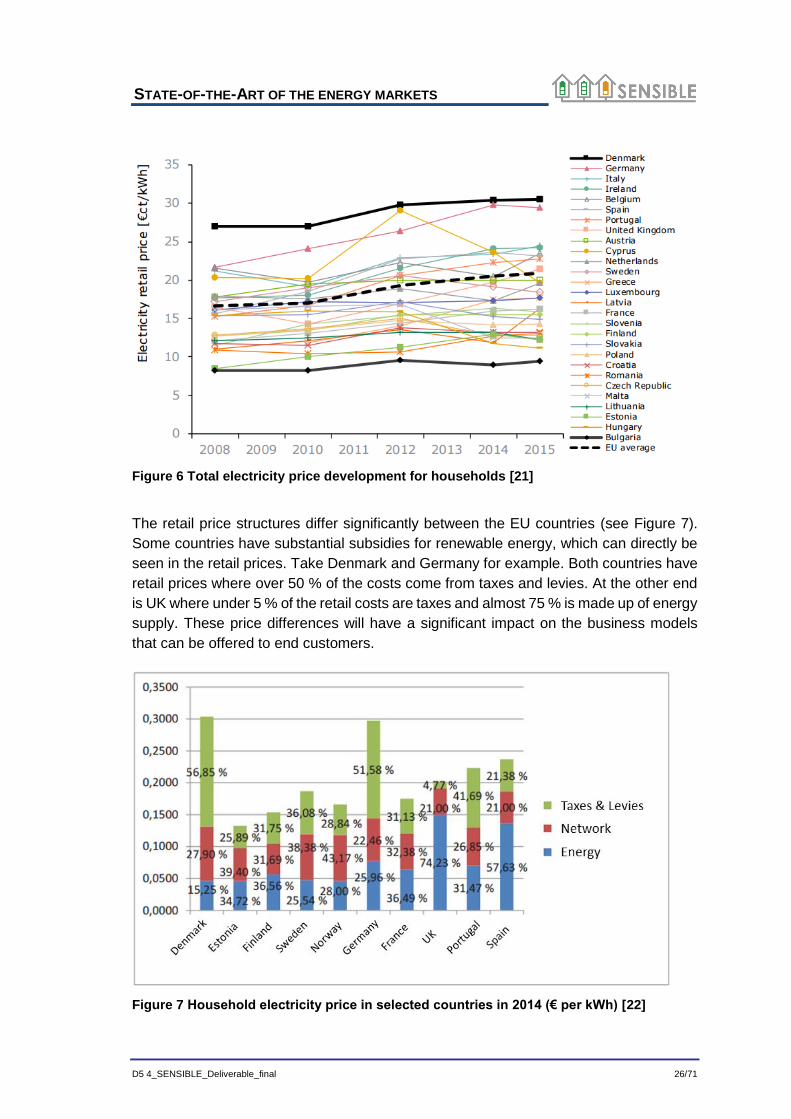
The overall electricity retail price development in EU countries is highlighted in Figure 6.
The overview shows quite significant change in the average price from 2008 to 2015.
The average price has increased approximately from 0,16 €/kWh to 0,20 €/kWh, which
means 20 - 25% increase [21]. The household prices vary from 0,10 €/kWh to 0,30
€/kWh.
The price development means that an average household consuming 4000 kWh energy
per year will have a total yearly energy bill of 800 € (0,20 €/kWh). A typical demand
response or energy efficiency service usually promises a minimum 10 % savings in en-
ergy costs. Regarding the business models, this results in an 80 € savings per year for
the end customer, who therefore would be able to pay just under 7 € per month for the
service. This is naturally in the case, that the service provider cannot deliver any addi-
tional benefits for example in comfort.
STATE-OF-THE-ART OF THE ENERGY MARKETS
D5 4_SENSIBLE_Deliverable_final 26/71
Figure 6 Total electricity price development for households [21]
The retail price structures differ significantly between the EU countries (see Figure 7).
Some countries have substantial subsidies for renewable energy, which can directly be
seen in the retail prices. Take Denmark and Germany for example. Both countries have
retail prices where over 50 % of the costs come from taxes and levies. At the other end
is UK where under 5 % of the retail costs are taxes and almost 75 % is made up of energy
supply. These price differences will have a significant impact on the business models
that can be offered to end customers.
Figure 7 Household electricity price in selected countries in 2014 (€ per kWh) [22]
STATE-OF-THE-ART OF THE ENERGY MARKETS
D5 4_SENSIBLE_Deliverable_final 27/71
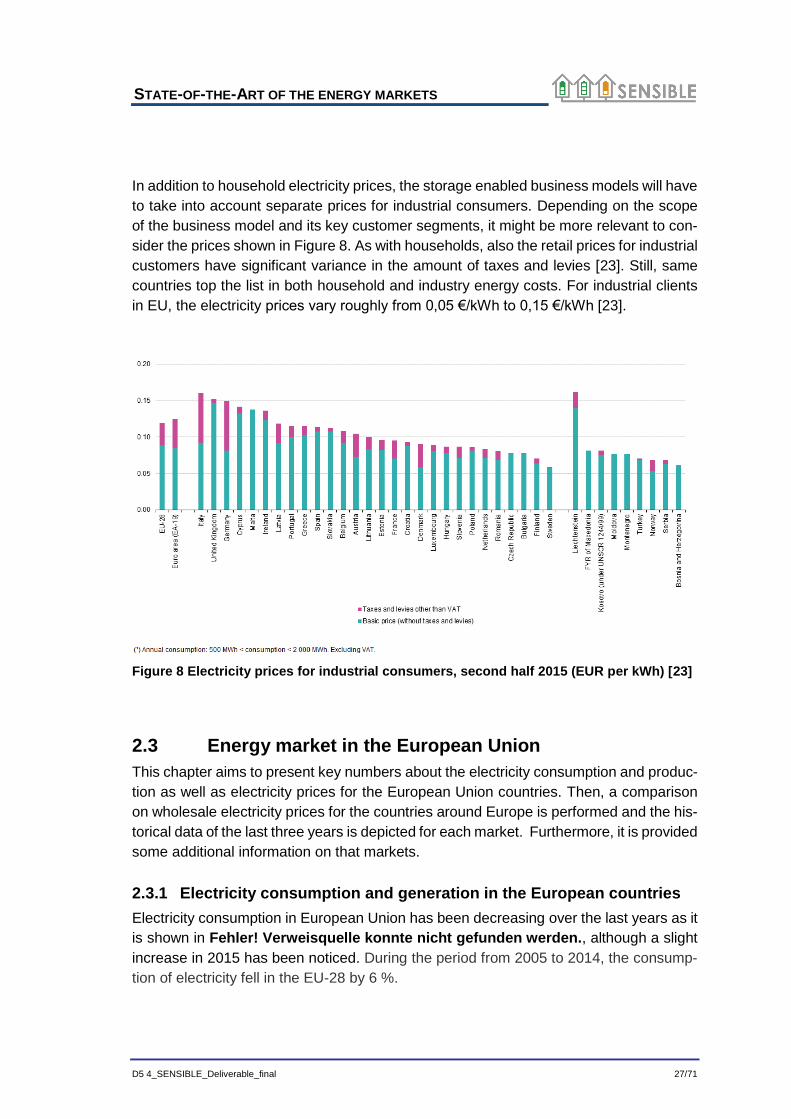
In addition to household electricity prices, the storage enabled business models will have
to take into account separate prices for industrial consumers. Depending on the scope
of the business model and its key customer segments, it might be more relevant to con-
sider the prices shown in Figure 8. As with households, also the retail prices for industrial
customers have significant variance in the amount of taxes and levies [23]. Still, same
countries top the list in both household and industry energy costs. For industrial clients
in EU, the electricity prices vary roughly from 0,05 €/kWh to 0,15 €/kWh [23].
Figure 8 Electricity prices for industrial consumers, second half 2015 (EUR per kWh) [23]
2.3 Energy market in the European Union
This chapter aims to present key numbers about the electricity consumption and produc-
tion as well as electricity prices for the European Union countries. Then, a comparison
on wholesale electricity prices for the countries around Europe is performed and the his-
torical data of the last three years is depicted for each market. Furthermore, it is provided
some additional information on that markets.
2.3.1 Electricity consumption and generation in the European countries
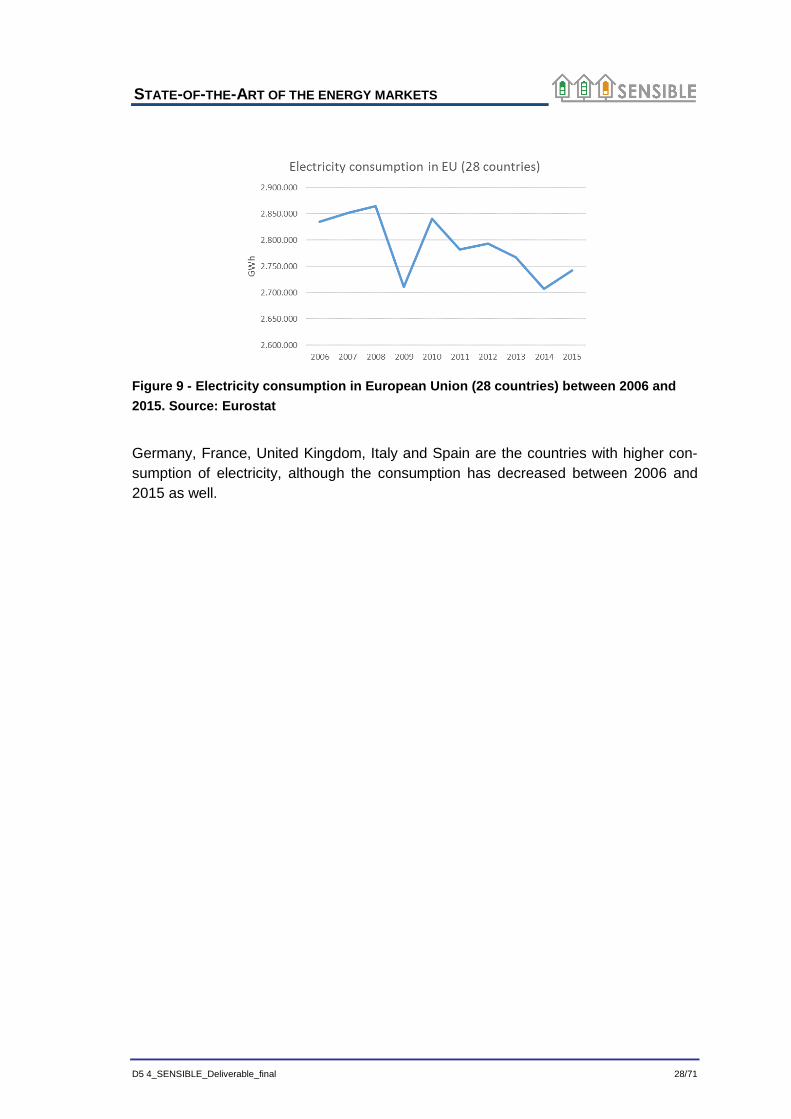
Electricity consumption in European Union has been decreasing over the last years as it
is shown in Fehler! Verweisquelle konnte nicht gefunden werden., although a slight
increase in 2015 has been noticed. During the period from 2005 to 2014, the consump-
tion of electricity fell in the EU-28 by 6 %.
STATE-OF-THE-ART OF THE ENERGY MARKETS
D5 4_SENSIBLE_Deliverable_final 28/71
Figure 9 - Electricity consumption in European Union (28 countries) between 2006 and
2015. Source: Eurostat
Germany, France, United Kingdom, Italy and Spain are the countries with higher con-
sumption of electricity, although the consumption has decreased between 2006 and
2015 as well.
STATE-OF-THE-ART OF THE ENERGY MARKETS
D5 4_SENSIBLE_Deliverable_final 29/71
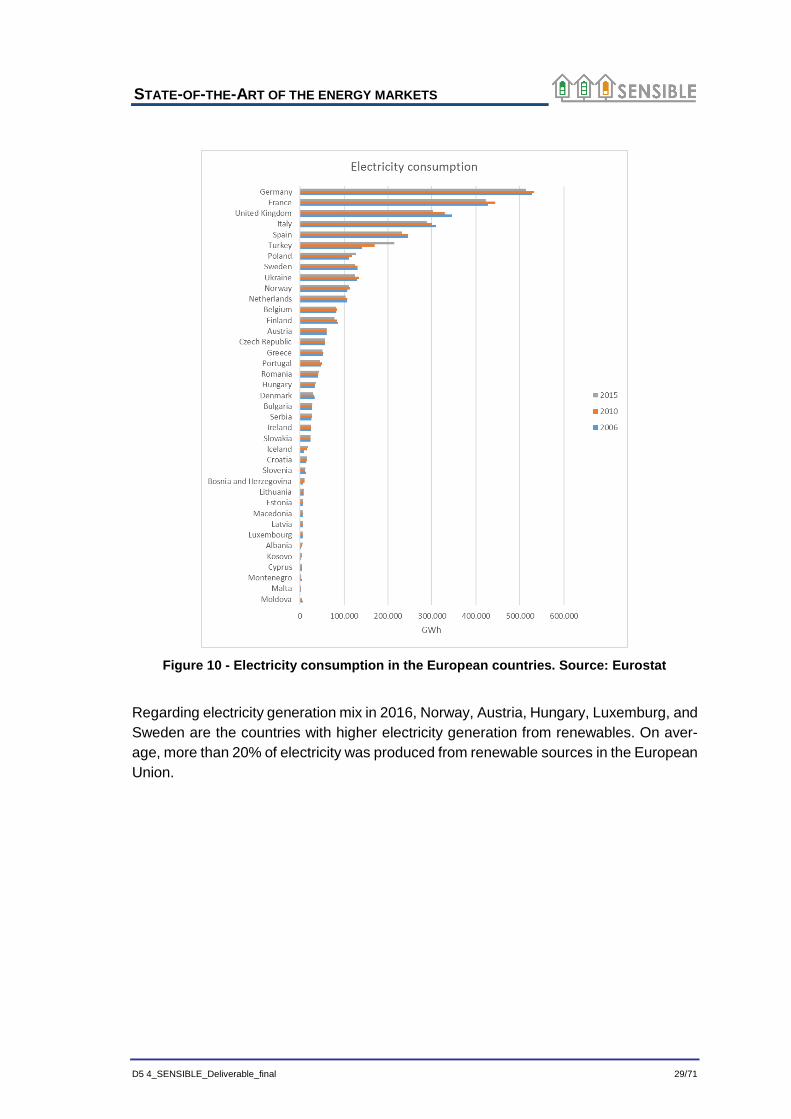
Figure 10 - Electricity consumption in the European countries. Source: Eurostat
Regarding electricity generation mix in 2016, Norway, Austria, Hungary, Luxemburg, and
Sweden are the countries with higher electricity generation from renewables. On aver-
age, more than 20% of electricity was produced from renewable sources in the European
Union.
STATE-OF-THE-ART OF THE ENERGY MARKETS
D5 4_SENSIBLE_Deliverable_final 30/71
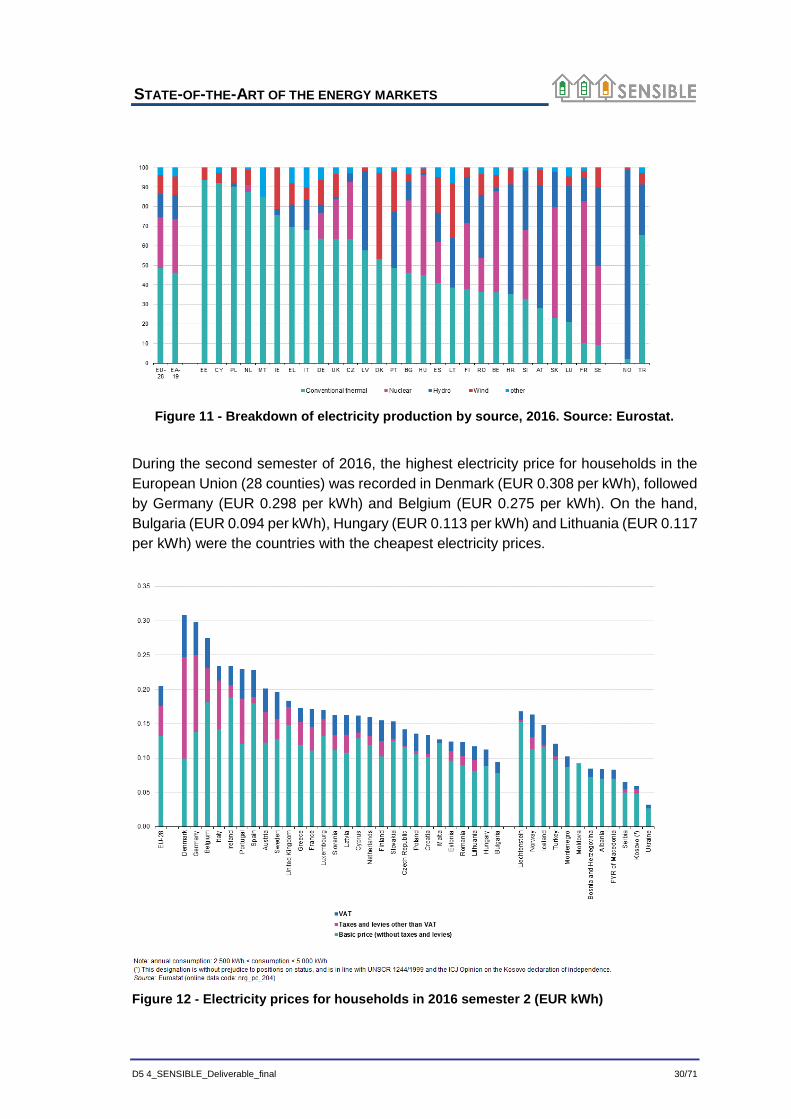
Figure 11 - Breakdown of electricity production by source, 2016. Source: Eurostat.
During the second semester of 2016, the highest electricity price for households in the
European Union (28 counties) was recorded in Denmark (EUR 0.308 per kWh), followed
by Germany (EUR 0.298 per kWh) and Belgium (EUR 0.275 per kWh). On the hand,
Bulgaria (EUR 0.094 per kWh), Hungary (EUR 0.113 per kWh) and Lithuania (EUR 0.117
per kWh) were the countries with the cheapest electricity prices.
Figure 12 - Electricity prices for households in 2016 semester 2 (EUR kWh)
STATE-OF-THE-ART OF THE ENERGY MARKETS
D5 4_SENSIBLE_Deliverable_final 31/71
Figure 12 also demonstrate that the proportion of taxes varies widely among countries.
The lowest amount of taxes contributions is paid in Malta (4.8 %) where a low VAT rate
is applied to the basic price and no other taxes are charged to household consumers. In
opposition, in Denmark, the taxes and levies account for 67.8% of the total electricity
price paid by households.
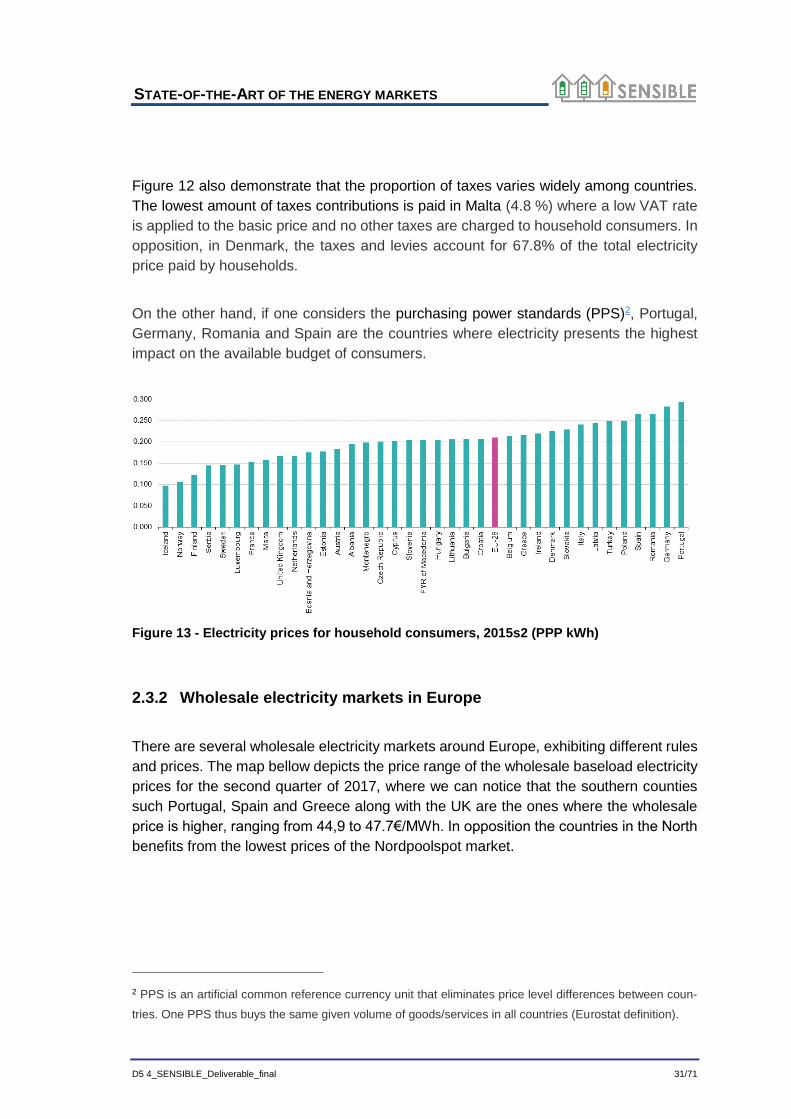
On the other hand, if one considers the purchasing power standards (PPS)2, Portugal,
Germany, Romania and Spain are the countries where electricity presents the highest
impact on the available budget of consumers.
Figure 13 - Electricity prices for household consumers, 2015s2 (PPP kWh)
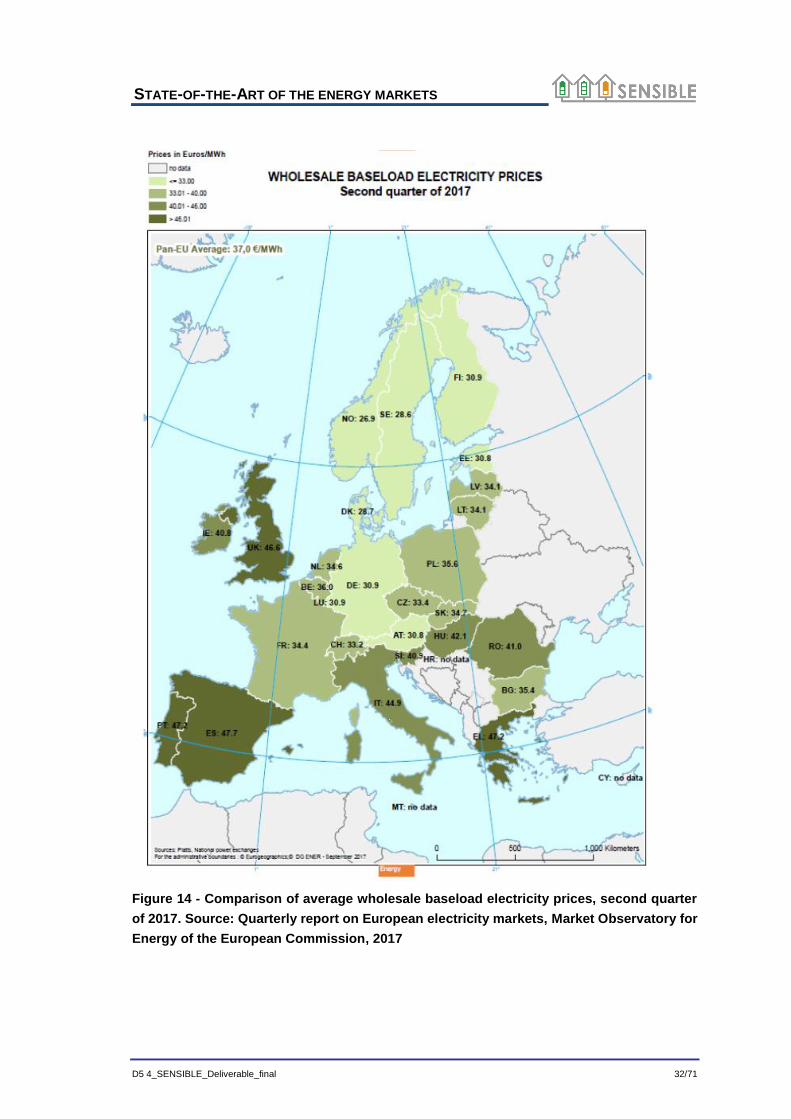
2.3.2 Wholesale electricity markets in Europe
There are several wholesale electricity markets around Europe, exhibiting different rules
and prices. The map bellow depicts the price range of the wholesale baseload electricity
prices for the second quarter of 2017, where we can notice that the southern counties
such Portugal, Spain and Greece along with the UK are the ones where the wholesale
price is higher, ranging from 44,9 to 47.7€/MWh. In opposition the countries in the North
benefits from the lowest prices of the Nordpoolspot market.
2 PPS is an artificial common reference currency unit that eliminates price level differences between coun-
tries. One PPS thus buys the same given volume of goods/services in all countries (Eurostat definition).
STATE-OF-THE-ART OF THE ENERGY MARKETS
D5 4_SENSIBLE_Deliverable_final 32/71
Figure 14 - Comparison of average wholesale baseload electricity prices, second quarter
of 2017. Source: Quarterly report on European electricity markets, Market Observatory for
Energy of the European Commission, 2017
STATE-OF-THE-ART OF THE ENERGY MARKETS
D5 4_SENSIBLE_Deliverable_final 33/71
In the following sections, a more detail information about the electricity prices in the most
relevant European wholesale markets is presented as well as some details about its
functioning.
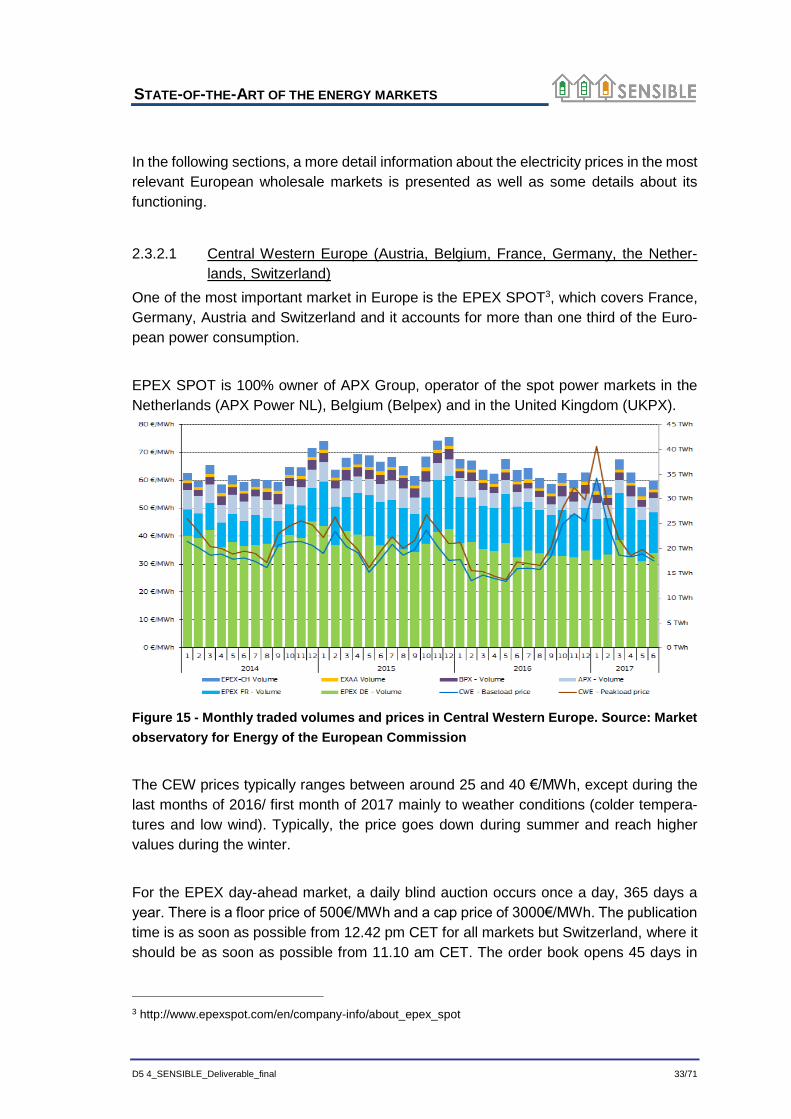
2.3.2.1 Central Western Europe (Austria, Belgium, France, Germany, the Nether-
lands, Switzerland)
One of the most important market in Europe is the EPEX SPOT3, which covers France,
Germany, Austria and Switzerland and it accounts for more than one third of the Euro-
pean power consumption.
EPEX SPOT is 100% owner of APX Group, operator of the spot power markets in the
Netherlands (APX Power NL), Belgium (Belpex) and in the United Kingdom (UKPX).
Figure 15 - Monthly traded volumes and prices in Central Western Europe. Source: Market
observatory for Energy of the European Commission
The CEW prices typically ranges between around 25 and 40 €/MWh, except during the
last months of 2016/ first month of 2017 mainly to weather conditions (colder tempera-
tures and low wind). Typically, the price goes down during summer and reach higher
values during the winter.
For the EPEX day-ahead market, a daily blind auction occurs once a day, 365 days a
year. There is a floor price of 500€/MWh and a cap price of 3000€/MWh. The publication
time is as soon as possible from 12.42 pm CET for all markets but Switzerland, where it
should be as soon as possible from 11.10 am CET. The order book opens 45 days in
3 http://www.epexspot.com/en/company-info/about_epex_spot
STATE-OF-THE-ART OF THE ENERGY MARKETS
D5 4_SENSIBLE_Deliverable_final 34/71
advance for France, Germany, Austria and Switzerland, 14 days for Netherlands, Bel-
gium and UK and closes one day before delivery at 12 pm CET (all markets but Switzer-
land, where it closes at 11 am.
Regarding the intraday market, it is divided into continuous and auction trading. The cap
and floor prices are the same as the intraday.
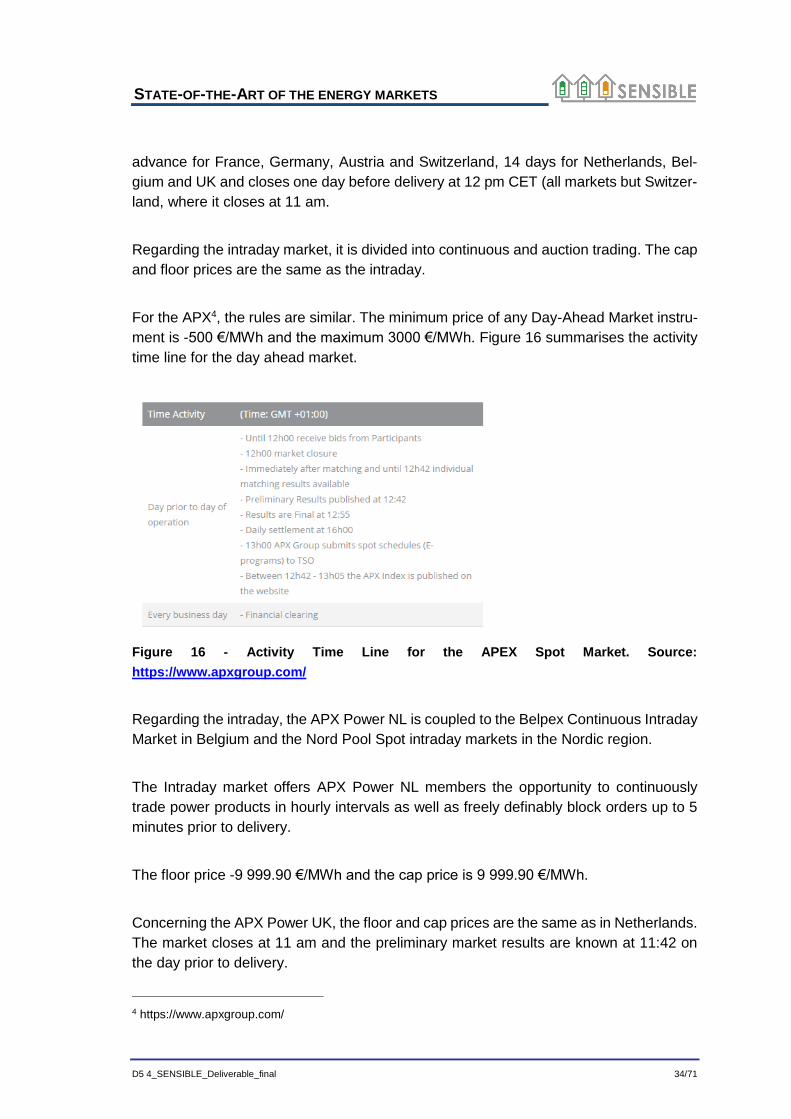
For the APX4, the rules are similar. The minimum price of any Day-Ahead Market instru-
ment is -500 €/MWh and the maximum 3000 €/MWh. Figure 16 summarises the activity
time line for the day ahead market.
Figure 16 - Activity Time Line for the APEX Spot Market. Source:
https://www.apxgroup.com/
Regarding the intraday, the APX Power NL is coupled to the Belpex Continuous Intraday
Market in Belgium and the Nord Pool Spot intraday markets in the Nordic region.
The Intraday market offers APX Power NL members the opportunity to continuously
trade power products in hourly intervals as well as freely definably block orders up to 5
minutes prior to delivery.
The floor price -9 999.90 €/MWh and the cap price is 9 999.90 €/MWh.
Concerning the APX Power UK, the floor and cap prices are the same as in Netherlands.
The market closes at 11 am and the preliminary market results are known at 11:42 on
the day prior to delivery.
4 https://www.apxgroup.com/
STATE-OF-THE-ART OF THE ENERGY MARKETS
D5 4_SENSIBLE_Deliverable_final 35/71
In addition, the market members at UK have also the opportunity to submit half hour bids
in a local Day-Ahead auction (double-sided blind auction) at 15:30 and the market results
are published 30 minutes later.
The physical power exchange for Belgium is the Belpex5 and the Day-Ahead market is
coupled with APX in the Netherlands and EPEX Spot in France and Germany. The order
books close at 12:00 and the results are published under normal circumstances no later
than 13:05. As for the other APX countries, the floor price is -500 €/MWh and the cap
price is 3000 €/MWh, whereas for the intraday the prices are between -9999.99 and
9999.99 €/MWh.
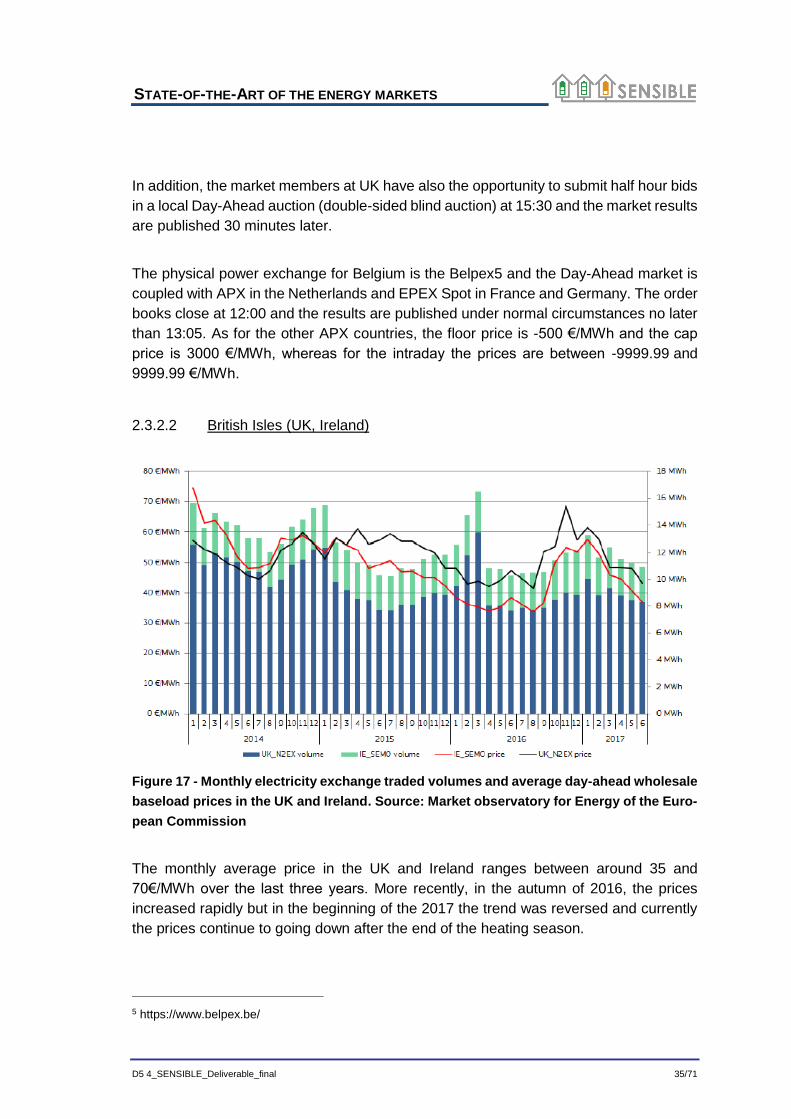
2.3.2.2 British Isles (UK, Ireland)
Figure 17 - Monthly electricity exchange traded volumes and average day-ahead wholesale
baseload prices in the UK and Ireland. Source: Market observatory for Energy of the Euro-
pean Commission
The monthly average price in the UK and Ireland ranges between around 35 and
70€/MWh over the last three years. More recently, in the autumn of 2016, the prices
increased rapidly but in the beginning of the 2017 the trend was reversed and currently
the prices continue to going down after the end of the heating season.
5 https://www.belpex.be/
STATE-OF-THE-ART OF THE ENERGY MARKETS
D5 4_SENSIBLE_Deliverable_final 36/71
As explained above, the UK market is operated by the APX power spot exchange, spe-
cifically by the APX Power UK. The floor and cap prices are the same as in the APEX
countries (-500€/MWh and 3000€/MWH, respectively). The market closes at 11 am and
the preliminary market results are known at 11:42 on the day prior to delivery.
The wholesale electricity market in Ireland and North Ireland is the Single Electricity Mar-
ket6 (SEM), which operates with dual currencies and in multiple jurisdictions, being the
first market of its kind in the world. In this case, the floor price was set at -100€/MWH
and cap price was set at 1000€/MWh.
2.3.2.3 Northern Europe (Denmark, Estonia, Finland, Latvia, Lithuania, Norway,
Sweden)
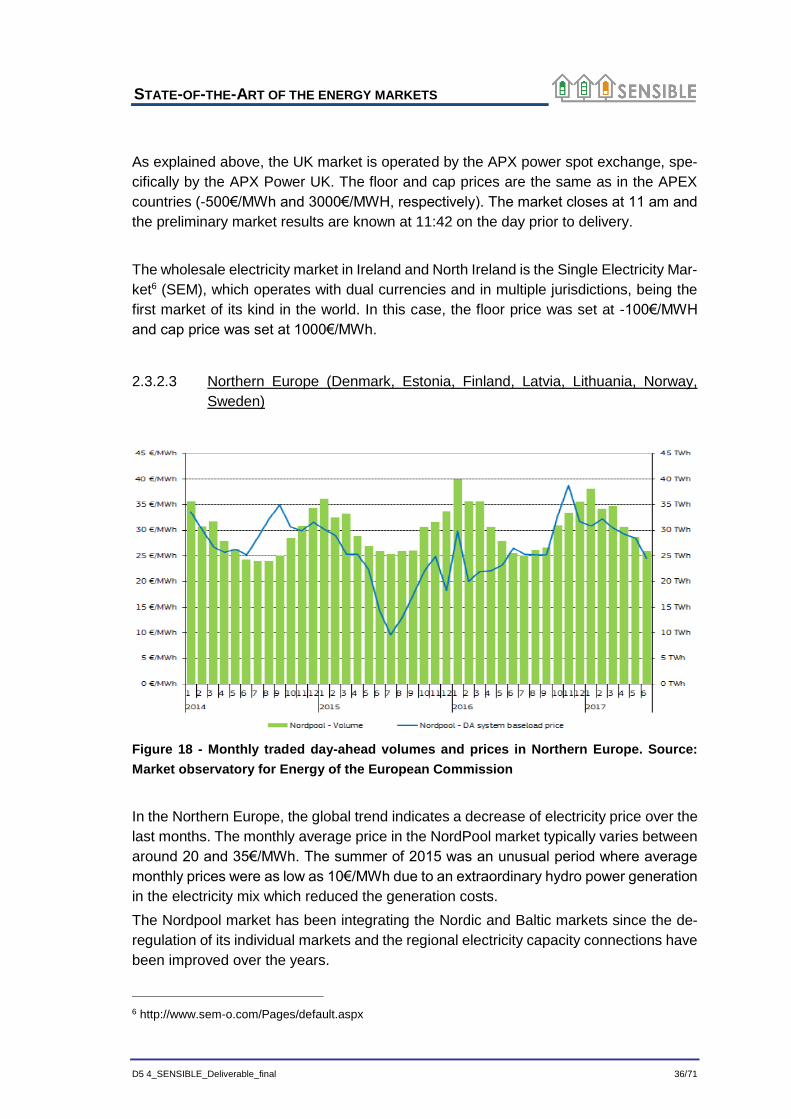
Figure 18 - Monthly traded day-ahead volumes and prices in Northern Europe. Source:
Market observatory for Energy of the European Commission
In the Northern Europe, the global trend indicates a decrease of electricity price over the
last months. The monthly average price in the NordPool market typically varies between
around 20 and 35€/MWh. The summer of 2015 was an unusual period where average
monthly prices were as low as 10€/MWh due to an extraordinary hydro power generation
in the electricity mix which reduced the generation costs.
The Nordpool market has been integrating the Nordic and Baltic markets since the de-
regulation of its individual markets and the regional electricity capacity connections have
been improved over the years.
6 http://www.sem-o.com/Pages/default.aspx
STATE-OF-THE-ART OF THE ENERGY MARKETS
D5 4_SENSIBLE_Deliverable_final 37/71
For the day ahead market, bids have to be submitted until 12:00 CET and the hourly
prices are typically announced at 12:42 CET. Regarding the intraday market, it embraces
not only the Nordic and Baltic countries, but also the UK and German markets.
2.3.2.4 Apennine Peninsula (Italy)
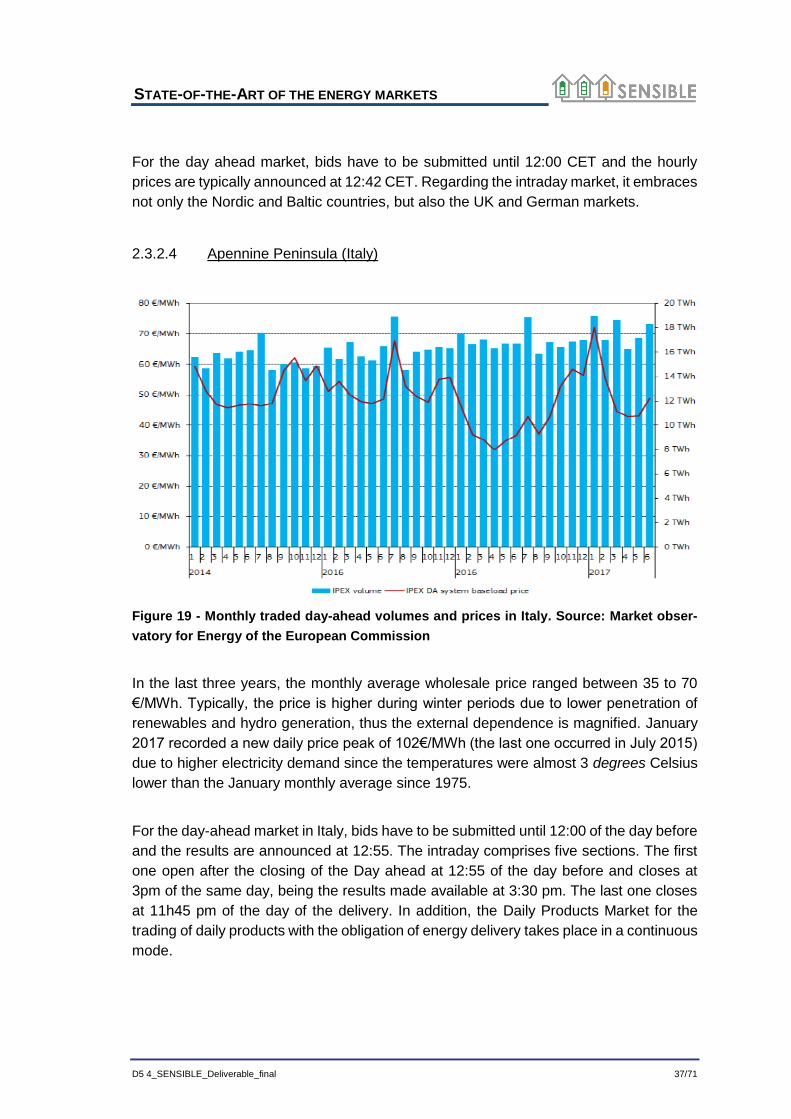
Figure 19 - Monthly traded day-ahead volumes and prices in Italy. Source: Market obser-
vatory for Energy of the European Commission
In the last three years, the monthly average wholesale price ranged between 35 to 70
€/MWh. Typically, the price is higher during winter periods due to lower penetration of
renewables and hydro generation, thus the external dependence is magnified. January
2017 recorded a new daily price peak of 102€/MWh (the last one occurred in July 2015)
due to higher electricity demand since the temperatures were almost 3 degrees Celsius
lower than the January monthly average since 1975.
For the day-ahead market in Italy, bids have to be submitted until 12:00 of the day before
and the results are announced at 12:55. The intraday comprises five sections. The first
one open after the closing of the Day ahead at 12:55 of the day before and closes at
3pm of the same day, being the results made available at 3:30 pm. The last one closes
at 11h45 pm of the day of the delivery. In addition, the Daily Products Market for the
trading of daily products with the obligation of energy delivery takes place in a continuous
mode.
STATE-OF-THE-ART OF THE ENERGY MARKETS
D5 4_SENSIBLE_Deliverable_final 38/71
2.3.2.5 Iberian Peninsula (Spain and Portugal)
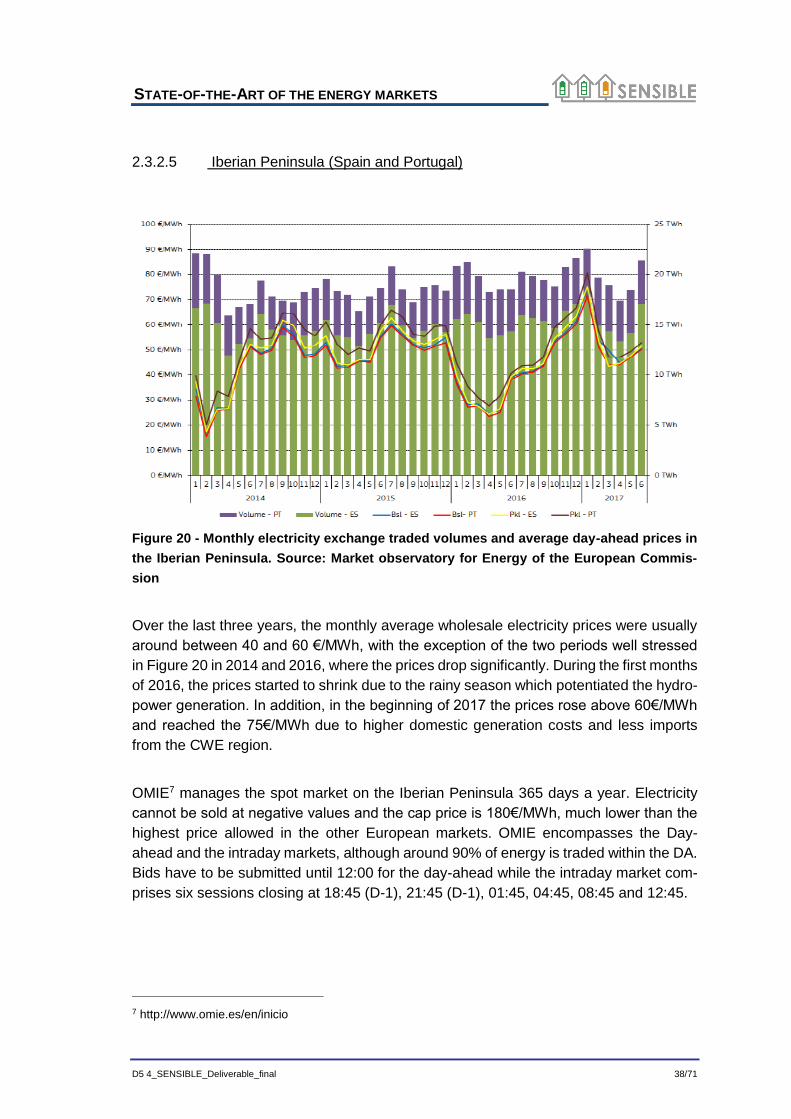
Figure 20 - Monthly electricity exchange traded volumes and average day-ahead prices in
the Iberian Peninsula. Source: Market observatory for Energy of the European Commis-
sion
Over the last three years, the monthly average wholesale electricity prices were usually
around between 40 and 60 €/MWh, with the exception of the two periods well stressed
in Figure 20 in 2014 and 2016, where the prices drop significantly. During the first months
of 2016, the prices started to shrink due to the rainy season which potentiated the hydro-
power generation. In addition, in the beginning of 2017 the prices rose above 60€/MWh
and reached the 75€/MWh due to higher domestic generation costs and less imports
from the CWE region.
OMIE7 manages the spot market on the Iberian Peninsula 365 days a year. Electricity
cannot be sold at negative values and the cap price is 180€/MWh, much lower than the
highest price allowed in the other European markets. OMIE encompasses the Day-
ahead and the intraday markets, although around 90% of energy is traded within the DA.
Bids have to be submitted until 12:00 for the day-ahead while the intraday market com-
prises six sessions closing at 18:45 (D-1), 21:45 (D-1), 01:45, 04:45, 08:45 and 12:45.
7 http://www.omie.es/en/inicio
STATE-OF-THE-ART OF THE ENERGY MARKETS
D5 4_SENSIBLE_Deliverable_final 39/71
2.3.2.6 Central Eastern Europe (Czech Republic, Hungary, Poland, Romania, Slo-
vakia, Slovenia)
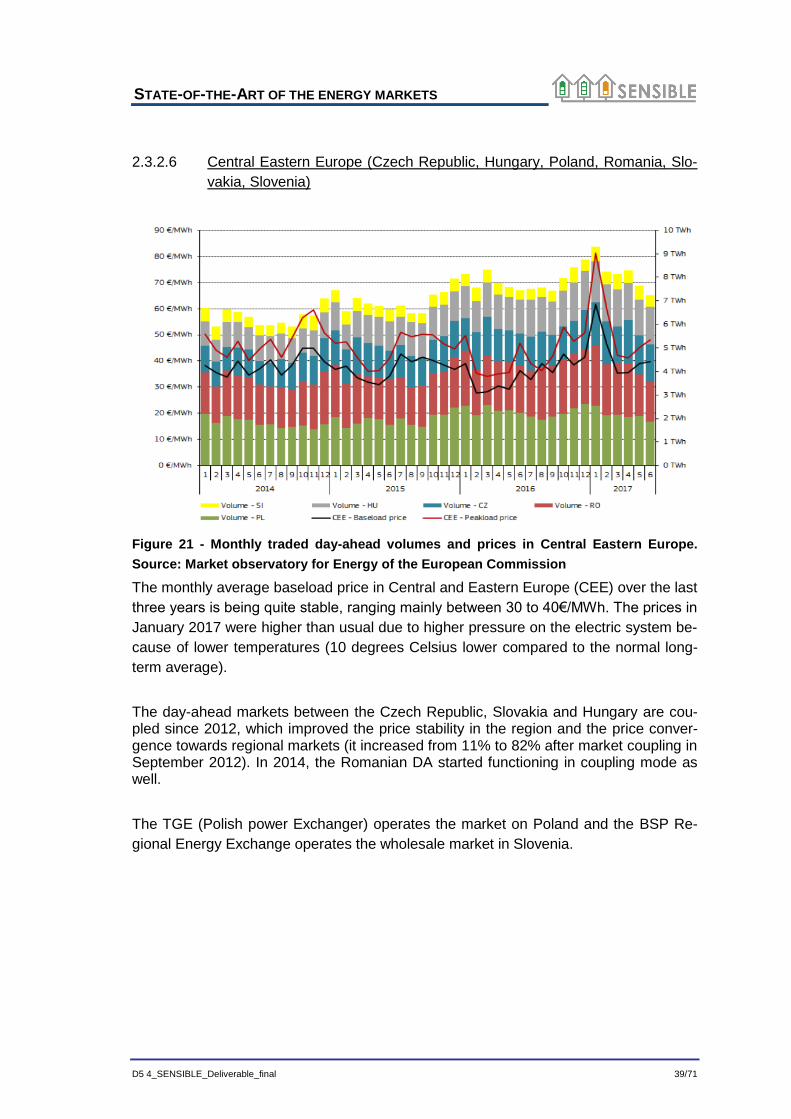
Figure 21 - Monthly traded day-ahead volumes and prices in Central Eastern Europe.
Source: Market observatory for Energy of the European Commission
The monthly average baseload price in Central and Eastern Europe (CEE) over the last
three years is being quite stable, ranging mainly between 30 to 40€/MWh. The prices in
January 2017 were higher than usual due to higher pressure on the electric system be-
cause of lower temperatures (10 degrees Celsius lower compared to the normal long-
term average).
The day-ahead markets between the Czech Republic, Slovakia and Hungary are cou-pled since 2012, which improved the price stability in the region and the price conver-gence towards regional markets (it increased from 11% to 82% after market coupling in September 2012). In 2014, the Romanian DA started functioning in coupling mode as well.
The TGE (Polish power Exchanger) operates the market on Poland and the BSP Re-
gional Energy Exchange operates the wholesale market in Slovenia.
STATE-OF-THE-ART OF THE ENERGY MARKETS
D5 4_SENSIBLE_Deliverable_final 40/71
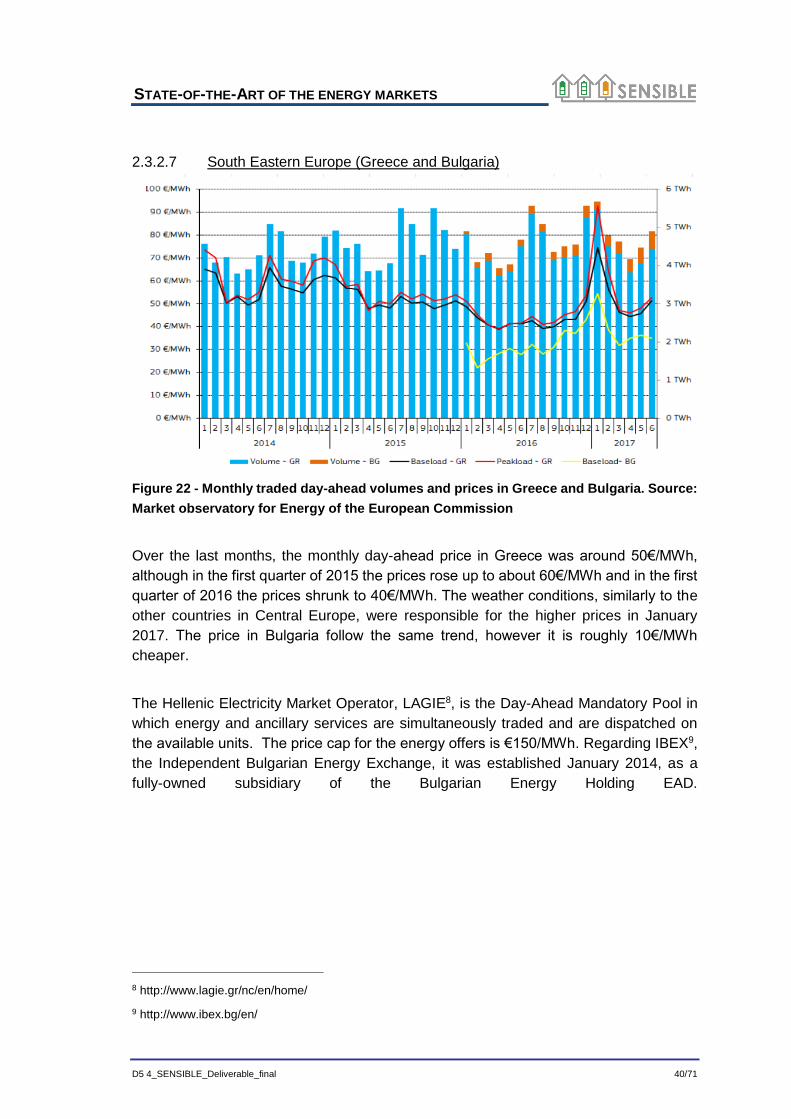
2.3.2.7 South Eastern Europe (Greece and Bulgaria)
Figure 22 - Monthly traded day-ahead volumes and prices in Greece and Bulgaria. Source:
Market observatory for Energy of the European Commission
Over the last months, the monthly day-ahead price in Greece was around 50€/MWh,
although in the first quarter of 2015 the prices rose up to about 60€/MWh and in the first
quarter of 2016 the prices shrunk to 40€/MWh. The weather conditions, similarly to the
other countries in Central Europe, were responsible for the higher prices in January
2017. The price in Bulgaria follow the same trend, however it is roughly 10€/MWh
cheaper.
The Hellenic Electricity Market Operator, LAGIE8, is the Day-Ahead Mandatory Pool in
which energy and ancillary services are simultaneously traded and are dispatched on
the available units. The price cap for the energy offers is €150/MWh. Regarding IBEX9,
the Independent Bulgarian Energy Exchange, it was established January 2014, as a
fully-owned subsidiary of the Bulgarian Energy Holding EAD.
8 http://www.lagie.gr/nc/en/home/
9 http://www.ibex.bg/en/
BUSINESS MODEL FRAMEWORK OVERVIEW
D5 4_SENSIBLE_Deliverable_final 41/71
3 Business model framework overview
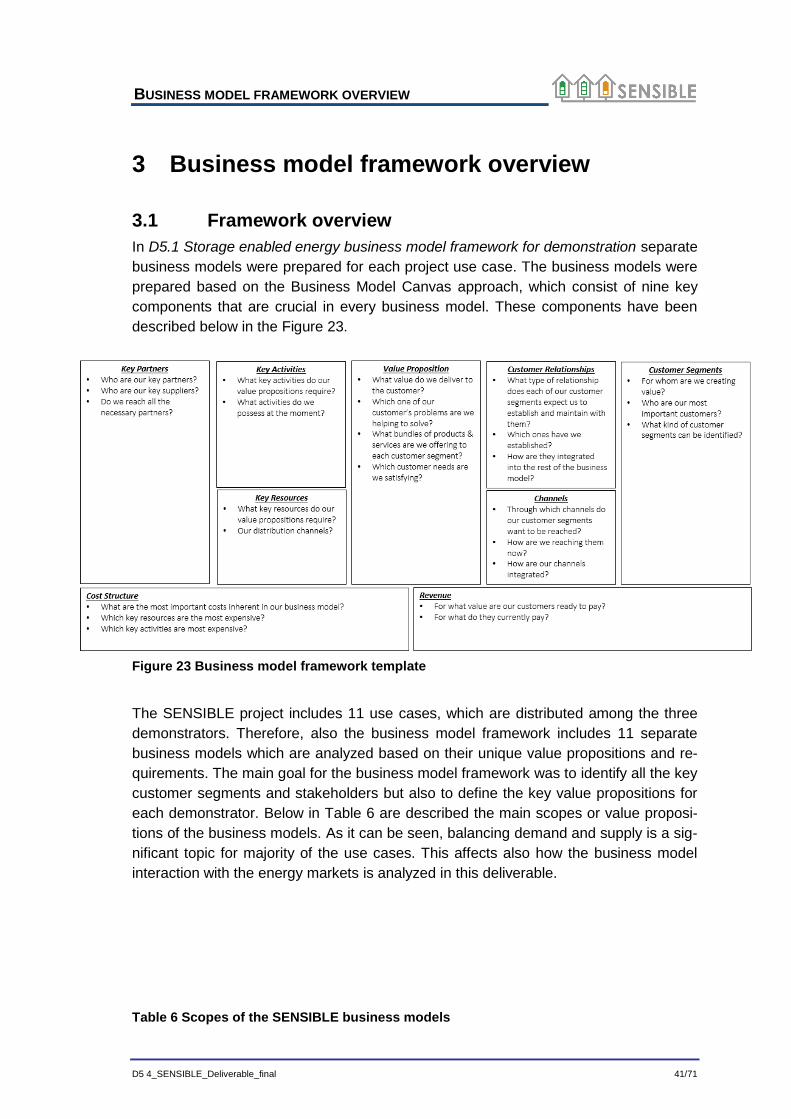
3.1 Framework overview
In D5.1 Storage enabled energy business model framework for demonstration separate
business models were prepared for each project use case. The business models were
prepared based on the Business Model Canvas approach, which consist of nine key
components that are crucial in every business model. These components have been
described below in the Figure 23.
Figure 23 Business model framework template
The SENSIBLE project includes 11 use cases, which are distributed among the three
demonstrators. Therefore, also the business model framework includes 11 separate
business models which are analyzed based on their unique value propositions and re-
quirements. The main goal for the business model framework was to identify all the key
customer segments and stakeholders but also to define the key value propositions for
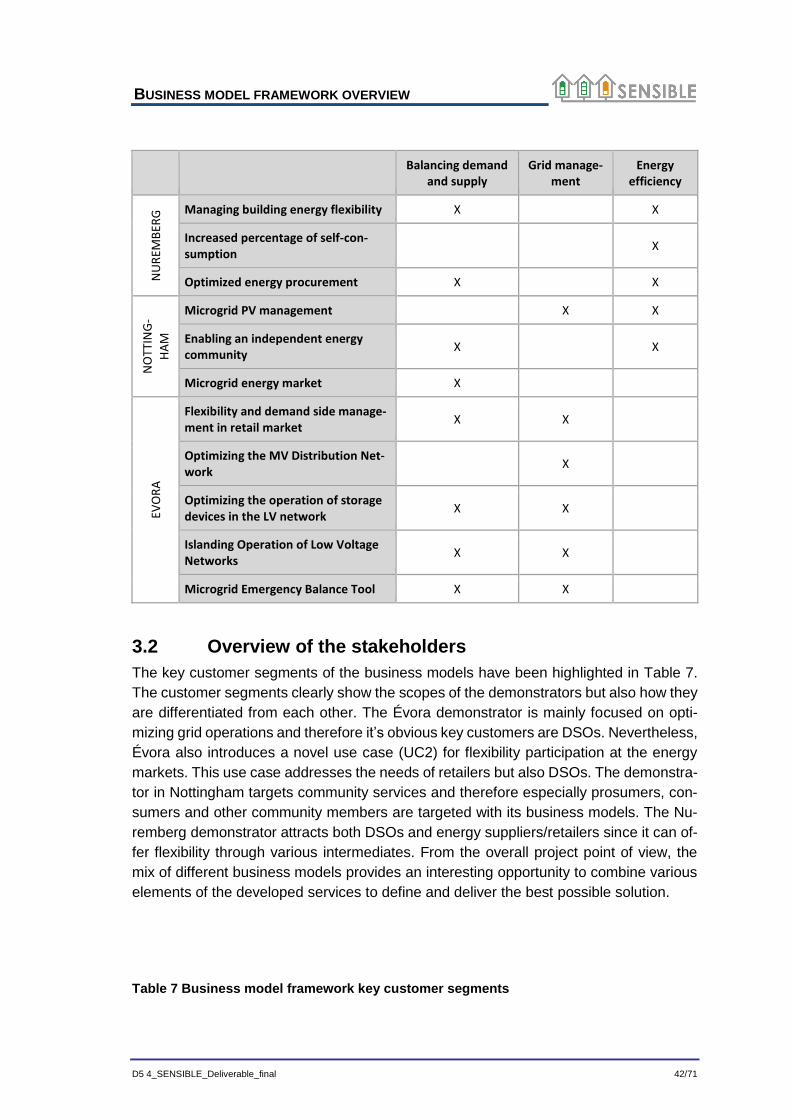
each demonstrator. Below in Table 6 are described the main scopes or value proposi-
tions of the business models. As it can be seen, balancing demand and supply is a sig-
nificant topic for majority of the use cases. This affects also how the business model
interaction with the energy markets is analyzed in this deliverable.
Table 6 Scopes of the SENSIBLE business models
BUSINESS MODEL FRAMEWORK OVERVIEW
D5 4_SENSIBLE_Deliverable_final 42/71
Balancing demand and supply
Grid manage-ment
Energy efficiency
NU
REM
BER
G Managing building energy flexibility X X
Increased percentage of self-con-sumption
X
Optimized energy procurement X X
NO
TTIN
G-
HA
M
Microgrid PV management X X
Enabling an independent energy community
X X
Microgrid energy market X
EVO
RA
Flexibility and demand side manage-ment in retail market
X X
Optimizing the MV Distribution Net-work
X
Optimizing the operation of storage devices in the LV network
X X
Islanding Operation of Low Voltage Networks
X X
Microgrid Emergency Balance Tool X X
3.2 Overview of the stakeholders
The key customer segments of the business models have been highlighted in Table 7.
The customer segments clearly show the scopes of the demonstrators but also how they
are differentiated from each other. The Évora demonstrator is mainly focused on opti-
mizing grid operations and therefore it’s obvious key customers are DSOs. Nevertheless,
Évora also introduces a novel use case (UC2) for flexibility participation at the energy
markets. This use case addresses the needs of retailers but also DSOs. The demonstra-
tor in Nottingham targets community services and therefore especially prosumers, con-
sumers and other community members are targeted with its business models. The Nu-
remberg demonstrator attracts both DSOs and energy suppliers/retailers since it can of-
fer flexibility through various intermediates. From the overall project point of view, the
mix of different business models provides an interesting opportunity to combine various
elements of the developed services to define and deliver the best possible solution.
Table 7 Business model framework key customer segments
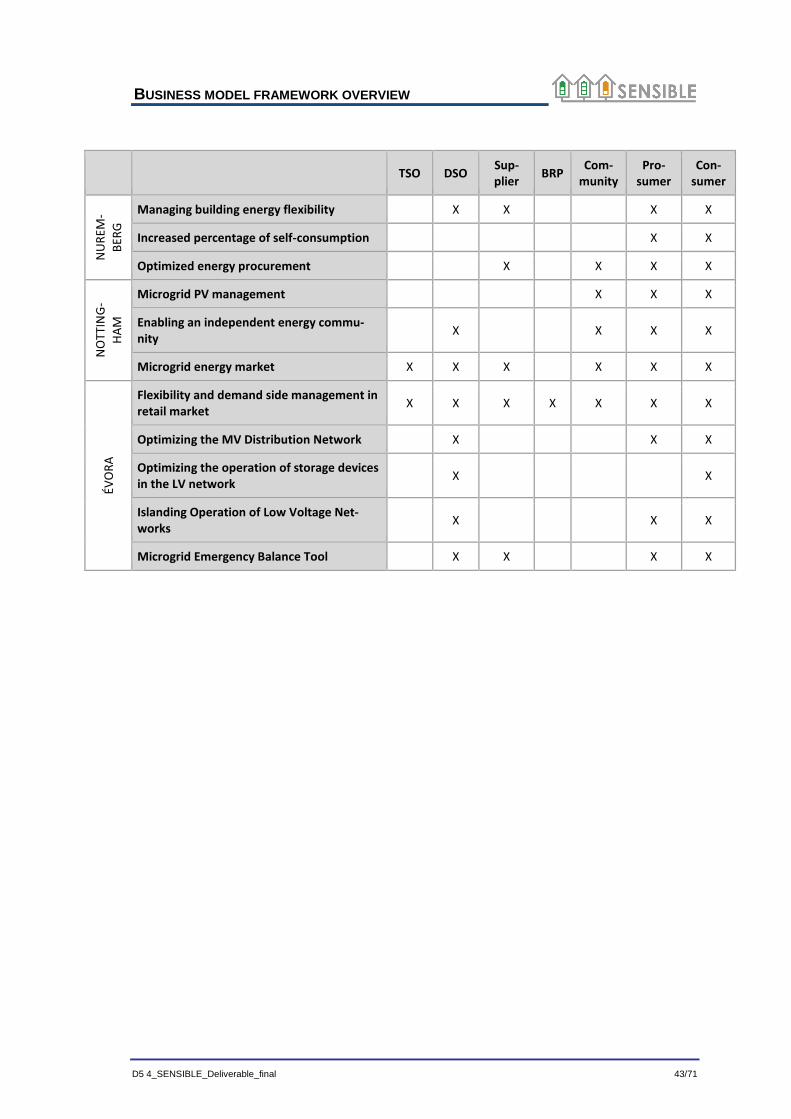
BUSINESS MODEL FRAMEWORK OVERVIEW
D5 4_SENSIBLE_Deliverable_final 43/71
TSO DSO Sup-plier
BRP Com-
munity Pro-
sumer Con-
sumer
NU
REM
-
BER
G
Managing building energy flexibility X X X X
Increased percentage of self-consumption X X
Optimized energy procurement X X X X
NO
TTIN
G-
HA
M
Microgrid PV management X X X
Enabling an independent energy commu-nity
X X X X
Microgrid energy market X X X X X X
ÉVO
RA
Flexibility and demand side management in retail market
X X X X X X X
Optimizing the MV Distribution Network X X X
Optimizing the operation of storage devices in the LV network
X X
Islanding Operation of Low Voltage Net-works
X X X
Microgrid Emergency Balance Tool X X X X
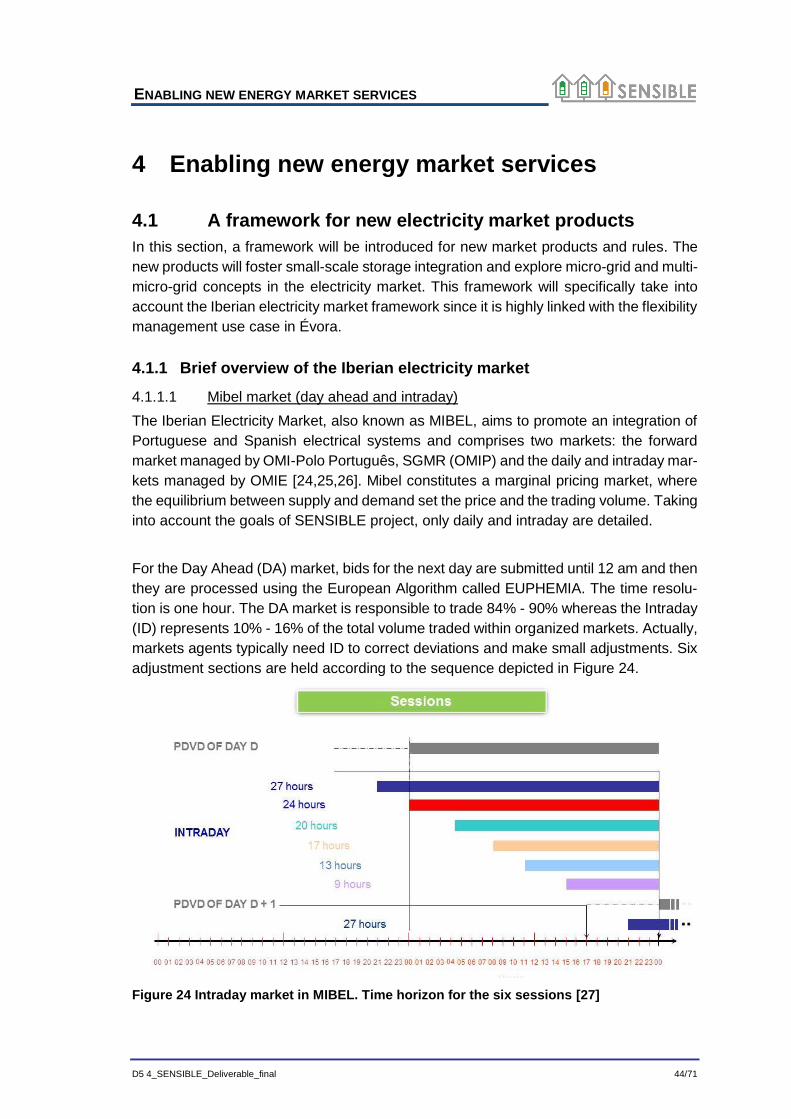
ENABLING NEW ENERGY MARKET SERVICES
D5 4_SENSIBLE_Deliverable_final 44/71
4 Enabling new energy market services
4.1 A framework for new electricity market products
In this section, a framework will be introduced for new market products and rules. The
new products will foster small-scale storage integration and explore micro-grid and multi-
micro-grid concepts in the electricity market. This framework will specifically take into
account the Iberian electricity market framework since it is highly linked with the flexibility
management use case in Évora.
4.1.1 Brief overview of the Iberian electricity market
4.1.1.1 Mibel market (day ahead and intraday)
The Iberian Electricity Market, also known as MIBEL, aims to promote an integration of
Portuguese and Spanish electrical systems and comprises two markets: the forward
market managed by OMI-Polo Português, SGMR (OMIP) and the daily and intraday mar-
kets managed by OMIE [24,25,26]. Mibel constitutes a marginal pricing market, where
the equilibrium between supply and demand set the price and the trading volume. Taking
into account the goals of SENSIBLE project, only daily and intraday are detailed.
For the Day Ahead (DA) market, bids for the next day are submitted until 12 am and then
they are processed using the European Algorithm called EUPHEMIA. The time resolu-
tion is one hour. The DA market is responsible to trade 84% - 90% whereas the Intraday
(ID) represents 10% - 16% of the total volume traded within organized markets. Actually,
markets agents typically need ID to correct deviations and make small adjustments. Six
adjustment sections are held according to the sequence depicted in Figure 24.
Figure 24 Intraday market in MIBEL. Time horizon for the six sessions [27]
ENABLING NEW ENERGY MARKET SERVICES
D5 4_SENSIBLE_Deliverable_final 45/71
It is also important to notice that negative prices are not allowed, i.e., the floor price is 0
€/MWh and the cap price is 180,3 €/MWh. Furthermore, when congestion appears be-
tween Portugal and Spain, market splitting is enforced allowing two price areas. Most of
the time Portuguese price is higher, however during 2015 the price difference was lower
than 1€/MWh for 98,1% of the hours.
4.1.1.2 Ancillary services / Complementary services
In Portugal and Spain, reserves are managed by TSO: REN in Portugal and REE in
Spain [28,29]. In Portugal, reserve markets are specifically designed for hydro and ther-
mal power plants. In Spain, all generators can participate into balancing markets, as long
as they succeed in the test procedures.
Primary reserve
It does not constitute a real market since it is compulsory and not paid. All generators
must allow for a regulation of 5% of its nominal capacity. Generators connected to the
transmission grid who do not have the capacity for primary regulation must contract it
directly to other entities.
Secondary reserve
The secondary reserve is allocated the day before and this complementary service aims
at maintaining the frequency within reference values and balancing between produc-
tions. This market is based on the upwards and downwards regulation band that a power
plant is able to provide. The power plants are remunerated by the offered band, i.e. by
the capacity to increase or decrease the production in €/MW and the supplied energy.
The system manager determines the amount of reserve that should be retained for each
programming period based on predictable temporal evolution of consumption and the
expected probability of failure of connected generators.
Tertiary reserve
The tertiary reserve is triggered whenever it is needed and it aims to recover strong
oscillations/unbalances of the electric system that primary and secondary reserves can’t
restore. The minimum reserve of tertiary regulation in each programming period will be
established by the system manager, with reference to the maximum loss of production
caused directly by the simple failure of an electrical system component, increased by 2%
in consumption in each period programming.
Interruptibility services
Apart from reserves, TSO can also resort to interruptibility services. In accordance with
the provisions of Ministerial Order n.º 592/2010, amended by Ministerial Order n.º
ENABLING NEW ENERGY MARKET SERVICES
D5 4_SENSIBLE_Deliverable_final 46/71
1308/2010, the interruptibility service is understood to be a complementary service which
consists of the voluntary reduction by consumers in their consumption of electricity to a
value less than or equal to the residual power value, in reply to a power reduction order
given by the Transmission Network Operator. The interruptibility service allows:
Rapid and efficient response to possible emergency situations;
Increase in system operation flexibility;
Improvement in security of supply.
The management of all aspects of this service, in administrative, technical and
operational terms, is granted to REN as the Transmission Network Operator.
According to the REN annual report, in 2015 in Portugal, the total contractual power was
1408 MW, the remuneration for the provision of interruptible service accounted for 109.9
million €. However, the TSO has not triggered any power reduction order [30]. In Portu-
gal, big consumers apply to offer this service and it is a contractual agreement between
consumers and REN. In Spain, it is competitive allocation mechanism managed by REE
and an auction system with face-to-face bidding is used [31].
4.1.2 Microgrids and isolated operation
4.1.2.1 Microgrid concept
Operators of modern distribution systems that include high integration of distributed en-
ergy resources, demand variability and electric energy storage (EES) face a challenging
task to meet current requirements of reliability, security and quality of supply. Decentral-
ized control schemes are being proposed at the distribution level to assure these require-
ments are met with increased system observability and controllability of the grid. The
Smart Grid (SG) developments are in line with these goals, where the Microgrid concept
plays an important role.
A Microgrid can be defined as a “flexible cell” within the electric power system that in-
cludes local generation based on renewable energy sources (RES) and low-carbon tech-
nologies (LCT), EES devices and controllable loads. These resources are coordinated
by a local management and control system that adequately support the operation of the
LV network and control the power flow between the Microgrid and the upstream MV
network.
The deployment of the Microgrid concept can endow the distribution networks with in-
creased reliability, continuity of supply, and resilience. The implementation of this con-
cept requires suitable management and control schemes to ensure a considerable de-
ployment of Microgeneration (MG) and EES. Moreover, the distributed generation and
ENABLING NEW ENERGY MARKET SERVICES
D5 4_SENSIBLE_Deliverable_final 47/71
the EES can be exploited to guarantee increased continuity of supply and local restora-
tion procedures following a blackout (black start) to ensure the proper operation of these
networks in islanded mode [32].
4.1.2.2 EES role during islanded operation of MG
EES can be seen as flexible resources that contribute to improve Microgrid operating
conditions when connected to the upstream MV grid which can be exploited in the is-
landed operation of the LV networks and in its restoration procedure. The Microgrid is
operated in islanded mode, i.e. autonomously, when major disturbances occur in the
upstream MV grid leading to its disconnection. In order to maintain the quality of supply,
the EES needs to guarantee voltage and frequency regulation capabilities. These control
strategies exploit the coordination between the EES, the MG and the load. In this sense,
the EES can be considered as highly flexible load/generator and the exploitation of this
characteristic can ensure an improved frequency and voltage regulation capabilities and
increased Microgrid resilience during islanded operation by avoiding large frequency and
voltage excursions caused by load disconnection or MG output variations [32]. Hence,
the EES is expected to provide three main services to the operator of the LV grid in the
islanded mode:
a) Multi-temporal optimization of energy balance;
b) Autonomous voltage and frequency control;
c) Microgrid black start.
4.1.2.2.1 Multi-temporal optimization of energy balance
After MG islanding, the power balance between generation and load requires that the
EES are capable of providing fast active and reactive power compensation as required.
Hence, EES devices must enable peak shaving, demand offset, and mitigation of MG
power fluctuations, by charging when there is energy surplus and discharging when there
is energy deficit. In a context of increasing penetration of renewable resources and the
related uncertainty, the integration of EES gives the opportunity to optimize the genera-
tion schedule across several time-horizons, thus requiring the EES devices to adapt their
input and output power as demanded by the Microgrid central controller [33]. Further-
more, this multi-temporal control must take into account load interruptibility contracts and
must be capable of forecasting the power output provided by renewable-based MG.
4.1.2.2.2 Autonomous voltage and frequency control
During the islanded operation, the stability and quality of supply of the Microgrid depends
on the effectiveness of voltage and frequency control schemes, which are coordinated
by the Microgrid central controller and the EES. In the islanded operation, the Microgrid
is more sensitive to voltage unbalance due to uneven connection of single-phase loads
ENABLING NEW ENERGY MARKET SERVICES
D5 4_SENSIBLE_Deliverable_final 48/71
and MG, and further emphasized by the connection of single-phase storage units charg-
ing interfaces. In pursuance of maintaining adequate voltage quality levels, active volt-
age compensation schemes using the distributed EES units are utilized to remove the
undesirable negative and zero sequence voltage components [32].
EES can be utilized in coordinated voltage control schemes appropriate for distribution
networks with highly uneven distributions of load and generation. This ESS integrated
voltage control scheme can provide effective voltage control solutions and can solve
steady-state voltage imbalances, which can occur in LV nodes due to the presence of
distributed generation. Moreover, the EES can be distributed in strategic parts of the
feeder, which not only improve the voltage control and insure the operation of grid equip-
ment according to manufacturer specifications but also reduce active power losses [34].
The exploitation of load flexibility and distributed storage capacity offered by the MG local
storage devices improve significantly the Microgrid frequency regulation capacity. Using
an active power/frequency droop control scheme after the islanding, both the Microgrid
main storage system (connected to the MV/LV substation) and the distributed EES will
be responsible for the MG frequency control by quickly injecting/absorbing power con-
sidering the capacity and droop characteristics after the occurrence of a disturbance.
When the frequency achieves values out of the droop control frequency range, the EES
injects/absorbs a pre-defined power [32].
4.1.2.2.3 Microgrid black start
The Microgrid restoration procedure following a local blackout comprises a sequence of
actions to be engaged by Microgrid local controllers in a tight coordination with EES to
resupply the load as fast as possible without the help of the upstream MV grid. The
Microgrid black start procedure should be performed automatically and without the inter-
vention of the LV network operator. Besides a highly responsive EES, the implementa-
tion of this service assumes that the Microgrid has:
MS with black start capabilities, capable of communicating the power available
and its operational status;
LV switches to disconnect feeders, loads and MG and suitable protection equip-
ment;
Communication infrastructure powered by dedicated auxiliary units;
In the restoration stages, the EES power output needs to be tightly controlled such that
the load pick-up is made in an optimized way without triggering protective devices that
respond to large frequency/voltage excursions. In addition, the Microgrid central control-
ler needs to have information about the load restoration priorities and be able to con-
nect/disconnect loads and MG in order to supply to most of the local consumers in the
shortest amount of time [32].
ENABLING NEW ENERGY MARKET SERVICES
D5 4_SENSIBLE_Deliverable_final 49/71
4.1.3 Regulatory framework for storage
The main regulatory barrier for storage in Europe today is actually the absence of regu-
lation both for bulk or small-scale storage. The Electricity Directive does not even men-
tion storage and no clear definition of storage exists in the European regulation. Likewise,
ENTSO-E’s network codes do not clearly define storage and thus storage is most of the
time treated as a generator, without considering its specificities, which limits the possi-
bilities for the participation of storage in the electrical system.
Regarding the balancing activities, the Electricity Directive mentions in Article 15 (7) the
need for rules and tariffs ensuring a transparent, non-discriminatory and cost-reflective
methodology. This is a positive position that shall still be transposed to the national leg-
islation, as storage’s technical characteristics and flexibility shall be valuable for the op-
eration of the future electric systems, with an increasing part of intermittent generation.
The Council of European Energy Regulators (CEER) issued a paper on the role of
DSO’s, where the following recommendation is issued: “In electricity, storage is consid-
ered, in principle, a market activity and therefore the role of DSO in storage should be
limited to the use of specific grid-oriented services [35]. However, energy storage
cannot be used as a substitute for fully available distribution lines, but could be used to
solve network constraints on a temporary basis. DSOs can use storage services, pro-
vided this technical solution is justified as the most cost-efficient option and is sourced in
a non-discriminatory manner. The DSOs‟ role in storage will be considered again, once
a market is properly developed for local, grid related services“. This position has not yet
been transposed to the European regulation, but must be considered as a potential future
barrier for DSO ownership of storage.
4.1.3.1 Storage supporting DSO activities
As seen above, DSOs ownership and operation of storage is not yet clearly regulated.
As DSOs evolve in a regulated environment, there is a risk involved on investing in stor-
age assets considering potential future evolution of regulation. Nevertheless, there are
several benefits of using storage for the DSO’s activities:
Increase the DER penetration
Reduce technical losses in the grid
Delay network investment
Although this potential benefits are very interesting, some DSO’s still don’t invest in stor-
age assets due to one or several of the following reasons:
ENABLING NEW ENERGY MARKET SERVICES
D5 4_SENSIBLE_Deliverable_final 50/71
Cost of the storage (compared to reinforcing the grid, in some conditions, also
linked to the DSO financing mode) – this shall continue to decrease in the follow-
ing years
Lack of experience using storage assets and need for extremely high reliability
of every grid equipment
Lack of standardisation of storage related (communication, technical tests, secu-
rity, certification, local authorities’ validation, etc.)
4.1.3.2 Storage supporting retailer activities
Retailers usually evolve in a market environment, so the regulation barrier is less sensi-
ble for this stakeholder. Nevertheless, in addition to the use of storage for its own needs,
the retailer may use the storage to supply services to the electrical grid (both for DSO’s
or TSO’s). This shall be subject to the existing legal framework, so it also has a strong
impact on the potential value of the storage for this stakeholder. The above mentioned
example of the balancing areas and the importance of a fair and clear regulation to allow
every asset to participate in this type of services show the importance of this clarification
also for retailers.
As mentioned before, retailers may use the storage assets for both the supply of services
to the grids or for their own needs. Some of the benefits of storage to support retailer’s
activities are:
Imbalance management/reduction
Energy portfolio optimization
These benefits shall be possible if and when retailers have other technical functionalities
available, such as close to real time metering data and ICT tools to treat and support the
decision making.
4.1.3.3 Demonstration and validation of concepts through Évora demonstrator
In the Évora demonstrator, the use cases will allow to demonstrate and validate the ben-
efits of the use of storage for the DSO and the retailer.
The UC 2 (Flexibility and DSM in the market participation) will test the services of storage
for the retailer and the DSO through an intermediary entity (an energy service provider)
belonging to the retailer. In this UC, the small scale storage, both in the grid and behind
the meter will provide flexibility to the grid and to the retailer. To achieve this, the partic-
ipation of volunteer clients is crucial, supplying their flexibility to the retailer (from water
heaters, electrical batteries or other flexible loads).
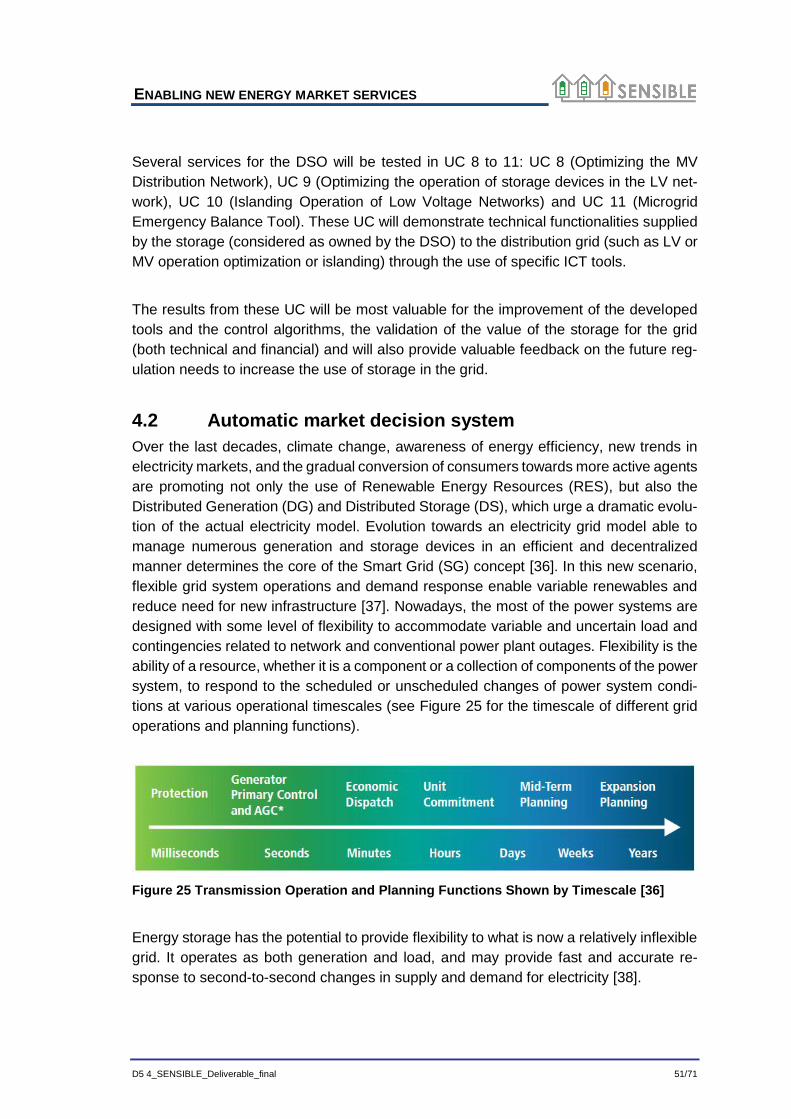
ENABLING NEW ENERGY MARKET SERVICES
D5 4_SENSIBLE_Deliverable_final 51/71
Several services for the DSO will be tested in UC 8 to 11: UC 8 (Optimizing the MV
Distribution Network), UC 9 (Optimizing the operation of storage devices in the LV net-
work), UC 10 (Islanding Operation of Low Voltage Networks) and UC 11 (Microgrid
Emergency Balance Tool). These UC will demonstrate technical functionalities supplied
by the storage (considered as owned by the DSO) to the distribution grid (such as LV or
MV operation optimization or islanding) through the use of specific ICT tools.
The results from these UC will be most valuable for the improvement of the developed
tools and the control algorithms, the validation of the value of the storage for the grid
(both technical and financial) and will also provide valuable feedback on the future reg-
ulation needs to increase the use of storage in the grid.
4.2 Automatic market decision system
Over the last decades, climate change, awareness of energy efficiency, new trends in
electricity markets, and the gradual conversion of consumers towards more active agents
are promoting not only the use of Renewable Energy Resources (RES), but also the
Distributed Generation (DG) and Distributed Storage (DS), which urge a dramatic evolu-
tion of the actual electricity model. Evolution towards an electricity grid model able to
manage numerous generation and storage devices in an efficient and decentralized
manner determines the core of the Smart Grid (SG) concept [36]. In this new scenario,
flexible grid system operations and demand response enable variable renewables and
reduce need for new infrastructure [37]. Nowadays, the most of the power systems are
designed with some level of flexibility to accommodate variable and uncertain load and
contingencies related to network and conventional power plant outages. Flexibility is the
ability of a resource, whether it is a component or a collection of components of the power
system, to respond to the scheduled or unscheduled changes of power system condi-
tions at various operational timescales (see Figure 25 for the timescale of different grid
operations and planning functions).
Figure 25 Transmission Operation and Planning Functions Shown by Timescale [36]
Energy storage has the potential to provide flexibility to what is now a relatively inflexible
grid. It operates as both generation and load, and may provide fast and accurate re-
sponse to second-to-second changes in supply and demand for electricity [38].
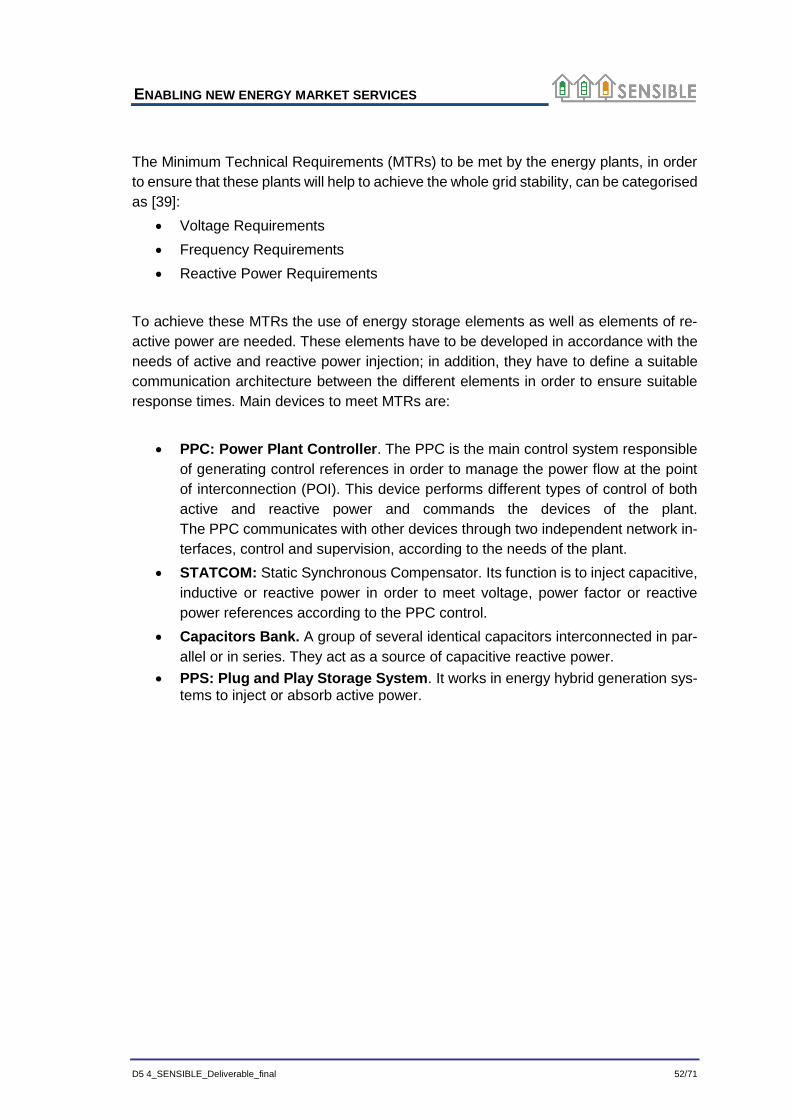
ENABLING NEW ENERGY MARKET SERVICES
D5 4_SENSIBLE_Deliverable_final 52/71
The Minimum Technical Requirements (MTRs) to be met by the energy plants, in order
to ensure that these plants will help to achieve the whole grid stability, can be categorised
as [39]:
Voltage Requirements
Frequency Requirements
Reactive Power Requirements
To achieve these MTRs the use of energy storage elements as well as elements of re-
active power are needed. These elements have to be developed in accordance with the
needs of active and reactive power injection; in addition, they have to define a suitable
communication architecture between the different elements in order to ensure suitable
response times. Main devices to meet MTRs are:
PPC: Power Plant Controller. The PPC is the main control system responsible
of generating control references in order to manage the power flow at the point
of interconnection (POI). This device performs different types of control of both
active and reactive power and commands the devices of the plant.
The PPC communicates with other devices through two independent network in-
terfaces, control and supervision, according to the needs of the plant.
STATCOM: Static Synchronous Compensator. Its function is to inject capacitive,
inductive or reactive power in order to meet voltage, power factor or reactive
power references according to the PPC control.
Capacitors Bank. A group of several identical capacitors interconnected in par-
allel or in series. They act as a source of capacitive reactive power.
PPS: Plug and Play Storage System. It works in energy hybrid generation sys-tems to inject or absorb active power.
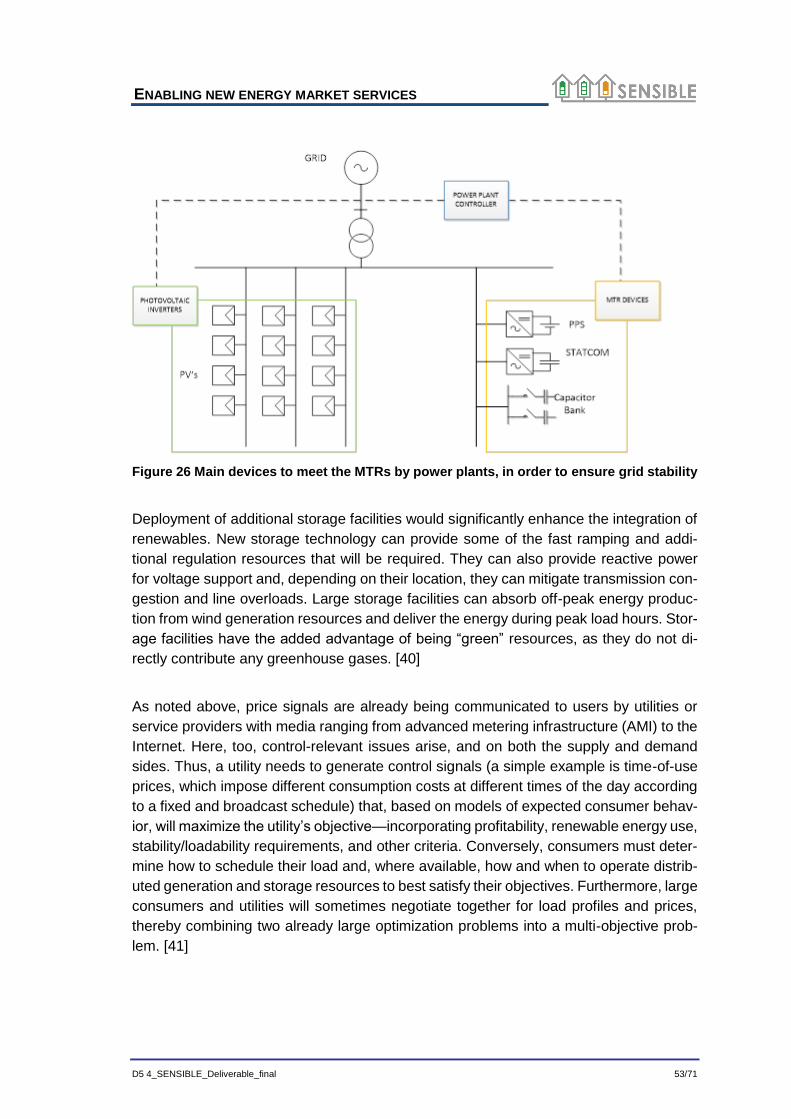
ENABLING NEW ENERGY MARKET SERVICES
D5 4_SENSIBLE_Deliverable_final 53/71
Figure 26 Main devices to meet the MTRs by power plants, in order to ensure grid stability
Deployment of additional storage facilities would significantly enhance the integration of
renewables. New storage technology can provide some of the fast ramping and addi-
tional regulation resources that will be required. They can also provide reactive power
for voltage support and, depending on their location, they can mitigate transmission con-
gestion and line overloads. Large storage facilities can absorb off-peak energy produc-
tion from wind generation resources and deliver the energy during peak load hours. Stor-
age facilities have the added advantage of being “green” resources, as they do not di-
rectly contribute any greenhouse gases. [40]
As noted above, price signals are already being communicated to users by utilities or
service providers with media ranging from advanced metering infrastructure (AMI) to the
Internet. Here, too, control-relevant issues arise, and on both the supply and demand
sides. Thus, a utility needs to generate control signals (a simple example is time-of-use
prices, which impose different consumption costs at different times of the day according
to a fixed and broadcast schedule) that, based on models of expected consumer behav-
ior, will maximize the utility’s objective—incorporating profitability, renewable energy use,
stability/loadability requirements, and other criteria. Conversely, consumers must deter-
mine how to schedule their load and, where available, how and when to operate distrib-
uted generation and storage resources to best satisfy their objectives. Furthermore, large
consumers and utilities will sometimes negotiate together for load profiles and prices,
thereby combining two already large optimization problems into a multi-objective prob-
lem. [41]
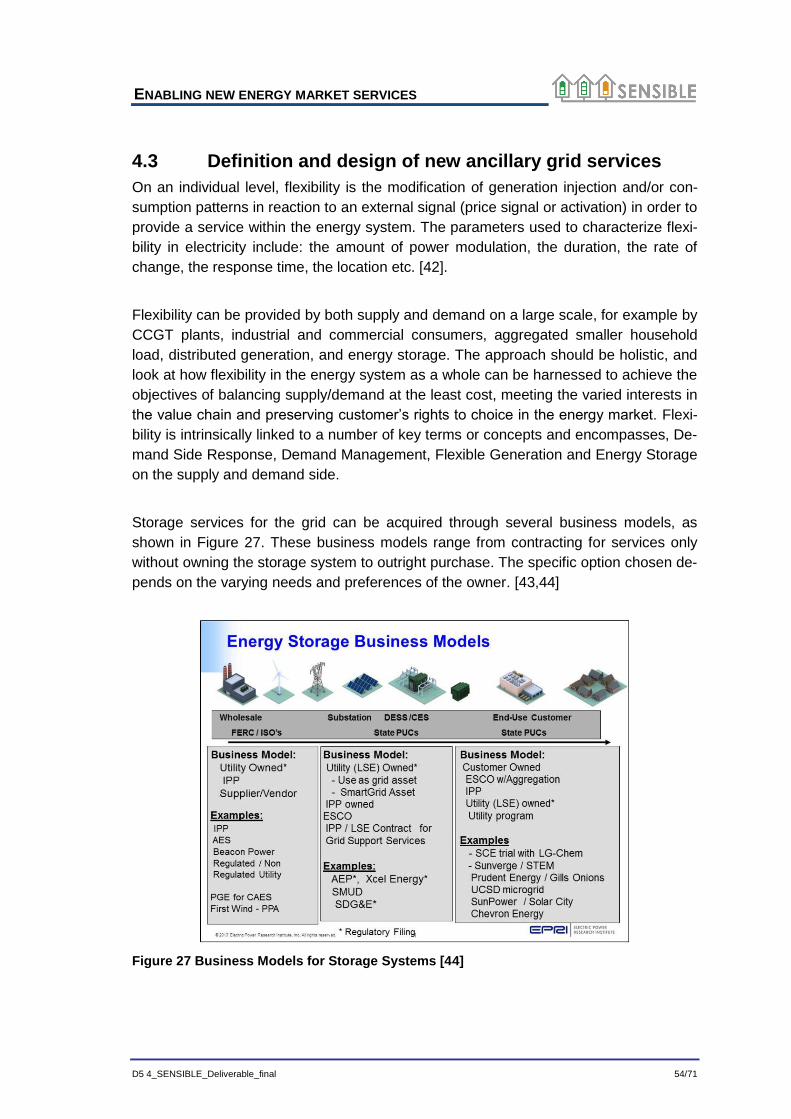
ENABLING NEW ENERGY MARKET SERVICES
D5 4_SENSIBLE_Deliverable_final 54/71
4.3 Definition and design of new ancillary grid services
On an individual level, flexibility is the modification of generation injection and/or con-
sumption patterns in reaction to an external signal (price signal or activation) in order to
provide a service within the energy system. The parameters used to characterize flexi-
bility in electricity include: the amount of power modulation, the duration, the rate of
change, the response time, the location etc. [42].
Flexibility can be provided by both supply and demand on a large scale, for example by
CCGT plants, industrial and commercial consumers, aggregated smaller household
load, distributed generation, and energy storage. The approach should be holistic, and
look at how flexibility in the energy system as a whole can be harnessed to achieve the
objectives of balancing supply/demand at the least cost, meeting the varied interests in
the value chain and preserving customer’s rights to choice in the energy market. Flexi-
bility is intrinsically linked to a number of key terms or concepts and encompasses, De-
mand Side Response, Demand Management, Flexible Generation and Energy Storage
on the supply and demand side.
Storage services for the grid can be acquired through several business models, as
shown in Figure 27. These business models range from contracting for services only
without owning the storage system to outright purchase. The specific option chosen de-
pends on the varying needs and preferences of the owner. [43,44]
Figure 27 Business Models for Storage Systems [44]
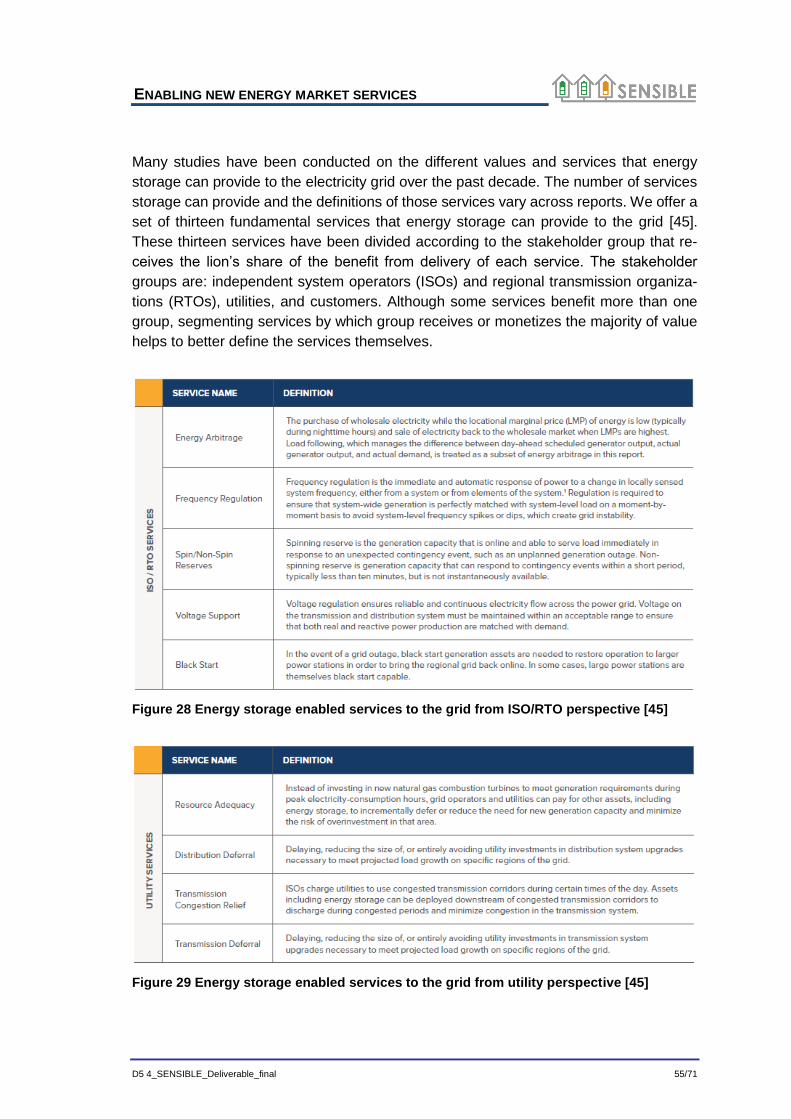
ENABLING NEW ENERGY MARKET SERVICES
D5 4_SENSIBLE_Deliverable_final 55/71
Many studies have been conducted on the different values and services that energy
storage can provide to the electricity grid over the past decade. The number of services
storage can provide and the definitions of those services vary across reports. We offer a
set of thirteen fundamental services that energy storage can provide to the grid [45].
These thirteen services have been divided according to the stakeholder group that re-
ceives the lion’s share of the benefit from delivery of each service. The stakeholder
groups are: independent system operators (ISOs) and regional transmission organiza-
tions (RTOs), utilities, and customers. Although some services benefit more than one
group, segmenting services by which group receives or monetizes the majority of value
helps to better define the services themselves.
Figure 28 Energy storage enabled services to the grid from ISO/RTO perspective [45]
Figure 29 Energy storage enabled services to the grid from utility perspective [45]
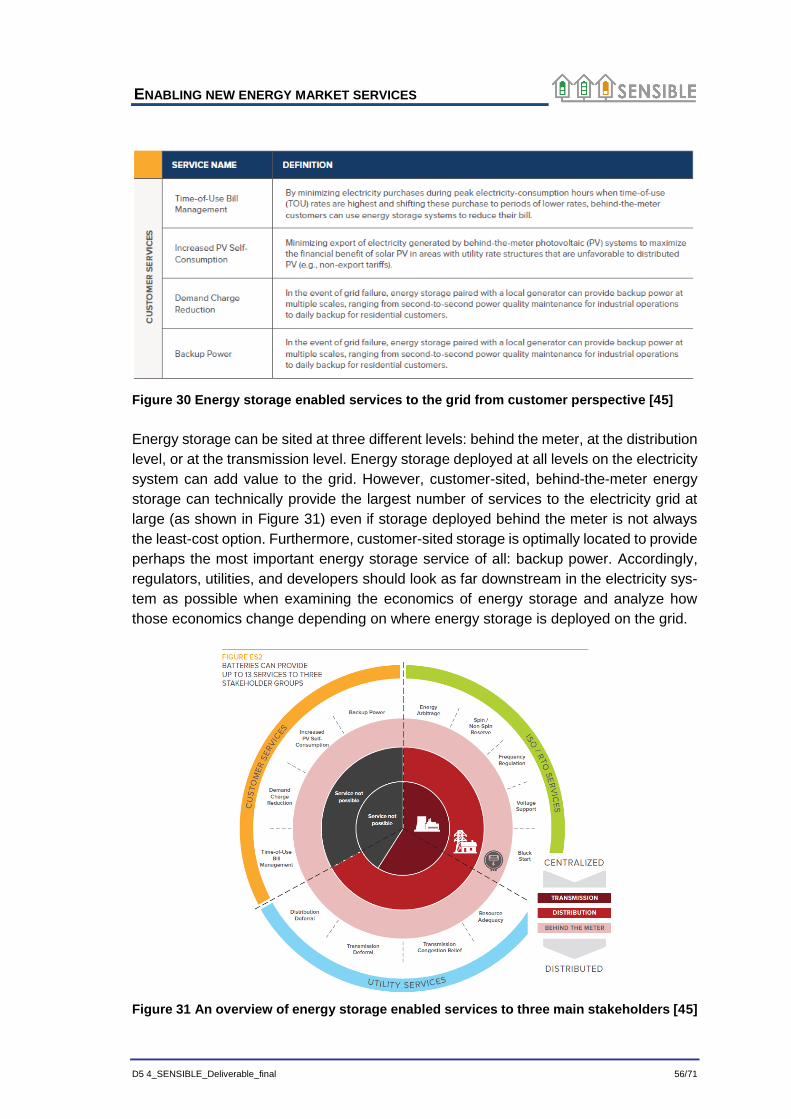
ENABLING NEW ENERGY MARKET SERVICES
D5 4_SENSIBLE_Deliverable_final 56/71
Figure 30 Energy storage enabled services to the grid from customer perspective [45]
Energy storage can be sited at three different levels: behind the meter, at the distribution
level, or at the transmission level. Energy storage deployed at all levels on the electricity
system can add value to the grid. However, customer-sited, behind-the-meter energy
storage can technically provide the largest number of services to the electricity grid at
large (as shown in Figure 31) even if storage deployed behind the meter is not always
the least-cost option. Furthermore, customer-sited storage is optimally located to provide
perhaps the most important energy storage service of all: backup power. Accordingly,
regulators, utilities, and developers should look as far downstream in the electricity sys-
tem as possible when examining the economics of energy storage and analyze how
those economics change depending on where energy storage is deployed on the grid.
Figure 31 An overview of energy storage enabled services to three main stakeholders [45]
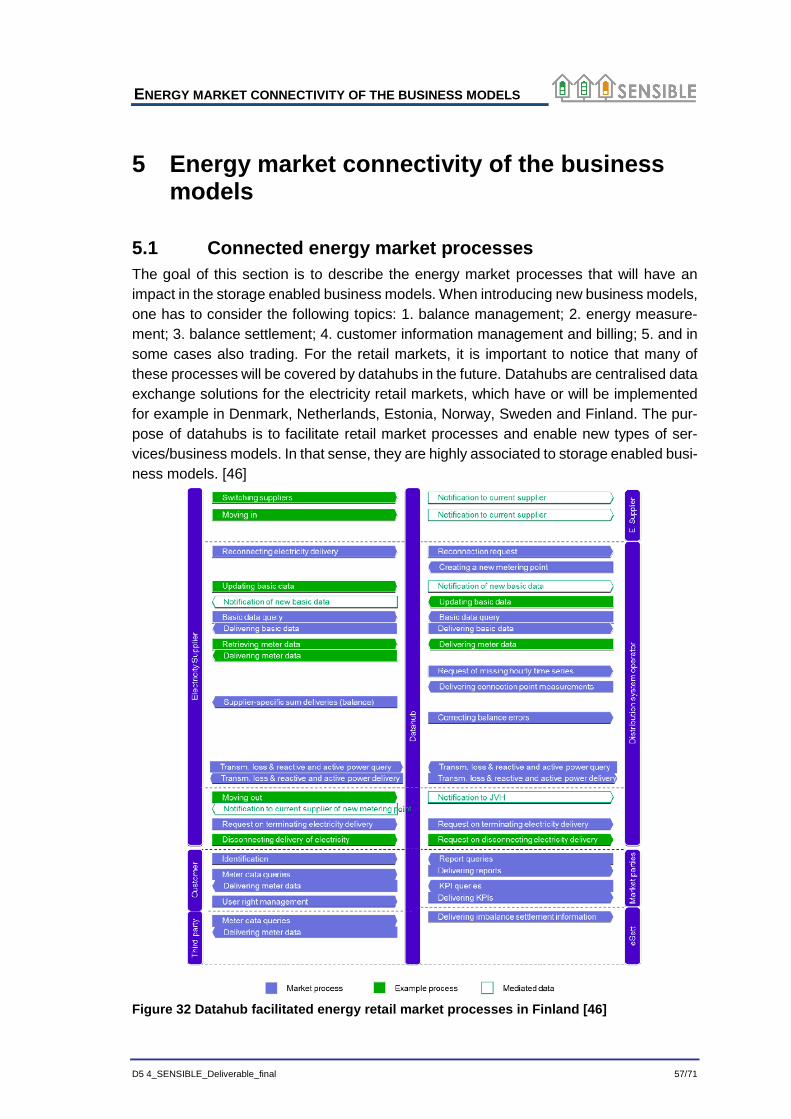
ENERGY MARKET CONNECTIVITY OF THE BUSINESS MODELS
D5 4_SENSIBLE_Deliverable_final 57/71
5 Energy market connectivity of the business models
5.1 Connected energy market processes
The goal of this section is to describe the energy market processes that will have an
impact in the storage enabled business models. When introducing new business models,
one has to consider the following topics: 1. balance management; 2. energy measure-
ment; 3. balance settlement; 4. customer information management and billing; 5. and in
some cases also trading. For the retail markets, it is important to notice that many of
these processes will be covered by datahubs in the future. Datahubs are centralised data
exchange solutions for the electricity retail markets, which have or will be implemented
for example in Denmark, Netherlands, Estonia, Norway, Sweden and Finland. The pur-
pose of datahubs is to facilitate retail market processes and enable new types of ser-
vices/business models. In that sense, they are highly associated to storage enabled busi-
ness models. [46]
Figure 32 Datahub facilitated energy retail market processes in Finland [46]
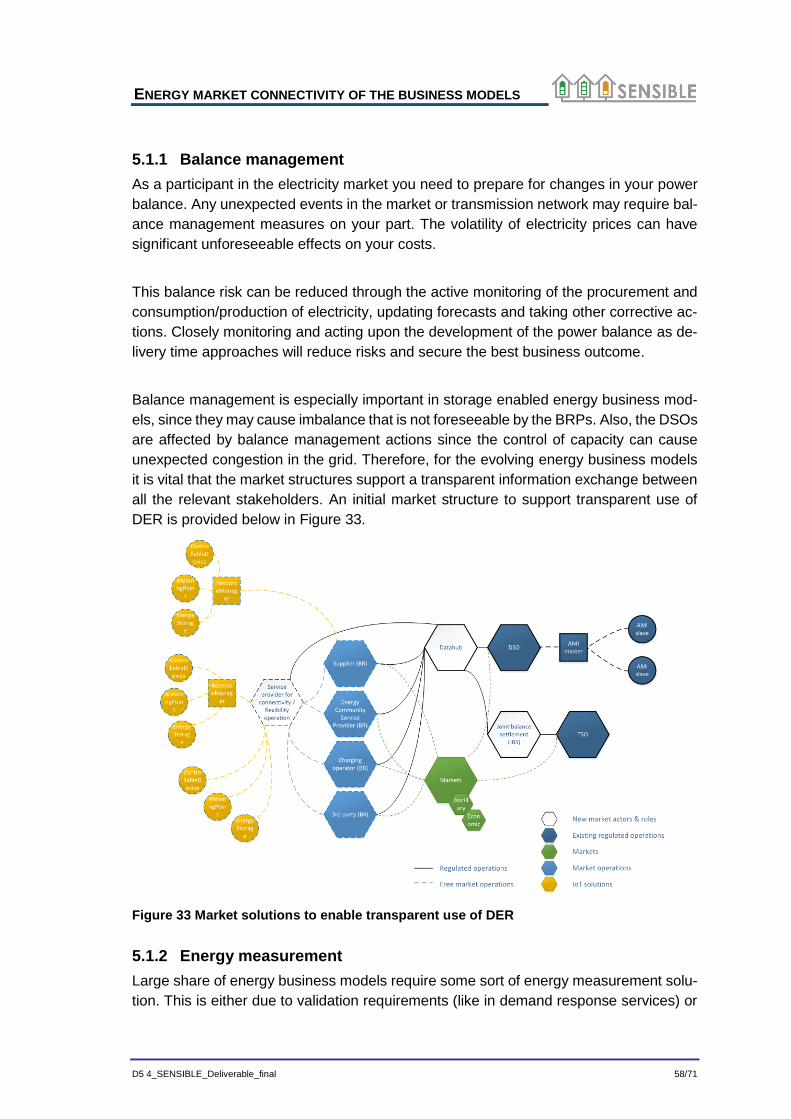
ENERGY MARKET CONNECTIVITY OF THE BUSINESS MODELS
D5 4_SENSIBLE_Deliverable_final 58/71
5.1.1 Balance management
As a participant in the electricity market you need to prepare for changes in your power
balance. Any unexpected events in the market or transmission network may require bal-
ance management measures on your part. The volatility of electricity prices can have
significant unforeseeable effects on your costs.
This balance risk can be reduced through the active monitoring of the procurement and
consumption/production of electricity, updating forecasts and taking other corrective ac-
tions. Closely monitoring and acting upon the development of the power balance as de-
livery time approaches will reduce risks and secure the best business outcome.
Balance management is especially important in storage enabled energy business mod-
els, since they may cause imbalance that is not foreseeable by the BRPs. Also, the DSOs
are affected by balance management actions since the control of capacity can cause
unexpected congestion in the grid. Therefore, for the evolving energy business models
it is vital that the market structures support a transparent information exchange between
all the relevant stakeholders. An initial market structure to support transparent use of
DER is provided below in Figure 33.
Figure 33 Market solutions to enable transparent use of DER
5.1.2 Energy measurement
Large share of energy business models require some sort of energy measurement solu-
tion. This is either due to validation requirements (like in demand response services) or
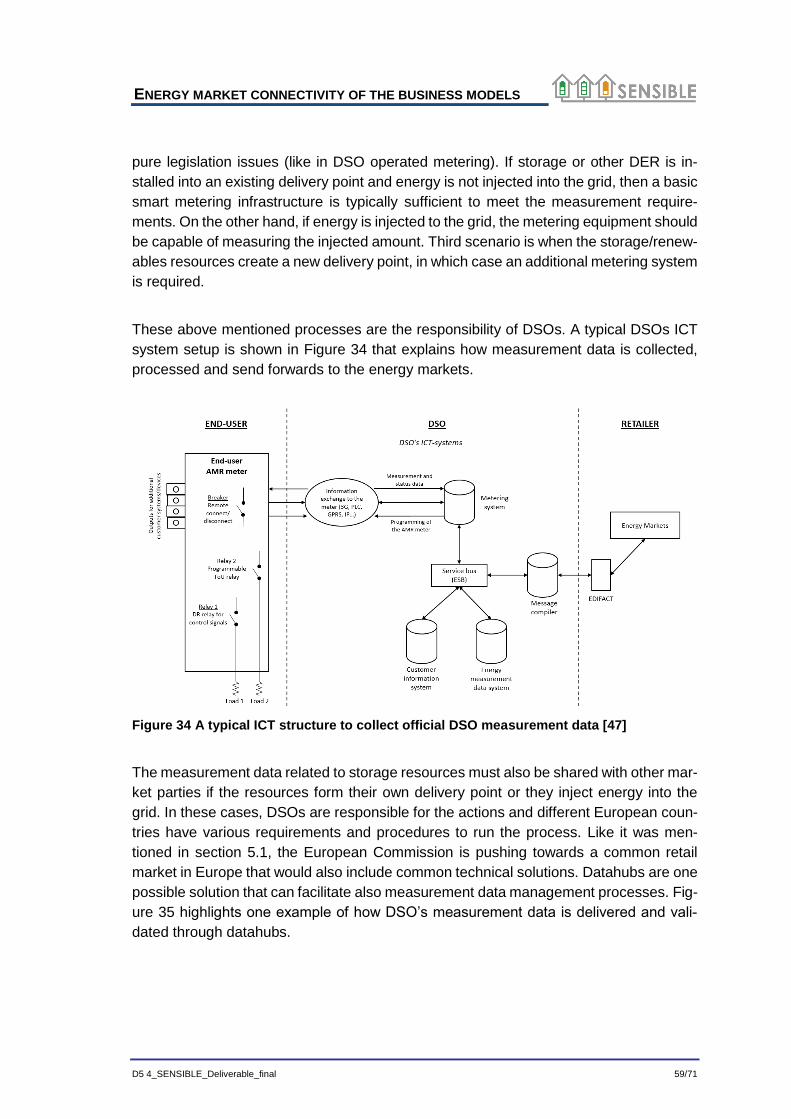
ENERGY MARKET CONNECTIVITY OF THE BUSINESS MODELS
D5 4_SENSIBLE_Deliverable_final 59/71
pure legislation issues (like in DSO operated metering). If storage or other DER is in-
stalled into an existing delivery point and energy is not injected into the grid, then a basic
smart metering infrastructure is typically sufficient to meet the measurement require-
ments. On the other hand, if energy is injected to the grid, the metering equipment should
be capable of measuring the injected amount. Third scenario is when the storage/renew-
ables resources create a new delivery point, in which case an additional metering system
is required.
These above mentioned processes are the responsibility of DSOs. A typical DSOs ICT
system setup is shown in Figure 34 that explains how measurement data is collected,
processed and send forwards to the energy markets.
Figure 34 A typical ICT structure to collect official DSO measurement data [47]
The measurement data related to storage resources must also be shared with other mar-
ket parties if the resources form their own delivery point or they inject energy into the
grid. In these cases, DSOs are responsible for the actions and different European coun-
tries have various requirements and procedures to run the process. Like it was men-
tioned in section 5.1, the European Commission is pushing towards a common retail
market in Europe that would also include common technical solutions. Datahubs are one
possible solution that can facilitate also measurement data management processes. Fig-
ure 35 highlights one example of how DSO’s measurement data is delivered and vali-
dated through datahubs.
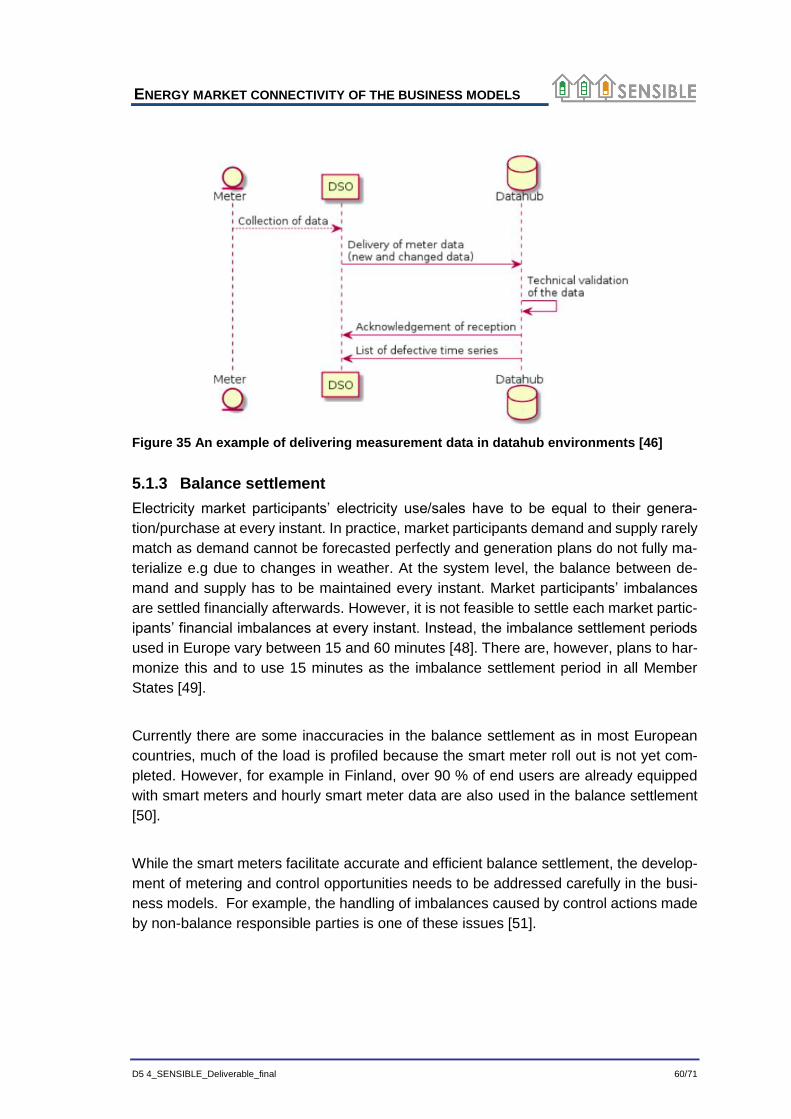
ENERGY MARKET CONNECTIVITY OF THE BUSINESS MODELS
D5 4_SENSIBLE_Deliverable_final 60/71
Figure 35 An example of delivering measurement data in datahub environments [46]
5.1.3 Balance settlement
Electricity market participants’ electricity use/sales have to be equal to their genera-
tion/purchase at every instant. In practice, market participants demand and supply rarely
match as demand cannot be forecasted perfectly and generation plans do not fully ma-
terialize e.g due to changes in weather. At the system level, the balance between de-
mand and supply has to be maintained every instant. Market participants’ imbalances
are settled financially afterwards. However, it is not feasible to settle each market partic-
ipants’ financial imbalances at every instant. Instead, the imbalance settlement periods
used in Europe vary between 15 and 60 minutes [48]. There are, however, plans to har-
monize this and to use 15 minutes as the imbalance settlement period in all Member
States [49].
Currently there are some inaccuracies in the balance settlement as in most European
countries, much of the load is profiled because the smart meter roll out is not yet com-
pleted. However, for example in Finland, over 90 % of end users are already equipped
with smart meters and hourly smart meter data are also used in the balance settlement
[50].
While the smart meters facilitate accurate and efficient balance settlement, the develop-
ment of metering and control opportunities needs to be addressed carefully in the busi-
ness models. For example, the handling of imbalances caused by control actions made
by non-balance responsible parties is one of these issues [51].
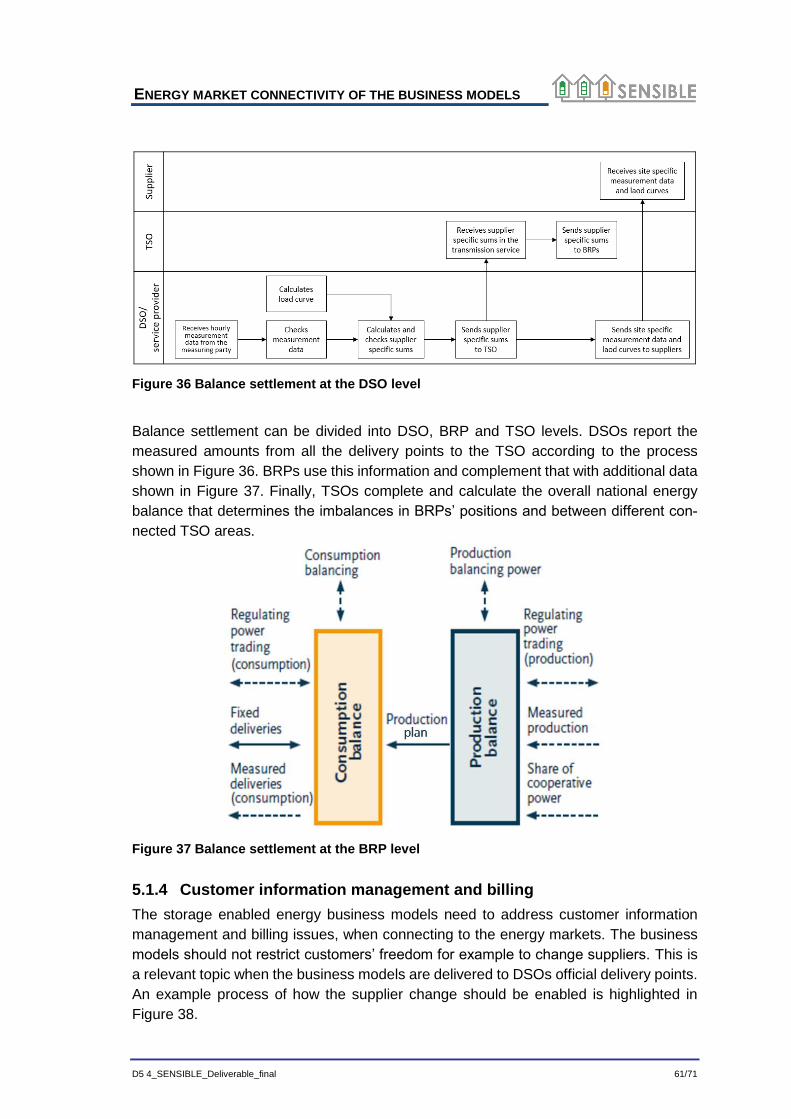
ENERGY MARKET CONNECTIVITY OF THE BUSINESS MODELS
D5 4_SENSIBLE_Deliverable_final 61/71
Figure 36 Balance settlement at the DSO level
Balance settlement can be divided into DSO, BRP and TSO levels. DSOs report the
measured amounts from all the delivery points to the TSO according to the process
shown in Figure 36. BRPs use this information and complement that with additional data
shown in Figure 37. Finally, TSOs complete and calculate the overall national energy
balance that determines the imbalances in BRPs’ positions and between different con-
nected TSO areas.
Figure 37 Balance settlement at the BRP level
5.1.4 Customer information management and billing
The storage enabled energy business models need to address customer information
management and billing issues, when connecting to the energy markets. The business
models should not restrict customers’ freedom for example to change suppliers. This is
a relevant topic when the business models are delivered to DSOs official delivery points.
An example process of how the supplier change should be enabled is highlighted in
Figure 38.
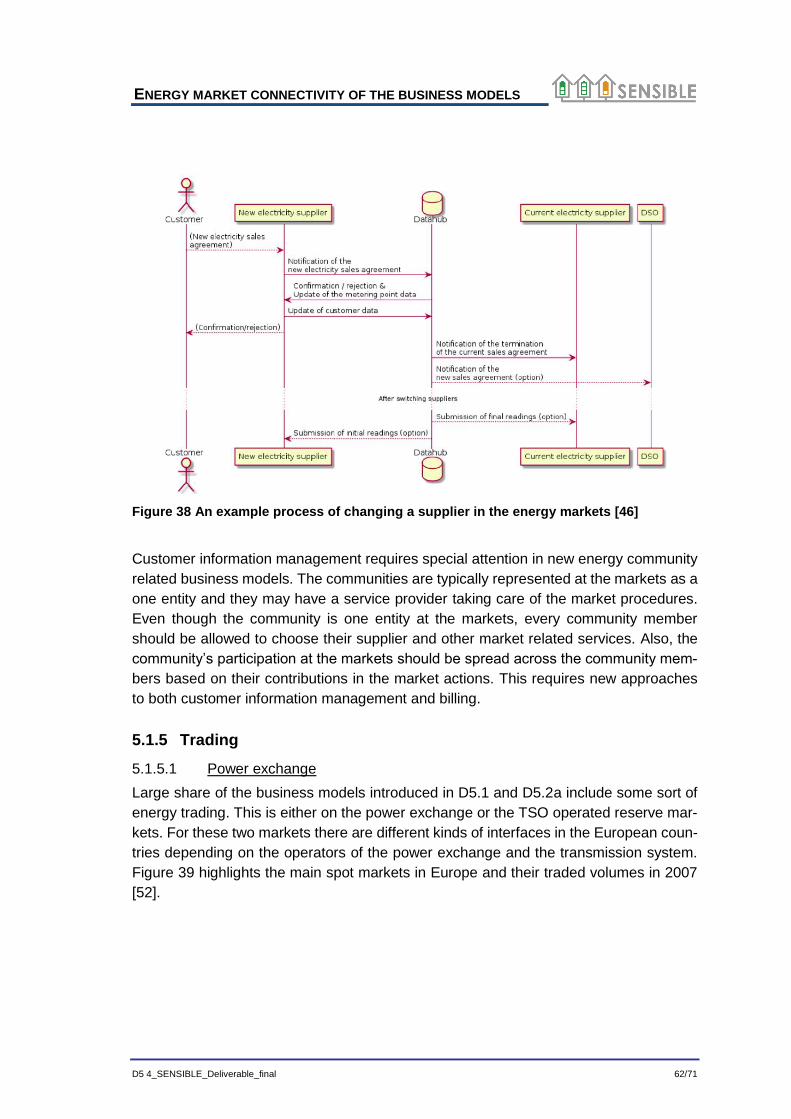
ENERGY MARKET CONNECTIVITY OF THE BUSINESS MODELS
D5 4_SENSIBLE_Deliverable_final 62/71
Figure 38 An example process of changing a supplier in the energy markets [46]
Customer information management requires special attention in new energy community
related business models. The communities are typically represented at the markets as a
one entity and they may have a service provider taking care of the market procedures.
Even though the community is one entity at the markets, every community member
should be allowed to choose their supplier and other market related services. Also, the
community’s participation at the markets should be spread across the community mem-
bers based on their contributions in the market actions. This requires new approaches
to both customer information management and billing.
5.1.5 Trading
5.1.5.1 Power exchange
Large share of the business models introduced in D5.1 and D5.2a include some sort of
energy trading. This is either on the power exchange or the TSO operated reserve mar-
kets. For these two markets there are different kinds of interfaces in the European coun-
tries depending on the operators of the power exchange and the transmission system.
Figure 39 highlights the main spot markets in Europe and their traded volumes in 2007
[52].
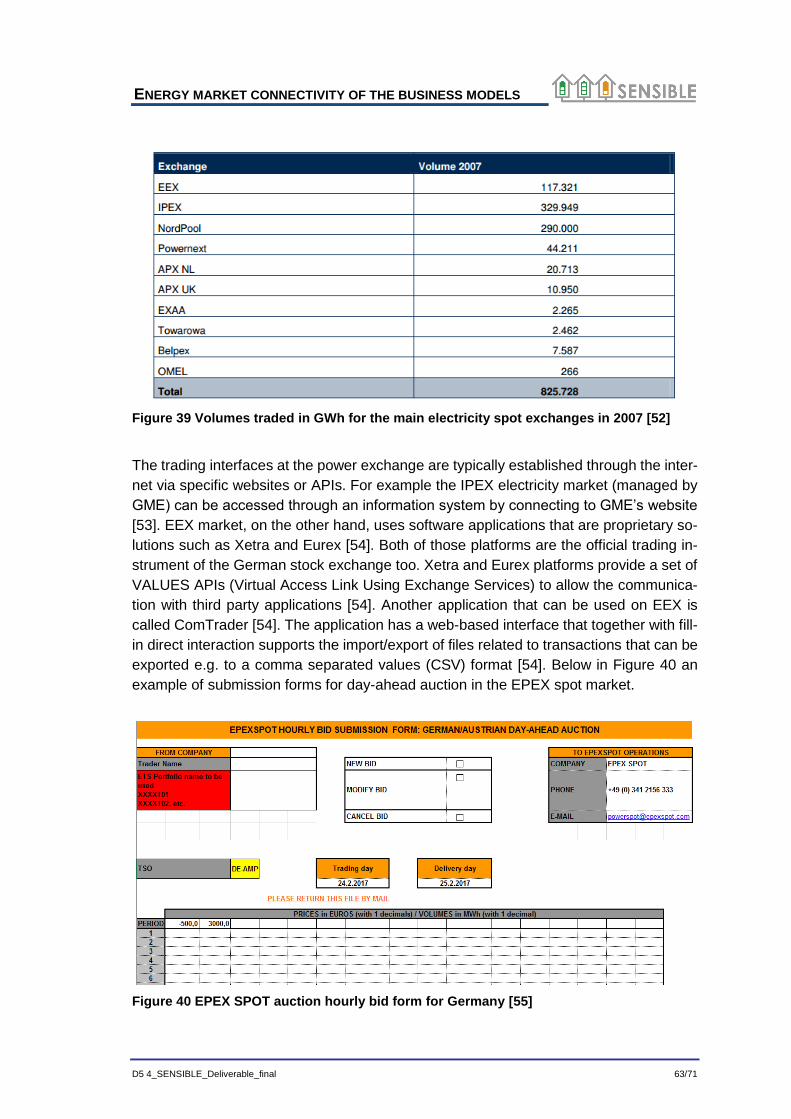
ENERGY MARKET CONNECTIVITY OF THE BUSINESS MODELS
D5 4_SENSIBLE_Deliverable_final 63/71
Figure 39 Volumes traded in GWh for the main electricity spot exchanges in 2007 [52]
The trading interfaces at the power exchange are typically established through the inter-
net via specific websites or APIs. For example the IPEX electricity market (managed by
GME) can be accessed through an information system by connecting to GME’s website
[53]. EEX market, on the other hand, uses software applications that are proprietary so-
lutions such as Xetra and Eurex [54]. Both of those platforms are the official trading in-
strument of the German stock exchange too. Xetra and Eurex platforms provide a set of
VALUES APIs (Virtual Access Link Using Exchange Services) to allow the communica-
tion with third party applications [54]. Another application that can be used on EEX is
called ComTrader [54]. The application has a web-based interface that together with fill-
in direct interaction supports the import/export of files related to transactions that can be
exported e.g. to a comma separated values (CSV) format [54]. Below in Figure 40 an
example of submission forms for day-ahead auction in the EPEX spot market.
Figure 40 EPEX SPOT auction hourly bid form for Germany [55]
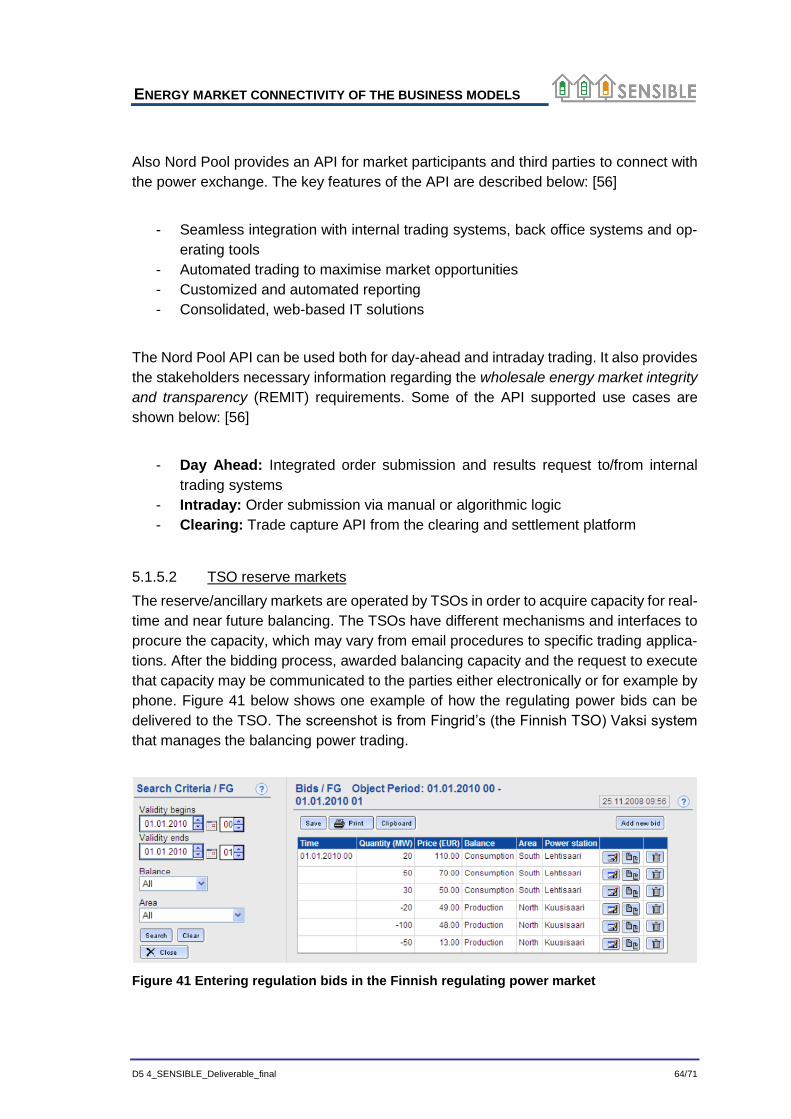
ENERGY MARKET CONNECTIVITY OF THE BUSINESS MODELS
D5 4_SENSIBLE_Deliverable_final 64/71
Also Nord Pool provides an API for market participants and third parties to connect with
the power exchange. The key features of the API are described below: [56]
- Seamless integration with internal trading systems, back office systems and op-
erating tools
- Automated trading to maximise market opportunities
- Customized and automated reporting
- Consolidated, web-based IT solutions
The Nord Pool API can be used both for day-ahead and intraday trading. It also provides
the stakeholders necessary information regarding the wholesale energy market integrity
and transparency (REMIT) requirements. Some of the API supported use cases are
shown below: [56]
- Day Ahead: Integrated order submission and results request to/from internal
trading systems
- Intraday: Order submission via manual or algorithmic logic
- Clearing: Trade capture API from the clearing and settlement platform
5.1.5.2 TSO reserve markets
The reserve/ancillary markets are operated by TSOs in order to acquire capacity for real-
time and near future balancing. The TSOs have different mechanisms and interfaces to
procure the capacity, which may vary from email procedures to specific trading applica-
tions. After the bidding process, awarded balancing capacity and the request to execute
that capacity may be communicated to the parties either electronically or for example by
phone. Figure 41 below shows one example of how the regulating power bids can be
delivered to the TSO. The screenshot is from Fingrid’s (the Finnish TSO) Vaksi system
that manages the balancing power trading.
Figure 41 Entering regulation bids in the Finnish regulating power market
ENERGY MARKET CONNECTIVITY OF THE BUSINESS MODELS
D5 4_SENSIBLE_Deliverable_final 65/71
5.2 Market interfaces
The objective of this chapter is to show the need for an ICT tool as a necessary instru-
ment for the development of business models relative to the management of storage
type as available real time market services.
5.2.1 Energy storage as a market service
The Energy storage is going to provide a possible source of flexibility, absorbing or re-
leasing energy to smooth intermittent generation patterns traditionally related with power
generators with a high component of unpredictability and variability (wind and solar) and
an increasing demand variability due to a socially changing lifestyles and the introduction
of the electrical vehicle.
Currently energy storage is mostly provided by large scale, centralized pumped storage
assets. However, increasingly also small-scale energy storage, either by distributed un-
der microgrids, customers’ control or directly integrated in the grid, provides very valua-
ble tool for balancing the energy system. Storage is especially important for an efficient
use of generation and grid resources providing the sufficient flexibility.
Developing future deployment of storage projects requires viable business models that
allow investors to earn sufficient revenue to cover investment costs and make a return
on that investment. That a storage device can be used for multiple applications increase
its potential source of value. However, it also means that the business case is multi-
layered and so relies upon being able to access multiple revenue streams. All this intro-
duce more complexity from a practical and operational perspective and may require the
involvement of multiple stakeholders across whom value must be shared. Challenges
may also be faced within the regulatory framework [57].
Future business models for grid-scale projects rely on capturing revenues from multiple
values streams, including capturing revenues from wholesale and balancing services
markets. This means that the assets (energy storage devices) will need to interface with
the market in order to make business models work. The most likely route for inclusion of
such projects within the settlement arrangement is within a market participant´s energy
account, either their own or that of a third party.
5.2.2 Enabling energy storage resource competing in the market
Potential storage owners are reluctant to consider the deployment of resources until they
can be assured and have clear evidence that barriers no longer exist, enabling market
access and a predictable revenue stream. Other regulatory issues that present barriers
to the deployment of energy storage include complexity and lack of clarity surrounding
the functional classification of energy storage and its use to provide simultaneous ser-
vices across different accounting classifications of production (generation), transmission
ENERGY MARKET CONNECTIVITY OF THE BUSINESS MODELS
D5 4_SENSIBLE_Deliverable_final 66/71
and distribution and discrepancies in market rules and regulations across the large num-
ber of markets in the country.
Energy storage technologies have the potential to significantly impact the electric grid,
especially as the current system will require considerable infrastructure investment to
maintain reliability, as assets get older and demands on the system increase because of
more variable loads and generation. As these modernization efforts continue, there is an
opportunity for energy storage technologies to provide a number of different services.
With the deployment of distributed generation resources, deployment of electric vehicles,
increasing demand response programs, increased energy efficiency programs and de-
ployment of microgrid systems creating a smarter grid while continuing to blur traditional
classification lines, energy storage technologies can help ensure that reliability needs
are met. Though an opportunity certainly exists for energy storage in building a more
resilient and reliable grid, there are, however, a number of barriers restricting further
deployment of these technologies.
Though there are a number of regulatory and market barriers preventing the increased
deployment of energy storage technologies, the primary barrier to deployment is high
capital costs due to the fact that ESS are dominated by CAPEX not by OPEX. Despite
other barriers that exist, in most situations, this prevents a potential owner from creating
a business case and further research is needed to decrease costs. These barriers restrict
market access, prevent compensation for all services rendered and create difficulty in
the evaluation of storage technologies by potential developers, market operators and
regulators.
Energy storage could have a key role to play in the future grid, but market and regulatory
issues have to be addressed to allow storage resources open market access and com-
pensation for the services they are capable of providing. Progress has been made in this
effort, but much remains to be done and will require continued engagement from regula-
tors, policy makers, market operators, utilities, developers and manufacturers [58].
We are seeing that, on the one hand the market needs change, on the other hand we
have the storage and new business models around it. The question is how energy stor-
age can spread out and be a reality worldwide through a new market model and thus
facilitate the deployment of distributed generation.
Under the current system, it is difficult for energy storage to have a clear business case.
With a new market model, such as the concept of Transactive Energy [59], customer
devices and grid systems (e.g. storage) can barter the proper way to solve their mutual
problems. At the same time, they can settle on a proper price for services, in close to
real time. This will significantly enhance the opportunities to leverage storage resources
for new business models. [59]
ENERGY MARKET CONNECTIVITY OF THE BUSINESS MODELS
D5 4_SENSIBLE_Deliverable_final 67/71
It is through integration between different markets (removing regulatory barriers which
together prevent their deployment once the capital cost is affordable) where the storage
will provide very valuable tools for balancing the energy of the system for an efficient use
of the generation and grid resources and becoming a business reality.
The old model in which a central agent controls and monitors all system parameters will
be replaced by millions of decision points, one for each agent. Each point will have an
"energy manager". The system will therefore require software tools to manage all de-
vices, generation, storage and consumption, using pricing information and the net bal-
ance to maximize the benefits of agent.
For that, a new ICT tool will be necessary too. A platform capable of a real time integrated
data acquisition and processing, with the ability to handle large volumes of data from the
network nodes, each of the agents, in a secured, distributed and loosely coupled way.
5.2.3 ICT tools to make possible the development of business model
To make the new business models that enable the development of energy storage a
reality, it is necessary for all (new and existing) agents to have an access to all system
information in real time. This requires having an integration platform in real time that can
handle all available information in a much more efficient way.
Thanks to ICT, the grid of the future will become smarter to improve reliability, security,
and efficiency of the electric system through information exchange, distributed genera-
tion, storage sources, and the active participation of the end consumer. The development
of smart grids exemplifies the increasing dependency of European economy and society
on Information and Communication Technologies [60].
ICT opens new scenarios and possibilities such as prosumer based energy markets.
Users can interact by using software application that work in their interest and automat-
ically trade energy to achieve profits (in the prosumer case) or lower the energy bill (in
the consumer case). These new ICT services have the aim of improving energy effi-
ciency and increment the penetration of renewable sources and distributed storage. In
addition, by using ICT in the energy domain provides new possibilities and scenarios for
the end users, which can raise energy awareness and provide automation for energy
efficiency.
As a conclusion, robust, open and secure ICT is at the core of a successful smart grid
implementation. All processes across the whole value chain (i.e. energy generation,
transmission, distribution, consumption, marketing, retailing, etc.) are heavily based on
ICT infrastructures.
MARKET STRUCTURE DEVELOPMENT TO ENABLE NEW
BUSINESS MODELS
D5 4_SENSIBLE_Deliverable_final 68/71
6 Market structure development to enable new business models
In the future, the energy mix will be increasingly based on renewables and the resource
portfolio will be distributed. Due to these factors, the energy system has to evolve to
accommodate generation following behaviours instead of the currently applied load fol-
lowing. In addition, the resulting higher demand for flexibility will have to be managed on
a local level. New market mechanisms are required to enable the integration of distrib-
uted resources and enable their effective use [37, 61]. Current market mechanisms will
have to be adjusted and augmented to allow for new resource participation and en-
hanced flexibility [51].
There are multiple domains for which the developed business cases provide benefits,
ranging from smart buildings to microgrids and communities, and to distribution grid ser-
vices. However, all the domains have connections to the existing market structures that
are potentially changing.
6.1 Smart Building services
The business models that are mostly related to the domain of smart building services
feature properties such as maximizing (off-grid) self-consumption, demand-side man-
agement capacity allocation for suppliers, and increasing day-ahead and intra-day mar-
ket accessibility. The business models consist of
Managing building energy flexibility
Flexibility and DSM in the market participation
Increased percentage of self-consumption
Optimized energy procurement
The key stakeholders involved in these use cases include
Building End Users/Operator
Energy Provider/Grid Operator
Forecast Service Providers and Aggregators
Building End Users can benefit from Building Operator installed energy management
systems that can help in saving energy costs. The savings can come from increased
local consumption, reducing the need for buying energy. Furthermore, consumers in
apartment complexes could share energy within the building through trading. However,
if the metering is done on a consumer-by-consumer basis within their premises, all en-
ergy transmitted within the building could get metered and potentially be subject to dis-
tribution fees. The regulations and procedures for such cases should be updated in order
to avoid “…discriminatory charges for self-consumption projects”, as per European Com-
mission guidelines [62].
MARKET STRUCTURE DEVELOPMENT TO ENABLE NEW
BUSINESS MODELS
D5 4_SENSIBLE_Deliverable_final 69/71
Alternatively, the savings can come directly from minimizing varying energy tariffs sup-
plied by the Energy Provider and/or Grid Operator, such as the ones presented in the
demonstrators in the use case “Flexibility and DSM in the market participation”. The flex-
ibility can be exploited by the Energy Provider through aggregating the responses within
buildings and making bids into wholesale markets, such as
day-ahead market
intra-day market
regulating (balancing) market
However, the Energy Provider, Grid Operator and a potential Aggregator have to ensure
that the balance responsibility is obeyed. I.e. in case an independent operator trades
flexibility, balance management of the current balance responsible party in the particular
metering area should not be disrupted [63, 51]. The market regulations will have to take
into account the new requirements when trading with flexibility becomes more prevalent.
6.2 Microgrids and community services
The use cases that support microgrids and community services consist of
Microgrid PV management
Enabling and independent energy community
Microgrid energy market
The key business features of these models relate to an even higher priority on self-con-
sumption and the use of grid supply only as a backup. In an islanding mode, peer-to-
peer trading of energy is enabled.
The proposed business models enable consumers to communally distribute the invest-
ment and operating costs related to distributed storage solutions. In addition, environ-
mental factors could motivate local communities to enhance their own self-image and
strengthen the community.
Furthermore, the microgrid and local community market services can enable maximizing
the potential of the deployed storages. However, in practice the connection to external
wholesale markets and/or other local community solutions is required for efficient oper-
ation. The practical aspects of the regulatory and market barriers are still partly open
regarding microgrid deployment [64]. Especially the particularities of each member state
in the European Union has been noted as a barrier, as well as some ambiguities in inte-
gration of renewable generation [64].
MARKET STRUCTURE DEVELOPMENT TO ENABLE NEW
BUSINESS MODELS
D5 4_SENSIBLE_Deliverable_final 70/71
For local market operation, in practice balance management, trading, invoicing and re-
porting services are required. Furthermore, the benefits of a single community should
not increase the costs of other parties through e.g. increased grid payments.
6.3 Distribution grid services
The use cases
Optimizing the MV distribution network
Optimizing the operation of storage devices in the LV network
Islanding operation of low voltage networks
Microgrid emergency balance tool
especially target the domain of distribution grid services. The aim is to use the distributed
storages for managing MV and LV operation, integration to new markets (ancillary ser-
vices), and enhancing the power quality and continuity of service. The distribution grid
can provide income to participating flexible loads and alternatively the local areas can
split into islanding mode and provide their own energy for decreased costs or increased
resilience if the main grid is facing an emergency situation.
Currently, the costs connecting of grid resources have not been derived with market
mechanisms but more or less fixed costs [65]. Methods for the distribution of grid costs
should be reconsidered such that they encourage investments into renewable generation
but simultaneously consider the investment costs resulting from real-time power demand
requirements, as the main cost component is related to the maximum instantaneous
power demand.
Power-based tariffs for small customers, where a major part of the bill would come from
the peak power demand of the connection point, are currently considered in order to
better manage peak demand and ensure fairer revenue for the Grid Operator [66]. A
pure power tariff is however not the most optimal solution as it does not directly or opti-
mally limit the total peak demand [65]. Storages can be utilized in a community to reduce
the needed peak power and thus reduce power tariff –based costs.
Aggregating consumers from different spatial areas into combined flexible resources is
not the most cost-effective solution as it does not reduce the need for transferring energy.
Thus, especially local communities can also be a driver in aggregating individual loads
in an optimal fashion to help in balancing the distribution grid. Relevant market mecha-
nisms for this are however required.
CONCLUSIONS
D5 4_SENSIBLE_Deliverable_final 71/71
7 Conclusions
The storage enabled energy business models utilize broadly the wholesale, ancillary and
retail markets. The main value of the business model is delivered through balancing
functionalities. In addition to pure market participation, the business models also contrib-
ute to active grid management. Key stakeholders to leverage the value of the business
models are DSOs and prosumers/consumers.
To enable the energy market interaction of the introduced business models/stakehold-
ers, you need to consider variety of different requirements. In this document the connec-
tivity requirements were divided into five categories: 1. Balance management; 2. Energy
measurement; 3. Balance settlement; 4. Customer information management and billing;
5. Trading. The evolving business models require new type of approach in all the cate-
gories due to more dynamic and distributed nature of the business models. For example,
energy measurement data needs to be gathered from smaller units than before, trading
of energy will have to be made more transactive and local, which at the end requires
special attention in customer information management. Transparent balance manage-
ment is also crucial in order to provide a framework where BRPs together with the DSOs
and TSOs can ensure an efficient and secure energy system.
The scope of this deliverable was to analyze the different requirements in order to con-
nect the business models, introduced in D5.1 and D5.2a, to the energy markets. In ad-
dition, the demonstrators and the specific business models were evaluated to identify
special market connectivity needs that require attention. New energy market structures
to help market connection were also analyzed.