Embed Size (px)
Citation preview

The Health Status of Disturbed and Undisturbed Non-‐Saline Estuaries: A CRAM-‐based assessment
By, Eria E. Garnica
Senior Thesis
Dr. Jeffery A. Foran
May 14, 2014

2
Table of Contents Page Title Page 1
Abstract 3
Introduction
Objective 3
Approach 5
Significance 6
Methods 7
CRAM Field Book description 9
Buffer and Landscape 9
Hydrology 10
Physical Structure 11
Biotic Structure 12
Results 13
CRAM Scores 13
Graphs, Tables, Maps, Figures 19
Discussion 30
References 34

3
Abstract
This senior project analyzes and compares two perennial, non-‐saline
estuaries in California by using the California Rapid Assessment Method for Wetland
(CRAM) to signify the differences between undisturbed and disturbed estuaries.
The California Rapid Assessment Method, is used to rapidly assess wetland
ecological features for water purification and influencing wildlife habitat. These
four attribute are used to comparatively analyze the variation between disturbed
and undisturbed estuarine wetlands. CRAM is a useful reference tool to evaluate
quick results for the health status of California Wetlands.
Introduction Objective
Estuaries are valuable, complex ecosystems that filter contaminants,
pollutants, solids, wastes, pesticides, and other urban runoff. They also stabilize
shorelines from erosion, decrease the effects of coastal storms, and increase aquatic,
terrestrial biodiversity. Estuaries are significant because they create habitats for
fish and wildlife, including threatened or endangered species listed. Currently,
perennial non-‐saline estuaries in California suffer from sea level rise, salt-‐water
intrusion, and other human impacts. Most signs of human disturbance degrade
wetlands services and functions, particularly fish and wildlife habitats (Parker et al
2011). Today, scientists have acknowledged a 91% loss of California wetlands, and
only 44,456 acres of estuaries remain (CA State of Wetlands Report 2010). As a

4
result, the state has made wetlands restoration a priority in California. The
California Wetlands Conservation Policy (executive order W-‐59-‐93) explains the
course of action for restoring, monitoring, and protecting California wetlands under
state agencies, public and private partnerships, and the federal government (Snow
2010).
Disturbed and undisturbed wetlands are both affected by sea level rise increasing
salt-‐water intrusion into the freshwater and brackish marshes. Salt-‐water intrusion
could shift the wetland composition by decreasing freshwater plant species to salt
tolerant plant species. Recent studies state and increase in sea level rise results a
shift in the salinity gradient, and a dramatic decrease in San Francisco Bay-‐Delta’s
tidal marsh biodiversity (such as, Sarcocornia pacifica, Spartina foliosa, and Distichlis
spicata), (Mall 1969). Also, the increase in carbon dioxide will affect soil carbon
storage, soil nutrient cycling, plant respiration, rates of decomposition, mycorrhizal
symbionts, and herbivory (Parker et al 2011). These freshwater estuarine values
(wetland composition structure) take part in the water purification cycle (wetland
function). The ecological processes include chemical, physical, and biological
processes that all take part in the water purification cycle (Kadlec 1996). In
addition to the water purification cycle, system components include plants, soils,
detritus, bacteria, protozoa, water levels, depth, temperature, dissolved oxygen, and
pH (Sherwood et al 1995).
This project will analyze and compare two restored CA freshwater
estuaries (Rush Ranch Estuary and Arroyo Burro Estuary) and their health status by
using the California Rapid Assessment Methods (CRAM) along with quantitative

5
data for correlation. Non-‐saline estuaries are I hypothesize that there are significant
differences between the performance standards of disturbed and undisturbed, non-‐
saline estuaries located in California. CRAM is a cost-‐effective way to rapidly assess
the health status of California wetlands. CRAM, uses a grading rubric with a series of
four scores that indicate the total score for the wetland health status. This method
assists scientists and researchers in understanding what actions need to be
addressed to improve wetland restoration.
The California Rapid Assessment Methods for wetlands consists of three-‐
tiered assessment levels from the California Wetlands. The three-‐tiered assessment
levels correlate one another by showing a more in-‐depth contextual understanding
of the overall estuarine wetland condition (Solek, Stein, and Sutula 2011). Level One,
Landscape Assessment, consists of using remote sensing data and field surveys in an
inventory database that is created by the California State Resources Agency. Level
two, Rapid Assessment, includes assessing wetland conditions by using field
diagnostics and existing data. Level three, Intensive Site Assessment, consists of data
that validates the CRAM results along with exemplifying the condition. Receiving
validation on the CRAM results for the study sites is a very important analytical step
to assess the estuarine wetland health status.
Approach
There are four different attributes that this project will focus on to score the
perennial, non-‐saline estuaries: buffer and landscape, hydrology, physical structure,
and biotic structure. Attribute 1: Buffer and Landscape includes A: an evaluation of

6
the landscape context, B: Assessment Area and buffer width, C: buffer condition.
Attribute 2: Hydrology includes A: water source, B: hydroperiod, C: hydrologic
connectivity. Attribute 3: Physical Structure consists of A: structural patch richness,
B: topographic complexity. Attribute 4: Biotic Structure A: number of plant layers.
B: number of co-‐dominant plant species, C: invasive plant species, D: horizontal
interspersion, E: vertical biotic structure.
I will compare disturbed and undisturbed perennial, non-‐saline estuaries in
California. By evaluating the CRAM scores for each freshwater estuarine marsh, I
will be able to distinguish the differences between disturbed and undisturbed
estuaries. I predict natural estuaries will have a higher CRAM scores because they
have fewer environmental impacts disrupting the wildlife habitat.
Significance
The results from this project may be used to support better restoration and
mitigation planning in the future. The Society for Ecological Restoration (SER) states,
“Ecological restoration is the process of renewing and maintaining ecosystem health
(SER Board of Directors, 1995).” Ultimately, this method can be a cost-‐effective way
to rapidly assess the health status of California wetlands.

7
Methods
I chose two perennial non-‐saline estuaries as my samples from the E-‐CRAM
state database, one high quality and one low quality score. I evaluated their health
status by using CRAM; The California Rapid Assessment Method for Wetlands,
perennial Estuarine Wetlands Field book, version 6.1. The scores will be in numeric
form this includes, 12/12, 9/12, 6/12, or 3/12. The two non-‐saline estuaries were
chosen because of their documented CRAM scores that are based on high and low
quality scores, and they are available on Eco-‐Atlas’s website. The documented
CRAM scores clarify problem areas of the non-‐saline estuaries. The problem areas
allow scientists to analyze their significant environmental impacts, disturbance
levels, and artificial inputs. This project focuses on comparing the differences
between disturbed and undisturbed estuaries by using CRAM to distinguish the
variation in their health status. Undisturbed and disturbed wetlands are
comparatively analyzed from their ecological processes, system components,
topographic complexity features, and what they are mainly intended for.
Undisturbed wetlands are the perfect reference wetlands that are used to compare
the function too since they have not experienced moderate to high levels of
degradation (net loss in abotic factors).
I conducted this California Rapid Assessment Methods with a professional
Senior Wetland Ecologist/Botanist, Mr. Russell Huddleston. Mr. Huddleston is a
trained professional in the California Rapid Assessment Methods for Wetlands and
he helped me with assessing and receiving accurate data. The line transects
extended 250 meters north, south, west, and east in the Assessment Area and Buffer

8
(figure 1). All line transects extended the 250 meters without any interruptions by
unnatural inputs or disturbances.
Two sites that were chosen for this project are: Rush Ranch Estuary and
Arroyo Burro Estuary. Rush Ranch Estuary is located Southern Solano County, CA,
latitude 38.211529 and -‐122.029459 longitude. Rush Ranch Estuary occurs in the
upper western portions of the Suisun Slough (Vasey et al 2012). This tidal marsh is
located within the San Francisco Bay. The Arroyo Burro Estuary is located in the
Santa Barbara Region near Mesa Creek, latitude 34.40473°N, and longitude -‐
119.73982°W. Down below in map1 shows the locations of the two wetlands used
for this senior project.
Figure 1. Two CA freshwater estuarine wetlands
(Google Earth)
9
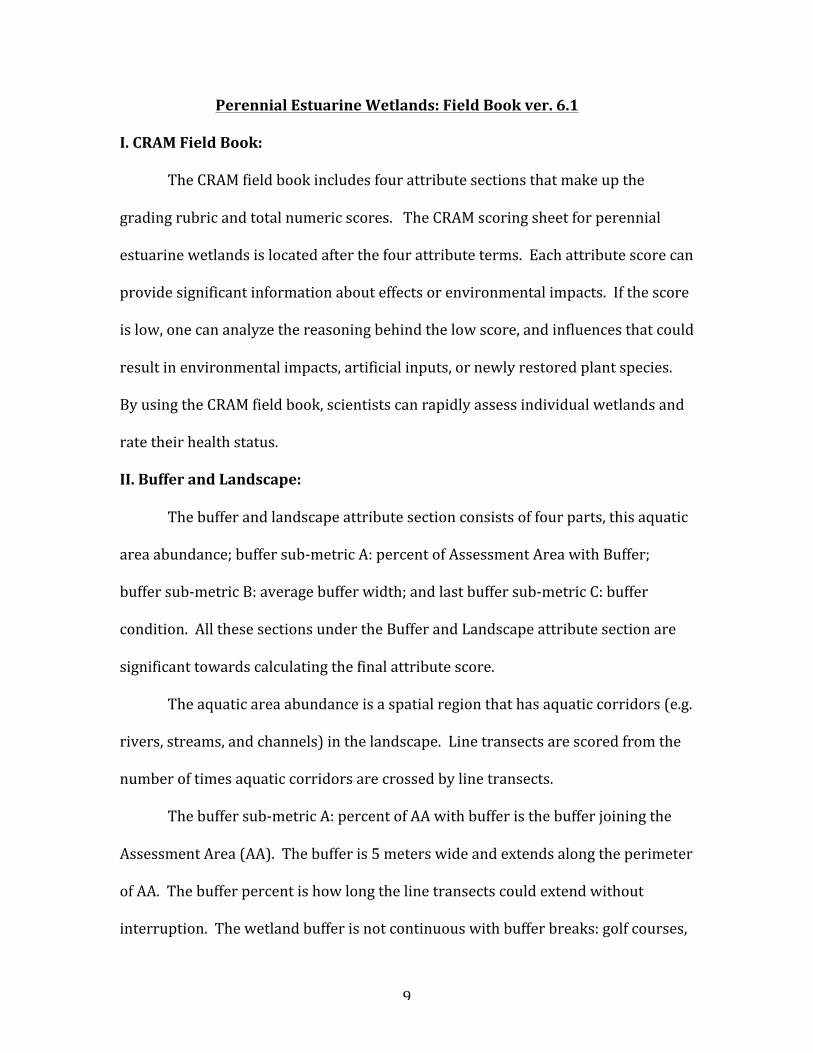
Perennial Estuarine Wetlands: Field Book ver. 6.1
I. CRAM Field Book:
The CRAM field book includes four attribute sections that make up the
grading rubric and total numeric scores. The CRAM scoring sheet for perennial
estuarine wetlands is located after the four attribute terms. Each attribute score can
provide significant information about effects or environmental impacts. If the score
is low, one can analyze the reasoning behind the low score, and influences that could
result in environmental impacts, artificial inputs, or newly restored plant species.
By using the CRAM field book, scientists can rapidly assess individual wetlands and
rate their health status.
II. Buffer and Landscape:
The buffer and landscape attribute section consists of four parts, this aquatic
area abundance; buffer sub-‐metric A: percent of Assessment Area with Buffer;
buffer sub-‐metric B: average buffer width; and last buffer sub-‐metric C: buffer
condition. All these sections under the Buffer and Landscape attribute section are
significant towards calculating the final attribute score.
The aquatic area abundance is a spatial region that has aquatic corridors (e.g.
rivers, streams, and channels) in the landscape. Line transects are scored from the
number of times aquatic corridors are crossed by line transects.
The buffer sub-‐metric A: percent of AA with buffer is the buffer joining the
Assessment Area (AA). The buffer is 5 meters wide and extends along the perimeter
of AA. The buffer percent is how long the line transects could extend without
interruption. The wetland buffer is not continuous with buffer breaks: golf courses,

10
commercial developments, fences, intensive agriculture, parking lots, railroads,
residential areas, sound walls, sports fields, urbanized parks, pedestrian side walks
and trails (very active), bike and foot trails (not very active), horse trails, natural
upland habitats, wild-‐land parks, land and pastures, railroads (only 2 trains a day),
swales and ditches, and vegetated levees.
The sub-‐metric B: average buffer width, consists of required measurements
for the buffer width. For example, if the buffer width is 5 meters or less then it
cannot be considered a buffer width. In addition, open water is not included in the
buffer width calculations.
The sub-‐metric C: buffer condition, includes the disturbance levels along with
plant species. The three categories of plant species include California natives, non-‐
natives, or invasive plant species in the buffer. The disturbance levels are rated by
soil compactions, level of human disturbance, and the presence or absence of a
buffer.
III. Hydrology:
The hydrology attribute section consists of three sections that make up the
total hydrology score, such as water source, hydro-‐period, and hydrologic
connectivity.
Water source is the extent, duration, and frequency of hydrologic regimes in
the Assessment Area. Undisturbed estuaries are recharged naturally by
precipitation, tidal inflows, and watershed runoff. Disturbed estuaries are
recharged by water pumps, and the hydrologic dynamics are controlled by storm
drains, weirs, dams, and grade control structures.
11
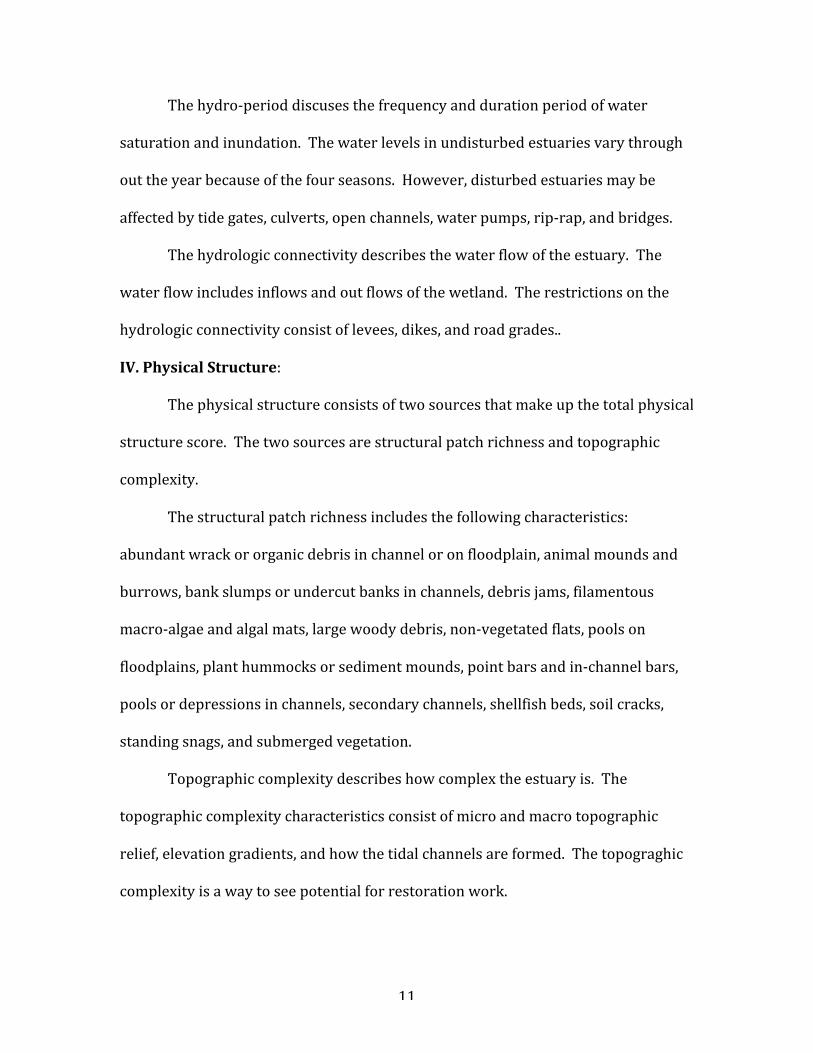
The hydro-‐period discuses the frequency and duration period of water
saturation and inundation. The water levels in undisturbed estuaries vary through
out the year because of the four seasons. However, disturbed estuaries may be
affected by tide gates, culverts, open channels, water pumps, rip-‐rap, and bridges.
The hydrologic connectivity describes the water flow of the estuary. The
water flow includes inflows and out flows of the wetland. The restrictions on the
hydrologic connectivity consist of levees, dikes, and road grades..
IV. Physical Structure:
The physical structure consists of two sources that make up the total physical
structure score. The two sources are structural patch richness and topographic
complexity.
The structural patch richness includes the following characteristics:
abundant wrack or organic debris in channel or on floodplain, animal mounds and
burrows, bank slumps or undercut banks in channels, debris jams, filamentous
macro-‐algae and algal mats, large woody debris, non-‐vegetated flats, pools on
floodplains, plant hummocks or sediment mounds, point bars and in-‐channel bars,
pools or depressions in channels, secondary channels, shellfish beds, soil cracks,
standing snags, and submerged vegetation.
Topographic complexity describes how complex the estuary is. The
topographic complexity characteristics consist of micro and macro topographic
relief, elevation gradients, and how the tidal channels are formed. The topograghic
complexity is a way to see potential for restoration work.

12
V. Biotic Structure:
The biotic structure consists of five different parts that make up the total
score for the attribute section. The five parts are, plant community sub-‐metric A:
number of plant layers, plant community sub-‐metric B: number of Co-‐dominant
species, plant community sub-‐metric C: percent invasion, horizontal interspersion,
and vertical biotic structure.
Under the plant community sub-‐metric A, includes the number of plant
layers present in the Assessment Area. The number of plant layers must consist of
at least 5% cover to be considered a plant layer. If the Assessment Area (AA) holds
less then 5% plant layers, has no plant layers, or has artificial inputs, it will receive a
“D” score. The artificial inputs that could cause a “D” score are rip-‐rap, concrete, or
newly transplanted plants.
Sub-‐metric B: number of Co-‐dominant species is the percent cover of a plant
species that only constitutes 10% in the AA. In section sub-‐metric C: percent
invasion is for invasive plant organisms in plant layers.
The last two features in the grading rubric are horizontal interspersion and
vertical biotic structure. The horizontal interspersion is an overview of the AA
including vegetation layers. The vertical biotic structure is an interspersion and
complexity of plant layers.
The results will consist of the “scoring sheet: perennial estuarine wetlands”
for the two non-‐saline estuaries (Rush Ranch and Arroyo Burro). Each attribute
section is a component of a functional assessment that estimates the whole
landscape context of the wetland. The results will include numeric scores that will

13
focus on problem areas. The scores will give relevance toward explaining the health
status and performance standards for each estuarine wetland. The health status
will determine the difference between these two perennial freshwater marshlands.
By using the scores as a guide, one can refer to the environmental effects and
artificial inputs that could alter the wetland composition and its function. For
example, a low score under the hydrology section can indicate unnatural inputs or
human disturbance. In addition, the problem areas will be supported by
quantitative data to correlate the California Rapid Assessment Method scores.
Results
The results show a distinct difference in two attributes, hydrology and biotic
structure while the other two attributes did not show enough variation (Graph 1).
The graphical approach was used to show variation between the two estuaries and
their attributes (Graph 1) furthermore the two estuaries were compared with
California non-‐saline estuaries by their total CRAM scores (Graph 2). The results
also included information on the biodiversity that occurs at Rush Ranch (Table 3),
and newly restored plant species that were transplanted in the Arroyo Burro
Estuary streambed (Table 4).
CRAM Scores
The scoring for Rush Ranch estuary has two different scores that consist of
documented scores from Eco-‐Atlas and my own scores that I conducted with Mr.
Huddleston a trained professional in the California Rapid Assessment Methods for

14
Wetlands (CRAM field book 2013). The scores for Arroyo Burro Estuary are
documents from the Eco-‐Atlas. However there is a lack of information in regards to
specific locations of the Assessment Area (AA) and Buffer during the CRAM. With
out a map showing the location of the AA and Buffer it would be difficult to spot the
problem areas.
Buffer and Landscape Context
Attribute Aquatic Area Abundance: Rush Ranch Estuary scored a “12/12”
while Arroyo Burro Estuary scored a “9/12” (Table 1). Not enough variation
between the two study sites for this attribute. Rush Ranch has rich aquatic
corridors (Figure 2 and 3). However, Arroyo Burro Estuary had a higher score than
predicted because it is surrounded by urbanization and lacks aquatic corridors
(Figure 4). There is no documented maps showing the Assessment Area or Buffer,
and trying to indicate if the line transects crossed aquatic corridors is an issue.
Attribute Percent of Assessment Area with Buffer: Rush Ranch Estuary
received “12/12” while Arroyo Burro Estuary received “9/12” (Table 1). There is no
variation between the two estuaries.
Attribute Average Buffer Width: Rush Ranch Estuary scored a “12/12”
compared to Arroyo Burro “9/12” (Table 1). The results showed no variation
between the two study sites.
Attribute Buffer Condition: Rush Ranch Estuary resulted a “12/12” while
Arroyo Burro Estuary scored a “9/12” (Table). There was not enough difference
between the two estuaries. Results have shown that this attribute along with the
other physical structure attributes, show no importance of the buffer condition,

15
percent, width, or aquatic abundance areas. Since, an undisturbed wetland can have
no difference in buffer scores compared to a highly disturbed wetland. Results,
specifies the dependence on mapping the buffer and assessment area location in the
study site.
Hydrology
Attribute Hydrologic Connectivity: Rush Ranch Estuary received a “12/12”
compared to Arroyo Burro Estuary “6/12” because of unnatural inputs (such as
levees, dikes, and road grades) that count for 50-‐90% of the wetland in the
Assessment Area (Graph 1 and table 1). The results demonstrated a difference
between the two estuaries in the hydrologic connectivity. The changes that were
made to restore the Arroyo Burro Estuary’s streambed included an open new
channel, slope, levees, vegetation, dikes, and removal of a 300ft. concrete culver that
all contribute into lowering the hydrology score (URS 2014). While Rush Ranch
Estuary has several secondary and primary tidal channels resulting in a rich aquatic
corridors (Figure 2 and 3).
Attribute Hydro-‐Period: Rush Ranch Estuary scored a “12/12” while Arroyo
Burro Estuary received an “12/12.” There is no difference between the two study
sites in this attribute section. The hydro-‐period score for Arroyo Burro Estuary was
higher than predicted however, this shows great streambed restoration planning.
The first year of monitoring the Arroyo Burro Estuary, have shown a 57% of
abundance in California native plant cover, and a 80% survival rate for newly
restored plants species (native and non-‐native plant species) (Kisner 2007). Since
there was an increase in relative abundance it results in a high score for the hydro-‐

16
period attribute. Changes in channel morphology, drainage network density, and
the relative abundance of plants could raise the hydro-‐period attribute score (CRAM
dictionary 2013).
Attribute Water Source: Rush Ranch scored a “12/12” while Arroyo Burro
scored a “6/12”. These scores specify a difference between the two estuarine
wetlands. Arroyo Burro Estuary consists of urban runoff, direct irrigation, storm
drains, and regulated water releases controlled by a large reservoir within 2km
upstream of the Assessment Area (CRAM field book 2013). Recent studies have
shown fecal coliform concentrations in the Arroyo Burro watershed, Vs =4/17E-‐6
for the average settling velocity of fine grain sediments, sediment resuspension rate
Rt= 0 kg/m2s summer versus 5.49E-‐4 kg/m2s winter, and total suspended solids
concentration TSS= 0.3 kg/m3s summer and 1.5 kg/m3s winter (Steets et al 2003).
The Arroyo Burro Estuary is under the “Water Quality Limited segments in the
Clean Water Act Section 303-‐(d) List” and Arroyo Burro was reported in 1999 as
4E6 and 8E6 MPN/m3 while the “California’s Single Sample Standard for fecal
coliforms in recreational water regions should not exceed 4E6 MPN/m3 ”(Sercu et al
2008). Other studies sampled the pH and dissolved oxygen levels of Arroyo Burro
Estuary: pH= 8.2 drain, 7.9 creek, 8.0 lagoon, and 8.2 surf zone; dissolved oxygen=
8.4 surf zone, 13.4 lagoon, 8.8 drain, and 7.8 creek (Sercu at al 2008). Rush Ranch
however has no signs of human disturbance or water pollution that occurs in the
estuary.
17
Physical Structure
Attribute Structural Patch Richness: Rush Ranch Estuary resulted in a “ 3/12”
while Arroyo Burro received a “9/12” (Table 1). Rush Ranch Estuary resulted in a
lower score compared to Arroyo Burro Estuary this indicates only two or less
structural patch richness features that occurred in this study site. However, the
score I received was “6/12” for Rush Ranch Estuary indicating four out of sixteen
structural patch richness features, and we found organic debris in the channel, bank
slumps, depressions in channels, and secondary channels (Table 1 and figure 2).
These scores could result from the choosing of the Assessment Area and Buffer
locations because the wetland composition could vary through out the study site.
Attribute Topographic Complexity: Rush Ranch resulted a “9/12” while
Arroyo Burro Estuary scored a “6/12” (Table 1). There was no difference between
the two study sites. Arroyo Burro Estuary resulting in a low score signifies lack of a
tidal channels and soil cracks furthermore this particular estuary had the tidal
channel restored because of drainage and sediment filling issues. Arroyo Burro
Estuary has a large reservoir that builds up sediment along with regulating water
releases this could impact fecal coliform loadings. However, tidal flushing and
storm-‐water could raise the fecal coliform contamination levels (Steets et al 2003).
Biotic Structure
Attribute Plant Number of Plant Layers: Rush Ranch Estuary received a
“12/12” while Arroyo Burro Estuary scored a “9/12” (Table 1). This attribute did
not show enough variation between the two study sites.

18
Attribute Number of Co-‐Dominant Species: Rush Ranch Estuary scored a
“12/12” while Arroyo Burro Estuary scored a “9/12” (Table 1). These results did
not show much difference between the two freshwater estuarine wetlands.
Attribute Percent Invasion: Rush Ranch Estuary scored a “12/12” while
Arroyo Burro Estuary did not have a documented percent invasion CRAM score in
the Eco-‐Atlas or show signs of invasive plant species in the Year One Annual
Monitoring Report (Kisner 2007). Rush Ranch Estuary has been comparatively
analyzed by topographic data that correlated estuarine plant species and their
distributions. The topographic data concludes, the habitat of Rush Ranch is
considerable, but will have continuous exotic plant species invading the ecosystem
(Andrew et al. 2009).
Attribute Horizontal Interspersion: Rush Ranch scored a “12/12” while
Arroyo Burro Estuary received a “3/12” (Table 1). The results show a difference
between the two study sites (Table1 and graph 1). A vegetation study was
conducted on Rush Ranch Estuary with species richness by calculating their relative
abundance: subplot= 5.2±0.2, plot=12.4±0.6, plot_all= 15.9±0.7, site=39, and
site_all= 44 (table 5) (Vasey et al 2013). The results showed no obvious signs of
human disturbance, no shifts in wetland composition, rich plant biodiversity, no
invasive plant species, and rich vegetation patterns. Rush Ranch Estuary is a very
rich ecosystem with rich biodiversity in plant species, such as Cirsium hydrophillum,
Schoenoplectus acutus, Typha latifolia, Typha domingensis, Typha angustifolia,
Schoenoplectus californicus (Vasey et al 2012). The low score for Arroyo Burro
Estuary indicates the Assessment Area supporting less than 5%, no plant layers, or

19
signs of concrete, rip rap, or newly restored vegetation. The One Year Annual
Report for the Arroyo Burro Estuary Restoration Project consisted of 57% of
California native plant cover and 11% non-‐native plant cover (Table 4 and 5),
(Kisner 2007). Furthermore, Arroyo Burro Estuary also consists of rip rap that was
installed along the newly constructed tidal channel (URS 2013).
Attribute Vertical Biotic Structure: Rush Ranch Estuary scored a “12/12”
while Arroyo Burro Estuary scored a “3/12” because the Assessment Area is
deficient in living vegetative canopy. The results showed a difference between the
two study sites indicating lack of dense canopy and shelter for wildlife in Arroyo
Burro Estuaries habitat (Table 1 and graph 1). Recent studies have shown with
quantitative data on Arroyo Burro Estuary, 31 non-‐native plant species and 84
California native plant species that occurred along the line transects (Table 5),
(Kisner 2007). This study concludes the relative abundance: an average of 57% of
average plant cover, 36% of average bare ground cover, 80% survival rate for the
first year of newly restored plants (Kisner 2007).
Table 1. CRAM Scoring Sheet: Perennial Estuarine Wetlands
Attributes Rush Ranch (I conducted these scores)
Rush Ranch (Documented scores)
Arroyo Burro (Documented scores)
Aquatic Area Abundance
6 12 9
Percent of AA* with Buffer
12 12 12
Average Buffer Width
12 12 9
Buffer Condition 9 12 9
Water Source 12 12 6

20
Hydro-‐period 12 12 12
Hydrologic Connectivity
9 12 6
Structural Patch Richness
6 3 9
Topographic Complexity
9 9 6
Horizontal Interspersion
12 12 3
Vertical Biotic Structure
12 12 3
Number of Plant Layers
12 12 9
Number of Co-‐dominant Species
12 12 9
Percent of Invasive species
12 9 IN.
*Assessment Area
Table 2. The total attribute scores and total CRAM score for each estuary.
Attributes Rush Ranch (I conducted these scores)
Rush Ranch (Documented scores)
Arroyo Burro (Documented scores)
Buffer and Landscape
68% 100% 79%
Hydrology 92% 100% 67%
Physical Structure
63% 50% 63%
Biotic Structure 100% 92% 44%
Total CRAM* score
81% 86% 63%
* California Rapid Assessment Methods for Wetlands
Table 3. Biodiversity at Rush Ranch Species Common Name Species Latin Name Salt Marsh Harvest Mouse
Reithrodontomys raviventris
Suisun Ornate Sorex ornatus sinuosus Delta Smelt Hypomesus transpacificus

21
Sacramento Splittail Pogonichthys macrolepidotus
Giant Garter Snake
Thamnophis gigas
California Clapper Rail Rallus longirostris obsoletus
California Black Rail Laterallus jamaicensis Suisun Song Sparrow Melospiza melodia
maxillaris American White Pelican Pelecanus erythrorhynchos Waterfowl (Vasey et al 2012)
Table 4. Transplanted California native plant species in Arroyo Burro Estuary.
Species common name Species Latin name
California Boxelder Acer negundo var californicum White alder Alnus rhombifolia rhombifolia Yerba mansa Anemopsis Californica Mugwort Artemisia douglasiana Marsh baccharis Baccharis douglasii Plummer’s Baccharis Baccharis plummerae Mule fat Baccharis salicifolia Creek dogweed Cormus sericea Saltgrass Distichlis spicata Common spikerush Eleocharis macrostachya Seacliff buckwheat Eriogonum parviflorum Western goldenrod Euthamia occidentalis Everlasting Gnaphalium canesceus Toyon Heteromeles arbutifolia Coast goldenbush Isocoma menziesii Basket rush Juncus textilis Giant rye grass Leymus condensatus Coascliff aster Malacothrix saxatilis Western sycamore Platanus reacemosa Black cottonwood Populus balsamifera subsp trichocarpa Hollyleaf Cherry Pruns ilicifolia Coast Live Oak Quercus agrifolia Lemonade sumac Rhus integrifolia Fuchsia flowered gooseberry Ribes speciosum California Blackberry Rubus ursinus Arroyo Willow Salix lasiolepis Purple sage Salvia leucophylla

22
Black sage Salvia Mellifera Alkali bulrush Scirpus maritimus (Kisner 2007)
Table 5. Quantitative Data for Rush Ranch Estuary.
Site CC PM CI RR BI SMS
Subplot 2.5±0.1 2.8±0.1 2.3±0.1 5.2±0.2 4.7±0.2 5.4±0.2
Plot 5.2±0.5 5.8±0.5 4.8±0.6 12.4±0.6 10.4±0.6 10.8±0.8
Plot_All 6.2±0.4 7.1±0.7 6.2±0.7 15.9±0.7 13.2±0.8 13.4±1.1
Site 10 14 21 39 48 44
Site_All 10 17 23 44 55 56
(Vasey et al 2012)
CC=China Camp
PM= Petaluma Marsh
CI=Coon Island
RR=Rush Ranch
BI= Browns Island
SMS= Sand Mound Slough
Table 6. Non-‐native plant species on line transects at Arroyo Burro Estuary.
Scientific Name
Common Name
A B C D E F G H I J K L
Agrostis virdis Water bent grass
*
Anagallis arvensis
Scarlet pimpernel
*
Brassica nigra Black mustard
*
Chamaesyce maculata
Spotted Spurge
* *

23
Chenopodium spp.
Goosefoot * * * *
Conium maculatum
Poison Hemlock
*
Convolvulus arevensis
Bind weed * *
Cyperus involucratus
Umbrella plant
*
Foeniculum vulgare
Sweet fennel
*
Junglans regia English walnut
*
Malva parviflora
Cheeseweed * *
Malva polymorpha
Bur clover *
Nicotiana glauca
Tree tobacco
* * * *
Oxalis pes-‐caprae
Bermuda buttercup
*
Plantago major Broadleaf plantain
* * *
Polypogon monspeliensis
Rabbitsfoot grass
* *
Raphanus sativa
Radish *
Rumex spp. Dock *
Vicia sativa Vetch *
Total 0 1 6 1 0 0 6 8 2 2 1 4
(Kisner 2007)

24
Graph 1. The bar graph for the 4 attribute scores on each estuary.
0
20
40
60
80
100
120
Buffer & Landscape
Hydrology Physcial Structure
Biotic Structure
Num
eric Scores
4 Attribute Scores
The 2 non-‐saline estuaries
Rush Ranch (documented)
Rush Ranch (I conducted)
Arroyo Burro (document)

25
Graph 2. Percent CRAM Score of all non-‐saline estuaries throughout California.
Table 7. Total CRAM scores for CA non-‐saline estuaries.
Location Name of Estuary Total CRAM Score San Francisco Suisun City Rush Ranch 86% San Francisco Browns Island 85% San Francisco Napa Pond 2 84% San Francisco Montezuma Bridge 80% San Francisco Pacific Atlantic Terminal 76% San Francisco Mackavoy Marsh 74% San Francisco Suisun City 72% San Francisco Browns Island
Oversample 71%
San Francisco Port Chicago Pier 2 72% San Francisco Pond 2A Over Sample 71% San Francisco Grey Goose 70% San Francisco Coyote Creek Lagoon 70%
0%
10%
20%
30%
40%
50%
60%
70%
80%
90%
100%
1 2 3 4 5 6 7 8 9 10 11 12 13 14 15 16 17
Total CRAM Score (%
)
Individual Non-‐saline Estuaries
Total CRAM Scores CA Non-‐saline Estuaries
Rush Ranch
Arroyo Burro

26
San Francisco Coyote Creek 69% Central CA Tembladero Lower Marsh 66% Southern CA Arroyo Burro Estuary 63%
Figure 2. Rush Ranch Estuary

27
Figure 3. The line transects in Rush Ranch Estuary.

28
Map 3. Arroyo Burro Estuary

29
Figure 1. Arroyo Burro Estuary and Mesa Creek, before restoration
(USFWS Photos)
Figure 2. Arroyo Burro Estuary and Mesa Creek, after restoration.
(USFWS Photos)

30
Conclusion
Discussion
I am accepting my hypothesis for this senior thesis because I have supportive
evidence to distinguish the difference between disturbed and undisturbed non-‐
saline estuaries in California. I established discernible differences between Rush
Ranch Estuary (undisturbed wetland) and Arroyo Burro Estuary (disturbed
wetland), by using the Level II California Rapid Assessment Methods for Estuaries to
comparatively analyze the CRAM scores. Furthermore, undisturbed versus
disturbed wetlands are comparatively analyzed by their ecological processes,
system components, topographic complexity features, and their intended purpose.
The results show Rush Ranch Estuary having the highest score 86% and
being well above average 75%, versus Arroyo Burro Estuary having the lowest score
63% (Graph 1 and table 7). This graphical approach visually demonstrates
variation between the two study sites among other California non-‐saline estuaries,
and their differences include hydrology and biotic structure. There was no
difference between the buffer and landscape context, and physical structure.
However in this case disturbed compared to undisturbed wetlands are different in
the landscape context.
Rush Ranch Estuary functions as a high quality, undisturbed non-‐saline
estuary while Arroyo Burro Estuary functions as a low quality, highly disturbed non-‐
saline estuary this type of low quality function is known as wetland treatment
system (Kadlec 1996). Disturbed and undisturbed wetlands are very different in the
landscape context because Arroyo Burro Estuary has no room for marsh migration.

31
Since there is lack of undisturbed areas and the affect by human fecal pollutants
contaminating the storm drains (Sercu et al 2008). While undisturbed areas
dominate Rush Ranch Estuary and are used for marsh migration.
An undisturbed wetland such as Rush Ranch Estuary provides a high quality
wildlife habitat for the Salt Marsh Harvest Mouse Reithrodontomys raviventris,
Suisun Song Sparrow Melospiza melodia maxillaries, and Waterfowl (Table 3). In
addition, Rush Ranch Marsh is also the ecological niche for endemic species of San
Francisco, such as Lathyrus jepsonii and Cirsium hydrophilum var., 200 organisms, 47
plant species, 15 mammals, and 230 birds (Parker et al 2011), (Andrew et al. 2009).
Rush Ranch is the largest remaining tidal wetland located in the Suisun Bay with
rare and valuable ecological features, such as up-‐land transition habitats making
this estuarine wetland a National Research Reserve under the San Francisco Bay
National Estuarine Research Reserve (Vasey et al 2012). Rush Ranch is a great
example of an undisturbed freshwater marsh since it is anticipated for conserving
and protecting threatened or endangered tidal marsh species (Table 3), (Whitcraft
et al 2011). Species listed under the State or Federal Endangered Species Act fall
under the legal jurisdiction of the ESA, and any damage to critical habitat or species
is prohibited.
The notion of the rapid assessment tactics discusses the environmental
impacts, such as degradation, bank erosion, and poor water quality. These
environmental impacts are results from human caused alterations toward wetlands.
Therefore, Arroyo Burro Estuary functions as a treatment wetland to improve the
water quality from bacteria loading and subsequent beach closures that increase

32
pollution levels caused by urbanization (Aguinaga et al 2004). Arroyo Burro
Estuary is under the “Water Quality Limited segments in the Clean Water Act
Section 303-‐(d) List”, for example the California’s single sample standard for fecal
coliform in a recreational waters should not exceed 4E6 MPN/m3 and in February
1999 the Arroyo Lagoon resulted in a 4E6 and 8E6 MPN/m3 (Sercu et al 2008),
(Steets et al 2003). The stressors that were found to affect the Arroyo Burro
Estuary was the urbanization runoff, urban residential, industrial and commercial,
active recreation, excessive human visitation, discharges of urban runoff,
contaminated storm drain, rip rap, engineered channel, nutrient impaired, bacteria
and pathogens impaired (CRAM field book 2013).
These two different non-‐saline estuaries differ in a few ways that include
function, wetland composition, and wetland condition. An assumption of the
California Rapid Assessment Method for Wetlands indicates any sign of human
disturbance is as a negative environmental impact on the estuary and will lower the
CRAM score. High CRAM scores indicate that the wetland is in excellent condition
compared to other wetlands in that class, and they may provide a reference for
wetland restoration or conservation.
The California Rapid Assessment Methods for Wetlands is not accurate for
determining the performance standards, health status for individual wetlands, or
should be used for a statistical approach. Since the Assessment Area and Buffer
could both be mapped in a biased location within the study site of Arroyo Burro
Estuary. Arroyo Burro Estuary received a higher CRAM scores even though it lacks
in water quality, hydrologic connectivity, aquatic abundance, buffer width, buffer

33
condition, buffer percent. CRAM is a way to rapidly compare and contrast the
wetland condition, stressors, and condition of the wetland.

34
References
Aguinaga, I., T. Lancy, J. Philips, J. Uwins, G. Weber, D. Williams. 2004 Land
Use Based Pollution Monitoring for Santa Barbara’s Urban Creeks. University of
California Santa Barbara, CA, USA.
Andrew, M. E., S. L. Ustin. 2009. Habitat suitability modeling of an invasive
plant with advance remote sensing data. Diversity and Distributions 15:627-‐640.
Arroyo Burro Estuary Restoration: Santa Barbara, CA. Penfield & Smith.
Retrieved February 14, 2014. http://www.penfieldsmith.com
California Invasive Plant Council (CalIPC ). 2012. 1442-‐A Walnut St., #462,
Berkeley, CA 94709. http://www.cal-‐ipc.org
California Rapid Assessment Methods for Wetlands. 2014. CRAM Wetlands.
Retrieved February 5, 2014. http://www.cramwetlands.org
California Rapid Assessment Method for Wetlands (CRAM) Photo Dictionary.
2013. Central Coast Wetlands Group at Moss Landing Marine Labs.
California Wetlands Monitoring Workgroup (CWMW). “Wetland Projects
EcoAtlas. Accessed March 5, 2014. URL
Callaway, J.C, T.V. Parker, M.C. Vasey, L.M. Schile, E.R. Herbert. 2011. Tidal
Wetland Restoration in San Frncisco Bay:History and Current Issues. San Francisco
Estuary and Watershed Science. 9:3.
Creed, S.C., R.W. Crites, E.J. middlebrooks. 1995. Natural Systems for Waste
Management and Treatment.

35
Environmental Laboratory. 1987. US Army Corps of Engineers wetlands
delineation manual. (Technical Report y-‐87-‐1.) US Army Corps of Engineers
Waterways Experiments Station.
Hunt, J. B. Anderson, B. Phillips, B. Largay,F. Watson, K. Harris, E. Hanson, M.
Berretti, R. Schafer, K. Brown, A. Bern. 2007. Effectiveness of agriculutural
Management Practices in Reducing Concnetrations of Pesticides Associated with
Toxicity to Aquatic Organisms. The Marine Pollution Studies Laboratory. Data
Summary and Final Report.
Historical Ecology Projects. San Francisco Estuary Institute: Region-‐wide
science for ecosystem management. http://www.sfei.org/HE-‐Projects.
Kadlec, R.H., R.L. Knight. 1996. Treatment Wetlands. Lewis Publishers. Boca
Raton, Florida, USA.
Huddleston, R. (2013, November 23). Rush Ranch CRAM.
Kisner, Johanna. 2007. Year 1 Status Report Arroyo Burro Estuary
Restoration Project. Annual Report 12-‐20-‐07.doc
Lester A. Snow. 2010. State of the State’s Wetlands: 10 Years of Challenges
and Progress. Natural Resources Agency State of California.
Mall, R.C. 1969. Soil-‐water-‐salt relationships of waterfowl food plants in the
Suisun Marsh of California. Wildlife Bulletin No. 1. California Department of Fish
and Game. Sacramento, CA, USA.
Major Projects Completed: City of Santa Barbara, Arroyo Burro Estuary
Restoration Project. Santa Barbara Natives, Inc.-‐California native plant nursery-‐

36
major projects completed. Retrieved February 14, 2014.
http://www.sbnatives.com/past-‐projects
Perennial Estuarine Wetlands Field Book. 2014. California Rapid Assessment
Methods for Wetlands. Version 6.1:1-‐38
Sercu, B., L.C. Van De Werefhorst, P.A. Holden. 2008. Storm Drains are
sources of Human Fecal Pollution during Dry Weather in Three Urban Southern
California Watersheds. Environmental Science & Technology. 43:293-‐298
Smalling, K. L., K. M. Kuivila, J. L. Orlando, B. M. Pilips, B. S. Anderson, K.
Siegler, J. W. Hunt, M. Hamilton. 2013. Environmental fate of fungicides and other
current-‐use pesticides in a central California Estuary. Marine Pollution. 73:144-‐153
Solek, C.W., E.D. Stein, M. Sutula. 2011. Demonstration of an integrated
watershed assessment using a three-‐tiered assessment framework. Wetlands
Ecology and Management. 19:459-‐474
Steets, B.M., P.A. Holden. 2003. A mechanistics model of runoff_associated
fecal coliform fate and transport through a coastal lagoon. Water Research. 37:589-‐
608
Sutula, Martha. 2011. Review of Indicators for Development of Nutrient
Numeric Endpoints in California Estuaries. Southern California Coastal Water
Research Project Technical Report No.646. December 2011.
Sutula, Martha. 2008. Status of Perennial Estuarine Wetlands in the State of
California. Surface Water Ambient Monitoring Program State Water Resources
Control Board.

37
Sutula, M.A., E. D. Stein, J.N. Collins, E.A. Fetscher, and R. Clark. 2006. A
Practical Guide for the Development of California Experience. Journal of the
American Water Resources Association (JAWRA) 42(1): 157-‐175
URS/City of Santa Barbara. 2013. Landscaping Plan_Understory Species.
Arroyo Burro Estuary Restoration Project No. 8051.
Vasey, M.C., T.V. Parker, J.C. Callaway, E.R. Herbert, L.M. Schile. 2012. Tidal
Wetland Vegetation in the San Francisco Bay-‐ Delta Estuary. San Francisco Estuary
and Watershed Science. 10(2)
Vasey, M.C., T.V. Parker, J.C. Callaway, E.R. Herbert, L.M. Schile, Ellen R. 2011.
Climate Change and San Francisco Bay Delta Tidal Wetlands. 9(3)
<htt://www.escholarship.org>
Whitcraft, C.R., B.J. Grewell, P.R. Baye. 2011. Estuarine vegetation at Rush
Ranch Open Space Preserve, San Francisco Bay National Estuarine Research Reserve,
California. San Francisco Estuary and Watershed Science 9:3.
Vasey, M. C., T.V. Parker, J.C. Callaway, E.R. Herbert, L.M. Schile. 2014. Tidal
Wetland Vegetation in the San Francisco Bay-‐Delta Estuary. San Francisco Estuary
and Watershed Science. 10(2)
Williams, P., and Faber, P. M. 2004. Design Guidelines for Tidal Wetland
Restoration in San Francisco Bay. The Bay Institute and California State Coastal
Conservancy, Oakland, CA. 83.
Williams, P., and Faber, P. M. 2001. Salt Marsh Restoration Experience in
Sam Francisco Bay. Journal of Coastal Research.27:203-‐211.

38