Embed Size (px)
Citation preview

MSU ARCHIVES tBR l
SENIOR THESES
DEPARTMENT OF PHYSICAL SCIENCES
Morehead State University
Petrologic Classification of Igneous and Metamorphic Rocks by Frank Baldridge
X -Ray Analysis of Cave Sediments From Pigeon Water Cave of Northeastern Pine Mountain by Billy B. Stapleton
The Correlation of Stream-deposited Breccias In Bat Cave, Carter Caves, Kentucky by James Bond
Jointing and Faulting in Select/ed Areas of Eastern Kentucky by Mark A. Blair
December 1993
. ( Tf..Y

t7
PETI}(LOGIC CLASSIFICATION OF IGNEOUS AND METAMORPIIlC ROCKS
&~esternNorthC~--;;~_ µ_g.. ~ ~
J
I A Research Paper
Presented to
the Department of Physical Sciences
_J Morehead State University
In Partial Fulfillment
of the Requirements for
Science 471
by
· Frank Baldridge
December 1993
I

TABLE OF CONTENTS
ABSTRACT .. ............. ........................... ........................ ... ........................ ............... ... ... iii.
WfRODUCTION ..................... ............... ... .. .. ..... .. ....... ....... .... .... .............. .. ........... ....... 1
TYPES OF MET AMORPI-IlSM ..................................................................................... 3
CLASSIFICATIONS OF IGNEOUS AND METAMORPI-IlC ROCKS ........ .......... .... .. 6
PROCEDURE FOR MAKING THIN SECTIONS .. ...... .. .......................... .. ... ...... .. ........ 9
RESULTS .... ..... .. ..... .. .. .... ... .... .. ........ .. .. ... .. ..... .... .. .................................... ............. ... ..... 10
REFERENCES CITED ...... .. ............ ...... .. ... .................. ............................. ............ .... ... 12

. ~·
I !
TABLE OF FIGURES
FIGURE 1. S~phic column .......................................................................... , ..... '..2
FIGURE 2. Con~ct metamorphism aureole ................................................................... 4
FIGURE 3. Depth and temperature increases ...................................... : .......................... 5
FIGURE 4. Schistosity with planar and linear texture .................................................... 8
I
ii

i ---,
-~
I
I
~,
I ' 'j '
,~
PETROLOGIC CLASSIFICATION OF IGNEOUS AND METAMORPIIlC ROCKS OF NORTIIWESTERN NORTII CAROLINA.
BALDRIDGE, Frank M, Dep8nment of Physical Sciences, Morehead State Universit)', Morehead, KY 40351
About 34percent of the Earth's surface is made up of igneous and metamorphic rocks, the remaining 66 percent comes from weathered particles of igneous rocks that are later lithified into sedimentary layers. To classify igneous and metamorphic rocks the mineralogical characteristics and fabric must be determined General observations can be made in the field but
, a thin section of the sample viewed ~th a polarizing microscope will produce more specific data. . .
. , Thin sections are actually thin slices of rock that are bonded to a glass slide and ground to a·
thickness of about 30 microns to enable them to transmit light The effects of polarized light on each mineral is unique, therefore crystal structure can be determined. When mineral composition is used in conjunction with the rocks texture arid microstructure the origin of the rock can be determined.
For this study field samples of igneous and metamorphic rocks were collected and the surrounding geology of the· area was noted for later reference in determining metamorphic influences.
, ;
_ ... --CITED REFERENCES
Fis~~Pettijohn, Reed, "eaver, 1970, Studies of Appalachian Geology, John Wiley and Sons, . ~- 195-271. . ' .
. '
, King, Philip B., Ferguson, La-wienee, Roberts, 1944, Geology and Manganese Deposits of orthe'.15tem Tennessee, Division of Geology, State of Tennessee Department of _ ervation. - ·
j .
Stiickey, Jasper L., Conrad, Stephen G., 1958, North Carolina Division of Mineral Resources-Geologic Map of North Carolina
i - _ .... · ---Winkler, ~elmut G. F., 1974, Petrogenesis ofMetamotphic Rocks, Springer, Verlag,"New York,
NewYork. · ·
\
iii /
--·-
~,
-' I
' _ _J
INTRODUCTION
This study deals with igneous and metamorphic rocks collected from northwestern
North Carolina in and around the Blue Ridge thrust sheet. Tectonic activity in the area , . , ~
has created a wide variety of metamorphic and ign~ous rock types; phylliWschi~ ~ gneis@granit61as~and gabb@Rocks range in age from ,,gambrian to rr,... precambrian and are located within the strati hie section (Fig. 1). Thin sections
were prepared to demonstrate texture and microstruc e observable under a
/etrographic microscope.
1
- ·-. - . . -- . -· -· -· • - ·-- • -· ~- . I I.
. I
L I.. I.
r.. I. ,_ . ,. .. ·. ---:-- . • • ·. . "'-:
-t"':\. ., ..... . . - . ~ ,-~-• - ;J:. .\ ·- I ...., . , , .... .,. : . 1"\.i :""':\,.-
I • ;. "1 • . - . , ·~· Cl. . ' . - ' ..._ e:::r "'"1:1 1--•• ___,;:- • r
•11111.
- . - . ·- . -- . - . _,,_,_ I 11- t:} - 0 - ••• • • - •• •• . . ' .. '., • • .. • •
• . . . .. •• . " /\ I~ \.
\ / ' /
/ \ /
(
\/ \.. ' / J ' I '\'I . \ -=
I 1-· ~\//.
-<; \ '~, '
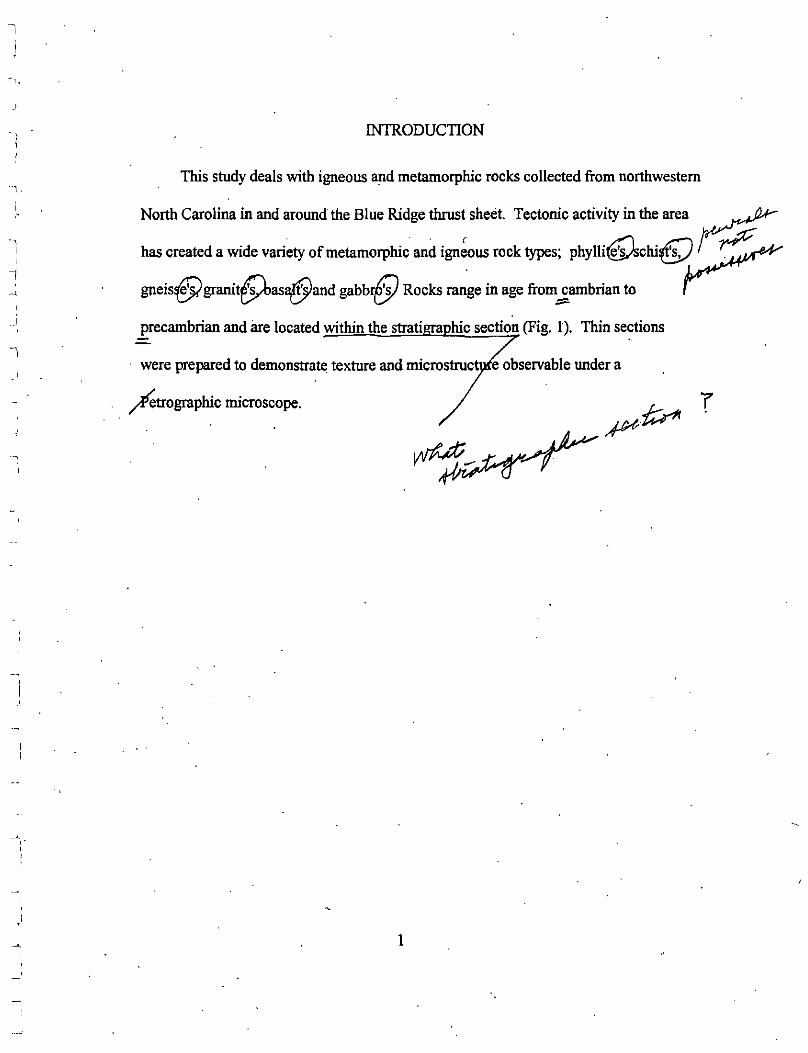
FIG. l
STRATIGRAPIDC SECTION
ROMB FORMATION· Shale, sill3IDne, Slllldstone:. Cambrian in age.
SHADY DOLOMITE- Dolomite and limestone. UNICOfambnan in age.
ERWIN FORMATION• Quartzite,. shale, sandstone. .Cambrian in age
•
UNICOI FORMATION- Sandstone, conglomerate. graywacke, siltstone and shale with amygdaloidal basalt Cambrian in age
MT. RODGERS GRQUP· Metavolcanics.rhyolite,arkose,shale · · and conglomerm,i. ·
Precambrian in age .
tRANBERR Y GRANITE- Mig@i\e, granitic gneiss, . · . . moll7.0nite, quartz diorite, green
stone, mica,and hornblende.~ · s Precamb • • r nan m age. _,.,-· ·
I ROAN GNEISS- Hornblende and garnet gneiss with granitic
· Uiigmatite. Also mica schist and amplnbolite Contains granitic and ~es. Precambrian in age.
2
I

' I
;?
_I
J
TYPES OF METAMORPHISM
There are two types of metamorphism in a geologic setting, local and regional.
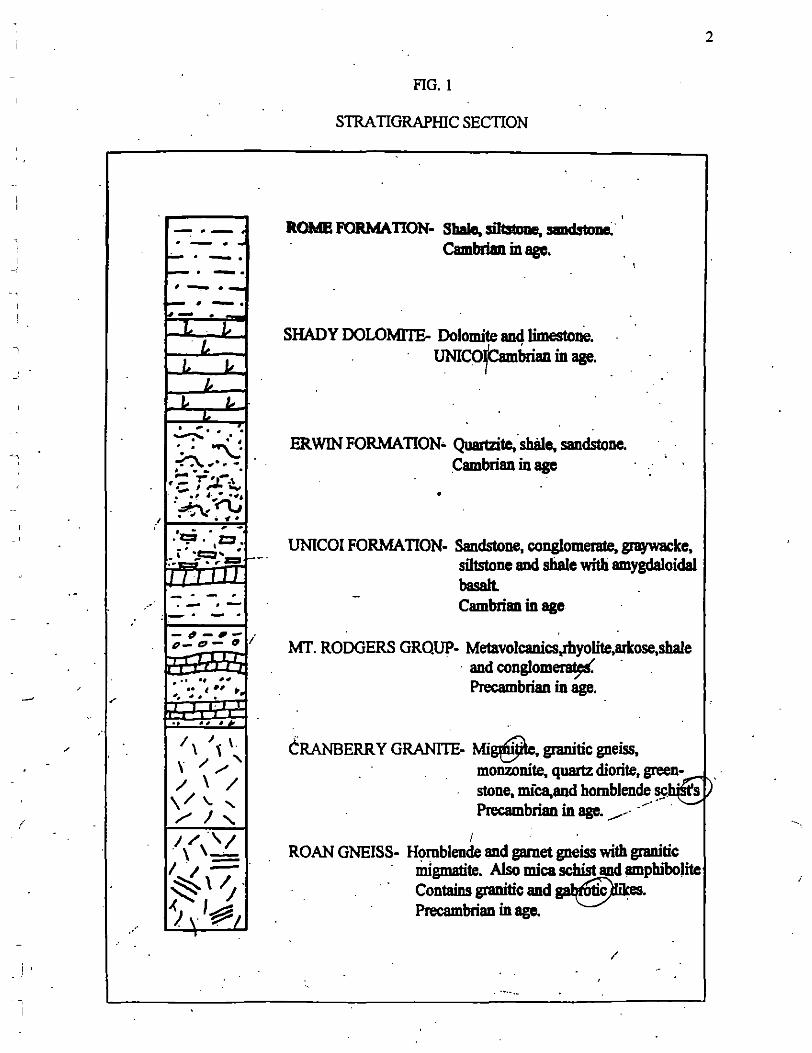
Local metamorphism can be divided into two types; contact and cataclastic. Contact
metamorphism occurs when an igneous intrusion raises the temperature of the
surrounding country rock or prQ!Q.!.l!h. When the temperature is increased an aureole of
metamorphic rocks is produced around the intrusive body (Fig. 2). The second type of
local metamorphism is called cataclastic metamorphism, this usually occurs near faults
and ovenhrusts. The mechanical crushing and shearing JlR:Seftt increases temperature
due to friction and alters the rocks fabric.
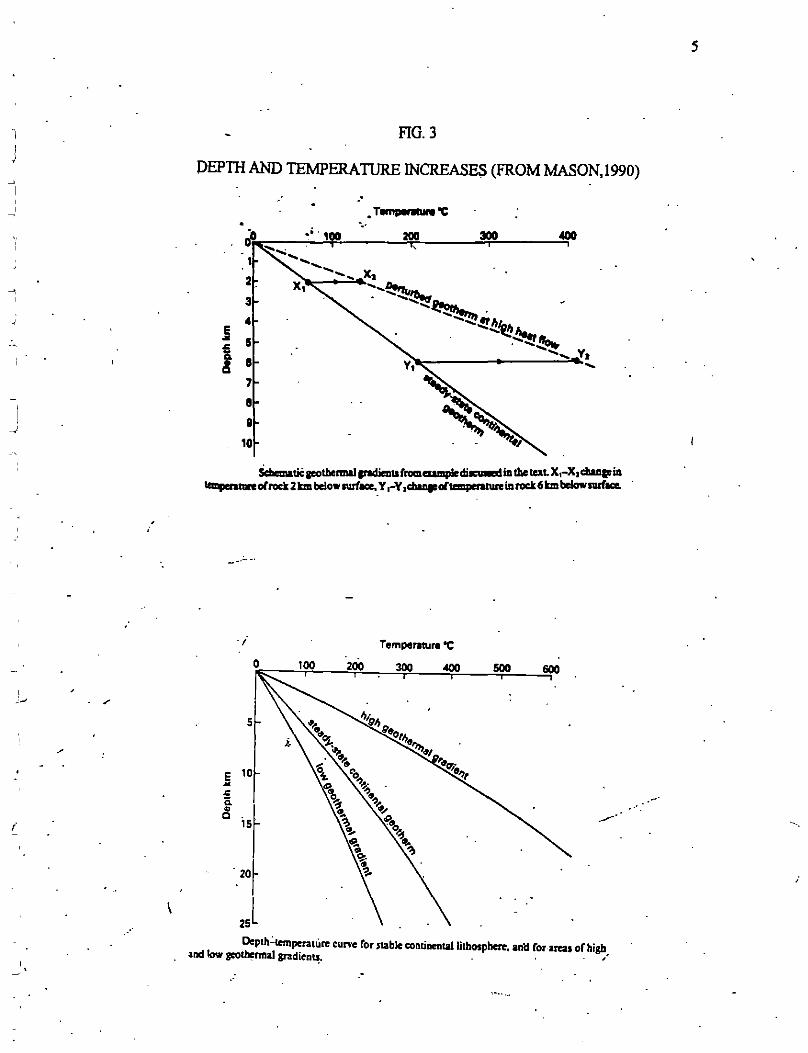
E.egional metamorphism occurs in areas of larger proportions, usually hundreds to
thousands of square kilometers in area. There are two types of of regional
metamorphism; regional dynamothermal and regional burial. Regional dynamothermal
metamorphism is usually associated with large orogenic belts and is similar to contact
metamorphism because alteration of the rock is due to a large supply of thermal energy
which raises the steady state geothermal gradient to a high geothermal gradient which is
hotter than the usual increase of25 degrees centigrade per kilometer (Fig. 3).
Regiona~al. metamorphism is not associated with orogenesis or magmatic
intrusions and actually depends on burial of i4e section for an iii.crease in temperattire
which follows the steady state geothermal gradient (Fig.3 ). The maximum temperature '
-obtained in burial metamorphism is usually around 400 to 500 degrees centigrade
.""\ (Winkler, 1974). CJ
3
l _)
~,
! -~
\
FlG. 2
. " -CONTACT METAMORPHISM AUREOLE (FROM MASON, 1990) ~
country. roclt I
·t medium· I caunny rock I ·111ained I. I dolerite t I I I 1 I I I
I I I I I 1
\_fine-~rained_J \____ baked zone ol .chilled rnarQi111 line-vraoned homlell
· (width 1.•_oqgera1ed)
Cross 1<Ction throu..Jh 1 dolerite dyke I m wide, showi"I conllCl ~-of counuy roct. · ·
'
!
o. 10 20 30m
\ \ I I I I ,-...... with I doovago t and , _ing
' ' I I
I I
I
f dlis boundary nae .... in quany .
Schematic plan of the CODllCl Bll!DOrpbic ZODeS ...... in Clill"e lliD Qiwiy, MarkJiold. Leicestenhire, En&fand. /
4
~
I
I ~·
,.
/
i
\
FIG. 3
OEPTII AND TEMPERATURE INCREASES (FROM MASON,1990)
.· .TempwMin-C
·' ' 100 -..
300
x. x, ----~~ 3 . -.... 4 --~.;,,~
j ......... "~ 5 .-.... ~
1 .............. v. e ..... 7
~ 9
8 ~~~~ 10
ScbomaliC seotbermal podionuf'romeumplodi..-ia die taL x,..X,clw!pia .....,__olroc:kllr:mbdowlurf-. Y~,dJaaiool1a11paUUniaroclt6lr:mbdownd100.
-~·····
. f Temperature -C
100 200 300 .coo 500 600
5
E 10 ... = Q.
isr ~
Q ..--
_2or
2J 0.pth~temperature Curve ror Jtable C<>RtittetttaJ lithosphere. aJlll for areaJ or high
and low geothermal gradien~. . · · /
.•
5
;

-,
J
~
I '
~·
- -,
_I
CLASSIFICATIONS OF IGNEOUS AND METAMORPHIC ROCKS 11
~
;1~/~ Igneou5 and metamorphic rocks are di~tinguished from each other by each roclci
individual fabric. Igneous rocks are generally classified into three groups according to
texture or crystal size; aphanitic, phaneritic and porphyritic. Aphanitic rocks are .
composed of small equal-sized crystals unable to be examined with the naked eyef they
are generally formed when an igneous intrusion reaches the surface. The smaller crystal ~ f,,,,N
size is caused by the rapid cooling the rock undergoes a(the surface. The second type of
igneous rock is the phaneritic texture; it is composed of!arger equal sized crystals which
can be observed with the naked eye. Phaneritic rocks are formed when an igneous
intrusion does not reach the surface and cools slowly allowing the crystals to grow larger.
The third type of igneous rock is the porphyritic texture which has characteristics of
aphanitic and phaneritic textures. Most of the.rock is made up of an aphanitic texture but
includes larger phenocrysts which are much larger than the surrounding groundmass
which can be observed in a thin sectfon of the rock. Porphyritic rocks are usually formed
when an intrusion cools at depth allowing large crystals to form, then the intrusion
reaches the surface where it cools quickly forming the smaller crystal_s that surround the
larger ones· (Ehlers, 1980).
The classification of metamorphic rocks is extremely. diverse due to differing
types of metamorphism and mineral content so only the three types found in the field
samples will be discussed; phyllites, schists and gneisses. Metamorphic rocks are
6

7
generally classified by individual grain size and the presence of schistosity which can be ,..,_
. broken.into two types linear and planar (Fig. 4). Phyllites are fine.grained and very
finely schistose rock; the grain size is coarser than in slates but finer than in mica schists.
Schists are medium"to coarse-grained rock with an excellent parallelism of planar and.or
linear fabric which causes them to split into thinner plates than gneisses. Gneisses are
medium'to coarse-grained rock that splits into plates and angular blocks. Gneisses are
also charact!'rized by alternating light and dark bands formed fefftleti from mineral
grouping'faused by the higher temperature and pressure this rock type fo~s unCler
(Winkler, 1974).
Metamorphic rocks can be further classified by mineral composition determined in
a thin section. For this study thin sections were made of each rock type but the
equipment available would only produce usable thin sections of the higher grade
metamorphic rocks,.forthis reason actual mineral composition of the field samples will·
not be discussed. However thin sections of the lower-grade metamorphic rocks were
\ able to show the schistosity of the samples which will indicate the type of metamorphism
the rocks were formed in.
·-.

' I .
I .I
-'
- • .-J.
/
·'
/
FIG.4
SCHISTOSITY Wl1H PLANAR AND LINEAR TEXTURE (FROM MASON, 1990)
\
-
0
(b)
_ i Hand spcdmem or (al slam and (11) ll:bisl. 1a ilhutrata Ille mono rqular c:leadireclioa in 1la1e. lndividoal lll1llCOYile and biolite Cl)lllll ano clisliapisbcd iJI lhe sdiist. Slate rrom llallochulish. Argtl; ichisl rrom Loct Slact, Salllaland, Sc:ctland.
LAYERING, BANDING AND FABRIC DEVELOPMENT 23
I Schematic block diagrams to illusirate'thc dilfcr~cc between S-tect~nit~ fa• ":ith a ·pronou~ roliation 1planar tei.tureL and L·tcccoaites tbl with a pronounced h~uon 1hnear. te:uureL Metamorphic rocks such as 1ehisu :and mJloai1CS ~re 1cnerally L-S-tecton.nes. and h"'Te· both a li~car :1nd planar c1>~poncm. · ·
••• o#·
8

PROCEDURE FOR MAKlNG THIN SECTIONS
A. Materials needed '
1. Hof late with thermometer
2. Lakeside 70 ~ I
3. 27 mm x 46 mm glass slides
4 .. Glass plate
5. Grinding powderst;400, 600, 800, 1000 grit
B. Procedure
1. Using rock trim saw cut a rock cliip about 1 inch square by 1/8 inch thick.
2. Score one side of a glass slide using 600 grit abrasive on a glass plate.
· 3. Heat hot plate to 140 degrees centigrade with slide and rock chip on the plate.
4. Apply a thin coat of Lakeside 70 to rock chip and place on scored side of glass
slide. Remove from hot plate to cool.
5. Trim excess.rock from the slide using the thin section saw.
ii. Thin rock chip with thin section grinding wheel to approximate thickness.
7. Finish grinding thin section on glass plate with 800-)000 grit ·abrasives. Proper
thickness will be reached when quartz appears gray to light straw yellow.
9 .
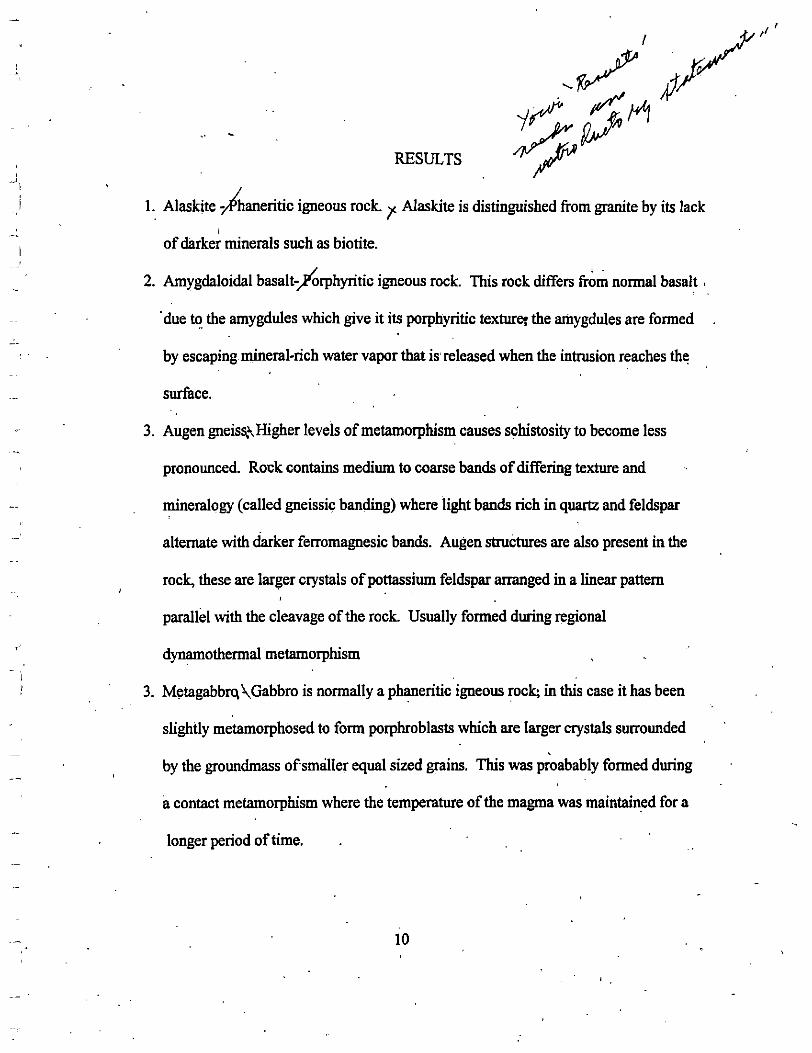
RESULTS
L Alaskite /iianeritic igneous rock. 'f Alaskite is distinguished from granite by its lack
' of darker minerals such as biotite.
2. Amygdaloidal basalt/orphyritic igneous rock. This rock differs fr~~ normal basalt ,
·due ti:! the amygdules which give it its porphyritic texturef the amygdules are formed
by escaping mineral-rich water vapor that is released when the intrusion reaches th~
surface.
3. Au gen gneiss,i.,_ Higher levels of metamorphism causes schistosity to become less
pronounced. Rock contains medium to coarse bands of differing texture and
mineralogy (called gneissic banding) where light bands rich in quartz and feldspar
alternate with darker ferromagnesic bands. Augen structures are also present in the
rock, these are larger crystals of pottassium feldspar arranged in a linear pattern
parallel with the cleavage of the rock. Usually formed during regional
dynamothermal metamorphism
3. Metagabbrq \Gabbro is normally a phaneritic igneous rock; in this case it has been
slightly metamorphosed to form porphroblasts which are larger crystals surrounded
by the groundmass ofsma1ler equal sized grains. This was proabably formed during
a contact metamorphism where the temperature of the magma was maintained for a
longer period of time.
10
. '

11
4. Mica schist - Coarse grained rock with excellent planar and linear schistosity.
' ~
Foliation present indicates a regional dynamothennal origin. Rock also contains I
porphproblasts of garnet.
5. Mylonite "'Fine-grained streaky rock with good schistosity. Mylonite resembles a very
fine grained schist but it is actually fonned during catacll!Stic metamorphism due to
flowage of coarser rocks. Excellent indicator of seismic activity.
6. Phyllite - Fine-grained schistose rock fonned at low temperatue with high pressure
during regional dynamothennal·metamorphism.

CITED REFERENCES
{J Barker, A. J., I 990, Introduction toptetamorphic;Yexture an~rostrueture.• Blackie
1an~ son, New York, New York, P/ 21-103. ' ' . . I .
2. \Conrad, S. G., 1958, Geologi~p of.North Carolina: North Carolina Oepartment of
,! Conservation and Development.
3./\Fisher, Pettijo~ Reed, .Weaver.., 1970, Studies of.Appalachi,aeology:Jo~ Wiley
f ~dSons,ri/.195-271. H~ ._. 4. King, Philip,~ .. Ferguson, Lawrence, Roberts, 1944, Geology and w;;nganese I ~~ .
/ Jeposits oyortheastern Tennessee; Division of Geology, State of Tennessee
· Department of Conser-vation.
>· Shelley, David, 1993, Igneous andj/etamorphicjoc~der th0croscope;
Chapinan and Hall, New York, pf. 88-111.
.~- Winkler, HelmutG. F., 1974, Petrogenesis ofMetamorphici(ocks:Springer Verlag, J ~-- -~--- .
·)'!ew York, New York, P/ 1-25.
12
'
-·

·--,
X-RAY ANALYSIS OF CAVE SEDIMENTS FROM PIGEON WATER CAVE OF
NORTHEASTERN PINE MOUNTAIN
A Senior Thesis
Presented to
the Department of Physical Sciences
Morehead State University
In Partial Fullfillment
of the Requirements for
Science 471
by '
Billy B. Stapleton
December 1992
--.
- '• . ".
.. .. \ .
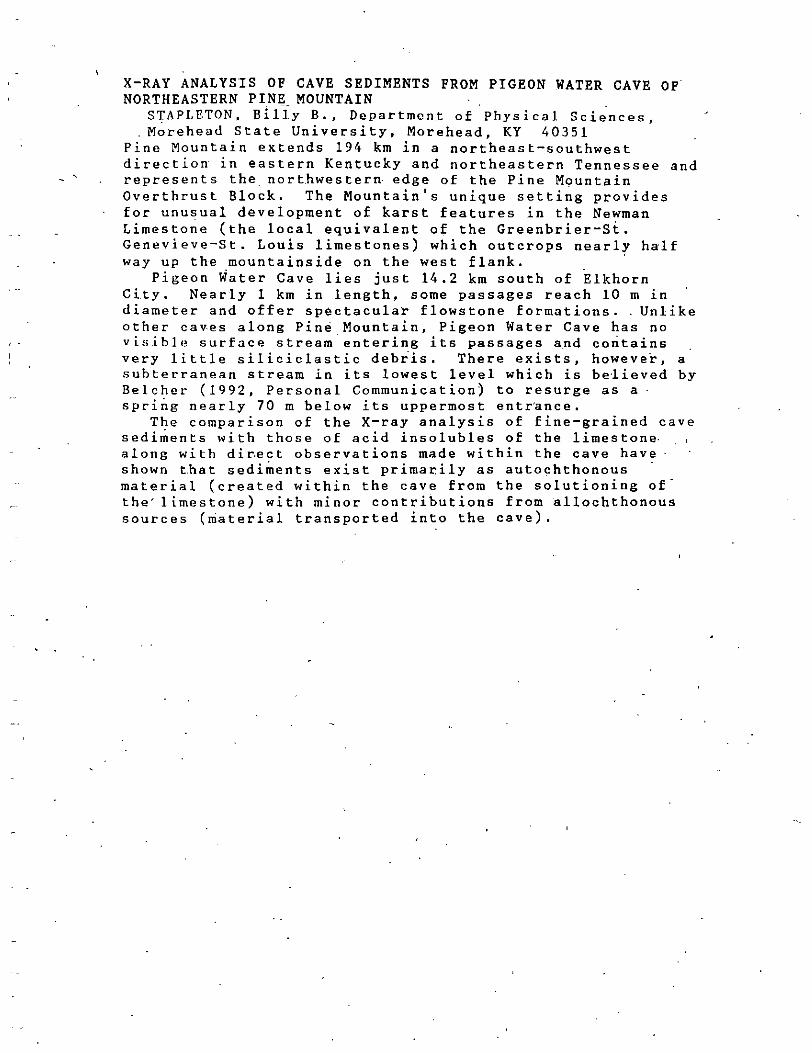
X-RAY ANALYSIS OF CAVE SEDIMENTS FROM PIGEON WATER CAVE OF NORTHEASTERN PIN~. MOUNTAIN
STAPLETON, Billy B., Department of Physical Sci;nces, Morehead State University, Morehead, KY 40351
Pine Mountain extends 194 km in a northeast-southwest direction in eastern Kentucky and northeastern Tennessee and represents the. northwestern edge of the Pine Mountain Overthrust Block. The Mountain's unique setting provides for unusual development of karst features in the Newman Limesto~e (the local equivalent of the Greenbrier-St. Genevieve-St. Louis limestones) which outcrops nearly half way up the mountainside on the west flank. ·
Pigeon Water Cave lies just 14.2 km south of Elkhorn City. Nearly 1 km in length, some passages reach 10 m in diameter and offer spectacular flowstone formations .. Unlike other caves along Pin~ Mountain, Pigeon Water Cave has no visible surface stream.entering its passages and contains very little siliciclastic debiis. There exists, howeve~, a subterranean stream in its lowest level which is be~ieved by Belcher (1992, Personal Communication) to resurge as a· spri~g nearly 70 m below its uppermost entr•nce.
The comparison of the X-ray analysis of fine-grained cave Bedi~ents with those of acid insolubles of the limestone. along with di~ect observations made within the cave have shown t.hat sediments exist primal'.ily as autochthonous · material (created within the cave from the solutioning of the' 1 imestone) with minor contributions from allochthonous sources (material transported into the cave).

TABLE OF CONTENTS
PAGE INTRODUCTION . . . . . . . . . . . . . . . . . . . . . . . . . . . . . . . . . . . . 1
Purpose of Investigation . . . . . . . . . . . . . . . . . . . . . . 1
Geologic Setting .............................. l
Stra.tigraphy . . . • • • . • • • • • . . • • • • • • • • • • • • • • • • • • • . 3
Cave Development 0 O O o o 0 I 0 I O O o 0 I I o o o o o o o o o o o o o o o 5
STUDY AREA • • • • • • • • • • • • • • • • • • • • • • • • • • • • • • • • • • • • • • 6
Location and Description of Cav~ . . . . . . . . . . . . . . 6
Sample Lo.cations . . . . . . . . . . . . . . . . . . . . . . . . . . . . . . 9
LAB PROCEDURES ................................. 11
Initial Sample Preparation .... •· .......... ' . . . 11
Limestone Diges.tion .......................... 11
Initial Separation Procedures ................ 12
Clay Extraction Procedures o o I 0 o o o o 0 o o o o o o o o o o 13
Silt-Sand Separation Procadures ..••••••• ; • • . • 14
Clay Mounting Procedures o o o I o o o : 0 o o o o o o o o o o I o 15
Treatment of Clays 16
X-RAY PROCEDURES ............................... 17
Equipment and Method .. . . . . . . . . . . . . . . . . . . . . . . . . . 17
Identification of Minerals • • • • • • • • • • • • • • • . • • • • 1 7
Quantitive Analysis 19
RESULTS ••••••••.•••••••••••••••••• I' ••••••••••••• 21
Clay Analysis. o o o o o o o o o o o o o o I 0 o o o o • o o o o o o o o o o o 21
Fraction Analysis ............................ 24
CONCLUSIONS ................................. ·• .. 28 . I
' 1. REFERENCES ..................................... 30
i

FIGURE
1.
2 .
3.
J 4 .
5.
6 .
7 •
B .
9 .
10.
11.
12.
13.
14.
1 5 .
16.
LIST OF FIGURES
PAGE
Map of Pine Mountain ...................... 2
Profile of Pine Mountain .. ................ 3
Stratigraphic Column • • • • • • • • • • • • • • • • • • • • • • ·4
Map of Pigeon Water Cave • • • • • • • • • • . • • • . . . . 7
Relation of Cave to Pine Mountain • • • • .. • • • B
Formulas Used for Quantitive Analysis
Peak Heights for Heat Treated Samples
20
21
Peak Heights for Glycolated Samples o o o 0 o I " 21
Clay Composition of Cave Sediments ....... Clay Composition of Limestone S~mples
Clay Composition Chart for All Samples .. Plot of Average Clay Composition o o o 0 0 o I o o
Fraction Analysis of Limestone
Fraction Analysis of Cave Sediments
Lab Results from Fraction Analysis
22
22
22
23
2·4
24
25
Plot of Clay-Silt-Sand for All Samples 26
ii
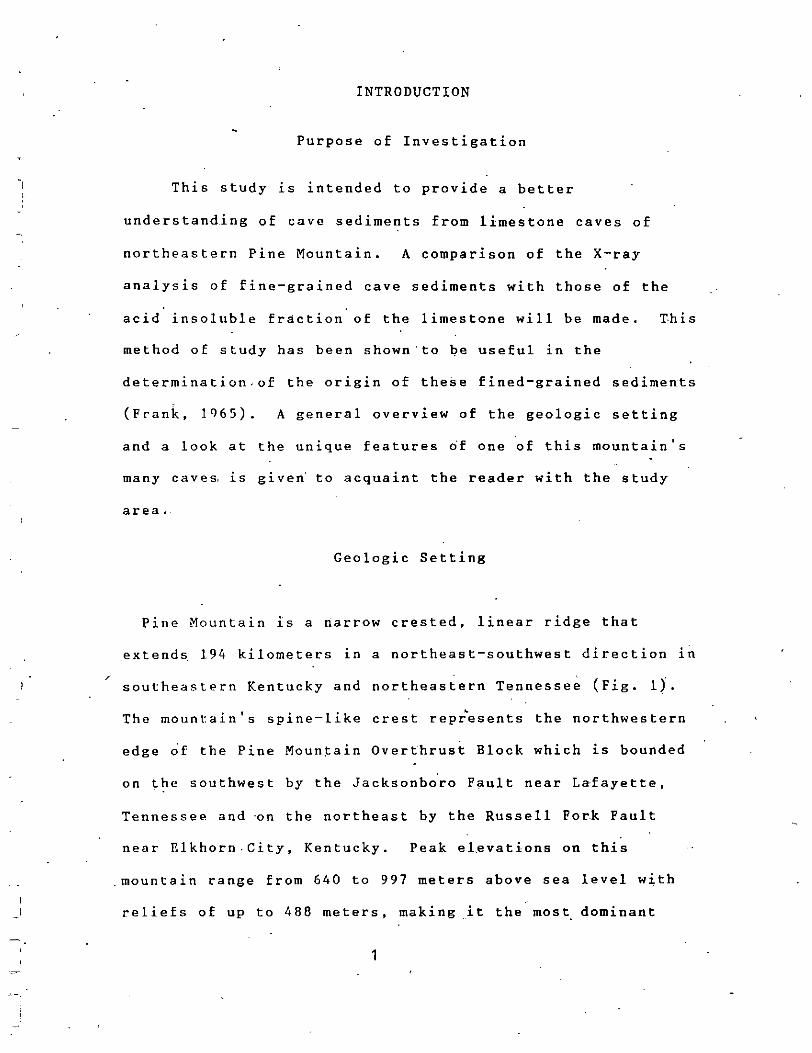
INTRODUCTION
Purpose of Investigation
This study is intended to provide a better
understanding of cave sediments from limestone caves of
northeastern Pine Mountain. A comparison of the X-ray
analysis of fine-grained cave sediments with those of the
acid insoluble fraction of the limestone will be made. This
~ethod of study has been shown to be useful in the
determination.of the origin of these fined-grained sediments
(Frank, 196~). A general overview of the geologic setting
and a look at the unique features df one of this mountain's
many caves. is given' to acquaint the reader with the study
area ..
Geologic Setting
Pine Mountain ts a narrow crested, linear ridge that
extends. 194 kilometers in a northeast-southwest direction in
' southeastern Kentucky and northeas~ern Tennesse~ (Fig. 1).
The mountain's spine-like crest represents the northwestern
edge of the Pine Moun~ain Overthrust Block which is bounded
on the southwest by the Jacksonboro Fault near Lafayette,
Tennessee and ·on the northeast by the Russell Fork Fault
near Elkhorn.City, Kentucky. Peak el•vations on this
.mountain range from 640 to 997 meters above sea level with
reliefs of up to 488 meters, making .it the most dominant
1

a LONDON
oCORllN
Figure 1.
··-. /
Map showing Pine Mountain to the rest of the state.
PJICEVILLE
/
and its location in relation (From Preston McGrain, 1975)

_,
-,
topographic feature in eastern Kentucky (Saunders, 1985, p.
87).
Streams cross the mountain in only two places: Clear
Fork near Jellico, Tennessee; and the Cumberland River at
Pineville,. Keqtuc~y. East of Pineville, the mountain
stretches for 130 kilometers unbroken by any surface
streams. Similarly, few roads give access across this
natural barrier; only about a half dozen over its entire
fength.
Stratigraphy
Pine Mountain's unique setting provides for unusual
' development of karst features in the Newman Limestone.(the
local equivalent of the Greenbrier-St. Genevieve-St. Louis
Limestones) which outcrops nearly half way up the
mountainside on the north flank (Fig. 2). This
Figure 2.
UPPER MEMBER
Profile of Newman on Pine Mountain.
Limestone as it (NOT TO SCALE)
outcrops
3
'
I I
~
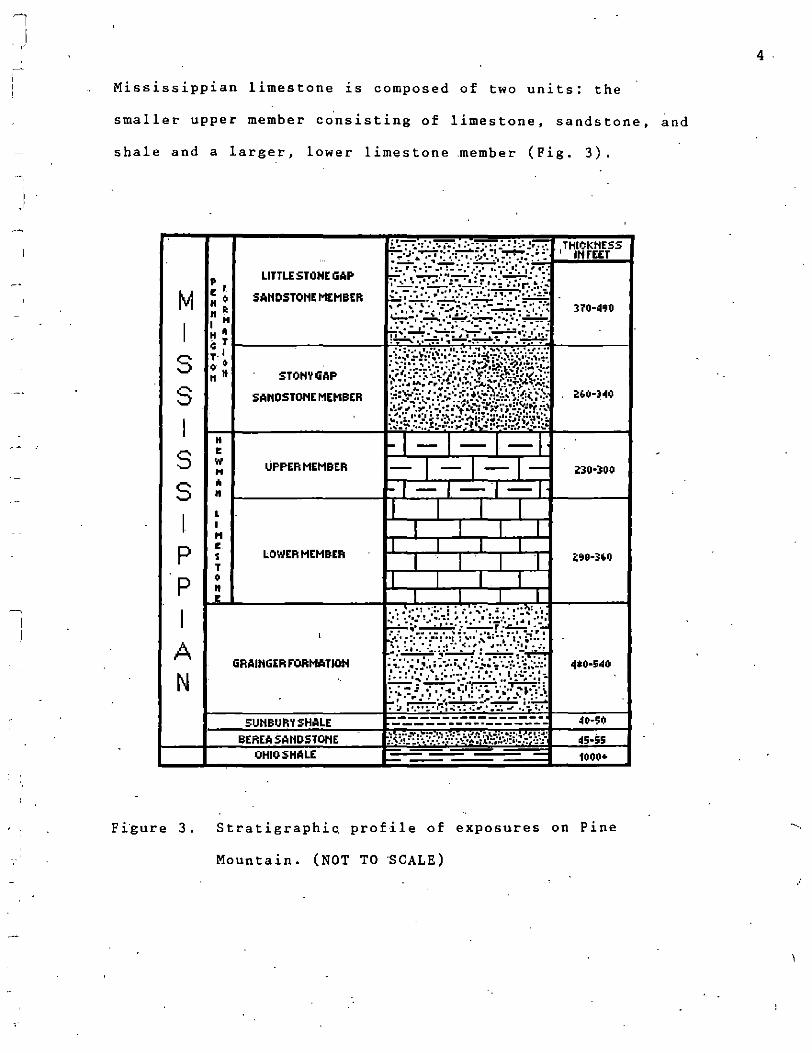
Mississippian limestone is composed of two units: the
smaller upper member consisting of limestone, sandstone, and
shale and a larger, lower limestone member (Fig. 3).
M I s s I s s I p p
I A N
p I LIJTLE STOllE GAP
• 0 SANDSTONE MEMBER " . H H I O H T G I T· 0 •
" " STOllYGAP
SAllDSTONE MEMEIER
H
• w UPPER MEMBER H
• " L I ti
• ' LOWER MEMBER T • " •
GRAJNGERFORMATJOH
SUNBURY SHALE
EIEREA SANDSTONE OHIO SHALE
.... 1-1-1-1 -1-1-1--1-, _., _ ,. I I I l
I I I l I I I I
I I I I I I I I
I I I I
THJ~KNESS ' JNrEET
Z30·300
~·0·540
45.55
1000•
Stratigraphic profile of exposures on Pine
Mountain. (NOT TO ~CALE)
4
~.

Along Pine Mountain the Newman Limestone is between 122 to
183m thick and dips into the mountain at 20 to 40 degrees
(Saunders, 1985, p. 87).
Cave Development
Caves of Pine Mountain occur on the north face of the
ridge and most if not all are located in the _lower member.
There are only nine mapped caves, but many more are known.
They range in size from only a few meters to nearly 3km in
length. Several pits are known as. well, some in. excess of
70m (Saunders, 1985, p. 89).
Many intermittent streams flow down the slope of the
mountain, sinking into the limestone and resurging as
springs at the lower contact of the limestone. Drainage in
the limestone of. the long mountains is from one direction
only. Spring records are very sketchy, but drainage basins
are tip to 4,57Sm long and 460m wide (Saunders, 1985, p. 93).
5

STUDY AREA
I ' I '
- Location and Description of Cave
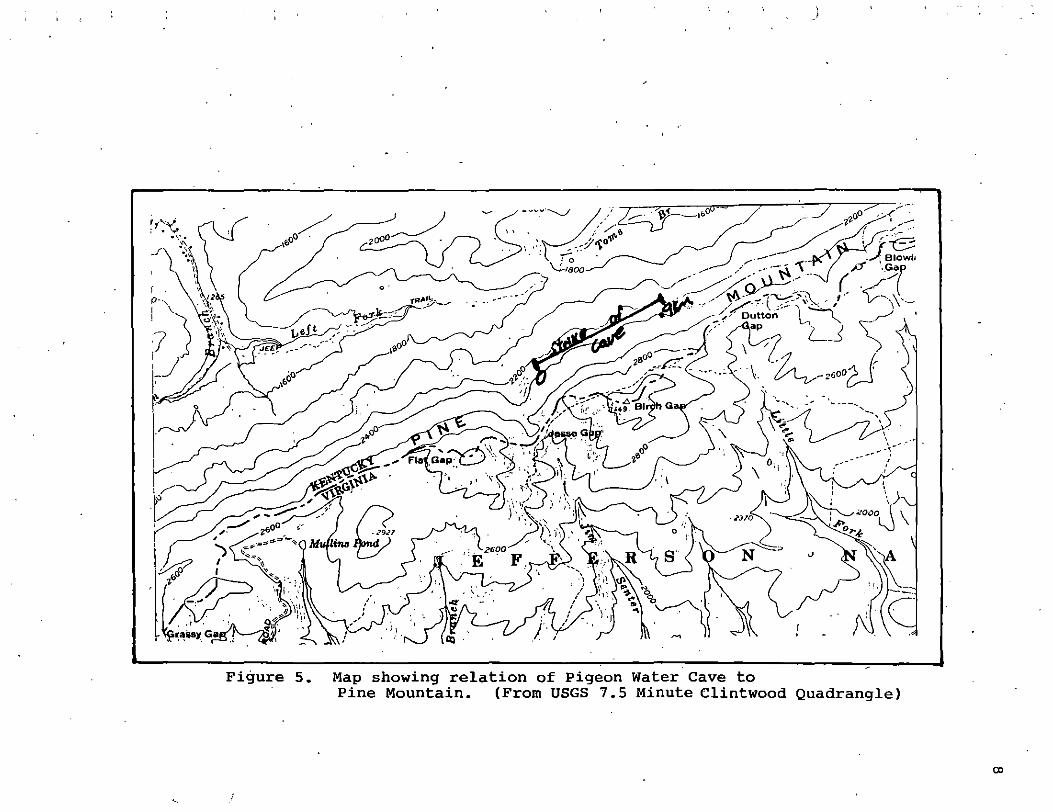
Pigeon Water Cave lies 14.2km southwest of.Elkhorn
City, Kentucky and was chosen as the site for this
investigation (Fig. 4). This cave compares to those
described by Saunders (1985) in that it is relatively short
in lebgth and runs ·roughly parallel to the strike of the
mountain (Fig. 5). Access to the cave is gained through
either a hand dug upper entrance or a lower naturally formed
entrance. The upper entrance is utilized most often due to
its more direct access and the miserable c~awl required by
the lower access. The cave consists of a large main passage
which reaches diameters in excess of lOm and a length of
nearly .9km along with several smaller side passages barely
large enough for a man to pass through. Both ends of the
main passage are blocked by debris from ceiling failures,
yet air can be felt emanating from beyond the blockage,
indicati~g that the passage extends beyond.
A lower partially water filled passage parallels the
main passage. Only 60m of the underground stream is exposed
due to sumps located on both the northeast and southwest
ends. It is believed that this stream resurges as a spring
near the lower entrance to the cave .(Belcher, 1992, personal
communicat.ion). A unique feature of this particular cave,
in comparison to other caves of Pine Mountain, is the meager
abundance of gra~el in its stream cha~nel. The stream in
.6

CROSS SEC110N A-A' CROSS SEC110N B-B'
RUBBLE
B
SCALE\ t-----lOM------t
PIGEON WATER CA VE LOwER PIGEON, KY
Figure 4.
UPPER ENTRANCE
LOWER ENTRANCE
~-~RING
Map of Pigeon Water Cave (By: Bill Stapleton).
NORTH
I LEGEND
BREAKDOWN (BLOCKAGE) I
SUMP' '
ENTRANCE
SPRING
-> FLOW DIRECTION
OM
SCALE (IN METERS)
lOOM 200M
j
Figure 5. Map showing relation of Pigeon Water Cave to Pine Mountain. (From USGS 7.5 Minute Clintwood Quadrangle)

9 .
Pigeon Water Cave carries very little gravel, but an
enormous amount of mud as evidenced by its chest-high mud
banks (Pig 5, A-A', pg. 7).
The solutioning of the main passage appears to have
been bedding controlled due to the uniformly sloping ceiling
which strikes N52°E and dips 29°SE, correlating to the dip
of the strata along Pi~e Mountain. The lower stream passage
follows a fracture striking. the same direction which permits
access to the upper main passage.
Throughout· the cave, large ~nd impressive speleothems
add to the majesty of this undeveloped cave. Travertine
dams, stalagtites, stalagmites, and flowstone structures are
found in great abundance and are for the most part undamage~.
by human hands.
Sample Locations
Limestone samples were gathered from four separate
sites. The first site (Ql) was from the active _quarry at
Elkhorn Stone Company 3.8km southwest of Elkhorn City. The
second sample (Q2).was taken from an abandoned quarry at
' Ashcamp, 8.9km southwest of Elkhorn City. The third and
fourth samples (Q3a and Q3b respectively) were taken from
the.limestone outcrop at the upper entrance of Pigeon Water
Cave. Approximately 5kg of fresh sample was collected at
each site after removing the weathered surface, thus
allowing access to unweathered rock.
J
Cave sedimerit samples were collected from th9 lower
stream passage of the cave. Four sampling points located
approximately 15m apart were established on both the east
and west sides of the stream for a total of eight samples.
Approximately lkg of mud was collected from the mud banks at
each site after removing the weathered surface. These
samples were labeled El-E4 for the east side and Wl-W4 for
the ·west (El and Wl being the extreme upstream ~ampling
points). All samples were then ·carefully sealed and
transported to the geology lab at Morehead State· University.
10

LAB PROCEDURES
Initial Sample Preparation
Once in the lab, all sediment samples were removed from
their individual sample bags and placed in appropriately
labeled porcelain dishes. Each of the four limestone
samples were first crushed using a mechanical rock· crusher
and placed in similarly labeled porcelain dishes. All
samples were then placed in a· 75°C oven and allowed to dry
' thoroughly.
Limestone Digestion'
Limestone digestion was carried out using a modified
version of Peterson's method (1962, p.13) developed by
Robert Lierman (1992, personal communication). A
representative· sample of each limestone was ground using a
mortar and pestle and then sifted through a No. 20 sieve
overlaying a No. 140 sieve. The particles caught by the No.
140 sieve were used for "the digestion process. This was
done so as to increase the surface area and hasten -J
digestion. An acid solution was prepared in a SOOml
Erlenmeyer flask for each of the 4 samples by mixing Bml of
concentrated acetic acid wi~h SOml of Calcium Acetate. ' I
Distill~d water was then added to make a 450ml .3M solution.
Acetic acid was used instead of hydrochloric to prevent
.damaging any chlorite minerals which may be present in the
samples. Calcium Acetate simply acts as a buffer to
. 1 1
12
maintain a pH of 4.5-5.5 wpich prevents the acid from
attacking clay minerals. 20g of each sample was then placed
in its appropriately labelled flask·and allowed to dissolve
overnight. The following daj, the liquid was decanted off
and fresh solution added to reconstitute the 450ml solution.
This process was repeated three times to insure an adequate
' amouµt of clays for processing, yet the digestion was not
allowed to go to completion in order to prevent any possible
damage to the clays by the acid. After the third run, the
~cid solutioµ was decanted off and the sample washed
thoroughly.with distilled water.
Initial Separation Procedures
I~ order to determine the relative composition of the
sample in terms of grain size distribution, it was first
necessary to separate the grains w,ithin each sample. This
was·accomplished by placing the entire sample of the
partially dissolved limestone in a Proctor-Silex commercial
blender ilong with lOOml of tap water. The sample was then
blended at hig~ speEd for approximately 2 minutes. The
' process ~as repeated for each of the samples. The sediment
samples underwent the same process differing only in that
lOg of the dry sediment was added to the blender.
All samples then underwent a process to remove any iron
which can unfavorable affect the results from X-ray
analysis. ~fter each sample was blended, the slurry was
placed in a· properly labelled centrifuge jar and centrifuged

for 10 minutes a~ 2500rpm. If the water was cloudy after
centrifuging, CaC12 was added to flocculate the clays and
the sample was again centrifuged. The water was then gently
poured off and 70ml of .3M Ni-Citrate and Sml of Na-
Bicarbonate was added to the Jar and placed in a low
temperature oven. After 15 minutes, 1/8 teaspoon of Sodium
Hydroxide was added and the sample heated for 15 minutes
longer. This process leaches out the iron from the sample
and places it in suspension (Lierman, 1992, personal
c~mmunication). The sample was then a~lowed to cool and was
c~ntrifuged for 10 minutes at 2500rpm. The liq~id was'then
poured off and the sample was ready for separation.
Clay Ext~action Procedures
Clay extraction was carried out in the same centrifuge
jars by applying Stokes Law calculated for a withdraw depth
of 8.Scm for particles <.004mm. Because settling time is
temperature dependent, a table of values calculated bj
Lierman (1992, personal communication) for the desired
withdraw depth was used.
Each jar was fllled with distilled w~ter, capped, and
"shaken vigorously until well mixed. . . The jars were then
placed under a sonic dismembrator for 1 minute to
deflocculate clays. The jars were placed o~ a stable
platfor~ and allowed to settle atcording to the time as
calculated from th~ table.
1 3
After sufficient time had elapsed, the liquid wari· drawn
of using a vacuum apparatus to a depth of 8.Scm and placed
in an appropriately labelled plastic beaker. This
constitutes the clay sized fraction of the sample. The
process wa~ repeated three times or until the upper 8.Scm of
liquid in the bentrifuge jar was clear. Approximately 2.Sml
of CaC12 was added to the beaker in order to flocculate the
clays. The beaker containing the clays was then centrifuged
for 10 minutes at 2500rpm in order to concentrate the clays.
The liquid ~as ·decanted and the clays allowed to dry.
Silt-Sand Separation Procedures
The sediment remaining 1n the centrifuge jars after
clay extraction represents the silt and sand size (> .OOltmm)
fraction of the sample. Because the limestone samples were
not allowed to completely digest, the larger than clay size
fraction of the sample was placed in a 10% HCl solution and
allowed to dissolve completely·so that an accurate insoluble
content could be determined. After complete digestion, the
clays were extracted using the same method as above, but
were kept separate from the first run and were not used for
clay analysis. However, its weight was added to the fi~st
ru~ 1n determining the total acid insoluble content of ihe
limestone.
The >.004mm fraction of each sample was first washed
through a No. ·230 mesh sieve. The particl~s caught by the
sieve represent the sand size (>,0625mm) fraction of the
14 .
;
sample. The sieve was labelled and placed in a low
temperature oven where it was allowed to dry-completely.
The particles passing through the sieve remain in
suspension and represent the silt size (between .004mm and
.0625mm) fraction of the sample. The suspension was then
filtered ~hrough standard filter paper so as to catch all
particles. The filter paper containing the silts was then
allowed to dry.
Each fraction (clay, sand, and silt) was then weighed
and weights recorded for each sample as well as percent
composition.
Clay-Mounting Procedures
Clays were prepared for X-ray analysis by mounting as
elutriated samples on glazed glass slides. Two identical
mounts per sample were prepared for a total of 24 elutriated
sampl.es·. Two additional pack samples were prepared by
powdering the drie.d clays with a mortar and pestle and
packing them into a sample holder. The two pack samples
were chosen at random, one from the limestone suite and the
other from the sediment suite.
The elutriated samples were prepared by first cutting
biological microscope slides 1n half and lightly glazing one
side so the clays would more ·easily adhere to the surface.
A .3g sample of the dried clays was weighed out, placed in a
vial along with 4ml of distilled water, and allowed to
hydrate for several minutes. The sample was then mixed
15
16
thoroughly by a laboratory vibrator, placed under the sonic
dismembrator for 2 minutes, removed and mixed again by the
vibrator. The sample was then split into 2 equal volumes.
The clay suspen~ions were mounted by dripping them onto the
glazed surface of their respective slide by using glass
syringes. The freshly prepared slides were allowed to dry
beneath an infrared lamp before they were moved.
Treatment of Clays
One slide of the sample pair was heat treated to 180°C
for one hour prior to X-ray analysis. The remaining slide
was treated with ethylene glycol. Considerable difficulty
was encountered in the glycolation process. Initially the
samples were treated by applying a uniform coat of the
' ethylene glycol with a dropper. This tended to cause the
clays to loose cohesion to the glass and peel up. A second
attempt was made.to glycolate the samples by placing them in
an anclosed evaporation apparatus so that the samples· would
become saturated from the ethylene glycol vapors. Because
this method requires that the samples be heated slightly in
the pres~nce of the vapors, the clays again lost cohesion
.w(th the glass. Finally, the clays were successfully
glycolated by spraying the ethylene glycol from a fine mist
spray bottle onto the sample. Two light coats were applied, J
allowing the sample to air dry in-between coats. /

)
X-RAY PROCEDURES
Equipment and Method
All samples were X-rayed using a Phillips Mod~l No.
XRG-2500 ·x-ray Diffractometer utilizing CuK radiation in
conjunction with a Phillips· chart recorder. A baseline of
1.0, multiplier of 5, scan speed of 1° 28/min., and a chart
speed of 1°/min. was used for aJl runs.
The first step in X-ray analysis is to identify the
minerals one Can expect to encounter throughout the
investigation. This was accomplished by first running the 2
untreated pack samples from 4"28 through 60"28, thus
allowing the major peaks of most clay minerals to be
expressed.
Identification of Minerals
Peaks from X-ray charts were identified through the
use of transparent overlays marked with the_r•flection
angles from most major.clay minerals in both degrees· 28 a~d
A units. In som~ instances, the Powder Dilfraction Pile
published by the Joint Committee for Powder Diffraction
Standards (1974) was consulted.
After identification of the major peaks from the pack
samples, it was determined that illite, kaolinite, chlorite,
and quartz were common to all samples. Montmorillinite was
suspected, but because it commonly occurs as a mixed layer,
17

_,
I
assemblage with illite, its existence could not be confirmed
until after running the ethylene. glycol treated samples
(Grim, 1968, p. 438). Elutriated samples were then ran from
2°26 through 30°26 in order to detect major reflections of
the common minerals.
In referring to montmorillinite, the term is used to
describe all expandable clays 'with the exception of
vermiculite (Grim, 1968, p. 41). Montmorillinite expands
readily to about 181 when solvated with ethylene glycol.
Kaolinite was defined •as clay minerals which show. both 3.581
and 71 peaks., Illite r~fers to t~e clay mineral with a 101
b~sal· spacing which is .not significantly expanded after
solvating with ethylene glycol (Robbins and Keller, 1952, p.
148). Chlorite is represented by a basal reflection at
3.581 (Griffin, 1971, p. 555). Quartz peaks lie at 3.341
and 4.i6l.
Thd purpose of treating the samples with ethylene
glycol, as previously mentioned, is to de~ermine the
existence of expandable clays. Glycolation tends to cause
the crystalline lattice of expandable clays to expand, thus
changing the reflection pattern of the X-rays. Heat
treatment of the samples to 180°C for 1 hour tends to
collapse the clays, thus sharpenin~ their correspondipg
peaks (Grim, 1968).
X-ray analysis took place over '
period. \
After
all peaks were identified and labeled, a baseline was drawn
' so that peak heights could be measured relative to baseline.
l8
.Quantitive Analysis
The stud_y performed by R.M. Frank in 1965, in which he
concluded that the clay content of cave sediments could be
used to differentiate their source, requires a method of
quantifying the clays in the sample. George M. Griffin
along with his former colleagues from Shell Development
Laboratories developed a simplified method of quantitive
analy~is (Fig. 6). By measuring characteristic peak heights
in a sample, the percent composition of clays could be
obtained.
Before applying this method, three assumptions must
first be made (Griffin, 1971, p. 554):
1. The reported clay minerals (kaolinite, chlorite, illite, and montmorillinite) comprise 100% of the sample, whereas in many cases there are other minerals present as well as amorphous material.
2. The refracting ability of the clay minerals is constant.
3. There i~ a 1:1 linear relationship between the ratio of the 3.581 kaolini~e peak to the 3.541 chlorite peak.
Peak heights must be ~easured in millimeters from baseline
'for the 71, 101, 3.541, and 3.591 peaks of the heat treated
samples. The 71 and 101 peak heights from the glycolated
samples are required as well. After these peak heights are
obtained for each sample, it is simply a matter of plugging
the values into the appropriate equations to determin~ clay
percentages. In this case, calculations were performed by a
personal computer running Microsoft Work's Spreadsheet for '\
Windows.
19

I ! The.following assumptions must be made:.
1. The reported clay minerals comprise 100% of the sample. 2. The refracting ability of the clay minerals is consistent. ,. 3. There is a 1: 1 linear relationship between the ratio of the 3.58 A kaoiinite peak
to the 3.54 A chlorite peak. ,
(a) On the 180°C pattern, measure. the heights of the 7 and 10 A peaks. Calculate the total percent kaolinite and/or chlorite as follows:
h 7 A ( 1110°)
3 K + C = -----=2:.::·5=------X 100 h7A(1so•1 + "10A(180•)
2.5
(b) On the l 80°C pattern measure the hc;ights of the 3.54_and ___ 3.59 A peak~. These heights are used to apportion the 7 A peak into
percent kaolinite and percent chlorite as follows:
"3.59A c 1 so0 1 % K = ~----===-;.='-.L. --..;....-X 3 K + C "3.59A ( 1 so0
) + h 3.54A fl so0 )
3 C = (3 K + C) - 3 K
(c) Calculate the total percent illite and/or montmorillonite as follows, using peak heights from the l 80°C pattern:
I . . 9G.
h I OA (180°) 3 I + M = -,.------'---'----X I 00
() "7A(l80•) + llIOA(l80•) 2.5 ..
( d) Measure the 7 and I 0 A pear< heights on the ethylene gly~ol pal!ern. Use these measurements and the previous ones on the 180 C paucrn tn calculate percentages of illite and montmorillonite as follows:
%1 (
I. \
h7A (180°)
= Ii I OA(EG) 11 1A (EG) ) X
Ii IOA(l80°) %1 +M
% .\I = (% I + M) - 3 I
\
Figure 6. Formuias used for quantitive clay analysis. (From George M. Griffin)
20

~J l
RESULTS
Clay Analysis
Figures 7 and 8 show me~sured peak heights of heat
treated samples and glycolated samples, respectively, These
values were used in calculating relative clay composi~ion
using the formulas from figure 6 (Seep. 20). The results
from these calculations are shbwn separately for cave ·
sediments and limestone insolubles iri figures 9 and 10,
respectively. Figure.11 shows all results graphically.
PEAK HEIGHTS FOR 1 llO C SAMPLES (MIWMETERS FROM BASELINE)
fil SZ ~ ~MWZWl~QlQZQMQa!i 3.54A 99 123 110 89 113 114 110 116 82 97 70 Si: 3.59A 119 149. 123 105 150 139 119 115 76 97 76 51
AVEBAGE 97.9
109.9 71.3
165.3. _7A 75 81 85 88 89 86 72 71 51 61 54 43 10A 155 189 183 122 211 212 192 185 117 151 156 110
Figure 7. Measured peak heights for heat treated samples.
·-------··------· ---·- -- - -- ·- ~------
PEAK HEIGHTS FOR GL YQ9LATED SAMPLES ·(MILLIMETERS FROM BASELINE)
7A lOA
fil fZ E3 42 52 47 53 70 62
~W1WZW3~Ql.Qla3Agm
58 52 30 38 45". 38 45 32 30 70 73 . 30 36 57 64 87 .70 56
AVEBAGE 42.4 60.7
P·igure 8; Meas"ured peak· heights for glycolated samples.
21

NOR
Ia ~ 9 .E! M m ~ W! 6ll!;;RAGE KAOLINITE 8.8 8 8.3 12.1 8.2 - 7.7 6.8 6.6 8.3 CHLORITE 7.4 6.6 7.4 10.3 6.2 6.3 6.2 6.7 7.1 ILLITE 51.2 49.3 51.7 67.6 50.7 34.9 30.9 42.1 47:3 MONT. 32.6 36.1 32.6 10 34.9 51.1 56.1 44.6 37.3
Figure 9. Clay composition analysis for cave sediments.
~LAYS NORMALIZED TO 100% IL S. ACID INSOLUBLES\
%KAOLINITE %CHLORITE % ILLITE %MONT.
Figure 1 0.
100% 90,-. 80%
70%
60%
50%
. 40"/o
30%
20%
10%
0% E1
Q1 ~ QM Q3B AVERAGE 7.1· 6.9 6.4 6.7 6.8 7.7 7 5.8 6.8 6.8
62.5 67.2 66.5 63.1 64.8 22.7 18.9 21.3 23.4 21.6
Clay composition analysis for limestone samples.
E2
CLAYS NORMALIZED TO 100% SAMPLES E1-Q3B
E3 · E4 W1 W2 W3 W4 Q1
• % KAOLINITE EJ %1LLITE
~ %CHLORITE !II %MONT.
Q2
Fi~ure 11. Graph showing clay composition for all samples •
•

p
To simplify the results, the average composition of the
cave sediment suite is compared to the average composition
of the limestone suite. The cave sediments were found to
contain 8.3% kaolinite, 7.1% chlorite, 47.3% illite, and
37.3% expandable montmorillinite. In comparison to the cave
sediments, the limestone sa~ples contained 6.8% kaolinite,
6.8% chlorite, 64.8% illite, and 21.6% montmorillinite. By
plotting the percentages, a definite correlation between the
two suites becomes evident (Fig. 12).
70
60
CLAYS NORMALIZED TO 100% AVERAGE VALUES
E . SO R 40
30 20
c E N T 1'"9====------
ol--~.:__~~~~~~~~~~~~--~~~~~~-:-:-~ % KAOLINITE % CHLORITE % ILUTE % MONT.
... CAVE SEDIMENTS ... L.S. ACID INSOLUBLE
Figure 12. Plot of average values for clays.
Though there appears to be some ~light variation
between the two suites in illite and montmorillinite
composition, it can most likely be explained by the fact
23
/

24
that jlljte can become altered through.physical and chemical
processes involved with the solutioning of limestone (Ford
and Willi~ms, 1989, p.329). Naturally, the cave sediments
have endured a great deal more weathering than the
limestone, thus altered clays such as mon~morillinite -would
be more abundant in the sediments.
Fraction Analysis
Digestion of the limestone proved it to be on the
average of 68.8% pure carbonate, Leaving 31.2% insoluble
residue .. Of the insoluble material from the limestone, 10%
was clay, 68.1% was silt, and 21.9% was sand (Fig. 13). In
contrast, cave sediments yielded 25.7% clay, 50% silt, and
24.3% sand (Fig. 14). Actual lab results for each sample
are given in Figure 15.
FRACTION ANALYSIS OF SAMPLES n1 _n30 INEWMAN LIMESTQNl=l
Q! gg Q3A gm AVERAGE %CLAY 8.9 14.8 8.1 8.4 10 %SILT 75.7 80.9 62.1 53.6 68.1
%SAND 15.4 ~.3 29.8 38 21.9
Fjgure 13. Fraction analysis from limestone. samplei.
FRACTION ANALYSIS OF SAMPLES E1-W4 •PIGEON WATER CAVE'
E1 E2 E3 E4 W1 Yl2 Ya Yi! A~!;;RAG!;;
%CLAY 27.2 25.3 25.3 21.7 24.4 24.5 28.9 28.5 25.7 %SILT 44.1 55.2 51.4 50.3 43.9 52.5 54.3 48.4 50 %5A~O 28.7 19.5 23.3 28 31.7 23 16.8 23.1 24.3
Figuri 14. Fraction analysis from sedi~ent samples.

FRACTION ANALYSIS FOR SAMPLES E1 -"38 ' I FRACTION ANALYSIS FOR SAMPLES El -"38
' ··- . . ......• ,-- ·--. --- : '
' : '
: I I : ~ -
I I SAMPLE DESCRIPTION ! SAMPLE WEIGHT : ACID INSOLUBLl"S %1NSOLS SAMPLE ! CLAY : %CLAY SILT %!iilLT
i ! I ; El Sediment I llln NIA NIA El I 2.72a 27.2 4.41 a 44.1 E2 Sediment ! 1 Cl<l NIA NIA E2 2.53a I 25.3 5.52a 55.2 E3 Sediment 10g NIA ' NIA E3 2.53a· 25.3 5.14n 51.4 E4. Sediment I 10g i NIA i NIA E4 2.17a 21.7 5.03" 50.3 W1 ! Sediment 10n NIA NIA W1 2.44a 24.4 I 4.39a I 43.9 W2 ! Sediment 1nn ! NIA NIA W2 2.45a ; 24.5 ' 5.25a I 52.5 . W3 Sediment - 10g NIA NIA W3 ! 2.89a 28.9 5.43" l 54.3 i I . W4 i Sediment I 10g I NIA i NIA W4 I ·2.859 I 28.5 4.84a 48.4 -- I Newman Limestone I I --.·-.----. 1---- I I 01 2nn 5.85 a . 29.3 01 .52 !I 8.9 4.43a I 75.7 Q2 Newman Limestone 20!1 5.75 Cl 28.8 02 ' .85a ' 14.8 4.65" • 80.9 ; '
Q3a Newman Limestone 20g I 7.05 !I i 35.3 Q3a i .57a 8,1 I 4.38a , .62.1 ' Newman Limestone-
,____ 03b 20<1 I 7.11 a I 35.5 Q3b .6a 8.4 3.81 d I 53.6
Figure 15. Lab results from fraction analysis.
:
I
'
I ' !
! I
I I
SANn I % SAND ·
2.87a I 1 :95" 2.33" 2.80a 3.17" I 2.30" I 1.68a I
2.31 " I .9" I
.25a 2.1 _g __ I.
2.7 a !
28.7 19.5 23.3 28.0 31.7 23.0 16.8 23.1 15.4 4.3 29.8 38
"' U1

I ' A ~lot of the clay, silt, and sand fractions for both
suites depicts a nearly consistent distribution within the
cave sediments (Fig. 15). However, there is variation
.within the limestone suite. • Samples Ql and Q2 sh~w-higher
percentages of silt with a lesser amount of sand in both
samples. An attempt to explain why there is a difference
within the .suite would require more int~nsive study of the
limestone. However, one explanation could lie in the fact
that the two samples (Ql and Q2) were collected as far as
lOkm from the •tudy area, lending the possibility of a
lithologic change within the limestone over this distance.
FRACTION ANALYSIS SAMPLES E1-Q3B
ooy········· ... ································· .............. .
~~t::::::::::::::::::::::::::::::::::::::::::::::::::::::::::::::::::.:::::::::::::::;~::.-::~::::::.:::::::::::::: P I .
-~ :~ :;::~;.i,~·:~::::··::~--~~(:::::::::::·:::: .. :.: .. :::~~ ~ :, ~~-~;~ >~~~
10 ................................................................ , ..... ······ .... : .. :-r<:::~o:--,,.,, ........• o+-~~~~~..-.-~~~~---~~-+~~~~~~~~..-.-~___;··•._~__,~~--·E1 E2 E3 E4 W1 W2 W3 W4 Q1 Q2 Q3A Q3B
SAMPLE
... %CLAY • %SILT -+- %SAND
Figure 16. Plot of clay-silt-sand for all samples.
I.
26
/

l
Considering only the samples taken at the study area
(Q3a and Q3b), there is still variation between the two
suites. There tends to be a higher percentage of silt in
the limestone samples, and lesser amounts of clays in
comparison to the sediment samples. It could be argued that
the variance between the suites is due to the fact that the
sediments have undergone more w~athering than the analyzed
limes~one, th~s resulting in the breakdown of the· larger
fractions into clay size material. This seems a likely
proposal.

CONCLUSIONS
Drawing-from the results of the fraction analysis, it
depicts a definite correlation between the insoluble
fraction of the limestone and that of the cave sediments in
terms of grain size distribution. The small variance can be
accounted for by the differences ~n weathering experienced
between the limestone and the sediment samples.
evidence to the theory that these sediments are
autochthonous in nature.
This gives
Perhaps the strongest evidence for the sediments being
derived from the solutioning of the limestone lies in the
results of the X-ray analysis. As in Franks's study (1965),
a definite relationship exists between the clay minerals of
the limestone and those of the cave sediments. Though there
is slight variation between samples, again the variation can
be pinned on differences in weathering.
In making the determination of the origin of these
fine-gr~ined sediments, one more line of evid~11ce must be
considered. The stream bed in Pigeon Water Cave does posses
a limited amount of quartz gravel. Because the Newman
Limestone is overlain ~y the Pennington Formation, which
consists of sandstone and conglomerate units, one can hazard
that the graveL is being carried into the cave from the·
overlying unit. If gravel is being carried into the cave,
then other sediment is as well. However, because the
overlying members were not considered in this study, an
28
. l
. '
explanation for the distribution of these sedime~ts will not
be offered.
In conclusion, the sediments encountered in the stream
passage of Pigeon Water Cave- are a mixture of both
allochthonous and autochthonous sediments. Gravel in the
streambed indicates that sediment is being tran~ported into
the..:' cave system. But, because of the strong evidence
provided by X-ray and fraction analysis, an overwhelming
percentage of the fine-grained sediments must be considered
autochthonous.
Because no visible surface stream enters the cave
system, a dye trace of the mountain southwest of Pigeon
Water Cave would be of great benefit to similar future
studies. Also, analysis of overlying units would be highly
recommended .
29
SELECTED REFERENCES
Belcher,. K.R. (1992) Personal communication.
Commonwealth of Virginia (1963) Clintwood Quadrangle, 7.5 Minute Series: U.S. Geological Survey Topographic Quadrangle·.
'Ford, D.C. and Williams, P.W. (1989) Karst Geomorphology and Hydrology: Unwin Hyman, London.
Frank, R.M. ·(1965) Petrologic study selected central Texas caves: of Texas, Austin.
of sediments from MA Thesis, University
Griffin, G.M. (1971) Interpretation of x-ray diffraction data! in Carver, R.E., ed., Procedures in Sedimen~ary Petrology: John Wiley and Sons, New York.
Grim,· R.E. (1968) Clay Mineralogy: McGraw-Hill, New York.
Joint· Committee on Powder Diffraction Standard~ (1974) Selected ~owder Diffraction Data for Minerals: JCPDS; Philadelphia.
Lierman, Robert. (1992) Personal Communication: Former Assistant Professor of Geology, Morehead State University.
McGrain, Preston (1975) Scenic Geology of Pin~ Mountain in Kentucky: Kentucky Geological Survey, University of Kentucky, Lexington.
Peterson, M.N.A. (1962) The mineralogy and petrology.of upper Mississippian carbonate rocks of the Cumberland Plateau of Tennessee: Jour. Geology, vol.70, p. 1-31.
Robbins, C. and Keller, W.D. (1952) Clay and other noncarbonate minerals in some limestones: Jour. Sed. Petrol., vol,22, p. 146-152.
S~undera, J.W. (1985) Pine Mountain karst and caves: in Caves and~karst of Kentucky; Kentucky Geol. Survey, Special Publication 12, Series XI, p.86-96.
30

; I
I
THE CORRELATION OF S1REAM·
D?POSITED BRECCIAS
IN BAT CAVE/
CARTER CAVES, KENTUCKY
A Senior Thesis Presented to the
Department of Physical Sciences
Morehead State University
In Partial Fulfillment of the
Requirements for the
Degree of Bachelor of Science
in Geology
by.
James Bond
October, 1993
"
'

TABLE OF CONTENTS
r
" I '
ABSTRACT ............................................................................................. : ............ .iii. )'.,,, . . . . (.~ ~·
INTRODUCTION .................................................. '. ............... : ................................ 1.-/ ·~ / c. . ~Yt
/(• .
LOCATION OF STUDY ......................................................................................... 2.
General Stratigraphy .................................................................................... 2.
CA VE FORMATION ................................... : ... ; .......................................•.............. 7.
Caye Interior Deposits ...................... :···············:····'·····································8·
General Sedimentation. ............................................. : ....................... 8.
Speleothem Growth. ........................................................................ 9.
Travertine Deposits ......................................................................... 9.
Cave Breccias .................................................................................. 9.
ME11IODS OF lNVESTIGATION ........................................................................ 11.
Brunton Compass and Hand Level .................................................... : ........ 11.
Presence of Travertine Deposits ................................................................. 11.
Comparison to Modem Analogs ....................................... , ......................... 12.
RESULTS ............................................................................................................... 13.
Breccia One ............................................................................................... ,. 13.
Breccia Two ....................................................... ; .................. : .................. :.13.
Breccia Three ............................................................................................. 14.
DISCUSSION ................................................................................................. ; ...... 17.
REFERENCES CITED ................................................................ .-......................... 19. I
i

TABLE OF FIGURES
Figure 1. Map of Bat Cave ...... , ................................................................................. 3'-·
Figure 2. Outline Map Showing Geological Regions and Location of the Carter.
· and Cascade Region ................................................................................... 4.
Figure 3. Geologic Time Sc~le Showing th~ Age of the Rocks in Carter~
with those in the rest ofKentucky .. : ........................................................... 5:
Figure'.4. Sketch Showing the Relationship of the Outstanding Features of Carter
Caves State Park with the Geologic Formations ...... : ............ ~ .................... 6 ..
Figure 5. Map of Bat Cave Showing Location ofBreccias ..................................... 15.'
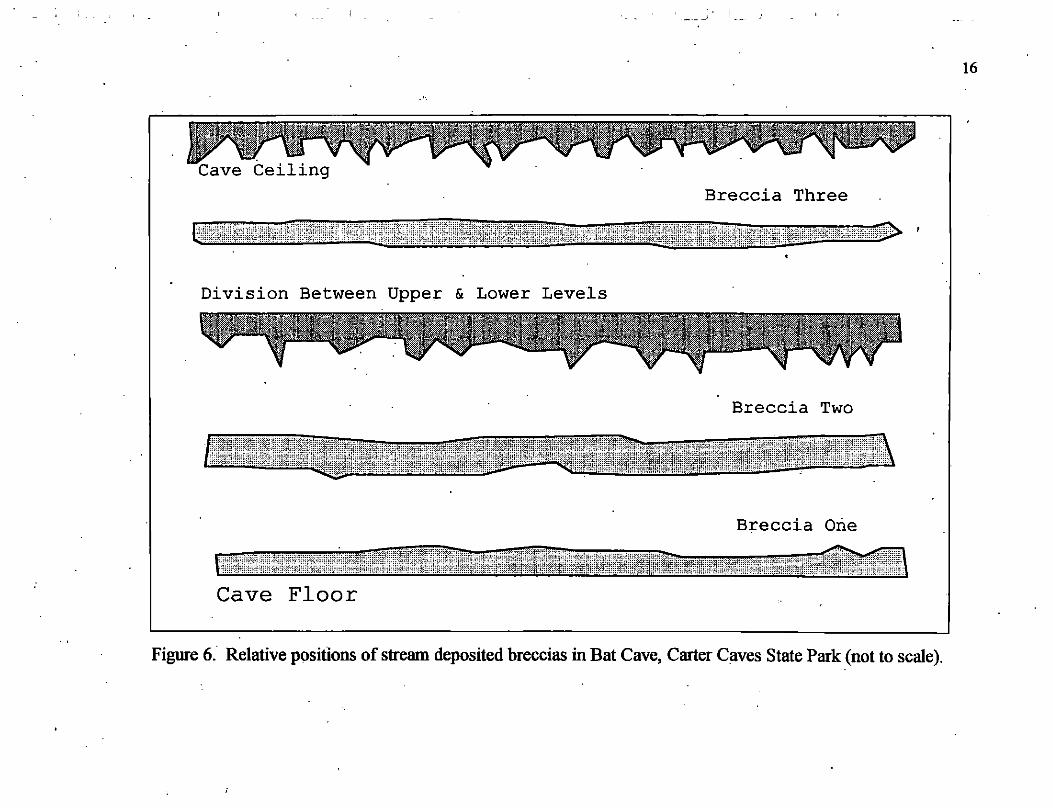
Figure 6. Relative Positions of Stream Deposited Breccias in Bat Cave ................ 16.
J
l
ii

J
THE CORRELATION OF STREAM DEPOSITED BRECCIAS IN BAT CA VE, CARTER CAVES, KENTUCKY.
BOND, James A, Department of Physical Sciences, Morehead State University, Morehead, KY 40351
Bat Cave, located at Carter Caves State Resort Park in Olive Hill, KY, was the location of this · study. Bat Cave is a limestone cave formed by dissolution oflimestone by water. In this study, an attempt was made to correlate stream deposited breccias that occur throughout the cave.
. Breccias were correlated using a Brunton Compass and a hand level. Speleothem growths, travertine deposits, and relative vertical position were used to determine relative ages of cave deposits. ·
Three distinct breccias were fourid, indicating three distinct stream levels. Breccia One is at the current stream level w~ere deposition is still active. Breccia Two is located approximately three to six feet above present stream level. Breccia Two displayed speleothem growth locally, which suggests this breccia has been inactive for some time. Breccia Three is the oldest breccia
· and is located in the upper passage of the cave. Breccia Three is covered by a thicker travertine deposit than locally coats Breccia Two. Locally, ancient travertine dam deposits occur at the · same level as Breccia Three. r
Ancient breccias were compared to modem breccia found at present stream level. Both modem and ancient breccias showed fining upward sequences. Upward fining indicates that stream channels were abandoned.
Ancient breccias can be used to constrain paleo-Climate. For example; In order for a breccia to form, the stream must remain at one level in the cave for a fairly long period of time. This mean5 that if water flow is too great, the stream does not deposit its load, and rapid down cutting will occur. The rapid down cutting_ lessens the time for deposition. On the other hand, if there is not enough water there will be no stream and no deposition. The formation ofthe,fming upward breccia indicates flow waned. The decreased "flow was due to channel abandonment {e.g. form · stream down cutting to deeper level) or, more likely, due to a glacial cycle when the water is tied up in the ice.
P~Y REFERENCES Ford, Derek, Williams, Paul, 1989, Karst Geomorphology and Hydrology, Academic · Division ofUnwin Hyman Lt<i, 15/17 Broadwick Street, London, pp. 242-355.
McGrain, Preston, 1966, Geology of the Carter and Cascade Cave Areas, Kentucky. Geological Survey, University ofKen~cky, Special Publication 12, pp. 6-13. ·
Tierney, John, 1985, Caves of Northeastern Kentucky (With Special Emphasis on Carter . Caves State Park), in Caves and Karst of Kentucky, edited by Percy H. Doughtery,
Kentucky Geol9gical Survey, Special Publication 12, Series XI, pp. 78-84:
White, William B., 1988, Geomorphology and Hydrology of Karst Terrains, Oxford University Press, New York, New York, pp. 220-300.
iii
i

~.
INTRODUCTION
1r<~_,r,.V The study of cave sedimentation can give clues to ancient long-term climatic
changes. Speleothem growth can be dated radiometrically providing accurate dates that.can
indicate periods of growth and non-growth in the formation (Moore and Sullivan, 1964).
Fluvial deposits can give clues to water levels and velocities. All these factors can
contribute to an overall better understanding of paleoclimate.
This study was conducted in an attempt to correlate and reli:itive-age date the various
levels of stream deposited breccia in Bat Cave. Once .the number of distinct levels of
breccia and their relative ages is determined, it becomes possible to make inferences about
stream v~locity and the amount of time the stream remained at one level in the cave.
1

-. I
~' I I
.J I ' J..
LOCATION OF STUDY ~<)Vy' . I v~
1t1'1Jil/A.~j:1". I 'I ~ 1 • .. v
. . . ' i.,v-/_; : . .,;Y This study was conducted in Bat Cave, located at Carter Caves State Resort Park in . ~-rt'· f;'/~
Olive Hill, KY. '('~.(, frf/
Bat Cave, as shown in Figure 1, is one of the largest caves on the park with
approximately 3.35 km of passageways (Tierney, 1985). The cave is made up of two levels
. that run roughly parallel to one another. The lower"level of the cave constitutes the main
passageway, having wide rooms and high ceilings. A stream, Cave Branch, runs through
this level making it susceptible to periodic flooding. The upper level is somewhat smaller
and usually drier. Flood water only rarely reache~ the upper level. There is, however, some
speleothem growth in this level that is lacking in the lower level. ";)
"v ~yY /1,.Pr ~/c , · 1if I .
General Stratigraphy
Carter Caves is located in the northern portion of the Eastern Coal Field of Kentucky
(see Figure 2). The hills and ridges are capped by a massive sandstone from the
Pennsylvanian Perio~ called the Lee Sandstone (McGrain, 1966). Underlying the sandstone
are layers oflimestone dating back to the Mississippian Period. They include the Lower
Chester, Ste. Genevieve, and St Louis limestones (see Figure 3). it is in these limestones . ~ . -· ..
the caves of Carter Caveljfomt'13at Cave itself is. formed primarily in the Ste. Genevi~ and
St Louis Limestones (McGrain, 1966).
2

,..
'.
- HOU . ' . LOOic:ING \If'
-
. \
\·
'
BAT CAVE UNDERGJIOUMO PAS~ACE
Of CAVE BRANCH WllUAlllll P ILD~, II MA\ l9W
~l___ .. 1'.lfUf
Figure 1·. Map ofBat Cave (From Tierney, 1985).
_I .1
H.
___ )... , _ __.) ---.1
' N
'

,.
'•
\
I
l
\
GEOLOGIC REGIONS OF KENTUCKY
'"
PURCHASE
~ CARTER ANO CASCADE CAVES ReGION
~ . '· \
WESTERN COAL FIELD
'
MISSISSIPPIAN PLATEAUS
--,
BLUEGRASS . EASTERN COAL FIELD
Figure 2. Outline map of Kentucky showing geologic regions and location of the Carter and Cascade region (From McGrain, 1966).
--+

~.
I ~
I I
~ I
'
(
--
PERIOD CA.llTDtCCl {DUllATtOIW 911 lllLUOllS Oii TUll'Sl
MESOZOIC 167:!:
PALEOZOIC 370±
PRE-CAMBRIAN:::::=;:::::~ 4,000:!:
!
QUATERNARY TERTIARY ·
CRETACEOUS
JURASSIC TRIASSIC PERMIAN
PENNSYL\!ANIAN MISSISSIPPIAN
DEVONIAN
SILURIAN
ORDOVICIAN
CAMBRIAN
I 62
72
46 49 50
30 35 60
20
75
100
AGE MILLIOtlS Oii 'l'tMS)
I 63
135
181 230 280
310 345 405 425
500
600
4,600
Figure 3. Geologic calendar showing the relation of the ages of the rocks in Carter County with those in the rest of Kentucky
(From McGrain, 1966).
\
5
. ..

(
.·· /
/
• • ~
• • • • " " " " i
..... -!-
Figure 4. · Sketch showing the relationship of outstanding features of Carter Caves Staie Park with the geologic formations (FromMcGrain,1966).
.···
\
6

' .
-.
CAVE FORl\IATION
The most widely accepted definitjon of a cave is: any natural hole in the rock large
enough for a person to enter and achieve total darkness (Ford and Williams, 1989).
Caves can be fonned by several mechanisms. They can be fonned by d!ssolution,
erosion, volcanic activity, glacial activity, tectonic activity, or some combination of these
factors. In northeastern Kentucky, caves are generally fonned through the dissolutioning of
carbonate rocks. The dissolution reactions iisually involve carbonic acid, although other·
.acids; such as sulfuric acid from oxidatipn of pyrite or dissolution of hydrogen sulfide gas in
·water; have been shown to be important in some cases (White, 1988).
Large scale structural elements such as folds and faults also help control cave
development ... In areas with strongly folded rocks, the caves tend to fonn parallel to axial
planar cleavage or axial joint sets. Caves that fonn in steeply dipping beds, along major
fractures, or along major faults, tend to have a strong vertical component (White,.1988). In
other words, they fonn as tall, narrow corridors.
In Carter County the carbonate bedrock is nearly horizontal and soluble horizons
extend horizontally in two dimensions. Therefore, tributaries tend to aggregate but remain
. within the same stratigraphic horizon. This pennitS complex drainage systems to develop
(White, 1988).
7
I I
I !
' T _!
: I
' ' '
8
Cave Interior Deposits
{p11~ . I
I
. General Sedimentation .
C . fun ; . . dim 'f~llJJl!' . f 1 . .. . aves ct1on as giant se ent traps, accumilrating a vanety o c astic, orgaruc,
and chemical debris. They are often the most varied deposits that form in continental
environments and they tend to be preserved for greater spans of tiqie than most_ other
deposits (Ford and Williams; 1989).
Cave sediments are generally classified into two main categories; elastic sediments
and chemical sediments. Clastic sediments include , among other things, fluvial deposits,
organic debris, and breakdown, which is debris from roof collapse. Chemical sediments
iiiclude travertines, speleothems, and ice (White, 1988).
Clastic sediments can be very complex. The law of superposition states that in areas
of flat lying rock, the oldest rock unit was laid down first and is therefore on the bottom of
the stratigraphic section (Prothero, 1990). This law is often violated due to slumping,
burrowing, and flowstone intrusion. Rates of deposition can even vary due to cave collapse
blocking off down stream areas for long periods of time and then finally being eroded away
to allow deposition to occur once more. If the cave is prone to frequent and severe flooding
there ca:n be a great deal of reworking and redeposition of sediments (Ford and Williams,
1?88).
.,
/
9
Spe/eothem Growth
The word "speleothem" is a term used to describe cave fonnations due mainly to the
precipitation of calcite. Speleothems· include formations· such as stalactites, stalagmites,
flowstones, soda straws, and rimstone dams (Ford and Williams, l 98S).
Speleothem consist mainly of calcite deposited from dripping water. As water from
the surface percolates through the limestone above the cave, it dissolves calcite. When it
reaches the interior of the cave the water deposits its calcite (Moore and Sullivan, 1964 ).
The deposition is triggered by a loss of C02 from the water.
Caves that experience frequent flooding tend to lack speleothem growth because the
flood waters wash away any calcite precipitant that may have formed. Bat Cave has very
little speleothem grow'th in the lower level where flooding is common.
Travertine Deposits ' 1 i1~( .
Travertine is calcium carbonate that is deposited under atmospheric conditions
(Klein and Hurlbut, 1993). Travertine deposits are found as different formations. It can be
deposited as travertine dams, which impound water. It can also be deposited as a coating on
ceilings, walls, and formations.
Cave Breccias . \4_7
Cave breccias form just like normal stream breccias. As the stream carries its load,
some of the gravel, sand , silt, and clay becomes deposited with the larger gravels being
eventually cemented together by the smaller particles. A typical sequence ofbreccia will

10
fine upward (James ancl Choquette, 1988 ). This is due to the fact that as water flow is .
reduced due to processes such as meandering, cut off, and abandonment, the larger particles
will settle out first, followed by the sands, silts, and finally clays.

METHODS OF INVESTIGATION '
In this study, an attempt was made to identify and correlate the various levels of ' ,.
' stream breccia in Bat Cave. Three methods were used: I.) Brunton compass and hand level . .,....v . . . 7 2.) the presence of travertine deposits 3.) comparisons to modem analogs.
//\ .
Brunton Compass and Hand Level
With the Brunton compass and hand level, an attempt was made_ to determine if any
two breccia deposits, both within sight of one another, were in fact the same layer. This was
done by shooting a sight level with one breccia to the other. This method allowed breccia
dep<)sits to be traced laterally through the cave over large distances.
Presence of Travertine Deposits
The presence of travertine deposits covering a breccia deposit suggested the breccia
was older than any breccias lacking travertine deposits. It could, however, suggest that the
area where the breccia with the travertine was found was simply more conducive to
speleothem growth.
11

12
Comparison to Modern Analogs
~,
Comparison to modem analogs was done to help determine if the paleo-breccias
were stream deposits or solution collapse breccias. Stream deposits should show some
_J sorting and· a fiqing upward sequence. Solution collapse breccia, on the other liand, would
not sho·w any sorting.
The current stream le~el breccia w3s dug into revealing a cross-section. The breccia
did, in fact, show fairly good sorting and a fining upward sequence. This information was
then compared to the paleo-breccias.
;

' ' I '
I , c,,
,
RESULTS
There were three distinct levels ofbreccia found in Bat Cave (see Figures 5 and 6).
Two were found in the lower level of the cave and the third was found in the upper level.
BrecciaOne
Breccia One was the current stream level breccia. It was found throughout the lower .
level of the cave, from entrance to eXit. The thickness ranged from 0 meters to
approximately 1 meter. It contained sandstone and chert clasts and displayed a fining
upWa!'d sequence. The last centimeter contains thin clay laminations, There were no
travertine deposits found anywhere on this breccia. This breccia·was the youngest of the\
three due to its position in the cave and the lack of any travertine deposits.
Breccia Two
Breccia Two was also found in the lower level of the cave. It was found throughout
much of the main passageway and in several side passages. In general it ran parall~l to and ·
above the current stream direction. The height ofbreccia two above floor level varied from
.5 meters to 2.5 meters. Breccia Two displayed a fining upward sequence with sandstone
13

14
and chert clasts. The. upper contact ·was topped by clay laminations. Breccia Two displays
thin coatings of travertine in some locations.
Breccia Three
Breccia Three was found in the upper level of the cave near the ceiling. It was a
layer 10 to 15 cm thick and it was only traceable for about 2.5 meters. The clasts were well
sorted and coated with much thicker travertine deposit than Breccia Two. Directly across
from Breccia Three were a group of clay laminations that appeared to be rimstone dam
deposits as part of the. dam was still evident Breccia Three was the oldest of the three ..
breccias found. This was due to its position in the cave and the presence of thick travertine
deposits.
~ ..
;

' '·
- ...... ,
l .-<
I
. .;
l
'
BAT CAVE UNDERGROUND PASSAGE
Of CAYE BRANCH WILLIA• r llOSON, d ..... 'f. 1966
~_1__- . _ _THU
\
Breccia One • Breccia Two • I
\ Breccia Three • .
Figure 5. Map ofBat Cave showing location ofbreccias (After Tierney, 1985).
N,
APP ROUrE Of lmDERGAOUNO
STREAM
\~~~-,'\. r 1-:. >
GATE' <'1.' ' w
15
(
16
Breccia Three
Division Between Upper & Lower Levels
Breccia Two
Breccia One
Cave Floor
Figure 6. Relative positions of stream deposited breccias in Bat Cave, Carter C11ves State Park (not to scale).

DISCUSSION
The cave was formed due to the chemical and mechanical effects of Cave Branch.
The three levels ofbreccia indicated three times when the stream remained at one level in
the cave for an extended period of time, since· it takes some time for the breccia to form.
This was most likely due to a reduction of the flow velocity of the stream. Such a reduction
would lessen the down cutting effect of the stream and force the stream to remain in place.
These reductions in flow velocity were then followed by a sudden increase in flow
velocity causing the stream to inundate the cave and down cut rapidly. This influx of water
prevented the stream from forming breccia deposits.
The most likely cause of these fluctuations in stream velocity is glaciation. During
periods of glacial transgression more water is tied up in the ice. This had the affect of
reducing the stream velocity in the cave to the point of eliminating it As the glaciers
melted it would produced a ~great influx of glacial outwash. this. outwash served to greatly
increase stream velocities and increase the down cutting effect ()f the water. It was, l
believe, during in~rglacial periods that the breccias were deposited. During these times .
stream flow W'.15 not be too weak to carry sediment or to strong to rapidly down cut It was,
therefore, possible to deposit the breccias found in Bat Cave.
The most accurate way to attempt to tie the cave breccias to ·glaciation would be
through radiometric dating of the speleothems found in the cave. Tlie speleothems should
show increased growth during periods of glacial retreat and decreased growth during glacial
advance. The radiometric dating would provide actual dates to be compared with known
17

18
dates of glaciation. This could then be compared to the cave breccias to determine if they
do, in fact, correlate. Radiometric dating was not done in this study due to time and money
constraints, however, 'it would make an interesting project in the future.

I
J
i )
REFERENCES CITED
/ Ford, Derek,"Williams, Paul, 1989, Karst Geomorphology and Hydrology:_Academic
Division ofUnwin Hyman Ltd, 15/17 Broadwick Street, London, J3P'.'242-355. ~ ' . . .
James, N.P.,~Choquette, P.W., 1988, Paleokarst.'Springer-Verlag, New York, New York, l)ef. 1-10. .
~ . .
Klein, Corn@,,_Hurlbut, Cornelius S., 1993, Mru@ofMinerology~ John Wiley & Sons, New York, New York, pj. 579. . ,
McGrain, Preston, 1966, Geology of the Carter and Cascade Cave Areas1Kentucky Geological Survey, University of Kentucky, Special Publication 12, I1-6-13 .
. .. ~ . . Moore, George W., Sullivan, G. Nicholas, 1964, Speleology: The Study of Caves, Cave
Books, St. Louis: MO, j)P- 41-63. .
Prothero, Qonald R, 1990, Interpreting the Stratigraphic Record{W.H. Freeman & Company, New York, New York, g{. 331.
Tierney, John, 1985, Caves of Northeastern Kentucky (With Special Emphasis on Carter Caves State Park), in Caves and Karst ofKentuck}(_edited by Percy R Doughtery): Kentucky Geological Survey, Special Publication 12, Series XI, JW-'78-84. ·
White, William B., 1988, Geomorphology and Hydrology of Karst Terrains/Oxford University Press, New York, New York, ¢,'220-300.
19

JO I ST ING AND FAULTI~G IN
SEL ECTE D AREAS OF
E.-\ STERN KENTUCKY
A Research Paper
Pcesented to th e
De p ;1rtme n t of Ph ys i c al Sciences
'."!ore lt ead S t ate Universit y
In P a r tial Fulfillm e nt
of tl1 e Requ irements for
S c ie n ce 471
by
Ma rk A. Blair
D ec ~m be r 13~ 1993

TABLE OF CONTENTS
., PA~
INTRODUCTION. . .. .. . 1·
General Definition of Term~ ................. 2
METHODS OF INVESTIGATION A~D CORRELATION ......... 6
Me~hods of Investigation ......... : .. , ..... ,; 6
Methods of Correlation ...................... 11
POSSIBLE CAUSES OF JOINTING AND FAULTING ..... , ... 16
Possible Causes of Joint{ng ................. 16
Possible Causes of Faulting .. , .............. 18
ECONOMIC SIGNIFICANCE OF THIS STUDY .............. 20
C 0 NC LU S I 0 N S . . . . . . . . . . . . . . . , . . . . . . . . . . . , . . . . . ; . . . . 2 1
WORKS CITED. ........ 22
' ' l

' '
' '
LIST OF FIGURES
FIGURE PAGE
i.
2.
Locations of Study.
Diagram of Joint ...
i·
3
3.· Systematic a~d Non-Systematic Joints.,,.. 3
4.
s.
6.
7.
8.
9.
10.
Strike-Slip Fault ..... ,, ......... , ...... .
Dip-Slip Fault .... ·.
Obliqu~-Slip Fault.
Fault Subcategories.
Video Enhancer Set-up.
Television Monitor ..... .
Projection of Satellite Imagery ............. .
4
4
11. Lineament Tracing on Map.
4
5
7
7
9
9
12.
13.
Rose
Rose
Diag1·am .......... , .. ............... 13
Diagram Showing Two Joint Sets .......... 13
14. Irvine-Paint Creek Fault .......•............. 14
13. Satellite Imagery/Direct Measurement Rose
Diagtam Comparison ........................... 15
16. Sequence Leading up to Jointing and Faulting.19
ii

' '
1 ..
• . ft,<-·
--r jWil§?' 1 f ')'P' . \t ,,,)' µ r·.
I INTRODUCTION
this
r~ L: ,/{µ.· jointing I i""< In paper
and faulting w i 11 be discussed. These areas
include the definitions of jointing and faulting,
the methods of measurement including satellite
imagery, a possible explanation of the causes, and
the significance of this type of research to
economic geology. The part of the Kentucky in
which this study was carried out was in the eastern
portion. The specific quadrangles are outlined in
figure -e-tte. I, -
Kentucky Geologlca,. Survey 228 Mining and Mineral Resourcas Bldg. University of Kentucky · Lexington; KY 40506-0107
U.S. Geological Survey Map Distribution Federal Center, Box 25286 Denver, CO 80225
Piaure l~' Index map showing ;aa Pine Mountain (Englund. (!)ut~rbridge. •' f .. g-.).
W E S T
Y RGINIA
38"

2.
General D~finition of Terms
The definitions of jointing and faulting are
relatively simple. A joint is defined as a
fracture in strata in which no di splac em.en t has
taken place(Figure 2 ) . There are two
classifications of jointing. These are ·termed as
systematic and non-systematic. These joints form a
joint system. The angle between the joints is ..
about 90 degrees. The difference between the two
is that systematic joints are .more continuous and
linear than non-systematic joints(Figure 3).
Faul ting can merely be defined as a joint in
which displacement has taken place. Faults.can be
classified by slip sense. Slip sense is defined as
t l1 e di r e c t i o n o f s 1 i p . The three ways faults are
classified are strike-slip, dip-slip, and oblique-
slip faults. Strike-slip. faults are faults that
hav.e slipped in a horizontal direction( Figure 4).
This is exemplified by the famous San Andreas Fault
in California. the second type of fault is the
dip-slip fault. Dip-slip faulting occurs iµ a r
vertical plane(Figure 5). All of the fa~lts· in this
study were of this type. The last category of '
faulting is· oblique-slip faulting. Oblique-slip

Figure 2: Block Diagram of. joint, showing joint plane.
~s..,~~:c. No>.!-Sys+~ic.
Figure 3: Systematic and ~on-systematic joint system.
3.

~,
4.
Figure 4: Strike-Slip Fault, arrows show relative
move·ment.
Figure 5: Dip-Slip Fault, arrows show 'rela·tive movement.
Figure 6: Oblique-Slip Fault, arrows.s&ow relative
movement.

: I
faults show movement in both the horizontal and
vertical directions(Figure 6).
Faulting can be further· divided into
subcategories as sl1own in figure seven. For the
purposes of this research the only s~bcat~gories of
concern are normal and reverse faulting. Only dip-
slip and oblique-slip (aults can be divided in this
manner. A norm a 1 fa u 1 t is formed due to· st r a iii
while a reverse f·ault is caused by pressure. A
reverse fault can also be termed as a thrust fault.
This is important due to the fact that knowing t.he
direction in which forces were acting gives clues
t o t l1 e c au s e s . This topic will be add~essed later
in ll.lore detail (Dennis, 1987, rih.97)
FAULT BY
CLASSIFICATION SLIP SENSE
StRIKE-SLIP FAULTS Right-slip fault Left-slip. fault
D.IP-SLIP FAULTS Normal-slip fault Reverse-slip fault
OBLIQUE-~LIP FAULTS Right-normal-slip fault Left-normal-slip fault
Right-reverse-slip fault Left-reverse-slip fault
Modified after Dennis.
Figure 7: Fault cl.assification by slip sense.
5.

METHODS OF INVESTIGATION AND CORRELATION
Methods of Investigation
The methods of investigation employed show
basically one thing; the strike of the litieaments
produced by the joints and or faults. The strike is
the relatively' straight line produced when the
plane of a joint or fault intersects the surface of
·the earth. This straight line can then be termed
as a 'lineament if it leaves a linear feature on the
earth's surface.
The three methods of measurement used are
satellite imagery, .GQ' s(geologic quadrangle maps)
with previously mapped faulting, and direct
measurement. Satellite imagery is a long process
but is. no.t hard to understand. The steps involved
in· a good satellite imagery study .include several
·procedures. The first step is to obtain a
satellite positive of the area in question. The
positive is then "enhanced" through a camera a~d
video edge ' enhancer(Figure 8). The image ·produced
is then transmitted to a television monitor. From
the television monitor a 35mm slide is taken of the
imagel( Figure 9) After the slides are developed
they can then be projected onto a standard 7. 5-
/ /

\
Figure 8,: Picture enh~ncer.(Hylbert,
showing 1~84).
video camera and edge
Figure 9·: Picture showing television monitor and 35mm camer~ set-up~Hylbert, 1984)
7.

minute topographic map at the same scale. When the
projection and the map are properly aligned the
combined image of the two appears to be a three
dimensional picture(Figure 10). The lineaments do
not show up well until the slide image is projected
through a type of grating. The Ranchi _grating is
a thin plastic film with about 133 lines per inch.
When the grating lines align with the lineaments of
the satellite imagery, the linear tr.ends lock in.
With acetate film covering the map, trends can then
be traced(Figures 10 & 11). After the· lineaments
are traced, a directional bearing can be taken with
a protractor from the North arrow on the
topographic map (Hylbert, 1984, A
compilation of this data is necessary, but will be
addressed later in the paper.
The second method of measurement involves the
use of previous!~ mapped faulting and jointing.
While lineaments and joints are rarely put on GQ's,
large faults are almost always marked. The
sigiificance of this is that with an exact location
the structure is much more easily fobnd. Once the
location of thi·s structure is known a field search
of local jointing and faulting can. be conducted.
This leads to the last method of measurement.
The method of direct measurement is very
important in determining the validity of the other
8.

Figure 10: satellite 19 8.4)
:~
'
Figure 11: tracing of
Three dimensional projection of imagery onto topographic map.I( Hylbert,
•,~,-~
·-·!·
1. ~ ' • , ..
;,: . !\ t;.,\.1 ~·.-.f ! . , . .
,·j., ., ..
w~i .. :j I
Picture showing lineaments on a
Ranchi grating a·nd the topographic map.
() .
I

two methods. Direct measurement involves going out
into the field and actually ''taking'' the strikes of
structures such as faults and joints. This is
accomplished
friend, the
by using the
Brunton compass.
several hundred measurements
geologist's closest
To get good results
must be taken. Since
this st.udy is looking at a· very broad view only a
few measurements of this type were gathered. This
in.form a ti on c an be corr e 1 ate d w i th data from the
satellite i~agery and GQ's (Hylbe~t, 1993)
10;

11.
~ethods of Correlation -
The method of correlation of this data employs
the use of a rose diagram. A rose diagram is a
sort of circular histogram that · shows actual
compass bearings (Figure 12). To use rose diagrams
the various bearings must be divided into
increments. For the purposes of this study 10
degree increments were used. This is a sort of way
to average· the directional trends. The rose
diagrams used here were compiled by Rosy in the
Rock Works software on a ~acintosh LCII computer.
By using software of this sort a great deal of time
is saved because of its ability of data
manipulation. The Rosy program supplies a great
deal of statistical information but due to the
com~lexitY of this information, it was not used.
The importance of the rose diagram soon becomes
·apparent in this study. By entering the bearings
of the satellite imagery into Rosy it is apparent
that there are at least two distinct joint ·set's.
The systematic joints of set one strike in the
range of. 60 degree + 10 degree, while set two
systematic joints strike nearly East-West(Figure
13) . When compared to the previously marked
faulting on the GQ's, the data was right on. The

Irvine-Paint Creek Fault(Figure 14) trends East
West with. one joint· set but each time . the fault
takes a turn it lines up with the other. The
measured field data did not compare as well but
this was probably due to the limited amount of
data. The joints sets obtained from the rose
within about 10 degrees of eacl1 diagram were still
o t h e r ( F i g·u r e 1 5 ) With more extensive daXa it can
the joint sets would have lined up be assumed that
more closely.
12.
·-.
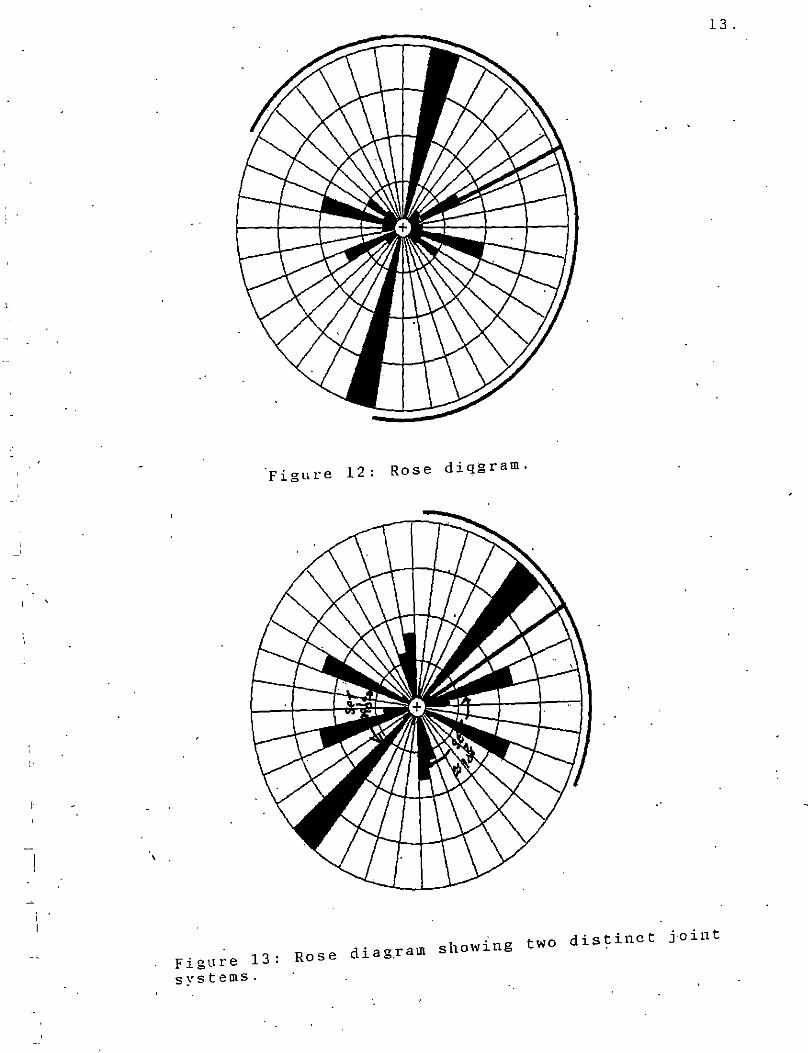
13.
Figure 12: Rose diqgram.
Figure 13: Rose diag~am showing two distinct joint
systems.
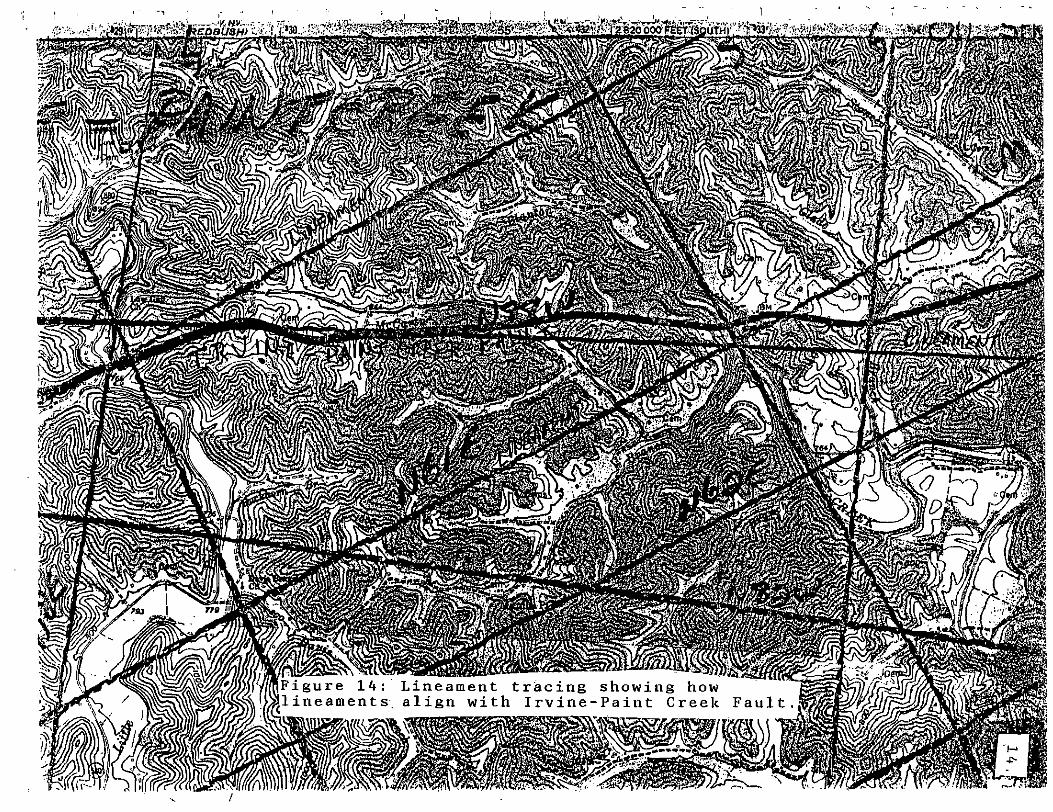

Figure 15: Rose diagrams showing comparison of satellite imagery data to field data.
15,

16.
POSSIBLE CAUSES OF THE JOINTING AND FAULTING
Possible Causes of Jointing
Determining the causes of jointing in the
selected areas of Eastern Kentucky is al~ost beyond
J the scope_ of t"l1is research. A few observ.ations
were made that m·ay help to start a1'! explanation.
The most obvious possible cause co1,1ld be the Pine
Mountain Thrust. Pine Mountain lies to the' South
of the research area(Figure 1). The strike of Pine
Mountain appears to be nearly parallel with the
systematic joints of joint system ·one. Sense the.
age of the st.rat a be i t1g dealt with is
Pennsylvanian, it stands to reason that the
jointing occurred at the earliest duri11g the
Permian. This i~ the period of time in which the
Appalachian Orogeny occurred, . and also Pine
Mountain was farmed.
There . is no obvious cause· to system two
jointing.· It is possible that they ·were formed at
an earlier time than the Pennsylvanian rocks were
deposited. If this is the case, then the jointing
perp~tuated up through the strata as it was formed.
Another possible explanation .is that the direction
of tl1e thrust changed and the system two joints
·. ! h

were also formed in the Permian just before the
system one joints (Hylbert, 1993)
r.
17.

18.
Possible Causes of Faulting
The possible causes of faulting in an
as this are even more difficult to determine than
the causes of jointing. The area being dealt with
is relatively stable arid not much tectonic activity
has occurred. The structural significance of the
area is minor (Jillson, 1920) A very hypothetical
explanation follows.
When the tl1rust of Pine Mountain s toppe·d,
there was a release of pressure. The pressure was
not great enough to cause reverse faulting but it
was· great enough to cause fracturing of the strata.
When this pressure .stopped the:re was a horizontal
rebound of the earth's crust. The crust is such a
massive object that it developed significant
inertia during this rebound .. The inertia from the
rebound set up strain that pulled the strata apart
at the joints(F~gure 16). As was stated before
t·his is a hypothetic.al explanation; but it does
seem reasonable.

' ··'
a.
..
c.
-(;--
S')'S1 Wl\!'I C lOu.tr S
_..:;:, ~ Nff F'ORCE'S
'31srfJ/lli!C. ~01tlf 1'--_--l., _ _.l/
"'='- ~ HE'f ~ol(tS fA.Utl' PLAtJ~ events from A to C, showina to cause jointing and .
0
figure 16: sequeuce of what may have happened
·faulting ..
19.
i

2.0.
ECONO.MIC SIGNIFICANCE OF THIS STUDY
Stu.dies of this type c.an be very important in
coal mit1i11g and oil ·exploration. Coal. mining
prob a'b 1 y be n e f i ts . the most . Mine planning for
under ground mines is a major area of concern,
more specifically roof control. Mine planners
could benefit by cutting across lineamen~ that. show
up on sate·llit.e imagery and completely stay· away
from areas i tl wl1 i ch li n·eamen ts cross. This method ' If ~f
of roof control is describe'd in Geologic Structure I\,
and Mine Roof Falls i 11 Selected Coal Beds Within
App a 1 a chi a .by D . K . Hy 1 be rt .
Oil exploration could also benefit f.rom this
type of study. If it could be proven that oil
follows joint, structures then we1·1s could possibly
be drilled with horizontal drilling rigs.· If. a
fault or joint could be intercepted with this
equipment the payoff would be. great. This stands
to reason because· the area of study was once· oil
-rich. Most of the oil was concentrated in dome
structures ( H.udnall.X et al., 1924). If drainage is I
structure controlled, which it appears to be, the
underground oil flow may also; ~he economic payoff

21.
of an undertaking of this sort could be great
(Reed, 1993).
CONCLUSION I
The definitions of jointing are rigidly set,
but their study and· measurement is not. There are
many techniques· that have been and many more that
will be developed to help us urid_erstand the
processes that shape our world. Whether we study
for economic gain or just an understanding we can
only benefit.
I
,.

91 -,.,,,,, ... ,.v' 'l ' - . ', !'
~1.-c· .. ·'' A/ ...... ~ \ r
Dennis, J.G. 1987, Wm.
WORKS CITED
Structural Geology an Introd~ction. C. Brown Publishers, Dubuque, Iowa.
Englund. K.J., and DeLaney, A.O., a, (1967), Geologic Map of the Ezel Quadrangle, (GQ-598) Kentucky, United States Geologic Survey, Washington. D.C.
Englund. K.J:, and DeLanev. A.O., b, (1966) Geologic Map of the Wrigley Quadrangle, (GQ-190) Kentucky, United States Geologic Survey, Washington, D.C.
-Englu1id. K.J .. and DeLaney, A.O., c, (1966), Geologic M~p of the· Sandy Hook Quadrangle, ( GQ -521) Kentucky. United Sta.tes Geologic Survey, Washingt6n. D.C.
Engl~nd, K.J., Huddle, J.W., and DeLaney, A.O., d, (1967), Geologic Map of the West Liberty Quadrangle, (GQ-599) Kentucky, United States Geologic Survey. Washington, D.C.
Hudnall, J. S., and Browning I. B., ( 1923) Structural Geologic Map of t-he Paint Creek Uplift (Series VI). Kentucky Geologic Survey, Lexington, KY.
Hylbert, D.K., Geologic Structure and Mine Roof Falls in Selected Coal Beds Within Appalachia, 1984, Morehead State University Printing S e r·v ices , Mo re head , KY:
Hy"lbert. D. K., Personal Interview, Fall 1993.
Jillson. W.R .. Oil and Gas Resources of Kentucky, 1920, Kent~cky Geologic Survey, Frankfort, KY.
Outerbridge. W.F., e, (1_963), Geol·ogic Map of the. Inez Quadrangle, (GQ-226) Kentucky, United States Geologic Survey, Washin&ton, D.C.
Outerbridge, W.F., f, (1967), Geologic Map of the Oil springs Quadrangle, (GQ-586) Kentucky, United States Geologic Survey, Washington, D.C.
Outerbi'idge, W.F .. g, (1966), Geologic Map of the Paintsville Quadrangle, (GQ-495) Kentucky, United States Geologic Survey, Washington, D.C.
Reed s:K .. PPrsonnl Interview and Commits made d. tl c i r~ .'-? · r r e s t:· ll r A t i c 1 n o f t: 11 i s 9 a [J e r . F a 1 l 1 9 9 3 . .. , ~

JOINTING AND FAULTING IN SELECTED AREAS IN EASTERN KENTUCKY Blair, Mark, A., Depa~tment of Pysical sciences,
Morehead state University, Morehead, KY 40351 The main fault system studied in Eastern Kentucky is that of the Irvine-Paint Creek Fault Zone. The faults in the area grade from medium to steeply dipping. Location and measurement; of jointing and faulting is difficult due to lack of good outcrops and vegetation coverage. This is overcome in one of three ways. The first way is a lineament study. This procedure involves using satellite imagery and a video enhancer to ''bring out" straight-line features in topography, These straight-line features are often the strikes of joints and faults. ·The second method is usirtg geologic quadrangles with locations of previously mapped structures. While only large faults are mapped there is often· associated faulting and jointing. The last method is a little random but often reveals well exposed joints and ·faults. It is merely driving along road cuts and outcrops looking for structures. The' results of the latter of the·· two methods can be compared to the results of the first method to verify data. The data obtained is the strike of t:he features. This data is analyzed by means of a rose diagram. A rose diagram is a statistical plot that groups directional trends. The jointing and faulting in Eastern Kentucky studied occurred in Pennsylvanian age rock. From the data it was found that two distinct joint.sets formed. One set lined up with the Pine Mountain Thrust that occurred in the Permian.. The other set may have been caused earlier and the structure perpetuated up through the younger material as it was layed down. The faulting is probably a result of the release of pressure from discontinuance of the Appalachian orogeny. The strain that was set up from this release may have formed the normal faults that we see today. The significance of this research is in the field of
I ·Economic Geology. These structures can help to predict areas prone to roof fall in underground mining and point US· toward·valuable and needed oil and.gas deposits:
MAJOR WORKS CITED
Hudnall, J.s., and Browning I.B., (1923) structural Geologic Map of the Paint creek Uplift (Series VI),
·Lexington, KY. Kentucky Geologic, survey.
Hylbert, D.K., Geologic structure and Mine in Selected coal Beds Within Appalachia, Publisher unknown.
Roof Fal-ls 1984,
Hylbert, D.K., Personal Interview, Fall 1993.
Jillson, W.R., Oil .and Gas Resources of. Kentucky, . 1920, Kentucky Geologic survey, Frankfort, KY.
/

MSU ARCHIVES